Blocking and Randomization to Improve Molecular Biomarker...
9
Statistics in Clinical Cancer Research Blocking and Randomization to Improve Molecular Biomarker Discovery Li-Xuan Qin 1 , Qin Zhou 1 , Faina Bogomolniy 2 , Liliana Villafania 3 , Narciso Olvera 2 , Magali Cavatore 3 , Jaya M. Satagopan 1 , Colin B. Begg 1 , and Douglas A. Levine 2 Abstract Randomization and blocking have the potential to prevent the negative impacts of nonbiologic effects on molecular biomarker discovery. Their use in practice, however, has been scarce. To demonstrate the logistic feasibility and scientific benefits of randomization and blocking, we conducted a microRNA study of endometrial tumors (n ¼ 96) and ovarian tumors (n ¼ 96) using a blocked randomization design to control for nonbiologic effects; we profiled the same set of tumors for a second time using no blocking or randomization. We assessed empirical evidence of differential expression in the two studies. We performed simulations through virtual rehybridizations to further evaluate the effects of blocking and randomization. There was moderate and asymmetric differential expression (351/3,523, 10%) between endometrial and ovarian tumors in the randomized dataset. Nonbiologic effects were observed in the nonrandomized dataset, and 1,934 markers (55%) were called differentially expressed. Among them, 185 were deemed differentially expressed (185/351, 53%) and 1,749 not differentially expressed (1,749/3,172, 55%) in the randomized dataset. In simulations, when randomization was applied to all samples at once or within batches of samples balanced in tumor groups, blocking improved the true-positive rate from 0.95 to 0.97 and the false-positive rate from 0.02 to 0.002; when sample batches were unbalanced, randomization was associated with the true-positive rate (0.92) and the false-positive rate (0.10) regardless of blocking. Normalization improved the detection of true-positive markers but still retained sizeable false-positive markers. Randomization and blocking should be used in practice to more fully reap the benefits of genomics technologies. Clin Cancer Res; 20(13); 3371–8. Ó2014 AACR. Introduction Technological advances in genomics profiling provide a plethora of molecular data to discover potential biomarkers for cancer diagnosis and treatment (1, 2). Discovering molecular biomarkers that are accurate and reproduc- ible—the "needles in a haystack"—still remains challenging (3–5). A major source of the challenge comes from the nonbiologic effects in the data that are resulted from the experimental process (6, 7). Nonbiologic effects can be introduced into the data at numerous steps of the experi- ment such as sample preparation, array hybridization, and image scanning (8). Previous efforts to remove nonbiologic effects have been mainly focused on post hoc data adjust- ments through a "normalization" step (9, 10). Careful study planning and sound experimental design offer a preventive opportunity to reduce the level of non- biologic effects and mitigate their negative impact on bio- marker discovery (11, 12). Two basic principles of experi- mental design are randomization and blocking (13, 14). Random assignment of experimental units to comparison groups eliminates bias due to known and unknown con- founders. Randomization has been widely used in many scientific fields, including clinical studies, to determine the efficacy of experimental treatments (15). Arranging exper- imental units in blocks of similar units can reduce the variance and hence increase the power to detect differences between comparison groups (16). Many profiling platforms come with natural blocks. For example, the Agilent human micro-RNA (miRNA) arrays have eight arrays on each glass slide; the Illumina human gene expression BeadChips have twelve bead-chips on each slide; and the Illumina sequencer has eight lanes on each flow cell. Randomization and blocking have been previously suggested for use in genomic studies (17–19). However, their applications in practice are scarce possibly due to the lack of awareness and the con- ceived difficulties in logistic planning. We set out to demonstrate the logistic feasibility and scientific benefits of randomization and blocking in molec- ular biomarker discovery so as to facilitate their adoption in cancer genomic studies. Toward this end, we profiled the same Authors' Affiliations: Departments of 1 Epidemiology and Biostatistics and 2 Surgery, and 3 Genomics Core Laboratory, Memorial Sloan-Kettering Cancer Center, New York, New York Note: Supplementary data for this article are available at Clinical Cancer Research Online (http://clincancerres.aacrjournals.org/). Corresponding Author: Li-Xuan Qin, Department of Epidemiology and Biostatistics, Memorial Sloan-Kettering Cancer Center, New York, NY 10065. Phone: 646-735-8116; Fax: 646-735-0010; E-mail: [email protected] doi: 10.1158/1078-0432.CCR-13-3155 Ó2014 American Association for Cancer Research. Clinical Cancer Research www.aacrjournals.org 3371 on June 14, 2018. © 2014 American Association for Cancer Research. clincancerres.aacrjournals.org Downloaded from Published OnlineFirst May 1, 2014; DOI: 10.1158/1078-0432.CCR-13-3155
Transcript of Blocking and Randomization to Improve Molecular Biomarker...
Statistics in Clinical Cancer Research
Blocking and Randomization to Improve MolecularBiomarker Discovery
Li-Xuan Qin1, Qin Zhou1, Faina Bogomolniy2, Liliana Villafania3, Narciso Olvera2, Magali Cavatore3,Jaya M. Satagopan1, Colin B. Begg1, and Douglas A. Levine2
AbstractRandomization and blocking have the potential to prevent the negative impacts of nonbiologic effects
on molecular biomarker discovery. Their use in practice, however, has been scarce. To demonstrate the
logistic feasibility and scientific benefits of randomization and blocking, we conducted a microRNA study
of endometrial tumors (n ¼ 96) and ovarian tumors (n ¼ 96) using a blocked randomization design to
control for nonbiologic effects; we profiled the same set of tumors for a second time using no blocking or
randomization. We assessed empirical evidence of differential expression in the two studies. We
performed simulations through virtual rehybridizations to further evaluate the effects of blocking and
randomization. There was moderate and asymmetric differential expression (351/3,523, 10%) between
endometrial and ovarian tumors in the randomized dataset. Nonbiologic effects were observed in the
nonrandomized dataset, and 1,934 markers (55%) were called differentially expressed. Among them, 185
were deemed differentially expressed (185/351, 53%) and 1,749 not differentially expressed (1,749/3,172,
55%) in the randomized dataset. In simulations, when randomization was applied to all samples at once
or within batches of samples balanced in tumor groups, blocking improved the true-positive rate from
0.95 to 0.97 and the false-positive rate from 0.02 to 0.002; when sample batches were unbalanced,
randomization was associated with the true-positive rate (0.92) and the false-positive rate (0.10)
regardless of blocking. Normalization improved the detection of true-positive markers but still retained
sizeable false-positive markers. Randomization and blocking should be used in practice to more fully reap
the benefits of genomics technologies. Clin Cancer Res; 20(13); 3371–8. �2014 AACR.
IntroductionTechnological advances in genomics profiling provide a
plethora ofmolecular data to discover potential biomarkersfor cancer diagnosis and treatment (1, 2). Discoveringmolecular biomarkers that are accurate and reproduc-ible—the "needles in a haystack"—still remains challenging(3–5). A major source of the challenge comes from thenonbiologic effects in the data that are resulted from theexperimental process (6, 7). Nonbiologic effects can beintroduced into the data at numerous steps of the experi-ment such as sample preparation, array hybridization, andimage scanning (8). Previous efforts to remove nonbiologiceffects have been mainly focused on post hoc data adjust-ments through a "normalization" step (9, 10).
Careful study planning and sound experimental designoffer a preventive opportunity to reduce the level of non-biologic effects and mitigate their negative impact on bio-marker discovery (11, 12). Two basic principles of experi-mental design are randomization and blocking (13, 14).Random assignment of experimental units to comparisongroups eliminates bias due to known and unknown con-founders. Randomization has been widely used in manyscientific fields, including clinical studies, to determine theefficacy of experimental treatments (15). Arranging exper-imental units in blocks of similar units can reduce thevariance and hence increase the power to detect differencesbetween comparison groups (16).Manyprofiling platformscome with natural blocks. For example, the Agilent humanmicro-RNA (miRNA) arrays have eight arrays on each glassslide; the Illumina human gene expression BeadChips havetwelve bead-chips on each slide; and the Illumina sequencerhas eight lanes on each flow cell. Randomization andblocking have been previously suggested for use in genomicstudies (17–19). However, their applications in practice arescarce possibly due to the lack of awareness and the con-ceived difficulties in logistic planning.
We set out to demonstrate the logistic feasibility andscientific benefits of randomization and blocking in molec-ular biomarker discovery so as to facilitate their adoption incancergenomic studies. Toward this end,weprofiled thesame
Authors' Affiliations:Departments of 1Epidemiology andBiostatistics and2Surgery, and 3Genomics Core Laboratory, Memorial Sloan-KetteringCancer Center, New York, New York
Note: Supplementary data for this article are available at Clinical CancerResearch Online (http://clincancerres.aacrjournals.org/).
Corresponding Author: Li-Xuan Qin, Department of Epidemiology andBiostatistics, Memorial Sloan-Kettering Cancer Center, New York, NY10065. Phone: 646-735-8116; Fax: 646-735-0010; E-mail: [email protected]
doi: 10.1158/1078-0432.CCR-13-3155
�2014 American Association for Cancer Research.
ClinicalCancer
Research
www.aacrjournals.org 3371
on June 14, 2018. © 2014 American Association for Cancer Research. clincancerres.aacrjournals.org Downloaded from
Published OnlineFirst May 1, 2014; DOI: 10.1158/1078-0432.CCR-13-3155

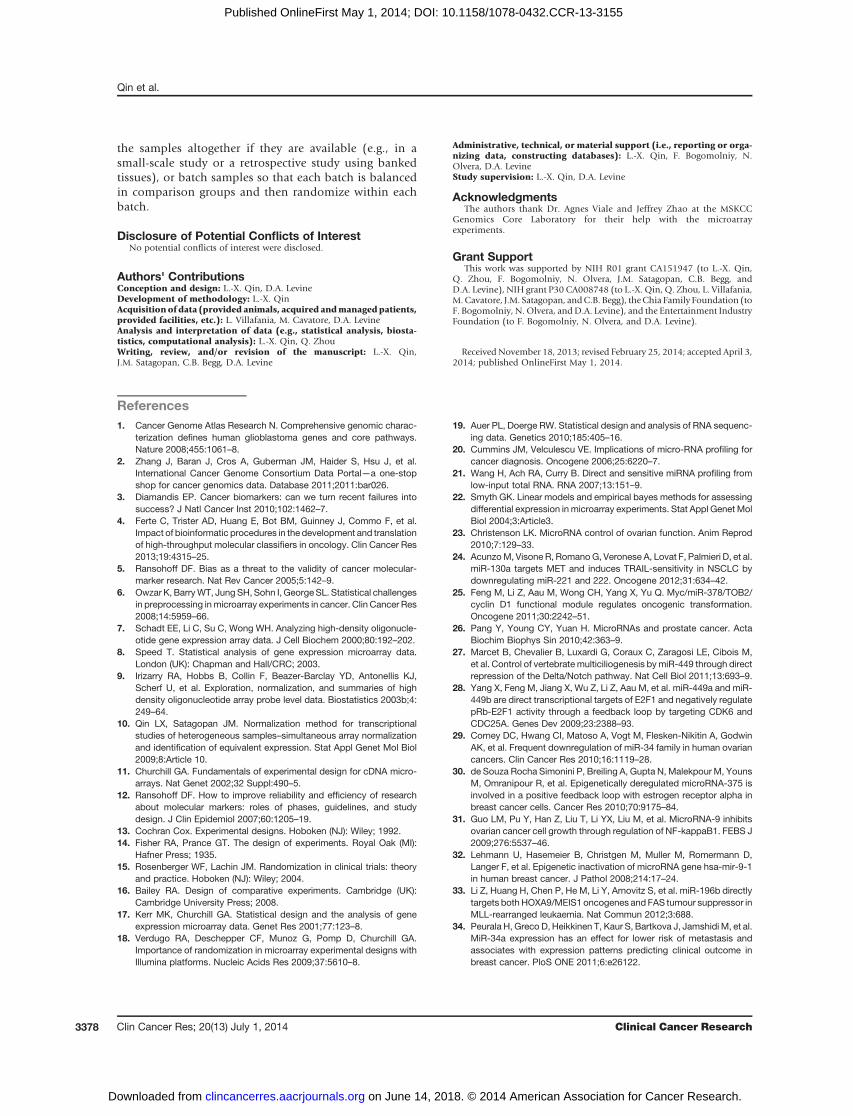
set of tumor samples twice with different experimentaldesigns, once using the blocked randomization design anduniform array handling and a second time using no blocking,randomization, or uniform handling. Empirical evidence ofdifferential expression was assessed in both the randomizedstudyand thenonrandomized study. Theoveralldesignofourstudy is illustrated in Fig. 1. This design is general and can beapplied to many genomics platforms. In this study, we pro-filed miRNA expression for a set of 96 endometrial tumorsand 96 ovarian tumors using Agilent miRNA arrays (20, 21).
We present empirical evidence of confounding nonbio-logic effects in the nonrandomized study. We compare theresults of differential expression analysis for the random-ized study versus that for the nonrandomized study. Weconsider the impact of a post hoc normalization step to
remove nonbiologic effects. In addition to the empiricalevaluations, we perform simulation studies to separatelyexamine the effect of randomization and blockingwhen thetrue biomarker status is known and array handling isnonuniform. We also use simulations to assess the effectof randomization when samples come in multiple batchesand each batch is randomized individually. Finally, wemake recommendations on study design for cancer molec-ular biomarker studies.
Materials and MethodsPatient samples
Ninety-six high-grade serous ovarian cancer samplesand 96 endometrioid endometrial cancer samples wereused in our study. These samples were all newly diagnosed,
© 2014 American Association for Cancer Research
Tumor tissue samples
Randomized
16
4
Log 2
(exp
ress
ion
inte
nsity
)
68
101214
16
4
Log 2
(exp
ress
ion
inte
nsity
)
68
101214
Six balanced configurations
(run four times)
24 slides24 slides
Unlimited nonbalanced
configurations
Nonrandomized
EndometrialOvarian
n = 96 n = 96
Figure 1. Illustration of the overalldesign for a block randomizedmiRNA array study paired with anonrandomized study using thesame set of tumor samples.
Qin et al.
Clin Cancer Res; 20(13) July 1, 2014 Clinical Cancer Research3372
on June 14, 2018. © 2014 American Association for Cancer Research. clincancerres.aacrjournals.org Downloaded from
Published OnlineFirst May 1, 2014; DOI: 10.1158/1078-0432.CCR-13-3155

previously untreated, and collected at Memorial Sloan-Kettering Cancer Center (MSKCC; New York, NY) between2000 and 2012. Their use in our study was approved by theMSKCC Institutional Review Board.
Tumor microdissection and RNA extractionSample preparation used strict quality control on the
specimens. Freshly harvested tissue was snap frozen foreventual cryomold embedding and RNA extraction formicroarray analysis. Before RNA extraction, a 5-mm hema-toxylin and eosin histologic section was cut from the top ofthe cryomold to assess for tumor content and percentage ofnecrosis. For any specimens with less than 60% tumor cellnuclei, we usedmacrodissection to obtain enriched areas soas to make the specimen usable for RNA extraction and asuniform as possible. All specimens had less than 20%necrosis. All pathology specimens used for molecular studywere diagnosed by dedicated gynecologic pathologists toestablish histologic cell type, grade of malignancy, and siteof origin. RNA was extracted from 30 to 100 mg of macro-dissected cryomold tissue using the Ambion mirVanamiRNA Isolation Kit (Ambion) according to the manufac-turer’s protocol. Total RNA yield and quality were assessedusing a nanodrop spectrophotometer and an AgilentBioanalyzer.
miRNA microarray hybridizationHumanmiRNAmicroarrays (Agilent Technologies), con-
taining 3,523markers that represent 1,205 human and 142human viral miRNAs, were used for miRNA expressionprofiling according to the manufacturer’s protocol. Forsamples meeting the quality control standards, 200 ng oftotal RNAwas labeled using themiRNA Complete Labelingand Hybridization Kit (Agilent). Labeled RNA was hybrid-ized in Agilent Human miRNA Microarray Release 16.0.Slides were washed and scanned according to the manu-facturer’s instructions. Imageswere quantified using FeatureExtraction 10.7.3.1 (Agilent).
Study design for the randomized studyAgilent miRNA arrays have an 8-plex design, where
each array slide contains eight individual arrays arrangedas two rows and four columns. Therefore, each array sliderepresents an experimental block. We used the blockedrandomization design when assigning arrays to samplegroups to remove confounding nonbiologic effects. Toachieve the best balance, we further required the blocks tobe row and column balanced. That is, there were equalnumbers of cases and controls on any row and anycolumn of a slide. A total of six possible configurationsachieve row and column balance for a 2 by 4 block suchas the Agilent 8-plex array (Fig. 1). The 192 tumorsamples used 192 arrays corresponding to 24 array slides.When implementing the blocked randomization design,we assigned the 24 slides to one of the six configurationswith equal probabilities and consequently dedicated thearrays to one of the two sample groups. We then assignedeach group of arrays to a random permutation of the
samples in the corresponding group. We carefullyplanned our randomized study. All 24 slides were orderedfrom the same manufacture batch. Their hybridizationand production were processed in one run by a singleexperienced technician.
Study design for the nonrandomized studyRNAs for the same 192 tumors used for the randomized
study were rearrayed for a second study that used noblocking or randomization. Care was taken to ensure con-sistent sample handling for the two studies, and RNAs usedfor two arrays of the same tumor sample were taken fromthe same master stock. The 192 arrays for the nonrando-mized study were ordered from multiple manufacturerbatches. To mimic what would be done in the clinicalsetting, the arrays in the nonrandomized study wereassigned to samples in the order of sample collection, andwere processed in multiple runs by two technicians.
Statistical analysis of miRNA array dataEachmarker on the Agilent array has multiple replicates
(ranging from 10 to 40) on the array. Our data showminimum variation among replicates for the same marker(Supplementary Fig. S1). Hence, we summarized datafrom replicates for the same marker using the median.Evidence against the null hypothesis of equivalent expres-sion was assessed using the t statistic comparing theendometrial and ovarian sample groups (22). A separatet test was performed for each of the 3,523 markers on theAgilent array and a two-sided P value was calculated. TheP values were used to derive a marker set at a givensignificance level: markers with P values smaller than thesignificance level were declared differentially expressed,and those having larger P values were declared not dif-ferentially expressed. The resulting differential expressionstatus of markers was compared between the randomizedstudy and the nonrandomized study using a Venn dia-gram. Statistical analyses were conducted using R andBioconductor.
Simulation studyOur goal for the simulation study was 3-fold: (i) to
examine the effect of randomization and blocking whennonuniform handling is used and when the true bio-marker status is known; (ii) to assess the effect of ran-domization and blocking separately; and (iii) to evaluatethe effect of randomization when samples come inbatches and randomization can only be done within eachbatch.
Toward this goal, we simulated data for the followingscenariosof experimental designs for array-to-sample assign-ment, each combined with nonuniform array handling:
a) blocking, randomization of all samples together;b) blocking, randomization within balanced batches of
samples;c) blocking, randomization within unbalanced batches of
samples;
Blocking and Randomization for Biomarker Discovery
www.aacrjournals.org Clin Cancer Res; 20(13) July 1, 2014 3373
on June 14, 2018. © 2014 American Association for Cancer Research. clincancerres.aacrjournals.org Downloaded from
Published OnlineFirst May 1, 2014; DOI: 10.1158/1078-0432.CCR-13-3155

d) no blocking, randomization of all samples together;e) no blocking, randomization within balanced batches of
samples;f) no blocking, randomization within unbalanced batches
of samples;g) blocking, no randomization;h) no blocking, no randomization; andi) complete confounding of sample groups and array
slides.
To mimic the characteristics of miRNA array data, weestimated the biologic effects of each sample and the non-biologic effects of each array using the empirical data fromthe paired array studies and then simulated data throughvirtual rehybridizations of samples to arrays. Specific stepsof the simulation study are as follows.
1. Biologic effects estimation: We approximated thebiologic effects of each sample as its measurements inthe randomized data, except that for not differentiallyexpressed markers in the ovarian samples meandifferences between the two tumor groups weresubtracted from the observed data.
2. Nonbiologic effects estimation: We estimated thenonbiologic effects for each array in the nonrandomizeddata as the difference between this array and its pairedarray in the randomized data.
3. Array-to-sample assignment: For each simulation,samples are randomly shuffled, and arrays are reassignedto samples according to an experimental design:
a) Blocking, randomization of all samples together:four arrays from each slide are randomly selectedand assigned to one tumor group, and the rest toanother group.
b) Blocking, randomization within balanced batches:twenty-four slides are randomly allocated to fivebatches each with equal number of samples fromthe two tumor groups; four arrays of each slide arerandomly selected and assigned to one group, andthe rest to another.
c) Blocking, randomization within unbalancedbatches: twenty-four slides are randomly allocatedto five batches each with unequal number ofsamples from the two tumor groups (with the ratioof the two tumor types 1:3 or 3:1); four arrays ofeach slide are randomly selected and assigned toonegroup, and the rest to another.
d) Noblocking, randomizationof all samples together:ninety-six arrays across all array slides are randomlyselected and assigned to one tumor group, and therest to another.
e) No blocking, randomization within balancedbatches: twenty-four slides are randomlyallocated to five batches each with equal numberof samples from the two tumor groups; half arraysacross slides in each batch are randomly selectedand assigned to one group, and the rest to another.
f) No blocking, randomization within unbalancedbatches: twenty-four slides are randomly allocatedto five batches each with unequal number ofsamples from the two tumor groups; half arraysacross slides in each batch are randomlyselected and assigned to one group, and the restto another.
g) Blocking, no randomization: four arrays on the firstrow of each slide are assigned to one tumor group,and the rest to another group.
h) No blocking, no randomization: the allocation ofarrays to the tumor groups is kept the same as thenonrandomized study.
i) Complete confounding of sample groups and arrayslides: twelve array slides are randomly assigned toone tumor group, and the rest slides to anothergroup.
4. Virtual hybridization: Simulated data were generated bysumming the biologic effects of each sample and thenonbiologic effects of its reassigned array.
5. Analysis of each simulated dataset: Simulated data wereanalyzed for differential expression similar to theanalysis of the nonrandomized empirical study.
6. Summary of simulated datasets: Steps 3 to 5 wererepeated to generate 100 datasets for eachexperimental design. True-positive rate (TPR) and false-negative rate (FNR) are calculated and averaged acrossthe 100 simulated datasets.
Results and DiscussionEmpirical evaluation of molecular biomarkers in therandomized study
We compared miRNA expression levels between endo-metrial and ovarian tumors for each of the 3,523 markerson the Agilent array using the randomized data. Amongthem, 351 markers (10%) were differentially expressedat a P value cutoff of 0.01 (Fig. 2A and SupplementaryTable S1). Among the 351 markers, 210 are overexpressedin ovarian tumors, six of which have a log2 fold-change(L2FC) more than 1 with a maximum of 1.5; 141 areunderexpressed, 13 of which have a L2FC more than1 with a maximum of 3.3. By chance, 35 markers areexpected to have a P value less than 0.01. The level ofdifferential expression is moderately abundant in ourdata and the pattern of differential expression is notsymmetric around 0 (Fig. 2B).
The sixmarkers that are upregulated inovarian tumors andhave a L2FC more than 1 represent four unique microRNAs(miRNA), and the 13 downregulated markers representeight unique miRNAs (Supplementary Table S2). miR-224, a gene located on the X-chromosome and thought tobe active in mammalian ovaries, is the most upregulatedin ovarian tumors with a L2FC of 1.5 (23). The otherthree upregulated miRNAs in ovarian tumors are miR-130a, miR-221, and its paralogue miR-222, which allhave been previously reported to be oncogenic (24–26).
Qin et al.
Clin Cancer Res; 20(13) July 1, 2014 Clinical Cancer Research3374
on June 14, 2018. © 2014 American Association for Cancer Research. clincancerres.aacrjournals.org Downloaded from
Published OnlineFirst May 1, 2014; DOI: 10.1158/1078-0432.CCR-13-3155

miR-449a, which has been shown to be involved in verte-brate multiciliogenesis, is the most upregulated in endo-metrial tumors with a L2FC of 3.3 (27, 28). The other sevendownregulated miRNAs are miR-9, miR-34a/b/c, miR-196b,miR-375, andmiR-449b,whichhavebeen implicatedin a number of cancer types (28–34).We experimentally validated two not differentially
expressed miRNAs and eight differentially expressedmiRNAs (two upregulated in ovarian tumors and sixdownregulated) using qRT-PCR. The differential expres-sion status was confirmed for all 10 miRNAs (Fig. 2C).
Empirical evaluation of molecular biomarkers in thenonrandomized study
Figure 3A and B shows the distribution of the non-randomized data without normalization in comparisonwith the distribution of the randomized data. It indicatesclear nonbiologic effects in the nonrandomized data.When comparing miRNA expression between endome-trial and ovarian tumors in the nonrandomized data,1,934 markers (55%) were called differentially expressedat a P value cutoff of 0.01. Among these markers, 181 werecalled differentially expressed in the randomized data
© 2014 American Association for Cancer Research
miR-196b
miR-9*miR-9*
miR-34b*
miR-378
miR-224
miR-224
miR-222miR-221
miR-130a
miR-130a
miR-9
miR-9
miR-196b
miR-375
miR-449b
miR-34c-5p
P > 0.05
EndometrialOvarian
miR-34b*
miR-449amiR-449a
05
1015
2025
3035
40
–4
–4–2
02
46
810
1214
miR-1225 miR-643 miR-130a miR-221 miR-196b miR-34c miR-375 miR-449a miR-449b miR-9
–3 –2 –1 0 1 2 3 4
Mean expression difference: ovarian–endometrial
A
C
B
Mean expression difference:
ovarian–endometrial
–L
og
10 (P
valu
e)
Lo
g2 (q
PC
R)
020
4060
80
Fre
qu
en
cy
P > 0.05P < 0.001 P < 0.001
P < 0.001
P < 0.001
P < 0.001P < 0.001
P < 0.001
P < 0.001
10–1–2–3
Figure 2. A, volcano plot for comparingmiRNA expression between ovarian tumors and endometrial tumors using the randomized data. B, histogram ofmeanexpression differences between ovarian tumors andendometrial tumors amongmarkers that are differentially expressed in the randomizeddata.C, boxplot ofthe qPCR data for ten selected miRNAs. The data were derived by the DDCt method and displayed on the log2 scale.
Blocking and Randomization for Biomarker Discovery
www.aacrjournals.org Clin Cancer Res; 20(13) July 1, 2014 3375
on June 14, 2018. © 2014 American Association for Cancer Research. clincancerres.aacrjournals.org Downloaded from
Published OnlineFirst May 1, 2014; DOI: 10.1158/1078-0432.CCR-13-3155

(185/351, 53%); 1,749 were called not differentiallyexpressed in the randomized data (1,749/3,172,55%; Fig. 3C). With quantile normalization, the number
of differentially expressed markers identified in the non-randomized data was reduced to 708. Among them, 328were differentially expressed (328/351, 93%) and 380
© 2014 American Association for Cancer Research
45
67
89
1011
1213
1415
16
Nonrandomized
(1,934)Nonrandomized
(708)
166
Randomized
(351)Randomized
(351)
1851,749380 328 23
OV
A01
OV
A02
OV
A03
OV
A04
OV
A05
EN
D01
EN
D02
EN
D03
EN
D04
EN
D05
OV
A06
OV
A07
EN
D06
EN
D07
OV
A08
OV
A09
OV
A10
EN
D08
EN
D09
EN
D10
OV
A11
OV
A12
OV
A13
OV
A14
OV
A15
OV
A16
OV
A17
EN
D11
OV
A18
OV
A45
OV
A90
OV
A63
OV
A38
OV
A58
OV
A15
OV
A85
OV
A28
EN
D65
EN
D92
EN
D62
EN
D88
EN
D94
EN
D60
EN
D50
EN
D93
EN
D90
EN
D86
EN
D82
EN
D39
EN
D44
EN
D87
EN
D89
EN
D27
EN
D07
EN
D21
EN
D49
EN
D53
EN
D38
EN
D83
EN
D51
EN
D14
EN
D35
EN
D67
EN
D18
EN
D79
EN
D58
EN
D42
EN
D81
EN
D56
EN
D10
EN
D77
EN
D17
EN
D05
EN
D72
EN
D54
EN
D03
EN
D12
EN
D06
EN
D55
EN
D34
EN
D71
EN
D61
OV
A75
OV
A06
OV
A88
OV
A55
OV
A76
OV
A52
OV
A62
OV
A37
OV
A67
OV
A65
OV
A61
OV
A03
OV
A10
OV
A14
OV
A16
OV
A54
OV
A44
OV
A19
OV
A08
OV
A36
OV
A29
OV
A34
OV
A39
OV
A69
OV
A95
OV
A43
OV
A46
OV
A93
OV
A96
OV
A80
OV
A07
OV
A35
OV
A89
OV
A30
OV
A82
OV
A05
OV
A48
EN
D40
OV
A31
OV
A83
OV
A26
OV
A11
OV
A40
OV
A79
OV
A20
OV
A09
OV
A70
OV
A32
OV
A27
OV
A12
OV
A51
OV
A21
OV
A49
OV
A04
OV
A87
OV
A84
OV
A68
OV
A81
OV
A17
OV
A01
OV
A22
OV
A33
OV
A91
OV
A74
EN
D01
EN
D24
EN
D84
EN
D47
EN
D25
EN
D22
OV
A53
EN
D16
OV
A02
OV
A56
OV
A47
EN
D66
EN
D74
OV
A77
EN
D32
OV
A50
EN
D68
OV
A41
OV
A64
OV
A66
EN
D95
EN
D91
EN
D96
OV
A92
EN
D57
OV
A24
OV
A78
OV
A25
OV
A60
OV
A86
OV
A73
OV
A57
OV
A59
OV
A23
OV
A94
OV
A42
OV
A71
EN
D33
EN
D46
EN
D28
EN
D70
EN
D15
EN
D52
EN
D80
EN
D04
EN
D69
EN
D43
EN
D13
EN
D37
EN
D48
EN
D73
EN
D63
EN
D29
EN
D31
EN
D08
EN
D41
EN
D85
EN
D59
EN
D23
EN
D02
EN
D64
EN
D30
OV
A72
EN
D76
OV
A13
EN
D26
EN
D11
EN
D20
EN
D09
EN
D45
EN
D75
EN
D78
EN
D19
EN
D36
EN
D12
EN
D13
EN
D14
EN
D15
EN
D16
EN
D17
OV
A18
OV
A19
EN
D18
EN
D19
OV
A20
OV
A21
OV
A22
OV
A23
OV
A24
OV
A25
OV
A26
OV
A27
OV
A28
OV
A29
EN
D20
EN
D21
EN
D22
EN
D23
EN
D24
EN
D25
EN
D26
EN
D27
EN
D28
EN
D29
OV
A30
EN
D30
OV
A31
OV
A32
OV
A33
OV
A34
OV
A35
OV
A36
OV
A37
OV
A38
OV
A39
OV
A40
OV
A41
EN
D32
EN
D33
EN
D34
EN
D35
EN
D36
EN
D37
EN
D38
EN
D39
EN
D40
EN
D41
OV
A42
OV
A43
EN
D42
EN
D43
OV
A44
OV
A45
OV
A46
EN
D44
EN
D45
EN
D46
OV
A47
OV
A48
OV
A49
OV
A50
OV
A51
OV
A52
OV
A53
EN
D47
EN
D48
EN
D49
EN
D50
EN
D51
EN
D52
EN
D53
OV
A54
OV
A55
OV
A56
OV
A57
OV
A58
EN
D54
EN
D55
EN
D56
EN
D57
EN
D58
OV
A59
OV
A60
OV
A61
OV
A62
OV
A63
OV
A64
OV
A65
OV
A66
OV
A67
EN
D59
EN
D60
EN
D61
EN
D62
EN
D63
EN
D64
EN
D65
EN
D66
EN
D67
OV
A68
OV
A69
OV
A70
EN
D68
EN
D69
EN
D70
OV
A71
OV
A72
OV
A73
OV
A74
OV
A75
OV
A76
OV
A77
EN
D71
EN
D72
EN
D73
EN
D74
EN
D75
EN
D76
EN
D77
OV
A78
OV
A79
EN
D78
EN
D79
OV
A80
OV
A81
OV
A82
EN
D80
EN
D81
EN
D82
OV
A83
OV
A84
OV
A85
OV
A86
OV
A87
OV
A88
OV
A89
EN
D83
EN
D84
EN
D85
EN
D86
EN
D87
EN
D88
EN
D89
OV
A90
OV
A91
OV
A92
OV
A93
OV
A94
OV
A95
OV
A96
EN
D90
EN
D91
EN
D92
EN
D93
EN
D94
EN
D95
EN
D96
EN
D31
Lo
g2 (
exp
ressio
n in
ten
sit
y)
45
67
89
1011
1213
1415
16
Lo
g2 (
exp
ressio
n in
ten
sit
y)
A
B
C D
Figure 3. A, boxplot of the randomized data. B, boxplot of the nonrandomized data before normalization. C, Venn diagram comparing differentially expressedmarkers identified by the nonrandomized data before normalization and those by the randomized data. D, Venn diagram comparing differentially expressedmarkers identified by the nonrandomized data after quantile normalization and those by the randomized data.
Qin et al.
Clin Cancer Res; 20(13) July 1, 2014 Clinical Cancer Research3376
on June 14, 2018. © 2014 American Association for Cancer Research. clincancerres.aacrjournals.org Downloaded from
Published OnlineFirst May 1, 2014; DOI: 10.1158/1078-0432.CCR-13-3155

were not differentially expressed (380/3,172, 12%) in therandomized data (Fig. 3D).
Simulation studyThe results of the simulation study are summarized
in Table 1 and graphically displayed in SupplementaryFig. S2.Not surprisingly, blocking and randomization applied to
all samples at once led to a best accuracy of biomarkerdetection with the highest TPR (0.97, 340/351) and lowestFPR (0.002, 6/3,172). This level of accuracy was equally, ifnot slightly better, achieved by blocking and randomizationapplied to sample batches that were balanced in samplegroups (TPR ¼ 0.97, FPR ¼ 0.001¼ 3/3,172). The next bestlevel of biomarker detection accuracy was achieved whenthe array-to-sample assignment used randomizationacross all samples (TPR ¼ 0.95 ¼ 333/351, FPR ¼ 0.02¼ 63/3,172) or randomization within balanced batchesof samples (TPR ¼ 0.95, FPR ¼ 0.01) but with no block-ing. When randomization was used for samples that camein batches unbalanced in sample groups, the accuracy ofbiomarker detection had a slightly worse TPR (0.92, 323/351) and a much worse FPR (0.10–0.17, 312–539/3,172)regardless of whether blocking was used within eachbatch. As expected, complete confounding of samplegroup and array slide resulted in a low TPR (0.89 ¼312/351) and a high FPR (0.20 ¼ 634/3,172).When no randomization was used, our simulation
showed a high accuracy of biomarker detection (TPR ¼0.97, FPR ¼ 0.001) with blocking, and a low detectionaccuracy without blocking (TPR ¼ 0.84 ¼ 295/351, FPR ¼0.07¼ 222/3,172). We note that this result depends on theactual level of confounding between sample group andarray slide in the data. In this simulation, we used thearray-to-sample assignment in the empirical nonrando-mized study, where the sample group was partly confound-edwith array slides with the number of endometrial tumorsbeing 0, 1, 2, 3, 5, 6, and 7 for 4, 2, 1, 4, 2, 7, and 4 arrayslides, respectively (Supplementary Table S3).
Regardless of the experimental design, the post hoc nor-malization step, using quantile normalization in our study,improved the detection of true-positive markers to analmost perfect level and at the same time still had false-positivemarkers with a FPR often around 0.20, correspond-ing to a FDR of about 64%.
We used P values at a cutoff of 0.01 to call significance inour study. We tested other P value cutoffs and observedsimilar results (results not shown). We also repeated ouranalysis using the FDR to adjust for multiple comparisonswhen calling significant markers, and observed similarresults on the relative ranking of the experimental designs(results not shown).
Taken together, the results from our simulation studyfurther underline the importance of blocking and random-ization for accurate detection of disease relevant markers.Even blocking alone, or randomization alone, or random-ization within balanced batches alone offers significantbenefits in accurate biomarkerdetection.Post hocdata adjust-ments through normalization improve the identification oftrue-positive markers, but still possess a large number offalse-positive markers.
ConclusionsWe have demonstrated that blocking and randomization
are valuable for miRNA array studies of tumor samples. Wealso showed, throughboth empirical and simulated studies,that blocking, randomization across all samples, or ran-domization within balanced sample batches can effectivelyremove confounding nonbiologic effects and ensure theaccuracy of detecting disease relevant markers with both ahigh TPR and a low FPR. We observed that post hoc nor-malization to the data improves the detection of true-positivemarkers andat the same time retains a largenumberof false-positive markers in our study.
In practice, we recommend use of the block-type designof profiling platforms, placing equal numbers of samplesfrom each comparison group in each block to the extentpossible. If blocking cannot be done, one should randomize
Table 1. Results of the simulation study
No normalization Quantile normalization
Index Blocking, randomization TPR FPR TPR FPR
a Yes, across all samples 0.97 (0.02) 0.002 (0.005) 1 (0) 0.19 (0.03)b Yes, within balanced batches 0.97 (0.02) 0.001 (0.003) 1 (0) 0.18 (0.03)c Yes, within unbalanced batches 0.92 (0.04) 0.10 (0.17) 1 (0) 0.24 (0.07)d No, across all samples 0.95 (0.03) 0.02 (0.05) 1 (0) 0.19 (0.04)e No, within balanced batches 0.95 (0.03) 0.01 (0.02) 1 (0) 0.18 (0.04)f No, within unbalanced batches 0.92 (0.05) 0.17 (0.26) 1 (0) 0.24 (0.07)g Yes, no 0.97 (0.01) 0.001 (0) 1 (0) 0.24 (0.02)h No, no 0.84 (0.01) 0.07 (0.03) 1 (0) 0.17 (0.02)i Completely confounded 0.89 (0.08) 0.20 (0.30) 0.999 (0.001) 0.26 (0.09)
NOTE: Mean and SD (in parenthesis) of TPR and FPR are reported. Simulation settings with the highest TPR and the lowest FPR areindicated in bold type. Simulation settings with the second highest TPR and the second lowest FPR are indicated in bold italic font.
Blocking and Randomization for Biomarker Discovery
www.aacrjournals.org Clin Cancer Res; 20(13) July 1, 2014 3377
on June 14, 2018. © 2014 American Association for Cancer Research. clincancerres.aacrjournals.org Downloaded from
Published OnlineFirst May 1, 2014; DOI: 10.1158/1078-0432.CCR-13-3155
the samples altogether if they are available (e.g., in asmall-scale study or a retrospective study using bankedtissues), or batch samples so that each batch is balancedin comparison groups and then randomize within eachbatch.
Disclosure of Potential Conflicts of InterestNo potential conflicts of interest were disclosed.
Authors' ContributionsConception and design: L.-X. Qin, D.A. LevineDevelopment of methodology: L.-X. QinAcquisitionofdata (provided animals, acquired andmanagedpatients,provided facilities, etc.): L. Villafania, M. Cavatore, D.A. LevineAnalysis and interpretation of data (e.g., statistical analysis, biosta-tistics, computational analysis): L.-X. Qin, Q. ZhouWriting, review, and/or revision of the manuscript: L.-X. Qin,J.M. Satagopan, C.B. Begg, D.A. Levine
Administrative, technical, or material support (i.e., reporting or orga-nizing data, constructing databases): L.-X. Qin, F. Bogomolniy, N.Olvera, D.A. LevineStudy supervision: L.-X. Qin, D.A. Levine
AcknowledgmentsThe authors thank Dr. Agnes Viale and Jeffrey Zhao at the MSKCC
Genomics Core Laboratory for their help with the microarrayexperiments.
Grant SupportThis work was supported by NIH R01 grant CA151947 (to L.-X. Qin,
Q. Zhou, F. Bogomolniy, N. Olvera, J.M. Satagopan, C.B. Begg, andD.A. Levine), NIH grant P30 CA008748 (to L.-X. Qin, Q. Zhou, L. Villafania,M.Cavatore, J.M. Satagopan, andC.B. Begg), theChia Family Foundation (toF. Bogomolniy, N. Olvera, andD.A. Levine), and the Entertainment IndustryFoundation (to F. Bogomolniy, N. Olvera, and D.A. Levine).
Received November 18, 2013; revised February 25, 2014; accepted April 3,2014; published OnlineFirst May 1, 2014.
References1. Cancer Genome Atlas Research N. Comprehensive genomic charac-
terization defines human glioblastoma genes and core pathways.Nature 2008;455:1061–8.
2. Zhang J, Baran J, Cros A, Guberman JM, Haider S, Hsu J, et al.International Cancer Genome Consortium Data Portal—a one-stopshop for cancer genomics data. Database 2011;2011:bar026.
3. Diamandis EP. Cancer biomarkers: can we turn recent failures intosuccess? J Natl Cancer Inst 2010;102:1462–7.
4. Ferte C, Trister AD, Huang E, Bot BM, Guinney J, Commo F, et al.Impact of bioinformatic procedures in the development and translationof high-throughput molecular classifiers in oncology. Clin Cancer Res2013;19:4315–25.
5. Ransohoff DF. Bias as a threat to the validity of cancer molecular-marker research. Nat Rev Cancer 2005;5:142–9.
6. Owzar K, BarryWT, JungSH, Sohn I, GeorgeSL. Statistical challengesin preprocessing inmicroarray experiments in cancer. Clin Cancer Res2008;14:5959–66.
7. Schadt EE, Li C, Su C, Wong WH. Analyzing high-density oligonucle-otide gene expression array data. J Cell Biochem 2000;80:192–202.
8. Speed T. Statistical analysis of gene expression microarray data.London (UK): Chapman and Hall/CRC; 2003.
9. Irizarry RA, Hobbs B, Collin F, Beazer-Barclay YD, Antonellis KJ,Scherf U, et al. Exploration, normalization, and summaries of highdensity oligonucleotide array probe level data. Biostatistics 2003b;4:249–64.
10. Qin LX, Satagopan JM. Normalization method for transcriptionalstudies of heterogeneous samples–simultaneous array normalizationand identification of equivalent expression. Stat Appl Genet Mol Biol2009;8:Article 10.
11. Churchill GA. Fundamentals of experimental design for cDNA micro-arrays. Nat Genet 2002;32 Suppl:490–5.
12. Ransohoff DF. How to improve reliability and efficiency of researchabout molecular markers: roles of phases, guidelines, and studydesign. J Clin Epidemiol 2007;60:1205–19.
13. Cochran Cox. Experimental designs. Hoboken (NJ): Wiley; 1992.14. Fisher RA, Prance GT. The design of experiments. Royal Oak (MI):
Hafner Press; 1935.15. Rosenberger WF, Lachin JM. Randomization in clinical trials: theory
and practice. Hoboken (NJ): Wiley; 2004.16. Bailey RA. Design of comparative experiments. Cambridge (UK):
Cambridge University Press; 2008.17. Kerr MK, Churchill GA. Statistical design and the analysis of gene
expression microarray data. Genet Res 2001;77:123–8.18. Verdugo RA, Deschepper CF, Munoz G, Pomp D, Churchill GA.
Importance of randomization in microarray experimental designs withIllumina platforms. Nucleic Acids Res 2009;37:5610–8.
19. Auer PL, Doerge RW. Statistical design and analysis of RNA sequenc-ing data. Genetics 2010;185:405–16.
20. Cummins JM, Velculescu VE. Implications of micro-RNA profiling forcancer diagnosis. Oncogene 2006;25:6220–7.
21. Wang H, Ach RA, Curry B. Direct and sensitive miRNA profiling fromlow-input total RNA. RNA 2007;13:151–9.
22. Smyth GK. Linear models and empirical bayes methods for assessingdifferential expression in microarray experiments. Stat Appl GenetMolBiol 2004;3:Article3.
23. Christenson LK. MicroRNA control of ovarian function. Anim Reprod2010;7:129–33.
24. AcunzoM, Visone R, RomanoG, Veronese A, Lovat F, Palmieri D, et al.miR-130a targets MET and induces TRAIL-sensitivity in NSCLC bydownregulating miR-221 and 222. Oncogene 2012;31:634–42.
25. Feng M, Li Z, Aau M, Wong CH, Yang X, Yu Q. Myc/miR-378/TOB2/cyclin D1 functional module regulates oncogenic transformation.Oncogene 2011;30:2242–51.
26. Pang Y, Young CY, Yuan H. MicroRNAs and prostate cancer. ActaBiochim Biophys Sin 2010;42:363–9.
27. Marcet B, Chevalier B, Luxardi G, Coraux C, Zaragosi LE, Cibois M,et al. Control of vertebrate multiciliogenesis bymiR-449 through directrepression of the Delta/Notch pathway. Nat Cell Biol 2011;13:693–9.
28. Yang X, Feng M, Jiang X, Wu Z, Li Z, Aau M, et al. miR-449a and miR-449b are direct transcriptional targets of E2F1 and negatively regulatepRb-E2F1 activity through a feedback loop by targeting CDK6 andCDC25A. Genes Dev 2009;23:2388–93.
29. Corney DC, Hwang CI, Matoso A, Vogt M, Flesken-Nikitin A, GodwinAK, et al. Frequent downregulation of miR-34 family in human ovariancancers. Clin Cancer Res 2010;16:1119–28.
30. de Souza Rocha Simonini P, Breiling A, Gupta N, Malekpour M, YounsM, Omranipour R, et al. Epigenetically deregulated microRNA-375 isinvolved in a positive feedback loop with estrogen receptor alpha inbreast cancer cells. Cancer Res 2010;70:9175–84.
31. Guo LM, Pu Y, Han Z, Liu T, Li YX, Liu M, et al. MicroRNA-9 inhibitsovarian cancer cell growth through regulation of NF-kappaB1. FEBS J2009;276:5537–46.
32. Lehmann U, Hasemeier B, Christgen M, Muller M, Romermann D,Langer F, et al. Epigenetic inactivation of microRNA gene hsa-mir-9-1in human breast cancer. J Pathol 2008;214:17–24.
33. Li Z, Huang H, Chen P, He M, Li Y, Arnovitz S, et al. miR-196b directlytargets bothHOXA9/MEIS1 oncogenes and FAS tumour suppressor inMLL-rearranged leukaemia. Nat Commun 2012;3:688.
34. Peurala H, Greco D, Heikkinen T, Kaur S, Bartkova J, Jamshidi M, et al.MiR-34a expression has an effect for lower risk of metastasis andassociates with expression patterns predicting clinical outcome inbreast cancer. PloS ONE 2011;6:e26122.
Clin Cancer Res; 20(13) July 1, 2014 Clinical Cancer Research3378
Qin et al.
on June 14, 2018. © 2014 American Association for Cancer Research. clincancerres.aacrjournals.org Downloaded from
Published OnlineFirst May 1, 2014; DOI: 10.1158/1078-0432.CCR-13-3155

2014;20:3371-3378. Published OnlineFirst May 1, 2014.Clin Cancer Res Li-Xuan Qin, Qin Zhou, Faina Bogomolniy, et al. DiscoveryBlocking and Randomization to Improve Molecular Biomarker
Updated version
10.1158/1078-0432.CCR-13-3155doi:
Access the most recent version of this article at:
Material
Supplementary
http://clincancerres.aacrjournals.org/content/suppl/2014/05/01/1078-0432.CCR-13-3155.DC1
Access the most recent supplemental material at:
Cited articles
http://clincancerres.aacrjournals.org/content/20/13/3371.full#ref-list-1
This article cites 26 articles, 7 of which you can access for free at:
Citing articles
http://clincancerres.aacrjournals.org/content/20/13/3371.full#related-urls
This article has been cited by 1 HighWire-hosted articles. Access the articles at:
E-mail alerts related to this article or journal.Sign up to receive free email-alerts
Subscriptions
Reprints and
To order reprints of this article or to subscribe to the journal, contact the AACR Publications Department at
Permissions
Rightslink site. Click on "Request Permissions" which will take you to the Copyright Clearance Center's (CCC)
.http://clincancerres.aacrjournals.org/content/20/13/3371To request permission to re-use all or part of this article, use this link
on June 14, 2018. © 2014 American Association for Cancer Research. clincancerres.aacrjournals.org Downloaded from
Published OnlineFirst May 1, 2014; DOI: 10.1158/1078-0432.CCR-13-3155