
BLOCK DIAGRAMS. Block diagrams A way to show schematically the individual subsystems of a design...
16
BLOCK DIAGRAMS
-
Upload
suzanna-horn -
Category
Documents
-
view
220 -
download
2
Transcript of BLOCK DIAGRAMS. Block diagrams A way to show schematically the individual subsystems of a design...

BLOCK DIAGRAMS

Block diagrams• A way to show schematically the individual subsystems of
a design with arrows to show the direction that signals flow through the subsystems.• It is a quick way to determine what the subsystems do in the
system without analysing the full circuit or looking at an entire software program.

Block diagrams• A way to show schematically the individual subsystems of
a design with arrows to show the direction that signals flow through the subsystems.• Sometimes the blocks are labeled with the name of the subsystem.
http://www.hobbyprojects.com/block_diagrams/block_diagrams.html

Block diagrams• A way to show schematically the individual subsystems of
a design with arrows to show the direction that signals flow through the subsystems.• Sometimes the blocks are labelled according to the mathematics
that the subsystem performs on the input signal
http://www.vis.uky.edu/~cheung/courses/ee422G/lecture10.pdf
Electronic Design Project• I expect to see at least one block diagram for the entire
system – the optical pulse meter in: • Each team member’s notebook
• Changes in the design of subsystems should be shown by changes to the block diagram.• For example, there will need to be a filter and an amplifier in the analogue
portion of the circuit. If the order in which these two are changes as the team designs the pulse meter, then a new block diagram should be added to everyone’s lab notebook. The old block diagram should stay in the notebook!
• The final report• The final presentation.

FLOWCHARTING

Flowchart• Visual representation (a diagram) of the activities that will
be performed to complete a task or project.• Used frequently to describe the sequence of steps in a software
programme.• Also used to outline the tasks that need to be done on a manufacturing
line or to complete a design project.• In these cases, the flow chart is usually coupled with a Gantt chart.

ChartsFlowchart
Gantt Chart

Common ShapesName Description
Action A process or action such as a calculation, assignment, etc.
Start/Begin and Stop/End Shows where the flow starts and stops
Decision Indicates that a decision has been made between 2 or more choices
Flowlines Shows the order in which actions are to be completed
Connector Shows where a flow restarts when it doesn’t fit on a single page.
Input/Output Indicates where date is either collected, stored, or stored.
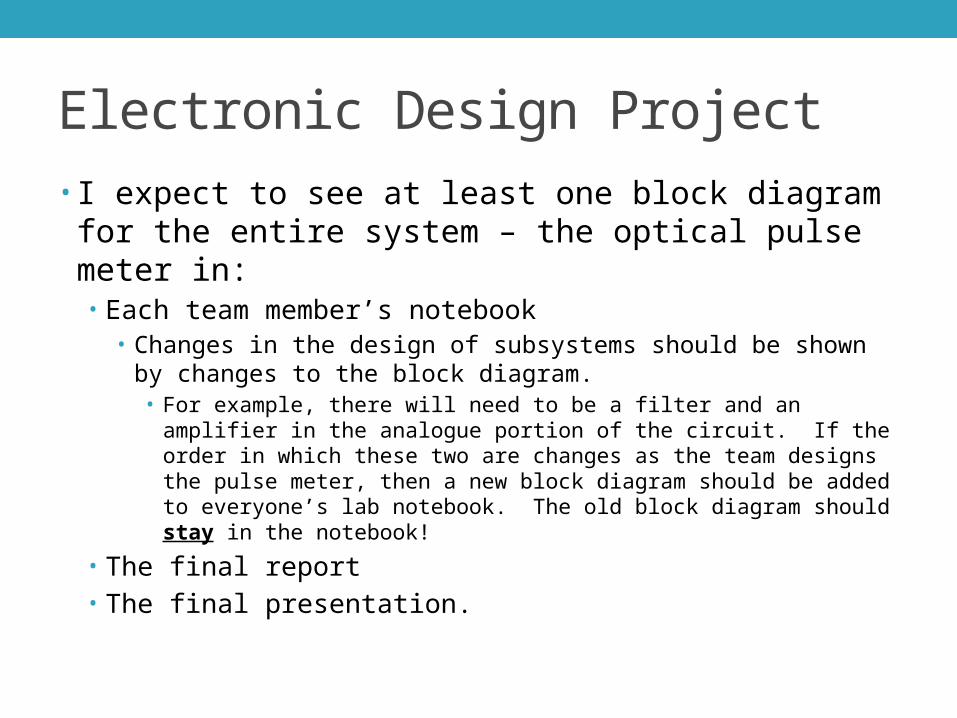
Examples of Flowcharts
http://www.rff.com/structured_flowchart.htm

Loops
These are some times called
• Do loops• For-Next loops• If-Then statements• If-Else statements• While statementshttp://www.rff.com/structured_flowchart.htm

Infinite Loops
In Microelectronic Systems, we used while(1) to
continuously loop through the mbed programs.
http://creately.com/blog/diagrams/part-2-15-mistakes-you-would-unintentionally-make-with-flowcharts/

Single and Multiple Ends
http://www.rff.com/structured_flowchart.htm
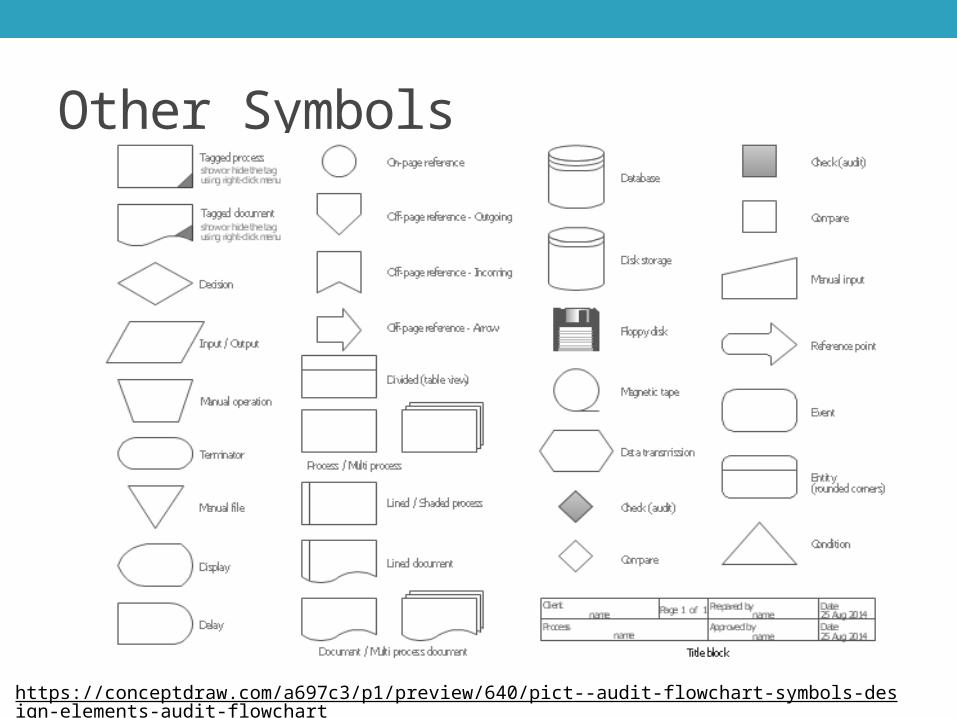
Other Symbols
https://conceptdraw.com/a697c3/p1/preview/640/pict--audit-flowchart-symbols-design-elements-audit-flowchart

Electronic Design Project• I expect to see at least one flowchart for the mbed
software program in: • Each team member’s notebook
• Use it when first thinking through how the program should be written.• Use it to document the final version of the program.
• The final report• The final presentation.