Blaine GWM Plan Final Hydrogeologic Report Volume I
88
Blame 6\rou_nJ VJoJer, f\Ao_n,cxn0 1' OOCJrtL0J RepTt Vo llme j_ [; - 10(o CJ -3 9LfiC)OJ..IT j j j j j j j j j j
Transcript of Blaine GWM Plan Final Hydrogeologic Report Volume I

Blame 6\rou_nJ VJoJer, f\Ao_n,cxn0 1' OOCJrtL0J
~lfillJ\ Hjdr~col~ic RepTt
Vo llme j_
[; - 10(o CJ
Bla.An~ -3
9LfiC)OJ..IT
j
j
j
j
j
j
j
j
j
j
j
j
j
j
j
j
j
j
j
j
j

.I I I I I I I I I I I I I I I I I I ,)
Golder Associates Inc.
4104-148th Avenue NE Redmond . .WA USA 98052 Telephone (206) 883-0777 Fax (206) 882-5498 ·
David Banton Associate
September 2, 1992
BLAINE GROUND WATER MANAGEMENT PROGRAM
FINAL HYDROGEOLOGIC REPORT
VOLUME I
Prepared for City of Blaine, Washington
Funded in Part by the Washington State Departme11.t ofEcology
Through the Centennial Clean Water Fund
By
Golder Associates Inc. Redmond, Washington
Mark Birch Project Hydrogeologist
903-1060.406
OFFICES IN AUSTRALIA. CANADA. GERMANY. HUNGARY. ITALY. SWEDEN. UNITED KINGDOM. UNITED STATES

I I I I I I I I I I I I I I I I I I I
September 2, 1992 i
TABLE OF CONTENTS
VOLUME I
EXECUTIVE SUMMARY
1. INTRODUCTION
1.1 Blaine Ground Water Management Area 1.2 Purpose and Scope of Work
2. BACKGROUND
2.1 Physical Conditions 2.2 Geology 2.3 Hydrogeology 2.4 Ground Water Quality 2.5 Land Use and Water Use .
3. DATA COLLECTION AND ANALYSIS
4.
3.1 Test Well Installation and Pump Testing 3.1.1 Geologic Conditions and Pump Test Results
3.1.1.1 GWMP-1 3.1.1.2 GWMP-2 3.1.1.3 GWMP-3 3.1.1.4 Deep Well 3.1.1.5 City Well No.2
3.2 Geophysical Logging of City Wells No. 1 and No. 2 3.3 Climatic Data 3.4 Stream Flow Data
3.4.1 Dakota Creek 3.4.2 Blaine Watershed Stream
3.5 Water-Level Data 3.6 Ground Water Withdrawals 3.7 Ground Water Quality Sampling and Analysis
3.7.1 Sampling Method 3.7.2 Results
DISCUSSION OF GROUND WATER FLOW SYSTEM
4.1 Hydrogeology 4.1.1 Definition of Hydrostratigraphic Units 4.1.2 Location and Thickness of Hydrostratigraphic Units 4.1.3 Hydraulic Characteristics and Water Quality 4.1.4 Ground Water Levels
Golder Associates
903-1060.406
Page No.
iv
1
1 1
3
3 4 5 6 7
8
8 9 9 9
10 10 10 11 11 13 13 14 15 16 17 17 18
21
21 21 23 25 29

I I I I II I I I I I I I I I
September 2, 1992 ii
TABLE OF CONTENTS (Cont.)
4.1.5 Flow Directions, Recharge/Discharge Areas, and Aquifer Interactions
4.2 Ground-Water Recharge 4.2.1 Upper Dakota Creek Catchment 4.2.2 Boundary Upland
4.2.1.1 Soil Moisture Budget Method 4.2.2.2 Water-Level Fluctuation Method 4.2.2.3 Discussion of Recharge Potential
4.2.3 Recharge from Outside the GWMA
5. GROUND-WATER RESOURCES
5.1 Quantity 5.1.1 Unit C2 5.1.2 Units C1, C3, and D 5.1.3 Unit C4 5.1.4 Blaines Future Needs
5.2 Ground-Water Quality
6. RECOMMENDATIONS
LIST OF TABLES
2-1 Existing Water Quality: City of Blaine Wells 3-1 Precipitation Data 3-2 Temperature Data 3-3 Potential Evapotranspiration 3-4 Blaine Ground Water Management Program- Well Summary Sheet 3-5 Water Quality Summary 4-1 Hydrostratigraphic Units 4-2 Summary of Hydraulic Characteristics
I LIST OF FIGURES I
I I I I
1-1 General Features Map 1-2 Location Map 4-1 Geologic Cross Section A-A' 4-2 Geologic Cross Section B-B' 4-3 Geologic Cross Section C-C' 4-4 Geologic Cross Section D-D' 4-5 Piper Diagram
Golder Associates
903-1060.406
Page No.
30 31 32 34 34 35 35 37
38
38 38 38 39 39 42
44

I I I I I I. I I I I ]
]
September 2, 1992 iii
LIST OF FIGURES (Cont.)
4-6 Schematic Conceptual Ground Water System 4-7 Generalized Water Table Elevation Map 4-8 Schematic Water Balance 4-9 Generalized Recharge Potential Map
903-1060.406
5-1 Relation Between Ground Water Withdrawals and other Hydrologic Components
VOLUME II
LIST OF APPENDICES
Appendix A Well Logs Appendix B Climatic Data Appendix C Stream Flow Data Appendix D Water Level Data Appendix E Ground Water Withdrawals Appendix F Water Quality Data Validation Appendix G Water Quality Data Appendix H Ground Water Recharge
Golder Associates

I I I I I I I I I I I I I I I I I I I
September 2. 1992 iv. 903-1060.406
EXECUTIVE SUMMARY
This report presents the results, interpretations, conclusions and recommendations based on a hydrogeologic study of the Blaine Ground Water Management Area (GWMA) in Whatcom County. The study was funded in part by a grant from the Washington Department of Ecology C~ntennial Clean Water Fund.
,___--- ..._________ -- . - - ------- .
Data Collection Program
The following data were collected as part of the program in order to evaluate the geology, hydrology, and hydrogeology of the Blaine GWMA:
• Meteorologic data, including precipitation and temperature;
• Geological logging and performing pumping tests on three test wells;
• Geophysical logging of two Blaine City wells;
• Quarterly water quality sampling of 18 wells;
• Measurement of ground water levels in 18 wells;
• Measurement of streamflows in Dakota Creek and an unnamed creek draining ~
the Boundary Upland; and 1\ j ~L , , . :\ ,. r ,q '1.£..1~, ••
• Collection of Blaine City wells, pumping rate data. --- .I''-' f)5- Q. ~\,"' 1 11 tJ
The results on the work are summarized below.
Geology
The Blaine GWMA is underlain by a sequence of glacial deposits ranging from sand and gravel to clay. The glacial deposits are at least 750 feet thick beneath the Blaine Watershed. Bedrock was not identified as part of the study. Most units are of variable thickness and
composition, are difficult to trace across the study area, and are sometimes absent. Several hundred feet of sand and gravel with occasional silty layers underlies the Boundary Upland area, whereas fine sands, silts and clays are present in the vicinity of Dakota Creek and Custer Trough.
Hydrogeology
Five aquifers were identified during the study. The aquifers are composed of either sand or sand and gravel and are capable of providing groundwater for municipal, agricultural, industrial or single family uses. The aquifers do not appear to be continuous over the GWMA. Below is a brief description of each aquifer.
Golder Associates

I I I I I I I I I I I I I I I I I I I
September 2. 1992 v 903-1060.406
Blaine Watershed Area
• Cl - the shallowest aquifer beneath Boundary Upland. City Wells No. 3 and 4 are completed in this aquifer. The aquifer provides spring flow to tributaries of Dakota Creek. The aquifer is recharged by precipitation over the Boundary Upland. Further development of this aquifer will have the greatest impact on tributary flow to Dakota Creek. The water quality shows increased nitrate levels · (up to 2 m&'L - drinking water standard is 10 m&'L) probably from isolated septic systems on the Boundary Upland. Additional development on the Boundary Upland could threaten water quality in this aquifer (and potentially deeper aquifers that are recharged by downward percolation from the Cl aquifer).
• C3 - Below Cl, and recharged via downward ·percolation from Cl across a silty aquitard (low-permeability layer). There are no City wells completed in this aquifer (with the possible exception of Well No. 1). Three test wells were drilled into this aquifer (GWMP-1, -2, -3) as part of the Ground Water Management Program. One test well at Boblett Street identified the possibility of developing between 400 to 500 gpm over 1 to 3 months pumping in the summer to meet future peak needs. The effect of pumping on stream flow would need to be determined prior to obtaining a water right from Ecology, but if the aquifer is only used for short periods in summer, the effect on Dakota Creek during these months will be limited. This is because the aquifer is overlain by silt and clay, and because the effect on creek flows is gradual taking place progressively over several months. Therefore, any effect on creek flows would occur in the fall or winter months when stream flows are higher. This "time-lag" effect on streamflow would need to be demonstrated to Ecology to secure a water right. As an alternative and possibly mitigative measure, groundwater from deeper aquifers could be used to augment streamflow if the short-term impact w'as unacceptable to Ecology. The water quality in this aquifer is good and meets present drinking water standards. Development on the Boundary Upland north of Bob lett Street could be a threat to water quality at this site.
• D - Below C3 in the Boundary Upland area and approximately 250 to 300 feet below ground surface, separated by a silt and clay layer from overlying Unit C3. City Wells No. 5, 6, Lincoln Park, and 12th Street are completed within this aquifer. A test/production well at Boblett Street is also completed in this zone. The D aquifer is recharged by downward percolation from C3 and possibly by flow from British Columbia. The use of groundwater from this aquifer has less effect on streamflow than the shallow aquifers (Cl and C3) because of the overlying low-permeability silt and clay. The test/production well at Boblett Street is capable of yielding 150 to 180 gpm and could be used for peak summer needs or year-round supply. A seven-day pump test of this well showed that the aquifer is confined with little to no impact on shallower aquifet;S and hence little impact on any tributary surface water flows to Dakota Creek. It should therefore be less complicated to obtain a water right for a well in the D aquifer than from a well in the C3 aquifer. The water quality meets present drinking water standards. Nitrate was less than detection (0.5 m&'L).
Golder Associates

I I I I I I I I I I I I I I I I I I I
September 2. 1992 vi 903-1060.406
• C4 - Deep (greater than 600 feet) aquifer. City Wells No. 1 and 2 are completed in this aquifer. The aquifer appears to be recharged from a source area other than the Boundary Upland since the water quality indicates longer subsurface residence. The likely recharge area is to the northeast of Blaine in British Columbia. The water chemistry indicates a long subsurface groundwater flow path leading to the conclusion that the water is likely old (probably several thousand years old), and therefore not subject to contamination by surface sources. The aquifer is well protected from contamination by the overlying silts and clays. The water quality meets present standards, however sodium and chloride are slightly higher than the shallow aquifers. There is no standard at present for sodium, however mixing in the City reservoir with water from the shallow aquifer wells reduces the sodium concentration. The extent of this aquifer is unknown because few wells have been drilled to such depths. Testing of City Well2 indicates additional groundwater supplies could be developed from the aquifer. Possibly 300 gpm could be developed by another deep well close to Wells No. 1 and 2. Development of the aquifer further away from Wells No. 1 and 2 would involve more risk because of the limited knowledge of the aquifer. If the aquifer is present at other locations, individual well yields of 200 to 400 gpm are possible. Because·of the aquifers' great depth, further development of this aquifer for water supply purposes will have little to no effect on streamflows in Dakota Creek. Water rights will be the easiest to obtain for this aquifer.
Dakota Creek and Custer Trough
• C2 - This is a shallow aquifer generally less than 50 feet deep in direct hydraulic communication with Dakota Creek. There are no City wells in this aquifer. It is only suitable for agricultural or single-family domestic use. The aquifer is susceptible to contamination because there is no overlying clay or silt layer. Data from the GWMP study indicate elevated nitrate and iron concentrations in this aquifer. The aquifer is not proposed to be used for municipal use in the future.
Overall Conclusions on Ground Water Availability within the GWMA
• The actual amount of groundwater that can be developed within the GWMA by Blaine cannot be determined accurately at this time. Observations of groundwater levels and streamflow in the area (see bullet below) indicates that additional groundwater can be developed with only limited impact, or mitigated impacts (i.e using deep aquifers to supplement streamflow if necessary to offset impacts of shallow wells). The best groundwater development strategy is one of progressive small-scale development (i.e. a new well every year or so) coupled with good monitoring of the hydrologic system (pumping rates, water quality, streamflows and groundwater levels) to determine the effect of the increased pumpage.
• Based on a comparison of streamflow in Dakota Creek at the Behme Road gaging station "for the period 1948-1954 and 1989-1992, Blaine's increased water consumption between 1950 and 1990 does not appear to have reduced streamflow
Golder Associates

I I I I I I I I I I I I I I I I I I I
September 2, 1992 vii 903-1060.406
in Dakota Creek at this gage. There is no gage closer to Blaine (the reach closer to Blaine is tidal).
• Water levels measured in wells in the Blaine Watershed have remained relatively stable over time. This indicates that groundwater pumpage is not greater than groundwater recharge (i.e., there is no indication that groundwater levels are declining over time indicative of groundwater mining).
• The recharge to those aquifers (Cl, C3, and D) sustained by precipitation over the Boundary Upland (area of about 6 square miles) is estimated to be between 2,000 to 4,000 gpm. Present annual average withdrawals by Blaine from these aquifers (Wells No. 3, 4, 5, 6, Lincoln Park, and 12th Street) is estimated at between 400 to 600 gpm. Future withdrawals must be somewhat less than overall recharge to sustain groundwater discharge to tributaries to Dakota Creek. Our opinion is that if the groundwater resource is managed well, future groundwater withdrawals from aquifers Cl, C3, and D could increase to between 30 to 50 percent of annual recharge without significant adverse effects on the hydrologic system. It would be preferable to concentrate additional development in the C3 and D aquifer because the effect on streamflows would be less than the C1 aquifer. Seasonal uses of these aquifer may help meet peaking needs with limited (or mitigated) effect on streamflows.
Recharge to the aquifer C4 is from deep underflow from British Columbia and cannot be determined accurately at this time. Present annual average withdrawal by Blaine Wells No. 1 and 2 from this aquifer is between 300 to 400 gpm. Based on the recent evaluation of Well No.2, we estimate that if the aquifer is extensive that possibly an additional 300 to 1,000 gpm could be developed from this aquifer by Blaine in the future. Future development of this aquifer is unlikely to impact streamflows because of the confined nature and depth of the aquifer. Water quality from this aquifer is different from the shallow aquifers (being slightly higher in sodium and chloride), therefore evaluation of water source blending should be carried out concurrent with additional development.
• There is the potential for future groundwater supplies from aquifers C3, C4, and D. The effort and costs involved to obtain new rights decreases as the depth of the aquifer increases. Groundwater from aquifer C3 could be used for summer peaking needs only provided that the City could demonstrate that there was a time-lag in the effect of pumping on streamflows during the pumping period. H necessary, groundwater from the D or C4 aquifer could also be used to mitigate streamflow impacts since testing has demonstrated that these are confined aquifers with little effect on streamflow.
• Since the Boundary Upland area is the main recharge area for the shallow aquifers, the City should proceed with the development of a Wellhead Protection Program for the Upland to protect water quality and ensure continued recharge of good quality water to the aquifer.
Golder Associates

I I I I I I I I I I I I I I I I I I I
September 2, 1992 1 903-1060.406
1. INTRODUCTION
This report presents an analysis of the hydrogeology, water quality, and ground water resources within a 30-square mile area near the City of Blaine, Washington, which has been designated the Blaine Ground Water Management Area (GWMA) (Figure 1-1). This report is designed to provide the basis for the development of a strategy to protect the ground water resources within the GWMA, as part of the Blaine Ground Water Management Program (GWMP).
1.1 Blaine Ground Water Management Area
The Blaine Ground Water Management Area (GWMA) encompasses about 30 square miles in the northwestern corner of Whatcom County (Figure 1-1). The area is bounded to the north by the border between Whatcom County and British Columbia; on the west by Drayton Harbor and Georgia Strait; on the south by the topographic divide separating Dakota Creek and California Creek; and on the east by the topographic divide separating the Dakota Creek watershed from Bertrand Creek These boundaries coincide somewhat with the Dakota Creek watershed.
The northern boundary of the GWMA is US/Canadian border. Although the border in part follows the topographic divide between the Dakota Creek watershed of Whatcom County and the Campbell River of British Columbia, the border does not delineate an independent study area for hydrological purposes. As a result, data has been collected from British Columbia to gain an overall understanding of the hydrology and hydrogeology of the Blaine GWMA.
Blaine is the major population center within the GWMA supporting a permanent population of about 3,375 persons. The remainder of the GWMA is rural residential and/or agricultural. The rural residential population is seasonal with greatest population during the summer months when the population can swell in excess of 10,000 persons. The area is currently undergoing relatively rapid development. The estimated permanent population of the entire GWMA is about 5,000 persons.
1.2 Purpose and Scope of Work
A Background Data Report was prepared in November 19901 to provide an initial evaluation of the geology, hydrogeology and ground water quality of the GWMA based on the available data. Based on this evaluation, additional data needs were identified to improve the understanding of the hydrogeology of the GWMA. These additional data were addressed in the Background Data Report, and have subsequently been collected in
1 Blaine Ground Water Management Program Background Report on Hydrogeology, Land Use and Water Use, Prepared for the City of Blaine by Golder Associates, dated November 6, 1990.
Golder Associates

I I I I I I I I I I I I I I I I I I I
September 2, 1992 2 903-1060.406
accordance with the Data Collection and Analysis Plan2 (DCAP), which was included as an appendix to the Background Data Report. Guidelines used for data collection were presented in the Quality Assurance and Quality Control Plan3 (QAQ~. Part of the data collection activities and analysis have been addressed in earlier reports . The final assessment of the geology, hydrogeology, and ground water quality of the GWMA, based on the data available prior to the GWMP, in conjunction with the data collected specifically for this project is presented in this final hydrogeologic report.
The purpose of this report is as follows:
• to define the hydrogeology of the GWMA; including hydrostratigraphic units, aquifer characteristics, water quality, and recharge-discharge relationships;
• to assess the groundwater resource capacity of the hydrogeologic system; and
• to provide recommendations for a long-term data collection and monitoring program to determine long-term trends in water levels and water quality, and to provide additional data for possible future technical work, such as groundwater modeling, to further refine·the understanding of the ground water resources of the GWMA.
2 Data Collection and Analysis Plan -Blaine Ground Water Management Program Background Report on the Hydrogeology, Land Use and Water Use, Appendix C, Prepared for the City of Blaine by Golder Associates, November 6, 1990.
3 Quality Assurance and Quality Control Plan - Blaine Ground Water Management Program Background Report on the Hydrogeology, Land Use and Water Use, Appendix B, Prepared for the City of Blaine by Golder Associates, November 6, 1990.
' Golder Associates, November 16, 1990. Installation and Pump-Testing of Test Wells and Recommendations for Further Ground Water Exploration - Blaine Ground Water Management Area. Prepared for the City of Blaine, Washington. Draft.
' Golder Associates Inc., February 24, 1992. Report on the Geophysical Logging and Tv Inspection of Blaine Wells No. 1 and No. 2 - Blaine Ground Water Management Area. Prepared for the City of Blaine, Washington.
Golder Associates

I I I I I I I I I I I I I I I I I I I
September 2, 1992 3· 903-1060.406
2. BACKGROUND
2.1 Physical Conditions
The Blaine GWMA is dominated by a broad upland feature referred to as the Boundary Upland which straddles the US/Canadian border (Figure 1-1). The Boundary Upland occupies the northern half of the GWMA and reaches a maximum elevation of about 500 feet above mean sea level (msl). The Boundary Upland decreases in elevation southward from the international border approaching the lowland region known as the Custer Trough. Ground surface elevations in the Custer Trough area range from sea level to about 80 feet (msl). The area of the Boundary Upland within the GWMA and the northwestern part of the Custer Trough are drained by Dakota Creek, which flows westward and discharges into Drayton Harbor. The northern portion of the Boundary Upland lies within British Columbia and slopes northwards into the Campbell River drainage, which discharges into Semiahmoo Bay.
The climate of the Blaine GWMA is characterized as having warm rainy winters and relatively dry cool summers. During the winter, there is a fairly steady succession of lowpressure systems moving eastward from the Pacific Ocean producing cloudy rainy conditions. In summer, high-pressure cells may develop off-shore producing long periods of sunny and dry weather.
The Blaine GWMA is drained by Dakota Creek and its associated tributaries (Figure 1-1 and 1-2). The easterly boundary of the GWMA represents the surface-water divide with Bertrand Creek which drains into the Nooksack River. The southern boundary of the GWMA represents the surface-water divide between Dakota Creek and California Creek. California Creek drains into Drayton Harbor, and runs parallel to Dakota Creek to the southwest of the GWMA, located approximately 2 miles southwest of Dakota Creek.
The Dakota Creek watershed occupies an area of about 30 square miles, with all but a very small portion occurring in Whatcom County. The North Fork of Dakota Creek surfaces as many diffuse springs and seeps on the edge of the Boundary Upland at elevations of between 150 and 200 feet msl, from where they flow southward and southwestward to join with the South Fork. The South Fork originates as a series of seeps/springs near the Birch Bay-Lynden and Glendale Roads at an elevation of about 100ft msl. The North Fork and the South Fork of Dakota Creek merge near the intersection of Sections 13, 14, 23, and 24 in Township 40N, Range IE immediately west of Custer School Road. From this confluence, Dakota Creek flows west-northwest towards Drayton Harbor. The creek is fed by other tributaries which generally drain the Boundary Upland including small un-named tributaries which originate as springs near the Blaine Watershed at elevations of between 200 and 300 feet msl.
At the northern edge of the Blaine GWMA, there appears to be isolated areas where surface drainage is directed northward into the Campbell River system of British Columbia (for example the northern portion of Sections 34, 35 and 36 in Township 41N, Range 1E).
Golder Associates

I I I I I I I I I I I I I I I I I I I
September 2, 1992 4 903-1060.406
In general however, the international border roughly approximates the topographic divide between Dakota Creek and the Campbell River.
2.2 Geology
The geologic setting of the GWMA and the Fraser Lowland of British Columbia is that of a· major structural trough which has subsided repeatedly since late-Cretaceous time6• The . northern boundary of the trough occurs approximately 20 miles north of the international border. The eastern border occurs approximately 30 miles east of Semiahmoo Bay; and the southern border occurs near Bellingham, Washington, approximately 15 miles south of the international border. The trough appears to be at least 1,100 feet deep in places based on a well located just north Blaine across the international border at Peace Arch Park (Figure 1-2), which was drilled to a depth of 1,112 feet below ground surface (bgs) without encountering bedrock. Bedrock, however, has been encountered at a depth of 457 feet bgs (elevation about -375 feet msl) (borehole 40N01E-11Q) farther to the south in Section 11 (Figure 1-2), and at depths of less than 300 feet still farther to the south in Section 32. The trough was gradually filled, first with fluvial sediments transported by rivers from the inland mountains, then by marine, fluvial, and glacial sediments of Quaternary age associated with the glacio-climatic episode of the last 1.8 million years7• Isostatic adjustments related to glacial advances and retreats, combined with eustatic changes in sea level produced vertical fluctuations of shoreline position of up to 650 feet during the last 1.8 million years6•
The Quaternary geology of the Blaine GWMA consists of glacial deposits of the Fraser Glaciation and Pre-Fraser glacial and non-glacial deposits. Very little is known of the Pre-Fraser deposits in the area. A few deep wells of up to 750 feet have been drilled within the Blaine Watershed (Blaine Wells No. 1 and No.2, in addition to a test well TH-f and test well No. 20 for the Point Roberts Water Association, see Figure 1-2). These wells encountered what is presumed to be Pre-Fraser glacial and/or non-glacial sediments at depths of greater than about 300 feet bgs. The geologic formations encountered below 300 feet bgs in these wells are presently unknown, but appear to be primarily low-permeability glacial till, marine or glacio-marine, or fluvial sediments with occasional thin water-bearing zones of sand.
The Fraser Glaciation consisted of two glacial advances known as the Vashon and Sumas Stades. The two glacial advances are separated by a period of glacial retreat known as the Everson Interstade. The Vashon deposits consist of a sand and gravel outwash deposit known as the Esperance Sand, and a till deposit known as the Vashon Drift, which consists of unsorted clay, silt, sand, and gravel. As the Vashon glacier retreated, the area was
' Mathews, W.H. 1972. Geology of the Vancouver Area of British Columbia, Field Excursion A05-C05, Guidebook, 24th International Geological Congress.
7 Halstead, E. C. (1986). Groundwater Supply- Fraser Lowland, British Columbia. National Hydrology Research Institute, Environment Canada.
Golder Associates

I I I I I I I I I I I I I I I I I I I
September 2. 1992 5 903-1060.406
invaded by the sea, and the Everson Interstade sediments were deposited. The Everson Interstade deposits consist of the Kulshan glacio-marine drift, the Deming sand, and the Bellingham glacio-marine drift. The deposits consist of interbedded fossiliferous stony days, stony silt, till-like mixtures, marine day, deltaic sand and gravel, fluvial and lacustrine day, silt, sand, gravel, and peat. During the waning stages of the last glacial period, a small glacial re-advance, known as the Sumas Stade, deposited glacial outwash in the Sumas a rea.8•9 ·
2.3 Hydrogeology
Previously available information on the hydrogeology of the GWMA was limited to three groundwater investifations for the City of Blaine and Point Roberts Water District in the Blaine Watershed10•1 •12, water-quality data from the City wells and STORET and W ATSTORE data bases, well logs available from the Department of Ecology, and recent work by a graduate student at Western Washington University13• North of the international border, a hydrogeological evaluation of the Fraser Valley was performed by Halstead7• Halstead identified six hydrostratigraphic units in the Fraser Valley area based on grain-size and depositional environment. A similar convention has been adopted for the Blaine GWMA. The hydrostratigraphy of the GWMA is discussed in detail in Section 4.1.
8 Easterbrook, D.]. 1976. Geologic Map of Western Whatcom County, USGS Miscellaneous Investigations Series Map I-854-B, Scale 1:62,500.
9 Armstrong, f.F., Crandell, D.R. Easterbrook, D.]., and Noble, ].B., 1965. Late Pleistocene Stratigraphy and Chronology on Southwestern British Columbia and Northwestern Washington. Geological Society of America Bulletin, Vol. 76, p. 321-330.
10 Shannon and Wilson, Inc. (1975). Potential Groundwater Supply, Blaine, Washington. Prepared for the City of Blaine.
11 Shannon and Wilson, Inc. (1986). Re-evaluation of Groundwater Resources within the Blaine Watershed, Blaine, Washington. Prepared for the City of Blaine.
12 Shannon and Wilson, Inc. (1987). Installation and Testing of City of Blaine Well19 and Point Roberts Water District No. 4 Test Well. Prepared for the City of Blaine. •
13 Sandal M. (1990). Water Balance and Hydrostratigraphy of the Dakota Creek Watershed, Whatcom County, Washington. M.Sc. Thesis for Western Washington University, Bellingham.
Golder Associates

I I I I I I I I I I I I I I I I I I I
September 2, 1992 6 903-1060.406
2.4 Ground Water Quality
Limited existing ground water qualiw~dat::Je accessed from the USGS WATSTOR data base, the EPA STORET data: base, and Dion?d Sumioka14. Additional ground water quality information for wells in the Ftas.er-Lowlands of British Columbia was obtained from Halstead7 and Armstrong and Brown15. This information was presented and discussed in the Background Data Report. Based on these limited data, the ground water quality within the GWMA appeared to be good with the possible exception of slightly elevated iron and manganese concentrations in places. Existing water quality data from the City wells is presented in Table 2-1.
Available data indicated that chloride concentrations within the GWMA are relatively low, although there had been reports of elevated chloride concentrations in the Fraser Lowlands of British Columbia, and in a few places along the coast southwest of the GWMA. Elevated chloride concentrations as high as 500 m!ifL have been observed in the deeper confined aquifers in Campbell River Park, located about one to two miles north of Sections 34 and 35 in British Columbia7• The source of this ground water is believed to be sea water trapped in the pore spaces of sediments that were deposited when the shoreline was farther inland than at present. In other locations of the Fraser Lowlands of British Columbia, chloride concentrations as high as 2,500 mg/L have been reported, which are believed to be associated with deep ground water flow systems. ~ated chlorid~entrations.as_bjglL..
/'f- as ~~~_have bee~ report~d in wells near P?int R?oerts ana along California Creek, '-wnich D10n and Sum10ka attnbute to saltwater mtrus1on, because the wells are close to the
coast, completed at depths at or below sea level, and are pumped heavily during the summer months. Dian and Sumioka believe that the elevated chloride concentrations near California Creek result from saline waters trapped in pore spaces of the sediments, which were deposited when the shoreline was located farther inland than at present.
Available data indicated that nitrate concentrations in the Blaine Watershed area were low, but occasionally within deteCtable levels. There was very little nitrate concentration data available from the remainder of the GWMA. Cases of nitrate contamination have been reported near Lynden16 and in the Fraser Lowlands of British Columbia17. These
\ (i'Dion, N.P., and S.S. Sumioka, 1978. Seawater Intrusion into Coastal Aquifers in Washington.
Stafevington Department of Ecology, Water-Supply Bulletin No.56.
15 Armstrong, ].E., and W.L. Brown, 1953. Ground-Water Resources of Surrey Municipality, British Columbia. Canada Department of Mines and Technical Surveys, Geological Survey of Canada Water Supply Paper No. 322.
" Golder Associates Inc. 1987. Report Prepared for the City of Lynden.
17 Kohut, A.P., S. Sather,]. Kwong, F. Chwojka. 1989. Nitrate Contamination of the Abbotsford Aquifer, British Columbia. British Columbia Ministry of the Environment. Water Management Branch. Groundwater Section. Victoria, BC.
Golder Associates

I I I I I I I I I I I I I I I I I I I
September 2, 1992 7 903-1060.406
incidence have been attributed to local sources of contamination such as manure piles, septic system failures, and fertilizer applications, which have contaminated nearby wells.
2.5 Land Use and Water Use
Land use jurisdictions, existing land use, and future land use were discussed in detail in the Background Data Report1. In addition, land use impacts on ground water quality was discussed. Water use jurisdictions, trends of withdrawals, and water rights were also discussed in the Background Data Report.
Golder Associates
I I I I I I I I I I I I I I I I I I I
September 2, 1992 8 903-1060.406
3. DATA COLLECTION AND ANALYSIS
Data collection activities were identified to help refine the understanding of the geology, hydrogeology, and ground water quality of the GWMA. These activities and analysis of the data are discussed in the following sections. The data collection activities consisted of:
1) Installation and pump testing of three test wells to evaluate the geology, hydrogeology, and water quality in areas where previously little data existed;
2) Installation of one test/production well to evaluate the hydrogeologic characteristics of a deeper aquifer identified at one of the test well sites (the test/production well was not part of the data collection plan, but the data are relevant to this study, and are therefore included);
/) ,J/ 3) Geop.~ysicallogging of City Wells No. 1 and No. 2 to determine the geologic , i 1 ~condthons;
4) Rehabilitation and pump testing of City Well No. 2 to determine the hydraulic properties in the vicinity of the well. This work was not part of the data collection plan, but the data are relevant to this study, and are therefore included;
5) Collection of water-level data and water-quality data from a number of wells located throughout the GWMA to evaluate ground water level fluctuations, directions of groundwater flow, and water quality; and
6) Collection of hydrometic data, including climatic, stream flow data, and ground water withdrawals, to evaluate recharge-discharge relationships and establish a water budget.
The results of activities 1, 2, 3, and 4 are discussed in previous reports4.S,l8;I9•
3.1 Test Well Installation and Pump Testing
Three 8-inch diameter test wells (GWMP-1, GWMP-2, and GWMP-3) were drilled and pump tested in August, September, and October 1990, to provide geologic, hydrogeologic, and water quality data, These wells will be used as permanent water quality monitoring wells as part of the Blaine GWMP. Test wells GWMP-1, GWMP-2 and GWMP-3 were each drilled to a final depth of about 300 feet below ground surface (bgs), and completed in the
18 Golder Associates Inc., October 23, 1991. Installation and Pump-Testing of a Deep Well at the Boblett Street Site, Blaine, Washington. Prepared for the City of Blaine, Washington.
19Golder Associates Inc., June 26, 1992, Report on Rehabilitation and Pump Testing of Blaine City Well No, 2. Prepared for the City of Blaine, Washington
Golder Associates

I I I I I I I I I I I I I I I I I I I
September 2, 1992 9 903-1060.406
most permeable zone encountered during drilling. The well logs are presented in Appendix A, and the well locations are shown on Figure 1-2.
A 12-inch diameter test/production (termed the Deep Well) was subsequently drilled and pump tested at the site of GWMP-3 in June and July, 1991 to investigate the ground water supply potential and ground water quality of a second aquifer identified while drilling GWMP-3. The well log is presented in Appendix A.
Blaine City Well No. 2 was rehabilitated and pump tested in April and May 1992. The well had been pumping sand for many years and a new well screen was required to alleviate the problem. The well log is presented in Appendix A..
3.1.1 Geologic Conditions and Pump Test Results
3.1.1.1 GWMP-1
Borehole GWMP-1 penetrated fine-grained materials, from the surface to a depth of approximately 150 feet bgs. This material consisted of fine sand with occasional gravel, fine sand with silt, silt, and clayey silt. Fine to coarse water-bearing sand with some gravel was encountered between 150 and approximately ·190 feet bgs. Fine sand, grading to sandy clay, and silty clay, was encountered between 190 and 278 feet bgs where the borehole was terminated.
The well was screened with 40-slot well screen at a depth of between 176 and 186 feet bgs in the aquifer occurring between 160 and 230 feet bgs. The static water level in October 1990 was about 131 feet bgs. Due to the fine-grained nature of the aquifer, and its limited groundwater supply potential as evidenced by air-lift flow rates of less than 20 gallons per minute (gpm), a slug test was conducted in the well rather than a pump test to determine the aquifer properties. The transmissivity of the aquifer is low, estimated at 60 to 120 ft2/d. Storativity could not be calculated accurately from the slug test results.
Water quality is discussed in a subsequent section.
3.1.1.2 GWMP-2
Borehole GWMP-2 penetrated sandy clay and gravel and fine to coarse sand from the surface to a depth of 17 feet bgs. Silty clay and clayey silt was encountered between 17 and 55 feet bgs. Water-bearing sand and gravel, and peat was then encountered between 55 and 100 feet bgs, and silty-day was encountered from 100 to 303 feet bgs where the borehole was terminated.
The well was completed with 5 feet of 60-slot well screen set at a depth of between 84 and 89 feet bgs within the aquifer occurring between 55 and 90 feet bgs. The static water level in October 1990 was about 71 feet bgs. The 2A-hour pump test of the well indicated that the aquifer had a high transmissivity of 14,000 ft2/d. The aquifer, however, is limited laterally by at least two low-permeability boundaries. Storativity could not be accurately
Golder Associates
I I I I I I I I I I I I I I I I I I I
September 2, 1992 10 903-1060.406
calculated from the single well pump test, but was estimated at about 0.01, which is typical of unconfined aquifers.
Water quality is discussed in a subsequent section.
3.1.1.3 c;~-3
Borehole (;WMP-3 encountered silty-day, clay and gravel, and sandy gravel from the surface to a depth of 53 feet bgs. Clayey fine sand with occasional gravel was encountered from 53 to 100 feet bgs. Water-bearing sand and gravel was encountered between 100 and 220 feet bgs. Silty sand and clayey silt was encountered between 220 and 255 feet bgs, and water-bearing fine sand with occasional gravel was encountered from 255 to 299 feet bgs where the borehole was terminated.
The well was completed with 10 feet of 60-slot well screen set at a depth of between 148 and 158 feet bgs within the aquifer occurring at a depth of between 100 and 220 feet bgs. The static water level within this aquifer prior to the pump test conducted in October 1990 was about 85 feet bgs. The transmissivity of the aquifer was estimated at 4,000 W/d. The storativity was assumed to be about 2 x 10''\ which is typical of confined aquifers. The pump test revealed that the aquifer is limited laterally by at least two low-permeability boundaries.
Water quality is discussed in a subsequent section.
3.1.1.4 Deep Well
The geologic materials penetrated by the Deep Well at the site of (;WMP-3, was similar to that encountered by (;WMP-3. However, the silt content of the deeper aquifer at the site had been underestimated during the drilling of (;WMP-3, resulting from the use of airrotary drilling methods, as opposed to cable tool drilling methods which were used during the installation of the Deep Well. The description of the deeper aquifer was, thus, revised to silty fine sand from 259 to 268 feet bgs, and fine sand from 268 to 298 feet bgs.
The well was completed with 20 feet of 20-slot well screen and sand packed between 272 to 292 feet bgs. The static water level prior to conducting the pump test was about 84 feet · bgs. The 7 -day pump test indicated that the transmissivity of the deep aquifer is about 330 ft"/d. The aquifer was assumed to have a storativity of 5 x 10·3, which is typical of semiconfined conditions. There was no indication of low-permeability boundaries within the deep aquifer in the near vicinity of the well.
3.1.1.5 City Well No. 2
This well was originally drilled in 1965 to a depth of 700 feet. The geologic log is very poor. (;eophysicallogging (Section 3.2) indicated silty deposits from 0 to 90 feet bgs, sandy deposits from 90 to 185 feet bgs, and clay from 185 to 630 feet where the borehole had collapsed. Subsequent rehabilitation efforts indicated about 15 feet of fine sand from 630 to 645 feet bgs, where the well screen was set.
Golder Associates

I I I I I I I I I I I I I I I I I I I
September 2. 1992 11 903-1060.406
A one-day pump test indicated that the transmissivity of the sand aquifer is about 700 ft'r/d. The aquifer is confined but appeared to be influenced by leakage during the test. The storativity of the aquifer was estimated at 2x10⁴
• There was no indication of lowpermeability boundaries within the area of influence of the test.
3.2 Geophysical Logging of City Wells No. 1 and No. 2
The original plan outlined in the DCAP called for geophysical logging of only Well No. 1, and conducting a 4-hour pump test and concurrent spinner log to identify various zones contributing flow to the well. However, a pumping system could not be devised to run concurrently with the spinner. Thus, the additional logging of Well No. 2 was substituted to augment the data collected from Well No. 1, and to obtain information on the lateral extent of the geologic units.
On January 23 and 24, 1992, Blaine City Wells No. 1 and No. 2 were inspected using a color down-hole camera and geophysically logged. A TV scan was first conducted in each well to determine the condition of the wells and the location of perforations. Then, a suite of geophysical logs were run beginning with fluid temperature, followed by fluid resistivity, caliper, spinner, natural gamma, and neutron-neutron.
The geophysical logs of City Wells No. 1 and No. 2 indicate the presence of two to three .water-bearing zones at a depth of less than 300 feet bgs, which is consistent with the three aquifers identified by Shannon and Wilson10 within the Blaine Watershed. The logs also indicated the presence of a deep water-bearing zone at a depth of about 620 feet bgs, which is consistent with the deep groundwater system described by Shannon and Wilson within the Watershed. This deep zone contributes all of the flow to Well No.2. Well No. 1, however, appears to be producing water from the deep zone (610 to 625 feet bgs) and possibly from a shallow zone between 172 and 180 feet bgs.
3.3 Climatic Data
Precipitation records were obtained from seven weather stations located within 20 miles of the GWMP area, including Blaine, two near Bellingham, Clearbrook in Washington; and Langely and two near White Rock, British Columbia (Figure 1-2). Monthly precipitation statistics compiled by NOAA20 from data collected from 1951 to 1980 are presented in Table 3-1. The average yearly precipitation for the Blaine station is 40.34 inches, 35 inches for the Bellingham Airport station, and 57 inches for the Langely station. Precipitation increases eastward and northward towards the Cascades and Coastal Mountain ranges. Approximately 70 percent of the annual precipitation occurs between October and March.
"' NOAA. Climatic Normals for the U.S. (Base 1951-1980). National Climatic Center, Environmental Data Information Service.
Golder Associates

I I I I I I I I I I I I I I I I I I I
September 2. 1992 12 903-1060.406
The monthly precipitation totals occurring between January 1989 and November 1991 are also included in Table 3-1 for comparison. The annual precipitation occurring at the Blaine and Bellingham Airport stations in 1989 were 45 and 40 inches, respectively (about 5 inches above the normals, where the normal has been defined as the 30-year average from 1951 to 1980); and in 1990, the annual precipitation for the Blaine and Bellingham Airport was 50 and 45 inches, respectively (about 10 inches above the normals). Notably higher than normal monthly precipitation totals occurred in August 1989, and in November 1989 and 1990. Precipitation measured at the Blaine station during these months, for example, was: 5.23 inches in August 1989, which exceeded the normal by 3.68 inches; in November 1989, 10.31 inches of precipitation, which exceeded the normal by 4.74 inches; and in November 1990, 10.46 inches of precipitation, which exceeded the normal by 4.89 inches.
In addition to the yearly and monthly average precipitation records, daily precipitation records were collected from the Blaine weather stations to determine rainfall-runoff relationships, and to develop a water budget. A precipitation station was also setup in the Boundary Upland area on October 17, 1990 at the location shown on Figure 1-1. The station was operated to measure precipitation in the Boundary Upland area, which is believed to be the primary recharge area for the local aquifers within the GWMA. Precipitation data were collected from October 17, 1990 through March, 1992 on a daily basis. The precipitation data obtained from Blaine and Boundary Upland weather stations are presented in tables and graphs in Appendix B. The tables and graphs illustrate that, in general, more precipitation fell in the Boundary Upland area than at the Blaine station. This was expected because of the greater elevation within the Boundary Upland area (about 400 feet msl) in comparison to the Blaine station site (elevation about 60 feet msl).
Estimates of the monthly total precipitation occurring within the Boundary Upland area before the Boundary Upland station was established, were developed from the data obtained from the Blaine station using linear regression techniques (further details presented in Table 3-1). These data are included in Table 3-1. The annual precipitation in the Boundary Upland area for 1989 and 1990 was estimated at 49 and 55 inches, respectively, which is approximately 4 inches per year greater than that occurring at the Blaine station.
Based on the precipitation data and the ground-surface elevations within the GWMA, the yearly average precipitation occurring within the GWMA is about 41 inches. The estimated average precipitation is slightly greater than the normal precipitation measured at the Blaine station due to the elevated terrain areas of the Boundary Upland area which receive greater precipitation. The average annual precipitation occurring within the Boundary Upland area is estimated to be about 44 inches.
Thirty-year monthly temperature statistics were also obtained for the Blaine weather station (Table 3-2) in order to determine the average potential evapotranspiration occurring within the GWMA. In addition, monthly average temperatures from the Blaine station were collected for 1989, 1990, and 1991, to determine potential evapotranspiration for use in developing a water budget. The temperature differences within the GWMA due to elevation differences appear to have a negligible impact on potential evapotranspiration,
Golder Associates

I I I I I I I I I I I I I I I I I I I
September 2, 1992 13 903-1060.406
based on the normal temperature change for increasing elevation of -3.8 op per 1,000 feetl-1.
The potential evapotranspiration within the GWMA for 1989, 1990, and 1991 was calculated using the Thomwaite method (Table 3-3), along with the average potential evapotranspiration based on the 30-year average temperature data. Total yearly potential evapotranspiration was estimated at 25 inches for 1989 and 1990 compared with about 24 inches based on the 30-year average temperatures. A complete temperature record for 1991 was not available at the time of this report. Monthly potential evapotranspiration varies from 0 inches in February (the coldest month) to 4.5 inches in July (the warmest month). The potential evapotranspiration estimates presented in Table 3-3 were used to derive an estimate of ground water recharge, presented in Section 4.2.
3.4 Stream Flow Data
3.4.1 Dakota Creek
On October 2, 1990, a gaging station was established on Dakota Creek at the Behme Road bridge (Figure 1-1) to measure runoff. Dakota Creek was previously gaged at the same location by the USGS between July 1948 and September 1954, and again between June 1989 and June 1990, by Sandal13. This gaging location is about 3.5 miles upstream of where Dakota Creek drains into Drayton Harbor, and is upstream of most of the tributaries that drain the Boundary Upland. The catchment area contributing flow to Dakota Creek upstream of the gaging station is 17.9 square miles (Figure 1-1) compared with the total Dakota Creek drainage basin of 27.8 square miles. Establishing a gaging station closer to the mouth of the creek was not feasible due to tidal effects on stream flow. Thus, about 65 percent of the total drainage from the Dakota Creek watershed can be gaged at this location. Drainage from the Boundary Upland area was largely un-gaged, except for the stream within the Blaine Watershed area (discussed below). The Boundary Upland occupies an area of about 6 square miles, and is thought to be the primary recharge area for the local aquifers developed by the City of Blaine for water supply purposes.
For this study, staff-gage measurements from Dakota Creek were recorded by City personnel on an average of two to three times a week beginning October 2, 1990 through March 1992. Staff gage measurements, however, were not collected from November 7, 1990 to February 7, 1991. Stream flow rate was periodically measured by a Golder Associates hydrologist using a pygmy meter to calibrate the staff gage measurements taken by the City with the rating curve established by Sandal13. The flow measurements and a streamflow hydrograph are presented in Appendix C.
21 Linsley R.K., ]r., M.A. Kohler, and ].L.H. Paulus, 1982. Hydrology for Engineers. MCgrawHill Book Company, pp. 508.
Golder Associates

I I I I I I I I I I I I I I I I I I I
September 2, 1992 14 903-1060.406
The Dakota Creek stream flow hydrograph (Figure C-1) shows that flow varied from about 1 cubic feet per second (cfs) to over 800 cfs from June 1989 through March 1992 (the stream was not gaged between June and October 1990). The average low-flow of 1 to 2.5 cfs occurred during the summer months, and higher flows averaging about 20 cfs occurred between about November and April to May. Low flows of 0.1 cfs were recorded in August 1950 and September 1952 by the USGS22• The .creek was not gaged from November 7, 1990 through February 7, 1991, during which time record-high precipitation events occurred in November 1990, resulting in severe flooding throughout the Puget Sound area.
The total discharge occurring Between May 1989 and June 1990 is estimated at 23,875 acrefeet, which is consistent with the average annual discharge of 23,000 acre-feet that occurred between 1948 and 1954 according to the USGS22. Rainfall-runoff relationships and development of a water budget are discussed in Section 4.2.
3.4.2 Blaine Watershed Stream
On October 3, 1990 a cutthroat flume was installed in the Watershed stream, downstream of the reservoir (Figure 1c1) to measure runoff and spring flow within the Blaine Watershed. The catchment area of the stream is approximately 0.5 square miles, as shown in Figure 1-1. Stream flow was measured two to three times per week between October 3 and November 2, 1990. The flume was washed out by high stream flows in early November, and the stream was un-gaged until February 7, 1991 when a V-notched weir was installed. The stream was then gaged two to three times per week through March, 1992 by City personnel, except between February 27 and March 28, 1991. In addition to the measurements collected by the City, Golder Associates installed a continuous recording device (Stevens Recorder) between July 17, 1990 and November 21, 1991. The City's storage reservoir often overflowed into the stream, however, which complicated the interpretation of the runoff data.
Stream flow varied from less than 0.04 cfs (20 gpm) to over 2.2 cfs (1,000 gpm), as shown in Figure C-2. The highest flows appeared to be caused by a combination of overflow from the Blaine reservoir and high precipitation. The reservoir overflowed almost on a daily basis at an estimated rate of 250 gpm to as much as 550 gpm for a period of up to 4 to 5 hours per day. Most overflow events appear to have occurred during the early morning hours after continuous pumping of the wells through the night once again topped off the reservoir. During the summer months, it appears that without the flow contribution from the overflowing reservoir, the stream flow would be less than 0.04 cfs (20 gpm) and may be less than about 0.01 cfs (5 gpm). During the winter months, stream flow, without the contribution for the overflowing reservoir, appears to average somewhere between 0.08 and 0.1 cfs (40 and 50 gpm).
22 Washington Division of Water Resources, 1960. Water Resources of the Nooksack river Basin and Certain Adjacent Streams. Water Supply Bulletin No. 12, Olympia, Washington.
Golder Associates

I I I I I I I I I I I I I I I I I I I
September 2. 1992 15. 903-1060.406
3.5 Water-Level Data
The Background Data Report1 provided a brief discussion of information available prior to this work. The data were too few to determine long-term trends or provide sufficient information to determine directions of ground water flow. The data consisted of water- Jt levels collected from the City wells in 1977 during a hydrogeologic study conducted by ~
Shannon and Wilson10; limited water-levels collected between 1978 and 1980; and limited L '-- · J water-levels collected from 1987 through 1989. Additional old water-level data from well ) ~ No. 1 and the 12th St well has since been found, and is included in this report.
In 1989, the City began collecting water-level measurements from the City wells as part of this study to determine yearly water-level fluctuations resulting from increased pumping during the summer and fall months, and recharge during the winter and spring months. Water-level measurements were collected from Wells No. 1, No. 4, No. 7, and Lincoln Park generally on a weekly basis. Fewer data were collected from Wells No. 2, No. 3, and No. 5 during this time.
As part of the GWMP, nine domestic wells were also selected for water-level monitoring in addition to the three test wells to document seasonal water-level fluctuations and determine directions of ground water flow. Table 3-4 presents the wells chosen for waterlevel data collection, which are shown of Figure 1-2. Water levels were to be collected from the wells on a monthly basis by City personnel. However, only about six measurements were taken in each well between November 1990 and November 1991. In order to obtain additional water level data needed to better determine yearly water-level fluctuations throughout the GWMA, water levels were taken from the domestic wells through March 1992.
Water-level data are presented in Appendix D, along with hydrographs depicting seasonal water-level fluctuations occurring primarily during the winter and spring months of 1990-91 and the summer and fall months of 1991. In general, seasonal water-levels fluctuated between 2 to 3 feet, as illustrated by the hydrographs of the domestic wells. The water levels in the City wells are more difficult to evaluate with regard to seasonal water-level changes, due to the irregular pumping schedules and the effects of increased pumping during the summer months. As shown in Figure D-13, pumping water levels in Well No. 1 were about 160 feet bgs (elevation about 17 feet msi), and non-pumping water levels were about 110 feet bgs (67 feet msl). As shown in Figure D-16, pumping water levels in Well No. 4 were about 75 to 85 feet bgs, and non-pumping water levels were about 25 to 40 feet bgs. Seasonal changes in water levels due to increased pumping during the summer months are apparent from the Lincoln Park well, Well No. 1, and Well No.4. Water levels in the Lincoln Park well were about 20 feet lower in the summer and fall months in comparison to the winter and spring months (Figure D-11). Water levels in Well No. 1 (Figure D-13) were about 3 feet lower in the summer and fall months, and water levels in Well No. 4 (Figure D-16) appeared to be about 10 feet lower in the summer months than in the winter months.
Golder Associates

I I I I I I I I I I I I I I I I I I I
September 2, 1992 16 903-1060.406
With regard to long-term water-level trends, data from one well (Well No. 1) shown in Figure D-12, suggests a possible declining water-level from about 65 feet bgs in 1940 to
. about 110 feet in February 1992. One should note, however, that the well has been modified a number of times in the past to tap additional water-bearing zones and to attempt to solve the sand-pumping .problem. Thus, the water-level measurements taken in the past may have been influenced by various inter-aquifer effects. It should also be noted that the water-levels may be representative of only a single water-bearing zone among many. Available data from the other City wells does not show any particular trend. Water level trends will be discussed in further detail in Section 5.0.
3.6 Ground Water Withdrawals
Groundwater withdrawal data were collected from the City wells in order to evaluate ground water resources and to establish a water budget. Flow meters have not been installed on the City wells. However, the pumps are equipped with hour meters to record the operating time of each well, which combined with estimates of the pumping rate (based on City flow-rate tests) were used to estimate the ground water withdrawals. The estimated ground water withdrawals were then compared with the total metered flow from the Watershed and water sales figures provided by the City to determine the potential range of actual ground water withdrawals.
Monthly total pumping from the City wells within the Watershed based on the hour-meter readings averaged about 1,400 gpm, as shown in Figure E-1. The total metered flow from the Watershed (City Wells No. 1 through No. 6), however, is less than half (average about 600 gpm) the estimated flow based on the hour-meter readings (Figure E-2). The metered flow plus the estimated flow from the Lincoln Park and 12th St Wells compares weJl with the reported sales (Figure E-3) for 1991 of 810 gpm23• Overflow of the reservoir accounts for some of the discrepancy (50 to 100·gpm, daily average) between water sales and hourmeter readings, but a large error remains, which is likely caused by inaccurate estimates of the pumping rate of the wells. Thus, it appears that the hour-meter readings do not provide accurate ground water withdrawal data. Flow meters should be installed for each of the City wells to accurately measure future use. Estimates of ground water withdrawal used in water budget calculations and water resources evaluation are based on the total metered quantities from the Watershed plus the estimated flow from the Lincoln Park and 12th St Wells (Figure E-4}, as discussed further in Section 4.2 and 5.
Other ground water withdrawals within the GWMA include withdrawals for irrigation and domestic purposes. Estimates of these withdrawals were presented and discussed in the Background Data Report.
23 Letter from City of Blaine to Economic and Engineering Services, Inc., dated May 5, 1992.
Golder Associates

I I I I I I I I I I I I I I I I I I I
September 2, 1992 17 903-1060.406
3.7 Ground Water Quality Sampling and Analysis
3.7.1 Sampling Method
Four quarterly rounds of water quality samples were taken from the three test wells, four of the City of Blaine wells, and the 11 domestic wells shown in Table 3-4 beginning in October 1990 to determine the ground water quality within the GWMA and seasonal trends. The first sampling round was conducted in October and November of 1990 by a Golder Associates hydrogeologist. Additional sampling rounds were conducted in March, July, and October 1991 by City personnel with assistance from Golder Associates. The Deep Well at Boblett Street was sampled in July 1991, while Blaine Wells No. 1 and 2 were sampled in May 1992. Samples were collected in accordance with the DCAJ>2.
The ground water samples were analyzed for the following constituents:
Bicarbonate Alkalinity Carbonate Alkalinity Hydroxide
Calcium Chloride Color
Iron Magnesium Manganese
Nitrate+ Nitrite (as N) Potassium Silica
Sodium Sulfate Total Alkalinity
Total Dissolved Solids Total Hardness Total Organic Halide
Turbidity Arsenic* Barium*
Cadmium* Chromium* Copper*
Lead* Mercury* Selenium*
Silver• Zinc*
Notes: • Analyzed for GWMP-1, GWMP-2, GWMP-3, and the Deep Well samples only. All samples were unfiltered. Metal samples are total metals.
During subsequent sampling rounds, only the apparently elevated parameters, based on the first-round sampling results were analyzed including iron, manganese, nitrate, and turbidity. Coliform was analyzed during the second sampling round, and one well (Rodenberger well) was re-sampled for coliform during the third round.
In addition to the sampling noted above, the Deep Well was sampled for all currently regulated drinking water parameters, including basic inorganics, metals, pesticides and PCB's, herbicides, gross a and ~'and coliform.
The first round of samples were taken from the test wells upon the conclusion of 24-hour pump tests conducted in October of 19<XJ4. Permanent pumps were subsequently installed
Golder Associates

I I I I I I I I I I I I I I I I I I I
September 2, 1992 18 903-1060.406
in the test wells to collect later samples. Samples from the domestic wells and the City wells were collected by opening faucets closest to the well head, and allowing the water to run for approximately 30 minutes prior to sampling. Temperature, specific conductance, and pH were monitored prior to collecting the samples. During the first sampling round, the pH/specific conductance meter malfunctioned, and pH and specific conductance were not collected for some of the samples. Specific conductance and pH, however, were collected during subsequent sampling rounds. The samples were collected in accordance with Technical Procedure TP 1.2-20, and as outlined in the QAQCP3
• An evaluation of the quality of the ground water chemistry data is presented in Appendix F.
3.7.2 Results
Overall, the ground water quality throughout the GWMA is good. A discussion of the key constituents is presented in the following sections. Water quality results are presented in Table 3-5 and in Appendix G. Sampling locations are shown on Figure 1-2.
Turbidity
Many of the samples were somewhat turbid: eight of the ground water samples collected during the first sampling round, seven samples during the second sampling round, 14 samples during the third, and seven during the fourth exceeded 1 Nephelometric Turbidity Units (NTU). Fine sand and silt may have been responsible for the turbidity. The highest turbidity reported (18 NTU) was for the sample collected from GWMP-1. The other samples averaged about 2 NTU. The open-casing type of completion for most of the domestic wells is a possible explanation for the high turbidities, and incomplete development is the likely reason for the high turbidity in GWMP-1.
Turbidity is not a concern with regard to human health, but is regulated for municipal systems for aesthetic and industrial-use reasons. Turbidity can affect sample analysis results for metals such as iron and manganese, when the water samples are not filtered (as was the case for this study). Acidizing the samples as required for analysis may release iron and manganese present as colloidaVsorbed particulates into the ground water, thus increasing the metal concentrations above the actual dissolved species.
Iron and Manf:;anese
Iron and manganese concentrations appear to correlate moderately well with the turbidity of the samples. This indicates that some of the iron and manganese was derived from particulate matter, and thus may not reflect the true dissolved iron and manganese concentrations. It does appear, however, that somewhat elevated iron and manganese concentrations exist throughout much of the GWMA. In 12 of the 18 wells sampled, iron concentrations exceeded State Secondary standards (0.3 mgiL) during at least one of the four sampling rounds (see Table 3-5). The highest iron concentration was from GWMP-1 • (3.9 mg!L), which is located in the western Boundary Upland area. High iron concentrations are also prevalent in the shallow unconfined aquifer located throughout much of the eastern Custer Trough area. Ten of the 18 wells sampled contained
Golder Associates

I I I I I I I I I I I I I I I I I I I
September 2. 1992 19 903-1060.406
manganese concentrations at or above the State Secondary standard of 0.05 mgll.. The locations of elevated manganese concentrations is similar in most cases with the locations of elevated iron concentrations.
Nitrate and Nitrite
Detectable concentrations of nitrate+nitrite or nitrate were found in eight of the 18 wells sampled (Table 3-5), ranging from 0.2 mw'L (Aller well) to 5.9 mgll. (DeKubber well). The nitrate + nitrite concentrations are assumed to reflect the nitrate concentration, because nitrite {analyzed during the second sampling round) was undetected. The State MCL for nitrate is 10 mw"L. The Dekubber well is a shallow dug well located within the Custer Trough area (Figure 1-2). The high nitrate concentrations in this well probably stem from (l/'-2F It local recharge from fertilized fields and runoff from pastured areas, and septic drain fields. r:' . / rz_
--------- it! " T tk...:::_ Nitrate concentrations of up to 1.9 mgll. were found in wells located in the Boundary Upland area (Boettcher, Colacurcio, Leer, and Aller wells). This raises some concern, because these wells are located in the primary recharge area for the local aquifers. Only one of the samples collected within the Boundary Uplands area (Berg well, depth 237 feet) contained undetectable concentrations of nitrate. Nitrate concentrations of about 1 mgll. have also been found in City wells No. 3 and No. 4, which appear to be installed in the same aquifer as the domestic wells in the Boundary Upland area (hydrostratigraphy is discussed in Section 4.1). Nitrate concentrations in the other City wells (Table 2-1) have been at or below detection limits, except for a Well No. 1 in 1979 (1.5 mw'L). This reported nitrate concentration in Well No. 1, however, appears to be an anomaly, because nitrate has not been detected in more recent samples.
Chloride and Sodium
~~f'l .n elevated chloride concentration (370 mgll.) was identified in the Rodenberger well, located east of the Boundary Upland area along Delta Line Road (Figure 1-2). The State Secondary Standard for chloride is 250 mw'L. This well is screened at a depth of between 231 and 236 feet bgs in fine sand. Some of the wells in the near vicinity, completed at similar depths reportedly produce higher quality water. However, a review of the well logs indicates that saline water has been encountered in other wells in the vicinity of Delta Line Road. Elevated chloride concentrations were not observed in any of the other wells sampled.
leva ted sodium concentrations (370 mw'L) were also identified in the Rodenberger well. Sodium is not currently regulated, but is of concern to people on low-sodium diets. Elevated sodium concentrations (92 mw'L) were also found in the Wilson well. This well is screened at a depth of 227 and 237 feet bgs in sand, and is located as shown in Figure 1-2 along Haynie Road. City Wells No. 2 and No. 1 have sodium concentrations of about 30 mw'L (Table 2-1).
Golder Associates

I I I I I I I I I I I I I I I I I I I
September 2. 1992 2D 903-1060.406
Total Metals
Ground water samples collected from GWMP-1, GWMP-2, and GWMP-3 were analyzed for selected metals during the first sampling round. Trace amounts of zinc were detected in GWMP-1 (0.22 mg!L), and arsenic in GWMP-3 (0.008 mg!L). Analysis of a sample collected from the Deep Well, located at the site of GWMP-3 (Figure 1-2), revealed trace amounts of arsenic (0.007 mg!L) and barium (0.07 mg!L). These concentrations are well below the State MCL's of 0.05 and 1.0 mg!L for arsenic and barium, respectively.
Other Constituents
The Rodenberger well also contains elevated concentrations of sulfate (2DO mg!L), and has 1,000 mg!L of total dissolved solids, which is characteristic of brackish water. The Rodenberger well also exceeds state water quality standards for chloride (discussed above), TDS, and color, iron, turbidity, and coliform bacteria. The well owners do not use the well for drinking or cooking.
The Wilson well water exceeds the State standards for color (100 color units). A yellowish color was noted when the well was sampled, and a distinct odor of hydrogen sulfide. The color and odor are often associated with decaying organic matter, which may impart the undesirable odor and taste. The well owners have installed a filtering system to reduce the taste and odor problem.
Golder Associates

I I I I I I I I I I I I I I I I I I I
September 2, 1992 21 903-1060.406
4. DISCUSSION OF GROUND WATER FLOW SYSTEM
The purpose of this section is to describe the ground water flow system within the GWMA, and to present and discuss ground water recharge based on the presently available data. This section begins with a description of the thickness and extent, and hydraulic characteristics of the sediments within the GWMA. Ground water levels and hydraulic heads within the GWMA are then discussed to provide a foundation for a discussion of the ground water flow characteristics. Ground water flow characteristics discussed include: the directions of flow; recharge/discharge relationships; and aquifer interactions. Section 4 ends with an estimation and discussion of ground water recharge. Section 5 provides an evaluation of the water resources available within the GWMA, based on the understanding of the ground water flow system and the estimate of potential recharge provided in Section 4.
4.1 Hydrogeology
The hydrogeology of the GWMA is complex because of the various geologic processes which have occurred locally. These processes have deposited sediments and reworked or eroded older sediments such that the vertical and lateral extent and character of the sediments differ substantially within the GWMA. In an attempt to understand the hydrogeology of the GWMA, the geologic materials were organized into hydrostratigraphic units which have similar hydraulic characteristics. The convention used for defining the hydrostratigraphic units is presented in Section 4.1.1 below, followed by a discussion of the thickness and extent and the hydraulic characteristics of the units in subsequent sections.
4.1.1 Definition of Hydrostratigraphic Units
The convention for assigning hydrostratigraphic units within the GWMA is similar to the convention used by Halstead7 to describe the hydrogeology of the Fraser Lowlands of British Columbia. The convention has been modified, however, to reflect the greater geological uncertainty in the Blaine GWMA where fewer wells have been drilled. A preliminary hydrostratigraphic convention was devised in the Background Data Report to describe the hydrogeology based on the previously available data. The convention, however, has since been revised slightly after additional data collection and re-evaluation. The updated hydrostratigraphic convention is presented in Table 4-1, which also presents the potential correlation with U.S. and Canadian geologic units. The definitions of the hydrostratigraphic units are as follows:
Hydrostratigraphic Unit C
Hydrostratigraphic Unit C, as described by Halstead, consists mainly of glacio-fluvial sand and gravel deposited by meltwater streams. Where these streams entered the sea, large deltas formed, which upon isostatic rebound, have been elevated above present sea level. Halstead indicates that this unit overlies Unit B (based on his definition), and forms
Golder Associates

I I I I I I I I I I I I I I I I I I I
September 2. 1992 22 903-1060.406
unconfined aquifers capable of yielding large quantities of ground water. The geologic units associated with Unit C, according to Halstead include parts of the Bellingham Drift and the Sumas Drift. Halstead also includes the Esperance Sand within Unit C, which is a glacial outwash sand and gravel deposited during the advance of the Vashon glacier. This unit, however, is believed to occur largely as a confined aquifer within the GWMA, and for the purposes of this study, is classified differently based on its close association with glacial till (see description of Unit D below).
For the purposes of this study, Unit C has been defined as sand or sand and gravel of glacio-fluvial, glacial, or fluvial origin. These sediments tend to be relatively permeable and constitute both unconfined and confined aquifers within the GWMA. For purposes of clarification, the Unit has been subdivided into four subunits (Cl, C2, C3, C4) based on stratigraphic sequence and aquifer type (confined/unconfined). The location and extent of these subunits is presented in a subsequent section.
The sands and gravels of Unit C comprise most of the confined and unconfined aquifers within the GWMA, and are capable of yielding moderate to large quantities of ground water.
Hydrostratigraphic Unit NB
Two separate hydrostratigraphic units (A and B) were recognized by Halstead in southern British Columbia. These units included clay, peat, stony clay and silty clays as well as sandy silts, silty sands with marine shells. The proportion of clay was 10% to 50%; silt, 35% to 75%; and sand, 5% to 60%. These materials are often reported on Canadian drillers logs as "sticky-stony clay". Unit A was differentiated from Unit B on the basis of the abundance of shells. The material is described as mainly glacio-marine in origin, which were deposited following the retreat of the Vashon glacier during the EversonJnterstade.
. ~I "~----Although Everson lnterstade deposits are present within the GWMA, there are insufficient data to differentiate between these units on the basis of shell content. Thus, the two units have been lumped together as Unit NB. The description of this unit has also been further narrowed to include only those clay and silt deposits in which the presence of gravel (or stones) has been noted in order limit the unit to glacio-marine deposits or similar deposits, as opposed to non-glacial marine or fluviaVIacustrine deposits. Unit NB may include glacio-marine and similar materials which were deposited prior to·the Vashon glaciation, in addition to the Everson lnterstade deposits.
Only minor quantities of ground water are available within the more permeable zones occurring within Unit NB, and the unit, as a whole, is regarded as an aquitard with limited ground water potential.
Hydrostratigraphic Unit D
Hydrostratigraphic Unit D, as described by Halstead, includes tills together with sands and gravels deposited by a variety of glacial processes. The tills consist of a heterogeneous
Golder Associates

I I I I I I I I I I I I I I I I I I I
September.2, 1992 23 903-1060.406
mixture of clay, silt, sand, gravel and boulders. Halstead includes the Vashon Drift and older pre-Vashon glacial drifts within this hydrogeologic unit.
For the purposes of this study, the definition of Unit D is similar to that of Halstead's in that it includes glacial till. However, water-bearing glacial outwash sand and gravel which is associated the till is also included within Unit D. Unit D is differentiated from Unit C by its association with sediments which appear to be glacial till, or other closely related glacial deposits. The low permeability till-like materials included within Unit D tend to be relatively thin (5 to 15 feet thick) in comparison to the glacial outwash sediments, which may be capable of supplying moderate quantities of ground water to wells. Thus, Unit D as a whole, is considered here as an aquifer, which appears to be one of the most productive aquifers in the Watershed and southern flank of the Boundary Upland area of the GWMA.
Hydrostratigraphic Unit E
Unit E, based on Halstead's description, is comprised of marine sediments interbedded with estuarine and fluvial deposits consisting of fine sand, silt and clayey silts. Within this Unit, Halstead includes sediments deposited during the Olympic non-glacial interval which occurred during pre-Vashon times. Halstead notes that all wells drilled to depths greater than about 300 feet bgs within the Fraser Lowland of British Columbia have encountered these sediments.
For the purposes of this study, clays and silty clays of glacio-marine origin may be included along with the fine sand, silt, and clayey silt, of non-glacial origin. ·Ground water supply potential from this unit is low, and water quality is often poor, as noted by Halstead, being a sodium chloride type with dissolved solids in excess of 500 mg!L.
Hydrostratigraphic Unit F
Halstead characterized Unit F as consisting of consolidated bedrock. This characterization will remain unchanged for the purposes of this study. Very few boreholes (with the exception of gas and/or coal exploration boreholes) have been drilled to bedrock in the GWMA or surrounding area. The potential yield from the bedrock is expected to be low. In addition, water quality could be poor due to the long residence time of the ground water within the subsurface.
4.1.2 Location and Thickness of Hydrostratigraphic Units
The hydrostratigraphy of the GWMA, as defined in the previous section, is illustrated in cross sections presented in Figures 4-1 to 4-4 (see Figure 1-2 for locations of cross sections), and discussed below, beginning in the Boundary Upland region and proceeding to the south within the Custer Trough region.
Unit C1, which consists primarily of permeable sand and gravel, occurs at elevations above about 100 feet msl, and is exposed along the flanks of the Boundary Upland. Gravel pits
Golder Associates

I I I I I I I I I I I I I I I I I I I
September 2. 1992 24 903-1060.406
located on the Boundary Upland area or along the flanks of the Boundary Upland area have been developed within Unit Cl. Most of the deeper domestic wells within the Boundary Upland area are believed to tap Unit C1, along with City Wells No. 3 and No. 4. Unit NB, which consists ofstony clay, may occur interbedded with Unit C1 at elevations above about 300 feet msl to ground surface, as illustrated in cross section C-C' (Figure 4-3). Unit NB materials may be responsible for the small perched zones present in this area.
Underlying Unit C1 in the Boundary Upland area are Units NB (stony clays) and E (clay, silt, and silty clay). At elevations of between about 100 and -50 feet msl, a zone of permeable sand or sand and gravel is present, which has been designated Unit C3. Unit C3 occurs at thicknesses of up to 100 feet, but thins laterally and is absent in places (Figure 4-1). Within the Watershed area, Unit C3 may be present as two layers, which correspond with Aquifers I and II, as designated by Shannon and Wilson10. Unit C3 may not be present east of GWMP-2, and has not been identified elsewhere in the GWMA. Test wells GWMP-1, GWMP-2, and GWMP-3 are believed to be completed within Unit C3, and City Wells No. 2, 5, 6, and 7 appear to have encountered it, based on the drillers logs. City Well No. 1 is believed to be tapping one of the two Unit C3 aquifers at a depth of 172 to 180 feet bgs, based on geophysical logs and TV inspection of the well.
Underlying Unit C3 in the Boundary Upland area is a layer of UnitE sediments 25 feet thick or more. Below Unit E are Unit D glacial sediments, which occur to the west of City Well No. 2, but do not appear to be present east of Well No. 2. Unit Dis 10 to 50 feet thick in the southern Boundary Upland area (Figure 4-1), and occurs at elevations of about -100 feet msl at the 12th St Well, to 25 feet msl at Well No. 2. The Deep Well installed at the Boblett Road site may be installed within this Unit. In addition, most of the City wells, including 12th St, Lincoln Park, No. 6, and No.7, are believed to be installed within this unit. Unit D corresponds with Shannon and Wilson's Aquifer III, and is probably the most productive aquifer thus far identified in the GWMA.
Underlying Unit Dis a sequence of UnitE sediments, which are 100 feet thick or more. The full thickness and extent of this layer of Unit E is uncertain because few wells have been drilled to this depth. Deep wells drilled within the Blaine Watershed, including City Wells No. 1 and No.2, and test wells designated TH-1 and No. 20, however, have encountered possible glacial till and outwash (Unit D), below the UnitE sediments. For example, glacial sediments were encountered at elevations between about -300 to -325 feet msl in TH-1, and at between -200 to -325 feet msl in Wells No. 2 and No. 20. These sediments, although more permeable than the overlying Unit E sediments are not capable of yielding sufficient quantities of ground water for municipal use.
Underlying the second layer of Unit D sediments within the Watershed, Unit NB sediments are present to an elevation of about -450 feet msl where Wells No. 1 and No. 2 encountered a permeable fine sand, designated Unit C4. Well No. 2 has reportedly produced up to 325 gpm of water from Unit C4 and is presently completed to produce 200 gpm from Unit C4. Additional permeable sand and gravel was apparently encountered in· Well No. 1 at an elevation of between -520 to -560 feet msl. The potential yield from the Unit C4 sediments is unknown.
Golder Associates

I I I I I I I I I I I I I I I I I I I
September 2, 1992 25 903-1060.406
In the Custer Trough area to the south and southeast of the Boundary Upland, the hydrostratigraphy is less well defined due to the lack of deep wells in the area. Figures 4-2 and 4-4 illustrate the hydrostratigraphy of the area. A thin veneer (about 30 feet thick) of Sumas outwash and recent alluvium (Unit C2) overlies most of the lowland area. Underlying Unit C2 sediments are Unit E sediments, which are 25 feet thick or more. Unit NB underlies UnitE at weii40N01E-11L (Wilson Well) and at weii40N01E-11Q (coal exploration borehole). The thickness of Unit NB varies from about 75 feet at 40N01E-11L to about 200 feet at weii40N01E-11Q. At well40N01E-11L Unit NB sediments are underlain by Unit E sediments. The well appears to be completed within a thin more permeable layer of fine sand within Unit E. Weii40N01E-11Q reportedly encountered about 175 feet of sand and gravel, which may be glacial in origin, based on the drillers log. According to the driller, Hayes Drilling of Bow, Washington, (personal communication, Aprir'1992}, these sediments appeared to be very permeable. Underlying these Unit D sediments is Unit F (bedrock), which was encountered at an elevation of about -375 feet msl.
4.1.3 Hydraulic Characteristics and Water Quality
Previous hydrogeologic studies within the GWMA have been limited to the Blaine Watershed. As part of this study, three test wells were installed outside of the Watershed to further understand the hydrogeology of the GWMA. The current understanding of the hydraulic characteristics and water quality of each hydrostratigraphic unit identified within the GWMA is presented in the following sections, and summarized in Table 4-2.
Unit Cl
Unit Cl is an unconfined to semi-unconfined aquifer consisting of sand and sand and gravel, located at elevations of above 100 feet msl in the Boundary Upland area. The lateral extent of Unit Cl is not well defined, and the thickness and hydraulic characteristics may vary throughout the Boundary Upland area. Unit C1 has been tapped by most of the domestic wells drilled in the Boundary Upland area. A few shallow wells appear to tap small perched zones (Leer well, for example), which may be caused by the presence of Ill) I( r 1)_ lenses of low-permeability Unit NB sediments. Unit C1 is also believed to be tapped by fi!Rl( (/)c../1' City Wells No. 3 and No.4, which have been completed at relatively shallow depths of 65 f and 98 feet bgs, respectively, within the Blaine Watershed. City Wells No.3 and No. 4 yield relatively high quantities of water (310 and 325 gpm, respectively, based on tests conducted by the City). Hydraulic characteristics of the C1 Unit have not be determined.
The quality of the ground water within Unit C1 for the most part appears to be good, based on samples collected from the domestic wells in the Boundary Upland area (Colacurcio, Berg, Boettcher, and Aller) and from City Wells No. 3 and No.4. Nitrate+nitrite concentrations of up to 2 mgiL, however, have been detected in some of the wells (Boettcher, Leer, Colacurcio, Aller, and City Wells No. 3 and No.4) (as discussed in Section 3.7}, which raises concern regarding future land use activities in the Boundary Upland area and their potential effect on water quality for the City Wells within the Watershed. Further discussion of land-use activities and potential grou.nd-water quality
Golder Associates

I I I I I I I I I I I I I I I I I I I
September 2, 1992 903-1060.406
impacts is presented in Section 5. The piper diagram shown in Figure 4-5 shows that the ground water from Unit C1 is a calcium bicarbonate type of water.
Unit C2
Unit C2 is primarily a thin (generally less than 30 feet thick) unconfined aquifer consisting of silt, sand, and sand and gravel, which occurs throughout most of the Custer Trough area. This unit has been tapped by a number of shallow wells, most of which are dug wells. Static water levels typically range from near ground level to 8 feet bgs, and the aquifer may be in direct hydraulic communication with Dakota Creek and its tributaries. Transmissivity and storativity ofthe unit have not been determined. Water quality samples collected from two shallow wells indicate that, at least on a localized basis, relatively high nitrate-nitrite concentrations (up to 5.9 mg!L) are present with the Custer Lowland area. In addition, elevated iron concentrations (1.5 mg!L in Nymeyer well) may exist. Many of the residences with shallow wells have installed filtration systems to remove the iron. The water contains a relatively low concentration of dissolved solids, indicative of local recharge.
The piper diagram shown on Figure.4-5 illustrates that the water sampled from shallow wells.within the Custer Trough area has a similar major ion chemistry as the water within shallow perched zones within the Boundary Upland (discussed below). These shallow waters differ from other waters within the GWMA, because they have been recently recharged locally and have had relatively short residence times within subsurface sediments.
Unit AlB Unit AlB consists of stony clay and silt, and has a relatively low permeability. A few thin more permeable zones are present within the unit which may be capable of yielding small quantities of water for domestic use. In the Boundary Upland area, for example, a few shallow wells have been developed within small perched zones resting on Unit AlB sediments. The ground water within these shallow perched zones contain relatively low concentrations of dissolved solids, indicative of local recharge and relatively short residence times within the subsurface. Thin more permeable zones within Unit AlB found at greater depth, may also be capable of yielding small quantities of water for domestic use. However, the quality of these waters may be less suited for drinking water purposes, due to longer residence times and therefore, higher concentrations of dissolved solids. Some of these small isolated permeable zones contain brackish water, which was present within the pore spaces of the sediments when they were deposited. For example, the Rodenberger well, which appears to be completed within a thin permeable zone within Unit A/B, contains high sodium and chloride concentrations (as discussed in Section 3.7). The piper diagram (Figure 4-5) illustrates that the Rodenberger well water, is classified as a sodium chloride type of water, and differs in composition substantially from the other ground waters sampled within the GWMA.
Unit C3
Unit C3 is a confined to semi-confined aquifer consisting of sand and sand and gravel, and has been encountered by many of the wells drilled in the Blaine Watershed area, and along
Golder Associates

I I I I I I I I I I I I I I I I I I I
September 2, 1992 27 903-1060.406
the southern flank of the Boundary Upland. At the site of GWMP-2, the unit occurs as an unconfined aquifer. This unit is believed to correspond with the aquifers within the Watershed designated Aquifers I and II by Shannon and Wilson10• City Well No .. 1 is believed to tap Unit C3 (in addition to Unit C4}, and test wells GWMP-1, GWMP-2, and GWMP-3 may be installed within Unit C3. The thickness and lateral character of the unit varies considerably. The thickness of the unit· appears to vary from 10 feet to over 100 feet, and based on the interpretation of the presence of low-permeability boundaries from the pump tests of GWMP-2 and GWMP-3, the unit may pinch out in places. Pump tests of GWMP-1, GWMP-2 and GWMP-3 indicate that the aquifer transmissivity varies from 60 to 14,000 ttl/d. The storativity of Unit C3 is estimated to vary from about 2 x 10⁻⁴ to 0.01, depending on the confined or unconfined nature of the aquifer.
The water quality of Unit C3 is in general good and nitrate concentrations are generally below detection limits. The water is classified as a calcium bicarbonate type of water. The piper diagram presented in Figure 4-5 illustrates that the major ion chemistry of the water from Unit C3 is similar to that of Unit C1, which suggests similar geochemical histories.
Unit C4
Unit C4 has been encountered in the Blaine Watershed by Wells No. 1 and No. 2, and test wells TH-1 and No. 20. This unit reportedly consists of fine sand, which occurs at thicknesses of up to 15 feet. This unit occurs at an elevation of about -450 to -560 feet msl, and may consist of more than one layer separated vertically by silt and clay. The lateral extent of the unit may be limited, as indicated by its apparent thinning at TH-1 and No. 20. Wells of sufficient depth, however, have not been drilled outside of the Watershed to determine its lateral extent on a larger scale. The hydraulic characteristics of Unit C4 were determined by pump testing Well No.2. The aquifer transmissivity and storativity were estimated at 700 ttl/d and 2x10⁻⁴, respectively. City Wells Nos. 1 and 2 have reportedly produced up to 800 gpm from Unit C4 in the past.
The ground water from this unit appears to be higher in total dissolved solids (IDS of about 360 mg/L) (Table 2-1) in comparison to groundwater from Units D and C1 and C3, which reflect its greater depth and corresponding greater residence time in the subsurface. In addition, this water has a higher sodium concentration (about 35 mg/L} and chloride concentration (30 to 40 mg/L) in comparison to the shallower aquifers in the area. The chemistry of this water (a sodium bicarbonate type) differs substantially from that of the waters from the other units near the Boundary Upland area (Unit C1, C3, and D), suggesting a more distant recharge source, and different flow system.
Unit D
Unit D consists of relatively low-permeability glacial till and permeable water-bearing sand and gravel, which typically underlie the till. The sand and gravel constitute a confined aquifer, which corresponds with Aquifer III, as designated by Shannon and Wilson. This unit was encounter~d within the western half of the Blaine Watershed in City Wells No. 5, No. 6, and No. 7 and in ·the Deep Well at the Bob lett Street site, and the Lincoln Park and 12th St. Wells (Figure 1-2). The Unit may also have been encountered in the eastern
Golder Associates

I I I I I I I I I I I I I I I I I I I
September 2, 1992 28 903-1060.406
Watershed area by Wells No. 1 and No.2, but permeable materials were not associated with it at this location. Unit D occurs at thicknesses ranging from 10 to 50 feet. The lateral character appears to be more consistent than Unit C3. However, Unit D may pinch out in places. Based on pump tests conducted by Shannon and Wilson from test wells TW-2 and TW-3 (now Wells No. 5 and No.6) within the Watershed, and from a pump test conducted by Golder Associates at the Boblett Road site (Deep Well), Unit D has a transmissivity ranging from 330 to 2,400 Wo/d. Storativity has not been determined, but is expected to be typical of confined to semi-confined aquifers (1 x 10⁻³ to 2 x 10⁴ ).
A second deeper possible glacial till and outwash sequence has been tentatively identified from the logs of TH-1, No. 20, and No. 1, and No.2, at an elevation of between -200 to -325 feet msl. The thickness of the permeable sand and gravel, however, appears to be generally less than about 10 feet. This unit according the Shannon and Wilson is not very productive, due to the fine-grained nature of the materials.
Unit D may also be present elsewhere within the ·GWMA, as suggested by the log of well 40N01E-11Q, which was drilled for coal exploration purposes (Figure 1-2). The log of this well suggests that possibly two glacial till and outwash sequences with a total thickness of about 175 feet occurs at an elevation of about -200 to -375 feet msl at this locality. According to the log and personal communication with the driller, this zone appears to be potentially very productive. Unit D sediments appears to be present at other localities throughout the GWMA. However, few wells have been drilled in the area to delineate its character and extent.
The quality of ground water from Unit D within the Watershed and southern Boundary Upland area is good, with the possible exception of manganese, which is near the State Secondary Standard of 0.05 mg/L. Nitrate concentrations are generally less than detection limits. The water within Unit D is classified as a calcium bicarbonate type of water. The Piper diagram in Figure 4-5 indicates that the major ion chemistry is very similar to that of Units Cl and C3, which suggests the water in each unit has experienced similar geochemical histories.
UnitE
Unit E sediments consist of mainly fine grained silt and clay, and thus are not capable of yielding large amounts of ground water. A few thin permeable zones may be capable of yielding quantities sufficient for domestic use, for example the Wilson well. However, the water quality is likely poor due to the long residence time within the subsurface as a result of the relatively impermeable sediments surrounding the isolated permeable zones. The water of the Wilson well, for example, is classified as a sodium bicarbonate type of water, and is considerably different from other waters sampled within the GWMA, as illustrated in Figure 4-5.
Unit F
Little is known of the hydraulic characteristics of the bedrock (Unit F) which underlies the GWMA. However, the permeability of the consolidated sediments is likely relatively low in
Golder Associates

I I I I I I I I I I I I I I I I I I I
September 2. 1992 29 903-1060.406
comparison to the permeability of other sand and gravel aquifers within the GWMA. In addition, the water quality' Within Unit F is probably poor due to the long residence time
· below the subsurface. The potential for developing Unit F as a potable water supply is believed to be low.
4.1.4 Ground Water Levels
Figure 4-6 presents a map depicting a generalization of the water-table elevations within the GWMA, based on the available water-level data. The water-level data were collected from wells installed within various unconfined and confined aquifers within the GWMA (data presented in Appendix D). As a result, the figure is not a map of water table elevations within the unconfined sediments or a map of a specific potentiometric surface (a potentiometric map represents the hydraulic head distribution within a single confined aquifer). Rather, the map depicts the general ground water elevations throughout the GWMA for purposes of defining the general directions of ground water movement.
Water-level data within the Boundary Upland area were taken from wells completed within permeable material generally at a depth of between 150 and 250 feet bgs (Unit C1). These permeable sediments in places may be unconfined. However, throughout much of the Boundary Upland area, Unit C1 appears to be confined to semi-confined, and thus, the water levels from wells at these locations represent the JK''entiometric ground water elevation. Water levels in the Boundary Upland area ~ery~from over 250 feet msl in the central Upland area to 200 feet msl or lower along the !Mrg s of the Boundary Upland area, as shown in Figure 4-6. · C... ;'\
d.)" Most of the deep wells drilled along the flanks of the Boundary upland area are completed in Units C3 or D. Thus, the water levels measured in these wells do not represent the same potentiometric surface as depicted in Figure 4-6 for the Boundary Upland area where Unit C1 is the primary aquifer. The water levels measured from the wells flanking the Boundary Upland are between about 120 and 55 feet msl. In the vicinity of the Watershed, the water levels appear to be lower (55 to 80 feet msl) than the water levels in the adjacent areas, as expected due to pumping of the City wells within the Watershed. Actual static water levels in Units C3 and D within the Watershed area are difficult to determine, as a result of the pumping of the City wells. At the site of GWMP-3, the static water level in Unit C3 is about 85 feet msl (measured at 90 feet bgs in December, 1991, and assuming a ground elevation of 175 feet msl). The water level in Unit D (measured in the Deep Well) at the same site, is about 1 to 2 feet lower (about 83 feet msl). This indicates that the potentiometric surface of Unit D is lower than the potentiometric surface of Unit C3 at this site. The implications with regard to ground water flow between hydrostratigraphic units will be discussed in the following section.
The hydraulic head of Unit C4 within the Watershed is approximately 60 feet msl, based on measurements taken from Well No. 2 in February, 1992. Near Well No. 1, which is located about 250 feet south of Well No. 2 (Figure 1-2B), Unit C4 appears to have a greater hydraulic head than Unit C3, based on upward fluid flow measured in Well No. 1 from
Golder Associates

I I I I I I I I I I I I I I I I I I I
September 2, 1992 30 903-1060.406
Unit C4 to Unit C3 during the geophysical investigation. The magnitude of the difference between the hydraulic heads, however, is presently uncertain.
Within the Custer Trough area, the water table is generally between 40 and 80 feet msl, and is from 0 to 8 feet below ground surface (based on water level data collected from two shallow wells, the DeKubber and Nymeyer wells). Many of the wells installed within deeper confined aquifers to the west of Haynie Road are reportedly flowing wells, indicating that the potentiometric surface of the deep confined aquifers is above ground surface in this area. Water-level data from wells within deep confined aquifers to the east of Haynie Road is limited, and the potentiometric surface elevations are uncertain in this area. However, one water-level measurement taken from 40N01E-11Q during its construction, indicated that the hydraulic head was about 15 feet bgs or about 75 feet msl.
4.1.5 Flow Directions, Recharge/Discharge Areas, and Aquifer Interactions
This section contains a general discussion of the various features of the ground water flow system within the GWMA, based on the preceding discussions of the water levels occurring within the GWMA, and the characteristics of the hydrostratigraphic units. This section includes a discussion of the general recharge and discharge locations within the GWMA, the directions of ground water flow, aquifer interactions, and possible ground water movement into and out of the GWMA. As more data becomes available, the understanding of the ground water system within the GWMA will undoubtedly improve,
·and the interpretation presented here should be modified accordingly. A schematic of the conceptual model of the ground water flow system is presented in Figure 4-7, and discussed below.
In general, ground water levels are highest in the Boundary Upland area and lowest in the Custer Trough area. The Boundary Upland, therefore, appears to be the primary ground water recharge area within the GWMA, because ground water flows from areas of high hydraulic head to areas of lower hydraulic head. A portion of the precipitation falling on the Boundary Upland area seeps into the underlying soil and percolates downward to recharge Unit C1. Once the ground water reaches Unit C1, some moves radially out from the central Upland region to discharge as springs along the margins of the Upland area. The springs, in turn, feed tributaries to Dakota Creek south of the international border and Cambell River north of the border. A shallow ground water divide probably exists near the topographic divide, which occurs near the international border as shown in Figure 1-1.
Unit C3, which exists below Unit C1, separated by low-permeability sediments of Units NB or Unit E, is recharged by downward movement of ground water from Unit C1 through the lower-permeability materials. Continued downward movement of ground water from Unit C3 through less-permeable materials, in turn, may be providing recharge to Unit D. The lower hydraulic head in Unit Din comparison to the hydraulic head in Unit C3 at the site of GWMP-3 (Figure 1-2), as discussed in the previous section, is consistent with downward flow from Unit C3 to Unit D. In addition, the major ion chemistry of the ground water from Units C1, C3, and D is similar (Figure 4-5), suggesting that the ground water in each unit has a similar geochemical history and may have came from the same
Golder Associates

I I I I I I I I I I I I I I I I I I I
September 2, 1992 31 903-1060.406
recharge area. Its possible, however, that Units C3 and D may be receiving a small component of recharge from ground water flowing laterally from recharge areas located outside of the GWMA. This possibility is discussed further in Section 4.2 and 5.
Some of the precipitation falling within the Boundary Upland area may eventually be recharging Unit C4 via downward ground water movement below the Boundary Upland area. However, Unit C4 may also receive significant recharge from more distant highland areas outside of the GWMA. The major ion chemistry of the ground water from Unit C4 differs substantially from the ground water chemistry of the other units (Cl, C3, and D), as discussed earlier, suggesting a different recharge area for Unit C4 ground water. Furthermore, ground water is flowing upward in Well No. 1 from Unit C4 to Unit C3, indicating an upward directed component of the hydraulic gradient. This is inconsistent with the Boundary Upland area being the source of recharge for Unit C4, as downward movement of ground water from shallower aquifers to deeper aquifers is expected near the recharge area.
To the south of the Boundary Upland, some of the ground water from Units D and/or Unit C2 may be flowing upward toward the ground surface in the lowland areas where it may be discharging to the shallow unconfined aquifer (Unit C2), as evidenced by the presence of deep flowing wells (Wilson well and 12th St Well, and others). In the eastern lowland area, downward seepage from the shallow unconfined aquifer may be providing some recharge to deeper aquifers in the area. However, few deep wells have been drilled in the area, and accurate water-level data are not available to confirm this possibility.
The horizontal direction of groundwater flow within the deeper confined aquifers (Unit C3, D, and C4) is uncertain due to the lack of deep wells in the Custer Trough areas, but is likely directed toward the south and west toward Drayton Harbor where it may eventually discharge. Some of the ground water from the Units (assuming their presence in the lowland area) may also flow southward outside of the GWMA boundaries and beneath the surface topographic divide between Dakota Creek and California Creek.
Within the shallow unconfined aquifer (Unit C2) located in the Custer Trough areas, water levels appear to be from about 8 feet bgs to near ground surface. Groundwater within the shallow aquifer probably flows from higher topography to lower topography, and flows primarily to the west, parallel to Dakota Creek and its tributaries. Unit C2 receives most of its recharge from direct precipitation. Ground water discharge from Unit C2 provides the base flow to Dakota Creek. The shallow water table conditions in the vicinity of Dakota Creek suggest that there may be considerable hydraulic communication between the shallow aquifer and Dakota Creek and its tributaries.
4.2 Ground-Water Recharge
A first step in evaluating the potential ground-water resources of an area is to develop an estimate of recharge to the ground-water system, a portion of which is available for withdrawal for human consumption. By evaluating the estimated recharge, a rough
Golder Associates

I I I I I I I I I I I I I I I I I I I
September 2. 1992 32 903-1060.406
estimate of the potential ground-water resources can be developed. Estimates of groundwater recharge, however, usually have a fair degree of uncertainty due to limited climatic, hydrologic, and soil characteristics data. In addition, ground-water recharge depends, in part, on the amount of ground-water withdrawal and aquifer characteristics, which can only be adequately addressed through the use of a numerical model of the ground-water flow system. Thus, the estimate of ground-water recharge presented in this section is for use in developing only a preliminary estimate of the quantity of ground water available for withdrawal. A discussion of the ground-water resources that may be available within the GWMA for withdrawal is presented in Section 5. As will be discussed in Section 5, the acceptable quantity of ground-water withdrawal ultimately depends on the social, economic, and ecological costs that are deemed acceptable by the community and associated governing bodies. Estimation of the acceptable withdrawal of ground water on this basis is beyond the scope of this study.
Recharge of the ground water system within the GWMA occurs primarily from precipitation falling within the GWMA, and also from lateral flow from outside of the GWMA, as discussed above. Precipitation falling within the Custer Trough area provides recharge to the underlying shallow unconfined aquifer (Unit C2), and precipitation falling within the Boundary Upland area provides recharge to Units C1, C3, D, and possibly C4. An estimate of recharge occurring within the Custer Trough area is discussed in the Section 4.2.1 below. The subsequent section (4.2.2) discusses recharge occurring in the Boundary Upland area, and Section 4.2.3 discusses recharge occurring by lateral flow from recharge areas outside of the GWMA.
4.2.1 Upper Dakota Creek Catchment
A subjective optimization procedure24 was used to estimate recharge occurring within the Upper Dakota Creek catchment. The method is based on the hydrologic water balance; a simplified diagram of which is shown in Figure 4-8. Water balancing methods are based on accounting for all the inputs and outputs of water associated with the hydrologic cycle. The major components of the hydrologic cycle are precipitation, evapotranspiration, surface runoff, changes in soil moisture and ground water storage, and ground water runoff. A detailed schematic of the optimization procedure is presented in Appendix H. To estimate recharge, a number of coefficients associated with surface runoff, infiltration, and ground water runoff (defined as ground water flow, or base flow to the creek) are adjusted until the calculated total daily runoff matches the measured daily runoff of Dakota Creek.
This method was used to match the runoff measured from Dakota Creek between May 1989 and June 1990. The measured discharge could not be matched perfectly. Thus, two curves were generated with different coefficients, to determine the likely range of ground water recharge. These curves are shown in Figures H-2 and H-3, along with the breakdown of the components of the water balance in each case. The effective ground water
" McCuen, R.H., and W.M. Snyder, Hydrologic Modeling: Statistical Methods and Applications, Prentice-Hall Englewood Cliffs, N] 07632. p308-351.
Golder Associates

I I I I I I I I I I I I I I I I I I I
September 2. 1992 33 903-1060.406
recharge based on this analysis is between 5 and 9 inches, or 10 and 20 percent of the total precipitation. The matches between calculated runoff and observed runoff are reasonably good for the winter months, but not as good for the summer months. Additional attempts to match the runoffs by adjusting the proportions of surface runoff, infiltration, and ground water runoff resulted in poorer matches. The same curve-matching procedure was used to estimate ground water recharge between November 1990 and November 1991 with similar results (see Figures H-4 and H-5). ·
Sandal13 used a somewhat different water-balance method and estimated ground water recharge to be about 30 percent of total precipitation for the upper Dakota Creek catchment between May 1989 and June 1990. His approach involved the use of published characteristics of the soils and vegetation to provide estimates of surface runoff and evapotranspiration. The estimated recharge was the residual of the total evapotranspiration and surface runoff, which was taken as the equivalent to ground water runoff. Sandal calculated an additional water balance for 1952 and 1953 with similar results, based on published climatic data, and Dakota Creek stream flow data collected by the USGS. Sandal's calculated discharge matched reasonably well with the measureq discharge from Dakota Creek during both periods, except for the months of January and February when measured discharge was greater than the calculated discharge. This difference is likely due to the high water table conditions that existed during these months, resulting in additional surface runoff.
Sandal's approach appeared to better estimate the recharge occurring during the summer months, in comparison to the estimate calculated using the optimization procedure. The optimization procedure appeared to produce a better estimate of recharge during the winter months. This suggests that a lower percentage of winter precipitation provides recharge to the aquifer, because the water table is higher (near ground surface) and much of the precipitation is discharged directly as overland flow. Most of the recharge to the unconfined aquifer, thus, probably occurs in the late fall and early winter months before the water table reaches its highest level. The total recharge is probably greater than 10 percent of the total precipitation, but less than 30 percent. Based on these analysis, the total ground water recharge to the shallow unconfined aquifer in the Upper Dakota Creek catchment is estimated to be between 15 and 25 percent of the total precipitation. Based on the average precipitation of 40 inches per year, this equates to 200 gpm to 330 gpm of average yearly recharge per square mile.
Most of the recharge occurring within the Custer Trough area provides base flow to Dakota Creek and also provides ground water to domestic wells and some irrigation wells. However, some of the ground water recharge occurring in the upper Dakota Creek catchment may provide recharge to underlying confined aquifers through downward vertical leakage. If significant downward leakage were occurring, however, the water balance calculations would show a net loss that could not be accounted for otherwise. However, no net loss was calculated from the water balances, and thus, downward vertical leakage appears to be limited. This conclusion is considered to be reasonable, since lowpermeability clay (UnitE or NB) appears to underlie the shallow unconfined aquifer (Unit C2) throughout the Custer Trough area.
Golder Associates

I I I I I I I I I I I I I I I I I I I
September 2. 1992 34 903-1060.406
4.2.2 Boundary Upland
A soil-moisture budgeting method was used to estimate ground-water recharge occurring within the Boundary Upland area, because runoff from the Boundary Upland area as a whole, could not be measured directly. The soil-moisture budgeting method estimates ground-water recharge as the residual of the input (precipitation) and the outputs (evapotranspiration, runoff, and the change in soil moisture) of the hydrologic cycle, as illustrated in Figure 4-8. The method assumes that the potential evapotranspiration and the soil-moisture deficit must be satisfied before general-water recharge can occur.
As discussed in Section 3.3, potential evapotranspiratioi:l was calculated using the Thornwaite method, which is based on the average monthly temperature and a correction factor. The correction factor is a function of the time of year and the latitude of the site.
Because runoff estimates from the Boundary Upland were uncertain, a second method based on seasonal water-level fluctuations was used to estimate recharge in the Boundary Upland area for comparison. In addition, a qualitative approach based on the permeability of soils and depth of the water table throughout the GWMA, was used to evaluate the relative potential for recharge throughout the GWMA. These results are discussed in Section 4.2.2.3 below.
4.2.1.1 Soil Moisture Budget Method
An estimate of recharge to the Boundary Upland area using the soil-moisture budgeting method was obtained based on the following:
• Precipitation data collected within the Boundary Upland area, or the estimated precipitation (see Table 3-1);
• Monthly potential evapotranspiration (calculated based on temperature data collected from the Blaine station);
• An estimate of the soil-moisture capacity (assumed to be 6 inches), based on soil characteristics provided by SCS; and
• An estimate of surface runoff of between 10 and 25 percent of the total precipitation. Runoff from the Boundary Upland area based on the runoff measured at the Watershed stream was estimated at 5 percent. However, due to frequent overflow of the City reservoir into the drainage and limited measurement during the winter months this estimate may be incorrect. Thus, the more conservative range of runoff of between 10 and 25 percent was selected to estimate recharge.
Between June 1990 and May 1991 a recharge of 20 to 26 inches was estim.ated using the soil-moisture budgeting method, assuming runoff of 25 and 10 percent, respectively. This recharge is equivalent to 38 to 50 percent of the total precipitation occurring within the
Golder Associates

I I I I I I I I I I I I I I I I I I I
September 2, 1992 35 903-1060.406
Boundary Upland during this time. The results of this analysis are presented in Table H-1 and H-2.
4.2.2.2 Water-Level Fluctuation Method
This method can be described by the following equation:
R = V'S + QrfA + Q,jA, for a specified time VT
where R is groundwater recharge per square foot of. aquifer; V'S is the volume of water per square foot of aquifer stored between the highest and lowest water levels within the aquifer during time VT; QP is the volume of water removed from the aquifer by pumping during time VT; Qd is the volume of water discharged to springs, plus natural discharge and vertical leakage to other aquifers during time VT; and A is the area of the aquifer within the capture area of the City wells.
This method assumes that all the recharge occurring between June 1990 and May 1991 occurred between October 1990 and May 1991, thus VT is 8 months. V'S is estimated at between 0.4 and 0.6 cubic feet of water per square foot of aquifer, based on the average water-level change in the Boundary Upland area of about 2 to 3 feet (as illustrated by the hydrographs of the Boettcher, Berg, and Colacurcio wells, Appendix D), and assuming that the effective porosity of the saturated sediments is 0.2. QP was 28 million cubic feet, based on an average pumping rate of 600 gpm occurring during time VT (see the estimated withdrawals in Appendix E). Qd is difficult to estimate, and thus will not be incorporated into the calculation of recharge. By not accounting for Qd, the recharge will be under-estimated. Thus, the calculated recharge is conservative, and may be representative of the lower bound of possible recharge occurring within the Boundary Upland.
Assuming that the recharge area supplying water to City wells is three square miles, the volume of water removed per square foot of aquifer by pumping would be 0.33 cubic feet. Thus, recharge (R) would be 0.73 to 0.93 cubic feet per foot of aquifer, which equates to 9 to 11 inches of recharge. Assuming that the recharge area for the City wells is five square . miles, the volume of water removed per square foot of aquifer by pumping would be 0.20 cubic feet. Thus, recharge (R) would be 0.6 to 0.8 cubic feet per foot of aquifer, which equates to 7 to 10 inches of recharge. Thus, based on this calculation, the recharge is estimated to have been between 7 and 10 inches.
4.2.2.3 Discussion of Rechan~e Potential
The estimated recharge using the water-level fluctuation method of about 10 inches is about half the estimated recharge based on the soil-moisture budgeting method (20 to 26 inches). The difference between the two estimates could be a result of errors in the soil moisture budgeting method, such as errors in the estimation of runoff. Possible errors associated with the water-level fluctuation method include: 1) no accounting for spring
Golder Associates
I I I I I I I I I I I I I I I I I I I
September 2, 1992 36 903-1060.406
discharge and natural ground-water discharge, which is not captured by wells from the Boundary Upland area; 2) errors in the assumed porosity of the saturated sediments; and 3) errors in the annual change in ground-water levels.
The amount of ground-water recharge which occurred in the Boundary Upland area in 1989 and 1990 was probably greater than the average recharge, because precipitation in 1989 and 1990 was about 5 and 10 inches above normal (see Table 3-1). Thus, the estimated recharge presented above is likely somewhat greater than normal since it includes the recharge occurring between June and December 1990. Precipitation occurring from January 1991 through December 1991, however, appears to be somewhat below normal by about 3 inches due mostly to a dryer than normal fall.
The recharge occurring in the Boundary Upland was, thus, calculated using the soil-moisture budgeting method based on the normal precipitation occurring within the Boundary Upland (44 inches) and the normal temperatures, as measured at the Blaine station to provide a better estimate of the average ground-water recharge. The average recharge based on these data was estimated at between 14 and 19 inches per year. The average yearly ground water-level fluctuation is unknown, thus, the average recharge based on water-level fluctuation could not be calculated. However, assuming a similar response as that which occurred between June 1990 and May 1991, the recharge estimated by this method may be about half, or 7 to 9 inches. Thus, based on these calculations recharge occurring within the Boundary Upland could be between 7 and 20 inches per year on the average (16 to 45 percent of the total precipitation), which translates to 230 to '660 gpm per square mile of recharge area per year.
To further investigate the recharge potential within the Boundary Upland area, a qualitative approach based on soil permeability and depth to the water table was undertaken in order to compare the recharge potential of the Boundary Upland with that of the Upper Dakota Creek catchment and the rest of the GWMA.
The recharge potential throughout the GWMA was divided into three categories, high, moderate, and low, based as follows:
High - Includes soils having high permeabilities, classified by the SCS as Hydrologic Group A, and where ground water levels remain greater than 6 feet bgs throughout the year.
Moderate - Includes soils having moderate to high permeabilities, classified as Hydrologic Group B, where the depth to ground water remains below 3 feet throughout most of the year.
Low - Includes soils which are not classified as high or moderate, and which are lower permeability soils.·
Soil permeability is the most important factor, among many, influencing ground-water recharge. The depth to the water table was chosen as a second criteria, because shallow water table depths within the Custer Lowland appear to reduce ground-water recharge, as discussed in Section 4.2.1 above.
Golder Associates

I I I I I I I I I I I I I I I I I I I
September 2, 1992 37 903-1060.406
Figure 4-9 illustrates the ground water recharge potential throughout the GWMA, based on this classification. Throughout much of the Boundary Upland area, the recharge potential is high or moderate. Soils are typically very permeable and well drained, although low permeability soils are present in isolated areas within the Boundary Upland, and along the eastern and southern flanks. The area with the highest potential recharge occurs in a Ushaped band near the central Boundary Upland area, comprising an area of approximately 2.5 square miles. The moderate recharge potential soils are located along the western portion of the Boundary Upland and in the central-most area. The moderate recharge potential soils occupy approximately 1.25 square miles. The remainder of the Boundary Upland area is occupied by soils of low recharge potential. Low-permeability soils also tend to occupy areas adjacent to the Boundary Upland. and the higher elevated terrain to the east of the Boundary Upland. ·
Within the Custer lowland area, low-permeability soils are primarily present, with minor amounts of moderate-permeability soils located along Dakota Creek and adjacent tributaries. The water table within Custer Trough is relatively shallow (less than 8 feet), and ground-water levels near the central portion of the trough near Dakota Creek appear to be high (near ground surface) during the winter months. As a result, much of the precipitation falling in this area is likely routed away by the streams prior to recharging the subsurface. Thus, recharge potential within all of the Custer Trough area has been classified as low.
This qualitative evaluation indicates that more recharge is likely to occur in the Boundary Upland area than in the Custer Trough area. The lower drainage density in the Boundary Upland area in comparison to the Custer Trough area (Figure 1-1) further suggests that runoff within the Boundary Upland area is less than runoff in the Custer Trough area. The recharge occurring within the Upper Dakota Creek catchment was estimated at between 15 and 25 percent of annual precipitation, or 6 to 10 inches per year. Thus, since precipitation averages about 4 inches more in the Boundary Upland area than in the Custer Trough, and based on the recharge estimates provided earlier and the potential recharge of the soils throughout the GWMA, an estimate of recharge within the Boundary Upland area of 10 to 20 inches per year appears to be reasonable.
4.2.3 Recharge from Outside the GWMA
The potential recharge of the deep confined aquifers (Unit C4 and possibly D) within the GWMA from sources outside the GWMA is uncertain. The differing major ion chemistry of the ground water from Unit C4 in comparison to the other ground waters within the GWMA, suggests that this ground water may be recharged from a source other than the Boundary Upland, as discussed previously. In addition, lateral flow from outside the GWMA may be contributing limited recharge to shallower confined aquifers (such as Unit D) within the GMW A. Further study of aquifer characteristics and additional test well installation may help provide a reasonable estimate of the potential recharge from outside the GWMA. Its possible that lateral flow from outside the GWMA may be providing significant recharge to the deeper aquifers within the GWMA, and this should be
Golder Associates

I I I I I I I I I I I I I I I I I I I
September 2, 1992 38 903-1060.406
considered in the evaluation of the ground-water resources within the GWMA, as discussed in Section 5 below.
Golder Associates

I I I I I I I I I I I I I I I I I I I
September 2, 1992 39 903-1060.406
5. GROUND-WATER RESOURCES
This section presents a discussion and evaluation of the ground-water resources within the GWMA, based on the current understanding of the hydrogeology, water quality, and the estimates of ground-water recharge presented in the previous section. The potential quantity of ground-water resources available within the GWMA for withdrawal is discussed first, followed by a discussion of the ground-water quality.
5.1 Quantity
The ground-water resources within the GWMA can be divided into: 1) the ground-water resources available from the shallow unconfined aquifer (Unit C2) within the Custer Trough area; 2) the ground water resources within the semi-confined to confined aquifers of the GWMA (Units C1, C3, and D); and 3) the ground-water resources in confined aquifer Unit C4, which appears to receive a significant amount of recharge from outside the GWMA. Ground water resources are discussed separately in the following sections. ·
5.1.1 Unit C2
Recharge to Unit C2 results from direct precipitation within the Custer Trough area. As discussed in the previous section, recharge has been estimated at between 6 and 10 inches per year, which translates to 200 to 330 gpm per square mile per year. Discharge from Unit C2 appears to provide most, if not all, the base flow to Dakota Creek. Relatively small quantities of ground water has been withdrawn from Unit C2 for domestic use and some irrigation. Additional development since the 1950's has apparently had little or no effect on the base flow to Dakota Creek, based on a comparison of the water balances calculated for 1952-1953 and 1989-1990. Future large withdrawals from Unit C2 could, however, negatively impact the base flow to Dakota Creek. The aquifer has not been used for municipal supply purposes in the past, in part because the water quality is poorer than that of the other aquifers in the GWMA, and the potential for contamination also makes it unattractive for future development as a municipal water supply. As a result, the evaluation of ground water resources for potential future development is focused primarily on the other aquifers, as discussed in the following section.
5.1.2 Units Cl, C3, and D
Recharge to Units C1, C3, and D within the GWMA occurs from precipitation occurring within the Boundary Upland, and possibly from lateral flow from outside the GWMA for Unit D only. As discussed in Section 4.2.2, the ground water recharge occurring in the Boundary Upland area is estimated at between 10 and 20 inches per year, which translates to 330 to 660 gpm per square mile per year. The total area of the Boundary Upland that could be contributing flow to these units within the GWMA is six square miles. Thus, the total recharge to these units within the GWMA is estimated at between 2,000 gpm and
Golder Associates

I I I I I I I
September 2, 1992 40 903-1060.406
4,000 gpm. Not all this water is available for groundwater development (see subsequent discussion) since this water provides part of the groundwater discharge to Dakota Creek and discharges into Drayton Harbor via subsurface flow. As a rough figure, it might be possible to develop between 30 to 50% of the annual recharge (600 to 2,000 gpm) without significant adverse effects on the hydrologic system. However, without development of additional groundwater the actual effects cannot be determined with reliability.
5.1.3 Unit C4
Recharge to Unit C4 appears to be from outside the GWMA boundaries. Therefore, there may be greater quantities of groundwater available from this aquifer than shallow aquifers. The amount of recharge cannot be estimated at this time. Wells 1 and 2 have reportedly produced up to 800 gpm from this aquifer with no apparent long-term water level declines. Our preliminary estimate is that potentially an additional 300 to 1,000 gpm could be
~eve loped from this aquifer. Development of ground water from this aquifer will have I y~ittle· effect on streamflow in Dakota Creek because of the large thickness of overlying low-\;(). permeability sediments.
I ~. q-g£7(' .
I I I I I I I I I I
5.1.4 Blaine:s Future Needs .
Blaine's 1991 annual average water usage was about 800 gpm. Present annual average withdrawals by Blaine from aquifers Cl, C3 and D (Wells 3, 4, 5, 6, Lincoln Park, and 12th St) is estimated at between 400 to 600 gpm. Withdrawal from Well Nos. 1 and 2 from Unit D is between 200 to 400 gpm.
The ~rojected average annual demands for municipal purposes was estimated at 1,608 gpm for the year 2010 and the ultimate average annual demand was estimated at 4,542 gpm. These estimates are currently being revised by EES. Thus, the ground water recharge may be sufficient to meet the municipal needs to at least the year 2010, but may not be able to sustain the ultimate demand. As discussed earlier, the estimate of ground water recharge is only a rough estimate of potential ground water available for withdrawal. The estimate of ground water recharge itself is subject to uncertainty because it is calculated as the relatively small residual of larger inputs and outputs, the estimates of which are subject to uncertainty26. For example, if recharge is equivalent to 25 percent of precipitation and precipitation can only be estimated to ±25 percent, then the error in the recharge estimate is 100 percent. Thus, this estimate should be viewed only as a rough approximation of what may be available for withdrawal.
25URS Consultants, August 1989. Blaine, Washington.
1989 Water System Plan Update. Prepared for the City of
,. Lerner D.N., A. S. Issar, and I. Simmers. 1990. Groundwater Recharge. A guide to Understanding and Estimating Natural Recharge. International Association of Hydrogeologists. Volume 8. pp. 324.
Golder Associates

I I I I I I I I I I I I I I I I I I I
September ·2. 1992 41 903-1060.406
Discussion
· Development of groundwater resources comes with associated costs. The most strait foreword of which, is lowering of the pumping water levels, resulting in added costs to lift the water from greater depths. Other less easily-defined costs may exist, such as reduced flow to wetlands, and water rights issues. These factors have been incorporated into a concept often referred to as the "safe yield", which has been defmed as the amount of ground water that can be withdrawn without producing an undesirable result.
Ground water yield comes in several scales. For an individual well, the potential yield is the maximum at which the well can be pumped without lowering the water level below the pump intake. For an individual aquifer, the potential aquifer yield is the maximum pumping rate of wells installed within the aquifer such.that water levels are not drawn below an acceptable level. This is in part a function of the number and spacing of the wells. On a larger scale, such as an entire hydrologic basin, as is the GWMA, the potential yield from the basin is the maximum rate of withdrawal which can be sustained by the complete hydrogeologic system without causing unacceptable declines in water levels or unacceptable changes in other components of the hydrologic system, such as reduced base flow to streams.
As discussed previously, an estimate of ground-water recharge provides a rough approximation of the potential quantity of ground water available for withdrawal. However, it is a common misconception that the safe yield of the ground water system is that amount of groundwater withdrawal that does not exceed the average ground-water recharge27. Bredehoeft and Youn~ point out that major ground-water development can significantly change the recharge and discharge character of the ground-water system. The maximum yield of the ground-water system, therefore, depends on how the effects of pumping are transmitted through the aquifers, and on the associated changes in the rates of recharge and discharge25. ·
An example of the response of a ground-water system to increased development is presented by Freeze29 as follows. The transient water balance of a ground-water system can be written as:
Q = R- D + V'S,
where Q is total rate of ground water withdrawal, R is total rate of ground water recharge,
27 Freeze R.A., ].A. Cherry, 1979. Groundwater, Prentice-Hall, Inc. N], pp. 553.
"' Bredehoeft, ].D., R.A. Young. 1970. The Temporal Allocation of Groundwater: A Simulation Approach. WRR, 6. pp. 3-21.
29 Freeze R.A., 1971. Three-dimensional, Transient, Saturated-Unsaturated Flow in a Groundwater Basin. WRR 7, pp. 347-366.
Golder Associates

I I I I I I I I I I I I I I I I I I I
September 2. 1992 42 903-1060.406
D is total rate of natural ground water discharge, and VS is rate of change of ground water storage within the ground water system.
The response of increased ground water withdrawals is illustrated Figure 5-1. Increased rates of withdrawals occur at times t1 to ts, where to represents the conditions before pumping. When withdrawals begin, the first response observed is a decrease in storage. With time, however, total recharge (R) to the ground-water system may increase and total discharge (D) may decrease until a new equilibrium is attained. At this point, water levels cease to decline in response to pumping. As total withdrawals (Q) increase, recharge continues to increase and discharge decreases until a new equilibrium condition is attained. At higher and higher rates of withdrawal, a maximum recharge rate is attained and discharge may become negative, or in other words, the ground-water system could be receiving recharge from surface-water bodies, such as streams, which were previously supplied by ground-water discharge. Additional ground-water withdrawals above this point could lead to a rapid depletion of ground-water levels and pumping rates could no longer be maintained.
This discussion illustrates the interactions of surface water and ground water, and that if ground water is developed to its maximum potential, surface-water components of the hydrologic system will be reduced. Thus, it becomes apparent that the optimal development of water resources within the hydrologic system depends on the best management of surface water and ground water understanding the relationship between the two systems. Best management could involve utilization of deep wells in the summer months to minimize impacts on streamflow, and/or development of aquifers with limited hydraulic communication to surface-water bodies for peaking purposes only, or use of surface water for artificial recharge.
The determination of the potential safe yield is far more complicated than determining the present ground-water recharge, particularly in light of often stringent regulations with regard to consumptive use of surface water or depletion of natural wetlands. At present, there are no indications that the ground-water system within the GWMA has been overdeveloped. No major declines in ground-water levels have been observed in recent history, and the base flow to Dakota Creek does not appear to have changed since the 1950's. Water levels in Well No. 1 have apparently declined since 1940 by about 50 feet in response to increased pumping over the years. However, as discussed above, a drop in water levels due to increased pumping is a natural response that cannot be avoided. If the ground water system was currently being over pumped, water levels would be declining at a relatively rapid rate, and the rate of decline would not diminish in time. Thus, the ground-water system within the GWMA does not appear to be developed to its fullest extent at the present time, suggesting that additional withdrawals could be made without adverse consequences. However, how much more ground water withdrawal can be sustained withoufadversely affecting water levels and discharge to surface-water bodies is less certain.
Based on the current understanding of the hydrogeology within the GWMA, there appears to be little hydraulic communication between the deep semi-confined and confined aquifers (Units C3, C4 and D) within the GWMA and the shallow unconfmed aquifer (Unit C2)
Golder Associates

I I
•• I I I I I I I I I
•• I I I I I I
September 2, 1992 43 903-1060.406
present within the Custer Trough area. However, as discussed before, there appears to be a fair degree of hydraulic communication between Dakota Creek and Unit C2; Unit C2 is providing most of the base flow to Dakota Creek. The other aquifers likely discharge to Drayton Harbor and possibly to other locations outside the GWMA. However, limited discharge from the other aquifers to Unit C2 within the GWMA may also be occurring. The large thickness of low-permeability materials (Units AlB and E) separating the deep· confined aquifers (C4 and D) and Unit C2 is expected to limit ground water flow between the two systems.
Although future development of the deep aquifers (Unit C4 and D) in the vicinity of the Boundary Upland area is not expected to change the base flow to Dakota Creek significantly, there is a possibility that increases in withdrawals could reduce spring flow along the margins of the Boundary Upland. At present, it is uncertain if spring discharge would be affected significantly. Monitoring of spring flow and ground water levels near wetland areas, along within continued monitoring of water levels in the City wells should be conducted as part of the GWMP.
The primary obstacle to future ground water resources development within the GWMA is locating sufficiently permeable aquifers for well installation. The lensoidal nature of permeable sand and gravel deposits complicates groundwater exploration, requiring a number of test wells to be drilled to identify productive aquifers. The hydrostratigraphy presented in Section 4.1 illustrates, however, that aquifers tend to be concentrated within specific horizons, which should provide useful information for future ground water exploration. Future municipal wells should target either the C3, C4 or D units depending on water rights discussions with the Department of Ecology. As additional test wells are drilled, the hydrostratigraphic model should be updated and revised accordingly such that the hydrostratigraphic characteristics of the GWMA can be further understood to aid in additional exploration activities.
5.2 Ground-Water Quality f~~ / ~r<6w-?
At present, ground-water quality within the GWMA is relatively good. Detectable nitrate concentrations within the Boundary Upland area, however, are of concern, because this area serves as the primary recharge area for most of the deeper aquifers within the GWMA. Highly permeable sandy and gravely soils within the Boundary Upland area provide an ideal environment for aquifer recharge (Figure 4-9). However, these sediments are als~ moderately to severely susceptible to land-use activities. The SCS rates over 60 percen of the soil within the Boundary Upland area as "severe" (due to poor filtering charac eristics) for septic system drain fields, which implies that special designs or consid~rations are required for appropriate system operation. Due to the soil characteristics
I .
witryin the Boundary Upland, and their importance as the primary recharge area for the local aquifers, special precautions with regard to future protection of the Boundary Upland ar~a from contamination are prudent. A second concern regarding future development within the Boundary Upland area is the potential increase in runoff from paved and cemented surfaces and the corresponding reduction in recharge to the aquifers. This
Golder Associates

I I I I I I I I I I I I I I I I I I I
September 2, 1992 44 903-1060.406
possibility, and potential mitigation measures, should also be considered during the development of plans to protect the ground water resources within the GWMA.
Golder Associates

I I I I I I
I I I I I I I I I I I I
September 2, 1992 45 903-1060.406
6. RECOMMENDATIONS
The following recommendations, based on the results of this hydrogeologic study, are made as part of the on-going GWMP:
1) The City should install flow meters cin all of their wells to provide accurate estimates of water usage. At present, there is conflicting information between water sales figures and pumpage records that must be resolvy~ to determine the present level of development of the various aquifers. ~~
2) A long-term water-level m~nit -·--~m should be initiated, which includes measuring water levels every O-~~~~g~~r City wells and test wells. The purpose of this program is to determi e: 1)-,2II!llla~ations in groundwater levels and potential interference effects between wells; and 2) to identify whether there are any long-term trends in groundwater levels in response to natural recharge/discharge or City pumping. This information may be used to support additional water rights applications.
In conjunction with the ground-water level monitoring program, we recommend continued measurement of streamflow in Dakota Creek and in the tributaries that drain the Boundary Upland. The City should approach the USGS about re-activating the stream gage on Dakota Creek at Behme Road.
3) Water quality should be monitored in the City wells as required by the Washington Department of Health for Class A Water Systems. These data should be input into a data base system similar to that developed as part of the GWMP in order to detect long-term trends in water quality (specifically nitrate levels) that may indicate contamination of the aquifers by surface sources. In addition, a wellhead protection area should be defined within the Boundary Upland area and permanent ground water monitoring wells installed to monitor and prevent possible future contamination of the City wells.
4) The City should concentrate its efforts on the deeper aquifers (Units C3, C4 and D) for future ground-water supply development. Ecology has closed Dakota Creek to new year-round surface-water withdrawals or to ground water in hydraulic continuity with surface water. However, because of the time-lag effect between ground water pumping and the effect on streamflow, it may be possible to use wells in Unit C3 for short peaking periods in the summer only to meet peak demand. This is because the effect on streamflow is not immediate, but occurs progressively over several months with the greatest effect occurring several months after pumping starts (i.e., in the fall and winter months when streamflow has increased above minimum regulated flows). A long-term pumping test (30 days) should be performed on well GWMP-3 (completed in Unit C3) to determine whether this aquifer could be used for peaking purposes and the potential effect on streamflow. The test would involve monitoring of ground water levels in surrounding wells and mini-piezometers adjacent to the creek/wetland, and measurement of streamflow.
Golder Associates

I I I I I I I I I I I I I I I I I I I
/1, i ,__c. J <if! •
September 2, 1992 46 d (/\ j 903-1060.406
New wells in Units C4 and D could likely be used yeLd since these aquifers appear to be confined. The confined nature limits hydraulic communication with Dakota Creek, and hence new rights will be easier to obtain. It is our opinion that new rights will be easiest to secure for the wells in Unit C4 since this aquifer is overlain by several hundred f!'!et of low permeability sediments and is not in hydraulic communication with Dakota Creek Because of the different water quality in Unit 4 compared to shallower aquifers, further evaluation of the water quality in this unit is recommended if additional development from this aquifer is pursued.
5) In addition to those areas investigated as part of the GWMP, the City should explore for new sources of ground water east and southeast of the Watershed targeting Units C3, C4 and D. This would include Sections 2, 3, 10 and 11. In Section 11, a coal exploration hole reportedly encountered 175 feet of sand and gravel overlying bedrock. This aquifer may be similar to the Unit D sediments in the Watershed. The exploration program should determine geologic conditions, well yields, water quality and the potential for hydraulic communication with Dakota Creek.
6) As additional hydrogeologic information is collected and interpreted, and complexities in the hydrogeologic system are better understood, the City may wish to consider the development of a ground .water model for the GWMA. A model would help understand the interactions of the various components of the hydrologic system and could be used to better determine ground water availability and effects on streamflow (i.e. ground water management). A ground water model was originally part of the scope of work of the GWMP, however a model could not be developed at this time because of the complexity in the hydrogeologic conditions and the limited data available from the program. We recommend on-going monitoring and further investigations as described above to assess the present and future performance of the ground water system until sufficient additional information has been collected to develop an appropriate model.
Golder Associates

I I ~
o-<;;
"'
I I I I I I I I I I I I I I I I I

I I I I I TABLES
I I I I I I I I I
- "
I I I I I Golder Associates

-------------------
(IJaiJU3l Barium
Table 2-1
Existing Water Quality: City of Blaine Wells
0.-65 - - <0.02 <0.01 <0.02 <O.C - - - -NA - - - - - - - 57 60 59
1 - - <0.5 <0.25 <0.5 <0.25 - - - -I l Cas NA 78 70 - - 140 - - .""130 70 70 73 ""12
Calcium I I
NA - - - - - - 0 - 0 0 _0.01 - - <0.001 . <0.002 <0.001 <0.002 - - - -
NA 12 12 - - 11 - - 9.5 12 - 14 14 NA 3.3 2.5 17 30 33 47 ~ 40 2.5 - 2.5 2.8
0.05 - - <0.02 -<0:01 <0.02 <0.01 - - - -Color 15units - - 3 5 12 5 5 - 5 ·o·
~~~~-t-----,~--~0~.2--~0~ .. 1+--~C.1+-~~~~--~2----~-~0.2~~<(1.2~--~~~0~ .. 1~--~-+-~0~:.1+--~~2 ~ NJ 57 51 65 70 56 60 51 61 57 54
Iron 0.: O.D1 0 <0.1 <C.1 -0.05 <0.1 <(1.1 0.13 __-<:0.1 - 0.01 -Lead 0.05 - - <O~Of <0:002 <0.01 <0.002 - - - -
I (Tot) NA 6.5 5.2 - - 6.8 - - 6.4 5.2 - 5.4 4-:-8 0.05 0 - 0.03 0.0~ 0.03 0.01 0.018 0.016 - - ~.05 ~-:as
0.002 - - <0.001 1.-n nn <0.001 - - - -Nitrate (as N) 10 0.1 0.1 0.2 ~-2 0.016" 0.2 . 0.3 -0.01" 0.1 - 0.4 0.9
Spec.
Silica Sliver
Sulfate
IDS pH
,, !degF
NA 2 - - - 5.8 - - 5.4 1.3 - 1.3 1 0.01 - - <0.005 <0.005 <0.005 - - - -
NA 24 25 - - - - 25 - 25 2f 0.05 - - <0.02 <0.01 <0.02 <0.01 - - - -250 6.7 4.4 - - 9 - - 6 - - - 5.6 NA 5.8 5.1 - 50 ~ - 60 ~ 5.1 - 5.5 li
700 us/em 133 - 180 360 320 325 380 320 129 128 117 1 500 99 93 - - - - 9 - 18-
- - - - 8 - - 7.2 7. 7.4 .8 NA - - - - 53 - - 54 _48. 46.4 - -
(')Indicates exceedance of MCL;- Indicates not sampled for; NA Indicates not applicable; • • Indicates total nitrate+ nitrite as N

-------------------
Arsenic V(l
Barium 9(as
Color
Iron Lead
1 1 (Tot)
Nitrate (as N)
Spec.
Silica Silver
TDS pH
tdeg F
0.05 NA
1 NA NA
0.01 NA NA
0.05 15 units
2 NA 0.3
0.05 NA
0.05 0.002
10 NA
0.01 NA
(
700 us/em
N~
-62 -
72 2
--3
-0
0.2 60
<0.01 -
4.9 0.01
-0.8 1.2 -
25 -6
5.5 143 104 8.4
42.8
Table 2-1 (cont.)
60 ;r,;gg~,,-
19 l)ltw~·····.· f~))i(1QAAl·•.· / < ...•.....•..•..• ;~~;\·.··· ··•. \ - <I )2 <( 12 <O.C - <0.02 O.Ql ~ - <0:02 <0~01 -
.• •••·•· r: ... •
62 - - - 89 - - - - - - -- <0.5 <0.5 <0.25 - <0.5 <0.25 <0.25 - <0.5 <0.25 -
75 - - - 108.6 - - - - - - 100:8 0---------- -- <O.oo1 <O.oo1 <:o.o2 - <O.oo1 <o.o62 ~ - 1 <0.001 -
15 - - - 20.8 - - - - - - --,u 2.4 6 4 5 -2.5 -4 15 ~ 5 5 <5.0 5.5
- <0.02 <0.02 <0.01 - 0.04 <0.01 <0.01 - <0.02 <0.01 -0 53 54 3 5 17 5 1
0.1 0.1 0.1 <0.2 0.4 0.2 <0.2 <0. 0 0.3 <0.2 -58 53 50 - 52 75 80 8 80 86 - 60
0.03 <0.1 <0.1 <0.1 0.23 <0.1 .48' <0.01 o.os <0:1 <0:05 o:os - <0.01 <0.01 <0.002 . - <0.01 <0.01 <0.002 - 0.01 <0.01 -
4.9 - - - 4.8 - - - - - - 7.1 <0.05 <0.01 <0.01 <0.01 0.04 0.04 O.o78• 0~047 -0~01 D.02 o:o53' ]1.61
- <0.001 <0.001 I • - <0.001 ~ - I <0.001 -0.5 0.4 0.3 1.1 0.5 0.2 <0.2 <0.2 0.16 0.2 <0.2 0.01 1.2 - - - - - - - - - -
- <0.005 <0.005 <0.005 - <0.005 <0.005 <0.005 - I <0.005 <0.005 24 - - - 20.3 - - - - - - 29.6
- <0.02 <0.02 <0.01 - <0.02 <0.01 <0.01 - <0.02 <0.01 -6.3 - - - 8.6 - - - -8 - - -5.3 - - 5 4 - - 10 - - - 18 140 120 110 140 213 164 260 200 - 180 - -99 - - - 116 - - - 130 - - -
8.1 - - - 7.9 - - - - - - 7.9 53.6 - - - - - - - - - - -
(•) Indicates exceedance of MCL; - Indicates not sampled for; NA Indicates not applicable; • • Indicates total nitrate+ nitrite as N
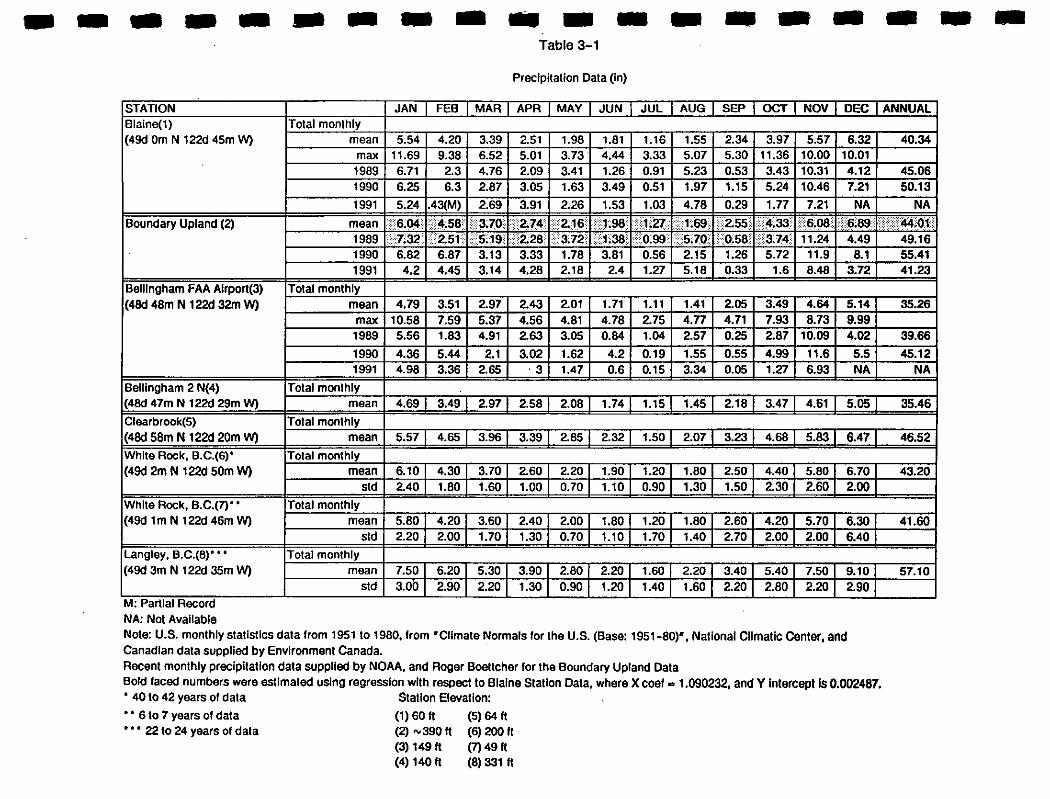
-------------------Table 3-1
Precipitation Data (In)
NA: Not Available Note: U.S. monthly statistics data from 1951 to 1980, from •Climate Normals lor the U.S. (Base: 1951-80)•, National Climatic Center, and Canadian data supplied by Environment Canada. Recent monthly precipitation data supplied by NOAA, and Roger Boettcher tor the Boundary Upland Data Bold faced numbers were estimated using regression with respect to Blaine Station Data, where X coef • 1.090232, andY Intercept Is 0.002487. ' 40 to 42 years of data Station Elevation:
" 6to 7 years of data (1) 60 H (5) 64 H "• 22 to 24 years of data (2) ~390 H (6) 200ft
(3) 149" (7) 49" (4) 140" (8) 331 ft

-------------------Table3-2
Temperature Data (deg F)
STATION JAN FEB MAR APR MAY JUN JUL AUG SEP OCT NOV. DEC Blaine(1) max 41.7 47.3 50.6 56.7 63.4 67.9 72.6 72.1 67.0 58.1 49.1 44.1 (49d Om N 122d 45m W) min 30.7 33.8 34.7 38.5 43.7 48.8 50.7 50.8 47.1 41.7 36.1 33.4
mean 36.2 40.6 42.7 47.6 53.6 58.4 61.7 61.5 57.1 49.9 42.6 38.8 1989 mean 37.6 31.4 42.1 50.2 54.1 60.7 62.1 61 56.9 49.6 43.8 39.4 1990 mean 39.7 36.1 43.4 50.3 54.5 58.7 64.2 63.4 58.4 49.1 43.6 32.2 1991 mean 33.8 44.4 41.2 47.2 53.6 57.3 62.4 62.7 56.9 46.7 44.0 NA
Bellingham FAA Alrport(2) max 42.3 47.5 50.1 56.0 62.4 66.7 71.5 71.1 66.9 58.6 49.8 44.8 (48d 48m N 122d 32m W) min 30.9 34.0 35.1 39.1 44.6 50.0 52.6 52.7 47.9 41.8 36.3 33.5
mean 36.6 40.8 42.6 47.6 53.5 58.4 62.1 61.9 57.4 50.2 43.1 39.2
Bellingham 2 N(3) max . 43.4 48.9 51.5 57.8 64.6 69.0 74.2 73.4 69.3 61.2 50.7 45.6 (48d 47m N 122d 29m W) min 30.6 33.5 34.2 37.7 42.7 48.1 50.1 50.0 46.1 40.8 35.8 33.2
mean 37.0 41.2 42.9 47.7 53.8 58.6 62.2 61.7 57.7 50.5 43.2 39.6
Clearbrook(4) max 40.5 46.9 51.0 58.2 65.1 69.4 75.4 74.4 69.2 59.2 48.9 43.4 (48d 59mN 122d 20m W) min 29.3 33.3 34.2 37.6 42.9 47.7 49.5 48.9 45.8 40.6 35.1 32.1
mean 34.9 40.1 42.7 47.9 54.0 58.6 62.4 61.7 57.5 49.9 42.1 37.8
Whiterock, B.C.(5)' max 41.5 46.2 48.7 54.9 60.8 64.3 69.3 68.7 64.6 56.8 48.6 44.4 (49d 2m N 122d 50m W) min 31.8 34.3 35.1 39.7 44.8 49.8 52.5 52.7 48.9 43.3 37.2 34.7
mean 36.9 40.3 41.9 47.1 52.9 57.2 61.0 60.6 56.7 50.0 42.8 39.4
Whiterock, B.C.(6)' • max 42.3 47.3 49.6 55.4 62.1 65.8 70.7 69.8 65.8 57 49.1 44.6 (49d 1m N 122d 46m W) min 32.7 35.6 36.9 41.7 46.6 51.6 54.1 54.1 50.4 44.2 38.8 35.8
mean 37.6 41.9 43.5 46.6 54.3 56.8 62.1 61.7 57.9 50.9 44.2 40.1 Langley, B.C.(7)' • • max 40.5 46.2 50.0 55.6 62.6 67.6 73.4 73.0 67.5 58.1 47.5 42.8
min 30.7 34.7 35.2 36.8 43.9 46.7 51.4 51.6 48.2 42.6 36.5 33.4 mean 35.6 40.5 42.6 47.3 53.4 58.3 62.4 62.4 57.9 50.4 42.1 38.1
NA. Not Available Note: Based on U.S. data from 1951 to 1980, from "Climate Normals lor the U.S. (Base: 1951-80)", National Climatic Center, and Canadian data supplied by Environment Canada. • 40 to 42 years of data. Station Elevation: " 6 to 7 years of data. (1) 60 It (5) 200 It • • • 22 to 24 years of data. (2) 149 It (6) 49 It
(3) 140 It (7) 331 It (4) 64 It
ANNUAL 57.6 40.8 49.2 49.1 49.6
NA
57.3 41.5 49.5
59.1 40.2 49.7
58.5 39.8 49.1
55.8 42.1 48.9
56.7 43.5 50.2
57.0 41.4 49.3

I I I I I I I I I I I I I I I I I I I
(VuriOOO
... ·... Mav
''"'"" ... ~L
.... vo~l ...
""'' "'" ... ''"' "''"" I SoP!
"'· olal
Yeu 11K11
IM~eh
lAo•"
I.
1.32 1.34 1.35 .... 1.05
1~.:. IFI
Table 3-3
I Pol
I..T ""' o.•o
0.00 0.00
'·" .... 1.03 ).21 .. ., &:60 2.ii
1228 o.oo 1M 3:i --..... 6.70 •
II. 16 4., 18.11 6.08 .... 3.8
... ..... u1 o:n
60.20 6.50 .. 12.60 •. oo ioo .. 14.83 6.10 v.
17.44 10.72 6 ... 14.67 6.10 7.64 .... •.
'·" 0.•
I~· ••
1.72 1.22 1:97
D.C .... , 7.05 ...
1.20 17.20
1.12
2.37 1.03 •. 53 1:79
I May 1.22 ..... 1ioo 7.05 1.01
IJu~ IAuouol ISePI
I Nov IDee Total
1::::.. ~:..:~, I Jan I Fob
"'"' """ '"" uly
'"'""
INov 0. IDee 0:
~otAva/l;ble
18.89 11.27 1.44 82.70 17.08 •.• 10.40 i:i2 ..... 1:.
.... 14.67 6.10 •. 81.70 10.60 8.10
8.03
.... 42.8C •••• 1.28 2.08 o.S. 38.80 3:7i 0.86 '·" 3:47 .....
• Ba .. d on 1SI51-1980 data bue

I I I I I I I I I I I I I I I I I I I
Table 3-4
BLAINE GROUND WATER MANAGEMENT PROGRAM
Well Summary Sheet
No Well J.D. Location Owner or person at well address
1 12st. Well 41N01E-31Q City of Blaine
2 Lincoln Park 41N01E-31R City of Blaine
3 Well No.6 40N01E-4K City of Blaine
4 40N01E-4Q1 40N01E-4Q John & Kelly Wood
5 Berg 40N01E-3C Walter Berg
6 Well No.4 40N01E-3N City of Blaine
7 Boettcher 40N01E-4F Roger Boettcher
8 Aller 40N01E-10A Warren Aller
9 Colacurcio 40N01E-2D Dan Colacurcio
10 Leer 40N01E-35Q Hilda Leer
n• Wilson 40N01E-11L Joseph Wilson
12 Rodenburger 40N01E-1G Terry Roden burger
13 Dekubber 40N02E-18F John Dekubber
14 Nymeyer 40N02E-17R Mark Nymeyer
15 Zylstra 40N02E-9Q Andrew Zylstra
16 GWMP-1 41N01E-32P City of Blaine
17 GWMP-2 40N01E-3P City of Blaine
18 GWMP-3 40N01E-5A City of Blaine
• Water Quality Samples Only- No Access for Water level measurements.

-------------------05-May-92 TABLE 3-5 WATER QUALITY SUMMARY DATA Page 1 or 8
DUPLI- FIELD SPEC. Turbid- Total Bicarb carbon Hydrox WELLID DATE FILTERED CATE COLOR PH CONDUCT. TEMP IDS lty Alkalln Alkalln Alkalln Alkalln calcium
pS DegC mg/l NTU mg/l mg/l mg/l mg/l mg/l 12TH ST 19-Nov-90 N N -5 6.68 360 11 110 1.00 85 85 -5 -5 13 12TH ST 19-Mar-91 N N 7.40 220 10 5.80 12TH ST 22-Jul-91 N N 7.13 243 12 0.30 12TH ST 22-Jul-91 N y 7.13 243 12 0.30 12TH ST 10-0ct-91 N N 7.75 280 11 -0.01 ALLER 20-Nov-90 N N -5 ,, 66 0.20 46 46 -5 -5 8 ALLER 20-Mar-91 N N 8.00 100 10 -0.50 ALLER 15-Apr-91 N N ALLER 18-Jul-91 N N 6.69 118 16 1.30 ALLER 09-0ct-91 N N 6.70 140 12 -O.Q1 BERG 20-Nov-90 N N -5 11 40 0.70 63 63 -5 -5 10 BERG 20-Mar-91 N N 7.40 160 9 1.40 BERG 15-Apr-91 N N BERG 18-Jul-91 N N 6.37 173 11 2.50 BERG 09-0ct-91 N N 6.75 200 11 2.20 BOETTCHER 19-Nov-90 N N -5 120 9 68 4.00 42 42 -5 -5 8 BOETTCHER 19-Mar-91 N N 8.60 420 9 -0.50 BOETTCHER 18-Jul-91 N N 7.60 131.6 11 1.60 BOETTCHER 09-0ct-91 N N 6.70 110 10 0.68 COLACURCI 19-Nov-90 N N -5 210 8 72 0.60 46 46 -5 -5 8 COLACURCI 20-Mar-91 N N 6.40 110 10 -0.50 COLACURCI 15-Apr-91 N N COLACURCI 18-Jul-91 N N 7.29 137.5 11.5 1.50 COLACURCI 09-0ct-91 N N 6.8 11 160 -0.01 DEEP WELL 16-Jul-91 N N 8.07 23 12.5 -0.50 100 100 -5 -5 16 DEEP WELL 29-Jul-91 N N 7.84 209 13 -0.10 105 105 -5 -5 14.4 DEKUBBER 20-Nov-90 N N -5 10 140 1.00 23 23 -5 -5 13 DEKUBBER 20-Nov-90 N y -5 10 22 22 -5 -5 13 DEKUBBER 20-Mar-91 N N 6.20 10 9 2.00
- Indicates parameter undetected at stated limit. Blanks indicate parameter not sampled for.

-------------------05-May-92 TABLE 3-5 WATER QUALITY SUMMARY DATA Page 2 of 8
DUPLI- FIELD SPEC. Turbid- Total Bicarb Carbon Hydrox WELLID DATE FILTERED CATE COLOR PH CONDUCT. TEMP TDS lty Alkalln Alkalln Alkalln Alkalln Calcium
pS DegC mg/L NTU mg/L mg/L mg/L mg/L mg/L DEKUBBER 15-Apr-91 N y
DEKUBBER 15-Apr-91 N N DEKUBBER 18-Jul-91 N y 6.18 194 14 2.30 DEKUBBER 18-Jul-91 N N 6.18 194 14 2.40 DEKUBBER 09-0ct-91 N N 5.30 180 15 2.10 FIELDBLANK 18-Jul-91 N N 1.60 FIELDBLANK 20-Nov-90 N N -5 "5 -5 -5 -5 -0.5 GWMP-1 02-0ct-90 N N -5 8.40 210 12 130 18.00 52 52 -5 -5 16 GWMP-1 25-Mar-91 N N 8.30 110 10 5.00 GWMP-1 22-Jul-91 N N 7.07 204 13.5 1.80 GWMP-1 10-0ct-91 N N 7.00 270 11 1.60 GWMP-2 09-0ct-90 N N -5 7.65 180 10 130 -0.50 80 80 -5 -5 13 GWMP-2 25-Mar-91 N N 7.90 120 10 -0.50 GWMP-2 22-Jul-91 N N 7.16 186.4 13 0.40 GWMP-2 10-0ct-91 N N 7.20 250 11 0.11 GWMP-2 10-0ct-91 N y 7.20 250 11 0.06 GWMP-3 05-0ct-90 N N -5 7.86 210 11 130 -0.50 84 84 -5 -5 14 GWMP-3 25-Mar-91 N N 8.10 110 10 3.00 GWMP-3 29-Jul-91 N N 7.12 196 12 0.10 GWMP-3 10-0ct-91 N N 7.30 240 11 0.15 LEER 19-Nov-90 N N -5 170 9 -20 4.00 13 13 -5 -5 4 LEER 19-Mar-91 N N 8.30 10 9 -0.50 LEER 18-Jul-91 N N 6.60 85.3 14.5 1.40 LEER 09-0ct-91 N N 5.30 70 13 0.25 LINCOLN 19-Nov-90 N N 5 150 11 120 0.80 94 94 -5 -5 16 LINCOLN 19-Nov-90 N y -5 11 97 97 -5 -5 16 LINCOLN 19-Mar-91 N N 8.40 80 13 -0.50 LINCOLN 22-Jul-91 N N 7.23 216 11 0.30 LINCOLN 10-0ct-91 N y 7.70 240 10 0.16
-Indicates parameter undetected at stated limit. Blanks Indicate parameter not sampled for.

-------------------05-May-92 TABLE 3-5 WATER QUALITY SUMMARY DATA Page 3 or 8
DUPLI- FIELD SPEC. Turbid- Total Bicarb Carbon Hydrox WELLtD DATE FILTERED GATE COLOR PH CONDUCT. TEMP TDS lly Alkalln Alkalin Alkalln Alkalln Calcium
pS DegC mg/L NTU mg/L mg/L mgJL mg/L mg/L LINCOLN 10-0ct-91 N N 7.70 240 10 -0.01 WELL N0.4 19-Nov-90 N N -5 110 9 72 0.30 80 80 -5 -5 10 WELL NO.4 19-Mar-91 N N aoo 170 9 -0.50 WELL N0.4 22-Jul-91 N N 7.05 154.1 11 0.30 WELL N0.4 10-0ct-91 N N 6.85 200 9.5 -0.01 WELL NO.6 19-Nov-90 N N -5 180 9 130 5.00 82 82 -5 -5 16 WELL N0.6 19-Mar-91 N N -0.50 WELL N0.6 22-Jul-91 N N 6.62 197 11 0.20 WELL N0.6 10-0ct-91 N N 7.80 360 11 -0.01 WELL N0.6 10-0ct-91 N y 7.80 360 11 -0.01
NYMEYER 20-Nov-90 N N -5 90 10 78 8.00 27 27 -5 -5 11 NYMEYER 20-Mar-91 N N 7.00 130 10 5.00 NYMEYER 15-Apr-91 N N NYMEYER 18-Jul-91 N N 6.99 174.3 13 5.60 NYMEYER 09-0ct-91 N N 6.00 220 15 9.50 RODENBERG 20-Nov-90 N N 20 10 1000 8.00 220 210 10 -5 9 RODENBERG 20-Mar-91 N N 7.80 130 10 3.00 RODENBERG 15-Apr-91 N N RODENBERG 18-Jul-91 N N 7.89 1790 14 3.60 RODENBERG 09-0ct-91 N N 8.45 1500 12 1.50 WILSON 21-Nov-90 N y 100 10 200 190 5.6 -5 2 WILSON 21-Nov-90 N N 100 200 0.20 200 190 8.8 -5 2 WILSON 20-Mar-91 N N 8.20 350 9 -0.50 WILSON 15-Apr-91 N y
WILSON 15-Apr-91 N N WILSON 18-Jul-91 N N 8.01 370 14 1.40 WILSON 09-0ct-91 N N 8.15 360 12 1.30 WOOD 20-Nov-90 N N -5 220 11 52 0.30 86 86 -5 -5 12 WOOD 20-Mar-91 N N 6.90 120 10 -0.50
- Indicates parameter undetected at stated limit. Blanks Indicate parameter not sampled lor.

-------------------05-May-92 TABLE 3-5 WATER QUALITY SUMMARY DATA Page 4 of 8
DUPLI- FIELD SPEC. Turbid- Total Bicarb Carbon Hydrox WELLID DATE FILTERED CATE COLOR PH CONDUCT. TEMP TDS ily Alkatin Alkalln Alkalln Alkalln Calcium
pS DegC mg/L NTU mg/L mg/L mg/L mg/L mg/L WOOD 15-Apr-91 N N WOOD 15-Apr-91 N y
WOOD 22-Jul-91 N N 6.79 99 15 1.50 WOOD· 09-0ct-91 N N 7.25 160 13.5 1.40 ZVLSTRA 20-Nov-90 N N -5 230 10 150 -0.50 110 110 -5 -5 16 ZVLSTRA 20-Mar-91 N N 6.40 10 13 -0.50 ZVLSTRA 15-Apr-91 N N ZVLSTRA 18-Jul-91 N N 6.46 268 16 3.60 ZVLSTRA 09-0ct-91 N N 6.95 400 13.5 0.12
- Indicates parameter undetected at stated limit. Blanks Indicate parameter not sampled for.

-------------------05-May-92 TABLE 3-5 WATER OUALilY SUMMARY DATA Paga5ol8
Nltrata/ Magna- Mangan- Pot as- Tot. Org Total Nitrate Nitrite Nitrite
WELLID DATE Chloride Iron sium ese slum Silica Sodium Sulfate Halides Coliform asN asN asN mg/L mg/L mg/L mg/L mg/L mg/L mgtL mg/L mg/L ~FU/100m mg/L mg/L mg/L
12TH ST 19-Nov-90 5 0.25 7 0.06 3.8 26.0 12.00 7 0.009 -0.05 12TH ST 19-Mar-91 1.00 0.06 -2.5 -0.05 -0.005 12TH ST 22-Jul-91 0.01 0.04 -0.05 12TH ST 22-Jul-91 0.01 0.04 -0.05 12TH ST 10-0ct-91 -0.01 0.04 -0.001 -0.01 ALLER 20-Nov-90 -5 -0.05 3 -0.02 1.4 20.0 5.30 -5 -0.008 0.38 ALLER 20-Mar-91 0.09 -0.01 0.57 -0.005 ALLER 15-Apr-91 -2.5 ALLER 18-Jul-91 0.04 -0.01 0.38 ALLER 09-0ct-91 -0.01 -0.01 0.001 0.20 BERG 20-Nov-90 -5 0.26 6 0.11 1.5 12.0 7.70 9 -0.008 -0.05 BERG 20-Mar-91 0.42 0.07 -0.05 -0.005 BERG 15-Apr-91 -2.5 BERG 18-Jul-91 0.31 0.12 -0.05 BERG 09-0ct-91 0.48 0.12 0.001 -0.01 BOETTCHER 19-Nov-90 -5 1.70 4 0.18 1.1 22.0 5.60 -5 0.018 1.70 BOETTCHER 19-Mar-91 0.10 -0.01 -2.5 -0.05 -0.005 BOETTCHER 18-Jul-91 0.06 -0.01 1.60 BOETTCHER 09-0ct-91 0.14 -0.01 -0.001 1.70 COLACURCI 19-Nov-90 -5 -0.05 4 -0.02 1.2 21.0 5.80 -5 -0.008 1.70 COLACURCI 20-Mar-91 0.09 -O.D1 0.24 -0.005 COLACURCI 15-Apr-91 -2.5 COLACURCt 18-Jul-91 0.03 -0.01 1.60 COLA CURCI 09-0ct-91 -0.01 -0.01 -0.001 1.70 DEEP WELL 16-Jul-91 -5 0.02 7.6 0.04 2.7 15.00 -10 -0.05 DEEP WELL 29-Jul-91 -5 -0.01 7.3 0.04 2.4 15.00 -10 -2 -0.05 DEKUBBER 20-Nov-90 16 0.37 4 0.07 5.0 16.0 10.00 20 0.014 5.90 DEKUBBER 20-Nov-90 16 0.26 4 0.07 5.1 15.0 10.00 16 5.90 DEKUBBER 20-Mar-91 2.00 -0.005
- Indicates parameter undetected at stated limit. Blanks Indicate parameter not sampled lor.

-------------------05-May-92 TABLE 3-5 WATER QUALITY SUMMARY DATA Page 6of 8
Nitrate/ Magna- Mangan- Pot as- Tot. Org Total Nitrate Nitrite Nitrite
WELLID DATE Chloride Iron sium ese slum Silica Sodium Sulfate Halides Coliform asN asN asN mgJL mgJL mg/L mg/L mg/L mg/L mg/L mg/L mg/L icFU/100m mg/L mgll mg/L
DEKUBBER ·15-Apr-91 -2.5 DEKUBBER 15-Apr-91 -2.5 DEKUBBER 18-Jul-91 0.64 0.08 3.50 DEKUBBER 18-Jul-91 0.63 0.08 4.00 DEKUBBER 09-0ct-91 0.43 0.08 0.004 5.50 FIELDBLANK 18-Jul-91 0.15 -0.01 -0.05 FIELDBLANK 20-Nov-90 -5 -0.05 -0.5 -0.02 -0.5 -0.5 -0.50 -5 -0.05 GWMP-1 02-0ct-90 -5 0.48 7.6 0.05 3.3 22.2 8.20 6 -0.05 GWMP-1 25-Mar-91 3.90 0.09 -2.5 -0.05 -0.005 GWMP-1 22-Jul-91 0.42 0.30 -0.05 GWMP-1 10-0ct-91 0.24 0.05 -0.001 -0.01 GWMP-2 09-0ct-90 5 0.11 5.3 0.10 2.2 25.7 9.50 -5 -0.05 GWMP-2 25-Mar-91 0.30 0.12 -2.5 -0.05 -0.005 GWMP-2 22-Jul-91 0.13 0.12 -0.05 GWMP-2 10-0ct-91 0.13 0.12 -0.001 -0.01 GWMP-2 10-0ct-91 0.16 0.12 -0.001 -0.01 GWMP-3 05-0ct-90 6 -0.03 6.2 0.05 3.0 25.3 8.70 -5 -0.05 GWMP-3 25-Mar-91 0.94 0.11 -2.5 -0.05 -0.005 GWMP-3 29-Jul-91 0.05 0.10 -0.05 GWMP-3 10-0ct-91 0.08 0.10 -0.001 -0.01 LEER 19-Nov-90 7.1 0.07 2 0.04 0.6 6.8 5.90 -5 -0.008 1.90 LEER 19-Mar-91 0.09 0.02 5 -0.05 -0.005 LEER 18-Jul-91 0.04 0.02 1.80 LEER 09-0ct-91 0.04 0.02 -0.001 1.40 LINCOLN 19-Nov-90 5 -0.05 6 0.04 4.0 21.0 11.00 6 -0.008 -0.05 LINCOLN 19-Nov-90 -5 -0.05 6 0.04 3.9 20.0 11.00 6 -0.05 LINCOLN 19-Mar-91 0.05 0.04 -2.5 -0.05 -0.005 LINCOLN 22-Jul-91 0.02 0.05 -0.05 LINCOLN . 10-0ct-91 -0.01 0.05 0.001 -0.01
- Indicates parameter undetected at stated limit. Blanks Indicate parameter not sampled for.

-------------------05-May-92 TABLE 3-5 WATER QUALITY SUMMARY DATA Page 7 of 8
Nitrate/ Magna- Mangan- Pot as- Tot. Org Total Nitrate Nitrite Nitrite
WELLID DATE Chloride Iron sium ese slum Silica Sodium Sulfate Halides Coliform asN asN asN mg/L mg/L mg/L mg/L mgJL mgJL mg/L mg/L mgJL icFUI100m mgJL mgJL mgJL
LINCOLN 10-0ct-91 -0.01 0.05 -0.001 -0.01 WELL N0.4 19-Nov-90 -5 -0.05 4 -0.02 1.4 20.0 5.70 6 -0.008 0.87 WELL N0.4 19-Mar-91 -0.03 -0.01 -2.5 -0.05 -0.005 WELL N0.4 22-Jul-91 -0.01 -0.01 1.00 WELL N0.4 10-0cl-91 -0.01 -0.01 -0.001 0.57 WELL N0.6 19-Nov-90 -5 0.29 7 0.03 2.4 14.0 9.10 12 0.011 -0.05 WELL N0.6 19-Mar-91 0.15 0.03 -2.5 -0.05 -0.005 WELL N0.6 22-Jul-91 -O.Ql 0.04 -0.05 WELL NO.6 10-0ct-91 -0.01 0.04 0.001 -0.01 WELL N0.6 10-0cl-91 -0.01 0.04 0.001 -0.01
NYMEYER 20-Nov-90 7.4 1.00 3 0.04 0.9 9.4 5.30 20 -0.008 0.93 NYMEYER 20-Mar-91 1.20 0.03 0.74 -0.005 NYMEYER 15-Apr-91 -2.5 NYMEYER 18-Jul-91 1.40 0.05 1.10 NYMEYER 09-0ct-91 1.50 0.05 0.001 0.39 RODENBERG 20-Nov-90 370 1.00 12 0.03 11.0 17.0 370.00 200 0.018 -0.05 RODENBERG 20-Mar-91 0.67 0.03 -0.05 -0.005 RODENBERG 15-Apr-91 53 RODENBERG 18-Jul-91 0.55 0.04 3 -0.05 RODENBERG 09-0ct-91 0.41 0.03 -0.001 -0.01 WILSON 21-Nov-90 6 -0.05 1 -0.02 3.4 27.0 94.00 -5 -0.05 WILSON 21-Nov-90 5.9 -0.05 1 -0.02 3.5 37.0 92.00 -5 0.028 -0.05 WILSON 20-Mar-91 -0.05 -0.005 WILSON 15-Apr-91 -2.5 WILSON 15-Apr-91 -2.5 WILSON 18-Jul-91 0.08 0.02 -0.05 WILSON 09-0cl-91 0.05 0.02 0.002 -0.01 WOOD 20-Nov-90 -5 -0.05 5 0.04 3.1 9.8 14.00 7 0.020 -0.05 WOOD 20-Mar-91 -0.05 -0.005
- Indicates parameter undelecled al slaled llmll. Blanks lndicale parameler nol sampled for.

-------------------05-May-92 TABLE 3-5 WATER QUALITY SUMMARY DATA Page Sol 8
' Nitrate/
Magna- Mangan- Pot as- Tot. Org Total Nitrate Nitrite Nitrite WELLID DATE Chloride Iron sium ese slum Silica Sodium Sulfate Halides Coliform asN asN asN
mgll mg/L mg/L mgJL mg/L mg/L mg/L mg/L mg/L icFUI100m mg/L mg/L mg/L WOOD 15-Apr-91 -2.5 WOOD 15-Apr-91 -2.5 WOOD 22-Jul-91 0.43 0.05 -0.05 WOOD 09-0ct-91 0.38 0.05 0.001 -0.01 ZVLSTRA 20-Nov-90 7.1 -0.05 8 -0.02 2.6 13.0 19.00 -5 0.032 2.20 ZYLSTRA 20-Mar-91 0.11 -0.01 .. 1.50 -0.005 ZVLSTRA 15-Apr-91 -2.5 ZVLSTRA 18-Jul-91 1.50 0.02 2.40 ZVLSTRA 09-0ct-91 0.03 -0.01 -0.001 3.20
- Indicates parameter undetected at stated limit. Blanks Indicate parameter not sampled for.

- -
E
- - -. - ... 1 -.--
/
Peat Till and Ice-contact Deposits Slit and Clay Outwash Sand and Gravell
Bellingham Drift, Kulshan Drift Pre-Vashon marine
i Pre-Vashon
- -
formations
bedrock
1976. (1) reworked
- -- - - - - - -- -Table 4-1
Hydrostratlgraphic Units
i of slit, sand, gravel, and peat.
glacio-fluvial, and Ice-contact
clay, and stony slit with marine shells.
some
available domestic and Irrigation use. Ground water suceptable to contamination.
quantities available In layers of more permeable materials.
lconlirled, and possibly semi-confined aquifers.
zones, particularly within the outwash sand and gravel.
more lzor1es:ground water usually high In dissolved
and often brackish to saline.
•• After Armstrong, 1981. (2) Member of Vashon Drift (Ovt). • • • Modified from Halstead, 1986.
-

-------------------903-1060.406 06-May-92
Table4-2
Summary of Aquifer Characteristics

I I I I I I I I I I I I I I I I I I I

I I I I I FIGURES
I I I I I I I I I I I I I ~1 Golder Associates
~

I I I I I I I .I 'J I
II I I I I I
I I I
••
. ' ......:, ..
D B A Y T
--HARBOR
...
0 1
Miles
PROJECT NO. 903 1060.406 DRAWING NO. 28496 DATE ~5192 DRAWN BY TK
'·' ' -- ., i
it.-· '
Legend
Boundary (Groundwater Management Area)
Boundary Upland (Physiographic Region)
Approximate area contributing flow to creek at gaging station
Approximate Location of Topographic Divide
Location
WASHINGTON
22
FIGURE 1-1 GENERAL FEATURES MAP
BLAINE GROUNDWATER MANAGEMENT AREA BLAINE/FINAL REPORT tWA
Golder Associates

I I I I I I I I I I I I I I I I I I I
13
24 19
30
PROJECT N0903-1060.406 OWG NO 31733 DATE 5--4-92
8 11 12 7
19
'
-....
r-· .]
R1E I R2F.
DRAWN PM
10
I 17 i 16
20 ,.
29
. __ . __ B!itish Columbia United States
34
I 3
10
L
T41N T40N
40N02E-6G .s
EXPLANATION
Name and location of well
Location of cross section
Locoti'on
Washington
o~~~~~~'~s;oo-=~~~~~~~3iooo Mums 0 5000 1 oooo FEET
FIGURE 1-2A LOCATION MAP Blaine/Final Report/WA
Golder Associates

•• •• ll
I I I I I I I I I I I I 'I I I I
LINCOLN PARK
----- ----31
A 12th ST.
6
................
I _.., -... -
------
..._ __ --.... --GWMP-3
DEEP WELL~
r l >
PROJECT N0903-1060.406 OWG N031734 DATES-4-92 DRAWN PM
' \
34 33 ----------------- BERG __ _.. --- c· ---I
I
I ,. ---~-- r-B_L_A_I N_E_W_A_T_E_RS_H_Er-0----''"---,
(ABANDONED) (TH-1)
I r
9
c
GWMP-2
10
J-A' (
00~~~~50~0=====;10~00M~S F 1500 3000 FEET
FIGURE1-28 LOCATION MAP Blaine/Final Report/WA
Golder Associates

'I I I I I I I I I I I I I I I I I I I
A
500
400
300
200
100
0
-100
-200
-300
-400
-500
-600
PROJECT N0903-tOS0.""0S
GWMP-1
Lincoln P•'* GWMP-3
12th Sf Well
C1
A/8
?- --C3 ---- - -c:- --
,----?- ---- E ']
2_,__ -? --
OWC N03U10 DAT£3-24-92 DRAWN DH
tONOIE-tOA 1---------- B/1/ne W•ferahed --------
TH-1 (f<bandonod)
C2 ---· ----A/8 --- -
E
_.r1--
"< ~
----./
/ /
D ?
8!1/n• Wt~/1 No.2
1/92
-
Bl•ln• Well No.20 (f<bandonod)
I
AlB -/ __.-/
D? f -/
..----
D ?
GWMP-2
C1
---?
E --· -----C3? -;;-- ·-- ----
E
EXPLANATION:
GWMP-2 Name and Well Loca!lon
•J1to · __ Groundwater Elevation and Oaie of ~easurement
Lsereened or Open Borehole Socllon
HYDROSTRATIGRAPHY:
A/8 S!ony Clay and S!ony Sill
C1 2 -?---- ---
Sand and Gravel of rruvlal, Glacial, or Glacio-fluvial origin -
A/8 OR E
0 1500 3000
HORIZONTf<l SCALE IN FEET
C2
C3
C4
D
E
F
Glacio-fluvial and flood Plain Deposits of Silt, Sand, Gravel, and Peat
Sand and Gravel of rluvlal or Glacio-fluvial Origin
Sand of fluvial or Glacio-fluvial Origin
Glacial !Ill and outwash Sand and Grovel
Mainly Sill and Clay of Marino or Glaciomarine Orl gin
Torllary-ogod Consolidated Sediments
A'
500
400
300
200
100
0
-100
-200
-300
-400
-500
-600
t;; ... ... 1!:: z 0
§ ...
fiGURE 4-1 CROSS SECTION A-A'
BLAINE/fiNAL REPORT/WA
Golder Associates

I I I I I I I I I I I I I I I I I I I PROJECT N0903-1060.A.06
B
500 40N01E-10A
400
300
200 ?-
100 E
0
-100
-200
-300
-400
-500
-600
OWG NOJ6811 DATE S-.4-92
E
40N01E-11L
F'lo'Wing Well 2/87
~"" ---/? A-/-B-1 r-- - ~
~- i- -7/
DIUWN OH
- -
40N01E-110
12/82" -- ( '..., , ... r---
_5~-- "'--~? "-"? -;:- - \
{ -- A/B
~(_:_ \ L_
( D
\
'
L ----~? F
0 1500 3000
~~~~~~~~~~-~~ HORIZONTAL SCALE IN FEET
B'
500
400
300 40N01E-18P
200
-?
100
[ Norlh Fork Dakota Creek
C2 -------------E 0
C3 _) -100
E
<..,
-200
Brackish
-300
-400
-500
-600
,_ w w ...
EXPLANATION:
GWMP-2 Name and Well Location 'lt90 __ Groundwater Elevation and
Date of Measurement
L Screened or Open Borehole Section
HYDROSTRATIGRAPHY:
A/B
C1
C2
C3
C4
D
E
F
Stony Clay and Stony Sill
Sand and Grovel of Fluvial, Glacial, or Glacio-fluvial origin
Glacio-fluvial and Flood Plain Deposits of Silt, Sand. Gravel. and Peat
Sand and Gravel of Fluvial or Glacio-fluvial Origin
Sand of Fluvial or Glacio-fluvial Origin
Glacial till and outwash Sand and Gravel
Mainly Silt and Cloy of Marine or Glaciomarine Origin
Tertiary-aged Consolidated Sediments
FIGURE 4-2 CROSS SECTION B-B'
BLAINE/FINAL REPORT/WA
Golder Associates
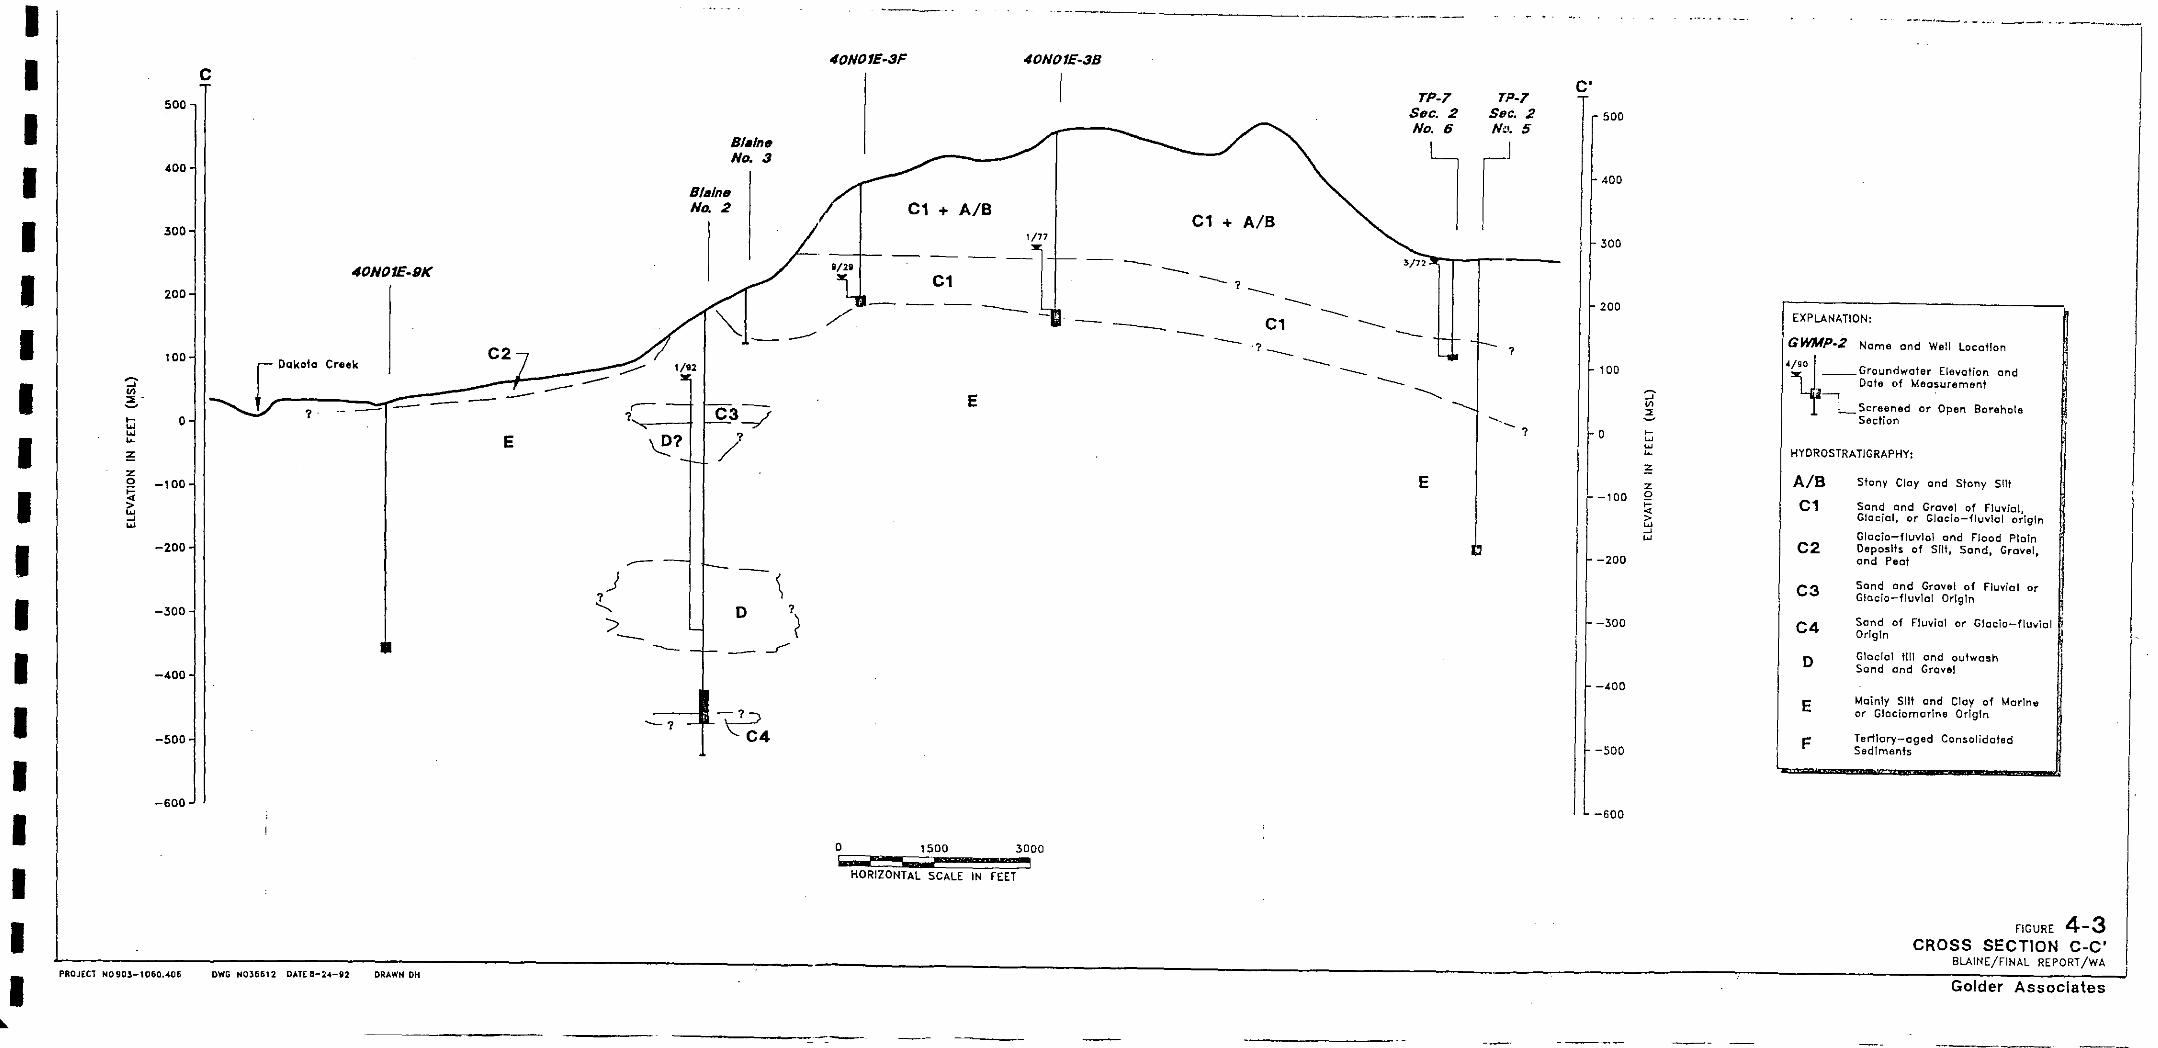
....
I I I I I I I I I I I I I I I I I I I
500
400
300
200
100
0
-100
-200
-300
-400
-500
-600
PROJECl N090l-1D60.406
c
40NOtE-9K
Creek C2
------- -E
DWG N036612 DATE8-24-il2 DRAWN DH
----
----J z_ ::> - ---
..__ 1
B!ltlne No. 2
------
\ D 1
< _r
~ C4
40N01E-3F 40N01E-3B
C1 + A/B
0/77
0/20 -----C1 --E
HORIZONTAL SCALE IN FEET
C1 + A/B
- ---1 ---
·----···----
TP-7 Sec. 2 No.6
--- ---C1 -------- ---- ·1- --- ---
E
TP-7 Sec. 2 N~•. 5
1
--.._ .._1
C'
500
400
300
200
100
0
-100
-200
-300
-400
-500
-600
"' z 9 ~ > w --' w
----·-- « - •••• ----· • ·- --··--··--
EXPLANATION:
GWMP-2 Nome and Well Location
4~90 __ Groundwater Elevation and Date of Measurement
L Screened or. Open Borehole Section
HYDROSTRATIGRAPHY:
A/B
C1
C2
C3
C4
D
E
F
Stony Cloy ond Stony Slit
Sand and Grovel of Flu-viol, Glacial, or Glacio-fluvlol origin
Glacio-fluvlol and Flood Plain Deposits of Sflt, Sand, Grovel, and Peat
Sand and Grovel of Fluvial or G!acio-fluvla! Origin
Send of Fluvial or Glacio-fluvial Origin
Gloclol t1!1 and outwash Sand and Gravel
Mainly Slit and Cloy of Marine or Glaciomarine Origin
Terllory-aged Consolidated Sediments
FIGURE 4-3 CROSS SECTION C-C'
BLAINE/FINAL REPORT /WA
Golder Associates

I I I
I I I I I I I I I I I I I I I I I
D
SOD
400
JOO
200
100
':J' (/)
~ t:; 0
!:::' :;
-100J z 0 >= _j ~ -' w
_,,j -400J
-500
-600
PROJECT NO 903-1 060.«16
40N01E-11Q 40N01E-23E 40N01E-14F
Dakota Creek~
12/82'" C2 t- r- - -C2 -- - --
--·~--- -- -- -- -- E E -- --.---- --- '--- -- -- -- --- ------- -- -- -- ---
A/B A/B ' '
--_;----- ........._,
[?A?~ ,__ -- '- < -?f ~ ·c: ~ D
~ C2
( .::::. ?....-"'--- -- -- -- ?
OWG NOJ661J DATE 5-~-92 DRAWl\'" DH
40N01E-12A 40N01E-12G
C2
---- --9/79 '30 . -1--- E
--- f-- --- - -r - -- D <,__ -AlB
- -- - -- - -----
40N01E-8G
-- .----
---
10/83
-----
- --. -- -?-D - -----EXPLANATION:
GWMP-2 Nome and Well Location
4~90 __ Groundwa·::f!r Elevation and Date of lleasurement
Lscreened or Open Borehole Section
HYDROSTRATIGRAPHY:
A/B C1
C2
C3
C4
D
E
F
Stony Cloy and Stony Silt
Sand· and Grovel of Fluvial, Glacial, or Glacio-fluvial origin
Glocio-fllftial and Flood Plain Deposits of Silt, Sand, Gravel, and Peat
Sand end Grovel of Fluvial or Glocio-flu·liol Origin
Sand of Fluvial or Glacio-fluvial Origin
Glacial till and outwash Sand and Grovel
Mainly Silt and Clay of Morine or Glociornorine Origin
Tertiory-11ged Consolidated Sedimenb .._ ____ ., ____ .......
D' 500
TP-7. SEC. 1 34
400
C1
-- ----------- ---------- A/B
--- --- --- --- --- -----7- -- --· -- - -
C2
0 1:;00 JOOO
HORIZONTAL !;CALE IN FEET
JOO
200
--? -7
100
0
-100
-200
-JOO
-400
-500
-600
FIGURE 4-4. CROSS SECTION D-D'
BLAINE/FINAL REPORT /WA
Golder Associates

I I I I I I I I I I I I I I I I I I I
Mg
100 80
SAMPLES:
1 12th Street
S04+CI
Na+K
\o
60 '40
Co
CATIONS
A Leer 2 Uncoln Pork B Dekubber 3 Well No. 6 c Zylstra 4 Well No. 4 D Berg 5 GWMP-1 E Nymeyer 6 GWMP-2 F Wood 7 GWMP-3 G Allen 8 Boettcher H Rodenberger 9 Colacurcio I Wilson
PROJECT NO 903-1060.406 DWG NO 36616 DATE
BLAINE
100 100
20 0 0
J Deep Well K Well No. 1 L Well No. 2
8-24-92 DRAWN DH
20
Ca+Mg
C03+HC03
o/
40 60
Cl
ANIONS
80 100
NOTE: Samples collected October and November 1990, samples K and L were collected in May 1992.
FIGURE 4-5 PIPER DIAGRAM
BlAINE/FINAL REPORT/WA
Golder Associates

-------------------Southwest
---Drayton Harbor
Custer Trough
Blaine Watershed
us Brfiish Columbia
Boundary Upland
\ ! ! ! Dakota Creek
/~ )L_ _i_ I _i_ ~
A I
A I
., Explanation
t Precipitation
I
t Vertical Leakage
Ground Water Flow Direction
See Table 4-1 for Description of Hydroslratigraphic Units
PROJECT NO. 903 t060A06 DRAWING NO. 28483 DATE &'4192 DRAWN BV EA
A I
[/ ._. f C1- ~
I I I
T
I I I
T
C4
Not to SCale
Eor AlB
I I
T t
\ \
'
Nonheast
/
' I /
-
FIGURE 4-6 SCHEMATIC CONCEPTUAL
GROUNDWATER SYSTEM BLAINE/ANAL REPORTIWA
Golder Associates

I I I I I I I I I I I I I I I I I I I
-:.·. D R A
·-HARBOR
.•. I
j ' ..
•• ~- " ,, !;,
j '· ' .
. '
~ ' i. ' ,.
0 1
Miles
"'\. . -
"'
... . i '1 • 1 ~ •
..::'"!!:·~·~"::..·"'"' +.:- -~--.:._-..2~ L-- ~."------
•
. ! t·.
·--1.
·' -~ ·.
PROJECT NO 9031060406 DRAWING NO 28497 DATE 5'5192 DRAWN BY TK
Legend
---- Boundary (Groundwater Management Area)
-- - Boundary Upland (Physiographic Region)
-50-- Water Table in Shallow Unconfined Aquifer, Unit C2 (feet msl)
····1 00······ ···:-··. .·.·:
Approximate Water Elevations (feet msl)
Approximate Location Unit C2 within GWMA
Direction of Groundwater Flow
Location
WASHINGTON
"
FIGURE 4-7 GENERALIZED WATER TABLE
ELEVATION MAP BLAINE/FINAL REPORT/WA
Golder Associates

- - - - - - - - ·- - - - - - - - - - -
Evapotranspiration
PROJECT NO. 903-1060.406 DRAWING NO. 28707 DATE 517192 DRAWN BY TK
Precipitation
Change Soil Moisture
Change Ground Water Storage
:~~
~:::::::::::::::::::::::.:::::::::::::::::::::::::~:::::::::::::::::: ~::;;;:::::::~.::~::::::::::~~:;.::;::::::::::~:::=~:::.::::::-::::::::!0
Overland Flow
Ground Water Discharge
FIGURE 4-8 SCHEMATIC WATER BALANCE
BLAINE/FINAL REPORTIWA
Golder Associates

I I I I I I I I I I I I I I I I I I I
LEGEND
Recharge Potential Criteria:
H - High Recharge Potential -
t.1 - Moderate Recharge Potential
L - Low Recharge Potential -
High lnfilteration Rate, based on SCS Classification • Hydrologic Group H"; Water table always below 3 feet bgs
Moderate or High lnfilteration Rate, Hydrolo9,ic Groups B or A, with water table w1thin 4 feet of ground surface during part of the year.
Low to very Low lnfilteration Rate, Hydrologic Groups C and D, often with hig tabels.
PROJECT NO 903-1060.406 DWG NO 36615 DATE 4-28-92 DRAWN DH
' '
Notes:
Soil Classification based on Soil Conservation Service (SCS)
Soil Survey of Whatcom County, Washington
L 8
J 17 ,,. ~
L
0 6000 12000 ---·-SCALE IN FEET
IYenlllng!Dn
10
L.-.,
11 12
24
FIGURE 4-9 GENERALIZED RECHARGE
POTENTIAL MAP BLAINE/FINAL REPORT/WA
Golder Associates

~------------------
R ,----------· ----J --- ,; .....
0 Ro ,;
ex:-.9.--- _____ , c:
~ ~ ("-.__ - . ... --r- 0 lfO lf1 2 J~········ ------ i 4 js .. Time -0 ..................... ··-·---------------------------- Do L ::J a 0 I •
Water Table .........
Decline
Wrthdrawal rate, Q
---- Recharge rate, R
------ Discharge rate, o
·---- Rate of change of storage, \7s FIGURE 5•1 RELATION BETWEEN GROUND WATER
WITHDRAWALS AND OTHER HYDROLOGIC COMPONENTS
NOTE: Adapted from Freeze and Cherry, 1979. BLAINE/FINAL REPORTIWA
PROJECT NO. 903-1060.408 ORAwtNGNO. 28709 DATE 517192 ORAWNBV TK Golder Associates