Bladex's 4Q15 Conference Call Presentation
22
4Q15 Earnings Results February 19, 2016
-
Upload
bladex -
Category
Investor Relations
-
view
4.756 -
download
3
Transcript of Bladex's 4Q15 Conference Call Presentation

4Q15 Earnings Results February 19, 2016
Color
Scheme
234 93 46
109 179 63
235 235 235
0 75 141
253 185 36
Accent
Color
31 179 179
192 0 0

The information presented herein is based on reported un-audited
results for the year ended December 31, 2015, which have been
prepared following International Financial Reporting Standards
(“IFRS”) in adherence to a mandate for licensed Banks supervised by
the Superintendency of Banks of Panama, as the Bank completes its
transition from its previous accounting standard, US-GAAP. The Bank
has applied the provisions of IFRS 1 in presenting its financial results.
The Bank´s transition date is January 1, 2014, for which it has
prepared its opening consolidated statement of financial position under
IFRS as of that date, with comparative information provided as of
December 31, 2014 and December 31, 2015.
2
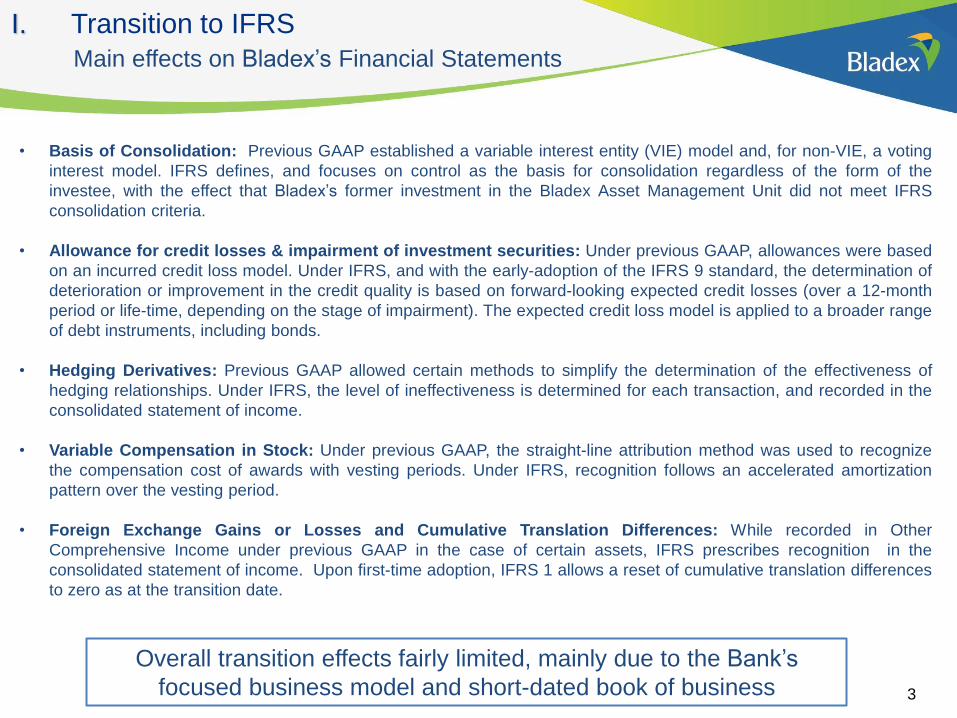
I. Transition to IFRS
• Basis of Consolidation: Previous GAAP established a variable interest entity (VIE) model and, for non-VIE, a voting
interest model. IFRS defines, and focuses on control as the basis for consolidation regardless of the form of the
investee, with the effect that Bladex’s former investment in the Bladex Asset Management Unit did not meet IFRS
consolidation criteria.
• Allowance for credit losses & impairment of investment securities: Under previous GAAP, allowances were based
on an incurred credit loss model. Under IFRS, and with the early-adoption of the IFRS 9 standard, the determination of
deterioration or improvement in the credit quality is based on forward-looking expected credit losses (over a 12-month
period or life-time, depending on the stage of impairment). The expected credit loss model is applied to a broader range
of debt instruments, including bonds.
• Hedging Derivatives: Previous GAAP allowed certain methods to simplify the determination of the effectiveness of
hedging relationships. Under IFRS, the level of ineffectiveness is determined for each transaction, and recorded in the
consolidated statement of income.
• Variable Compensation in Stock: Under previous GAAP, the straight-line attribution method was used to recognize
the compensation cost of awards with vesting periods. Under IFRS, recognition follows an accelerated amortization
pattern over the vesting period.
• Foreign Exchange Gains or Losses and Cumulative Translation Differences: While recorded in Other
Comprehensive Income under previous GAAP in the case of certain assets, IFRS prescribes recognition in the
consolidated statement of income. Upon first-time adoption, IFRS 1 allows a reset of cumulative translation differences
to zero as at the transition date.
Overall transition effects fairly limited, mainly due to the Bank’s
focused business model and short-dated book of business
Main effects on Bladex’s Financial Statements
3

III. Financial Performance Overview
• Net Income of $104.0 million, up +2% YoY from higher revenues, lower expenses and non-core gains from the
participation in investment funds, partially offset by higher provision and impairment loss for expected credit
losses on loans and investment securities (+$6.5 million).
• Business Net Income of $99.0 million (flat YoY).
• +3% increase in average Commercial Portfolio to $7.1 billion.
• +3% increase in Net Interest Income on 4% growth in average loans balances, as lending rates and average
funding costs remained stable.
• Fee income from the letter of credit business and loan structuring activities rises to $19.2 million (+10% YoY).
7 syndicated/club deal transactions successfully executed in 2015.
• Expenses drop -3% YoY, with Business Efficiency Ratio improving to 31%, Overall Efficiency Ratio to 30%.
• NIM at 1.84% (-4 bps YoY), mainly from higher average liquidity balances in the asset mix.
• Reserve coverage ratio increased 11 bps to 1.33% from 1.22% on higher expected credit losses. Non-
performing loan ratio increased temporarily to 0.78% on isolated exposure in Oil & Gas sector, with reduction to
0.42% on pre-payments received subsequent to date of close.
• Net Income of $23.2 million (-38%QoQ, -35% YoY), mainly from swing in results from particpation in investment
funds, and provision for, and impairment loss from, expected credit losses on loans and investment securities,
respectively.
• Business Net Income of $25.3 million (-17% QoQ, -16% YoY).
• Average Commercial Portfolio balances grew to $7.2 billion (+1%QoQ, -1%YoY).
• +2% QoQ increase in Net Interest Income on higher lending rates (+10 bps) and higher average loan balances
(+2%). -2% YoY decrease attributable to increased average funding costs (+16 bps) on higher average funding
tenors, with partial offset by increase in average loan balances (+1%) and lending rates (+10 bps).
• Fee income & other income (-6% QoQ, +9% YoY). QoQ decrease attributable to lower fees from syndicated
transactions, partially offset by higher net gain on sale of loans at amortized cost. YoY increase mainly
attributable to commissions from Letters of Credit and contingency business.
• NIM at 1.90% (+7 bps QoQ, -2 bps YoY) due to higher average balances and lending rates, offsetting increased
average funding costs from higher average funding tenors and LIBOR rates.
• Board declared $0.385 quarterly dividend per share.
Year 2015
$104.0 MM Net Income
(+2% YoY)
11.0% ROAE
10.4% Business ROAE
4Q15
$23.2 MM Net Income
(-38% QoQ, -35% YoY)
9.5% ROAE
10.4% Business ROAE
4
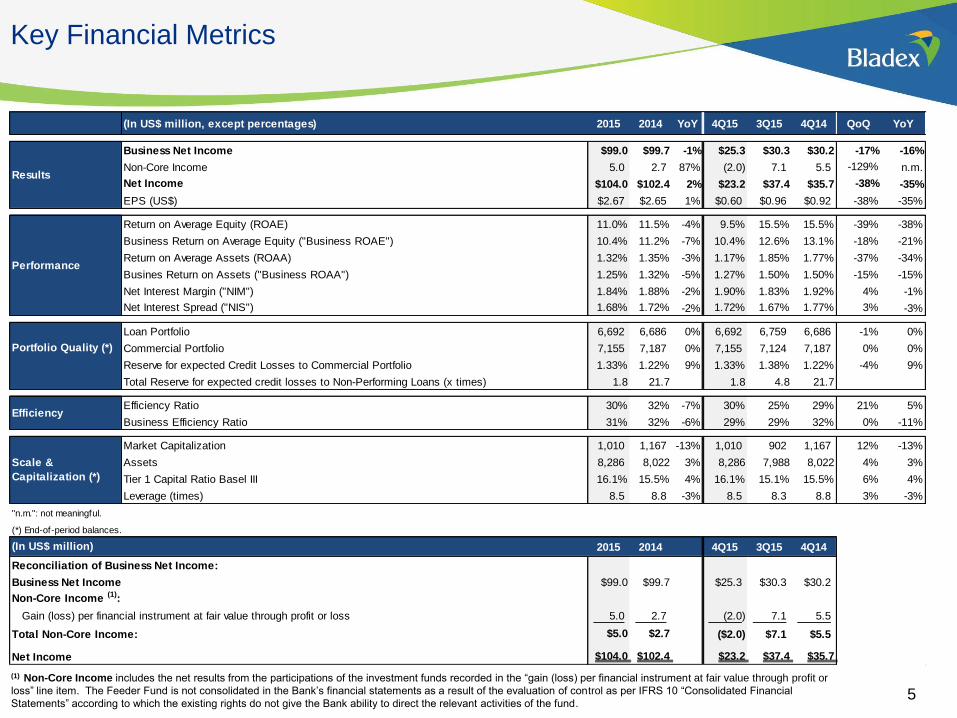
Key Financial Metrics
5
(1) Non-Core Income includes the net results from the participations of the investment funds recorded in the “gain (loss) per financial instrument at fair value through profit or
loss” line item. The Feeder Fund is not consolidated in the Bank’s financial statements as a result of the evaluation of control as per IFRS 10 “Consolidated Financial
Statements” according to which the existing rights do not give the Bank ability to direct the relevant activities of the fund.
(In US$ million, except percentages) 2015 2014 YoY 4Q15 3Q15 4Q14 QoQ YoY
Business Net Income $99.0 $99.7 -1% $25.3 $30.3 $30.2 -17% -16%
Non-Core Income 5.0 2.7 87% (2.0) 7.1 5.5 -129% n.m.
Net Income $104.0 $102.4 2% $23.2 $37.4 $35.7 -38% -35%
EPS (US$) $2.67 $2.65 1% $0.60 $0.96 $0.92 -38% -35%
Return on Average Equity (ROAE) 11.0% 11.5% -4% 9.5% 15.5% 15.5% -39% -38%
Business Return on Average Equity ("Business ROAE") 10.4% 11.2% -7% 10.4% 12.6% 13.1% -18% -21%
Return on Average Assets (ROAA) 1.32% 1.35% -3% 1.17% 1.85% 1.77% -37% -34%
Busines Return on Assets ("Business ROAA") 1.25% 1.32% -5% 1.27% 1.50% 1.50% -15% -15%
Net Interest Margin ("NIM") 1.84% 1.88% -2% 1.90% 1.83% 1.92% 4% -1%
Net Interest Spread ("NIS") 1.68% 1.72% -2% 1.72% 1.67% 1.77% 3% -3%
Loan Portfolio 6,692 6,686 0% 6,692 6,759 6,686 -1% 0%
Commercial Portfolio 7,155 7,187 0% 7,155 7,124 7,187 0% 0%
Reserve for expected Credit Losses to Commercial Portfolio 1.33% 1.22% 9% 1.33% 1.38% 1.22% -4% 9%
Total Reserve for expected credit losses to Non-Performing Loans (x times) 1.8 21.7 1.8 4.8 21.7
Efficiency Ratio 30% 32% -7% 30% 25% 29% 21% 5%
Business Efficiency Ratio 31% 32% -6% 29% 29% 32% 0% -11%
Market Capitalization 1,010 1,167 -13% 1,010 902 1,167 12% -13%
Assets 8,286 8,022 3% 8,286 7,988 8,022 4% 3%
Tier 1 Capital Ratio Basel III 16.1% 15.5% 4% 16.1% 15.1% 15.5% 6% 4%
Leverage (times) 8.5 8.8 -3% 8.5 8.3 8.8 3% -3%
"n.m.": not meaningful.
(*) End-of-period balances.
2015 2014 4Q15 3Q15 4Q14
Reconciliation of Business Net Income:
Business Net Income $99.0 $99.7 $25.3 $30.3 $30.2
Non-Core Income (1):
Gain (loss) per financial instrument at fair value through profit or loss 5.0 2.7 (2.0) 7.1 5.5
Total Non-Core Income: $5.0 $2.7 ($2.0) $7.1 $5.5
Net Income $104.0 $102.4 $23.2 $37.4 $35.7
Results
Portfolio Quality (*)
Efficiency
Scale &
Capitalization (*)
(In US$ million)
Performance
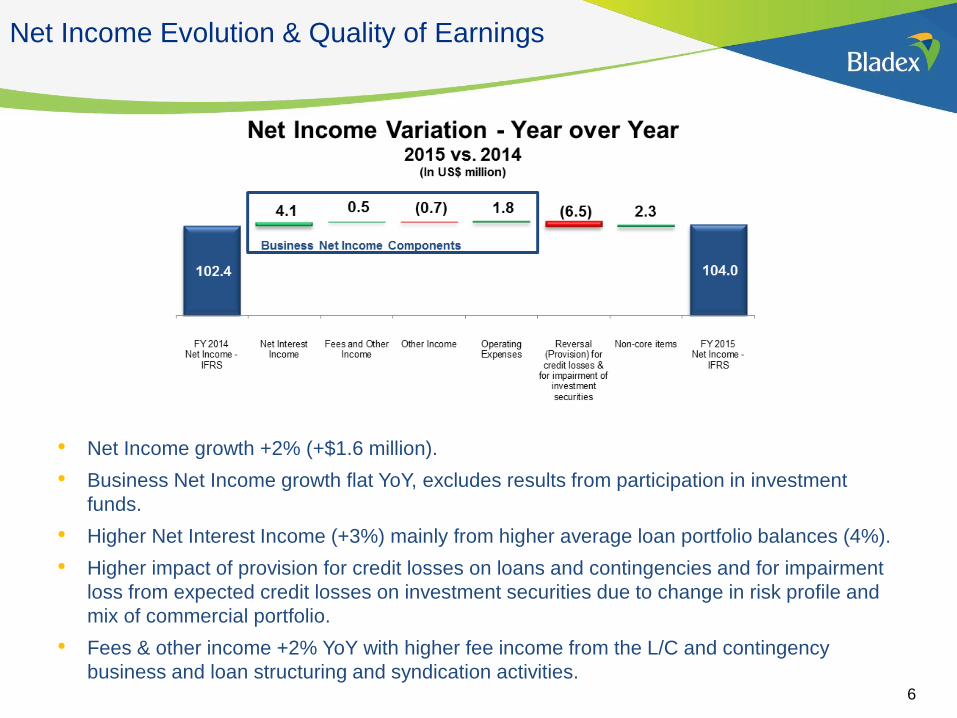
Net Income Evolution & Quality of Earnings
• Net Income growth +2% (+$1.6 million).
• Business Net Income growth flat YoY, excludes results from participation in investment
funds.
• Higher Net Interest Income (+3%) mainly from higher average loan portfolio balances (4%).
• Higher impact of provision for credit losses on loans and contingencies and for impairment
loss from expected credit losses on investment securities due to change in risk profile and
mix of commercial portfolio.
• Fees & other income +2% YoY with higher fee income from the L/C and contingency
business and loan structuring and syndication activities. 6
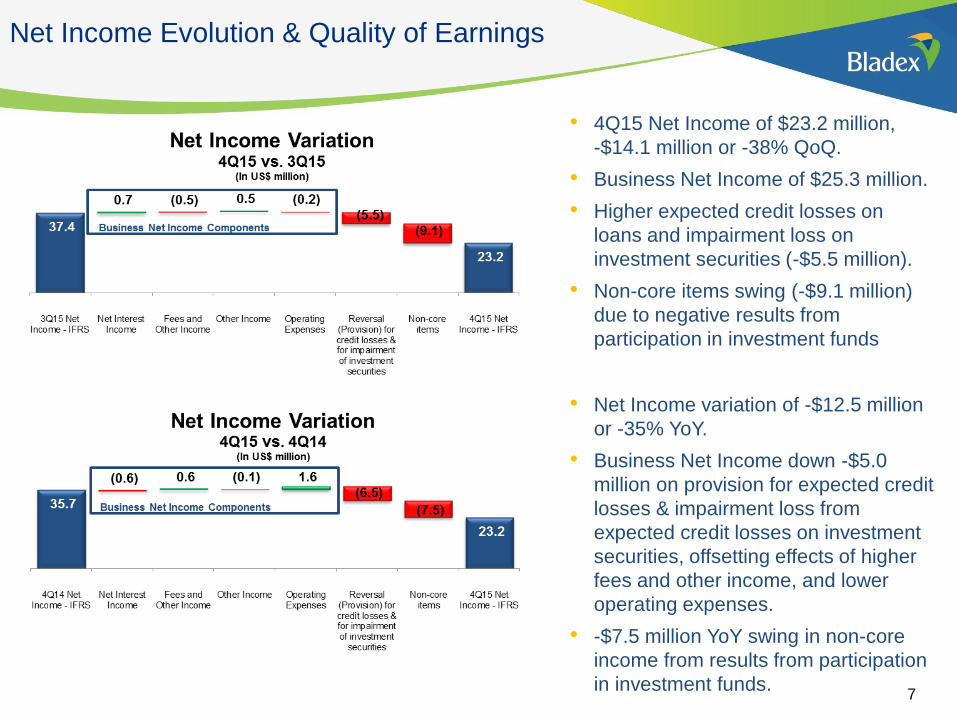
Net Income Evolution & Quality of Earnings
• 4Q15 Net Income of $23.2 million,
-$14.1 million or -38% QoQ.
• Business Net Income of $25.3 million.
• Higher expected credit losses on
loans and impairment loss on
investment securities (-$5.5 million).
• Non-core items swing (-$9.1 million)
due to negative results from
participation in investment funds
• Net Income variation of -$12.5 million
or -35% YoY.
• Business Net Income down -$5.0
million on provision for expected credit
losses & impairment loss from
expected credit losses on investment
securities, offsetting effects of higher
fees and other income, and lower
operating expenses.
• -$7.5 million YoY swing in non-core
income from results from participation
in investment funds. 7
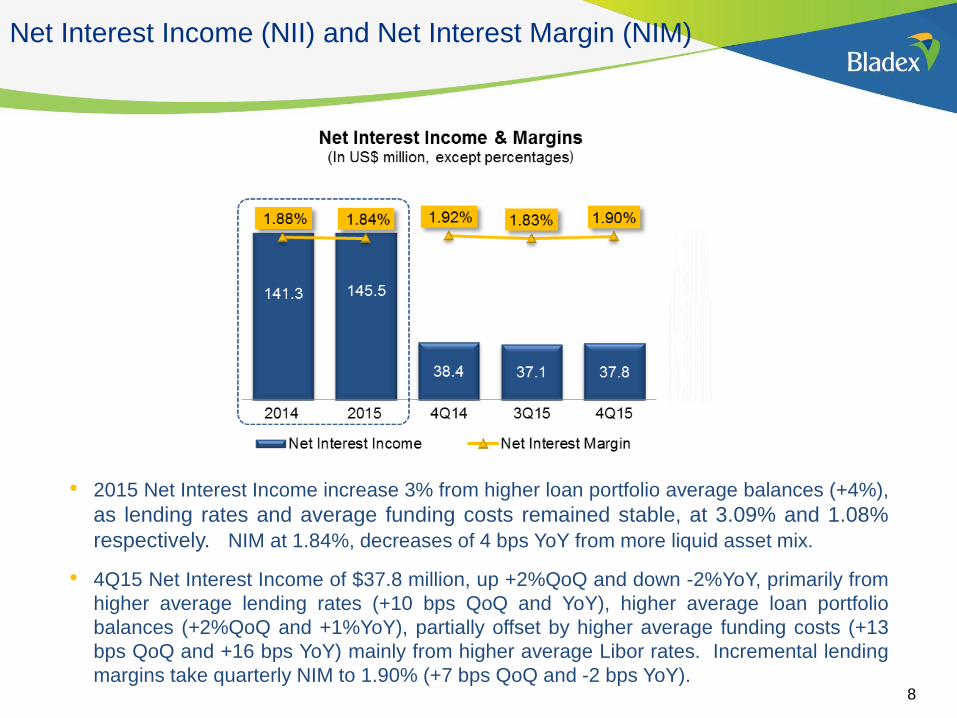
Net Interest Income (NII) and Net Interest Margin (NIM)
• 2015 Net Interest Income increase 3% from higher loan portfolio average balances (+4%),
as lending rates and average funding costs remained stable, at 3.09% and 1.08%
respectively. NIM at 1.84%, decreases of 4 bps YoY from more liquid asset mix.
• 4Q15 Net Interest Income of $37.8 million, up +2%QoQ and down -2%YoY, primarily from
higher average lending rates (+10 bps QoQ and YoY), higher average loan portfolio
balances (+2%QoQ and +1%YoY), partially offset by higher average funding costs (+13
bps QoQ and +16 bps YoY) mainly from higher average Libor rates. Incremental lending
margins take quarterly NIM to 1.90% (+7 bps QoQ and -2 bps YoY). 8
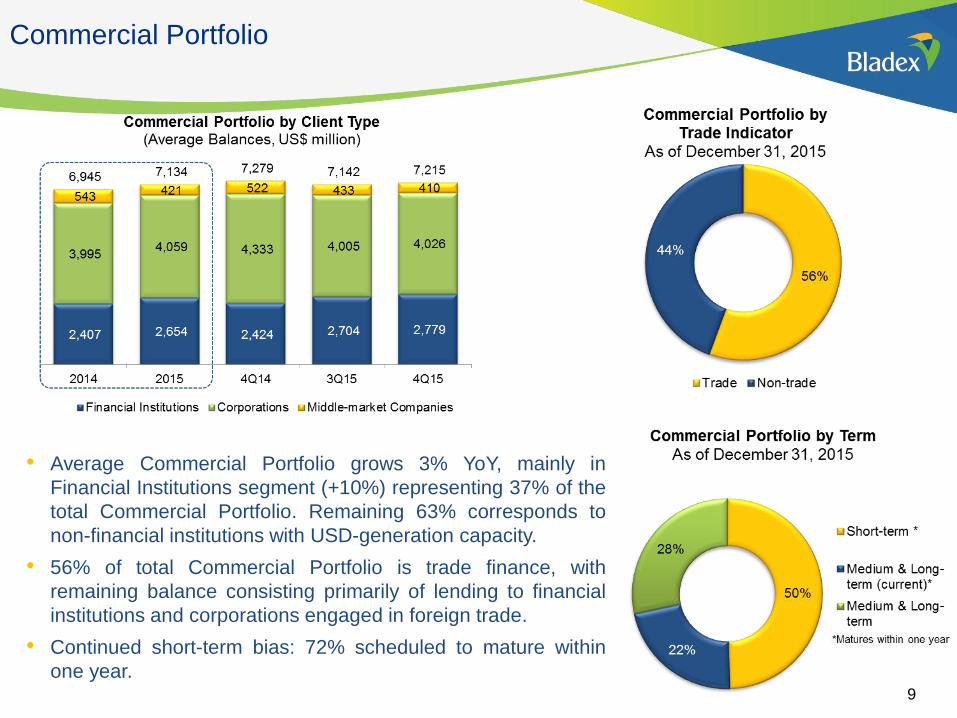
Commercial Portfolio
• Average Commercial Portfolio grows 3% YoY, mainly in
Financial Institutions segment (+10%) representing 37% of the
total Commercial Portfolio. Remaining 63% corresponds to
non-financial institutions with USD-generation capacity.
• 56% of total Commercial Portfolio is trade finance, with
remaining balance consisting primarily of lending to financial
institutions and corporations engaged in foreign trade.
• Continued short-term bias: 72% scheduled to mature within
one year. 9

Commercial Portfolio Exposure By Country and By Industry
• Broadly diversified across countries & industries.
• Brazil exposure at 23% of Commercial Portfolio, down from 25% in 3Q2015 (-2 ppts.
QoQ), and from 28% in 4Q2014 (-5 ppts. YoY).
• Growth focus shifted primarily to Central American & Caribbean Region (+4 ppts. QoQ
and +8 ppts. YoY).
• Exposure to financial institutions at 39%, unchanged from prior quarter (+3 ppts. YoY).
Overall exposure to Oil and Gas industry reduced to 12%, -3 ppts.YoY and -1ppts. QoQ. 10
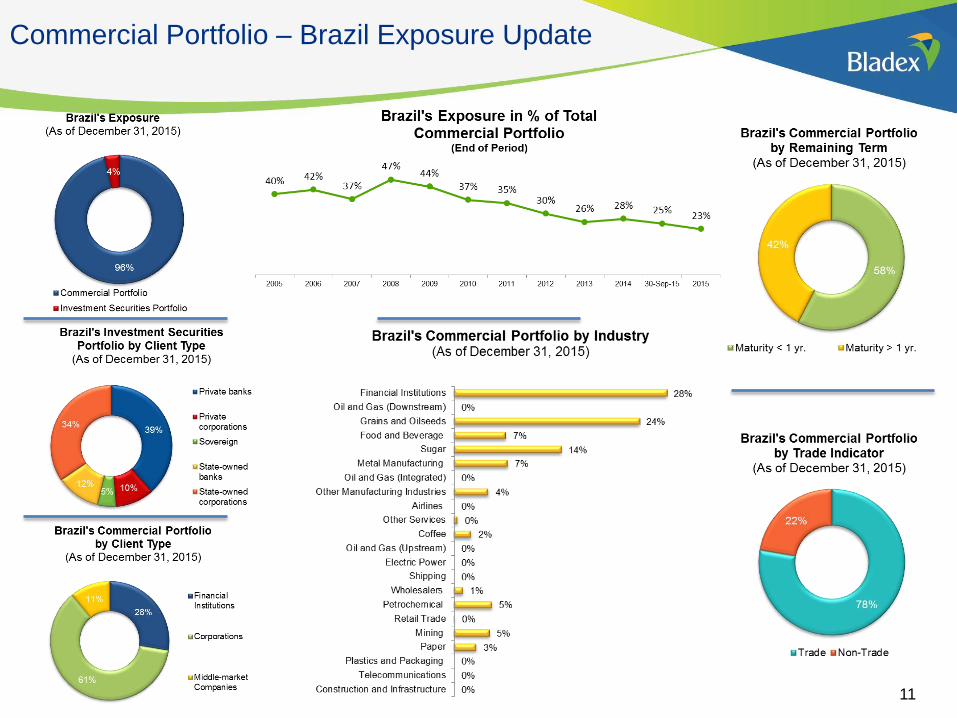
Commercial Portfolio – Brazil Exposure Update
11

Upstream Integrated Downstream
Clients primarily focused on
Exploration
Production
Clients focused on:
Full Value chain,
from Upstream to
Downstream
Clients primarily focused on
Refining
Storage
Distribution
Oil & Gas Exposure Analysis
Bladex Outlook Negative Stable Positive
Rationale for Outlook • Lower prices/margins
• Reduced cash flows
• Reduced investment
• Upstream impact mitigated by
positive outlook in
downstream activities
• Better refining margins
• Cost efficiency gains
Bladex Credit Exposure:
• Includes Commercial
Portfolio + Treasury Portfolio
(nominal values).
* Y/E 2015 Update:
• Total duration of 8 months
• 7.1% is related to Treasury
Portfolio.
• 88% of Bonds are sovereign
risk (Brazil, Chile, Colombia,
Mexico, Trinidad & Tobago).
• $176MM
• 2% of Total Credit Portfolio
• 18% of O&G Exposure
• Increase in credit
risk/impairment in securities
• Concerted lender actions
• Mitigating factors:
Diversification in Gas
More Competitive Cost
Base
Pre-payment of longer
dated disbursed loans
50% of exposure is
contingent only (SBLCs)
• $373MM
• 5% of Total Credit Portfolio
• 39% of O&G Exposure
• Import/export transactions
• Mitigating factors:
Strategic relevance / quasi-
gov´t entities
Local fuel price regimes
not tied to crude price
evolution
• $412MM
• 6% of Total Credit Portfolio
• 43% of O&G Exposure
• Import transactions
• Mitigating factors:
Strategic relevance / quasi-
gov´t entities
Local fuel price regimes
not tied to crude price
evolution
Bladex exposure continues downward trend, with bias towards
quasi-sovereigns and Integrated/Downstream market spectrum 12
Oil & Gas Credit Exposure
Year Credit Exposure
(USD MM) % / Bladex Credit
Exposure
2015* 961 13%
2014 1,117 15%
2013 1,206 17%
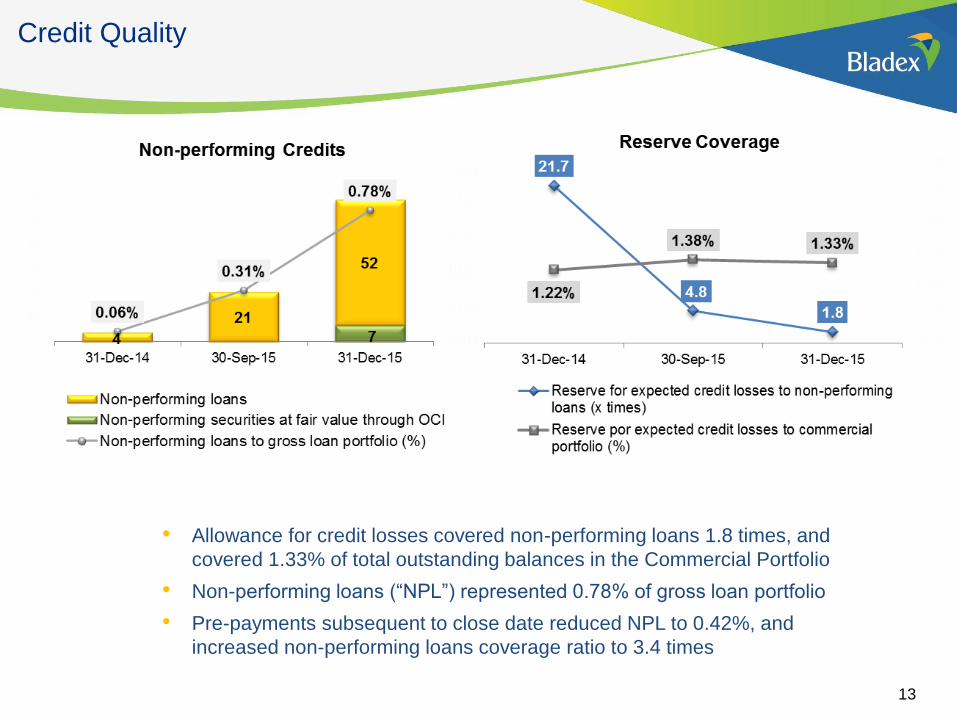
Credit Quality
• Allowance for credit losses covered non-performing loans 1.8 times, and
covered 1.33% of total outstanding balances in the Commercial Portfolio
• Non-performing loans (“NPL”) represented 0.78% of gross loan portfolio
• Pre-payments subsequent to close date reduced NPL to 0.42%, and
increased non-performing loans coverage ratio to 3.4 times
13

Off-balance Sheet Assets & Commission
and Intermediation Income
• Fees & Other Income increase 2% YoY, with higher fee
income from higher commissions from the L/C and
contingency business, and fees from structuring and
syndication activities, partially offset by lower loan
distribution activity in the secondary markets.
• 7 syndicated/club deal transactions totaling $612
million executed in 2015. Solid pipeline of prospective
transactions for 2016.
• 6% QoQ decrease mostly from lower loan structuring
and distribution fees, offsetting increased gain on sale
of loans. Income from letters of credit and
contingencies business remained relatively stable QoQ. 14
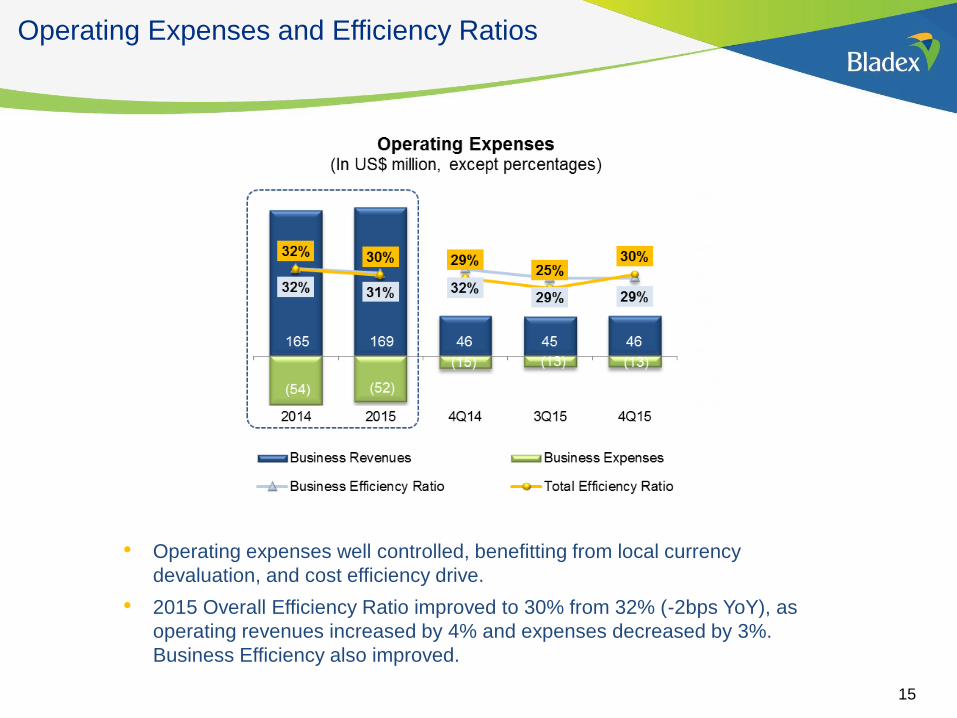
Operating Expenses and Efficiency Ratios
• Operating expenses well controlled, benefitting from local currency
devaluation, and cost efficiency drive.
• 2015 Overall Efficiency Ratio improved to 30% from 32% (-2bps YoY), as
operating revenues increased by 4% and expenses decreased by 3%.
Business Efficiency also improved.
15

ROAE and Capitalization
• QoQ ROAE drop attributable to losses from
participation in investment funds and higher
provision for expected credit losses on loans
and off-balance sheet financial instruments
and impairment losses from expected credit
losses on investment securities.
• 2015 ROAE fairly stable at 11.0% compared
to 11.5% in 2014
• Tier 1 Basel III capitalization strengthens to
16.1% with reduction of RWA
16

Shareholder Returns
•Bladex’s stock price performance
down 10% in 2015, outperforming
most indices (e.g. MSCI Latam,
IBOV). Total Shareholder Return
-9% for twelve trailing months.
•Attractive stock valuation at 9.7x
(P/EPS) and 1.0x (P/BV) at Y/E
2015.
•Stable dividend with yield well in
excess of 5%.
17

Questions & Answers
18
Appendix
19
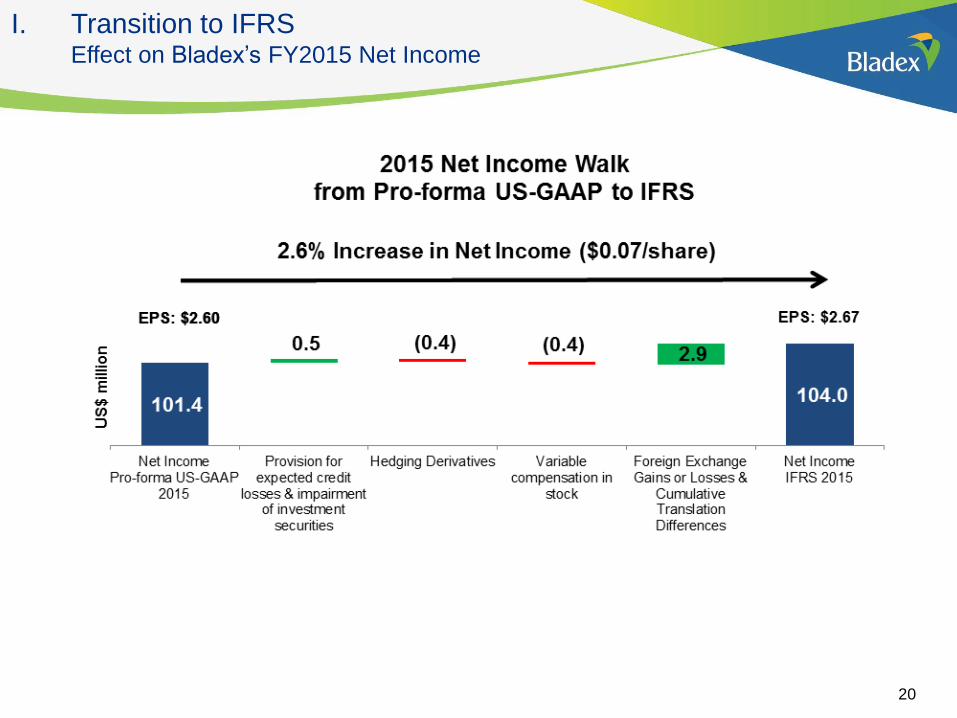
I. Transition to IFRS Effect on Bladex’s FY2015 Net Income
20

I. Transition to IFRS Effect on Bladex’s Statement of Financial Position
21

Thank You!
22