Blackwell Publishing LtdComparative phylogeography of
20
Molecular Ecology (2008) 17, 2397–2416 doi: 10.1111/j.1365-294X.2008.03741.x © 2008 The Authors Journal compilation © 2008 Blackwell Publishing Ltd Blackwell Publishing Ltd Comparative phylogeography of codistributed species of Chilean Liolaemus (Squamata: Tropiduridae) from the central-southern Andean range PEDRO F. VICTORIANO,* JUAN CARLOS ORTIZ,* EDGAR BENAVIDES,† BYRON J. ADAMS‡ and JACK W. SITES JR† *Departamento de Zoología, Facultad de Ciencias Naturales y Oceanográficas, C.I.E.P. Universidad de Concepción, Casilla 160-C, Concepción, Chile, †Department of Biology and M.L. Bean Life Science Museum, Brigham Young University, Provo, UT 84602, USA, ‡Department of Microbiology and Molecular Biology, and Evolutionary Ecology Laboratories, Brigham Young University, Provo, UT 84602, USA Abstract In this study, we used a recently developed supertrees method to test for shared phylogeo- graphical signal in partially overlapping geographical ranges of lizards of the genus Liolaemus from the Andean Range in south-central Chile. We reconstruct mtDNA gene trees for three partially codistributed species (Liolaemus tenuis, L. lemniscatus and L. pictus), and our sampling effort is sufficient to allow statistical tests of shared signal between the combinations L. tenuis–L. pictus, and L. tenuis–L. lemniscatus. For both combinations, standardized maximum agreement subtrees scores showed statistically significant signal for shared pattern in regions of overlap, as evaluated by randomization tests (P< 0.001 and < 0.05, respectively). The matrix representation with parsimony tree obtained from the com- bination of the three different gene trees revealed concordant phylogeographical associations of all species, and was consistent with the geographical association of intraspecific haploclades with three Chilean bioclimatic zones. A multidimensional scaling analysis of several climate variables showed highly significant differences among these zones, which further suggests that they may have contributed to similar patterns of intraspecific divergence across all three species. In the mesomorphic zone in Central Chile, the species L. tenuis and L. lemniscatus may have codiverged in response to shared orogenic vicariant events, which likely predominated over climatic events associated with cycles of glacial advance and retreat. In the hygromorphic zone in southern Chile, however, glacial cycles likely predominated in structuring the phylogeographical histories of L. tenuis and L. pictus, although important ecological differences between these two caution against broad generalizations at this point. Keywords: Andes, Chile, comparative phylogeography, Liolaemus, lizard, maximum agreement subtrees, mtDNA Received 15 September 2007; revision accepted 18 February 2008 Introduction Comparative phylogeography is becoming an increasingly important subdiscipline of biogeography focused on recon- struction of the evolutionary history of ecological associations and communities on a regional scale (Bermingham & Moritz 1998; Arbogast & Kenagy 2001). The methods of comparative phylogeography typically do this in two steps; the first is to reconstruct the evolutionary histories of two or more codistributed species within a region of interest, and then determine whether some parts of these shared histories reflect common responses to the same historical events. While the first step of this general approach (phylogenetic inference) is relatively well-developed, the actual comparative component of evaluating evolu- tionary histories of multiple species for signal of a shared response to the same historical events (orogenies, marine Correspondence: Pedro F. Victoriano, Departamento de Zoología, Facultad de Ciencias Naturales y Oceanográficas, Barrio Univer- sitario, Casilla 160-C, Universidad de Concepción, Concepción, Chile. Fax: 56 412 389 82; E-mail: [email protected]
Transcript of Blackwell Publishing LtdComparative phylogeography of

Molecular Ecology (2008) 17, 2397–2416 doi: 10.1111/j.1365-294X.2008.03741.x
© 2008 The AuthorsJournal compilation © 2008 Blackwell Publishing Ltd
Blackwell Publishing LtdComparative phylogeography of codistributed species of Chilean Liolaemus (Squamata: Tropiduridae) from the central-southern Andean range
PEDRO F. VICTORIANO,* JUAN CARLOS ORTIZ,* EDGAR BENAVIDES,† BYRON J . ADAMS‡ and JACK W. S ITES JR†*Departamento de Zoología, Facultad de Ciencias Naturales y Oceanográficas, C.I.E.P. Universidad de Concepción, Casilla 160-C, Concepción, Chile, †Department of Biology and M.L. Bean Life Science Museum, Brigham Young University, Provo, UT 84602, USA, ‡Department of Microbiology and Molecular Biology, and Evolutionary Ecology Laboratories, Brigham Young University, Provo, UT 84602, USA
Abstract
In this study, we used a recently developed supertrees method to test for shared phylogeo-graphical signal in partially overlapping geographical ranges of lizards of the genusLiolaemus from the Andean Range in south-central Chile. We reconstruct mtDNA gene treesfor three partially codistributed species (Liolaemus tenuis, L. lemniscatus and L. pictus),and our sampling effort is sufficient to allow statistical tests of shared signal between thecombinations L. tenuis–L. pictus, and L. tenuis–L. lemniscatus. For both combinations,standardized maximum agreement subtrees scores showed statistically significant signalfor shared pattern in regions of overlap, as evaluated by randomization tests (P < 0.001 and< 0.05, respectively). The matrix representation with parsimony tree obtained from the com-bination of the three different gene trees revealed concordant phylogeographical associationsof all species, and was consistent with the geographical association of intraspecific haplocladeswith three Chilean bioclimatic zones. A multidimensional scaling analysis of several climatevariables showed highly significant differences among these zones, which further suggeststhat they may have contributed to similar patterns of intraspecific divergence across all threespecies. In the mesomorphic zone in Central Chile, the species L. tenuis and L. lemniscatus mayhave codiverged in response to shared orogenic vicariant events, which likely predominatedover climatic events associated with cycles of glacial advance and retreat. In the hygromorphiczone in southern Chile, however, glacial cycles likely predominated in structuring thephylogeographical histories of L. tenuis and L. pictus, although important ecologicaldifferences between these two caution against broad generalizations at this point.
Keywords: Andes, Chile, comparative phylogeography, Liolaemus, lizard, maximum agreementsubtrees, mtDNA
Received 15 September 2007; revision accepted 18 February 2008
Introduction
Comparative phylogeography is becoming an increasinglyimportant subdiscipline of biogeography focused on recon-struction of the evolutionary history of ecological associationsand communities on a regional scale (Bermingham &
Moritz 1998; Arbogast & Kenagy 2001). The methods ofcomparative phylogeography typically do this in twosteps; the first is to reconstruct the evolutionary historiesof two or more codistributed species within a region ofinterest, and then determine whether some parts of theseshared histories reflect common responses to the samehistorical events. While the first step of this general approach(phylogenetic inference) is relatively well-developed,the actual comparative component of evaluating evolu-tionary histories of multiple species for signal of a sharedresponse to the same historical events (orogenies, marine
Correspondence: Pedro F. Victoriano, Departamento de Zoología,Facultad de Ciencias Naturales y Oceanográficas, Barrio Univer-sitario, Casilla 160-C, Universidad de Concepción, Concepción,Chile. Fax: 56 412 389 82; E-mail: [email protected]

2398 P. F. V I C TO R I A N O E T A L .
© 2008 The AuthorsJournal compilation © 2008 Blackwell Publishing Ltd
transgressions, glacial cycles, volcanism, etc.) has untilrecently been largely descriptive and qualitative. This isbeginning to change as new methodologies permit tests ofa priori hypotheses in regions where sufficient backgroundinformation permits the formulation of explicit alternativesthat can be distinguished with statistical rigor (Carstenset al. 2005). Continued refinement of methods will be extre-mely useful for exploring different models of speciationand other historical processes (Carstens & Richards 2007),and also for identifying areas of endemism, highspecies richness, and geographical foci of evolutionaryprocesses for conservation planning (Moritz 2002; Rissleret al. 2006).
Ideal study systems include taxa that share broadlyoverlapping distributions and a common history in thesame region for a sufficient time to accumulate signaltracking the history (Zink 2002). In these cases, congruentpatterns of evolutionary divergence will be evident inthe phylogenies of the codistributed species if the sharedsignal has not been erased by more recent, species-specificidiosyncratic events. The strongest evidence for sharedsignal requires divergence in both spatial and temporalcontexts (Donoghue & Moore 2003).
One challenge to obtaining estimates of spatial divergencehas been the requirement that taxa be codistributed, butrecent methods accommodate statistical tests of sharedphylogeographical signal between taxa having only partiallyoverlapping geographical distributions using a supertreeapproach (Lapointe & Rissler 2005; see Bininda-Emonds2004 for a general review of supertrees). Here, we applythis approach (LR05 hereafter) to three species of Liolaemusfrom the complex landscapes comprising the Pacific flankof the Andean Range in south-central Chile. This requiresthat we: (i) obtain well-resolved and strongly supportedhypotheses of relationships within each of the three speciesof Liolaemus based on reasonable sampling throughouttheir ranges; and (ii) use these genealogies to implementthe LR05 approach to see if any combinations of speciesshow significant spatial codivergence. Even with a findingof spatial codivergence, we recognize that we cannot dis-criminate among all possible alternative explanationsfor a shared pattern. Rather, we consider this a ‘hypothesis-generating’ study in the context described by Avila et al.(2006); in poorly known taxa and/or regions for whichbackground data are insufficient to generate plausible alter-native a priori hypotheses, ‘first pass’ studies are needed togenerate one or more plausible hypotheses. These maythen be followed by studies that require collection of multipleclasses of data [i.e. nuclear genes (Carsten & Knowles 2007),bioclimatic or palaeo-ecological variables (Hugall et al. 2002;Carstens & Richards 2007), etc.], and then specifying andtesting a number of alternative historical hypotheses thatapproximate biological reality (but not so many that spuriousfindings become likely; Johnson & Omland 2004).
The study region and target species
The western slope of the central Chilean Andes exhibits somehistorical and physical features suitable for these kinds ofstudies because the region is characterized by extremetopographic relief, high species endemism in multiplegroups (Smith-Ramirez 2004), and it has experienced acomplex palaeoclimatic and geomorphological history. Someexamples are the tectonic uplift of the Andes over the last 23million years, beginning during the Miocene and continuingto the present (Ramos 1989), and periodic global coolingduring the Pleistocene (1.8 million years ago to14 000 yearsago) which produced multiple shifts in climate, landscape,and sea level. At maximum advance during this last glacialperiod, an ice sheet covered an extensive region of southernChile and would have excluded much of the terrestrialbiota from a large part of the southern Andes (Fig. 1). Severalspecies of squamate reptiles now occur in this area, andmany of these have almost certainly experienced the samepalaeoclimatic and geomorphological histories.
The lizard genus Liolaemus Wiegmann 1834, is representedin Chile by 76 recognized species, four of which are poly-typic and give a total of 85 taxa (Pincheira-Donoso & Núñez2005). The heterogeneity of the Chilean territory, with pro-nounced latitudinal and altitudinal climatic and ecologicalgradients, implies that widely distributed species of Liolaemusare adapted to very different environmental regimes. Thehigh species richness, high endemism, and the frequentlyobserved extensive intraspecific morphological variationin widely distributed species collectively suggests thatthis genus has been a dynamic group in an evolutionarysense — it has likely speciated extensively in response to acombination of recent and ancient tectonic and climaticchanges in this part of South America. Several species ofLiolaemus are abundant and have sympatric and sometimessyntopic distributions (Donoso-Barros 1966; Nuñez & Jaksic1992), and Chilean species represent several distinct cladesof the genus (Schulte et al. 2000). Furthermore, many speciesdiffer in key features of their life histories (habitat preference,parity mode, etc.), so closely related and distantly relatedspecies, with similar and different ecologies, often occurin sympatry. This collection of attributes makes the groupwell-suited for comparative phylogeographical studies.
Here, we chose three focal species for comparativephylogeographical study because of their accessibility inthe field, well-defined geographical distributions, and ahigh level of geographical codistribution between differentcombinations of species. The species include: Liolaemustenuis (Dumeril & Bibron 1837), Liolaemus pictus (Dumeril &Bibron (1837), and Liolaemus lemniscatus (Gravenhorst 1838).These species are phylogenetically members of the sameclade (i.e. the subgenus Liolaemus), but L. lemniscatus andL. tenuis are much more closely related to each other thaneither is to L. pictus (Schulte et al. 2000). Of these, the arboreal

C O M PA R AT I V E P H Y L O G E O G R A P H Y O F C H I L E A N L I O L A E M U S 2399
© 2008 The AuthorsJournal compilation © 2008 Blackwell Publishing Ltd
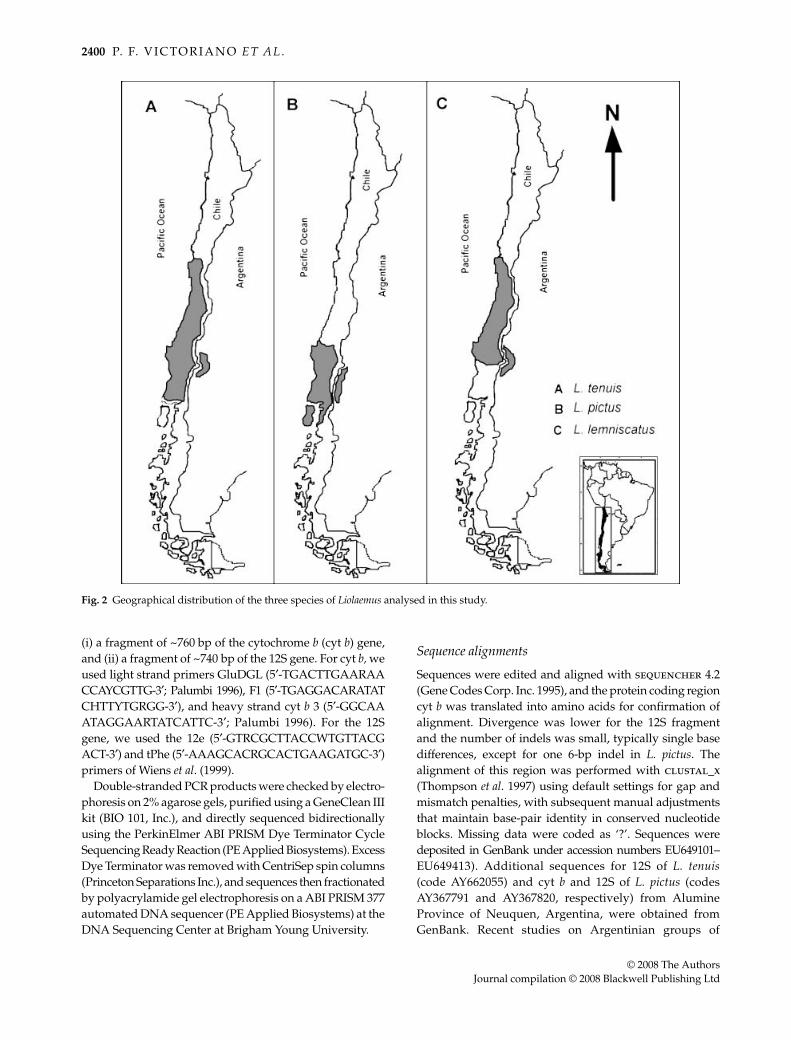
L. tenuis has the largest distribution, ranging from Coquimbo(29°58′S, 71°21′W) south to Los Lagos (39°51′S, 72°50′W;Fig. 2a), and altitudinally extending from sea level to 1800 m(Donoso-Barros 1966; Vidal et al. 2004, 2005a); this distributioncovers bioclimatic and ecological conditions rangingfrom Mediterranean to sub-Andean (Di Castri 1968), andincludes areas that were glaciated during the last glacialmaximum (LGM; Lowell et al. 1995). Its distribution is associ-ated with grassland and shrub habitats in the mesomorphiczone (Donoso-Barros 1966), and the species is oviparous(Cei et al. 2003).
The more terrestrial L. lemniscatus (also oviparous) isassociated with warmer and drier environments than L. tenuis(Lamborot & Ortiz 1990; Pincheira-Donoso & Nuñez 2005),
and ranges from La Serena (30°S) south to the Biobío River(38°S; Fig. 2c), and altitudinally from 250 to 1400 m. Finally,L. pictus ranges from the Biobío region (~37°S) south to ChiloéIsland (43°S; Fig. 2b), and ecologically from ~200–1700 m.It is an arboreal lizard found in the Nothofagus forest fromthe transitional to hygromorphic zones in Chile, and theconifer woodlands of southern Neuquen and northernRio Negro provinces in Argentina (Martins et al. 2004). Thisspecies is viviparous (Donoso-Barros 1966; Cei et al. 2003;Vidal et al. 2005b), and likely most tolerant of the threespecies to cold and humidity. This species is the most likelycandidate to persist during the LGM fragmentation (Vidalet al. 2005b).
These species overlap latitudinally from the Biobío region(~37°S) south to Llanquihue (~42°S), and two (L. tenuisand L. lemniscatus) overlap from Coquimbo (~30°S) to theBiobío River (Fig. 2). In combination, this represents in ashared latitudinal distribution of over 1000 km.
Materials and methods
Taxon sampling
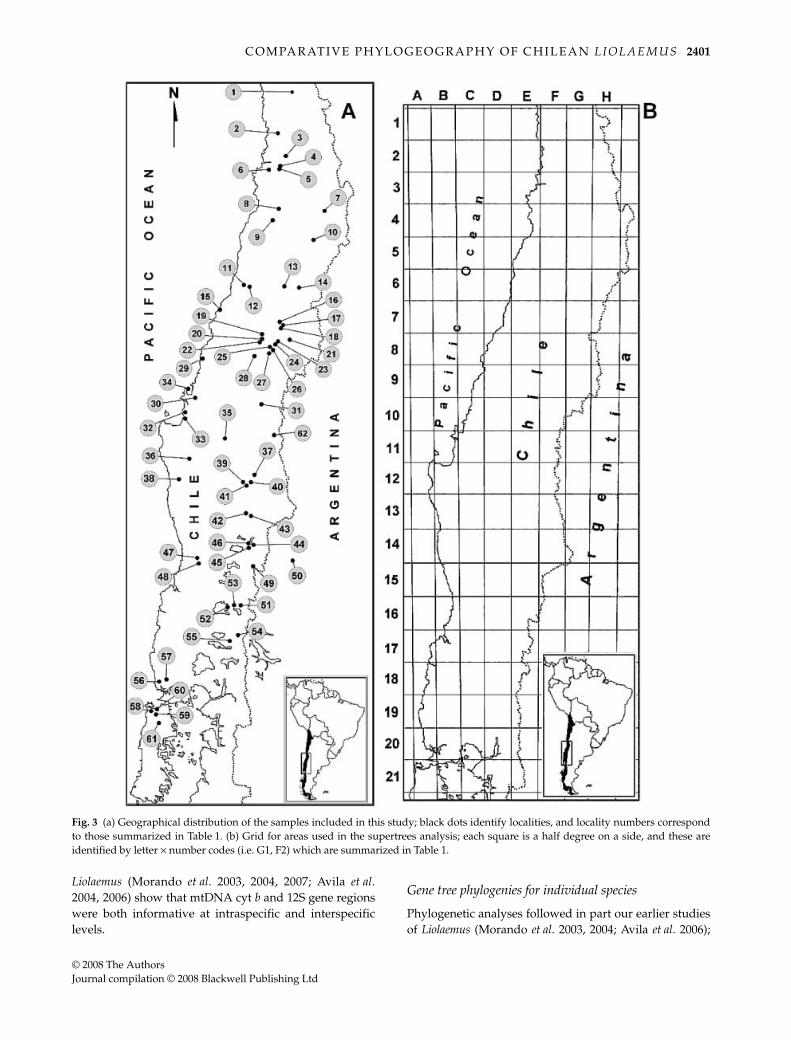
Lizards were collected in the field by hand or noose, euth-anized, and preserved as museum vouchers in the MonteL. Bean Life Science Museum at Brigham Young University(BYU), and in the Museo de Zoologia, Universidad deConcepción (MZUC). We collected a total of 278 lizards from61 localities (Fig. 3a) in the following species proportions:144 individuals of Liolaemus tenuis (from 41 localities), 82Liolaemus pictus (15 localities), and 52 Liolaemus lemniscatusfrom 14 sites (Table 1; Fig. 3a). Three species (Liolaemus chiliensis,Liolaemus cyanogaster and Liolaemus monticola) were chosenas outgroup taxa on the basis of relationships reported bySchulte et al. (2000). Table 1 summarizes the number ofindividuals collected per locality and other distributionalinformation for each species considered in this study.
Laboratory protocols
Total genomic DNA was extracted from muscle tissuepreserved in 96% ethanol, following the protocol developedby Fetzner (1999), and using the QIAGEN DNeasy tissuekit according to the standard protocol. Three microlitresof extraction products were separated by electrophoresison a 1% agarose gel to assess DNA quality, and sampleswere diluted if necessary before polymerase chain reaction(PCR) amplification. Two mitochondrial gene regions wereamplified via PCR in a ‘cocktail’ containing 2.0 μL oftemplate DNA (approximate concentration estimated on a2% agarose gel), 8 μL of dNTPs (1.25 mm), 4 μL of 10× Taqbuffer, 4 μL of each primer (10 μm), 4 μL of MgCl (25 mm),24 μL of distilled water and 0.25 μL of Taq DNA polymerase(5 U/μ) from Promega Corp. The gene regions used include
Fig. 1 Distribution of the ice shield during the LGM (dashed line)and the approximate latitudinal extent of the three Chileanbiogeographical zones (mesomorphic, transitional, and hygro-morphic) considered in this study.
2400 P. F. V I C TO R I A N O E T A L .
© 2008 The AuthorsJournal compilation © 2008 Blackwell Publishing Ltd
(i) a fragment of ~760 bp of the cytochrome b (cyt b) gene,and (ii) a fragment of ~740 bp of the 12S gene. For cyt b, weused light strand primers GluDGL (5′-TGACTTGAARAACCAYCGTTG-3′; Palumbi 1996), F1 (5′-TGAGGACARATATCHTTYTGRGG-3′), and heavy strand cyt b 3 (5′-GGCAAATAGGAARTATCATTC-3′; Palumbi 1996). For the 12Sgene, we used the 12e (5′-GTRCGCTTACCWTGTTACGACT-3′) and tPhe (5′-AAAGCACRGCACTGAAGATGC-3′)primers of Wiens et al. (1999).
Double-stranded PCR products were checked by electro-phoresis on 2% agarose gels, purified using a GeneClean IIIkit (BIO 101, Inc.), and directly sequenced bidirectionallyusing the PerkinElmer ABI PRISM Dye Terminator CycleSequencing Ready Reaction (PE Applied Biosystems). ExcessDye Terminator was removed with CentriSep spin columns(Princeton Separations Inc.), and sequences then fractionatedby polyacrylamide gel electrophoresis on a ABI PRISM 377automated DNA sequencer (PE Applied Biosystems) at theDNA Sequencing Center at Brigham Young University.
Sequence alignments
Sequences were edited and aligned with sequencher 4.2(Gene Codes Corp. Inc. 1995), and the protein coding regioncyt b was translated into amino acids for confirmation ofalignment. Divergence was lower for the 12S fragmentand the number of indels was small, typically single basedifferences, except for one 6-bp indel in L. pictus. Thealignment of this region was performed with clustal_x(Thompson et al. 1997) using default settings for gap andmismatch penalties, with subsequent manual adjustmentsthat maintain base-pair identity in conserved nucleotideblocks. Missing data were coded as ‘?’. Sequences weredeposited in GenBank under accession numbers EU649101–EU649413). Additional sequences for 12S of L. tenuis(code AY662055) and cyt b and 12S of L. pictus (codesAY367791 and AY367820, respectively) from AlumineProvince of Neuquen, Argentina, were obtained fromGenBank. Recent studies on Argentinian groups of
Fig. 2 Geographical distribution of the three species of Liolaemus analysed in this study.
C O M PA R AT I V E P H Y L O G E O G R A P H Y O F C H I L E A N L I O L A E M U S 2401
© 2008 The AuthorsJournal compilation © 2008 Blackwell Publishing Ltd
Liolaemus (Morando et al. 2003, 2004, 2007; Avila et al.2004, 2006) show that mtDNA cyt b and 12S gene regionswere both informative at intraspecific and interspecificlevels.
Gene tree phylogenies for individual species
Phylogenetic analyses followed in part our earlier studiesof Liolaemus (Morando et al. 2003, 2004; Avila et al. 2006);
Fig. 3 (a) Geographical distribution of the samples included in this study; black dots identify localities, and locality numbers correspondto those summarized in Table 1. (b) Grid for areas used in the supertrees analysis; each square is a half degree on a side, and these areidentified by letter × number codes (i.e. G1, F2) which are summarized in Table 1.
2402 P. F. V I C TO R I A N O E T A L .
© 2008 The AuthorsJournal compilation © 2008 Blackwell Publishing Ltd
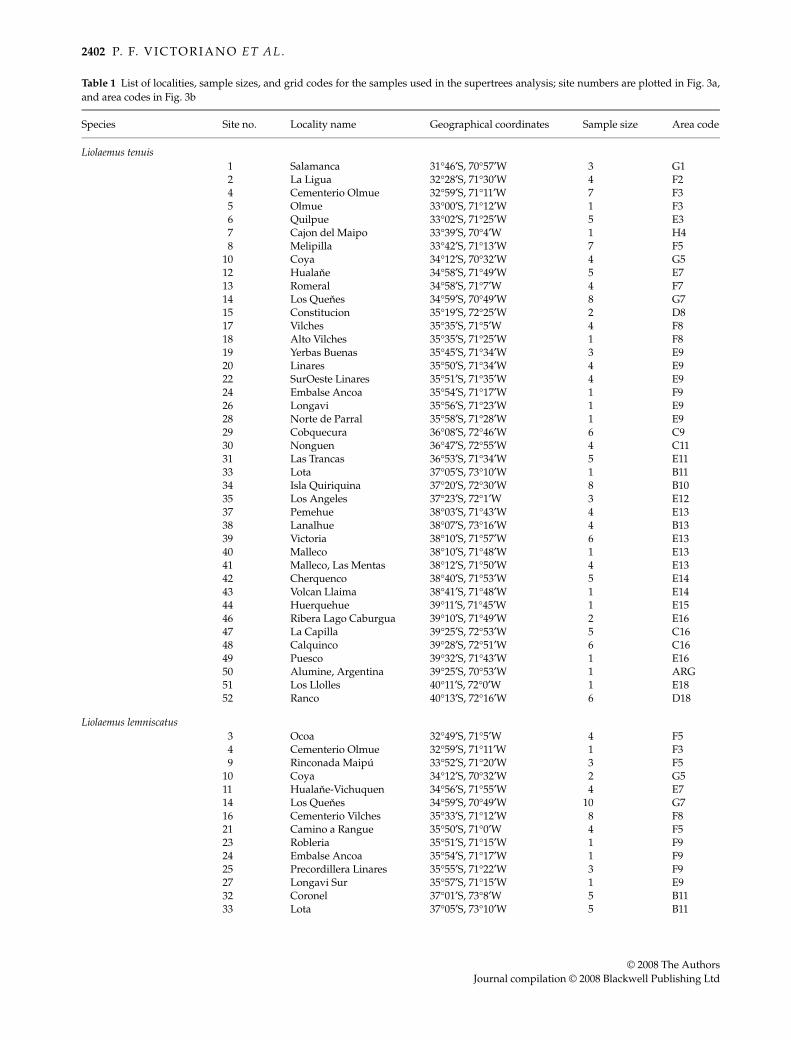
Table 1 List of localities, sample sizes, and grid codes for the samples used in the supertrees analysis; site numbers are plotted in Fig. 3a,and area codes in Fig. 3b
Species Site no. Locality name Geographical coordinates Sample size Area code
Liolaemus tenuis1 Salamanca 31°46′S, 70°57′W 3 G12 La Ligua 32°28′S, 71°30′W 4 F24 Cementerio Olmue 32°59′S, 71°11′W 7 F35 Olmue 33°00′S, 71°12′W 1 F36 Quilpue 33°02′S, 71°25′W 5 E37 Cajon del Maipo 33°39′S, 70°4′W 1 H48 Melipilla 33°42′S, 71°13′W 7 F5
10 Coya 34°12′S, 70°32′W 4 G512 Hualane 34°58′S, 71°49′W 5 E713 Romeral 34°58′S, 71°7′W 4 F714 Los Quenes 34°59′S, 70°49′W 8 G715 Constitucion 35°19′S, 72°25′W 2 D817 Vilches 35°35′S, 71°5′W 4 F818 Alto Vilches 35°35′S, 71°25′W 1 F819 Yerbas Buenas 35°45′S, 71°34′W 3 E920 Linares 35°50′S, 71°34′W 4 E922 SurOeste Linares 35°51′S, 71°35′W 4 E924 Embalse Ancoa 35°54′S, 71°17′W 1 F926 Longavi 35°56′S, 71°23′W 1 E928 Norte de Parral 35°58′S, 71°28′W 1 E929 Cobquecura 36°08′S, 72°46′W 6 C930 Nonguen 36°47′S, 72°55′W 4 C1131 Las Trancas 36°53′S, 71°34′W 5 E1133 Lota 37°05′S, 73°10′W 1 B1134 Isla Quiriquina 37°20′S, 72°30′W 8 B1035 Los Angeles 37°23′S, 72°1′W 3 E1237 Pemehue 38°03′S, 71°43′W 4 E1338 Lanalhue 38°07′S, 73°16′W 4 B1339 Victoria 38°10′S, 71°57′W 6 E1340 Malleco 38°10′S, 71°48′W 1 E1341 Malleco, Las Mentas 38°12′S, 71°50′W 4 E1342 Cherquenco 38°40′S, 71°53′W 5 E1443 Volcan Llaima 38°41′S, 71°48′W 1 E1444 Huerquehue 39°11′S, 71°45′W 1 E1546 Ribera Lago Caburgua 39°10′S, 71°49′W 2 E1647 La Capilla 39°25′S, 72°53′W 5 C1648 Calquinco 39°28′S, 72°51′W 6 C1649 Puesco 39°32′S, 71°43′W 1 E1650 Alumine, Argentina 39°25′S, 70°53′W 1 ARG51 Los Llolles 40°11′S, 72°0′W 1 E1852 Ranco 40°13′S, 72°16′W 6 D18
Liolaemus lemniscatus3 Ocoa 32°49′S, 71°5′W 4 F54 Cementerio Olmue 32°59′S, 71°11′W 1 F39 Rinconada Maipú 33°52′S, 71°20′W 3 F5
10 Coya 34°12′S, 70°32′W 2 G511 Hualane-Vichuquen 34°56′S, 71°55′W 4 E714 Los Quenes 34°59′S, 70°49′W 10 G716 Cementerio Vilches 35°33′S, 71°12′W 8 F821 Camino a Rangue 35°50′S, 71°0′W 4 F523 Robleria 35°51′S, 71°15′W 1 F924 Embalse Ancoa 35°54′S, 71°17′W 1 F925 Precordillera Linares 35°55′S, 71°22′W 3 F927 Longavi Sur 35°57′S, 71°15′W 1 E932 Coronel 37°01′S, 73°8′W 5 B1133 Lota 37°05′S, 73°10′W 5 B11

C O M PA R AT I V E P H Y L O G E O G R A P H Y O F C H I L E A N L I O L A E M U S 2403
© 2008 The AuthorsJournal compilation © 2008 Blackwell Publishing Ltd
Liolaemus pictus36 Nahuelbuta 37°47′S, 73°3′W 3 B1341 Malleco, Las Mentas 38°12′S, 71°50′W 10 E1343 Volcan Llaima 38°41′S, 71°48′W 11 E1445 Huerquehue Sur 39°12′S, 71°46′W 2 E1650 Alumine, Argentina 39°25′S, 70°53′W 1 ARG51 Los Llolles 40°11′S, 72°0′W 3 E1852 Ranco 40°13′S, 72°16′W 1 D1853 Maihue 40°12′S, 72°6′W 2 E1854 Puyehue 40°41′S, 72°0′W 4 E1955 Antillanca 40°46′S, 72°12′W 11 D1956 Sur Oeste Estaquillas 41°27′S, 73°44′W 9 A2057 Estaquillas 41°26′S, 73°41′W 3 A2058 Este de Ancud 41°55′S, 73°54′W 7 A2159 Sur de Ancud 41°55′S, 73°50′W 7 A2160 Ancud 41°56′S, 73°53′W 2 A2161 Belben 42°04′S, 73°45′W 6 A21
Outgroups:Liolaemus cyanogaster 29 Cobquecura 36°08′S, 72°46′W 2 C9Liolaemus chiliensis 31 Las Trancas 36°53′S, 71°34′W 1 E11Liolaemus monticola 62 Volcan Antuco 37°21′S, 71°6′W 1 F12
Species Site no. Locality name Geographical coordinates Sample size Area code
Table 1 Continued
redundant haplotypes were identified using collapse(version 1.1; available at: http://biology.byu.edu/faculty/kac/crandall_lab/computer.html), and removed from theirrespective data matrices. Both single gene regions and thecombined data set (~1500 bp for both gene regions) were usedfor Bayesian and maximum-likelihood (ML) phylogeneticanalyses on the nonredundant sequence matrixes. Treesobtained from analyses of individual gene regions andcombined data sets showed almost identical topologies,and none recovered strongly supported topological conflicts(Wiens 1998) within any species, so only results of the com-bined analyses are included here. The program modeltest(version 3.04; Posada & Crandall 1998) was used to selectthe best-fitting model of evolution (Akaike criterion; Posada& Buckley 2004), for each gene region within each species.Two models were selected for cyt b; for L. tenuis, the modelwas TrN + I + Γ, while for L. lemniscatus and L. pictus themodel was K81uf + I + Γ. For 12S (run separately and in thecombined data set), the general time reversible modelwith invariable and variable sites with a discrete gammadistribution (GTR + I + Γ; Yang 1994) was selected as thebest-fit model for all species. All ML analyses were basedon heuristic searches with 10 random addition replicates,maxtrees = 100, and tree-bisection–reconnection (TBR)branch-swapping algorithm, as implemented in paup(Swofford 2002). ML bootstrap (MLB) proportions wereobtained by performing five separate searches with 20random addition replicates each, and then combining thetotal 100 pseudoreplicates to obtain one MLB value.
Bayesian analyses were performed using mrbayes 2.0(Huelsenbeck & Ronquist 2001), based on the same modelsused for the ML searches. For each species, we carried out runsfor 5 million generations, with four incrementally heatedchains, and then sampled at intervals of 1000 generationsto include 5000 data points. Stationarity was estimated byplotting (with Microsoft Excel 2003) the log-likelihood scoresagainst generation time, and assuming stationarity whenthe curves flattened out. This phase was reached between 30 000and 40 000 generations, depending on the species. Then,we discarded the first 30–40 trees (burn-in), and the 50%majority-rule trees were obtained from the remaining 4970–4960 data points with the purpose of obtaining the posteriorprobability (PP) values. To avoid local entrapment on a sub-optimal peak in the tree space, we performed two independentanalyses, and compared these for convergence to similarlog-likelihood mean values (Huelsenbeck & Bollback 2001;Leaché & Reeder 2002). We also compared the posteriorprobabilities for individual clades obtained from the separateanalyses for congruence to ensure convergence of the twoanalyses. All phylogenetic analyses were performed on anIBM Sp2 supercomputer in the BYU supercomputing facility.
Additionally, we estimated several genetic diversityindexes for each species of Liolaemus by using all thesequences, both for each area indicated in Fig. 3b, andfor each main clade obtained from the phylogeneticanalysis. We estimated the haplotype (= gene) diversity(Hd; Nei 1987, p. 180) and nucleotide diversity (π, Nei 1987,p. 257) using dnasp 4.10 and mega 3.1, respectively.

2404 P. F. V I C TO R I A N O E T A L .
© 2008 The AuthorsJournal compilation © 2008 Blackwell Publishing Ltd
Comparative phylogeography among species
We used the phylogeographical hypotheses (individualphylogenetic trees) of the three species derived from thecombined data sets, as described above, to test for topologicalcongruence between relevant combinations of codistributedspecies. The LR05 method first uses maximum agreementsubtrees to represent overlapping geographical regionsrepresented in individual gene trees, and this requires thatoriginal data (gene trees for each species) be recoded todefine common regional units. We did this by subdividingthe sampling area into a grid system delimited as 0.25degree square latitude/longitude squares, and coding eachsquare with letters (longitude arrangement) and numbers(latitude arrangement; Fig. 3b). The sampling area includesthree zones described in general biogeographical classifica-tions of the Chilean territory (Pisano 1954; Mann 1964;Fig. 1a), so we further subdivided the grid into three zonescorresponding to the mesomorphic zone (c. 29°S to 36°S;rows 1–9 in Fig. 3b); transitional zone (c. 36°S to 38°S; rows10–13 in Fig. 3b); and hygromorphic zone (c. 38°S to 40°S;rows 14–21 in Fig. 3b). The geographical origins of allunique haplotypes were used to define intraspecific areacladograms for each species, where different areas codedin Fig. 3b were represented by one unique haplotype.
In each gene tree, all strongly supported [PP > 0.95(Leaché & Reeder 2002); MLB > 70 (Hillis & Bull 1993)]reciprocally monophyletic haploclades were pruned toa single representative sequence for each area, and thenthe individual haplotype names were replaced with theirrespective area names. The most basal haplotype in eachclade was designated the semaphoront taxon. Using paup*(Swofford 2002), a maximum agreement subtree (MAST)was established for each pairwise combination of areatrees; MASTs are appropriate to compare trees bearingdifferent numbers of ‘leaves’ representing partially over-lapping regions (grids in this study; see Lapointe & Rissler2005). For each pairwise comparison (of individual genetrees), the size of each MAST was used as a congruenceindex (the larger the MAST, the more congruent the twoarea trees are). These values were normalized for eachcomparison by dividing the size of the respective MAST bythe number of areas common to both trees, and then com-pared to the distribution frequency of the MAST scores of1000 randomly generated trees (Markov model) with anequal number of shared areas as the original MAST. Theconcordance of area trees was tested using treemap 1.0b(Page 1994) by treating co-occurring taxa as host–parasiteassociations. Congruence of area trees was inferred whenthe test was significant (i.e. larger than randomly generatedMAST scores, 95%, for P = 0.05). In order to test whethercoalescent events among codistributed taxa are correlated,times to coalescence (of codistributed taxa) for codiver-gent nodes (in units of genetic distance) were plotted
using treemap 1.0 (Page 1994). Each pair of codivergingnodes were compared using Spearman’s rho (two-tailed)test where N is the number of pairs of coalescing nodes(alpha = 0.05).
Pairs of area trees that were statistically more concordantthan expected by chance alone were combined using matrixrepresentation with parsimony (MRP with triple fit; seeBininda-Emonds 2004 for other kinds of supertrees); MRPwas chosen because it is not biased by the shape of the inputtrees (Wilkinson et al. 2005). The supertree summarizesgeographical areas that correspond to clade breaks inmultiple taxa with unique ecological and life-history char-acteristics, providing evidence for a shared history ofvicariant isolation or selection. This analysis was imple-mented using radcon version 1.1.6 (Thorley & Page 2000).Because influential physical factors may have played arole in generating such patterns, a second prediction madeby the LR05 method is that, if multiple source trees arecongruent (i.e. if they show signs of shared historicalprocesses), then phylogeographical regions defined in asupertree will be statistically different with respect to climaticvariables. In these tests, absence of congruence amongsource trees would lead to a supertree with no phylogeo-graphical signal and in turn, with no relationship to climaticfactors (Lapointe & Rissler 2005, p. 291).
To quantify climate variables for the geographical areasconsidered in the supertree, we used a multivariate analysisto summarize six variables recorded from 85 meteorolo-gical stations located throughout the study area (taken fromAmigo & Ramírez 1998). In areas represented by more thanone weather station, we used the most centrally locatedstation in each geographical area represented in the supertree.The climatic variables are: T, annual mean temperature;M, mean daily maximum temperature of the coldest month;m, mean daily minimum temperature of the coldest month;Ic, index of continentality or thermal amplitude (calculatedas the difference between the daily mean temperatures ofthe hottest and coldest months); P, mean annual precipitation;and Tp = above zero temperature index (the sum of all themonthly mean temperatures greater than 0°C, multipliedby 10).
A nonmetric multidimensional scaling (MDS) analysis,derived from Euclidean distance similarity matrices, wasused to visualize dissimilarities between the same areasincluded in the supertree (based in the six climatic variables).All data were log-transformed and normalized beforeanalysis. Each area was assigned to one of the three classicalbiogeographical zones for Chile, and this feature was con-sidered an independent factor in the analysis. The resultswere further tested for significance using analysis ofsimilarity (primer version 6 anosim; Clarke & Gorley 2005),which is analogous to a univariate anova and reflectsdifferences between treatment groups (the three Chileanbiogeographical zones) in contrast to differences among

C O M PA R AT I V E P H Y L O G E O G R A P H Y O F C H I L E A N L I O L A E M U S 2405
© 2008 The AuthorsJournal compilation © 2008 Blackwell Publishing Ltd
replicates within groups (the R statistic). Under the nullhypothesis (‘no difference between groups’), R = 0, and thiswas tested by a nonparametric permutation; there shouldbe little or no effect on the average R value if the labelsidentifying which replicates belong to which samples arerandomly rearranged (Clarke 1999). Finally, the primerversion 6 bio-env routine linking multivariate patterns wasused to identify ‘influential parameters’ on the arrangementobtained from MDS. This is a nonparametric correlationbetween two distance matrices. We obtained one matrixof distances between geographical areas in the supertreetopology from the number of steps between areas in thenonrooted supertree, and log-transformed these numbersbefore the analysis. The second matrix was based on thesame log-transformed and normalized climatic data usedin the previous MDS. The bio-env method assigns hierar-chical correlation values both to each individual climaticvariable and for combinations of them.
Results
General patterns of variation
We obtained 68 unique haplotypes (combined gene regions)for Liolaemus tenuis, and 59 and 37 nonredundant haplotypesfor Liolaemus pictus and Liolaemus lemniscatus, respectively.The ratio of unique haplotypes relative to the total numberof individuals sampled for each species was 0.46 for L. tenuis,0.71 for L. pictus, and 0.71 for L. lemniscatus. Weightingthese indicators by the total geographical area sampled(number of localities) gives a lower estimate of mtDNAhaplotype variability in L. tenuis (an average of 1.7 haplo-types per locality), compared to L. lemniscatus (2.64), andL. pictus (3.93).
Both the haplotype diversity (Hd) and the nucleotidediversity (π) values for each main clade and for each speciesare shown in Table 2 (values for each individual area aresummarized in Appendix). Liolaemus tenuis showed thelowest Hd value (0.928), while estimates were identicaland higher for L. lemniscatus and L. pictus, respectively.Different relative values were obtained for π, which washighest in L. tenuis (π = 0.074) and lowest in L. pictus
(π = 0.051). When calculated for the major clades in eachspecies (Table 2), a pattern of reduced genetic diversity insouthern clades was detected in all three species (cladesB2 in L. lemniscatus and L. pictus, and B in L. tenuis). Thehighest levels of variation were detected in clades B1 inL. lemniscatus and L. pictus, and in clade A1 in L. tenuis. Thelowest genetic diversity was obtained for the southernlocalities (Clade B) of L. tenuis (Hd = 0.624; π = 0.002).
Intraspecific phylogeographical structure
In all three species, the intraspecific consensus trees obtainedfrom Bayesian analyses of individual gene regions and thecombined data recovered nearly identical topologies, andthese trees were also topologically virtually identical to thosederived from the ML analyses. In cases of non-identicaltopologies, differences were due either to unresolved parts ofsome gene trees, or conflicting structure with weak nodalsupport (as estimated from PP and MLB values). We concludethat there is no evidence for significant conflict betweengene regions or methods within any of the species (followingWiens 1998), and present here the ML topologies with bothMLB and PP estimates of nodal support. In all three cases,alternative structure of outgroup rooting options alwaysrecovered monophyletic ingroup haplotypes with strongsupport (MLB = 100; PP = 1.0).
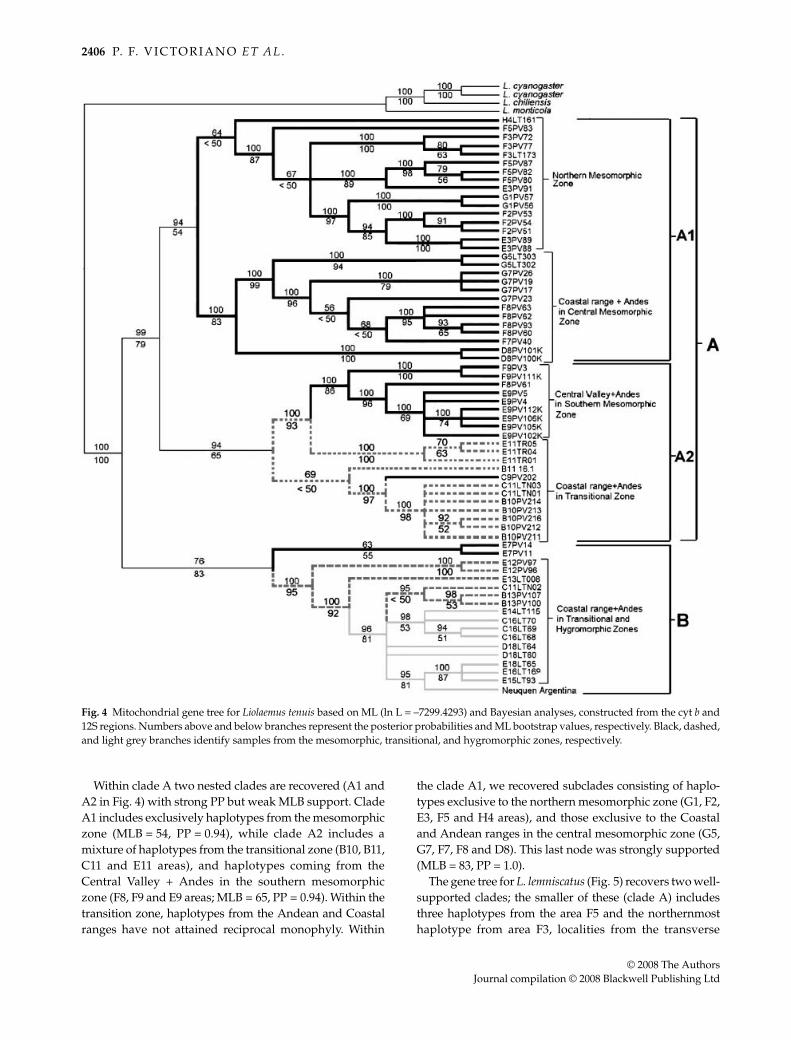
Figure 4 presents the consensus of two ML trees(ln L = –7299.4293) for L. tenuis, which is also representativeof the majority rule consensus of 9977 Bayesian trees (meanln L = –6981). Two large haploclades were recovered, themost strongly supported of which includes haplotypes fromthe mesomorphic and transitional zones (clade A; MLB = 79;PP = 0.99). The second less well-supported clade (B) includeshaplotypes from the hygromorphic Zone (including onesite in Argentina), some transitional zone haplotypes andtwo from the mesomorphic locality (E7 square). Withinthis arrangement, inclusion of the E7 area (clade B) wasuniquely inconsistent with its geographical location, butplacement of E7 in this clade receives only moderatesupport (MLB = 83, PP = 0.76). The subclade monophyleticfor haplotypes from the hygromorphic and transitionalZones is strongly supported (MLB = 95; PP = 1.0).
Table 2 Haplotype (gene) diversity/nucleotide diversity (π; ± S.D.), for the main clades in the three species of Liolaemus; clades areidentified in figures 4 to 6
Clade L. lemniscatus L. tenuis L. pictus
A 0.900 ± 0.161/0.022 ± 0.003 0.981 ± 0.005/0.060 ± 0.005 0.953 ± 0.031/0.019 ± 0.003A1 0.969 ± 0.010/0.040 ± 0.005A2 0.952 ± 0.019/0.052 ± 0.006B 0.988 ± 0.008/0.058 ± 0.005 0.624 ± 0.072/0.002 ± 0.001 0.985 ± 0.006/0.029 ± 0.004B1 0.986 ± 0.010/0.049 ± 0.004 0.972 ± 0.012/0.028 ± 0.004B2 0.778 ± 0.091/0.002 ± 0.001 0.952 ± 0.096/0.008 ± 0.002Total sp 0.985 ± 0.007/0.066 ± 0.005 0.928 ± 0.017/0.074 ± 0.007 0.985 ± 0.006/0.051 ± 0.005
2406 P. F. V I C TO R I A N O E T A L .
© 2008 The AuthorsJournal compilation © 2008 Blackwell Publishing Ltd
Within clade A two nested clades are recovered (A1 andA2 in Fig. 4) with strong PP but weak MLB support. CladeA1 includes exclusively haplotypes from the mesomorphiczone (MLB = 54, PP = 0.94), while clade A2 includes amixture of haplotypes from the transitional zone (B10, B11,C11 and E11 areas), and haplotypes coming from theCentral Valley + Andes in the southern mesomorphiczone (F8, F9 and E9 areas; MLB = 65, PP = 0.94). Within thetransition zone, haplotypes from the Andean and Coastalranges have not attained reciprocal monophyly. Within
the clade A1, we recovered subclades consisting of haplo-types exclusive to the northern mesomorphic zone (G1, F2,E3, F5 and H4 areas), and those exclusive to the Coastaland Andean ranges in the central mesomorphic zone (G5,G7, F7, F8 and D8). This last node was strongly supported(MLB = 83, PP = 1.0).
The gene tree for L. lemniscatus (Fig. 5) recovers two well-supported clades; the smaller of these (clade A) includesthree haplotypes from the area F5 and the northernmosthaplotype from area F3, localities from the transverse
Fig. 4 Mitochondrial gene tree for Liolaemus tenuis based on ML (ln L = –7299.4293) and Bayesian analyses, constructed from the cyt b and12S regions. Numbers above and below branches represent the posterior probabilities and ML bootstrap values, respectively. Black, dashed,and light grey branches identify samples from the mesomorphic, transitional, and hygromorphic zones, respectively.

C O M PA R AT I V E P H Y L O G E O G R A P H Y O F C H I L E A N L I O L A E M U S 2407
© 2008 The AuthorsJournal compilation © 2008 Blackwell Publishing Ltd
valleys of the northern mesomorphic zone (MLB = 94,PP = 0.99). The second clade (clade B; MLB = 85, PP = 1.0)resolves two well-supported subclades that are reciprocallymonophyletic with respect to geography. Clade B2 (MLB =100, PP = 1.0) includes only haplotypes from the CoastalRange in the transitional zone (area B11). Clade B1 is wellsupported (MLB = 85, PP = 0.96) and includes 29 uniquehaplotypes detected in this species, but none has sorted tomonophyly by geographical locality. Subclade B1.1 (weaklysupported) for example, includes haplotypes from theCoastal Range, transverse valleys, and the Andean Rangein the central mesomorphic zone (areas F5 and F9). Similarly,subclade B1.2 (more strongly supported) is a mix of geo-graphical areas: it includes haplotypes from the Coastal
Range, transverse valleys (both represented by area E7),and Andean Range (areas G5, G7, F8, and F9) of the centralmesomorphic zone. Two well-supported haploclades withinsubclade B1.2 correspond to latitudinal regions previouslyrecognized as distinct bioclimatic zones; one represents anorthern subgroup restricted to an area between 34°S and35°S latitude (E7, G5, G7), and the second includes haplo-types from areas F8 and F9, approximately between 35°S and36°S latitude. A unique haplotype from the Central Valleyin the central mesomorphic zone is the sister to clade B1.
All analyses for L. pictus recover two highly divergenthaploclades (A and B; Fig. 6). Clade A includes haplotypesfrom the Coastal Range, the Andean Range in the transi-tional zone, and more northern Andean areas from the hygro-
Fig. 5 Mitochondrial gene tree for Liolaemus lemniscatus based on ML (lnL = –6195.8893) and Bayesian analysis; numbers above and belowbranches, and branch shading are as found in Fig. 4.

2408 P. F. V I C TO R I A N O E T A L .
© 2008 The AuthorsJournal compilation © 2008 Blackwell Publishing Ltd
morphic zone, with strong support (MLB = 91, PP = 0.99).Clade B is comprised of haplotypes that are distributedexclusively in the hygromorphic zone, representing Andeanand Coastal areas, albeit with weak support (MLB = 51,PP = 0.74). Within clade B, six haplotypes from the mainlandcoastal area near Chiloé Island (A20; clade B2), are stronglysupported as distinct from all other sequences in clade B(MLB = 98, PP = 1.0). The monophyly of clade B1 receivesalmost no support (MLB < 50, PP = 0.69), but several ofits subclades do. For example, clade B1.1 is comprisedexclusively of Andean haplotypes from the southernhygromorphic zone (areas D18, D19, E16 and E18; Fig. 6;
MLB = 100, PP = 1.0), and another includes all A21 haplo-types from Chiloé Island in the Coastal hygromorphiczone. Clade B1.1 is weakly recovered as the sister clade toa haploclade including the area A20 sequences from thecoastal mainland adjacent to Chiloe Island, and the haplo-type from Neuquen, Argentina.
Comparative phylogeography
The size of the three area trees (areas coded in Fig. 3) was30 in L. tenuis, 11 in L. pictus and 10 in L. lemniscatus, for atotal of 34 areas represented overall. There were no areas
Fig. 6 Mitochondrial gene tree for Liolaemus pictus based in ML (lnL = –5816.3776) and Bayesian analysis; numbers above and belowbranches, and branch shading are as found in Figs 4 and 5.

C O M PA R AT I V E P H Y L O G E O G R A P H Y O F C H I L E A N L I O L A E M U S 2409
© 2008 The AuthorsJournal compilation © 2008 Blackwell Publishing Ltd
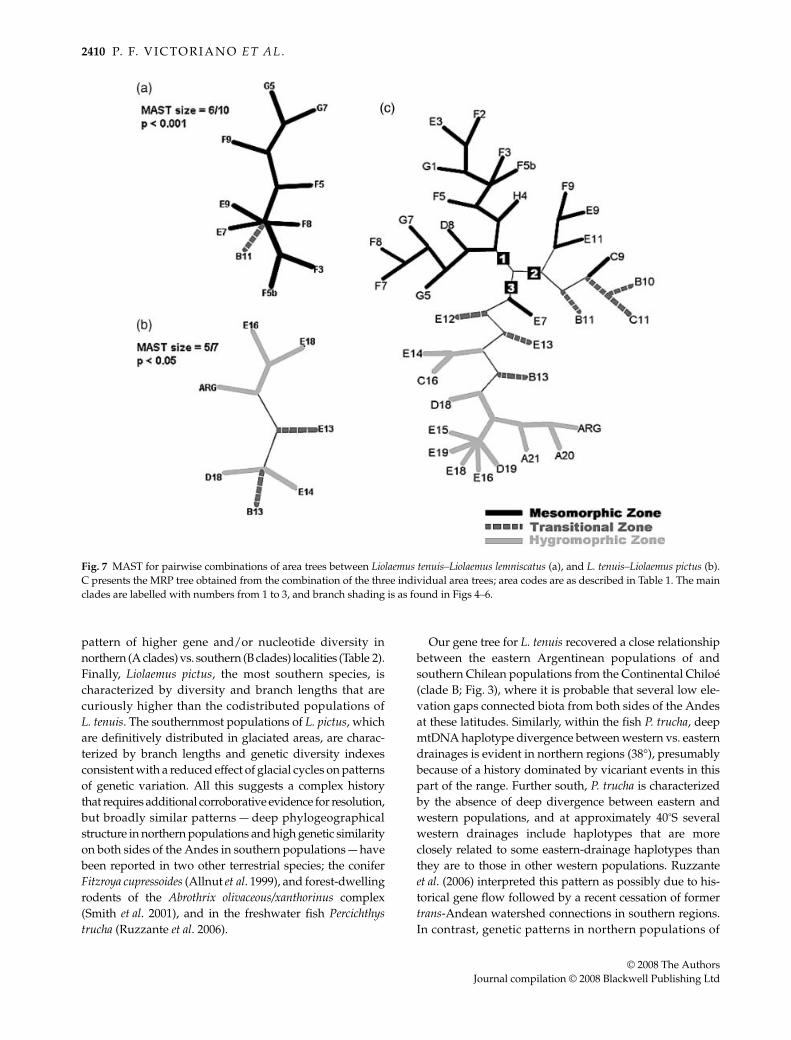
shared by all three species trees, but L. tenuis shared 10localities with L. lemniscatus and seven with L. pictus; L. pictusand L. lemniscatus did not co-occur at any of our samplinglocations. Plots of times to coalescence in units of geneticdistance for correlated codivergence events were notsignificant. Table 3 summarizes standardized MAST scoresfor the two species pairs sampled from regions of overlap.The mean value for the two standardized MAST scores is0.66; the comparison between L. tenuis and L. lemniscatusshows the higher value (0.71), and is highly significantby the randomization test (P < 0.001). The L. tenuis–L. pictusstandardized MAST value is 0.60, also significant (P < 0.05).The respective MAST for both comparisons are shownin Fig. 7(a,b). Both show a general trend of closely relatedhaplotypes occupying proximal geographical areas. Oneexception is area D18 in the L. tenuis–L. pictus MAST, whichis associated with the northern areas (B13 and E14). Becauseboth comparisons gave significant P values, we usedthem to generate a supertree representing the 34 sampledgeographical regions.
The MRP tree obtained from the combination of the threeindividual area trees is shown in Fig. 7c, and summarizesthe concordant phylogeographical associations of the speciesamong the 34 areas sampled. This MRP tree was consideredin the interpretation of the climatic variables analysed forthree Chilean bioclimatic zones (mesomorphic, transitionaland hygromorphic) defined by Mann (1964) and Pisano(1954). The MRP tree obtained from the Liolaemus haplotypesshows a topology clearly consistent with these a prioridefined bioclimatic zones. One haploclade occupies manyareas of the mesomorphic zone (root 1). Specifically, thosefrom the northern and central areas constitute a clade (D8to H4), latitudinally ranging from approximately 32°S to35°30′S. A second group includes areas from the southernmesomorphic zone (C9, E9, F9, E11) and some of those fromthe coastal transitional zone (B10, B11 and C11; root 2). Thethird group in the MRP tree includes all other areas fromthe transitional zone (Andean transitional zone, E12, B13and E13), all areas from the hygromorphic zone, and theperipheral Argentinean site (root 3). The single geograph-ical inconsistency detected is the association of the E7 areafrom mesomorphic zone within this third group, but in thetopology of the MRP tree, this area is near the root of this groupand close to the transitional areas in the second group.
The anosim analysis of the climatic variables revealshighly significant differences among groups of geographical
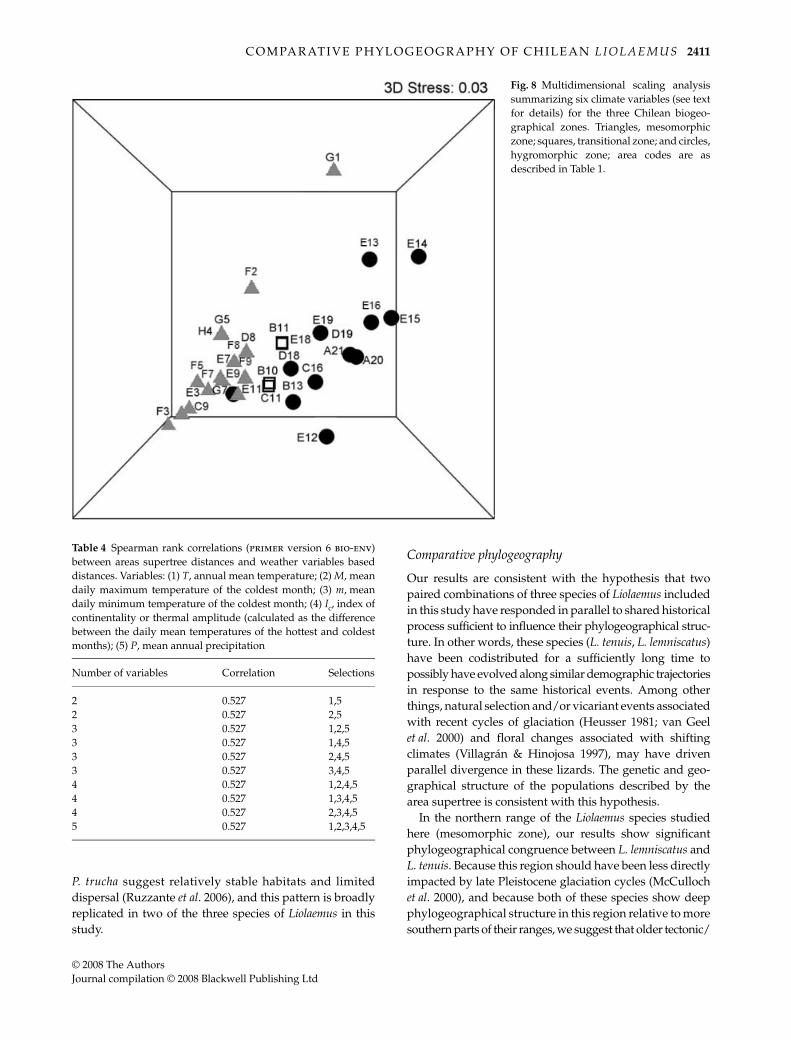
areas from the three bioclimatic zones (global R = 0.436;P < 0.001). Both comparisons involving the mesomorphiczone were statistically different; the mesomorphic–hygro-morphic comparison showed R = 0.463 (P < 0.001), andthe mesomorphic–transitional comparison gave R = 0.438(P < 0.05); there was no significant association for thehygromorphic–transitional comparison (R = 0.295; P > 0.05).These results suggest more pronounced climatic differencesbetween the mesomorphic and transitional zones thanbetween the hygromorphic and transitional zones. Figure 8presents the spatial arrangement of the 32 supertreegeographical areas in an MDS three-dimensional plot rep-resenting a multivariate summary of the climatic variables.The stress value for MDS was low (0.03), corresponding to agood fit for this kind of analysis (i.e. little distortion betweenthe original data and the scaling axes). The clusters ofpoints in the graph are generally consistent with the latitu-dinal position of the localities, and consequently with theChilean bioclimatic zones. The transitional points (squares)are clustered between the mesomorphic and hygromorphiczones, and the similarity patterns for the climatic variablesamong areas correspond to the genetic structure of thespecies phylogeographies represented in the supertree.Spearman rank correlations derived from the bio-envroutine indicated that five of the six weather parametersessentially captured the full MDS profile, and showedrelatively high correlation values between the supertreedistance matrix and the climate matrix (global R = 0.527,P < 0.001; Table 4).
Discussion
General patterns of divergence
We detected patterns of evolutionary relationships for eachLiolaemus species that are consistent with Chilean geography.Independently, for the three Liolaemus species analysed, thetopologies reflect latitudinal gradients. The general patternfor L. tenuis, the most broadly distributed, is a higher geneticdiversity, longer branch lengths and greater populationstructure in the mesomorphic zone, while the opposite isobserved for the periglacial and glacial populations. Liolaemuslemniscatus is mainly distributed in the Mesomorphic zoneand its level of divergence between haplotypes suggestsa similar history to the northern codistributed area ofLiolaemus tenuis. Clades of both species show a general
Liolaemus tenuis Liolaemus pictus Liolaemus lemniscatus
L. tenuis ...... 0.71 (P < 0.001) 0.60 (P < 0.05)L. pictus 7 ...... ......L. lemniscatus 10 0 ......
Table 3 Normalized MAST values (pro-bability values in parentheses) of therandomization analysis (above diagonal);numbers below the diagonal are the numberof shared areas in the sampling design
2410 P. F. V I C TO R I A N O E T A L .
© 2008 The AuthorsJournal compilation © 2008 Blackwell Publishing Ltd
pattern of higher gene and/or nucleotide diversity innorthern (A clades) vs. southern (B clades) localities (Table 2).Finally, Liolaemus pictus, the most southern species, ischaracterized by diversity and branch lengths that arecuriously higher than the codistributed populations ofL. tenuis. The southernmost populations of L. pictus, whichare definitively distributed in glaciated areas, are charac-terized by branch lengths and genetic diversity indexesconsistent with a reduced effect of glacial cycles on patternsof genetic variation. All this suggests a complex historythat requires additional corroborative evidence for resolution,but broadly similar patterns — deep phylogeographicalstructure in northern populations and high genetic similarityon both sides of the Andes in southern populations — havebeen reported in two other terrestrial species; the coniferFitzroya cupressoides (Allnut et al. 1999), and forest-dwellingrodents of the Abrothrix olivaceous/xanthorinus complex(Smith et al. 2001), and in the freshwater fish Percichthystrucha (Ruzzante et al. 2006).
Our gene tree for L. tenuis recovered a close relationshipbetween the eastern Argentinean populations of andsouthern Chilean populations from the Continental Chiloé(clade B; Fig. 3), where it is probable that several low ele-vation gaps connected biota from both sides of the Andesat these latitudes. Similarly, within the fish P. trucha, deepmtDNA haplotype divergence between western vs. easterndrainages is evident in northern regions (38°), presumablybecause of a history dominated by vicariant events in thispart of the range. Further south, P. trucha is characterizedby the absence of deep divergence between eastern andwestern populations, and at approximately 40°S severalwestern drainages include haplotypes that are moreclosely related to some eastern-drainage haplotypes thanthey are to those in other western populations. Ruzzanteet al. (2006) interpreted this pattern as possibly due to his-torical gene flow followed by a recent cessation of formertrans-Andean watershed connections in southern regions.In contrast, genetic patterns in northern populations of
Fig. 7 MAST for pairwise combinations of area trees between Liolaemus tenuis–Liolaemus lemniscatus (a), and L. tenuis–Liolaemus pictus (b).C presents the MRP tree obtained from the combination of the three individual area trees; area codes are as described in Table 1. The mainclades are labelled with numbers from 1 to 3, and branch shading is as found in Figs 4–6.
C O M PA R AT I V E P H Y L O G E O G R A P H Y O F C H I L E A N L I O L A E M U S 2411
© 2008 The AuthorsJournal compilation © 2008 Blackwell Publishing Ltd
P. trucha suggest relatively stable habitats and limiteddispersal (Ruzzante et al. 2006), and this pattern is broadlyreplicated in two of the three species of Liolaemus in thisstudy.
Comparative phylogeography
Our results are consistent with the hypothesis that twopaired combinations of three species of Liolaemus includedin this study have responded in parallel to shared historicalprocess sufficient to influence their phylogeographical struc-ture. In other words, these species (L. tenuis, L. lemniscatus)have been codistributed for a sufficiently long time topossibly have evolved along similar demographic trajectoriesin response to the same historical events. Among otherthings, natural selection and/or vicariant events associatedwith recent cycles of glaciation (Heusser 1981; van Geelet al. 2000) and floral changes associated with shiftingclimates (Villagrán & Hinojosa 1997), may have drivenparallel divergence in these lizards. The genetic and geo-graphical structure of the populations described by thearea supertree is consistent with this hypothesis.
In the northern range of the Liolaemus species studiedhere (mesomorphic zone), our results show significantphylogeographical congruence between L. lemniscatus andL. tenuis. Because this region should have been less directlyimpacted by late Pleistocene glaciation cycles (McCullochet al. 2000), and because both of these species show deepphylogeographical structure in this region relative to moresouthern parts of their ranges, we suggest that older tectonic/
Fig. 8 Multidimensional scaling analysissummarizing six climate variables (see textfor details) for the three Chilean biogeo-graphical zones. Triangles, mesomorphiczone; squares, transitional zone; and circles,hygromorphic zone; area codes are asdescribed in Table 1.
Table 4 Spearman rank correlations (primer version 6 bio-env)between areas supertree distances and weather variables baseddistances. Variables: (1) T, annual mean temperature; (2) M, meandaily maximum temperature of the coldest month; (3) m, meandaily minimum temperature of the coldest month; (4) Ic, index ofcontinentality or thermal amplitude (calculated as the differencebetween the daily mean temperatures of the hottest and coldestmonths); (5) P, mean annual precipitation
Number of variables Correlation Selections
2 0.527 1,52 0.527 2,53 0.527 1,2,53 0.527 1,4,53 0.527 2,4,53 0.527 3,4,54 0.527 1,2,4,54 0.527 1,3,4,54 0.527 2,3,4,55 0.527 1,2,3,4,5
2412 P. F. V I C TO R I A N O E T A L .
© 2008 The AuthorsJournal compilation © 2008 Blackwell Publishing Ltd
orogenic events, or perhaps very old climatic events (onset ofPleistocene changes) may have most strongly influenced thehistories of each species. Specifically, the occurrence of acomplex mix of localized transverse valleys bisected byhigh mountains, and the complete isolation of the Andeanand Coastal ranges, coupled with less dramatic climaticoscillations resulting from cycles of glacial advance/retreatfurther south (Hollin & Schilling 1981), may have forged deepphylogeographical splits and allowed the persistence of oldhaplotypes at some localities. These northern populationssegregate for both old and newer (derived) haplotypes(especially L. tenuis) relative to more southern populations.
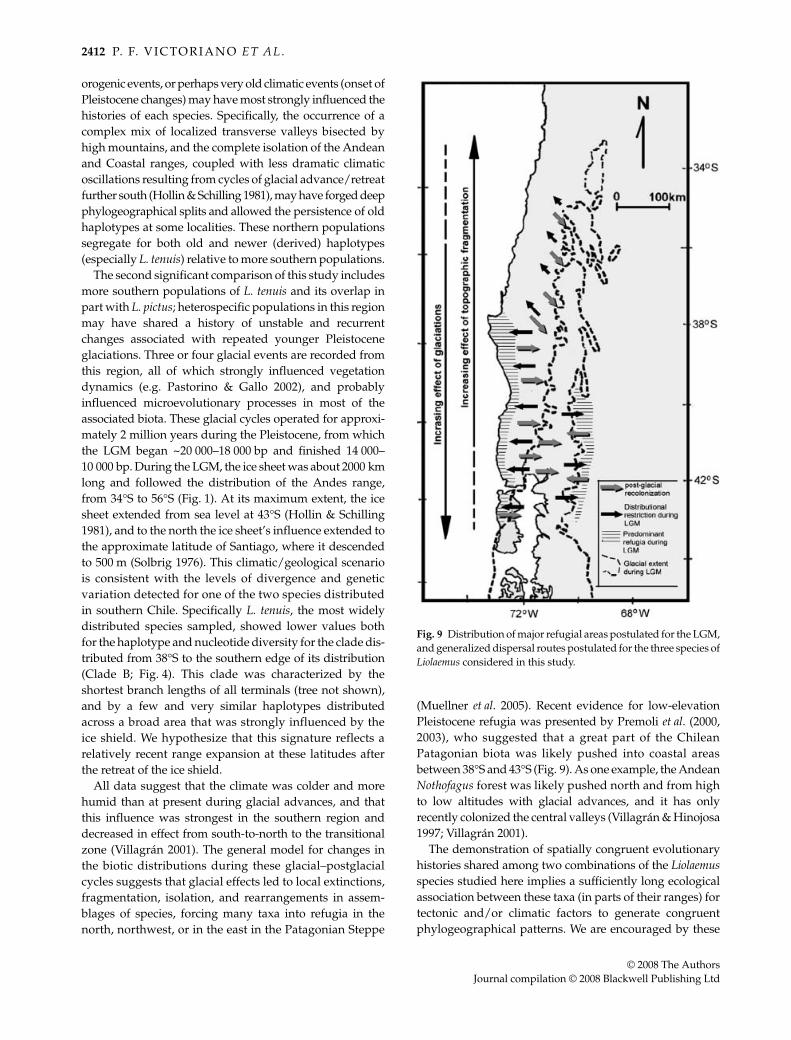
The second significant comparison of this study includesmore southern populations of L. tenuis and its overlap inpart with L. pictus; heterospecific populations in this regionmay have shared a history of unstable and recurrentchanges associated with repeated younger Pleistoceneglaciations. Three or four glacial events are recorded fromthis region, all of which strongly influenced vegetationdynamics (e.g. Pastorino & Gallo 2002), and probablyinfluenced microevolutionary processes in most of theassociated biota. These glacial cycles operated for approxi-mately 2 million years during the Pleistocene, from whichthe LGM began ~20 000–18 000 bp and finished 14 000–10 000 bp. During the LGM, the ice sheet was about 2000 kmlong and followed the distribution of the Andes range,from 34°S to 56°S (Fig. 1). At its maximum extent, the icesheet extended from sea level at 43°S (Hollin & Schilling1981), and to the north the ice sheet’s influence extended tothe approximate latitude of Santiago, where it descendedto 500 m (Solbrig 1976). This climatic/geological scenariois consistent with the levels of divergence and geneticvariation detected for one of the two species distributedin southern Chile. Specifically L. tenuis, the most widelydistributed species sampled, showed lower values bothfor the haplotype and nucleotide diversity for the clade dis-tributed from 38°S to the southern edge of its distribution(Clade B; Fig. 4). This clade was characterized by theshortest branch lengths of all terminals (tree not shown),and by a few and very similar haplotypes distributedacross a broad area that was strongly influenced by theice shield. We hypothesize that this signature reflects arelatively recent range expansion at these latitudes afterthe retreat of the ice shield.
All data suggest that the climate was colder and morehumid than at present during glacial advances, and thatthis influence was strongest in the southern region anddecreased in effect from south-to-north to the transitionalzone (Villagrán 2001). The general model for changes inthe biotic distributions during these glacial–postglacialcycles suggests that glacial effects led to local extinctions,fragmentation, isolation, and rearrangements in assem-blages of species, forcing many taxa into refugia in thenorth, northwest, or in the east in the Patagonian Steppe
(Muellner et al. 2005). Recent evidence for low-elevationPleistocene refugia was presented by Premoli et al. (2000,2003), who suggested that a great part of the ChileanPatagonian biota was likely pushed into coastal areasbetween 38°S and 43°S (Fig. 9). As one example, the AndeanNothofagus forest was likely pushed north and from highto low altitudes with glacial advances, and it has onlyrecently colonized the central valleys (Villagrán & Hinojosa1997; Villagrán 2001).
The demonstration of spatially congruent evolutionaryhistories shared among two combinations of the Liolaemusspecies studied here implies a sufficiently long ecologicalassociation between these taxa (in parts of their ranges) fortectonic and/or climatic factors to generate congruentphylogeographical patterns. We are encouraged by these
Fig. 9 Distribution of major refugial areas postulated for the LGM,and generalized dispersal routes postulated for the three species ofLiolaemus considered in this study.

C O M PA R AT I V E P H Y L O G E O G R A P H Y O F C H I L E A N L I O L A E M U S 2413
© 2008 The AuthorsJournal compilation © 2008 Blackwell Publishing Ltd
results, because this study is a very broad assessment ofpatterns across a topographically and climatically extremelyvariable landscape, and it ignores the fact that, even forcongeners, there are sufficient life-history differences amongthe Liolaemus species studied here to confound phylogeo-graphical patterns at finer scales of resolution. For example,the effect of colder climatic conditions in southern Chilemust be a significant factor in causing extinctions ordensity reductions in local populations of ectothermalterrestrial vertebrates in general. While the effects of glaci-ations in southern populations of L. tenuis and L. pictusshould result in a shared phylogeographical pattern inthis region, important differences between the two arealmost certainly responsible for the more complex patternsin this part of the range. Liolaemus tenuis has a broaderdistribution than L. pictus, and the former generally occupiesmore open habitats and forest edges, while L. pictus ismore strongly associated with forest habitat. This differ-ence alone suggests that L. tenuis likely has higher thermalrequirements, and it is also oviparous whereas L. pictusis viviparous, which would also favour L. pictus in coolerenvironments. Our study was not designed to distinguishamong such variables to make inferences about ecologicalfactors that might explain divergence, or absence thereof,within and between species in this group, and we mentionthese here simply to recognize the limits of this study.
The most powerful property of comparative phylogeo-graphy is the use of information from different codistributedclades — ideally with very different ecologies — presumed toshare a history of similar climatic and geological processes;these represent independent replications in a naturalexperiment of evolution (Zink 2002; Zamudio & Savage2003). Many studies have analysed the comparative phy-logeography of codistributed taxa from independentlineages, with the aim of detecting common evolutionaryprocesses, but until recently the most common approachconsisted of qualitative and visual comparisons of individualgene trees (Avise 2000). More recently statistical methodshave been used to quantitatively test alternative a priorihypotheses of congruence in phylogeographical patternsof sympatric taxa (e.g. Carstens et al. 2005), but theseapproaches are problematic in taxa with only partiallyoverlapping distributions. A major advantage of the methodused here (Lapointe & Rissler 2005) is that MRP trees canbe compared in paired statistical tests appropriate to speciessharing partially overlapping ranges.
This is the first comparative phylogeographical studyin southern South America using statistical methods totest for the occurrence of areas with common evolutionaryhistory, but much remains to be done in follow-up studies.For example, our analysis of climate variables suggeststhat the previously defined bioclimatic zones have someexplanatory power for natural selection to drive populationdivergence, but more detailed niche modelling efforts will
need to be integrated with geographical range informationfor stronger inferences on the role of habitat differencesin driving speciation (Graham et al. 2004). More intensivesampling will provide more details on potential areas ofoverlap which can be evaluated with additional new testsof shared history (Zhang et al. 2006), and these can be linkedto expanded genetic studies with nuclear markers to testlong-term demographic stability that might be expectedin refugial areas (Hutchinson & Templeton 1999; Knowles& Richards 2005). Finally, tests for codivergence in spacemust be linked to tests for codivergence in time (Hickersonet al. 2006); such studies in this part of the world will providea southern hemisphere perspective to the comparativephylogeographical studies of the effects of Quaternaryglacial cycles in Europe and North America (Hewitt 2000;Moreno et al. 2001). The approach will also yield moregeneral patterns with the inclusion of more taxa, and thesestudies are in progress.
Acknowledgements
We thank the following people for help in the field or in the laboratory— M. Vidal, E. Habit, M. Fernandez, R. Cifuentes, J. Bourke (all ofUniversidad de Concepción: Chile), F. Torres (Pontificia UniversidadCatólica de Chile), the Victoriano-Sepúlveda and Cisternas-Ojeda families; J. Alsbury and M. Hawkins (Brigham YoungUniversity); E. Habit (UdeC) assisted with part of the statisticalanalysis of weather data. Logistic and financial support wasprovided by Brigham Young University (David M. KennedyCenter for International Studies, and the Department of Inte-grative Biology, M.L. Bean Life Science Museum). The project wasalso financially supported in part by the US Department ofAgriculture (award CSREES NRI 2005-00903 to BJA), US NationalScience Foundation (awards DEB 0132227 and OISE 0530267 toJ.W.S., Jr. and others, DEB 0309111 to J.W.S., Jr. and E.B.; and awardDEB 0640959 to B.J.A.), and Beca Presidente de la República(Mideplan, Chile) and Project DIUC-CIEP 205.113.067-1sp, Univer-sidad de Concepción.
ReferencesAllnut TR, Newton AC, Lara A et al. (1999) Genetic variation in
Fitzroya cupressoides (alerce), a threatened South Americanconifer. Molecular Ecology, 8, 975–987.
Amigo J, Ramírez C (1998) A bioclimatic classification of Chile:woodland communities in the temperate Zone. Plant Ecology,136, 9–26.
Arbogast BS, Kenagy GJ (2001) Comparative phylogeography asan integrative approach to historical biogeography. Journal ofBiogeography, 28, 819–825.
Avila LJ, Morando M, Perez CHF, Sites JW Jr (2004) Phylogeneticrelationships of lizards of the Liolaemus petrophilus group(Squamata, Liolaemidae), with description of two new speciesfrom western Argentina. Herpetologica, 60, 187–203.
Avila LJ, Morando M, Sites JW Jr (2006) Congeneric phylogeo-graphy: hypothesizing species boundaries and evolutionaryprocesses in lizards of the Liolaemus boulengeri complex(Squamata: Liolaemini). Biological Journal of the Linnean Society,89, 241–275.
2414 P. F. V I C TO R I A N O E T A L .
© 2008 The AuthorsJournal compilation © 2008 Blackwell Publishing Ltd
Avise JC (2000) The History and Formation of Species. HarvardUniversity Press, Cambridge, Massachusetts.
Bermingham E, Moritz C (1998) Comparative phylogeography:concepts and applications. Molecular Ecology, 7, 367–369.
Bininda-Emonds ORP (2004) The evolution of supertrees. Trends inEcology & Evolution, 19, 315–322.
Carstens BC, Knowles LL (2007) Shifting distributions and speci-ation: species divergence during rapid climate change. MolecularEcology, 16, 619–627.
Carstens BC, Richards CL (2007) Integrating coalescent andecological niche modeling in comparative phylogeography.Evolution, 61, 1439–1454.
Carstens BC, Brunsfeld SJ, Demboski JR, Good JM, Sullivan J(2005) Investigating the evolutionary history of the Pacific north-west mesic forest ecosystem: hypothesis testing within a com-parative phylogeographic framework. Evolution, 59, 1639–1652.
Cei JM, Videla F, Vicente L (2003) From oviparity to viviparity: apreliminary note on the morphometric differentiation betweenoviparous and viviparous species assigned to the genus Liolaemus(Reptilia, Squamata, Liolaemidae). Journal of Zoological Systematicsand Evolutionary Researches, 41, 151–156.
Clarke KR (1999) Non-metric multivariate analysis in community-level ecotoxicology. Environmental Toxicology and Chemistry, 18,117–127.
Clarke KR, Gorley RN (2005) PRIMER v.6: User Manual/Tutorial.PRIMER-E Ltda., Plymouth, UK.
Di Castri F (1968) Esquisse écologique du Chili. In: Biologie del’Amérique austral (eds Delamare Deboutteville, C, Rapoport T),pp. 7–52. Edition du Centre National de la Recherche Scientifique,Paris, France.
Donoghue MJ, Moore BR (2003) Toward an integrative historicalbiogeography. Integrative and Comparative Biology, 43, 261–270.
Donoso-Barros R (1966) Reptiles de Chile. Ediciones de la Universidadde Chile, Santiago, Chile.
Duméril AMC, Bibron G (1837) Erpétologie générale ou histoirenaturelle del Reptiles. Vol 8. Imprimerie Paris De Fain, Paris.
Fetzner J (1999) Extracting high quality DNA from shed reptilesskins; A simplified method. BioTechniques, 26, 1052–1054.
van Geel B, Heusser C, Renssen H, Schuurmans JE (2000) Climaticchange in Chile at around 2700 BP and global evidence for solarforcing: a hypothesis. Holocene, 10, 659–664.
Graham CH, Ferrier S, Huettman F, Moritz C, Peterson AT (2004)New developments in museum-based informatics and applica-tions in biodiversity analyses. Trends in Ecology & Evolution, 19,497–503.
Gravenhorst JLC (1838) Beitrage zur genauern Kenntnis einigerEidechsengattungen. Nova Acta Academiae Caesarae LeopoldinaCarolinae Germaninicae Naturae Curisorum, 18, 712–784.
Heusser C (1981) Palynology of the last interglacial–glacial cyclein midlatitudes of southern Chile. Quaternary Researches, 16,293–321.
Hewitt G (2000) The genetic legacy of the Quaternary ice ages.Nature, 405, 907–913.
Hickerson MJ, Dolman G, Moritz C (2006) Comparative phylogeo-graphy summary statistics for testing simultaneous vicariance.Molecular Ecolology, 15, 209–223.
Hillis DM, Bull JJ (1993) An empirical test of bootstrapping as amethod for assessing confidence in phylogenetic analysis.Systematic Biology, 42, 182–192.
Hollin JTS, Schilling DH (1981) Late Wisconsin-Wichselianmountain glaciers and small ice caps. In: The Last Great Ice Sheets(eds Denton JH, Hughes TJ), pp. 179–206. Wiley, New York.
Huelsenbeck JP, Bollback JP (2001) Empirical and hierarchicalBayesian estimation of ancestral status. Systematic Biology, 50,351–366.
Huelsenbeck JP, Ronquist F (2001) mrbayes. Bayesian inference ofphylogeny. Bioinformatics, 17, 754.
Hugall A, Moritz C, Moussalli A, Stanisic J (2002) Reconcilingpaleodistribution models and comparative phylogeographyin the Wet Tropics rainforest land snail Gnarosophia bellend-enkerensis (Brazier 1875). Proceedings of the National Academy ofSciences, USA, 99, 6112–6117.
Hutchinson DW, Templeton AR (1999) Correlation of pairwisegenetic and geographic distance measures: inferring the relativeinfluences of gene flow and drift on the distribution of geneticvariability. Evolution, 53, 1898–1914.
Johnson JB, Omland KS (2004) Model selection in ecology andevolution. Trends in Ecology & Evolution, 19, 101–108.
Knowles LL, Richards CL (2005) Genetic drifts importance duringPleistocene divergence as revealed by analysis of genomicvariation. Molecular Ecology, 14, 4023–4032.
Lamborot M, Ortiz JC (1990) Liolaemus pseudolemniscatus, unanueva especie de lagarto del Norte Chico de Chile (Sauria:Tropiduridae). Gayana, 54, 135–142.
Lapointe F, Rissler L (2005) Congruence, consensus and the com-parative phylogeography of codistributed species in California.American Naturalist, 166, 290–299.
Leaché AD, Reeder TW (2002) Molecular systematics of the easternfence lizard (Sceloporus undulatus): a comparison of parsimony,likelihood, and Bayesian approaches. Systematic Biology, 51,44–68.
Lowell TV, Heusser CJ, Andersen BG et al. (1995) Interhemisphericcorrelations of Late Pleistocene glacial events. Science, 269,1541–1549.
Mann G (1964) Regiones Biogeográficas de Chile. InvestigacionesZoológicas Chilenas, VI, 15–49.
Martins EP, Labra A, Halloy M, Thompson JT (2004) Large-scale patterns of signal evolution: an interspecific study ofLiolaemus lizard headbob displays. Animal Behaviour, 68, 453–463.
McCulloch RD, Bentley MJ, Purves RS, Hulton NRJ, Sugden DE,Clapperton CM (2000) Climatic inferences from glacial andpalaeoecological evidence at the last glacial termination, southernSouth America. Journal of Quaternary Science, 15, 409–417.
Morando M, Avila LJ, Sites JW Jr (2003) Sampling strategies fordelimiting species: genes, individuals, and populations in theLiolaemus elongates–kriegi complex (Squamata: Liolaemidae)in Andean–Patagonian South America. Systematic Biology, 52,159–185.
Morando M, Avila LJ, Baker J, Sites JW Jr (2004) Phylogeny andphylogeography of the Liolaemus darwinii complex (Squamata:Liolaemidae): evidence for introgression and incomplete lineagesorting. Evolution, 58, 842–861.
Morando M, Avila LJ, Turner C, Sites JW Jr (2007) Molecularevidence for a species complex in the Patagonian lizard Liolaemusbibroni and phylogeography of the closely related L. gracilis(Squamata: Liolaemini). Molecular Phylogenetics and Evolution,43, 952–973.
Moreno PI, Jacobson GL, Lowell TV, Denton GH (2001) Interhemi-spheric climate links revealed from a Late-glacial cool episodein southern Chile. Nature, 409, 804–808.
Moritz C (2002) Strategies to protect biological diversity and theprocesses that sustain it. Systematic Biology, 51, 238–254.
Muellner AN, Tremetsberger K, Stuessy T, Baeza CM (2005)Pleistocene refugia and recolonization routes in the southern

C O M PA R AT I V E P H Y L O G E O G R A P H Y O F C H I L E A N L I O L A E M U S 2415
© 2008 The AuthorsJournal compilation © 2008 Blackwell Publishing Ltd
Andes: insights from Hypochaeris palustris (Asteraceae, Lactuceae).Molecular Ecology, 14, 203–212.
Nei M (1987) Molecular Evolutionary Genetics. Columbia UniversityPress, New York.
Nuñez H, Jaksic F (1992) Lista comentada de los reptiles terrestresde Chile continental. Boletin Del Museo Nacional de HistoriaNatural (Chile), 43, 63–91.
Page RDM (1994) Parallel phylogenies: reconstructing the historyof host-parasite assemblages. Cladistics, 10, 155–173.
Palumbi SR (1996) Nucleic acids I: the polymerase chain reaction.In: Molecular Systematics (eds Hillis DM, Moritz C, Mable BK),2nd edn, pp. 205–247. Sinauer & Associates, Sunderland,Massachusetts.
Pastorino MJ, Gallo LA (2002) Quaternary evolutionary history ofAustrocedrus chilensis, a cypress native to the Andean-Patagonianforest. Journal of Biogeography, 29, 1167–1178.
Pincheira-Donoso D, NunezNúñez H (2005) Las especies delgenero Liolaemus Wiegmann, 1834 (Iguania: Tropiduridae:Liolaeminae). Taxonomía, sistemática y evolución. PublicaciónOcasional del Museo de Historia Natural. Chile, 59, 7–486.
Pisano E (1954) Fitogeografía. La vegetación de las distintas zonasgeográficas chilenas. Revista Geographyráfica de Chile TerraAustralis, 11, 95–107.
Posada D, Buckley TR (2004) Model selection and model averagingin phylogenetics: advantages of Akaike information criterionand Bayesian approaches over likelihood ratio tests. SystematicBiology, 53, 793–808.
Posada D, Crandall KA (1998) modeltest: testing the model ofDNA substitution. Bioinformatics, 14, 817–818.
Premoli AC, Kitzberger T, Veblen TT (2000) Isozyme variationand recent biogeographical history of the long-lived coniferFitzroya cupressoides. Journal of Biogeography, 27, 251–260.
Premoli AC, Vergara R, Souto CP, Lara A, Newton AC (2003)Lowland valleys shelter the ancient conifer Fitzroya cupressoidesin the Central Depression of Southern Chile. Journal of the RoyalSociety of New Zealand, 33, 623–631.
Ramos VA (1989) The birth of southern South America. AmericanScientist, 77, 444–450.
Rissler LJ, Hijmans RJ, Graham CH, Moritz C, Wake DB (2006)Phylogeographic lineages and species comparisons in conser-vation analyses: a case study of the California herpetofauna.American Naturalist, 167, 655–666.
Ruzzante D, Walde S, Cussac V et al. (2006) Phylogeography ofthe Percichthyidae (Pisces) in Patagonia: roles of orogeny,glaciation, and volcanism. Molecular Ecology, 15, 2949–2968.
Schulte II JA, Macey JR, Espinoza RE, Larson A (2000) Phylogeneticrelationships in the iguanid lizard genus Liolaemus: multipleorigins of viviparous reproduction and evidence for recurringAndean vicariance and dispersal. Biological Journal of the LinneanSociety, 69, 75–120.
Smith MF, Kelt DA, Patton JL (2001) Testing models of diversifica-tion in mice in the Abrothrix olivaceus/xanthorhinus complex inChile and Argentina. Molecular Ecology, 10, 397–405.
Smith-Ramirez C (2004) The Chilean coastal range: a vanishingcenter of biodiversity and endemism in South Americatemperate rainforest. Biodiversity and Conservation, 13, 373–393.
Solbrig O (1976) The Origin and floristic affinities of the SouthAmerican temperate desert and semidesert. In: Evolution of DesertBiota (eds Goodall DW), pp. 7–49. University Texas Press, Austin.
Swofford CL (2002) PAUP*: Phylogenetic Analysis Using Parsimony
(*and Other Methods), Beta Version 4.0.b5b. Sinauer & Associates,Sunderland, Massachusetts.
Thompson JD, Gibson TJ, Plewniak F, Jeanmougin F, Higgins DG(1997) The clustal–windows interface: flexible strategies formultiple sequence alignment aided by quality analysis tools.Nucleic Acids Researches, 24, 4876–4882.
Thorley JL, Page RDM (2000) radcon: phylogenetic comparisonand consensus. Bioinformatics, 16, 486–487.
Vidal M, Ortiz JC, Astorga M, Victoriano P, Lamborot M (2004)Revision of Liolaemus tenuis subspecies (Duméril & Bibron, 1837)by analysis of population genetic structure. Amphibia-Reptilia,25, 438–445.
Vidal M, Ortiz JC, Ramírez CC, Lamborot M (2005a) Intraspecificvariation in morphology and sexual dimorphism in Liolaemustenuis (Tropiduridae). Amphibia-Reptilia, 26, 343–351.
Vidal M, Veloso A, Mendez M (2005b) Insular morphologicaldivergence in the lizard Liolaemus pictus (Liolaemidae). Amphibia-Reptilia, 27, 103–111.
Villagrán C (2001) Un modelo de la historia de la vegetación de laCordillera de la Costa central-sur: la hipótesis glacial de Darwin.Revista Chilena de Historia Natural, 74, 793–803.
Villagrán C, Hinojosa LF (1997) Historia de los bosques del sur deSudamérica, II: análisis fitogeográfico. Revista Chilena de HistoriaNatural, 70, 241–267.
Wiens JJ (1998) Combining data sets with different phylogenetichistories. Systematic Biology, 47, 568–581.
Wiens JJ, Reeder TW, Nieto Montes de Oca A (1999) Molecularphylogenetics and evolution of sexual dichromatism amongpopulations of the Yarrow’s spiny lizards (Sceloporus jarrovii).Evolution, 53, 1884–1897.
Wilkinson M, Cotton JA, Creevey C et al. (2005) The shape ofsupertrees to come: tree shape related properties of fourteensupertree methods. Systematic Biology, 54, 419–431.
Yang Z (1994) Estimating the pattern of nucleotide substitution.Journal of Molecular Evolution, 39, 105–111.
Zamudio KR, Savage WK (2003) Historical isolation, rangeexpansion, and secondary contact of two highly divergentmitochondrial lineages in spotted salamanders (Ambystomamaculatum). Evolution, 57, 1631–1652.
Zhang AB, Tan S, Sota T (2006) autoinfer1.0: a computer programto infer biogeographical events automatically. Molecular EcologyNotes, 6, 597–599.
Zink RM (2002) Methods in comparative phylogeography, andtheir application to studying evolution in the North Americanaridlands. Integrative Comparative Biology, 42, 953–959.
Pedro F. Victoriano is an Associate Professor of Vertebrate Biologyat Universidad de Concepción with interest in microevolution,ecology and comparative phylogeography. Juan Carlos Ortiz is aProfessor of Zoology at Universidad de Concepción with interest intaxonomy and evolution of amphibian and reptiles. Edgar Benavidesperformed this research at Brigham Young University (BYU)while a PhD student and a post-doctoral researcher; his interestsare evolutionary and population genetics, systematics, taxonomy,and conservation of Neotropical amphibians and reptiles. Jack W.Sites, Jr. is a professor of Biology and Curator of Herpetology atBYU, and he has similar interests. Byron Adams is an AssistantProfessor of Microbiology and Molecular Biology at BYU withinterests in coevolution and comparative phylogeography.

2416 P. F. V I C TO R I A N O E T A L .
© 2008 The AuthorsJournal compilation © 2008 Blackwell Publishing Ltd
Appendix
Haplotype (gene) diversity/nucleotide diversity (π) (± SD), for each analysed area, and total values for the three species of Liolaemus. n/c,values not calculated
Area L. lemniscatus L. tenuis L. pictus
1G 0.667 ± 0.314/0.001 ± 0.0012F 0.833 ± 0.222/0.012 ± 0.0033E 0.700 ± 0.218/0.017 ± 0.0033F n/c 0.607 ± 0.164/0.003 ± 0.0014H n/c5F 0.982 ± 0.046/0.059 ± 0.007 0.714 ± 0.181/0.009 ± 0.0025G 1.000 ± 0.500/0.008 ± 0.003 0.500 ± 0.265/0.003 ± 0.0017E 0.833 ± 0.222/0.007 ± 0.002 0.600 ± 0.175/0.003 ± 0.0017F 0.000 ± 0.000/0.000 ± 0.0007G 0.867 ± 0.071/0.005 ± 0.001 0.750 ± 0.139/0.002 ± 0.0018D 1.000 ± 0.500/0.005 ± 0.0038F 0.929 ± 0.084/0.004 ± 0.001 1.000 ± 0.126/0.036 ± 0.0059C 0.000 ± 0.000/0.000 ± 0.0009E n/c 0.864 ± 0.072/0.004 ± 0.0019F 1.000 ± 0.126/0.058 ± 0.007 1.000 ± 0.500/0.008 ± 0.00310B 0.893 ± 0.086/0.012 ± 0.00311B 0.778 ± 0.091/0.002 ± 0.00111C 0.833 ± 0.222/0.084 ± 0.00911E 0.700 ± 0.218/0.002 ± 0.00112E 0.667 ± 0.314/0.001 ± 0.00113B 0.500 ± 0.265/0.001 ± 0.001 1.000 ± 0.272/0.046 ± 0.00613E 0.343 ± 0.128/0.001 ± 0.000 0.956 ± 0.059/0.010 ± 0.00214E 0.533 ± 0.172/0.001 ± 0.001 0.800 ± 0.114/0.013 ± 0.00315E n/c16C 0.564 ± 0.134/0.002 ± 0.00116E 0.667 ± 0.314/0.002 ± 0.001 1.000 ± 0.500/0.014 ± 0.00418D 0.600 ± 0.215/0.001 ± 0.001 n/c18E n/c 0.900 ± 0.161/0.006 ± 0.00219D 0.818 ± 0.119/0.002 ± 0.00119E 0.833 ± 0.222/0.003 ± 0.00120A 0.985 ± 0.040/0.028 ± 0.00421A 0.909 ± 0.047/0.006 ± 0.001Total sp 0.985 ± 0.007/0.066 ± 0.005 0.928 ± 0.017/0.074 ± 0.007 0.985 ± 0.006/0.0512 ± 0.005