Blackpool Local Economy Baseline Study
76
Local Economy Baseline for Blackpool A Report to Blackpool Council November 2011
Transcript of Blackpool Local Economy Baseline Study

Local Economy Baseline for Blackpool
A Report to Blackpool Council
November 2011

Local Economy Baseline for Blackpool A Report to Blackpool Council
www.sqw.co.uk
Contents
1: Introduction ................................... ....................................................................................... 1
2: Framing Blackpool’s economy .................... ....................................................................... 4
3: Business ....................................... ...................................................................................... 13
4: People ......................................... ........................................................................................ 26
5: Place .......................................... .......................................................................................... 42
6: The Tourism Economy ............................ .......................................................................... 52
7: SWOT assessment................................. ............................................................................ 62
8: Conclusions .................................... ................................................................................... 67
Annex A: Performance Monitoring Framework ......... ....................................................... A-1
Annex B: Consultees and workshop attendees ........ ....................................................... B-1
Contact: Joe Duggett Tel: 0161 475 2109 email: [email protected]
Approved by: Richard Hindle Date: November 2011
Director

Local Economy Baseline for Blackpool A Report to Blackpool Council
1
1: Introduction
1.1 This report presents a Local Economy Baseline for Blackpool. SQW Ltd (SQW) was commissioned to deliver this study by Blackpool Council, and the work was undertaken between July and October 2011.
Purpose
1.2 The overarching purpose of the Local Economy Baseline is to provide a strong and comprehensive evidence base for Blackpool to inform on-going economic development strategy and investment decisions. The study has a particular focus on the impact of tourism, and its contribution to the local economy. The evidence base will help to identify key opportunities for the town, and its role in the functional Fylde Coast economy going forward.
1.3 Specifically, there are three overarching aims for the work, namely to:
• Provide a detailed analysis of the local economy in Blackpool, and identify its key economic drivers
� With a specific focus on the contribution of the tourism economy
• Assess the wider contextual factors impacting on economic performance and prospects in Blackpool, at local, sub-regional and national levels
� Focusing on identifying the major opportunities and threats to the local economy
• Develop a concise and user-friendly Performance Monitoring Framework
� Identifying data/benchmarks against which Blackpool’s performance can be measured and tracked over time.
Approach
1.4 The conceptual approach for the Local Economy Baseline is presented in Figure 1-1, with the analysis framed around a high-level ‘Business, People, Place’ perspective, establishing the key elements in the local economy, and the interactions between them.
1.5 The framework also captures the importance of Economic Linkages, Demographics, and given Blackpool’s traditional economic role, the Tourism Economy as key underpinning factors of Blackpool’s economy.

Local Economy Baseline for Blackpool A Report to Blackpool Council
2
Figure 1-1: Framework for Local Economy Baseline
Housing
Sustainability
Commercial property
Infrastructure
Place
Business
The Blackpool Economy
People
Sectors
Resilience
Enterprise
Innovation
Competitiveness
Employment
Skills & Education
Deprivation
Earnings
Economic Linkages
Tourism Economy
Demographics
Source: SQW
1.6 It is worth noting at the outset that the principal focus of the work, spatially, is on Blackpool as defined by its Local Authority District boundary. However, reflecting functional economic forces, the study also discusses and recognises Blackpool’s important role in the wider Fylde Coast economy, and data for the Fylde Coast has been collated and analysed.
1.7 Further, the focus is principally on Blackpool ‘as a whole’, drawing on the majority of data that are available at Local Authority District level only, and recognising the consistent challenges faced by Blackpool as a coherent and well-defined place. However, where appropriate, for example in understanding patterns of deprivation and associated finer grained social issues, the baseline also considers performance within as well as across Blackpool.
The evidence base
1.8 The Local Economy Baseline is based on three core strands of evidence:
• a comprehensive analysis of socio-economic indicators spanning the Business, People and Place Themes – over 50 data-sets have been interrogated, with data collected (where available) for a five-year period up to the latest data to enable an understanding of the direction of travel in Blackpool as well as the ‘current’ situation
• a literature review of key policy, strategic and research documents
• local stakeholder engagement through detailed bilateral consultations and a ‘challenge’ workshop with representatives from the private, public and voluntary/community sectors in the town.

Local Economy Baseline for Blackpool A Report to Blackpool Council
3
Structure
1.9 The remainder of this report is structured as follows:
• Section 2 establishes the context for understanding the Blackpool economy
• Sections 3-5 present evidence on the Business, People and Place Themes respectively
• Section 6 provides a specific assessment of the Blackpool Tourism Economy
• Section 7 sets out an overarching Strengths, Weaknesses, Opportunities and Threats – SWOT – assessment of Blackpool’s economy
• Section 8 summarises the overall conclusions of the study.
1.10 Two Annexes are also attached:
• Annex A introduces the proposed Performance Monitoring Framework (PMF)
• Annex B identifies study consultees and workshop attendees.
1.11 A Baseline Database accompanies this report, providing the data collected as part of the study for further scrutiny and analysis by the Council, and to aid the implementation of the PMF.

Local Economy Baseline for Blackpool A Report to Blackpool Council
4
2: Framing Blackpool’s economy
2.1 This section establishes the overall context for the study. It provides an overview of the development of Blackpool and headline economic trends, considers the spatial context within which Blackpool operates, and sets out the key external factors impacting specifically on the economic performance of Blackpool, and also on the wider area of the Fylde Coast.
An overview of Blackpool’s economy – then and now
2.2 Blackpool developed as a major urban centre with the building of the railways and the emergence of a mass market for tourism. Drawing in particular on visitors from the growing industrial towns of the North, Blackpool rapidly evolved over the late 19th Century and first half of the 20th Century from a small village into one of the largest conurbations in Lancashire.
2.3 The economic and physical fabric of the town was shaped by its emergence as one of the UK’s most popular visitor destinations. Blackpool Tower, the Winter Gardens and later the Pleasure Beach, reinforced the natural offer of the seaside, large numbers of visitors came, mainly by train, and a vast stock of holiday accommodation, and fast food/drink and entertainment facilities were developed to meet their needs. Over time, other industries grew in response to the needs of the local population and the opportunity to recruit from a growing potential workforce. But tourism continued to dominate the local economy as Blackpool became the UK’s quintessential classic ‘seaside resort’. By the 1970s, Blackpool attracted over 17 million visitors a year.
2.4 By the 1980s, however, growing affluence, the lifting of currency export restrictions and the beginning of mass market air travel changed popular expectations and behaviour, and Blackpool’s fortunes suffered. Although Blackpool remained a destination of choice for millions, fewer people now visited the town, and those that came stayed for shorter periods of time and spent less money than necessary to sustain a prosperous local economy. Both private and public sector investment stalled, jobs were continuing to be lost, and the resident population faced limited employment prospects and relatively low wages. The population shrank, as residents, particularly those of working age and with qualifications, moved elsewhere to live and work, and unsurprisingly, social problems became deeply entrenched in parts of the town.
2.5 The physical fabric of Blackpool – geared towards a ‘cheap and cheerful’ offer to the mass market – had also become increasingly misaligned with consumer expectations and demand. Although parts of the town continued to offer good quality housing, the ‘over-supply’ of cheaper holiday accommodation and the potential to use this flexibly – with little or no new investment – to meet other short-term accommodation needs, had the effect of reducing the incentive for new high-quality and sustainable investment in commercial and residential property. This in turn reinforced the social challenges, and led to even higher levels of transience.

Local Economy Baseline for Blackpool A Report to Blackpool Council
5
2.6 Blackpool remains a significant economic and population centre with 140,000 residents, 4,500 businesses and an annual Gross Value Added (GVA) of £1.7bn. In recent years, there has been some restructuring of the local economy, with new employment created, particularly in the public sector and in retailing. In the last decade, serious efforts have been made to re-build the town’s asset base, for the visitor economy and other sectors. The attempt to attract investment in a major, government-backed, casino created much attention at national level, although ultimately Blackpool lost out before the project was abandoned.
2.7 New investment in the wider modernisation of the town’s infrastructure, led by the public sector, followed this disappointment. The 2003 Masterplan for the town had set in train major investments in the physical and commercial fabric, culminating in the recent re-opening of the Tower, an improved seafront and public realm, a renovated Winter Gardens and a considerably enhanced retail offer. Public investment has created new private sector interest, involvement, and some recent investment, despite the recession and the economic uncertainty which has followed. But the town’s economy remains unusually fragile – the visitor and retail sectors, and public sector employment are threatened both by public sector funding cuts and the loss of consumer confidence, and new jobs have not been created elsewhere in the local economy.
2.8 Despite this economic backdrop, the regeneration undertaken to date has been well-received, and there is real optimism and a sense of opportunity. The challenge facing Blackpool is to continue to build on this momentum, through the present difficult times in the national and global economies.
Some worrying headlines from the data
2.9 A headline analysis of the secondary data for the Blackpool economy reveals that:
• the Blackpool economy grew at under half the rate of England over 1995-2008 – with annual GVA growth of 2.6% p.a. in Blackpool compared to 5.4% in England; annual growth in Blackpool was also well below the Lancashire rate, of 4.2%
• Blackpool’s population reduced by 6% over 1981-2010, a loss of 9,100 residents – over this period England’s population grew by 12% and Lancashire by 5%
• Blackpool’s working-age population also reduced substantially over the last two decades, with 5,700 fewer residents of working age in 2010 than 1992 – over this period the working age population across England increased by 11%, and by 5% in Lancashire
• Gross Disposable Household Income (GDHI) per head of Blackpool’s residents stood at 78% of the England average in 2009 compared to 87% in 1995 – GDHI is a measure of how much income people have after accounting for taxes/social contributions, property and pension payments.
2.10 As might be expected from these headline figures, in recent years the Blackpool economy has increasingly underperformed that of England with regard to prosperity and productivity, as

Local Economy Baseline for Blackpool A Report to Blackpool Council
6
measured by GVA per head and GVA per employee. But, as shown in Figure 2-1 below, the gap has also widened with Lancashire.
Figure 2-1: GVA per head and GVA per employee trends in Blackpool and comparators
Prosperity – GVA per head (1995-2008)
Productivity – GVA per employee (1998-2008)
Source: National Statistics, Mid-Year Population Estimates and Annual Business Inquiry
Exploring the spatial context and key economic linkages . . .
2.11 Blackpool’s tightly drawn administrative boundary, which includes only the urban area of the town, the seafront and the immediately surrounding residential areas, partly accounts for these findings. Some of the growth of new activities which might have taken place inside the local authority area is probably found over these administrative borders.
2.12 But Blackpool is also a relatively self-contained economy; as suggested by commuting patterns, a key indicator of functional economic linkages. The 2001 Census found that 70% of employed residents in Blackpool worked in the town, and 70% of local workers also lived there (see Table 2-1).

Local Economy Baseline for Blackpool A Report to Blackpool Council
7
Table 2-1: Levels of self-containment of the Blackpool economy
Blackpool Outside Blackpool
Where employed residents of Blackpool work 70.5% 29.5%
Where workers in Blackpool live 70.0% 30.0%
Source: Census 2001
2.13 So, the economic performance of Blackpool rests heavily on the skills and competencies of its residents – local businesses are heavily dependent on local workers, and vice versa. In general, better-paid people travel further to work, and in Blackpool as elsewhere, this picture varies across types of job and occupational groups. As shown in Table 2-2, over half of Blackpool’s employed residents in the two ‘highest-value’ occupations commuted outside of Blackpool in 2001, and over half of the people working in these occupations in Blackpool lived elsewhere. In short, for higher-value occupations Blackpool is far less self-contained than the overall commuting data suggest.
Table 2-2: Commuting trends to/from Blackpool by occupational group
Occupations Where Blackpool's residents work Where Blackpool's workers live
Blackpool Outside Blackpool Blackpool Outside Blac kpool
Large employers/higher managerial 47.0% 53.0% 47.5% 52.5%
Higher professional 47.0% 53.0% 46.8% 53.2%
Lower managerial and professional 62.2% 37.8% 55.5% 44.5%
Intermediate 67.2% 32.8% 62.5% 37.5%
Small employers and own account workers 90.6% 9.4% 88.2% 11.8%
Lower supervisory and technical 61.7% 38.3% 74.4% 25.6%
Semi-routine 77.1% 22.9% 80.4% 19.6%
Routine 74.1% 25.9% 82.0% 18.0%
Source: Census 2001
2.14 While these statistics reflect a wider trend, they also point to the extent to which, especially for higher-value economic activity, Blackpool – as a residential and workplace location – is dependent on its external economic linkages.
2.15 The town is the principal economic centre of the Fylde Coast sub-regional economy, defined here and elsewhere as the area administered by three Councils - Fylde, Wyre and Blackpool. Blackpool accounts for 42% of the total Fylde Coast population of 328,000, 37% of the, 12,000 businesses and 44% of the area’s 131,000 work-based employees. The wider Fylde area contains other coastal tourist destinations such as Fleetwood and Lytham, as well as accessible and relatively prosperous market towns such as Poulton-le-Fylde, and largely rural areas to the east dominated by agriculture. This hinterland provides an important resource – for labour, investment and business – on which Blackpool can, and does, draw.
2.16 Again using commuting patterns as an indicator of functional economic linkages, the 2001 Census identified around 14,000 commuter movements to Blackpool from the other two districts in the Fylde Coast. Residents of the Fylde Coast therefore accounted for a quarter

Local Economy Baseline for Blackpool A Report to Blackpool Council
8
(24%) of Blackpool’s workers. And the link is not just one way – 12,000 employed residents of Blackpool commuted out to the rest of the Fylde Coast: 7,200 to Fylde and 4,800 to Wyre.
2.17 However, the commuting data, and the broader qualitative messages garnered from the stakeholder consultations for this study, suggest that Blackpool does not exert as significant a ‘pull’ from this wider functional area as might be expected for a typical economy of its size, especially given the lack of other large competing urban centres within the Fylde Coast. Indeed, as set out in Table 2-3, more people actually travelled out of Blackpool to work in Fylde in 2001 than moved the other way.
Table 2-3: Movements to and from Blackpool and the Fylde Coast in 2001
Fylde Wyre Total
Movements to Blackpool 4,639 9,676 14,315
Movements from Blackpool 7,224 4,768 11,992
Ratio 0.6 2.0 1.2
Source: Census 2001
2.18 Specific locations are at play here e.g. 1,500 movements from Blackpool to work at Warton where BAE have a major manufacturing and research base, and 750 movements just outside of the Blackpool administrative boundary to the area including Blackpool Airport where there are significant concentrations of businesses including hotels, the airport itself, businesses within/servicing airport trade, as well as businesses located close to Blackpool Business Park. However, given that Blackpool is the urban core for this wider area and the dominant visitor centre, both of which would be expected to lead to major concentration of employment, the balance of movements is far less focused on movements to Blackpool than might otherwise be expected.
2.19 Further, there is some evidence that these linkages may be weakening. As shown in Figure 2-2, the Fylde Coast accounted for a lower proportion of the movements to and from Blackpool in 2008 than in 2001. These data should be treated with caution as the changes are not statistically significant. They do, however, suggest a softening of Blackpool’s influence on the wider Fylde Coast, and Wyre in particular, in terms of commuting movements.
Figure 2-2: Commuter flows to and from Blackpool and the Fylde Coast in 2001 and 2008
Source: Local Labour Force Survey, 2001. Annual Population Survey, 2008.
7.4% 7.1% 7.8%11.3%
8.4%6.8%
20.6%15.9%
0%
5%
10%
15%
20%
25%
30%
2001 flow 2008 flow 2001 flow 2008 flow
Outflows from Blackpool Inflows to Blackpool
Pro
po
rtio
n o
f to
tal
Wyre
Fylde

Local Economy Baseline for Blackpool A Report to Blackpool Council
9
2.20 Overall, these data indicate that Blackpool functions as an important, but by no means dominant economic centre for the Fylde Coast. And its influence may be reducing as it has continued to struggle economically this last decade, as indicated by lagging prosperity and productivity. The key factors/drivers underpinning this trend are discussed in subsequent sections of the report. We will also return to the potential impact on Blackpool of the recently announced job losses at BAE’s Warton site.
2.21 That said, it is evident from Figure 2-3, that the administrative boundary of Blackpool does not contain a natural economic area: there is a continuous dense pattern of businesses through Blackpool along the coastal strip to the north and south. Many of the firms are small, but the scale of the surrounding business base highlights the importance of Blackpool developing its role as the sub-regional centre, in order to deliver the potential agglomeration and wider benefits that are associated with major economic centres. SQW analysis suggests that additional to the 4,500 business in Blackpool, there are over 5,000 businesses within 10 miles of Blackpool’s town centre.
Figure 2-3: Concentrations of businesses across the Fylde Coast
The Fylde Coast Business Database, calibrated with national statistics from the Business Register and Employment Survey suggests that:
• under 5 miles from Blackpool there are a further 2,950 enterprises
• 5-10 miles from Blackpool there are a further 2,400 enterprises
The data also demonstrate the continuous concentration of businesses on the north-south axis through Blackpool and linking Fleetwood in the North to Lytham in the South – interrupted spatially only by the presence of Blackpool airport, as well as concentrations on businesses north-west of Blackpool.
Source: SQW based on data from Experian and BRES

Local Economy Baseline for Blackpool A Report to Blackpool Council
10
. . . and the specific challenges of seaside economies
2.22 Blackpool is at a disadvantage in looking to exploit and maximise its role as a functional economic centre – it does not have a 360° hinterland of workers and businesses upon which to draw. While this basic geographic fact may be self-evident, it is also important, especially given the rural nature of much of the area surrounding the town. Broader structural challenges are also faced by many other ‘seaside’ economies:
• They are spatially ‘peripheral’, typically located away from the main economic centres and labour markets; partly because of scale and catchment, this peripherality is often exacerbated by weak and/or outdated transport links.
• They possess an outdated physical infrastructure, geared towards the tourism economy that was the key reason for their physical development, with a large number of private rented houses, and ex-holiday homes in relatively poor condition.
• They have a higher proportion of people of non-working age, for example through high numbers of retirees moving to the area.
• They have long-term labour market challenges owing to a declining core industry (tourism) and consistently higher levels of non-employment (including hidden unemployment through high-levels of people on sickness-related benefits).1
2.23 Blackpool’s situation differs primarily because of its scale as a large ‘seaside’ town: the only other comparable UK resorts are Bournemouth, Torbay and Brighton, all of which have faced structural issues, but which also operate in quite different economic and spatial contexts. However, recognising the underpinning issues that all seaside economies face provides an important contextual backdrop for understanding the economic strengths and weaknesses, and the threats and opportunities that will drive change in Blackpool’s economic position, for good or ill, in the coming years.
Wider operating and strategic contexts
2.24 Outside this local context, and the generic spatial issues affecting coastal towns, broader economic factors have shaped and constrained recent economic performance in Blackpool.
2.25 Looking back, the UK was hit particularly hard by the global financial crisis and ensuing global recession over 2007-08. The national economy contracted for six consecutive quarters from Q2 2008 onwards. By 2009, the Government’s deficit had widened to more than 12% of GDP, partly as a result of policy measures implemented in response to the recession and the financial crisis. This was one of the largest government deficits among OECD countries. Significant job losses were experienced across the country, and across all sectors, as the crisis spread from the financial sector to the ‘real’ economy: by 2009 the unemployment rate was 7.8% across England, with 800,000 more people out of work than in 2005.
1 See for example, House of Commons Committee for Communities and Local Government, Report on Coastal Towns, 6 March 2007, and Final Report of the Seaside Towns Research Project, Beatty & Fothergill, Centre for Regional Economic and Social Research, Sheffield Hallam University, June 2003

Local Economy Baseline for Blackpool A Report to Blackpool Council
11
2.26 Whilst the UK has now been technically out of recession for two years, the country’s output is still below the pre-recession level, the recovery remains very fragile, and over the summer of 2011 a fresh set of financial crises, in the Eurozone in particular, have emerged. The IMF downgraded growth projections for all major advanced economies in September 2011, and at the time of writing (late-2011) economic growth in the USA, Europe and other advanced economies remained weak, at best.
2.27 As a result, future economic prospects are uncertain. The latest economic forecast from the UK Office of Budget Responsibility (OBR) published in early 2011 downgraded earlier forecasts, and suggested that GDP growth would remain under 3% to 2015, whilst employment would remain essentially static for the next three years.
Table 2-4: Forecasts for the UK economy
2009 2010 2011 2012 2013 2014 2015
GDP -4.9 1.3 1.7 2.5 2.9 2.9 2.8
Employment 29.0 29.0 29.0 29.2 29.5 29.7 30.0
Unemployment (%) 7.6 7.9 8.2 8.1 7.6 7.0 6.4
Source: OBR, March 2011
2.28 These high-level issues matter deeply for Blackpool’s local economy: they will impact on the level of new investment in the area, determine employment opportunities and job creation, drive consumer spending and demand for goods and services from local businesses (including the extent to which there is ‘disposable’ income for holidays), and they will also have a negative effect on the provision of social, health, educational and other public services.
2.29 Two final contextual points are also important:
• First, public sector spending has been an important driver of economic performance in Blackpool over the last decade. The town benefited from substantial public sector job creation and significant regeneration and economic development capital funding. Going forward, the picture will look very different, with a focus on ‘rebalancing the economy’ away from the public sector, and less public money around to support employment, service provision and physical improvements.
• Second, owing to time-lags, both in the effects feeding through, and in the collection and publication of the data, some of the indicators discussed in the following pages do not yet show the impact of the recession ‘in full force’.

Local Economy Baseline for Blackpool A Report to Blackpool Council
12
Key messages
• Following its rise to become the UK’s leading seaside resort by the 1970s, Blackpool has faced three decades of economic challenge and, in relative terms, decline. Although it remains a major economy, and retains the tangible assets that facilitated its growth, the town’s economy is fragile and under-performing.
• Blackpool is, economically, the largest and most important part of the Fylde Coast functional economy – this area provides an important resource – for labour, investment and business – on which Blackpool can, and does, draw. However, Blackpool does not appear to function as a dominant core of this functional economy, as may be expected given its scale.
• Blackpool is not an economy in isolation and faces many of the challenges other places face – owing to its nature as a ‘seaside’ economy and the spatial/economic legacy this confers, and given national, and indeed global, economic trends. Although local decisions and actions matter, Blackpool’s economic performance will be determined to a very significant degree by forces above and beyond its control. In short, at present, the outlook does not look good.

Local Economy Baseline for Blackpool A Report to Blackpool Council
13
3: Business
3.1 This section focuses on Blackpool’s business base, including Blackpool as a workplace and as an investment location.
Key questions and coverage
3.2 The research questions which framed the analysis for the Business Theme, together with the sources of data which were analysed in exploring these issues, are set out in Table 3-1.
Table 3-1: Key questions and data sources for the Business Theme
Key questions Key sources of data and information
• What is the scale and nature of, and how resilient is, Blackpool's business base?
• Business Demography
• Inter-Departmental Business Register
• How enterprising is Blackpool’s economy? • Business Demography
• What is the sectoral composition of Blackpool’s economy
• Business Register and Employment Survey
• Annual Business Inquiry
• Experian Database of Fylde Coast businesses
• How innovative is the economy? • Annual Business Inquiry
• Is Blackpool a competitive place to do business? • UK Competitiveness Index
Source: SQW
3.3 Further to the data evidence identified above, the findings also draw on the review of literature completed for this work, the feedback from the consultations with local stakeholders and the Challenge Workshop held in Blackpool in late September. Additional evidence on the Business Theme can be found in the attached Baseline Database.
The evidence base
Scale and nature of the business base
3.4 Blackpool’s economy contained 4,500 active enterprises in 2009, 37% of the total across the Fylde Coast. The business base was marginally smaller in 2009 than in 2005, when there were 4,655 active enterprises. While this represents only a 3% fall over five years, the stock of businesses elsewhere - in Lancashire and nationally - grew over this period. Across England the business base increased by 7% between 2005 and 2009, and by 4% across Lancashire.
3.5 The Fylde Coast as a whole saw no change in the size of the business stock over 2005-09. Decline in Blackpool was offset by modest growth in Wyre and Fylde. Blackpool’s business base became a smaller part of the functional economic area in which it operates: in 2005 Blackpool accounted for 39% of businesses in the Fylde Coast, by 2009, 37%. Although this may appear a modest change, it provides further evidence of the potential weakening influence of Blackpool, discussed in the previous section.
Local Economy Baseline for Blackpool A Report to Blackpool Council
14
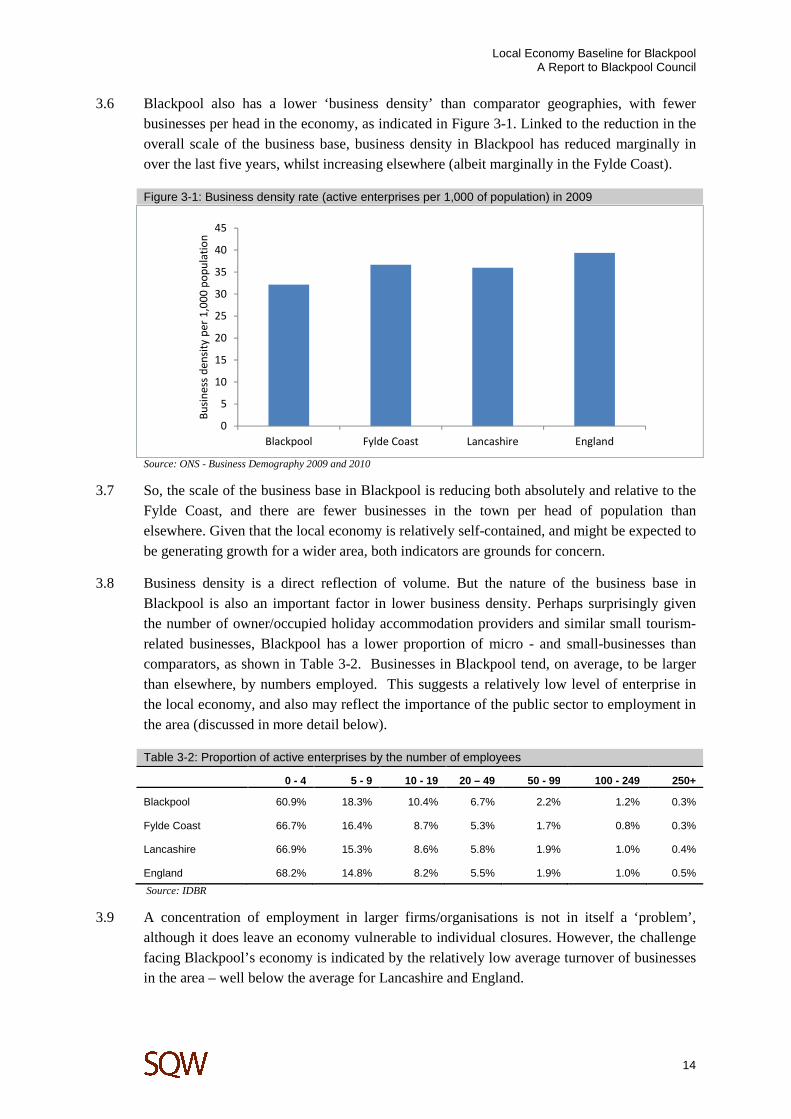
3.6 Blackpool also has a lower ‘business density’ than comparator geographies, with fewer businesses per head in the economy, as indicated in Figure 3-1. Linked to the reduction in the overall scale of the business base, business density in Blackpool has reduced marginally in over the last five years, whilst increasing elsewhere (albeit marginally in the Fylde Coast).
Figure 3-1: Business density rate (active enterprises per 1,000 of population) in 2009
Source: ONS - Business Demography 2009 and 2010
3.7 So, the scale of the business base in Blackpool is reducing both absolutely and relative to the Fylde Coast, and there are fewer businesses in the town per head of population than elsewhere. Given that the local economy is relatively self-contained, and might be expected to be generating growth for a wider area, both indicators are grounds for concern.
3.8 Business density is a direct reflection of volume. But the nature of the business base in Blackpool is also an important factor in lower business density. Perhaps surprisingly given the number of owner/occupied holiday accommodation providers and similar small tourism-related businesses, Blackpool has a lower proportion of micro - and small-businesses than comparators, as shown in Table 3-2. Businesses in Blackpool tend, on average, to be larger than elsewhere, by numbers employed. This suggests a relatively low level of enterprise in the local economy, and also may reflect the importance of the public sector to employment in the area (discussed in more detail below).
Table 3-2: Proportion of active enterprises by the number of employees
0 - 4 5 - 9 10 - 19 20 – 49 50 - 99 100 - 249 250+
Blackpool 60.9% 18.3% 10.4% 6.7% 2.2% 1.2% 0.3%
Fylde Coast 66.7% 16.4% 8.7% 5.3% 1.7% 0.8% 0.3%
Lancashire 66.9% 15.3% 8.6% 5.8% 1.9% 1.0% 0.4%
England 68.2% 14.8% 8.2% 5.5% 1.9% 1.0% 0.5%
Source: IDBR
3.9 A concentration of employment in larger firms/organisations is not in itself a ‘problem’, although it does leave an economy vulnerable to individual closures. However, the challenge facing Blackpool’s economy is indicated by the relatively low average turnover of businesses in the area – well below the average for Lancashire and England.
0
5
10
15
20
25
30
35
40
45
Blackpool Fylde Coast Lancashire England
Bu
sin
ess
de
nsi
ty p
er
1,0
00
po
pu
lati
on

Local Economy Baseline for Blackpool A Report to Blackpool Council
15
3.10 Comparison with England should be treated with some caution as the latter includes global firms with HQs in London, for example. But the Lancashire comparison is instructive: although, as we have seen, firms in Blackpool tend on average to employ more people, the latest average turnover per enterprise in Blackpool was around £660,000 compared to around £870,000 in Lancashire. On the other hand, average turnover is lower across the Fylde Coast, driven by the presence of more micro- and small- businesses in the wider area, as shown in Table 3-2 above.
Figure 3-2: Average turnover of businesses in Blackpool and comparators (2005-09)
Source: ONS – IDBR
Enterprise and survival
3.11 As discussed above, Blackpool’s business base is not shrinking fast, but nor is it growing. How can this be explained? In part this reflects the long-term decline of Blackpool’s economy, and the impacts of the recession in Blackpool, with reduction in the scale of the business base since 2007. However, further to these structural issues, a change in the stock of businesses is based on the net effects of flows in (new starts and inward moves) and flows out (firms closing or leaving the area) over a defined time period. Therefore, although the modest declines in the scale of the business base are part of a longer-term trend, within which performance has varied and some years have been better than others, the overall level is explained by levels of, and the relationship between, business ‘births’ – start-up enterprise –and business ‘deaths’ – survival.
3.12 Turning first to enterprise, the data suggest a slowing rate of new starts in Blackpool in recent years: 455 businesses were created in Blackpool in 2009, compared to a figure of 710 in 2005, and an average over the 2005-08 period of over 600. As shown in Figure 3-3 the rate of new business births per head of the working-age population in Blackpool has dropped dramatically since 2005.
3.13 Although this reduction follows a relatively strong performance prior to the ‘credit crunch’ in 2007, the level of new business births in Blackpool in 2010 (per head of population) was well below the national level, and the reduction has been far sharper than that experienced nationally. Interestingly, however, the data suggest that Blackpool’s performance reflects a broader trend across the Fylde Coast and Lancashire, where reductions in the enterprise were
0
500
1,000
1,500
2,000
2,500
2005 2006 2007 2008 2009Ave
rage
turn
over
per
bus
ines
s (£
k)
Blackpool Fylde Coast Lancashire England

Local Economy Baseline for Blackpool A Report to Blackpool Council
16
as pronounced (and more so across the Fylde Coast as a whole) as in Blackpool. The lack of availability of finance was identified by a number of local stakeholders as a key issue for business in Blackpool, and as a core factor in this declining enterprise rate.
Figure 3-3: Enterprise rates in Blackpool and comparators
Source: ONS - Business Demography 2009
3.14 So, Blackpool is not unique in experiencing a major reduction in enterprise in the last few years as the ‘credit crunch’, and then the broader recession, has impacted the local area, and Lancashire as a whole, particularly hard. However, the impacts of this trend in Blackpool are more pronounced and concerning because alongside declining rates of enterprise, business survival is lower than elsewhere. This relationship drives the gradual decline in business stocks identified above.
3.15 As shown in Table 3-3, over 2005-08 Blackpool’s ratio of business births to business deaths was consistently ‘worse’ than the Fylde Coast and Lancashire. Whilst all locations saw more deaths than births in 2009, the ratio in Blackpool was still well below levels across England and Lancashire. The ratio also ‘turned negative’ sooner in Blackpool than elsewhere.
3.16 Driven by this trend, over 2005-09 business deaths in Blackpool equated to a higher proportion of the total end-year total stock than in all other comparators – or put another way, around one in seven of the businesses that were active at the start of the 2009 in Blackpool were no longer active by the end of the year.
40
45
50
55
60
65
70
75
80
85
2005 2006 2007 2008 2009
Bus
ines
s B
irths
per
10,
000
WA
P
Blackpool Fylde Coast Lancashire England

Local Economy Baseline for Blackpool A Report to Blackpool Council
17
Table 3-3: Key indicators on business deaths
2005 2006 2007 2008 2009
Ratio of business births to business deaths (over 1=more births than deaths)
Blackpool 1.20 1.16 1.00 0.96 0.66
Fylde Coast 1.24 1.20 1.09 1.01 0.64
Lancashire 1.27 1.24 1.22 1.09 0.77
England 1.19 1.23 1.24 1.21 0.84
Business deaths as a percentage of total business stock
Blackpool 13% 11% 13% 12% 15%
Fylde Coast 11% 9% 11% 11% 14%
Lancashire 11% 9% 10% 10% 12%
England 11% 9% 10% 10% 12%
Source: ONS - Business Demography 2009
3.17 The ‘business deaths’ data give no indication on the type of businesses closing down – but information on the survival rates of new firms highlights the challenges faced in Blackpool. As shown in Table 3-4 in Blackpool, only 44% of the businesses that started-up in 2005 were still trading four years later, around 10 percentage points lower than comparators. This indicates a high level of business ‘churn’ in the Blackpool economy, as a high-proportion of the businesses that do start-up, close down in their first few years.
Table 3-4: Business survival rates
1-year survival 2-year survival 3-year survival 4-year survival
Business started in 2005
Blackpool 94.4 74.6 54.9 43.7
Fylde Coast 95.1 83.2 67.4 55.4
Lancashire 94.8 80.0 64.0 52.7
England 94.3 79.9 64.6 53.7
Busin ess started in 2006
Blackpool 95.8 76.3 59.3 -
Fylde Coast 96.8 83.1 68.2 -
Lancashire 96.5 80.3 64.4 -
England 96.5 80.7 66.2 -
Source: Business demography
3.18 Overall, the data above suggest that too few businesses are being created and/or attracted to Blackpool to offset business failure, and to deliver growth in the scale of the business base, which has been experienced in Lancashire and England, and elsewhere in the Fylde Coast. Blackpool’s businesses change markedly year-on-year, but the stock remains, at best, the same size.
3.19 The data suggest that Blackpool’s businesses are generally less resilient than others across the rest of the Fylde Coast, and in Lancashire and England. Even before the recession hit, business survival rates in Blackpool were lower than elsewhere, and the number of business deaths outweighed business births earlier in Blackpool than elsewhere as a result of the

Local Economy Baseline for Blackpool A Report to Blackpool Council
18
recession. As we have seen, given that Blackpool’s businesses generally have a smaller turnover, this is not unexpected.
The Blackpool ‘difference’ – the sectoral compositi on of the economy
3.20 The business base in Blackpool supported around 58,000 work-based employees in 2009 (the latest year for which data is available). Blackpool therefore accounted for 44% of the total across the Fylde Coast. However, the number of work-based employees in Blackpool has reduced over the last decade. Over 1998-2008, Blackpool saw a 7% reduction in work-based employment, in aggregate terms around 4,300 work-based employees. By contrast over this same period, the number of employees in England as a whole increased by 9%.2
3.21 This reduction in work-based employment was not felt evenly across sectors in Blackpool: decline focused on the Distribution, hotels and restaurants sector (a reduction of 2,100), Manufacturing (a reduction of 1,400) and Transport and communications (a reduction of 500). The manufacturing job losses are significant, given the fact that manufacturing can be both productive and well-paid relative to other sectors, especially in an economy dominated by the public sector, retail and accommodation/food, as in Blackpool, and because there are relatively few manufacturing jobs in Blackpool given its size.
3.22 The only sector that saw an increase in work-based employment in Blackpool over 1998-2008 was Banking, finance and insurance, that grew by 5% (in aggregate around 300 jobs), although our consultations suggest that this has been in ‘back-office’ and contact centre functions rather than more high-value professional services. That this was the only sector that grew in Blackpool is not a surprise – nationally this sector grew by 28% over 1998-2008. However, both the modest increase in Blackpool compared to nationally, and the fact that it was the only sector to increase in employment highlights the economic challenges faced by Blackpool this last decade, in aggregate employment growth and in re-aligning its economy to new areas of opportunity.
3.23 Indeed, the overall sectoral shape of employment in Blackpool has not changed substantially over the last decade – sectors that were important a decade ago remain key today, notably retail, the public sector (including health and social work), and accommodation/food and drink. In this regard, Blackpool’s economic base has remained very ‘different’ to that experienced elsewhere, as shown in Table 3-5.
3.24 The one sector where Blackpool has the same proportion of employment as England is Education. The differences between Blackpool and the wider Fylde Coast economy are also notable. Manufacturing accounted for 16% of employment in the Fylde Coast as a whole in 2009, compared to 7% in Blackpool (with a high level of manufacturing in Wyre, which, as noted earlier, is particularly focused on one business). This variation also reflects Blackpool’s role as a service centre for the wider Fylde Coast, with higher levels of employment in public services (hospitals, schools).
2 Data for 1998-2008 is drawn from the Annual Business Inquiry which was discontinued at this point – therefore the data for 2009 drawn from the new BRES cannot be compared directly to ABI data.

Local Economy Baseline for Blackpool A Report to Blackpool Council
19
Table 3-5: Proportion of work-based employees accounted for by sectors in 2009 (ordered by declining scale in Blackpool)
Blackpool Fylde Coast Lancashire England
Human health & social work activities 17% 13% 15% 13%
Wholesale & retail trade; repair of motor vehicles & motorcycles 17% 15% 17% 16%
Accommodation & food service activities 13% 11% 7% 7%
Public admin & defence; compulsory social security 13% 10% 6% 5%
Education 10% 8% 9% 10%
Manufacturing 7% 16% 15% 9%
Arts, entertainment & recreation 6% 4% 3% 2%
Construction 3% 5% 6% 5%
Administrative & support service activities 3% 3% 5% 8%
Professional, scientific & technical activities 3% 5% 5% 7%
Transportation & storage 2% 3% 3% 5%
Other service activities 2% 2% 2% 2%
Financial & insurance activities 2% 3% 2% 4%
Real estate activities 1% 1% 1% 2%
Information & communication 1% 2% 2% 4%
Source: BRES
3.25 The data highlight that the public sector, retail and accommodation are the key sources of employment in Blackpool. However, as noted earlier, Manufacturing is also important, supporting 4,300 employees in the local economy, and particularly important for providing full-time employment. Local stakeholders, in consultations and the challenge workshop, suggested that manufacturing in Blackpool is often ‘lost’ as a result of the focus on tourism and retail employment.
3.26 Data from the Experian database gives a further perspective on the sectoral nature of Blackpool’s economy. The database provides information on the number of on-site employees for all businesses registered in the Blackpool Local Authority District according to ‘Yellow Pages’ categories. This helps to provide a more ‘real world’ reflection on the economic base in Blackpool than standard sectoral definitions.
3.27 Consistent with BRES, the data indicate that Hotels/Inns and Hospitals are by some margin the largest sources of employment in the town – collectively supporting almost 16,000 employees. Experian/Yellow Pages data on all categories that support over 250 employees in Blackpool are set out in Table 3-6. These account for 58% of all employees.3 Other notable data include:
• around 3,000 employees in schools and colleges
• around 450 in the building/construction industry
3 The total employees in the database is 71,000 higher than the publicly available data (60,000).The database draws on Companies House records so may include businesses that are no longer actively trading. The data should therefore be regarded as indicative only.

Local Economy Baseline for Blackpool A Report to Blackpool Council
20
• significant concentrations in financial and professional services including over 400 employees in solicitors, and over 1,200 in banks and financial institutions.
Table 3-6: Employment in Blackpool by Yellow Pages classification – all over 250 employees
500 and over 250 to 500
YP Classification Number YP Classification Number
Hotels & Inns 8,060 Charitable & Voluntary Organisations 490
Hospitals 7,790 Restaurants – Speciality 480
Supermarkets 3,300 Builders 450
Schools & Colleges 3,060 Hairdressers 450
Sports Grounds & Stadia 2,000 Solicitors 440
Guest Houses 1,310 Clubs & Associations 400
Banks & Financial Institutions 1,210 Grocers & Convenience Stores 400
Doctors (Medical Practitioners) 1,100 Bed & Breakfast 390
Residential & Retirement Homes 930 Pharmacies 380
Pubs 810 Confectionery 370
Bus, Coach & Tram Services 750 Plastics - Manufacturers & Supplies 370
Theatres & Concert Halls 699 Taxis & Private Hire Vehicles 350
Nursing Homes 640 Night Clubs & Bars 330
Food Manufacturers 630 Cafes & Coffee Shops 320
Health Authorities & Primary Care Trusts 560 Training Services 310
Take Away Food 540 Tourist Attractions 310
Police 500 Department Stores 310
Clothes Shops – Ladies 270
Security Services & Equipment 260
Source: Experian database provided by Blackpool MBC Note: data rounded to nearest 10
3.28 Blackpool’s business base is ‘different’ in two further ways. First, a noticeably higher proportion of employees work part-time. As shown in Figure 3-4, 39% of employees in Blackpool in 2009 were in part-time employment, compared to under a third in relevant comparators. Part-time employment in Blackpool was particularly pronounced in the Accommodation and food service activities, where over half of all employees were part-time (54%), and in Wholesale and retail where 49% were part-time.
3.29 As noted above, Manufacturing is an important sector for full-time work: over 90% of employees in Manufacturing in Blackpool in 2009 were in full-time employment.

Local Economy Baseline for Blackpool A Report to Blackpool Council
21
Figure 3-4:Full-time and part-time split of employment
Source: BRES
3.30 Second, Blackpool is far more reliant on public sector employment than elsewhere, as shown in Table 3-7.
Table 3-7: Public sector employment and private sector job growth
% employees in public sector Private sector job growth 2005 -2008
Blackpool 31% 0.0%
Fylde Coast 25% 6.4%
Fylde Coast excluding Blackpool 20% 10%
Lancashire 23% 3.0%
England 20% 2.7%
Source: National Statistics
3.31 The public sector can provide high-value and professional employment at senior levels, labour market accessibility at more junior levels, and relatively flexible labour, with high-rates of part-time work available. However, going forward, further public sector job losses are likely to be seen, following those that have already taken place in Blackpool.
3.32 Research by Blackpool Council and the Blackpool, Fylde, and Wyre EDC with 22 public sector agencies across the Fylde Coast reported that all these organisations expected to cut jobs in coming years. It was estimated that across the Fylde Coast as a whole, there could be up to 6,500 redundancies in the public sector affecting Fylde Coast residents, and up to 8,300 in all (including those who work in the Fylde Coast but live elsewhere).
3.33 Given the lack of employment dynamism elsewhere in Blackpool’s economy, this represents a real threat to the local economy, and one that was highlighted consistently by local stakeholders. However, potential opportunities were also identified – with, for example, the skills and capabilities of redundant public sector staff perhaps being leveraged to attract firms to set-up back office functions or customer focused activities.
61%67% 68% 68%
39%33% 32% 32%
0%
10%
20%
30%
40%
50%
60%
70%
80%
90%
100%
Blackpool Fylde Coast Lancashire England
Employees
Part-time
Full-time

Local Economy Baseline for Blackpool A Report to Blackpool Council
22
3.34 Emphasising further the scale of this challenge, the data show that over the 2005-08 period there was no overall private sector job growth in Blackpool – so when job losses in the public sector occurred, overall levels of employment went down, as shown in Table 3-8.
Table 3-8: Changes in public and private sector employment in Blackpool
2005 2006 2007 2008 Change
Private 39,300 40,600 40,400 39,300 0
Public 18,700 19,000 17,100 17,600 -1,100
Overall 58,000 59,600 57,500 56,900 -1,100
Source: National Statistics
3.35 Reflecting the high-rates of public sector employment, lack of private sector growth, and the nature of the public sector in Blackpool (for the most part, service delivery and administrative functions, rather than research-led activity or head offices), the Centre for Cities identified Blackpool as one of the most vulnerable places in the country to all public sector cuts on its ‘Index of Vulnerability’, as shown in Figure 3-5.
Figure 3-5: Index of vulnerability to public sector cuts
Source: Centre for Cities (2010) Cities Outlook 2010
Innovation
3.36 Innovation is recognised as a key driver of productivity, although this is difficult to measure at LAD level. As a proxy, we assessed the proportion of businesses and employees in Knowledge Intensive Businesses (KIBs)4. The data show, not unexpectedly given the high proportion of retail, accommodation and (non-university) education employment in Blackpool, the proportion of employees in Knowledge Intensive Businesses is well below comparator levels.
4 OECD definition

Local Economy Baseline for Blackpool A Report to Blackpool Council
23
Figure 3-6: Proportion of employees in Knowledge Intensive Businesses
Source: ABI
3.37 However, three points are of note here:
• First, the proportion of employees in KIBs in the Fylde Coast, including Blackpool, highlights the potential to capitalise on the knowledge-base of the businesses in this area, including strengths in advanced and high-value manufacturing – some of the people who were part of the overall 1,400 jobs downsizing of manufacturing over the last decade could be particularly well placed.
• Second, although not evidently strong in ‘traditional’ knowledge /innovation industry, Blackpool itself has an important and growing creative industries sector that can play an important role in driving innovation in the local area, capitalising on the town’s reputation for creative firms and entrepreneurs, and with the two creative industries incubators in the town the platform appears to be there to progress this agenda further – as highlighted by local stakeholders, Blackpool is known as a ‘quirky’ and ‘creative’ place, and this has real economic potential going forward.
• Third, the development of the University Centre provides an important push to develop the knowledge economy of Blackpool, both directly, and through leveraging links for the benefit of the business base with the research-intensive Lancaster University that awards degrees at the University Centre – although the lack of a full university presence in Blackpool is recognised as a missed opportunity for Blackpool, and indeed the entire Fylde Coast economy, by a number of local stakeholders, they welcomed the University Centre focus on providing courses and learning opportunities that align with Blackpool’s traditional strengths, for example, in acting and musical theatre and tourism, sports and leisure.
3.38 Further, the recent announcement of potentially significant natural resources in Blackpool and the surrounding area may provide the potential for significant future high-value research, technical and professional services jobs. At this point this opportunity is highly uncertain and Blackpool should not rely on, or expect, this new employment in the short term to address its knowledge economy deficits. However, thinking through the potential skills needs and gaps
0%
2%
4%
6%
8%
10%
12%
14%
16%
18%
Blackpool Fylde Coast Lancashire England
Pro
po
rtio
n o
f e
mp
loy
ee
s in
KIB
s

Local Economy Baseline for Blackpool A Report to Blackpool Council
24
should this opportunity progress will be important in order to maximise the potential for local benefits, both for the employment base and in the local supply-chain.
Competitiveness
3.39 Overall, taking into account the various data messages and wider evidence from consultations and literature above, how competitive is Blackpool’s economy?
3.40 On the one hand, the data on business survival rates, and feedback from local stakeholders in the private sector, suggests that Blackpool is a competitive place to be in business. Crucially, the lower business survival rates suggest that accessing markets and remaining profitable is a major issue for firms across Blackpool, and these closures drag down substantially the overall performance of the economy.
3.41 Although non-viable and non-profitable businesses closing is not in itself problematic in dynamic and enterprising economies, where there are strong pipelines of growth orientated businesses, this is simply not the case in Blackpool. Here, the business base is in decline, albeit fairly gently, and because enterprise rates have been low in recent years, the business closures are not, overall, being replaced by new, more viable and profitable firms. Further, as employment numbers and the population of Blackpool continue to decline, being in business in Blackpool for those that do survive is increasingly tough.
3.42 But from an external perspective, how competitive is Blackpool compared to other places. The following advantages were highlighted by local stakeholders. Blackpool:
• offers a relatively low cost business location, both in terms of premises and wages
• has a well-developed and well-defined set of sectoral strengths i.e. people know what Blackpool is about in terms of its tourism economy
• now has a critical mass of high-quality large-scale visitor attractions, that may attract more investment to the town from the tourism sector directly, and attract increasing professional services and other ancillary firms
• has a large (though declining) population and labour market both in the LAD itself and the broader Fylde Coast area
• has good motorway connectivity and proximity to large urban centres (Manchester, Liverpool and Preston) in the North West, as well as an airport.
3.43 However, the data-based evidence suggests that Blackpool is not a competitive place vis a vis other areas. Notably the UK Competitiveness Index (UKCI)5, an integrated measure of competitiveness based on a range of measurable factors, ranked Blackpool 372 out of the 379 LADs across England in 2010. Further, as shown in Table 3-9 Blackpool has consistently ranked well to the bottom of the Index over the last five years.
5 Produced by Robert Huggins at the University of Wales Institutes’ Centre for International Competitiveness

Local Economy Baseline for Blackpool A Report to Blackpool Council
25
Table 3-9: UK Competitiveness Index for Blackpool LAD
2005 2006 2008 2009 2010
Blackpool 356 387 397 376 372
Base 434 434 407 379 379
Source: UK Competitiveness Index Note: there was no index produced in 2007
3.44 These data should not be taken too literally. Some of the indicators on which the index is based may be at least partially interdependent. However, the Index does highlight the challenges faced by Blackpool in competing with other business locations, despite the advantages identified by local stakeholders.
3.45 Underpinning this ranking from a business perspective, and driving the overall relatively low levels of competitiveness in Blackpool, is the sectoral nature of the economy, with the business and employment base over-represented in industries such as retail and tourism, where productivity and wages are low. Further, the reliance on the public sector, given likely future employment and spending cuts, means that Blackpool will struggle to improve its competitive position in an increasingly challenging economic environment.
Key messages
• Blackpool’s business base has declined in scale gradually over recent years, continuing a long-term trend. Although Blackpool has not been ‘haemorrhaging’ businesses in recent years, nor has it been replacing failing firms with viable new ones at a fast enough rate. Blackpool’s business base is stable at best, and the direction of travel appears to be down, not up.
• Blackpool’s businesses appear generally to be less resilient – or perhaps plan less for the long term - than those in other places. Although there is a reasonable level of start-ups, businesses exhibit lower survival rates in the early years in Blackpool than elsewhere, and the recession has exacerbated this, with business closures outnumbering business starts.
• Blackpool’s business base remains very ‘different’ to the national picture, and notably, to the wider Fylde Coast and to Lancashire. Retail, the public sector and accommodation (plus wider tourism economy business) remain the key employment foundations of the economy – all these sectors face considerable challenges going forward. Only in financial services has Blackpool seen employment rises over the past decade – this sector, of course, faces its own challenges.
• Blackpool has important competitive assets and advantages – it is at the heart of a major economic area, is price competitive in terms of labour and premises, and now has a critical mass of major visitor attractions and, for a coastal location, it also has good transport access. But, Blackpool’s sectoral mix and low productivity/wage economy mean that its overall competitiveness as a business location, relative to other places in England is low.

Local Economy Baseline for Blackpool A Report to Blackpool Council
26
4: People
4.1 This section focuses on Blackpool’s economy from the perspective of People, with a focus on Blackpool as a residential location and its broader service offer.
Key questions and coverage
4.2 A set of Research Questions were developed to frame the analysis for the People Theme. The key questions, and the data collated/analysed to provide evidence on these issues, are set out in Table 4-1.
Table 4-1: Key questions and data for the People Theme
Key questions Key sources of data and information
• How many people live in Blackpool, and what is the demographic profile of Blackpool?
• Mid-year population estimates
• Migration data from ONS
• How does Blackpool perform in terms of labour market participation?
• Annual Population Survey
• DWP Benefits
• What are the current skills levels amongst the resident adult population, and how strong is Blackpool's education performance for its resident population of young people?
• Annual Population Survey
• Department for Education
• What is the earnings and income profile of Blackpool as a residential location?
• Annual Survey of Hours and Earnings
• What challenges does Blackpool face in terms of economic and social exclusion, including health?
• Index of Multiple Deprivation
• DWP Benefits
• Public Health Observatory Health Profiles
Source: SQW
4.3 In addition to this data evidence, the findings also drew on the review of literature undertaken for this work and feedback from the consultations with local stakeholders and the Challenge Workshop held in Blackpool in late September. Additional evidence on the People Theme can be found in the attached Baseline Database.
The evidence base
Population context
4.4 Blackpool had a population in 2010 of 140,000. However, as noted in Section 2, this was about 9,000 fewer than in 1981. The population of Blackpool grew briefly in the early 1990s, reaching a high point of 151,000 in 1993. After this, the population fell in most years except 2002-05 when numbers held up and increased slightly.
4.5 Blackpool is by no means unique in seeing a reducing population in aggregate over the past three decades. Many large conurbations across the North similarly saw their populations decline and are smaller now that they were in the early 1980s. What is different about

Local Economy Baseline for Blackpool A Report to Blackpool Council
27
Blackpool is that the population is still falling – many other places like Liverpool and Manchester have seen renewed population growth in recent years. The lack of a growing local business base to provide employment opportunities, as discussed in the previous section, is almost certainly the reason why Blackpool has not witnessed a similar renaissance.
4.6 The working age population in Blackpool has also declined markedly since the early 1990s, as shown in Figure 4-1. This means that there are fewer people in Blackpool to create businesses, supply labour, and support the local retail and service sector.
Figure 4-1: Working age population 1992-2010
Source: Mid-year population estimates
4.7 As both the total population and working age population have decreased at broadly the same rate since the mid-1990s, the proportion of the total population that are of working age in Blackpool has remained largely consistent at around 62%, which is below the national average of 65%. This differential may seem modest, but, if Blackpool had the same proportion of people of working age as in England, there would be over 3,500 more residents of working-age in the area – not an insubstantial figure.
4.8 This lower proportion of people of working age in Blackpool results from a higher proportion of over-65s than across England and Lancashire, reflecting the attractiveness of seaside locations for retirees, and Blackpool’s failure to attract in-migrants of working age. The split of the population by age for Blackpool and comparators is set out in Table 4-2.
Table 4-2: Age split of resident population
Blackpool Fylde Coast Lancashire England
Proportion of working age 62.3% 61.1% 63.5% 64.8%
Detailed age split
0 to 14 17.1% 15.7% 17.6% 17.5%
15 to 24 12.9% 11.8% 13.6% 13.2%
25 to 39 16.4% 15.4% 17.4% 20.0%
40 to 64 34.2% 35.1% 33.8% 32.8%
Over 65 19.4% 22.0% 17.6% 16.5%
Source: Mid-year population estimates
85
90
95
100
105
110
115
1992
1993
1994
1995
1996
1997
1998
1999
2000
2001
2002
2003
2004
2005
2006
2007
2008
2009
2010
WA
P (1
992
= 1
00)
Blackpool Fylde Coast Lancashire England

Local Economy Baseline for Blackpool A Report to Blackpool Council
28
4.9 Given the strength of Blackpool’s functional linkages to the wider Fylde Coast discussed in Section 2, the demography of the Fylde Coast is also important. The Fylde Coast has an even higher rate of over-65s than Blackpool, thus reducing the potential stock of workers that can be attracted to Blackpool for its business base. This ‘supply factor’ may also help to explain the weaker employment pull of Blackpool from the Fylde Coast discussed previously.
4.10 That said, a clear message from consultations with local stakeholders is that the over-65 population in the Fylde Coast represents a potentially lucrative source of expenditure in Blackpool’s retail and leisure economy, with many prosperous residents in and around areas such as Lytham and Poulton-le-Fylde. However, at present this resource is under-utilised owing to Blackpool’s offer – an issue that requires both investment and changes in broader perceptions/attitudes – which may take time to achieve.
Migration
4.11 Blackpool has experienced significant, though declining, international migration in recent years. Over 2005-10 the average number of National Insurance Numbers (NINOs) assigned to overseas residents moving to Blackpool was 1,000, in 2010 it was 570.
4.12 As demonstrated in Figure 4-2 the number of NINOs per 10,000 of the population decreased in Blackpool steadily over 2007-10, in line with, though more pronounced than, the trend across England. Blackpool’s rate of international migration per head in 2010 was broadly in line with the average across Lancashire. While not all these people will necessarily stay to work in the local area, they do represent an opportunity for local businesses to access new labour and skills.
4.13 There was some anecdotal evidence from our consultations that many jobs created in recent years have been taken by migrants (from Eastern Europe) in particular, although given the high levels of non-participation in the labour market in Blackpool (see below) it is unlikely they have significantly displaced labour market activity by local people.
Figure 4-2: NINOs per 10,000 of the population
Source: ONS
0
20
40
60
80
100
120
140
160
2005 2006 2007 2008 2009 2010
NIN
Os
per
10,0
00 p
opul
atio
n
Blackpool Fylde Coast Lancashire England

Local Economy Baseline for Blackpool A Report to Blackpool Council
29
4.14 An important issue for Blackpool, as raised consistently by the local stakeholders engaged in this study, is that of UK-based migration, with high levels of ‘transience’ as people move in and out of Blackpool, often attracted by the availability of cheap rented accommodation, and very often on benefits/not in employment.
4.15 Although this is a commonly cited issue, the evidence on its scale and significance is limited by the lack of data on transience. Data from ONS suggests that over the past five years Blackpool has seen around 7,500-8,000 movements into and out of Blackpool from/to other Local Authority Districts across England and Wales, with a broadly even balance each year. Although relatively high, this probably understates the total number of temporary movements, and does not capture the impact on particular locations.
Table 4-3: Migration movements to/from Blackpool by residents in England and Wales
Movements 2006 2007 2008 2009 2010 Average p.a.
Inlows 8,000 8,100 7,600 7,500 7,600 7,760
Outflows 7900 8000 7800 7600 7600 7,780
Balance 100 100 -200 -100 0 -20
Source: ONS
4.16 Analysis by the Council has also found that Blackpool contains Middle Level Super Output Areas with some of the highest average population inflow rates in England and Wales, meaning that over the course of a year (based on the latest data), Blackpool appears to have exceptionally high levels of people moving into some parts of the town. Further, Council analysis suggests that additional temporary movements add about 2,100 each year to the totals in Table 4-3, as demonstrated in the graphic below (Figure 4-3).
Figure 4-3: Migration movements to/from Blackpool
Source: Blackpool Council

Local Economy Baseline for Blackpool A Report to Blackpool Council
30
4.17 This estimated overall turnover of about 10,000 people each year, is very high for a population of around 140,000. Ultimately, however, the key issue for Blackpool, as evidenced by our consultations and literature review, is not the scale as such, rather the characteristics of the population involved – with low skills, poor health and high levels of worklessness, crime and benefit dependency.
4.18 This combination of factors has a negative overall impact on Blackpool’s economy, both directly in terms of calls on service provision and expenditure, and damage to the visitor experience and perceptions, and indirectly in helping to sustain the low-quality private rented sector in the housing market and the wider image of the town. Dealing with this issue is seen as a key priority for the area by local policy makers and other stakeholders.
Labour market conditions
Economic activity and employment
4.19 The economic activity rate (people directly in work or actively seeking it) in Blackpool stood at around 75% in 2010. This does represent a deficit to other areas, although Blackpool has recovered from a major reduction in economic activity over 2006-07 when, as shown in Table 3-8 above, there was a significant reduction in recorded public sector employment in Blackpool.
Figure 4-4: Economic activity rate
Source: APS
4.20 Interestingly, however, and reflecting the sectoral nature of the economy in Blackpool described in section 3, the deficit in economic activity in Blackpool is driven principally by male inactivity: female economic inactivity in Blackpool is broadly in line with the national level.
4.21 Positively, the data show an increase in the number and proportion of economically inactive people in Blackpool who ‘want a job’ in recent years. Not all economically inactive people are able, or want to, work, however, as shown in Table 4-4. In 2005, 17% of the economically inactive in Blackpool wanted a job. By 2010 this rate had increased to 27%, which equates to
65
68
71
74
77
80
2005 2006 2007 2008 2009 2010
Eco
nmic
act
iviy
rat
e (%
WA
P)
Blackpool Fylde Coast Lancashire England

Local Economy Baseline for Blackpool A Report to Blackpool Council
31
some 2,000 more people in Blackpool looking to find work. The recession plays a crucial role here – it has been observed nationally that as people become less confident over their economic prospects, the proportion ‘wanting a job’ has tended to increase. However, the shift in Blackpool has been notably more pronounced than in comparator areas.
Table 4-4: Proportion of the economically inactive population who want a job
2005 2006 2007 2008 2009 2010
PP Change
Blackpool 16.9 14.6 24.2 24.2 23.3 27.2 10.3
Fylde Coast 16.4 18.5 19.5 27.4 22.3 19.6 3.2
Lancashire 17.6 16.5 19.4 23.4 21.7 21.1 3.5
England 21.7 23.0 22.4 23.7 23.7 23.7 2.0
Source: APS
4.22 Consistent with a relatively low activity rate, the employment rate in Blackpool has also been generally lower than comparators. However, the unemployment data for Blackpool are more concerning – the deficit to comparators is now larger and a downward trend in the employment rate has been observed over the last two years, in contrast to an increasing employment rate in Lancashire and no change in the Fylde Coast as a whole. In total, 2,800 fewer residents of Blackpool were in employment in 2010 than in 2005. Whilst Blackpool mirrored the national trend over 2008-10, it started from a very much lower base.
Figure 4-5: Employment rate
Source: APS
4.23 Again, however, the issue is principally related to male unemployment, with the deficit to England for male unemployment in 2010 at 5.1 percentage points, compared to 0.5 percentage points for women. Further, although in 2010 a higher proportion of Blackpool’s employed residents worked full-time than nationally, this was driven by female full-time employment, as set out in Table 4-5. By contrast male employment in Blackpool is characterised by higher rates of part-time working than elsewhere.
62
64
66
68
70
72
74
2005 2006 2007 2008 2009 2010
Em
ploy
men
t rat
e (%
WA
P)
Blackpool Fylde Coast Lancashire England

Local Economy Baseline for Blackpool A Report to Blackpool Council
32
Table 4-5: Full time and part-time employment
Full-time Part-time Full-time - male
Part -time - male
Full -time - female
Part -time - female
Blackpool 75.4 24.5 85.7 14.3 63.9 35.9
Fylde Coast 76.1 23.9 89.4 10.6 61.2 38.7
Lancashire 74.7 25.1 86.9 12.8 60.7 39.3
England 74.2 25.7 88.4 11.4 57.7 42.2
Source: APS
4.24 The seasonality of the visitor economy is important in shaping local patterns of employment – if hotels and accommodation providers are closed and/or under-utilised during the winter months then the requirements for staff will reduce. Further, given the knock-on effect of the tourism economy on the wider economy as discussed in the Business Theme section, other employment will also feel the effects.
4.25 The seasonal nature of employment, and its impact on levels of unemployment, is demonstrated in Figure 4-6 showing the very significant shifts within each year in Blackpool, compared to the England average. So, whilst the overall pattern mirrored England-wide movements between 2005 and 2011, there have been notable year-to-year fluctuations in those in and out of employment in Blackpool.
Figure 4-6: Job seekers allowance rates in Blackpool and England by month
Source: DWP
4.26 One of the key strengths in Blackpool’s tourism economy, as articulated by local stakeholders and discussed in more detail in Section 5 is the extent to which it has a longer season than elsewhere, with the Illuminations and conference markets playing a key role. The data suggest, however, that despite this longer season, the sheer scale of the tourism economy in Blackpool, and the reliance of local people on employment in this sector means that seasonal fluctuations in labour market engagement remain a key issue for the economy. This matters to local people as they have a less certain income stream, they may have lower wages when they are in work, and they are less likely to benefit from training and workforce development.
0
1
2
3
4
5
6
7
Jan
-05
Ap
r-0
5
Jul-
05
Oct
-05
Jan
-06
Ap
r-0
6
Jul-
06
Oct
-06
Jan
-07
Ap
r-0
7
Jul-
07
Oct
-07
Jan
-08
Ap
r-0
8
Jul-
08
Oct
-08
Jan
-09
Ap
r-0
9
Jul-
09
Oct
-09
Jan
-10
Ap
r-1
0
Jul-
10
Oct
-10
Jan
-11
Ap
r-1
1
Jul-
11
JSA
Cla
ima
nts
as
% W
AP
Blackpool
England

Local Economy Baseline for Blackpool A Report to Blackpool Council
33
Employment demand
4.27 To what extent is there demand for employees in Blackpool, and how does this compare to the scale of the population seeking work? To answer this, the number of vacancies advertised in July of each year over 2005-11 was tracked (given the seasonal nature of employment, this is the point at which we can expect there to be the highest demand for labour). These vacancies have then been compared to the number of JSA claimants at that date.
4.28 As shown in Table 4-6, fewer vacancies are being advertised in Blackpool than previously, and the average number has continued to fall in the last three years. As a result, competition for each vacancy has increased substantially. In July 2011, there were 5.7 JSA claimants for each vacancy, compared to 2.0 in 2005.
Table 4-6: Vacancies advertised and JSA claimants per vacancy
2005 2006 2007 2008 2009 2010 2011
Vacancies advertise d (2005 = 100)
Blackpool 100 87.8 102.6 68.3 88.5 86.0 75.2
Fylde Coast 100 98.6 98.6 74.5 97.4 85.9 76.7
Lancashire 100 115.8 101.1 88.6 90.6 91.8 96.8
England 121.9 113.1 109.9 92.7 113.2 136.3 121.9
JSA Claimant per vacancy
Blackpool 2.0 2.8 2.2 3.3 4.0 4.2 5.7
Fylde Coast 1.8 2.2 2.0 2.7 3.4 3.8 5.0
Lancashire 1.8 1.8 1.9 2.3 4.0 3.4 3.6
England 2.9 2.6 2.6 2.7 5.7 4.2 3.7
Source: DWP
Occupations and earnings
4.29 The residence-based occupational structure of Blackpool in 2010 (that is, the type of jobs held by people who live in the town) is set out in Figure 4-7. As shown, Blackpool has a lower proportion of residents in the managerial and professional occupations than all comparators (including Lancashire as a whole), with a higher proportion in lower-paid administrative, sales and personal services occupations.
4.30 This again is driven by the sectoral nature of the work-based economy in Blackpool, with a greater share of employment in the retail and accommodation sectors in lower level occupations. Further, as we saw in Section 2, around half of those residents who do work in higher-value occupations travel outside of Blackpool to do so, and over half of the higher value jobs in Blackpool are taken by non-residents.

Local Economy Baseline for Blackpool A Report to Blackpool Council
34
Figure 4-7: Resident occupations
Source: Annual Population Survey
4.31 Encouragingly, the proportion of Blackpool residents employed in higher-value occupations has, however, increased over the last five years – in 2005 just under 30% of employed residents were in the ‘top’ three managerial/professional occupational groupings, compared to approaching 35% in 2010. In aggregate terms this equates to 3,200 more residents of Blackpool employed in these occupations in 2010 than five years earlier. Blackpool’s residents still generally do lower value jobs than is the case nationally, but the quality of the resident base’s employment status has been improving.
4.32 The principal driver of this change in occupational structure has been in ‘Associate Professional and Technical Occupations’6 – 2,900 of the additional 3,200 residents of Blackpool in the ‘top three’ operational grouping came from this group. Indeed, the actual number of residents in the highest ‘Managers and Senior Officials’ grouping stayed the same in Blackpool over 2005-10 (6,900 residents).
4.33 Therefore, although the improvement in the occupations of Blackpool residents is genuine, with more residents in associate professional occupations, and fewer in administrative and secretarial occupations, the number of residents in the highest value occupations has remained essentially static over the last five years. By contrast, across England the number of Managers and Senior Officials increased by 6%.
4.34 Earnings are higher in professional occupations – for example, nationally, average weekly earnings of managers and senior officials (where Blackpool is under-represented compared to England) were two thirds higher than those for elementary occupations (where Blackpool is over-represented). As a result, average resident earnings in Blackpool have consistently lagged well behind national levels, as shown in Figure 4-8. Given that the cost of living is
6 These are occupations focused on providing support to Professionals and to Managers, Directors and Senior Officials, and taking ‘operational’ responsibilities; examples include for example, the operation and maintenance of complex equipment; legal, business, financial and design services, and the provision of IT services.
34.741.8 39.5
45.0
34.7
33.131.9
29.7
30.324.9 28.2 24.9
0
10
20
30
40
50
60
70
80
90
100
Blackpool Fylde Coast Lancashire England
Pro
po
rtio
of
resi
de
occ
up
ati
on
sSales & customer service
occupations/Process, plant &
machine operatives/Elementary
occupations
Administrative & secretarial
occupations/Skilled trades
occupations/Personal service
occupations
Managers & senior
officials/Professional
occupations/Associate prof &
tech occupations

Local Economy Baseline for Blackpool A Report to Blackpool Council
35
increasing nationally – with rising fuel prices and food costs in particular – this suggests that maintaining living standards is likely to become increasingly challenging for local people. Indeed, as set out in Section 2, Gross Disposable Household Income in Blackpool is well below comparator levels – £12,200 in 2009 in Blackpool, compared to £13,700 in Lancashire and £15,400 in England.
4.35 Further, low potential earnings in the area make it harder to ‘make work pay’, reduce benefits dependency and encourage the local workless population back into employment. It is also notable that annual workplace earnings in Blackpool are essentially the same as resident earnings (£18.7k for workplace earnings) – reflecting the even balance of in/out movements from those working in higher value occupations.
Figure 4-8: Resident earnings in Blackpool and England
Source: ASHE
4.36 Residents’ earnings in Blackpool are also well below those in Fylde, and below those in Wyre for full-time workers. Interestingly, part-time earnings in Blackpool are more in line with levels elsewhere – given the higher proportion of employees that work part-time, as discussed above this does help, in part, to offset lower full-time wages.
Table 4-7: Full-time and part-time median annual earnings across the Fylde Coast
Blackpool Fylde Wyre
Full-time 18,500 28,700 21,900
Part-time 8,300 - 8,100
Source: ASHE
4.37 Overall the data on occupations and earnings suggest that a major job remains to be done to provide access to, and demand for, higher quality jobs both in Blackpool, and the wider Fylde Coast. This is a key issue for Blackpool’s economy, however, our sense from consultations and engagement with local stakeholders is that the focus is principally on sectoral change, and driving up the quality of the local tourism offer. These are important issues, but wages are determined by occupation as much as sector – professional jobs in tourism and retail pay well – and the focus on driving up skill levels and local engagement across all sectors will also be vital to Blackpool’s future. This will involve partners working closely with businesses (and
0
5,000
10,000
15,000
20,000
25,000
30,000
2006 2010
Me
dia
n a
nn
ua
l ea
rnin
gs
-re
sid
en
t
Blackpool F/T Blackpool P/T England F/T England P/T

Local Economy Baseline for Blackpool A Report to Blackpool Council
36
potential inward investors) to ensure that the skills provision in the local area meets the needs of businesses that operate in higher productivity activities, and therefore provide the opportunities for Blackpool’s residents to work in higher level/higher wage occupations.
Skills and education
4.38 The skills base of the local population is a key determinant of economic performance. High skills amongst the adult population can attract investment and new businesses to an area, and people with higher skills are generally employed in higher value occupations and tend to be more likely to start-up a successful business. However, Blackpool has experienced long-term challenges in skills development. Owing to the traditional dominance of tourism and associated retail/service occupations in the town – where qualifications have traditionally been low – the resident base has included a high proportion of people with no or low levels of qualifications, and a low proportion (relative to elsewhere) with higher level qualifications.
4.39 This remains the case. As shown in Table 4-8 just under 20% of Blackpool’s resident population had Level 4+ qualifications in 2010 (equivalent to a first degree or above) compared to approaching or over 30% in comparators.
Table 4-8: Qualifications of the resident population (16-64)
NVQ4+ NVQ3 only NVQ2 only NVQ1 only No Quals
Blackpool 19.4 14.8 22.7 13.3 16.5
Fylde Coast 27.6 14.4 20.9 11.1 12.7
Lancashire 29.7 16.2 17.7 12.7 12
England 31.1 15.8 16.3 13.3 11.1
Source: APS
4.40 However, qualification levels amongst the resident population in Blackpool have been improving – crucially, by 2010 more people had Level 4 qualifications than No Qualifications, the reverse was the case in 2005, as demonstrated in Figure 4-9.
Figure 4-9: Qualification of the Blackpool resident working-age population
Source: APS
10
12
14
16
18
20
22
24
26
2005 2006 2007 2008 2009 2010
% o
f th
e W
AP
(1
6-6
4)
% with NVQ4+
% with NVQ3 only
% with NVQ2 only
% with NVQ1 only
% with no qualifications

Local Economy Baseline for Blackpool A Report to Blackpool Council
37
4.41 Trends in the educational performance of young people are also broadly positive – suggesting improving overall levels of skills and capacity in the local area, important for future economic prospects. GCSE results have been improving, although deficits remain to national averages (see Table 4-9).
Table 4-9: Performance at GCSE
2005-2006
2006-2007
2007-2008
2008-2009
2009-2010 Change
Average Point Score per Pupil
Blackpool 330.7 352.7 361.8 401.1 435.3 32%
England 360.3 368.4 391.8 418.9 448.8 25%
Percentage achieving 5+ A* -C grades
Blackpool - 5 A*-C 49 52 54 66 74 25pp
England - 5 A*-C 57 60 65 70 76 19pp
Percentage achieving 5+ A* -C grades inc l. English & Maths
Blackpool - 5 A*-C incl English/Maths 34 35 35 39 47 13
England - 5 A*-C incl English/Maths 44 46 48 51 55 11
Source: Department for Education
4.42 However, performance at GCSE across Blackpool remains very mixed – with only one school in Blackpool (Montgomery High School, Bispham), performing above the national average on GCSE results including English and Maths. This chart excludes the (private) Arnold School which performs very strongly with 99% of pupils achieving 5+ A*-C in 2010 (against the national average of 76%).
Figure 4-10: GCSE performance by school across Blackpool
Source: DfE
England
0%
10%
20%
30%
40%
50%
60%
70%
Beacon Hill
High School
Business and
Enterprise
College
Bispham
High School -
An Arts
College
Collegiate
High School
Highfield
Humanities
College
Montgomery
High School -
A Language
College and
Full Service
School
Palatine
Community
Sports
College
St George's
School A
Church of
England
Business &
Enterprise
College
St Mary's
Catholic
College
Pu
pil
s a
chie
vin
g 5
+ A
*-C
in
cl E
ng
lish
& M
ath
s

Local Economy Baseline for Blackpool A Report to Blackpool Council
38
4.43 Positively, however, pupils in Blackpool that stay on in education post-GCSE perform well, with A-Level results consistently above the England average in terms of average points scored over the last five years.
Table 4-10: Average A-Level points score
Average Point Score per Pupil 2005-2006 2006-2007 2007-2008 2008-2009 2009-2010
Blackpool 735.9 720.9 754.6 751.7 784.4
England 700.6 712.1 721.3 721.1 727
Source: DfE
4.44 Four further points are important in considering educational performance in Blackpool:
• Blackpool has a lower proportion of pupils staying on post-GCSE than nationally – 76% of young people stay in full-time education in Blackpool compared to 79% in England. This also reflects a higher proportion of people in part-time education, and/or moving between education and seasonal work in the local economy.
• Blackpool has a higher rate of young people that are Not in Employment, Education or Training (NEET) than nationally – with 7% NEET in Blackpool (over 500 young people aged 16-19) compared to 6.5% in Lancashire and 6% in England.
• Blackpool has good educational assets on which to build, including two highly rated colleges – Blackpool and the Fylde College and Blackpool Sixth Form College were both judged Good or Outstanding on all areas in their latest Ofsted Report (both published in 2009) – as the larger of the two institutions by some margin, Blackpool and the Fylde College was identified by stakeholders as a key asset and local strength.
• the new University Centre at Blackpool and Fylde College enhances Blackpool’s function as a key educational centre for the Fylde Coast as a whole. This broader educational role provides the area with an opportunity to attract and retain talented young people in Blackpool, and may help to attract new families to the area, especially given the relatively affordable housing (as discussed in the Place section).
4.45 That said, as discussed in the Business Theme, the lack of a larger HE presence in Blackpool is potentially a weakness of the area – given its size as an economy and residential location, and its role in the wider Fylde Coast, arguably Blackpool really should have a larger HE presence which could provide access to higher education for a wider range of local people, attract new people to the area, and provide a research and technical offer to help support local business growth and knowledge-based economic activity. The development of the role of the University Centre was recognised as a potential opportunity for Blackpool by local stakeholders – clearly given the current funding that will be challenging. With the Centre now well established, it has the potential to play an important role in further up-skilling the resident population, with a focus on sectorally relevant vocational learning.
Deprivation and social challenges
4.46 The final element in this review of Blackpool’s economy from the ‘People’ perspective, concerns the broader social and deprivation issues that impact on overall economic performance. Key findings from the data review include:

Local Economy Baseline for Blackpool A Report to Blackpool Council
39
• a high proportion of Incapacity Benefits Claimants in Blackpool compared to comparators – around 10% of the working age population claimed IB in Blackpool in early 2011 compared to under 5% in England and 7% across the Fylde Coast as a whole – as shown in Figure 4-11, although IB claimant rates in Blackpool have come down in recent years, the gap to comparators has remained pronounced
• low life-expectancy for both males and females – of 73.7 and 79.4 respectively – compared to England average of 78.3 and 82.3 respectively
• higher levels of smoking – the adult smoking rate over 2009/10 in Blackpool was around 30%, some 10pp higher than the average across England
• high levels of alcohol abuse and substance misuse: Blackpool had 2,400 hospital stays for alcohol related harm per 100,000 of population in 2009, compared to an average of 1,740 across England (although the data will be inflated by visitors given the prevalence of drinking parties among short-stay visitors), and a drugs misuse rate of 24 per 1000 resident population aged 15-64 against a national average of 9.4
• high levels of child poverty – according to the latest data, over 9,000 children live in poverty in Blackpool, around 30% of all children, compared to 21% across England.
Figure 4-11: IB/SDA claimant rates
Source: DWP
4.47 These issues, aligned with other factors set out above, in particular the data on earnings and labour market participation, as well as the key messages from the Business Theme discussed in the previous section, mean that Blackpool remains an area with high levels of overall deprivation. The Index of Multiple Deprivation 2010 ranked Blackpool as being:
• the 6th most deprived District in England when taking into account ‘extreme’ levels of deprivation in some neighbourhoods
• the 10th most deprived District, on an overall average level of deprivation basis.
4.48 These rankings represented an apparent worsening in relative deprivation in Blackpool, with equivalent rankings in the IMD 2007 of 12th and 18th respectively. The overall figures mask
0.0%
2.0%
4.0%
6.0%
8.0%
10.0%
12.0%
14.0%
2005 2006 2007 2008 2009 2010 2011
IB C
laim
ants
as
a %
WA
P
Blackpool Fylde Coast Lancashire England

Local Economy Baseline for Blackpool A Report to Blackpool Council
40
considerable spatial variation: Blackpool also has affluent areas. However, as demonstrated in Figure 4-12 extreme deprivation is found in local neighbourhoods across the town, albeit most concentrated around the core of the urban centre, where issues of transience, low skills and non-employment are most pronounced.
Figure 4-12: IMD 20010 in Blackpool
Source: CLG
4.49 Detailed research on the IMD 2010 by Blackpool Council suggests that the apparent intensification of deprivation rankings across Blackpool is owing to methodological in one of the domains (Housing) of the IMD.
4.50 However, the overall sense of increasing relative deprivation in the town suggested by the IMD is consistent, in our view, with the overall direction of travel related to Blackpool’s economy from a People perspective. As with the Business Theme the messages suggest not that Blackpool is now substantially worse off now than say a decade ago – although on some measures the data do point to that – but, rather that over the past few years Blackpool has not ‘closed the gap’.

Local Economy Baseline for Blackpool A Report to Blackpool Council
41
Key messages
• Blackpool’s working age population is decreasing, meaning there are fewer people to start businesses, provide labour for local firms, and generate the wealth that will drive the economy forward. A reducing working age population also means fewer people and families to spend their earnings in the local retail and leisure economy.
• Blackpool’s labour market engagement remains too low – there are too few people in work and too few people actively seeking work. However, labour market challenges in Blackpool are principally a ‘male issue’ with female engagement broadly in line with comparators.
• Competition for work is increasing, as the number of vacancies on offer in Blackpool has declined sharply – there are demand as well as supply issues in Blackpool’s labour market that need to be addressed. As well as more jobs, better quality jobs are also needed to meet increasing demand from those who are economically inactive and who do want to find work.
• More of Blackpool’s residents work in administrative, elementary and services occupations than elsewhere – the occupational structure is changing but not at the top levels. As a result, average earnings remain low, and they have not changed substantially in the last five years.
• Skills levels are improving for both adults and young people: a developing educational infrastructure in the area provides a key opportunity for attracting in new businesses and families – that said Blackpool remains a relatively low qualification economy.

Local Economy Baseline for Blackpool A Report to Blackpool Council
42
5: Place
5.1 This section focuses on Blackpool’s economy from the perspective of Place, including issues related to Blackpool as a residential and a commercial location.
Key questions and coverage
5.2 The Research Questions which framed the analysis for the Place Theme, and the data collated/analysed to provide evidence on these issues, are set out in Table 5-1.
Table 5-1: Place key questions and coverage
Key questions Key sources of d ata and information
• Is the housing stock in Blackpool appropriate to meet economic growth and inclusion, and is housing affordable to local people?
• CLG live tables on housing
• Housing monitoring report
• Is there adequate existing and pipeline commercial floorspace and employment land to support economic growth and inclusion?
• Commercial and Industrial Floorspace and Rateable Value Statistics
• Employment land review Update
• Is the infrastructure of Blackpool appropriate to supporting sustainable economic growth?
• Council transport statistics
• DECC resource use statistics
Source: SQW
5.3 Further to the data evidence identified above, the findings also draw on the review of literature completed for this work and the feedback from the consultations with local stakeholders and the Challenge Workshop held in Blackpool in late September. Additional evidence on the Place Theme can be found in the attached Excel Data Repository.
The evidence base
Housing
5.4 Blackpool is a major residential location, with approaching 70,000 dwellings across the Local Authority District area. It accounts for some 45% of the total housing stock across the Fylde Coast, and 11% across Lancashire.
5.5 In terms of the mix of the dwelling stock, Blackpool has a notably higher proportion of housing in the private sector than across Lancashire and England, as set out in Table 5-2. The over-representation of private sector housing in Blackpool is similar to the Fylde Coast as a whole, which shares many of the characteristics of large numbers of private rented housing units owing to former holiday accommodation in places such as Fleetwood and Lytham.

Local Economy Baseline for Blackpool A Report to Blackpool Council
43
Table 5-2: Housing mix by tenure
Local Authority Housing
Association Other Public Sector Private Sector
Blackpool 8% 3% 0% 90%
Fylde Coast 3% 5% 0% 91%
Lancashire 2% 10% 0% 87%
England 8% 10% 0% 82%
Source: CLG
5.6 In terms of dwelling type, Blackpool also has substantially lower proportion of detached properties (8%) than across the Fylde Coast, as shown in Table 5-3, and a higher rate of flats and terraced housing.
Table 5-3: Dwelling type
Detached
Semi-Detached Terraced Flat/
Maisonette Shared Other
Blackpool 8% 38% 31% 22% 0% 0%
Fylde Coast 19% 39% 24% 17% 0% 1%
Fylde 27% 34% 18% 19% 0% 2%
Wyre 27% 43% 18% 10% 0% 2%
Source: Census 2001
5.7 Looking at this data in more detail in terms of mix, an estimated 22% of the housing stock in Blackpool is in the private rented sector,7 although private rented housing accounts for over 50% in some central areas of the town. The private rented sector is also growing (up from 18% of the stock in 2001). This has prompted local concerns over levels of property investment and the quality of the offer, population shifts and disproportionally high levels of some transient groups, higher levels of voids, and neighbourhood stability, sustainability and cohesion issues. Poor quality housing also has health impacts, and knock-on implications for public services.
5.8 Specifically, the principal concern evidenced from our consultations and well-established in the literature is over Houses of Multiple Occupation (HMOs) of which there are at least 3,000 in Blackpool.8
5.9 HMOs in Blackpool are of varying quality, but, as stated in the recent Strategic Housing Market Assessment, ‘often poorly converted, inadequately maintained’ leading to ‘socio-economic problems associated with poor management & problem tenants’.9 The scale and quality of the HMOs in the town was identified as a key challenge for Blackpool by consultees for this study, and addressing this issue is a long-term policy imperative for the place.
5.10 Key characteristics of the HMO sector in Blackpool, as identified in the SHMA include:
7 Fylde Coast Housing Strategy 8 ibid 9 Fylde Coast Strategic Housing Market Assessment, 2008

Local Economy Baseline for Blackpool A Report to Blackpool Council
44
• over half are spatially concentrated in the four central wards of Claremont, Bloomfield, Talbot and Waterloo; this area also contains most of the hotels and guesthouse accommodation in Blackpool
• an estimated three-quarters of HMO landlords are Blackpool residents and the majority (approaching two thirds) have only one property – this suggests that many of the HMOs arise from proprietors of struggling holiday accommodation converting their business property into residential use
• the average rental level for HMOs (as reported in 2008) was approximately £79 per week, equating to approaching £14m per annum across the total stock – as a result, given the low levels of investment in the properties, the return for landlords is considerable
• the average value of a HMO property is estimated at around £143,000 (as reported in 2008) – in this context the cost of acquisition to intervene in the market place is very high.
5.11 These final two points, demonstrate that while HMOs may be damaging socially to the wider place and economy, they are highly profitable for landlords, and that intervening directly in the market on any scale would be very expensive. The tensions caused are considerable; this issue was consistently identified by stakeholders as both important and difficult to address.
5.12 Despite the price distortion caused by multiple occupancy, average house prices in Blackpool are, and have for some time, been well below those found elsewhere. This suggests the attractiveness of Blackpool as a residential location is limited. Importantly, as shown in Table 5-4, average house prices in Blackpool in 2010 were the same as in 2005 despite very significant increases elsewhere, of up to 16% in England and 18% in Lancashire.
Table 5-4: Median house prices (£)
2005 2006 2007 2008 2009 2010 Change
Blackpool 105,000 115,000 119,000 114,995 103,000 105,000 0%
Fylde 154,150 174,000 178,000 175,000 165,000 172,875 12%
Wyre 135,000 143,000 150,000 144,000 141,000 140,000 4%
Lancashire 110,000 122,358 130,000 126,500 130,000 129,950 18%
England 159,950 168,500 178,000 174,000 170,000 185,000 16%
Source: CLG
5.13 Wider housing data also suggest that Blackpool’s attractiveness as a residential location, for both investors and buyers, is weakening. For example:
• the reduction in property sales witnessed nationally as a result of the recession and challenges in accessing finance has been particularly pronounced in Blackpool, with the number of sales in 2010 at 40% of 2005 levels in Blackpool, compared to over 50% across the rest of the Fylde Coast, Lancashire and nationally, as shown in Table 5-5
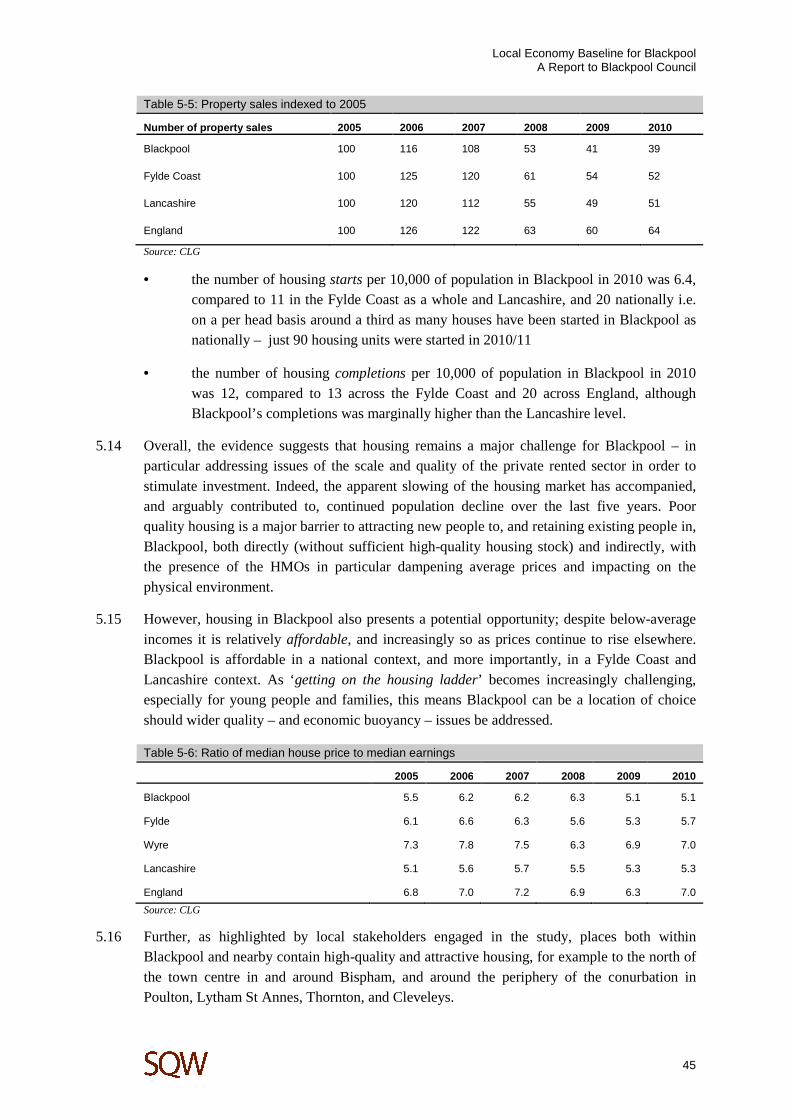
Local Economy Baseline for Blackpool A Report to Blackpool Council
45
Table 5-5: Property sales indexed to 2005
Number of prop erty sales 2005 2006 2007 2008 2009 2010
Blackpool 100 116 108 53 41 39
Fylde Coast 100 125 120 61 54 52
Lancashire 100 120 112 55 49 51
England 100 126 122 63 60 64
Source: CLG
• the number of housing starts per 10,000 of population in Blackpool in 2010 was 6.4, compared to 11 in the Fylde Coast as a whole and Lancashire, and 20 nationally i.e. on a per head basis around a third as many houses have been started in Blackpool as nationally – just 90 housing units were started in 2010/11
• the number of housing completions per 10,000 of population in Blackpool in 2010 was 12, compared to 13 across the Fylde Coast and 20 across England, although Blackpool’s completions was marginally higher than the Lancashire level.
5.14 Overall, the evidence suggests that housing remains a major challenge for Blackpool – in particular addressing issues of the scale and quality of the private rented sector in order to stimulate investment. Indeed, the apparent slowing of the housing market has accompanied, and arguably contributed to, continued population decline over the last five years. Poor quality housing is a major barrier to attracting new people to, and retaining existing people in, Blackpool, both directly (without sufficient high-quality housing stock) and indirectly, with the presence of the HMOs in particular dampening average prices and impacting on the physical environment.
5.15 However, housing in Blackpool also presents a potential opportunity; despite below-average incomes it is relatively affordable, and increasingly so as prices continue to rise elsewhere. Blackpool is affordable in a national context, and more importantly, in a Fylde Coast and Lancashire context. As ‘getting on the housing ladder’ becomes increasingly challenging, especially for young people and families, this means Blackpool can be a location of choice should wider quality – and economic buoyancy – issues be addressed.
Table 5-6: Ratio of median house price to median earnings
2005 2006 2007 2008 2009 2010
Blackpool 5.5 6.2 6.2 6.3 5.1 5.1
Fylde 6.1 6.6 6.3 5.6 5.3 5.7
Wyre 7.3 7.8 7.5 6.3 6.9 7.0
Lancashire 5.1 5.6 5.7 5.5 5.3 5.3
England 6.8 7.0 7.2 6.9 6.3 7.0
Source: CLG
5.16 Further, as highlighted by local stakeholders engaged in the study, places both within Blackpool and nearby contain high-quality and attractive housing, for example to the north of the town centre in and around Bispham, and around the periphery of the conurbation in Poulton, Lytham St Annes, Thornton, and Cleveleys.

Local Economy Baseline for Blackpool A Report to Blackpool Council
46
Commercial property
5.17 Blackpool contained around 1,350,000 sqm of commercial floorspace in 2008, 47% of the total across the Fylde Coast. Just over one third of this total (35%) was accounted for by retail floorspace – almost double the national average, although its role as a main retail centre for the Fylde Coast explains this (see below). Warehouses and factories account for a significant amount of floorspace, although the lower proportion of both in Blackpool relative to Lancashire emphasises how its economy is ‘different’ to that in the wider sub-regional area in which it is located.
5.18 The proportion of floorspace accounted for by offices in Blackpool is broadly similar, if slightly below, the national average. But ‘non-commercial’ offices (essentially non-central government public sector occupied offices) accounted for 31% of the total office floorspace in Blackpool, compared to 17% in England and 24% in Lancashire.
Figure 5-1: Commercial floorspace by use type
Source: CLG
5.19 This over-representation of ‘non-commercial’ offices in Blackpool reflects the importance of the public sector in maintaining the local commercial property infrastructure, as well as for the employment base. However, much of this stock is of low quality and it also contributes to relatively low commercial rateable values for office space across Blackpool.
5.20 Although a broad range of factors come into play when determining rateable values, they do reflect broadly ‘what the market is willing to pay’ for commercial property in an area. The data suggest that Blackpool’s office offer is geared towards the lower end of the market, and overall, commercial rateable values were well below national levels in 2008.
5.21 The overall comparison with Lancashire suggests that Blackpool is performing relatively well. However, this is driven principally by the generally lower commercial rates for factories and warehouses. Importantly in terms of both offices (by some margin) and retail (less so) commercial rateable values across Lancashire as a whole were higher than for Blackpool. Given that rateable values are generally higher in urban locations, with concentrations of
35%28%
17% 18%
15%
17%
11%17%
22% 30%
41%34%
24% 21%28% 27%
0%
10%
20%
30%
40%
50%
60%
70%
80%
90%
100%
Blackpool Fylde Coast Lancashire England
Pro
po
rtio
n o
fco
mm
erc
ial
flo
ors
pa
ce
Other Premises
Warehouses
Factories
Offices
Retail Premises

Local Economy Baseline for Blackpool A Report to Blackpool Council
47
offices and retail creating demand for space, this does highlight the relative weakness of Blackpool in its attractiveness to the market as a place in which to locate and do business.
Table 5-7: Commercial rateable value per sqm in 2008 (£)
All Classes
Retail Premises Offices
Commercial Offices
‘Non-commercial
’ Offices Factories Ware-
houses
Blackpool 46 83 45 48 41 19 21
Fylde Coast 42 81 44 46 41 20 23
Lancashire 38 86 56 59 47 21 26
England 66 130 121 128 84 29 40
Source: CLG
5.22 These data are from 2008 (the latest available) and therefore do not take into account any changes as a result of the recent investments in the physical infrastructure of the town centre, the on-going work to deliver the flagship Talbot Gateway scheme, as part of the Central Business District project, and the continued growth at Blackpool Business Park.
5.23 Indeed, our engagement with local stakeholders in the research suggested that market interest and confidence in Blackpool as a commercial location is improving, owing in part to the significant recent involvement of major private sector players such as Merlin and Nickelodeon. Talbot Gateway is also recognised as a major opportunity for Blackpool, creating jobs in its first phase through a new supermarket, and potentially in its (still to be confirmed) second phase, providing a new focus for private investment and high-level occupations in the area.
5.24 Further, as identified by consultees for this study, the relatively low commercial value does mean that Blackpool is a cost-competitive location for businesses. This can be important for attracting contact centres and back-office functions, for example, which provide labour market accessibility for people with entry-level qualifications and/or limited work experience. The key challenge for Blackpool will be to retain its offer as a competitive choice on price for certain sectors, in order to maintain employment levels and retain existing businesses in the area, whilst also providing high-quality business premises and sites that will attract market interest and leverage up the overall attractiveness of the place as a business location. In the longer-term competing on price alone will leave Blackpool in a low-wage/low-skill economy.
5.25 However, Blackpool faces significant constraints in terms of the employment land required to drive future growth and develop the new commercial opportunities which will raise the overall quality and offer of the area as a business location.
5.26 The latest research on employment land10 suggests that although there is 23ha of available employment land in Blackpool, only 9.1 ha (principally at Blackpool Business Park and the North Blackpool Technology Park) is ‘suitable, available & developable’. As the study reports that much of this land is (positively) subject to firm interest, there is ‘no significant new available land to meet Blackpool’s medium to longer term needs’.
10 Blackpool 2010 Employment Land Review

Local Economy Baseline for Blackpool A Report to Blackpool Council
48
5.27 This represents a clear challenge and threat for the local economy – Blackpool needs to attract and create more businesses in order to address its economic deficit, and needs the land to do this, yet it is hampered by its relatively tight spatial definition and lack of developable land. Working with partners across the Fylde Coast to help offset this issue, and fully utilising the powers and priorities of the emerging Planning Framework are likely to be vital.
5.28 Further, despite the scale of Blackpool’s retail offer, the evidence suggests that the quality of the retail offer is limiting its role as centre for the Fylde Coast, and thereby retaining expenditure in the functional economy. The 2008 Fylde Coast Retail Study identified significant levels of retail trips by residents of the Fylde Coast to Preston despite the proximity of Blackpool, even from places such as Fleetwood. More recent research for the Fylde Coast EDC identified expenditure leakage of around 23% from the Fylde Coast – largely to Preston, with a depreciating effect on Blackpool (and other Fylde Coast) town centres.
5.29 Key findings of the Retail Study for Blackpool town centre completed in 2008 included:
• the town centre has a good range of different sized venues, and there are improving town centre yields, with traders seeking representation in the centre
• the development of Talbot Gateway with its anchor store, improved public realm and transport, and continued expansion of Hounds Hill are opportunities for the town centre
• there is poor provision in the convenience goods sector, a high proportion of small vacant outlets when compared to the national average and comparison, retail service, and financial and business service representation is below the national average
• the continued growth of competing centres and out-of-centre retail destinations and the growth of on-line shopping were identified as threats over and above there being no change on the quality/range of comparison and convenience offer.
5.30 Some three years on, our consultation with stakeholders suggests that this remains a fair characterisation of Blackpool’s town centre offer. The recent physical improvements in the town centre and along the front, and the attraction of new retailers and chains, have improved the overall offer of the town centre. However, consultees still regarded the town centre very much as a ‘work in progress’, with the development of more accessible and high-quality restaurant/cafés to attract residents from the Fylde Coast seen as a priority. And with competition from elsewhere, there remains a need to develop the quality and diversity of Blackpool’s town-centre offer.
Transport infrastructure
5.31 Transport is a crucial enabler of productivity and competitiveness. Good transport systems support the productivity of urban areas, supporting deep and productive labour markets, and allowing businesses to reap the benefits of agglomeration, whilst transport corridors are the arteries of domestic and international trade, boosting the competitiveness of the UK economy. Transport infrastructure is therefore a key concern for understanding the existing performance of, and prospects for, Blackpool’s economy.

Local Economy Baseline for Blackpool A Report to Blackpool Council
49
5.32 Positively, despite Blackpool’s relative peripherality from the main economic centres of the North, the M55 provides a good link to Preston and the wider motorway network including the M6 south to the Manchester and Liverpool city-regions. It is seen by some visitors as a centre for visiting other attractions across the North West, not just as a destination in its own right.
5.33 The rail network also provides access to Preston, with regular direct morning services (6 departures per hour between 7am and 8pm weekdays, 3 per hour between and 8am and 9am), and 2 trains per hour to Manchester and 1 per hour to Liverpool, as well as other local services to proximate areas. Rail is also an important source of trips to Blackpool, with data provided by the Council showing that the number of rail trips to Blackpool has continued to increase over the last five years, with around 680,000 trips to Blackpool in 2010/11. Indeed, rail provides an important infrastructure for maintaining the tourism offer and accessibility.
Table 5-8: Rail trips to Blackpool rail stations (all stations)
2005/2006 2006/2007 2007/2008 2008/2009 2009/2010 2010/2011
Blackpool 602,255 634,820 647,869 621,248 638,538 681,025
Annual change -5% 5% 2% -4% 3% 7%
Source: Blackpool Council
5.34 However, despite the planned electrification of the Blackpool-Preston line, consultations suggest that the loss of direct trains to London may have impacted on Blackpool’s ability to tap into wider business markets through, for example conferences and events, with the need for improved rail linkages to improve business performance and accessibility. Looking forward, how High Speed Rail will impact on Blackpool should be considered by local partners to ensure that any benefits can be maximised, and challenges addressed. Further, the planned re-franchising of the West Coast Mainline in 2013 provides partners with an opportunity to lobby for an improved service for Blackpool.
5.35 Blackpool Airport, although just outside the local authority boundary, is also an important transport asset for the town, as reflected in the Council’s ownership stake. The Airport forms part of the ‘real’ functional economy in Blackpool, and is an important local employer – supporting 300 jobs on site, many filled by Blackpool residents.
5.36 The Airport is small, compared to other regional airports in Manchester and Liverpool, and with a very limited service offer. But it is fairly busy, catering for 225,000 to 230,000 passengers per year, has current capacity for up to 400,000 providing significant growth potential, and plans for significant expansion beyond that. The Airport serves both passenger and business users, as well as education and air ambulance services. Further to securing its existing role and status, developing the potential of the Airport is an important opportunity for Blackpool – and was recognised as such by local stakeholders engaged in this study – helping to maximise the economic potential of the recent investments in the tourism economy offer of the town.
Business views on the ‘Place’
5.37 As noted above, significant public investment has gone into the redevelopment of Blackpool’s physical infrastructure in recent years. This has included, for example, a major restoration and

Local Economy Baseline for Blackpool A Report to Blackpool Council
50
revitalisation of the Winter Gardens and Blackpool Tower, town centre improvement programmes including turning St John’s Precinct into a new high quality public square in the centre of Blackpool, and the major improvements to the seafront including the reconstruction of damaged sea defences, new headlands and improved access to the seafront.
5.38 However, although a lot of good work has been done, away from these central areas the overall quality of the physical infrastructure of Blackpool remains poor. Reflecting this, Figure 5-2 presents the aggregated responses by 125 businesses in Blackpool to the question ‘what 3 things still need to be done to regenerate the Blackpool economy and make the area a
more attractive location for business?’ posed as part of SQW’s evaluation of the investment in the physical regeneration of Blackpool completed in Spring 2011.
5.39 The context is important here – the survey was completed in early 2011 as the physical works on the seafront were still on-going, and the majority of respondents were located close to the town centre. However, the findings do suggest that continued development in the quality of place is seen as the key issue for businesses in the area – by some margin the most commonly cited issues were improving the quality of buildings and roads in the area. Similarly, when we asked businesses what key factors impacted on their business performance, issues of transport access, the quality of the local physical environment and associated image/perceptions of the area were to the fore.
Figure 5-2: Business perception on ‘what needs to be done’ in Blackpool
Source: Evaluation of Selected NWDA Investments in Blackpool, SQW 2011
0 5 10 15 20 25 30
Regenerate/improve poor quality buildings
Improve roads
Other
Improvements in parking
Reduce drink/drugs culture
Improve public transport
Regenerate or improve shops
Improve the cleanliness
More attractions or entertainment
Improve tourist accommodation standards
Help businesses
Regenerate or improve housing
Finish current building works
Number of respondents

Local Economy Baseline for Blackpool A Report to Blackpool Council
51
Key messages
• The housing market in Blackpool is characterised by generally low prices and high levels of private rented accommodation with a particular challenge of HMOs – a legacy of the significant stock of holiday accommodation no longer required. The 3,000+ HMOs in Blackpool are a major policy challenge – many, not all, are of poor quality and lead to social issues and challenges, but they are profitable and as such hard to address in public policy terms.
• Housing in Blackpool is relatively affordable compared to the rest of the Fylde Coast and England, although broadly similar to Lancashire – this does provide an opportunity for Blackpool to attract/retain firs t-time buyers.
• Much of the commercial property in Blackpool is of low quality, and the rate that the market is willing to pay for premises is lower than elsewhere, particularly for offices – Blackpool’s commercial property market is under-represented in commercial offices.
• The lack of available employment in Blackpool represents a potential threat to developing Blackpool’s business base – new employment sites are needed but there are insufficient sites in Blackpool which can be brought forward to stimulate new demand.
• Given its location, external transport connectivity is good, with the M55 and airport in particular ensuring Blackpool is an accessible place for business and visitors.
• Progress has been made in making Blackpool’s physical infrastructure more fit-for-purpose as a modern economy – in particular in the town centre, at the seafront and in its major tourism assets. But away from this core, significant physical appearance/infrastructure challenges remain.

Local Economy Baseline for Blackpool A Report to Blackpool Council
52
6: The Tourism Economy
6.1 This section of the Local Economy Baseline provides a more detailed assessment of the scale, scope and role of the tourism economy in Blackpool. This reflects the extent to which the tourism economy influences Blackpool’s economy directly and indirectly across business, people and place, and its role as the key original driver behind the growth of the town.
Coverage and key questions
6.2 Three overarching Research Questions were developed to frame the analysis for the Tourism Economy analysis. The questions, and the data collated/analysed to provide evidence on these issues, are set out in Table 6-1.
Table 6-1: Key questions and coverage for the Tourism Economy analysis
Key questions Key sources of data and information
• What is the scale of the Tourism Economy sector in Blackpool?
• Business Register and Employment Survey
• Experian Database of Fylde Coast businesses
• Inter-Departmental Business Register
• How has Blackpool's Tourism Economy performed in recent years?
• Omnibus Survey
• Visit England surveys
• Is the tourism infrastructure in Blackpool fit-for-purpose to provide a '21st Century' offer to visitors?
• Quality Accreditation data
• Accommodation study
Source: SQW
6.3 Further to the data evidence identified above, the findings also draw on the review of literature completed for this work and the feedback from the consultations with local stakeholders and the Challenge Workshop held in Blackpool in late September. Additional evidence on the Tourism Economy can be found in the attached Excel Data Repository.
The evidence base
Scale of the tourism economy
6.4 Tourism is a hard sector to quantify – many businesses that are engaged in tourism are also supported by local consumer spending. To provide a quantitative picture of the tourism economy in Blackpool, our starting point is the definition of tourism employed by ONS based on the SIC 2007.11
6.5 According to this categorisation, tourism supports 11,000 work-based employees in Blackpool, accounting for 19% of all employment in the town and 8% of all employment across the Fylde Coast. Around one in five of all employees in Blackpool are supported by the tourism economy directly. Further, Blackpool accounts for 57% of the tourism economy jobs across the Fylde Coast as a whole. The importance of the tourism economy to Blackpool 11 See The economic impact of tourism across regions and nations of the UK, ONS

Local Economy Baseline for Blackpool A Report to Blackpool Council
53
compared to comparators is illustrated in Figure 6-1; the level is around double that in England and Lancashire.
Figure 6-1: Tourism economy employees as a proportion of all employees (2009)
Source: BRES
6.6 The tourism economy is even more important when it comes to part-time employment; the sector accounts for 23% of part-time employment in Blackpool, as shown in Table 6-2.
Table 6-2: Tourism economy as a proportion of full-time and part-time employees
Full -time Part -time Total Employees
Blackpool 16% 23% 19%
Fylde Coast 11% 22% 15%
Lancashire 7% 17% 10%
England 8% 15% 10%
Source: BRES
6.7 However, the ‘tourism economy’ contains a broad range of activities that support different levels and types of employment. As shown in Table 6-3, the largest sub-sectors in terms of employment in Blackpool in 2009 were hotels (2,800 employees), public houses/bars (1,100 employees) and amusement parks and theme parks (1,000 employees).
Table 6-3: Employees by sub-sectors of the tourism economy
Total Full -time Part -time
Hotels and similar accommodation 2,800 1,600 1,200
Public houses and bars 1,100 400 700
Activities of amusement parks and theme parks 1,100 900 100
Unlicensed restaurants and cafes 1,000 400 600
Gambling and betting activities 800 400 400
Licensed restaurants 800 300 500
Licensed clubs 700 200 600
Operation of sports facilities 700 200 500
0%
2%
4%
6%
8%
10%
12%
14%
16%
18%
20%
Blackpool Fylde Coast Lancashire England
% a
ll e
mp
loy
ee
s in
to
uri
sm e
con
om
y

Local Economy Baseline for Blackpool A Report to Blackpool Council
54
Total Full -time Part -time
Management of real estate on a fee or contract basis 400 400 -
Take away food shops and mobile food stands 400 100 300
Event catering activities 300 200 100
Camping grounds, recreational vehicle parks and trailer parks 100 100 -
Other amusement and recreation activities 100 100 -
Botanical and zoological gardens and nature reserve activities 100 - 100
Letting and operating of own or leased real estate 100 100 -
Taxi operation 100 100 -
Operation of arts facilities 100 - -
Other sports activities (not including activities of racehorse owners) 100 - -
Other 200 100 100
Source: BRES Note: all figures rounded to 100
6.8 Previous work on employment in tourism across England’s ‘seaside’ towns estimated that there were 19,400 direct tourism jobs in the ‘Greater Blackpool’ area, including Lytham St Anne’s and Fleetwood, in 2006/08.12
6.9 There are also important links to the wider employment base, through supply-chain linkages (with, for example, tourism businesses making use of local wholesalers, and professional services providers such as accountants, lawyers and recruitment advisers etc.), and induced effects as people employed in tourism spend money in the local economy (both those who live in the town and those who commute in). In a place such as Blackpool, where tourism is also a long-standing industry, the tourism economy will also have played a key role in attracting people to Blackpool in the first place.
6.10 Quantifying these factors, to provide a figure on the total ‘indirect’ impact of the tourism economy on Blackpool’s employment would require specific research, including a survey of businesses to identify supply-chain linkages. However, if we applied the multiplier used in the earlier work on tourism across England’s ‘seaside’ towns of 1.2, this would suggest that Blackpool’s tourism sector supports indirectly a further 2,200 work-based employees in Blackpool, a total of 13,300 and 23% of all employees in the town.
Businesses
6.11 Assessing how many businesses form the tourism economy is not straightforward: the new BRES, that succeeded the ABI, does not provide detailed sectoral information in business units at a local level. However, using the Experian database and the Yellow Pages Classification it is possible to provide an indication of the number of tourism-related businesses.
6.12 The database identified around 6,400 active enterprises across all sectors, higher than BRES data suggests (4,500) – as discussed previously the dataset draws on Companies House data so may include businesses that are not actively trading. To account for this in assessing the number of tourism businesses we have taken the ratio of total businesses in the Experian 12 The Seaside Tourist industry in England and Wales, Beatty et al, June 2010

Local Economy Baseline for Blackpool A Report to Blackpool Council
55
database to the total identified in BRES data (0.7), and applied this to the enterprise numbers in the Experian database for tourism related sectors i.e. if Experian identified 100 businesses in a sub-sector, this would equate to 70, taking into account non-trading businesses (plus duplications, and firms with registered addresses only in Blackpool).
6.13 Drawing on this analysis, all tourism economy related industries with at least five businesses (following the application of the BRES ratio) are presented in Table 6-4.
Table 6-4: Indicative assessment of number of tourism economy businesses in Blackpool
Yellow Pages Classification Total Proportion of all e nterprises
Hotels & Inns 550 12.2%
Guest Houses 198 4.3%
Holiday Accommodation - Self Catering 92 2.0%
Restaurants 81 1.8%
Take Away Food 86 1.9%
Pubs 43 0.9%
Cafes & Coffee Shops 42 0.9%
Bed & Breakfast 37 0.8%
Holiday Accommodation & Parks 23 0.5%
Amusement Parks & Arcades 13 0.3%
Theatres & Concert Halls 6 0.1%
Entertainment Agencies 5 0.1%
Taxis & Private Hire Vehicles 5 0.1%
Total in tourism economy 1,180 26.0%
Source: SQW based on Experian database
6.14 These data should be treated as indicative only. However, the data suggest that around one quarter of all enterprises in Blackpool (approaching 1,200) are part of the visitor economy. Further, this value may well under-estimate the number of accommodation providers in Blackpool. An earlier accommodation study estimated that there are around 1,080 guest houses alone in Blackpool13, well above the data presented above – however, many of these may not be registered formally as businesses and therefore are not captured in the Experian database.
6.15 What is important, however, is that the data highlight the scale and breadth of tourism economy businesses in Blackpool – and even on a conservative estimate the data suggest that tourism economy businesses account for a quarter of all enterprises in Blackpool’s economy.
Turnover
6.16 A further perspective on the scale of the tourism economy in Blackpool can be derived from data on turnover by sectors. Again there are challenges in what is/is not included in tourism so the data should be treated with caution. However, for individual sectors, the data demonstrate the scale of the tourism economy in the area. For example, as shown in Table 6-5, the
13 Fylde Coast Accommodation Study, Humberts Leisure, 2009

Local Economy Baseline for Blackpool A Report to Blackpool Council
56
Accommodation sector had a turnover of around £83m in 2009. Together these sectors had a combined turnover of over £300m in 2009 – equivalent to 14% of the total turnover across Blackpool.
Table 6-5: Turnover of tourism related sectors in 2009 in Blackpool
SIC 2007 sector Combined turnover (£000s)
Accommodation 83,447
Food and beverage service activities 87,171
Rental and leasing activities 11,507
Travel agency; tour operator and other reservation service and related activities 68,453
Creative; arts and entertainment activities 9,630
Gambling and betting activities 8,393
Sports activities and amusement and recreation activities 86,650
Total 355,251
Source: ONS
6.17 However, the turnover data also highlight the need to develop the value/quality of the tourism offer in Blackpool. Turnover per enterprise and per employee in these sectors in Blackpool in 2009 was well below the national level, as shown in the table below. The data on Accommodation is noteworthy, reflecting the large number of small and relatively low-quality guest houses across Blackpool.
Table 6-6: Turnover per enterprise and per employee in tourism economy sectors in 2009
Sector
Turnover per enterprise Turnover per employee
Blackpool England Blackpool % England Blackpool England
Blackpo ol % England
Accommodation 379 1,436 26% 38 53 71%
Food/beverage service activities 291 515 56% 37 41 89%
Rental and leasing activities 384 1,670 23% 67 171 39%
Travel agency etc. 3,423 3,341 102% 122 220 55%
Creative/arts/entertainment activities 241 272 88% 74 94 79%
Sports activities/amusement/recreation activities 1,444 658 220% 45 49 93%
Source: ONS
6.18 The differential between turnover per enterprise and per employee is also notable when compared to England for the Accommodation sector. Blackpool’s accommodation businesses were on average around a quarter of the size in terms of turnover than England, but turnover per employee is around three quarters of the England level; because they are smaller with 10 employees on average in Blackpool compared to 27 across England.

Local Economy Baseline for Blackpool A Report to Blackpool Council
57
Productivity
6.19 As set out in Section 2, overall levels of productivity – as measured by GVA per employee – in Blackpool are well below national levels. Overall GVA per employee in Blackpool stood at £30,500 in 2008, compared to £46,950 across England. A wide range of factors drive this performance, including the enterprise, skills, innovation and competitiveness factors, and the sectoral distribution of the economy, discussed in the Business section.
6.20 However, low productivity in the local tourism economy plays an important role. As discussed above, around one-fifth of all employees in Blackpool are in the tourism economy, compared to around one-in-ten nationally. Previous evidence14 suggests that the productivity (GVA per employee) of the tourism sector in Greater Blackpool was £14,500; around half the level in Blackpool’s economy as a whole.
6.21 Contributory factors to this low productivity include a high proportion of the jobs in tourism being part-time, with many offering low wages,15 high levels of seasonality in employment and economic activity, and the dispersed nature of the tourism economy, with many small businesses increasing pressure on prices. Raising the quality and productivity of the tourism economy in Blackpool is therefore key to future economic prospects.
Wider perceptions
6.22 Over and above these quantitative data on the importance of the tourism economy to Blackpool, it is also vital to recognise the wider perceptions of Blackpool as a place, and an economy, dominated by tourism. The statistics confirm that tourism is integral to the Blackpool economy, especially when taking into account its wider effects, as visitors generate business for a wide range of other local services. But, given low average wages in the sector, the balance, and inter-relationships, between the direct ‘visitor economy’, and other parts of the local economy are critically important.
6.23 Consistently, local stakeholders identified the tourism economy as a key driver of the economy over the last decade – although the implications of this were identified as both positive and negative, with the ‘unique’ reputation this confers on the one hand, set against the hard-to-shift perceptions of the place as a low-quality destination and somewhat ‘tired’ location on the other.
6.24 Further, local stakeholders consistently identified the development of the tourism economy of the town in recent years as essential to Blackpool’s economic future. The investment by, and arguably as important commitment of, Merlin, an internationally recognised brand was a key factor here; alongside the presence of other major private sector players such as Hilton and Nickelodeon.
14 Final Report of the Seaside Towns Research Project, Beatty & Fothergill, Centre for Regional Economic and Social Research, Sheffield Hallam University, June 2003 15 For example, the average weekly wage across the North West region in 2010 in the Accommodation sector was £240 against an average across all sectors of £380

Local Economy Baseline for Blackpool A Report to Blackpool Council
58
Performance of the tourism economy
6.25 Blackpool remains one of the UK’s most popular tourist destinations. Despite long-term changes in the nature of tourism, with holidays abroad increasingly accessible through low-cost airlines, Blackpool continues to attract millions of visitors each year. Blackpool is also a well-recognised brand, with an established profile across the UK, and in Ireland.
6.26 Blackpool’s tourism offer is broad, catering for a wide range of markets and groups – ensuring that, as one of our consultees noted ‘Blackpool is whatever you want, whoever you are’. The range of attractions and entertainments also helps the place to present an offer to visitors ‘regardless of the weather’.
6.27 In 2010 around 13.2 million people visited Blackpool, with visitor numbers over the last three years increasing as the recession increased levels of UK tourism and so-called ‘staycations’ (see Figure 6-2).
6.28 Our consultations suggested that whilst this, potentially short-term, phenomenon is recognised as having played a key role in visitor numbers in recent years, the fact that the long-term decline in visitor numbers has been reversed does in itself represent a major opportunity for Blackpool, especially as the new facilities and infrastructure is now in place to sustain visitor interest. Further, given the broader economic challenges and uncertainties discussed in Section 2, a consistently higher proportion of ‘UK-holidays for UK-residents’ over the longer-term is a real possibility.
Figure 6-2: Annual visits to Blackpool
Source: Blackpool Council
6.29 Indeed, Visit England’s survey of the most visited English Cities and Towns by UK residents in 2010 showed that Blackpool was:
• the fourth most visited place in England (after London, Manchester and Birmingham) for trips of at least one night
• the second most visited town/city in terms of ‘pure holiday trips’, after only London
0
2,000
4,000
6,000
8,000
10,000
12,000
14,000
16,000
2005 2006 2007 2008 2009 2010
Vis
ito
rs (
tho
usa
nd
s

Local Economy Baseline for Blackpool A Report to Blackpool Council
59
• the 12th most visited town/city in the UK for business trips of at least one night, showing its continued conference market
� although Blackpool appears to have lost out on the annual political conference market that provided a high-level of exposure in national media, it continues to attract smaller and more ‘niche’ interest-based conferences – sometimes characterised as the ‘star-trekkers market’; however, the public sector has also been an important source of conference markets for Blackpool, which is likely to reduce in future years as a result of public spending constraints.
6.30 As consistently identified as a key issue by local stakeholders, visitor spend in Blackpool is lower than might be expected, or at least hoped, given the scale of visitor numbers; people come to Blackpool, but they spend less than is needed to sustain the overall quality and scale of the local tourism economy. Leisure visitors to Blackpool also tend to stay for shorter periods than elsewhere – as evidenced in the Visit England data set out in Table 6-7.16
6.31 According to this data, over 2008-10 the average nights stayed in Blackpool for holidays was 3.7 days compared to the average of 6.8 across England as a whole – the average nights in Blackpool was also lower than in Lancashire. Average spend per trip to Blackpool was also lower than England, although higher than Lancashire.
6.32 However, the gap to England in terms of visitor spend is not as pronounced as may have been expected given the strong views from consultees that raising visitor spend was a major concern for the area. This may reflect in part that expenditure in Blackpool is concentrated heavily on access to, and in, major attractions, meaning that it does not – directly – ‘trickle down’ into the wider economy of the area and is therefore not supporting fully the wider tourism business base.
Table 6-7: Length of stay and average spend per holiday
Average nights per tri p (holidays) Average spend per trip (holidays)
2006-8 2007-9 2008-10 2006-8 2007-9 2008-10
Blackpool 3.5 3.6 3.7 198.2 197.6 201.6
Lancashire 4.9 4.6 4.6 185.7 182.1 183.8
England 7.4 7.1 6.8 207.2 208.3 208.5
Source: Visit England, Overnight Tourism Data for Towns, Local Authorities and Counties’
6.33 That said, the data do align with the wider messages on an increase in day visits, rather than overnight stays, providing lower average spend in the economy, with the effect of further under-utilising the very significant stock of accommodation in the area (see below). So, the challenge for Blackpool with UK visitors is to make people stay longer, and ensure that they spend more money in the local economy as a whole when they do. An improved retail offer will be an important factor here, as will further development of a wider leisure offer - cafe-bars, theatres and restaurants that offer more to families, and to the ‘early evening’ trade.
16 Note that the data provide three-year averages rather than individual years to account for short-term fluctuations.

Local Economy Baseline for Blackpool A Report to Blackpool Council
60
6.34 In terms of overseas visits, Visit England’s International Passenger Survey suggests that around 44,000 visitors came to Blackpool in 2010, a reduction from the previous three years (the reverse ‘staycation’ effect). However, Blackpool accounted for 23% of all visits to Lancashire in 2010, an increase on the proportion in 2007-09.
Table 6-8: Number of visits to Blackpool and Lancashire from overseas
2007 2008 2009 2010
Total visits from overseas to Blackpool (000s) 55 45 69 44
Total visits from overseas to Lancashire (000s) 291 268 264 243
Blackpool as % Lancashire 19% 21% 21% 23%
Source: Visit England
6.35 An important message to emerge from our consultation, however, was the existing, and future potential role of Blackpool as both a destination in its own right and as a base for exploring the other tourism and leisure facilities in the Fylde Coast and the wider North West, including the Lake District, Forest of Bowland, Manchester and Liverpool.
6.36 There are clearly trade-offs here – the effect of people coming to and staying in Blackpool but spending their days elsewhere is to reduce their expenditure in the local economy. However, maximising its spatial location, and good transport access (both in terms of road, the airport, and for more localised rail services), would enable Blackpool to attract visitors from an even wider range of target markets which may not currently be considering Blackpool as their main location.
Tourism infrastructure
6.37 Considerable investment – from both the public and private sectors – has gone into Blackpool’s tourism infrastructure in recent years. Notably, the Council purchased the Tower and Winter Gardens: subsequent investment by Merlin in the visitor offer in these iconic destinations was completed in Summer 2011.
6.38 Blackpool’s historic tramway has also received investment of £100m providing new stops and delivering quicker journey times across the Fylde Coast. Public investment in new coastal defences also supported the re-development of the seafront, and other town centre regeneration works are now nearing completion.
6.39 This investment enables Blackpool to better compete on quality as well as price, attract new as well as retain existing visitors, and look to extend the stays of visitors as well as extending the season. As noted earlier, this is already longer in Blackpool than most if not all competing coastal destinations, owing to the Illuminations and conference market. Consultations completed for this study suggest that local partners across the public and private sectors, from both within and outside the tourism economy sector, are confident regarding the potential of this investment to improve substantively the tourism offer and performance of Blackpool going forwards.
6.40 However, Blackpool still faces considerable challenges in terms of its tourism infrastructure. There is, as noted earlier, a significant over-supply of holiday accommodation, with too many low-quality and out-dated providers that once catered for the 17m visitors a year. A recent

Local Economy Baseline for Blackpool A Report to Blackpool Council
61
study estimated that Blackpool has a bed-space over-supply of around 20,000, based on an aggregate bed-spaces of 57,000 i.e. Blackpool essentially has a third ‘too many’ bed-spaces.
6.41 This leads to providers competing principally on price, not quality. The accommodation study estimated that 93% of serviced accommodation providers in Blackpool had no quality grading: progress was made in increasing the stock of accredited providers operating in Blackpool in the last five years, and there are now individual well-known examples of successful quality providers in smaller premises, as well as in the larger hotels (see Figure 6-3).
Figure 6-3: Number of accredited accommodation providers in Blackpool
Source: Blackpool Council
Key messages
• The tourism economy remains a major driver of the local economy – it accounts for around one-fifth of work-based employees and remains a core element of Blackpool’s business base. Tourism supports additional jobs in the wider economy through supply-chain effects and remains core to the external perceptions and profile of Blackpool.
• Blackpool remains a major tourism destination – last year only London attracted more UK holidaymakers and recent years have seen an increasing number of visitors, although people need to stay longer in order to increase levels of spend in the local business base.
• The major investment that has gone into the infrastructure which supports the visitor economy in the last decade, means that tourism will continue to be key to generating new employment and wealth in the town. These ambitions will be successfully realised only if current and potential new investors are confident in Blackpool’s competitive position as a modern destination.
0
50
100
150
200
250
300
350
400
2007 2008 2009 2010 2011
No.
acc
redi
ted
acco
m p
rovi
ders

Local Economy Baseline for Blackpool A Report to Blackpool Council
62
7: SWOT assessment
7.1 This section draws on the evidence presented in the previous four sections to provide an overall SWOT assessment of Blackpool’s economy. For each element of the SWOT we set out the key issues identified by the evidence. We also discuss the implications of these integrated messages for Blackpool to inform future economic development thinking.
Strengths
• Blackpool has a well-established high profile as a visitor destinat ion at the UK level, and offers an increasingly diverse tourism product to different market segments . In 2010 Blackpool was the second most visited place in the country for holidays by UK residents – only London (a global city) attracts more people.
• Blackpool’s tourism economy has ‘broad-shoulders’ w ith a longer season than experienced in other seaside towns and holiday destinations owing to its key assets such as the well-established Illuminations, Pleasure Beach, and the new/re-developed facilities such as the Tower and Madam Tussauds. Blackpool now has ‘global’ brands associated with, and committed to, its tourism offer.
• Blackpool is a well-defined and established locatio n for ‘specialist’ conferences/conventions, based on its capacity to p rovide large-scale facilities and large numbers of delegates/attendees . Although not at present on the mainstream political conference circuit, Blackpool remained the 12th most visited place for business/ conference events in England in 2010 and continues to present a strong offer to the market for large and specialist events; the public sector element will now be under pressure owing to spending constraints.
• Scale – Blackpool is a large urban centre and has a substantial (although declining) population on which to draw.
• Blackpool is at the heart of a large and well-defin ed functional economic area. Blackpool’s residents are able to access a wide range of job opportunities, and opportunities for high-wage employment in the wider Fylde Coast, and business supply-chain opportunities. Outside of the local authority area, but within 10 miles of the town centre of Blackpool are an estimated 5,000 additional businesses.
• External road connections are good providing access for visitors and residents to places such as Preston, Lancaster, the Lake District, and further away, Manchester and Liverpool, and their city-regions. The M55 and M6 mean that despite its relative peripheral location, Blackpool is highly accessible.
• The updated tram network does (and will) provide improv ed internal connections across Blackpool and the Fylde Coast for the benefits of residents: improved links between the major attractions along seafront provide an improved visitor experience.
• There is an improving skills profile in the local resident popu lation – for both adults and young people . The number of people in the economy with degree level qualifications is now higher than the number with no qualifications, a reverse of the situation some five years ago.
• Positive levels of engagement in the labour market by women . Blackpool provides the potential for accessible and flexible – including part-time – employment for female residents, particularly in retail, accommodation and administrative occupations.

Local Economy Baseline for Blackpool A Report to Blackpool Council
63
• A higher share of the economically inactive populat ion in Blackpool now ‘want a job’ compared to relevant comparators. Although overall levels of economic inactivity remain higher than elsewhere, this suggests that, in part owing to the pressures of the recession, the non-employed population in Blackpool is increasingly looking to engage in the labour market.
• The range and relative affordability of housing compare d to the wider functional economy, provides access in housing to first-time b uyers and/or movers-in to the area, as well as ensuring that housing is affordable to local people, even those on relatively low wages.
Implications
7.2 What are the implications of these issues for Blackpool as it considers its economic prospects and plans going forward? Three overarching points emerge:
• tourism remains the key strength of the local economy – diversification of the business base is important to provide new and potentially higher-value jobs in the economy, but Blackpool remains known for, and its residents best placed to benefit from, tourism and the visitor economy
• effective infrastructure is key to Blackpool’s economic development, including inter-connections across the Fylde Coast, with Preston, and to national networks
• the increasing skills and ‘propensity to work’ among the resident population are positive trends that need to be supported and sustained to ensure that employment opportunities, both in Blackpool and the Fylde Coast, are captured for the local population.
Weaknesses
• A large prevalence in the local economy of low value added occupations and sectors – leading to economic underperformance in productivity and low earnings for residents who work in the town (a high proportion of all workers). Resident earnings in Blackpool have not increased over the past five years.
• Declining rates of enterprise with too few businesses starting up in recent years to maintain the scale of the business base.
• Relatively low levels of business resilience, with high rates of business closures, and low business survival rates , as a result the overall scale of the business base in Blackpool is declining, albeit modestly – but across the rest of the Fylde Coast and Lancashire the business base in increasing, as across England.
• Seasonal nature of employment in the economy , leading to high rates of unemployment over much of the year and reducing wages, job security and skills development/training opportunities.
• Persistently lower levels of engagement and participation in the labour market by the resident population – in short, too few people are in work in Blackpool, and there remain higher than average levels of economic inactivity, employment and crucially a very high level of local people, mainly male, claiming sickness benefits.
• There remain important skills deficits in the local resident base with an over-representation compared to other places of people with low-level or no qualifications.

Local Economy Baseline for Blackpool A Report to Blackpool Council
64
• A deficit of high-quality and available employment development sites – this limits the potential for economic diversification and reduces market and investor interest in the area as a business location.
• A limited and under-performing town centre for reta il and associated leisure purposes meaning that expenditure of residents of Blackpool itself and the wider Fylde Coast is lost elsewhere, notably to Preston, as well as limiting the expenditure in the local area of visitors. The retail offer of Blackpool away from the town centre is also a weakness.
• Population transience and high rates of in-migratio n from non-economically active and/or socially excluded individuals . Although for understandable reasons the hard evidence is relatively weak, issues of transience and associated social problems are cited by people who know Blackpool well as an important detractor from local wellbeing and a constraint on the further development of a more rounded visitor economy.
• Potentially weakening linkages to the labour market and skills capacity of Fylde Coast , with Blackpool exerting a lesser ‘pull’ as the main economic centre than may be expected, limiting the potential for effective clustering and agglomeration benefits. While urban centres elsewhere are driving growth, Blackpool, is becoming a smaller part of the Fylde Coast economy.
• High rates of smoking, drinking and substance misus e across the resident population. This has economic implications both directly in terms of non-employment, and indirectly though calls on public resources and services; it also has implications for Blackpool’s reputation as a place to live, visit, work and invest.
• Continued over-supply of holiday accommodation, wit h many units being converted into HMOs , or remaining as low-value B&Bs competing on price not quality.
• Lack of an integrated knowledge-economy offer . To date, Blackpool has not operated as a ‘knowledge-economy hub’. It now has some assets for this, notably the creative incubators and the University Centre, but the town has not yet developed a coherent offer to new starts/entrepreneurs in non-creative industries.
7.3 What are the implications of these issues for Blackpool as it considers its economic prospects and plans going forward? Three key points emerge:
• overall, clearly very significant weaknesses are present in Blackpool’s economy, many owing to long-term and structural characteristics – expecting these challenges to be addressed in the short-term is not realistic, Blackpool needs to focus on the long-term and reversing directions of travel
• although as discussed in this report much good work has been done to refresh the physical appearance and offer of Blackpool, land and property related issues remain key weaknesses for Blackpool – a focus on ‘people’ is appropriate given the scale of the social deprivation issued faced, but ‘place’ should not be regarded as ‘solved’
• occupations are as important as sectors for driving improvements, especially in a place like Blackpool with a very clearly defined sectoral specialism and legacy, and an infrastructure geared towards certain types of industries.

Local Economy Baseline for Blackpool A Report to Blackpool Council
65
Opportunities
• Maximise Blackpool’s role as a retail and economic centre fo r the Fylde Coast , supporting a critical mass of employment, developing a niche offer complementary to, and benefiting from, being well-connected to larger centres in Preston and Manchester.
• The investment in the tourism infrastructure and offer helps to raise the overall quality and productivity in the sector, and this is already leveraging further investment by the private as well as public sector. There is scope - and ambition - for Blackpool to attract more business-related tourism and to capture higher levels of visitor expenditure through a more mixed and higher quality evening offer.
• Blackpool can develop its role as a ‘location of choice’ for supp ort services and contact centres, and for other labour intensive for ms of economic activity , given its accessible labour market, rising lower/intermediate skill levels, low cost base, and a resident population that is confident with, and used to part-time and flexible working. This should be seen as a route to developing higher quality and better paid employment.
• Working with partners, develop the Airport to suppo rt business growth , with a focus on increasing in-bound tourism as well as improving the outward offer to non-UK locations including Ireland (the largest source of overseas trips to Blackpool) and the near continent.
• The re-franchising of the West Coast Mainline in 2013 provides an opportunity for local partners in Blackpool to ‘make the case’ for an improved rail service offer.
• Build the quality and range of food/accommodation o ffer in Blackpool town centre in order to respond to and secure the potential of, the public investment and new private expertise in infrastructure and major attractions, and help build more of an ‘evening economy’ in the town to attract residents in Fylde Coast, retirees and families.
• Develop Blackpool’s role in the creative arts i.e. public performance, technical enabling/organising displays, drawing on its profile as a location for events and shows, the refreshed tourism infrastructure, and creative industries incubators. The colleges will have a key role to play here helping to drive enterprise and interest in creative industries.
• Pursue the next stage of Talbot Gateway and the eme rging Central Business District as a means to help diversify the economy of Blackpool and in time attract new private sector investment to the central area.
• Develop the role of the University Centre as a key knowledge-economy asset for Blackpool . Given the lack of HE provision in the Fylde Coast economy as a whole, the potential for developing the Centre into a full university college over the longer-term is a major opportunity for Blackpool to attract and retain talented young people.
• Engage with the planning and delivery of the recently proposed Enterprise Zone at Warton – this provides a major opportunity for Blackpool given the proximity of the site to the area and established commuting patterns. Blackpool must ensure that it is fully engaged in discussions on the Enterprise Zone to ensure that the town, its people and its infrastructure are seen as a key part of the wider investment offer.
• Engage with industry and government in assessing th e potential for, and implications of, the shale gas discovery which coul d bring investment to Blackpool, and a range of well-paid technical and s kills jobs. Environmental protection will be paramount, but this could be an important bridgehead to a local economy in which technical knowledge and its applications are more evident and valued.
7.4 The key cross-cutting message to emerge here is that for Blackpool to capitalise on most, if not all, of these opportunities will rely on active engagement with partners in the Fylde Coast – this is particularly so for the Enterprise Zone, shale gas, and airport-related opportunities.

Local Economy Baseline for Blackpool A Report to Blackpool Council
66
Threats
• The national economic slowdown persists , leading to reducing consumer confidence and real-term incomes. Crucially, this may reduce demand for the enhanced tourism offer in Blackpool from UK residents, and in particular for relatively expensive new attractions.
• Wider European and global economic slowdown also pe rsists, reducing the potential for increased overseas visits, and the gr owth potential of the Airport . This wider economic context will also impact on likely levels of new investment into Blackpool by the private sector.
• Limited resilience in the business base and low lev els of enterprise mean that the scale of the business and employment base continues to reduce , so that Blackpool becomes a smaller part of the Fylde Coast economy, and loses is scale advantage.
• An on-going reliance on retail, the tourism economy , accommodation and the public sector in order to retain employment levels traps Blackpool in a low productivity economy with knock-on effects for wages, competitiveness, investment and quality of life for local people.
• Public sector shrinkage with significant employment impacts on the local economy and social/equity considerations as social protection and other public spending is reduced A relatively high proportion of Blackpool residents depend on benefits, and this may reduce wages and quality of life in the area.
• The tourism economy offer remains dominated and influen ced by pressure of other uses (accommodation) and continues to compete on pr ice not quality , with many low value jobs.
• The public sector spending reductions threaten the main tenance and up-keep of the improved/refreshed physical infrastructure in the town centre, the seafront and the wider visitor economy.
• The persistence of a low-wage economy reduces the incen tive to work for local economically inactive people that have moved towards the labour market in recent years; these people return to/remain in long-term inactivity with no intention to find regular employment.
• Poor rail links (need to connect at Preston to West Coast Mainline) limits interest from business and conference market , and over the longer term high-speed rail further distances Blackpool for the main rail network and commuting/travelling patterns.
• Job losses at BAE in Warton impact both directly and indirectly on Blackpool in terms of loss of employment by residents, a reduced overall confidence in the Fylde Coast economy by the market, and potentially, displacement of businesses to the proposed Enterprise Zone site.
• Further competition from the major urban centres of Manches ter, Liverpool, Warrington and Preston for investment and employment.
7.5 All of these threats are ‘possible’ if not ‘probable’ and would impact substantially on Blackpool’s ability to turn-around its economic fortunes. The ‘external/contextual’ Threats are clearly the hardest to predict, yet they are probably also the most significant. As discussed above, the evidence suggests that Blackpool was hit very hard by the recession of 2008-09 across business, people and place themes with, for example, increasing rates of business closures, increased unemployment and a slow-down of housing activity/markets. Recent investments have improved Blackpool’s position and prospects, but the town is particularly vulnerable to a further extended downturn in the national and international economy.

Local Economy Baseline for Blackpool A Report to Blackpool Council
67
8: Conclusions
8.1 The overall conclusion of this study is that in economic terms, Blackpool has continued to struggle, not just since the onset of the recession but over the longer term. The gaps with national, Lancashire and sub-regional performance across a wide range of factors have increased. Further, although it is not the principal cause, the recession of 2008-09 does appear to have hit Blackpool sooner, and harder, than elsewhere, and it is taking longer to recover.
Key factors driving performance . . .
8.2 Although there are no simple answers, and Blackpool’s economic performance is driven by a diverse range of inter-connected factors, many of them which are holding up, or improving, the key explaining this sub-optimal economic performance in Blackpool, and drawing on our overall ‘Business, People, Place’ framework appear to be:
… in terms of Business
• the sectoral structure of the economy, with high levels of work-based employment in low-wage and low-value industries such as retail, accommodation and health and social work
• gradual decline in the scale of Blackpool’s business and work-based employment base owing to lower business resilience and reducing rates of enterprise – although the reduction is gradual rather than sudden, Blackpool is an increasingly smaller economy and given that one of its strengths is its size, this is concerning
• a high-reliance on the public sector (and generally delivery/administrative public sector employment) as a source of employment, with no private sector-led job creation in recent years.
.. in terms of People
• a residential occupational structure focused on ‘non-professional’ occupations, that pay lower wages – some progress has been made but the number of residents in the highest level occupations has remained essentially static over the past five years
• a falling working age population meaning that there are fewer people around to create the necessary wealth needed to support local businesses and public services
• high rates of unemployment, and economic inactivity, in particular amongst men
• entrenched deprivation and social challenges with double the national level of people claiming sickness-related benefits.
… in terms of Place
• an over-supply of former/current holiday accommodation, much of which has been converted into low-quality HMOs

Local Economy Baseline for Blackpool A Report to Blackpool Council
68
• low-grade commercial property and low commercial rateable values reflecting lack of competitiveness as a business location
• a lack of high-quality employment sites to attract new economic opportunities, within the local authority boundary.
. . . and some positive signs
8.3 However, there are positive signs in the local economy. Most notably:
• the skills and education indicators are ‘pointing in the right direction’
• the resident occupational mix is moving to the higher-value end of the spectrum
• visitors numbers are increasing, even if the challenge remains to increase the lengths of stay – from day-to overnights – and raise local expenditure
• the diversity, quality and scale of the tourism offer has improved and is now well-placed to attract significant expenditure and exposure to the place.
8.4 Importantly, our research suggests that key local stakeholders – and those engaged in this work included very senior and influential players in the private sector in the town – are genuinely enthused and positive about the prospects for Blackpool’s economy going forward.
And finally . . .
8.5 The threats and challenges that Blackpool faces are substantial – however they are not new. This study has highlighted that many of the issues facing Blackpool are well-recognised by local stakeholders. However, in the short-term they will be exacerbated by public sector cuts, directly in terms of employment, and indirectly as reductions in public expenditure add further pressures to the high proportion of the local population who rely on benefits and core service provision, and as the level of investment that Blackpool has benefited from over the last decade is scaled back.
8.6 In our view, based on the evidence presented in this study the key questions that partners across Blackpool should now be asking are:
• How can Blackpool lever its position as the business and visitor centre for the Fylde Coast, to the benefit of the town and the wider area?
• What actions can be taken to grow a cadre of locally-based managers and technical skills which can effectively deliver, support and extend the town’s visitor offer, and potentially to sell this specialist business expertise outside Blackpool?
• How can the Council best work with national and local partners, to develop ideas and engage others behind a set of agreed economic-based priorities for further physical change, including working towards solutions for the HMOs issue?

Local Economy Baseline for Blackpool A Report to Blackpool Council
A-1
Annex A: Performance Monitoring Framework
A.1 This Annex provides a Performance Monitoring Framework for Blackpool to facilitate the on-going tracking of the area’s performance.
Purpose
A.2 The evidence base set out in this report provides the Council, its partners and the wider group of stakeholders, with a substantiated summary of how Blackpool is performing, based on the most recent information on key economic drivers and descriptors.
A.3 It provides a forward-facing resource, in that it can be used to facilitate a dialogue on the implications, and on policy and delivery priorities. If it is to fulfil this role in the future, the key elements need to be put into a Performance Management Framework (PMF), which can be updated as new data becomes available. This PMF, and the basis for it, is presented in this Annex.
Framework architecture
A.4 The PMF is ‘top-down’ and ‘bottom-up’: it will be used to track how Blackpool’s economy is changing overall, in response both to the wider economic environment and specific local factors, and also to assess the results of specific investments and interventions. In this way it can be used check ‘what is working’ in economic development activity, and the conditions in which this is happening. The core components of the Performance Monitoring Framework are therefore:
• a top-down assessment – monitoring the overall state of play and change in Blackpool through the use of a discrete set of condition indicators
• a bottom-up assessment – recording the activities, investments and outputs of specific public policy interventions through the use of a set of response indicators.
Figure A-1: Architecture of the Performance Monitoring Framework
Condition Indicators…
Monitoring Blackpool’s economic performance and how this is changing (through socio-economic baselining)
� Re-aligning local strategic objectives in the light of empirical evidence
� �
Response Indicators…
Monitoring and evaluating the outputs and impacts of activities designed to impact on overall performance (through bottom-up project monitoring and review)
Monitoring of strategic inputs and activities in support of the development of Blackpool
Source: SQW

Local Economy Baseline for Blackpool A Report to Blackpool Council
A-2
Condition Indicators
A.5 At this point, we have identified a detailed set of condition indicators. This set of indicators is intentionally selective: it focuses on indicators for which data can be updated on a regular – essentially annual – basis where possible, that are robust, and that provide evidence on the key characteristics and drivers of Blackpool’s economy. Given the detail contained in this report, these data can of course, be further expanded by partners.
A.6 The indicators identified cover the Business, People and Place Themes, as well as broader economic issues such as demographics and tourism.
A.7 The condition indicators include two subsets, as shown in Table A-1, which follows:
• Headline Indicators – that provide high level information on the overall economic structure and performance
� These indicators are generally based on long-term trends, and we would expect to see only limited change on a per annum basis: the focus in presenting and interpreting these indicators therefore will be on ‘direction of travel’ from the baseline in both relative and absolute terms.
• Performance Indicators – that provide evidence on the activities and outlook of the businesses and people in Blackpool
� Although also informed by long-term trends, these are indicators where we would expect to see more short-term movements and change, and where specific policy interventions may have an impact year-on-year: the focus in interpretation for these indicators therefore will be on annual performance against the previous year.
A.8 For all indicators we propose that data is collected for Blackpool, the Fylde Coast, Lancashire (LEP boundary i.e. Lancashire CC, Blackpool and Blackburn-with-Darwen LAD), and England.
Response indicators
A.9 At this point, we have not developed a full set of response indicators. These will need to be iterated and agreed by local partners dependent on the emerging policy response and range of economic development priorities that emerge from both this local economy baseline and wider discussions.
A.10 We would expect the response indicators to include: Jobs created; People helped to secure employment, education or training; Businesses created; New/upgraded commercial floorspace.

Local Economy Baseline for Blackpool A Report to Blackpool Council
A-3
Table A-1: Condition Indicators
Indicator Source Geography Frequency
High -level Indicators
GVA per head Office for National Statistics NUTS 3 Annual
GVA per employee Office for National Statistics and BRES NUTS 3 Annual
Working age population as a proportion of the total population Mid-year Population Estimates LAD Annual
Number of active enterprises Business Demography LAD Annual
Work-based employees Business Register and Employer Survey LAD Annual
Annual resident and workplace earnings Annual Survey of Hours and Earnings LAD Annual
Performance Indicators
Business births per 10,000 WAP Business Demography and Mid-year Population Estimates LAD Annual
Ratio of business births to business deaths Business Demography LAD Annual
Proportion of work-based employees in the tourism economy Business Register and Employer Survey LAD Annual
Proportion of work-based employees in the public sector Business Register and Employer Survey LAD Annual
Employment rate Annual Population Survey LAD Annual
Proportion of population with NVQ4+ Qualifications Annual Population Survey LAD Annual
Proportion of population with No Qualifications Annual Population Survey LAD Annual
Employed residents in managerial occupations Annual Population Survey LAD Annual
JSA Claimants per Advertised Vacancy Claimant Count LAD Annual – data available on a monthly basis
Median House Price Communities and Local Government LAD Annual
Commercial floorspace – commercial office, ‘non-commercial’ office and retail Communities and Local Government LAD To be confirmed
Annual Visits to Blackpool Omnibus Survey LAD Annual
Source: SQW

Local Economy Baseline for Blackpool A Report to Blackpool Council
A-4
Additional options
A.11 The PMF set out above will provide Blackpool Council with an up-to-date, accessible, and practical process for understanding on-going economic conditions across Blackpool. In considering how Blackpool can better understand its performance, other options also emerged, notably at the Challenge Workshop with partners that the Council may wish to consider.
A.12 Three options in particular should be considered by the Council:
• an annual (or potentially bi-annual) survey of business perceptions in Blackpool to provide an up-to-date and robust evidence base on the performance of, challenges in, and requirements for, the local economy – ideally a concise (no more than 10 minutes to complete) survey, that could be distributed on-line to minimise costs
• a formal benchmarking study of Blackpool with ‘comparator’ locations across the UK against which economic performance can then be tracked ‘in real time’ – a clear message from the workshop was that comparisons to Fylde Coast, Lancashire and especially England can only ‘tell us so much’ in what is a unique economy. However, comparisons to other places that operate in very different contexts simply because they appear to be ‘similar’ can be potentially very misleading and unhelpful i.e. comparing Blackpool directly and only to Brighton would be helpful on some dimensions, not on others. We would therefore suggest a mix of locations, for example:
� Stretch locations – Brighton, Bournemouth
� Best-fit locations – Torbay, Scarborough, Southend-on-Sea
• the continuation of a survey of visitor expenditure across Blackpool – from a representative sample of tourism economy firms – that we understand was piloted by the EDC this last year. A common message from this work was that people need to spend more in Blackpool when they visit, and that increasing expenditure – for day and overnight stays – is essential to Blackpool’s future economic performance. However, there is no robust, detailed longitudinal data on this issue at present based on local evidence. An annual survey of visitor spend, cut by day/overnight, types of expenditure and location of expenditure by business type, would provide an invaluable source of evidence for understanding Blackpool’s tourism economy, and its contribution to the wider local economy.

Local Economy Baseline for Blackpool A Report to Blackpool Council
B-1
Annex B: Consultees and workshop attendees
Consultees
• Damien Bourke - Fylde Coast EDC
• Alan Cavill - Blackpool Council
• Doug Garrett - formerly of Re:Blackpool
• Peter Glenn - Parkinson Construction
• David Hardy - Champion Accountants
• Iain Hawkins - Merlin
• Howard Lewis- Blackpool Hilton
• Eileen Ormond - Blackpool BID
• Steve Pye - Federation of Small Businesses
• Paul Rankin - Blackpool Airport
• David Sandhu - AI Claims
• Claire Smith - Stay Blackpool
• Pauline Waterhouse - Blackpool and Fylde College
• Steve Weaver - Blackpool Council
• Philip Welsh - Blackpool Council
Workshop attendees
• David Hardy - Champion Group
• Mike Taplin - Blackpool Council
• Trevor Roberts - Blackpool Transport
• Robert Latham - Blackpool Fylde & Wyre Economic Development Company
• Scott Butterfield - Blackpool Council
• Peter Legg - Blackpool Council
• Pauline Waterhouse - Blackpool and The Fylde College
• David Cam - Pleasure Beach Resort
• Soraya Rigby - Blackpool Council

Local Economy Baseline for Blackpool A Report to Blackpool Council
B-2
• Claire Smith - Stay Blackpool
• Damien Bourke - Blackpool Fylde and Wyre Economic Development Company
• Ray Eyres - Parkinson
• Iain Hawkins - Merlin
• Paul Rankin - Blackpool Airport
• Howard Lewis - Hilton Blackpool
• Katie Invernon - Blackpool Council
• Kathryn Molloy - Lancashire County Council
• Jane Saleh - Blackpool Council
• Mark Shortell - Tangerine UK
• Steve Pye - Federation of Small Businesses