STEPPING STONE TO THE CSU VIA THE COMMUNITY COLLEGE Fall 2008 Jim Blackburn Mark McKellip

Blackburn College Fact Book 2014-2015

2
Table of Contents Introduction…………………………………………………………………………………………………………….. Page 5
Letter from the President……………………………………………………………………………………………… Page 6
History of Blackburn College…………………………………………………………………………………………. Page 7
Mission/Vision Statement……………………………………………………………………………………………… Page 7
Work Program…………………………………………………………………………………………………………. Page 8 Mission Statement of Work Program…………………………………………………………………………… Page 8 Work Program Learning Goals…………………………………………………………………………………. Page 8
Accreditation…………………………………………………………………………………………………………… Page 9
Academic Departments………………………………………………………………………………………………… Page 9
Academic Majors………………………………………………………………………………………………………. Page 10
Key Dates in History………………………………………………………………………………………………….... Page 12
Board of Trustees……………………………………………………………………………………………………… Page 13
Presidents of Blackburn College……………………………………………………………………………………… Page 14
Core Revenues per FTE Enrollment, by Source…………………………………………………………………….. Page 15
Percent distribution of Core Revenues, by Source...……………………………….………………………………... Page 15
Core Expenses per FTE Enrollment, by Function………………………………………………………………..….. Page 16

3
Percent Distribution of Core Expenses, by Function..……………………………………………………………..…. Page 16
Enrollment………..……………………………………………………………………………………………………… Page 17 Enrollment by Gender, Student level, and Full/Part Time Statuses………………………..…………………….. Page 17
Percent of All Students Enrolled by Age……….………………………………………………………………… Page 18 Percent of All Students Enrolled, by Race/Ethnicity……………………………………………………………... Page 18
Residence of First-Time Degree/Certificate Seeking Undergraduates…………………..…………………….… Page 19 Full-Time, First-Time Freshman Admissions Quantity and Quality Indicators……………………………….… Page 20 Number of Freshman Applicants, Admissions, and Students Enrolled……………………………………….….. Page 21 Percentile Test Scores of First-Time Degree/Certificate-Seeking Undergraduate Students………………….…. Page 21 Number of Transfer Applicants, Admissions, and Students Enrolled…………………………………………….. Page 22
Student Housing Directory……………..………………………………………………………………………… Page 23 Work Program Data………………………..………………………………………………………………………..…. Page 24 Work Program General Mangers…..………………………………………………………………………….… Page 24 Varsity Athletics Data………………………………………………………………………………………………….. Page 25 Team Roster Size………………………………………………………………………………………..……….. Page 25 Varsity Athletic Results………………………………………………………………………………………….. Page 25 Graduation Majors…………………………………………………………………………………………………….... Page 26
Bachelor’s Degree Graduation Rates of Full-Time, First-Time Degree/Certificate-Seeking Undergraduates….... Page 27
Graduate Placement Rates……………………………………………………………………………………………… Page 27
Number of Degrees and Certificates Awarded, by Level and Race/Ethnicity and Gender………………….……... Page 28
Graduation Rates of Full-Time, First-Time, Degree/Certification Undergraduates…………………………..….… Page 29

4
First to Second Year Retention Rates of First-Time Bachelor’s Degree-Seeking Undergraduates……………….. Page 29
Retention and Graduation History…………………………………………………………………………………….. Page 30 Full-Time, First-Time, Degree/Certificate-Seeking Undergraduates…………………………………………..... Page 30 Full-Time, Transfer, Degree/Certificate-Seeking Undergraduates……………………………………………… Page 31 Enrollment History……………………………………………………………………………………………………... Page 32 Full-Time, First-Time, Degree/Certificate-Seeking Undergraduates………………………………………........ Page 32 Full-Time Transfer, Degree/Certificate-Seeking Undergraduates…………………….………………………… Page 33 Club Listing……………………………………………………………………………………………………….…….. Page 34 Faculty and Staff…………………………………………………………………………………………………….….. Page 36
Headcount Enrollment by State………….……………………………………………………………………………. Page 37 Headcount Enrollment by Illinois County……………………………………………………………………………. Page 38 Campus Map……………………………………………………………………………………………………………. Page 39

5
Introduction To Our Readers:
The Office of Institutional Research is pleased to present Blackburn College’s second annual Fact Book. The purpose of this Fact Book is to deliver an easy-to-use collection of current and accurate information pertaining to the college, including demographic, financial, and institutional history. The material in this Fact Book was provided by various offices at the college and contains historical information when possible for comparison purposes. Many colleagues across the College contributed to the information found in these pages. I offer my sincere gratitude for your continued assistance in reporting these data.
The Fact Book reflects many areas of the College that are asked about most often. There are many different “true” statistics about an institution, each serving a necessary purpose. The question, “How many students attend Blackburn?” may be answered in many ways and it should be recognized that each of those ways addresses a specific need and is correct for its own purpose. The data presented in this document do not represent the only way of looking at things, but rather “snapshots” of information at key points in time and according to the most commonly used definitions. Questions may be directed to the Office of Institutional Research at 217-854-5594 or by e-mail [email protected] .
We hope that you find this Fact Book both useful and informative. Please feel free to offer suggestions or comments on the format and content.
Kristi J. Nelms, Ed.D. Director Office of Institutional Research

6
Letter from the President
Dear Friends,
I am pleased that you have taken the time to look at the Blackburn College Fact Book. Not everyone reaches for such a document – only those who really care about the College. I believe you will find the contents impressive as they represent a 178 year tradition of educating students for work, life, and service. We are not perfect, but I am proud of what we do for students and you can see some of those outcomes here.
Assembling such a compendium of information is a huge task and I owe a debt of thanks for those who assembled it. The students and staff of the Office of Institutional Research, led by Kristi Nelms and including Vicki Michaels, Laura Lyons, Jyllyan Trumble, John Aden, Jessica Pace, James Zeitler, and Thien Hoang.
At Blackburn, students are at the core of everything we do – even the hard work like assembling a fact book. They and Kristi can hold their heads high for having done an outstanding job.
Please do not hesitate to contact them or me if what you find prompts further questions. We are simple seekers of truth and we are glad you have joined us on the journey.
Sincerely
John Comerford, Ph.D. President

7
History of Blackburn College
There is no other college or university in the United States quite like Blackburn College. Our unique campus culture is the by-product of the purposeful melding of our nationally acclaimed student-managed Work Program and rigorous liberal arts academic curriculum. The result is a unique living laboratory for learning where the boundaries between job and classroom are blurred, and mentoring from
faculty and staff knows no clock.
Since 1913, Blackburn’s student managed Work Program has made the dream of a college education affordable for thousands of first generation students by keeping the cost of our private liberal arts education within their reach. Over the years, our students have built Blackburn – literally brick by brick. In fact, Blackburn enjoys the distinction of being the only college campus in the United States to
have been largely built by its students. Today our students carry on this tradition by staffing mission-critical jobs as plumbers, carpenters, painters, landscapers, cooks, servers, administrators, computer technicians, janitors, graphic artists, security officers,
assistant coaches, tutors and teaching assistants. At Blackburn, students are fully vested in every aspect of their college experience, whether it’s success in the classroom, managing or staffing their campus job, or in governing the life of the institution.
Our Mission
Blackburn College, founded in 1837 and affiliated with the Presbyterian Church (USA), provides a coeducational student body with a rigorous, distinctive, and affordable liberal arts education that prepares graduates to be responsible, productive citizens.
The Blackburn community values critical and independent thinking, leadership development, respect for all individuals, and lifelong learning.
The College fosters a sense of service, community, and moral responsibility through its unique student-managed work program, its collegial concept of shared governance, and its faculty/staff mentor relationship with students.
Our Vision
Blackburn College aspires to provide a distinctive, nationally recognized liberal arts model, grounded in student leadership, mutuality, and scholarship and cultivated through a community of integrated work, learning, and service.

8
Work Program
Established in 1913, most Blackburn students participate in the Work Program, gaining “hands-on” work, service, and leadership opportunities. The majority of Work Program jobs are on campus and essential to the day-to-day operations of the campus, its services, and its facilities.
Mission Statement of Work Program
The mission of the Blackburn College student-managed work program is to meet the labor needs of the campus community, and to help better prepare students for a successful transition to life, work, and career after college by:
• Involving students to the maximum extent feasible in the provision of all goods and services needed and/or provided by the college.
o Reducing the cost of a four-year, private college education through student “self-help”. o Providing “hands-on” work, service and leadership learning opportunities in addition to the classroom. o Providing an added dimension of community involvement, and student character development emphasizing a strong work
ethic, responsibility and accountability.
Work Program Learning Goals
Through the Blackburn College Work Program experience, students refine a multitude of skills necessary to success after college. The skills that students learn and grow include:
Adaptability Communication: Receiving Communication: Sending Initiative
Leadership Personal Responsibility Problem Solving Social Responsibility
Interpersonal Relationships Project Management Job Specific Skills

9
Accreditation
Blackburn College is accredited by the North Central Association of Colleges and Schools. Its programs of teacher education are recognized by the Illinois State Teacher Certification Board and the State Superintendent of Education. The American Association of University Women grants Blackburn women graduates membership.
In addition to its representative memberships in various organizations that benefit specific administrative and academic departments, the College holds institutional memberships in the Council of Independent Colleges, the College Entrance Examination Board, the Federation of Illinois Colleges and Universities, the Associated Colleges of Illinois, the Association of Governing Boards of Universities and Colleges, and the Association of Presbyterian Colleges and Universities.
Academic Departments
Blackburn College offers the Bachelor of Arts degree with a major in these fields:
• Art • Biology • Business and Economics • Chemistry and Physics • Computer Science • Criminal Justice • Education • Educational Studies
• English and Communications • History • Leadership, Law, and Public Service • Mathematics • Performing Arts • Physical Education and Sports Management • Psychology • Spanish

10
Academic Majors Sorted by Academic Department
• Art
o Art o Graphic Arts o Visual Arts Education
• Biology o Biology – Environmental Track o Biology – General Track o Biology – Molecular Biology Track o Biology – Pre-med & Other Health
Professions Track o Environmental Studies o Medical Laboratory Science o Secondary Science Education: Biology (9-12)
• Business and Economics o Accounting o Business Management o Marketing
• Chemistry and Physics o Biochemistry o Chemistry – General Track o Chemistry – Pre-med and Other Health
Professions Track
• Computer Science
o Computer Science • Criminal Justice
o Criminal Justice • Education
o Elementary Education (K-9) o Physical Education (K-12) o Secondary English Education (9-12) o Secondary Mathematics Education (9-12) o Secondary Science Education: Biology (9-12) o Secondary Social Science Education:
History (9-12) o Visual Arts Education (K-12)
• Educational Studies o Educational Studies – Education
Paraprofessional Track o Educational Studies – Education Research
and Writing Track o Educational Studies – Writing and Designing
Children’s Literature Track o Human Resource Development

11
• English and Communications o Communications o Creative Writing o Literature o Professional Writing o Secondary English Education (9-12)
• History o History o Secondary Social Science Education:
History (9-12) • Leadership, Law, and Public Service
o Legal Studies o Political Science o Political Science – Public Admin. Track o Organizational Leadership
Arts Management Track Communications Track General Track Information Systems Track Public Service and Non-Profit Track Recreational Leadership Track
• Mathematics o Mathematics – Finance Track o Mathematics – General Track o Secondary Mathematics Education (9-12)
• Performing Arts o Performing Arts
Music Track Theatre Track Musical Theatre
• Physical Education o Physical Education (K-12) o Sports Management
• Psychology o Psychology
Clinical and Counseling Emphasis Experimental Emphasis
• Spanish o Spanish

12
Key Dates in History 1835 Gideon Blackburn Purchased Government Lands 1837 Blackburn Theological Seminary Deed of Trust established 1857 Charter granted for Blackburn Theological Seminary 1858 Old Main Constructed 1862 Blackburn Academy Organized 1864 Four-year College Established 1867 Theological Department Organized 1870 First College Commencement Held in Macoupin County
Courthouse 1880 Robertson Hall Constructed 1881 ‘Burnian First Published 1882 First Intercollegiate Athletic Competition – Baseball 1893 Athletic Association Established 1913 Work Program Initiated 1918 B.A. Four-Year Program Discontinued 1924 Stoddard Hall Constructed 1927 Old Main Destroyed Due to Fire 1928 Hudson Hall Constructed Butler Hall Constructed 1929 McKinley’s House Constructed 1930 Blackburn Academy Discontinued
Dedications for Organ and Chapel 1931 Blackburn Accredited by the North Central Association of
Colleges and Schools as a Junior College 1932 Hudson Hall and Clegg Chapel Constructed 1938 Dawes Gymnasium Constructed 1947 Honored Blackburn Beaver for First Time to Athletic Team Blackburn’s Program of Teacher Education First Recognized
by the State of Illinois 1949 Jones-Allison Hall Constructed
1950 WSMI, Carlinville’s Radio Station, Office/Broadcast Station in Stoddard
Blackburn Received Accreditation as a Four-Year Bachelor’s Degree Granting Institution
1952 C.H.C Anderson Student Center Constructed 1953 Olin Science Building Construction Began 1957 F.W. Olin Science Building Constructed 1959 Robertson Hall Destroyed Due to Fire Graham Hall Constructed 1962 Alumni Hall of Biology added to Olin Science Building 1963 Lumpkin Library Construction Began 1965 Challacombe Hall Constructed 1966 Ludlum Hall Constructed 1967 New Entrance College Constructed Theresa M. Renner Art Center Constructed 1968 C.H.C Anderson Student Center Renovated
Fred M. Jewell Hall Constructed James R. Fuller Infirmary Constructed 1969 Clegg Chapel Renovated Clement J. and Elizabeth P. Lumpkin Library Constructed 1970 Isabell Bothwell Conservatory of Music Constructed 1971 New Parking Areas and Roadways Provided 1974 Introduced Madrigal Dinner 1983 Computer Center Established New Baseball Field completed 1984 Herbert N. Woodward Physical Education Center Dedicated Maintenance Plant Completed 1986 Barney Beaver made First Appearance at Homecoming 1989 Dancers and Tumblers Invited to Entertain Madrigal Dinner 1991 Mary H. Rahme Learning Resource Center Dedicated 2012 Blackburn is Ranked #2 Best Buy in US News

13
Blackburn College Board of Trustees
2014-2015
Officers of the Board
Mr. Edward W. Young, Chair Dr. Hazel Loucks, Vice Chair Mr. Cress Maddox, Secretary
Board of Trustees
Mr. Jerome E. Adams
Mr. Charles J. Beetz
Dr. Lois B. DeFleur
Hon. Kenneth R. Deihl
Dr. Thomas A. Dew
Ms. Fran Goodman
Rev. Cliff Hayes
Mr. Mark Hinueber
Dr. William R. Jewell
Ms. Cynthia LaMar
Dr. John A. Lapp
Dr. George Malo
Dr. Bryan F. Meyers
Mr. David A. Olsen
Mr. Stanley M. Pillman
Dr. Diane Rutledge
Mr. James Sandfort
Ms. Jennifer Shelby
Col. Michael W. Smiley
Ms. Madonna Tideman

14
Presidents of Blackburn College Reverend John C. Downer 1859-1862
Robert B. Minton 1862-1867
John W. Bailey 1867-1876
Robert B. Minton 1876-1877
Edwin L. Hurd 1877-1891
Richard Edwards 1891-1893
James E. Rogers 1893-1896
Walter H. Crowell 1896-1897
Walter H. Bradley 1897-1905
Thomas W. Lingle 1905-1908
Walter H. Bradley 1908-1912
William Mestrezat Hudson 1912-1945
Robert Ward McEwen 1945-1949
Donald Matthew MacKenzie 1949
Robert Phillips Ludlum 1949-1965
Glenn Lowery McConagha 1965-1974
John Robert Alberti 1974-1982
William Foster Denman 1982-1989
David Warfield Brown 1989-1991
Miriam R. Pride 1991-2013
John L. Comerford 2013-

15
Core revenues per FTE enrollment, by source: Fiscal year 2014 Tuition and fees $12,758
Government grants and contracts $2,579 Private gifts, grants, and contracts $3,962
Investment return $4,747 Other core revenues $149
Percent distribution of core revenues, by source: Fiscal year 2014
NOTE: Core revenues for private, not-for-profit institutions (and a small number of public institutions) reporting under FASB standards include tuition and fees; government appropriations (federal, state, and local); government grants and contracts; private gifts, grants, and contracts (including contributions from affiliated entities); investment return; sales and services of educational activities; and other sources.
Source: IPEDS Finance 2015-16
Government grants and contracts
11%
Private gifts, grants, and contracts
16%
Other Core Revenues1%
Tuition and fees52%
Investment return20%

16
Core expenses per FTE enrollment, by function: Fiscal year 2014 Instruction $7,214
Research $0 Public service $0
Academic support $2,027 Institutional support $5,772
Student services $5,173 Other core expenses $0
Percent distribution of core expenses, by function: Fiscal year 2014
Instruction35%
Academic support
10%
Institutional support
29%
Student services26%

17
Enrollment by gender, student level, and full-and part-time statuses: Fall 2014
Total Men Women
All students 589 268 321 Undergraduates without audits 585 266 319
First-time 172 78 94 Transfer-ins 57 35 22 Continuing 360 155 205
Degree/certificate seeking 578 264 314 Non-degree/certificate seeking 11 4 7
Full-time students 554 257 297 First-time 167 77 90
Transfer-ins 53 34 19 Continuing 334 146 188
Degree/certificate seeking 553 257 296 Non-degree/certificate seeking 1 0 1
Part-time students 31 9 22 First-time 5 1 4
Transfer-ins 4 1 3 Continuing 22 7 15
Degree/certificate seeking 25 7 18 Non-degree/certificate seeking 6 2 4

18
Percent of all students enrolled by age: Fall 2014
Percent of all students enrolled, by race/ethnicity: Fall 2014
*17% of students identified as a minority race (excludes “Unknown Race”)
93.4%
6.6%0%
25%50%75%
100%
24 and Under 25 and Over
1.6%
2.0%
81.8%
2.2%
10.7%
1.2%
0.5%
0% 10% 20% 30% 40% 50% 60% 70% 80% 90%
Race and Ethnicity Unknown
Two or More Races
White
Hispanic
Black or African American
Asian
American Indian or Alaskan Native

19
Residence of degree/certificate-seeking undergraduates: Fall 2014
89.0%
10.2%
0.8%
87.4%
12.0%
0.6%
82.5%
15.8%
1.7%0.0%
20.0%
40.0%
60.0%
80.0%
100.0%
In-S
tate
Out
-of-
stat
e
Out
-of-
coun
try
In-S
tate
Out
-of-
stat
e
Out
-of-
coun
try
In-S
tate
Out
-of-
stat
e
Out
-of-
coun
try
All Students First-Time Undergrads New Transfers

20
Full-Time, First-Time Freshman Admissions Quantity and Quality Indicators: 2012-2014
Full-Time, First-Time Freshman Admissions Quantity and Quality Indicators
2012 2013 2014
Admissions Stage Male Female Total Male Female Total Male Female Total
Inquiries 1683 2769 4452 1707 2677 4384 1496 2374 3870
Gender % 38% 62% 100% 39% 61% 100% 39% 61% 100%
Applicants 195 288 483 232 296 528 361 427 788
Gender % 40% 60% 100% 44% 56% 100% 46% 54% 100%
Admits 119 177 296 155 204 359 226 287 513
Gender % 40% 60% 100% 43% 57% 100% 44% 56% 100%
Tuition Deposits/Enrollees 57 78 135 53 62 115 77 90 167
Gender % 42% 58% 58% 46% 54% 100% 46% 54% 100%
Conversion 12% 10% 11% 14% 11% 12% 24% 18% 20%
Acceptance Rate 61% 61% 61% 67% 69% 68% 63% 67% 65%
Yield 48% 44% 46% 34% 30% 32% 34% 31% 33%
ACT Average 21.9 22.4 22.2 21.9 22.4 22.0 21.1 21.2 21.2
HS GPA Average 3.12 3.46 3.32 3.22 3.47 3.35 3.14 3.39 3.28

21
Number of New Freshman Applicants, Admissions, and Students Enrolled: Fall 2014
Number applied Number admitted Number enrolled Full-time Part-Time
Total 788 513 185 6 Men 361 226 88 1
Women 427 287 97 5
Percentile test scores of first-time degree/certificate-seeking undergraduate students: Fall 2014
SAT 25th percentile 75th percentile
Critical Reading 420 525 Math 470 505
Percent submitting SAT scores: 2%
ACT 25th percentile 75th percentile Composite 18 24
English 17 24 Math 16 24
Reading 18 25 Science 19 24
Percent submitting ACT scores: 96%

22
Number of New Transfer Applicants, Admissions, and Students Enrolled: Fall 2011-Fall 2014
Number applied Number admitted
Number enrolled Full-time Part-Time Total
Fall 2014
Total 129 101 53 2 55
Men 69 53 34 1 35
Women 60 48 19 1 20
Fall 2013
Total 88 71 45 1 46
Men 40 31 20 1 21
Women 48 40 25 0 25
Fall 2012
Total 124 96 60 0 61
Men 58 44 25 0 27
Women 66 52 35 0 34
Fall 2011
Total 153 71 33 4 35
Men 64 27 17 0 17
Women 89 44 16 2 18

23
Student Housing Directory: 2014-2015
66
46 46
104
7165
184
0
58
4741
82
64
52
165
10
20
40
60
80
100
120
140
160
180
200
Butler Challacombe Graham Jewell Jones Stoddard Commuter Abroad
Fall 14 Spring 15

24
Work Program Data: 2011-2015
Work Program General Managers: 2011-2015
Fall 2011
Spring 2012
Fall 2012
Spring 2013
Fall 2013
Spring 2014
Fall 2014
Spring 2015
Academics 94 90 81 80 95 93 92 97 Administration 63 58 62 61 76 74 66 63
Athletics 30 25 31 30 36 34 47 39 Book Store 12 11 13 12 15 11 12 10
Campus and Community Safety 40 36 39 39 44 40 46 38 Campus Maintenance 41 32 37 37 42 33 45 39
Community Service 59 44 33 31 48 44 34 28 Campus Service 35 28 55 50 70 66 54 48
Food Service 55 53 51 45 81 75 55 46 Library 21 20 15 14 23 23 20 16
Snack Bar 26 20 24 20 42 36 24 17 Tech Services 19 14 18 15 30 28 22 15
Not in the Work Program 43 31 55 47 66 49 72 62
2011-2012 2012-2013 2013-2014 2014-2015
General Manager 1 Brandon Smith Tim Erton Katie Hazelwonder Carly Vunetich General Manager 2 Hannah Marlow Brett Rench Carly Vunetich Shane Rogers

25
Varsity Athletics Data: 2014-2015
Varsity Athletics Results: 2014-2015
18 19
8 93 5
22 2010 6 7
0
5
10
15
20
25
Men'sBaseball
Men'sBasketball
Women'sBasketball
Men's CrossCountry
Women'sCross
Country
Men's Golf Men's Soccer Women'sSoccer
Women'sSoftball
Women'sTennis
Women'sVolleyball
Team Roster Size
Sport Overall Conference
Wins Losses Ties Wins Losses Ties Men's Baseball 13 27 5 17 Men's Basketball 6 19 5 13 Women's Basketball 0 25 0 18 Men's Soccer 6 13 2 7 Women's Soccer 8 10 1 3 5 1 Women's Softball 5 31 3 15 Women's Tennis 1 14 0 5 Women's Volleyball 3 29 1 17

26
Graduates by Major and Gender: 2014-2015 Academic Majors Men Women Total
Accounting 6 5 11 Art/Art Studies, General 3 3
Biology/Biological Sciences, General 6 9 15 Business Administration, Management and Operations, Other 9 10 19
Chemistry, General 2 2 4 Communication, General 3 3
Computer Science 2 2 4 Creative Writing 2 2
Criminal Justice/Safety Studies 5 6 11 Elementary Education and Teaching 5 5
Environmental Biology 1 1 Graphic Arts 1 2 3
Health/Medical Preparatory Programs, Other 1 1 2 History, General 1 1
Interdisciplinary Studies 1 1 Literature 1 1 2
Marketing/Marketing Management, General 2 2 4 Mathematics, General 1 1
Organizational Leadership, Information Systems 1 1 Performing Arts, Music 1 1
Performing Arts, Theatre 1 1 Physical Education Teaching and Coaching 2 2 Political Science and Government, General 1 1 2
Professional Writing 1 1 Psychology, Clinical and Counseling Emphasis 1 5 6
Spanish 2 2 Sport and Fitness Administration/Management 6 3 9
*Number of graduates above is higher than total number of graduates due to double majors

27
Bachelor's degree graduation rates of full-time, first-time, degree/certificate-seeking undergraduates within 4 years, 6 years, and 8 years: 2006 cohort
Graduate Placement Rates: Spring 2015 Graduates # %
May 2015 Graduates 119 100 Responses (within 6 months of graduation) 114 95.8% Employed Graduates 113 99% Students Enrolled in Graduate/Professional School 11 9.6%
45% 45%36%
0%
10%
20%
30%
40%
50%
8-year 6-year 4-year
Graduation rate

28
Number of degrees and certificates awarded, by level and race/ethnicity and gender: 2014-2015
Completions: Total by First Major
Bachelor's Degree
Men Women Total American Indian or Alaskan Native 1 1 Asian 1 1 Black or African American 1 3 4 Hispanic 3 3 White 39 55 94 Non-Resident Alien 1 1 Two or More Races 2 2 4 Race and Ethnicity Unknown Total 47 61 108
Completions: Total by Second Major
Bachelor's Degree
Men Women Total American Indian or Alaskan Native Asian Black or African American Hispanic White 3 5 8 Two or More Races Non-Resident Alien 1 1 Race and Ethnicity Unknown Total 4 5 9

29
Graduation rates of full-time, first-time, degree/certificate-seeking undergraduates within 150% of normal time to program completion, by gender and race/ethnicity:
2008 cohort*
Incoming 2008
Graduated by 2014 Rate
Total 171 66 39% Men 77 26 34% Women 94 40 43% American Indian or Alaska Native 1 0 0% Asian 0 Black or African American 13 2 15% Hispanic or Latino 3 3 100% Native Hawaiian or Other Pacific Islander 0 White 149 61 41% Two or more races 5 0 0% Race/ethnicity unknown 0 Nonresident alien 0
*Graduation rates are based on the student's completion status as of August 31, 2014.
First to second year retention rates of first-time bachelor's degree-seeking undergraduates: (Fall 2013 cohort)
62% 0%0%
50%
100%
Full-Time Part-TimeRetention rate

30
Retention and Graduation History
Full-Time, First-Time, Degree/Certificate-Seeking 2002-2015
Fall of Year: F'02 F'03 F'04 F'05 F'06 F'07 F'08 F'09 F'10 F'11 F'12 F'13 F'14
Total FTFT Entering 147 175 178 188 177 175 171 146 150 141 135 115 167
F'03 F'04 F'05 F'06 F'07 F'08 F'09 F'10 F'11 F'12 F'13 F'14
Returning second year 85 96 115 123 107 106 100 93 91 100 100 71 Retention Year 1 to Year 2 58% 55% 65% 65% 60% 61% 58% 64% 61% 71% 74% 62%
F'04 F'05 F'06 F'07 F'08 F'09 F'10 F'11 F'12 F'13 F'14
Returning third year 69 74 88 99 89 88 84 73 70 84 80 Retention Year 1 to Year 3 47% 42% 49% 53% 50% 50% 49% 50% 47% 62% 59%
F'05 F'06 F'07 F'08 F'09 F'10 F'11 F'12 F'13 F'14
Returning fourth year 64 66 80 90 81 77 72 63 67 79 Retention Year 1 to Year 4 44% 38% 45% 48% 46% 44% 42% 43% 45% 56%
F'02 F'03 F'04 F'05 F'06 F'07 F'08 F'09 F'10 F'11 F'12 F'13 F'14
Graduating fourth year 45 49 59 64 64 55 52 46 49 % graduating in four years 31% 28% 33% 34% 36% 31% 30% 32% 33%
Graduating fifth year 59 66 77 88 80 77 63 60 % graduating in five years 40% 38% 43% 47% 45% 44% 37% 41%
Graduating sixth year 60 67 83 88 80 79 66 % graduating in six years 41% 38% 47% 47% 45% 45% 39% Graduating seventh year 67 80 79
% graduating in seven years 38% 45% 45% Graduating eighth year 67 80
% graduating in eight years 38% 45%

31
Full-Time, Transfer, Degree/Certificate-Seeking 2002-2015
Fall of Year: F'02 F'03 F'04 F'05 F'06 F'07 F'08 F'09 F'10 F'11 F'12 F'13 F'14
Total Full-Time Transfer Entering 45 30 40 46 35 37 45 49 50 33 60 45 53
After Two Years F'02 F'03 F'04 F'05 F'06 F'07 F'08 F'09 F'10 F'11 F'12 F'13 F'14
Graduated N 12 10 8 6 5 4 6 7 4 3 11 7 % 27% 33% 20% 13% 14% 11% 13% 14% 8% 9% 18% 16%
Returning N 21 12 11 17 17 17 23 19 23 11 22 17 % 47% 40% 28% 37% 49% 46% 51% 39% 46% 33% 37% 38%
All Graduated or Returning N 33 22 19 23 22 21 29 26 27 14 33 24 % 73% 73% 48% 50% 63% 57% 64% 53% 54% 42% 55% 53%
After Three Years F'02 F'03 F'04 F'05 F'06 F'07 F'08 F'09 F'10 F'11 F'12 F'13 F'14
Graduated N 22 16 17 17 16 16 18 23 10 8 23 % 49% 53% 43% 37% 46% 43% 40% 47% 20% 24% 38%
Returning N 10 3 3 6 6 6 8 2 12 5 7 % 22% 10% 8% 13% 17% 16% 18% 4% 24% 15% 12%
All Graduated or Returning N 32 19 20 23 22 22 26 25 22 13 30 % 71% 63% 50% 50% 63% 59% 58% 51% 44% 39% 50%
After Four Years F'02 F'03 F'04 F'05 F'06 F'07 F'08 F'09 F'10 F'11 F'12 F'13 F'14
Graduated N 31 19 19 23 19 19 23 26 21 12 % 69% 63% 48% 50% 54% 51% 51% 53% 42% 36%
Returning N 0 1 0 0 2 3 0 1 0 1 % 0% 3% 0% 0% 6% 8% 0% 2% 0% 3%
All Graduated or Returning N 31 20 19 23 21 22 23 27 21 13 % 69% 67% 48% 50% 60% 59% 51% 55% 42% 39%
After Five Years F'02 F'03 F'04 F'05 F'06 F'07 F'08 F'09 F'10 F'11 F'12 F'13 F'14
Graduated N 31 20 19 23 20 22 24 28 21 % 69% 67% 48% 50% 57% 59% 53% 57% 42%
Returning N 0 0 0 0 0 0 0 0 0 % 0% 0% 0% 0% 0% 0% 0% 0% 0%
All Graduated or Returning N 31 20 19 23 20 22 24 28 21 % 69% 67% 48% 50% 57% 59% 53% 57% 42%

32
Enrollment History 2002-2014
FIRST-TIME/FULL-TIME FRESHMEN ENROLLMENT BY CATEGORY
FALL COHORT 2002 2003 2004 2005 2006 2007 2008 2009 2010 2011 2012 2013 2014 ALL 147 175 178 188 177 175 171 146 150 141 135 115 167 Male 72 90 87 94 66 84 77 53 44 55 55 53 77
Female 75 85 91 94 111 91 94 93 106 86 80 62 90 MINORITY 21 20 25 20 22 24 17 15 27 20 19 11 35
ACT SCORE 18 - Below 40 48 46 35 27 38 38 32 43 40 29 20 52
19 -- 25 77 102 110 117 104 101 90 80 82 80 70 68 86 26 - Above 13 17 17 29 38 27 36 29 23 18 34 21 24
RESIDENCY Resident 134 154 162 181 159 154 145 120 125 126 124 92 153
Commuter 13 21 16 7 18 21 26 26 25 15 11 23 14 HIGH SCHOOL GPA
2.0--2.49 24 33 24 24 28 33 14 18 12 11 8 8 17 2.5--2.99 45 54 44 43 39 36 35 42 35 32 26 20 38 3.0--3.49 33 49 60 55 50 48 41 31 44 50 42 34 47 3.5--4.00 38 34 46 63 56 55 75 51 56 46 57 50 63
ATHLETICS Athlete 44 66 61 63 52 59 67 31 49 51 40 26 49
Non-Athlete 103 109 117 125 125 116 104 115 101 90 95 89 118

33
FULL-TIME TRANSFER ENROLLMENT BY CATEGORY
FALL COHORT 2002 2003 2004 2005 2006 2007 2008 2009 2010 2011 2012 2013 2014 ALL 45 30 40 46 35 37 45 49 50 33 60 45 53 Male 22 10 20 25 21 21 27 28 29 17 25 20 34
Female 23 20 20 21 14 16 28 21 21 16 35 25 19 Minority 4 1 0 3 2 7 8 11 9 11 8 5 17
First generation Not Available 17 13 27 12 11 RESIDENCY 2002 2003 2004 2005 2006 2007 2008 2009 2010 2011 2012 2013 2014
Resident 41 28 38 43 30 31 20 41 33 23 35 31 36 Commuter 4 2 2 3 5 6 25 8 17 10 25 14 17
ATHLETICS 2002 2003 2004 2005 2006 2007 2008 2009 2010 2011 2012 2013 2014 Athlete Not Available 13 26 14 11 17 6 20
Non-Athlete Not Available 32 23 36 22 43 39 33 WORK PROGRAM 2002 2003 2004 2005 2006 2007 2008 2009 2010 2011 2012 2013 2014
Participant Not Available 40 27 49 34 47 Non-Participant Not Available 10 6 11 11 6
34
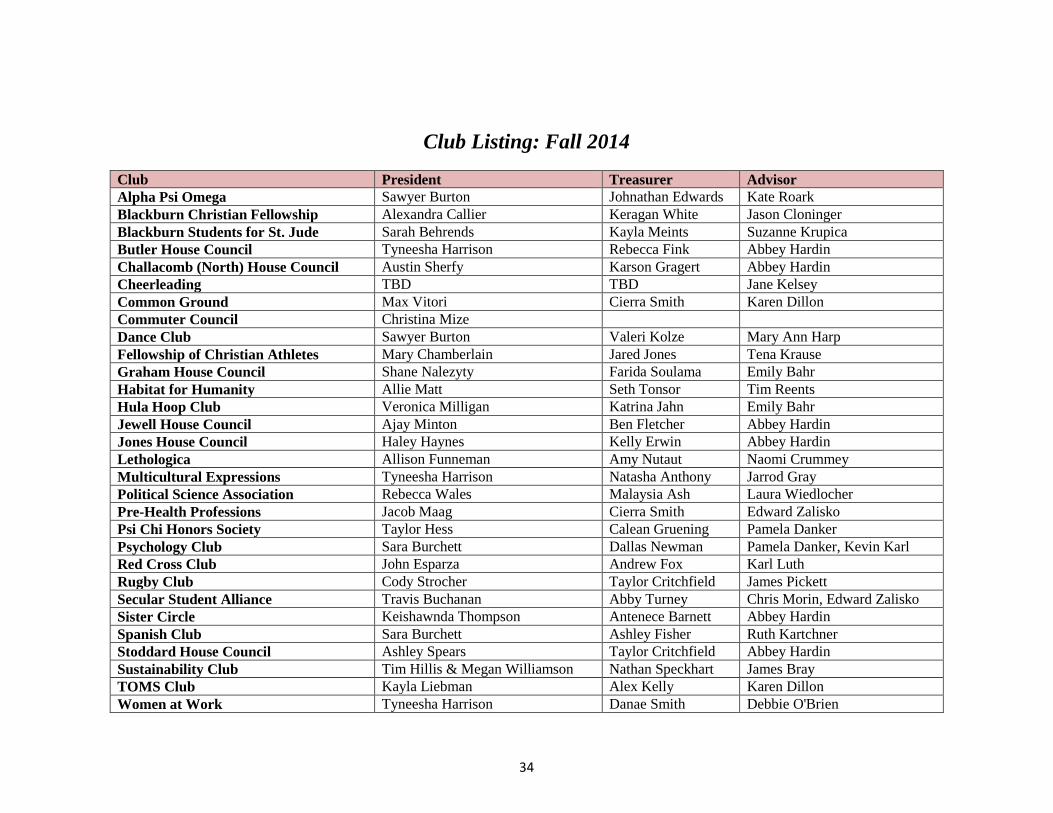
Club Listing: Fall 2014
Club President Treasurer Advisor Alpha Psi Omega Sawyer Burton Johnathan Edwards Kate Roark Blackburn Christian Fellowship Alexandra Callier Keragan White Jason Cloninger Blackburn Students for St. Jude Sarah Behrends Kayla Meints Suzanne Krupica Butler House Council Tyneesha Harrison Rebecca Fink Abbey Hardin Challacomb (North) House Council Austin Sherfy Karson Gragert Abbey Hardin Cheerleading TBD TBD Jane Kelsey Common Ground Max Vitori Cierra Smith Karen Dillon Commuter Council Christina Mize Dance Club Sawyer Burton Valeri Kolze Mary Ann Harp Fellowship of Christian Athletes Mary Chamberlain Jared Jones Tena Krause Graham House Council Shane Nalezyty Farida Soulama Emily Bahr Habitat for Humanity Allie Matt Seth Tonsor Tim Reents Hula Hoop Club Veronica Milligan Katrina Jahn Emily Bahr Jewell House Council Ajay Minton Ben Fletcher Abbey Hardin Jones House Council Haley Haynes Kelly Erwin Abbey Hardin Lethologica Allison Funneman Amy Nutaut Naomi Crummey Multicultural Expressions Tyneesha Harrison Natasha Anthony Jarrod Gray Political Science Association Rebecca Wales Malaysia Ash Laura Wiedlocher Pre-Health Professions Jacob Maag Cierra Smith Edward Zalisko Psi Chi Honors Society Taylor Hess Calean Gruening Pamela Danker Psychology Club Sara Burchett Dallas Newman Pamela Danker, Kevin Karl Red Cross Club John Esparza Andrew Fox Karl Luth Rugby Club Cody Strocher Taylor Critchfield James Pickett Secular Student Alliance Travis Buchanan Abby Turney Chris Morin, Edward Zalisko Sister Circle Keishawnda Thompson Antenece Barnett Abbey Hardin Spanish Club Sara Burchett Ashley Fisher Ruth Kartchner Stoddard House Council Ashley Spears Taylor Critchfield Abbey Hardin Sustainability Club Tim Hillis & Megan Williamson Nathan Speckhart James Bray TOMS Club Kayla Liebman Alex Kelly Karen Dillon Women at Work Tyneesha Harrison Danae Smith Debbie O'Brien

35
Club Listing: Spring 2015
Club President Treasurer Advisor Alpha Psi Omega Brendan Lersch Johnathon Edwards Kate Roark Art Club Noah Daum & Brandon Secrist Bryan Bethel Craig Newsom At Knit's End Shelby Rainford Amanda Carroll Naomi Crummey Butler House Council Tyneesha Harrison Alexis Ramirez Emily Bahr Challacombe (North) House Council Austin Sherfy Karson Gragert Abbey Hardin Dance Club Sawyer Burton Patterson Friese Mary Ann Harp Fellowship of Christian Athletes Mary Chamberlain Lauren Rhodes Tena Krause Film Club Blade Williams Ashley Sparks Mark Benedetti Flow Arts Veronica Milligan Katrina Jahn Emily Bahr Graham House Council Veronica Milligan Christian Bailey Emily Bahr Habitat for Humanity Allison Matt Seth Tonsor Abbey Hardin Jewell House Council Ajay Minton Ben Fletcher Abbey Hardin Jones House Council Haley Haynes Kelly Erwin Abbey Hardin Lethologica Allison Funneman Amy Nutaut Naomi Crummey Multicultural Expressions Tyneesha Harrison Natasha Anthony Jarrod Gray Political Science Association Katerina Emmons Rebecca Wales Laura Wiedlocher Pre-Health Professions Jacob Maag Cierra Smith Edward Zalisko & David Reid Psi Chi Honor Society Taylor Hess Calean Gruening Pamela Danker Psychology Club Sara Burchett Antenece Barnett Pamela Danker & Kevin Karl Red Cross Club John Esparza April Goodwin Karl Luth Rugby Club Cody Strocher Taylor Critchfield Chris Beck Running Club Nathan Speckhart Timothy Lacy Mark Hopping Secular Student Alliance Jordan Range Abby Turney Chris Morin Sister Circle Keishawnda Thompson Antenece Barnett Abbey Hardin Sustainability Club Tim Hillis & Megan Williamson Nathan Speckhart James Bray Spanish Club Sara Burchett Ashley Fisher Ruth Kartchner Spectrum Courtney Egner Emily Nelson Karen Dillon Stoddard House Council Ashley Spears Taylor Critchfield Abbey Hardin Student Athlete Advisory Committee Lauren Rhodes Vincent Birk Kacey Morrison Trading Card Games James Zeitler & Nathanial Boulch Andrew Kirby Chris Morin

36
Faculty Fall 2014 Spring 2015
Full-Time Part-Time Full-Time Part-Time Art 2 3 2 3 Biology 4 4 Business and Economics 3 2 2 2 Careers 2 2 Chemistry 2 1 2 1 Computer Science 1 1 Criminal Justice 2 2 1 Education 4 9 3 8 English and Communications 5 7 5 3 History 2 2 Leadership, Law, and Public Service 1 2 1 Mathematics 3 2 3 2 Performing Arts 2 5 2 4 Philosophy and Religion 1 1 Physical Education 2 5 2 5 Psychology 1 2 Spanish 1 1 1 1 Total 36 37 36 33
Staff Fall 2014 Spring 2015
Full-Time Part-Time Full-Time Part-Time Office of the President 2 2 Office of the Provost 6 6 Administration and Finance 7 7 Institutional Advancement 6 1 6 1 Marketing and Public Relations 2 2 Athletic Programs 8 2 8 5 Student Life 8 1 8 1 Admissions 7 8 Work Program 2 2 Library 1 1 1 1 Technology Services 6 6 1 Physical Plant 8 1 8 1 Dining Services 1 1 Bus Drivers 5 5 Total 64 11 65 15

37
Headcount Enrollment by State: Fall 2014
Puerto Rico 2
6 or more
3-5
1-2
Turkey 1
IL 524
CA 2
TN 1
IN 4
KY 5
CO 3
FL 1
GA 1
IA 2
MT 1
TX 2
LA 1
MD 3
RI 1 PA 1 OH
3
NY 1 WI
4
MO 24
Canada 1
Rwanda 1

38
Headcount Enrollment by Illinois County: Fall 2014
Adams 3
Alexander 1
Bond 6
Boone 1
Calhoun 10
Cass 3
Champaign 3
Christian 9 Clark
1
Clinton 1
Coles 1
Cook 35
Crawford 1
DeKalb 2
DeWitt 1
DuPage 5
Effingham 4
Fayette 6
Fulton 3
Greene 16
Hardin 1
Henry 3
Iroquois 2
Jackson 2
Jefferson 4
Jersey 13
Kane 4
Kankakee 8
Kendall 2
La Salle 1
Lake 7
Macon 13
Macoupin 137
Madison 43 Marion
3
Mason 3
McHenry 3
McLean 6
Menard 1
Mercer 3
Monroe 2
0
1-5
6-10
11+
Montgomery 39
Morgan 9
Peoria 8
Piatt 2
Pike 2
Pope 1
Randolph 5
St. Clair 14
Saline 1
Sangamon 45 Scott
5 Shelby
1
Union 1
Vermilion 5
Wayne 1
White 1
Winnebago 5
Will 3
Woodford 1
Williamson 2

39
Campus Map