Blackboard Learn Grade Center - Clemson...
91
Blackboard Grade Center Teaching & Learning Services [email protected] June 2010 Page 1 of 91 Blackboard Learn Grade Center Beginner Accessing the Blackboard Learn Grade Center ......................................................................................................2 Customizing the Grade Center View ......................................................................................................................5 Sorting the Grade Center ....................................................................................................................................5 Changing User Visibility in the Grade Center....................................................................................................5 Filter ...................................................................................................................................................................8 Grading Periods ..................................................................................................................................................8 Grading Schemas ..............................................................................................................................................12 Categories .........................................................................................................................................................18 Smart View .......................................................................................................................................................22 Column Organization .......................................................................................................................................35 Send Email........................................................................................................................................................40 Creating a Grade Center Column .........................................................................................................................42 Manually Creating a Grade Center Column .....................................................................................................42 Creating Calculated Columns ...........................................................................................................................45 Creating a Text Column ...................................................................................................................................61 Reports..................................................................................................................................................................64 Column Statistics and Grade Distribution ........................................................................................................64 Viewing Statistics by Student ...........................................................................................................................65 Create a Report .................................................................................................................................................66 View Grade History..........................................................................................................................................70 Viewing Student Survey/Test/Assignment Attempts ...........................................................................................73 Assign a Grade to an Essay Question ...............................................................................................................73 Entering Grades manually in the Grade Center ................................................................................................75 Changing a Grade .............................................................................................................................................76 Overriding a Grade ...........................................................................................................................................78 Reverting a Grade .............................................................................................................................................80 Exempting a Grade ...........................................................................................................................................81 Grading Student Assignments ..........................................................................................................................83 Clearing Survey/Test/Assignment Attempts ....................................................................................................87 Downloading Assignments ...............................................................................................................................89
Transcript of Blackboard Learn Grade Center - Clemson...

Blackboard Grade Center
Teaching & Learning Services [email protected] June 2010 Page 1 of 91
Blackboard Learn Grade Center Beginner
Accessing the Blackboard Learn Grade Center ......................................................................................................2
Customizing the Grade Center View ......................................................................................................................5
Sorting the Grade Center ....................................................................................................................................5
Changing User Visibility in the Grade Center ....................................................................................................5
Filter ...................................................................................................................................................................8
Grading Periods ..................................................................................................................................................8
Grading Schemas ..............................................................................................................................................12
Categories .........................................................................................................................................................18
Smart View .......................................................................................................................................................22
Column Organization .......................................................................................................................................35
Send Email........................................................................................................................................................40
Creating a Grade Center Column .........................................................................................................................42
Manually Creating a Grade Center Column .....................................................................................................42
Creating Calculated Columns ...........................................................................................................................45
Creating a Text Column ...................................................................................................................................61
Reports ..................................................................................................................................................................64
Column Statistics and Grade Distribution ........................................................................................................64
Viewing Statistics by Student ...........................................................................................................................65
Create a Report .................................................................................................................................................66
View Grade History ..........................................................................................................................................70
Viewing Student Survey/Test/Assignment Attempts ...........................................................................................73
Assign a Grade to an Essay Question ...............................................................................................................73
Entering Grades manually in the Grade Center ................................................................................................75
Changing a Grade .............................................................................................................................................76
Overriding a Grade ...........................................................................................................................................78
Reverting a Grade .............................................................................................................................................80
Exempting a Grade ...........................................................................................................................................81
Grading Student Assignments ..........................................................................................................................83
Clearing Survey/Test/Assignment Attempts ....................................................................................................87
Downloading Assignments ...............................................................................................................................89

Blackboard Grade Center
Teaching & Learning Services [email protected] June 2010 Page 2 of 91
Accessing the Blackboard Learn Grade Center
To access the Blackboard Learn Grade Center:
1. Login to Blackboard Learn.
2. Click the Courses tab.
3. Click the course to open from the Course List module.
4. The course entry page is displayed.
5. From the Control Panel, click the chevron to expand Grade Center.

Blackboard Grade Center
Teaching & Learning Services [email protected] June 2010 Page 3 of 91
6. Click Full Grade Center.
7. The Grade Center is displayed.
Note: All courses will contain two automatically generated columns: a Total Points column and
a Weighted Grade column. The user must configure the settings of these two columns.
a. Action Bar
Create Column – Click to create a column that represents a gradable item in the course.

Blackboard Grade Center
Teaching & Learning Services [email protected] June 2010 Page 4 of 91
Create Calculated – From the contextual menu, select one of the following calculated
columns: Average, Minimum/Maximum, Total or Weighted.
Manage – From the contextual menu, select an option to manage Grading Periods, Grading
Schemas, Categories, Smart Views, Column Organization, Student Visibility, or to Send
Email.
Reports – From the contextual menu, either create a report or view grade history.
b. Work Offline
Upload – Grades can be created off-line and then uploaded to the Grade Center. Grades that
were created in another grade system can also be uploaded for inclusion in the Grade Center.
The data in the file must be synchronized to the Grade Center data by using unique identifiers
for each student (User Name) and each Grade Center column (Column ID number). Column
ID numbers are generated by the system and should not be changed to removed.
Download – Grade Center data can be downloaded as a delimited (separated) file and used in
spreadsheet or statistical analysis applications such as Microsoft Excel. Faculty can
download the complete Grade Center page or select specific data to download.
c. Filters
Current View – From the contextual menu, select whether to place the columns in ascending
or descending order according to the Column Organization defined by using the Manage
contextual menu.
Category – From the contextual menu, select a category to filter by.
Status – From the contextual menu, select an assignment status to filter by.
Sort Columns By – From the contextual menu, select one of the following options for
sorting the columns: Layout Position, Categories, Due Date, Date Created, Points Possible,
or Display Name.
Order – From the contextual menu, select whether to place the columns in ascending or
descending order according to the Column Organization defined by using the Manage
contextual menu.
d. Column Properties – Column properties vary depending on the type of column. Click the
Action Link for a column to see all options.
e. Icon Legend – Information on the meaning of icons that appear in spreadsheet cells.
f. Email – Email can be sent to selected students, all students, selected observers, or all observers
directly from the Grade Center. The Email link goes to the Send Email page.

Blackboard Grade Center
Teaching & Learning Services [email protected] June 2010 Page 5 of 91
g. Edit Rows Displayed – determines how many rows of data are displayed. The minimum
number of rows to display is 5. The maximum number of rows to display is 50.
Customizing the Grade Center View
Sorting the Grade Center
To facilitate seeing Grade Center data in different ways, Faculty, TAs, and Graders can sort all visible
columns within the Grade Center based on the Sort Columns By drop down menu. The different
criteria include:
Layout Position – switches the layout of the columns from first to last. When clicked again it
moves the last column to the first position.
Categories – User defined categories or default categories to identify the type of gradable item
such as a “Test” or “Lab Report”.
Due Date – Faculty defined date that a gradable item is due.
Date Created – The date the gradable item was created in the system.
Points Possible – Faculty defined total number of points a gradable item is worth.
Display Name – Faculty defined name for the gradable item.
Note: Sorting based on criteria in the Sort Columns By drop down menu is not saved across
sessions. It will only last as long as the current session remains open. Once the browser is
closed, the view will default back to its default view.
Changing User Visibility in the Grade Center
Users can be hidden from the Grade Center View, reducing the number of rows in the grid. Hidden
users are not deleted from the Grade Center, and can be revealed at any time.
Option 1:
You might have students in your class that have not completed any assignments, but have not dropped
your class either. If you do not want these students to show up continuously in the Grade Center, you
can change their visibility.
To change user visibility:
1. Hover your mouse over the Manage action link and select Student Visibility.

Blackboard Grade Center
Teaching & Learning Services [email protected] June 2010 Page 6 of 91
2. The User Visibility page is displayed.
3. Select the checkbox(s) for the students you want to change the visibility of.
a. Click Hide Users to make the student not visible on the Grade Center.
Note: Users that are hidden will appear grayed out on the User Visibility page and will not
appear in the Grade Center View.
b. Click Show Users to make the student visible on the Grade Center.
4. Then click Submit.
Option 2:
Occasionally students may call or stop by your office and want to discuss their grade. In which case,
you might want to quickly filter by that particular student’s row in the Grade Center. You can make all
other students invisible so that you can discuss just that student’s grade with them. Then when you are
done, you can toggle back to display all of the students in the Grade Center.
To change user visibility:
1. Navigate to the student’s row in the Grade Center.

Blackboard Grade Center
Teaching & Learning Services [email protected] June 2010 Page 7 of 91
2. Then click the action menu for the specific student to single out.
3. Select Hide Other Rows.
4. The Grade Center is displayed with all student records hidden except those of the selected student.
5. To unhide the other students, click the action menu for the selected student.

Blackboard Grade Center
Teaching & Learning Services [email protected] June 2010 Page 8 of 91
6. Then select Show All Rows. The Grade Center is displayed with all student records except those
whose visibility was changed using Option 1.
Filter
The Filter option is a toggle that can be turned On/Off. The Filter option allows you to enable different
filters that can be applied to the Grade Center. Below are some of the configuration options:
Current View – Contains the options to filter the Grade Center by Favorites, the Full Grade
Center, Grading Periods and Smart Views.
Full Grade Center – this is a view created by default. It displays all columns and rows in
the Grade Center.
Smart Views – are views of the Grade Center based on a variety of student criteria. This
enables Faculty to create certain views of the Grade Center – based on performance criteria
for gradable items such as Assessments or Assignments – that quickly track Students.
Category – Contains the option to filter the Grade Center by a specific category.
Status – Contains the option to filter the Grade Center by status. Statuses include: Completed,
Edited Manually, Exempt, In Progress, Needs Grading and not attempted.
Grading Periods
Grading Periods are segments that can help manage the Grade Center. Grading Periods, for example,
can be defined as Terms, Semesters, Quarters, Years, etc. and can have date ranges that further define
them. Grading Periods are not created by default. Columns can be assigned a Grading Period to allow
them to be sorted together.
Blackboard Grade Center
Teaching & Learning Services [email protected] June 2010 Page 9 of 91
Creating a Grading Period
To create a Grading Period:
1. Hover your mouse over the Manage action link and select Grading Periods.
2. The Grading Periods page is displayed.
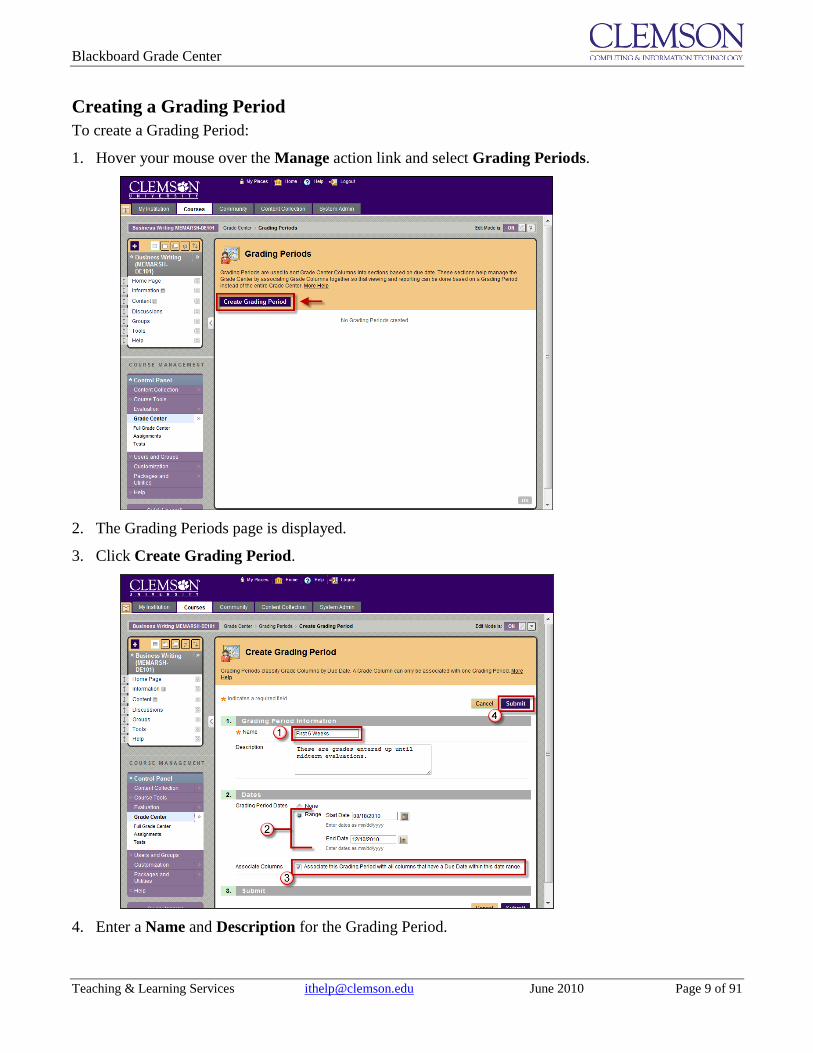
3. Click Create Grading Period.
4. Enter a Name and Description for the Grading Period.
Blackboard Grade Center
Teaching & Learning Services [email protected] June 2010 Page 10 of 91
5. Select the Grading Period Dates.
a. None – Grading Periods can be help to organize columns in the grade center by other criteria
then date. For example if you have a student project that has multiple components. You can
create a Grade Period for the project and assign the related columns to the Grade Period. This
will allow you to filter the student grades so that only the grades associated with the selected
project are displayed.
b. Range – Using a date range can be set to automatically associate Grade Columns that have Due
Dates that fall within the range. This only applies to existing Grade Columns. New Grade
Columns must be associated with the Grading Period when they are created.
Note: Grade Center Columns cannot be associated with more than one Grading Period. A newly
created Grading Period with the same or an overlapping date range will override the settings of
an existing Grading Period. All items associated with the existing Grading Period will become
associated with the new one.
6. If a date range has been specified, select Associate the Grading Period with all columns that have
a Due Date within this date range.
7. Click Submit.
Manually Assigning Columns to a Grading Period
To manually assign a Column to a Grading Period:
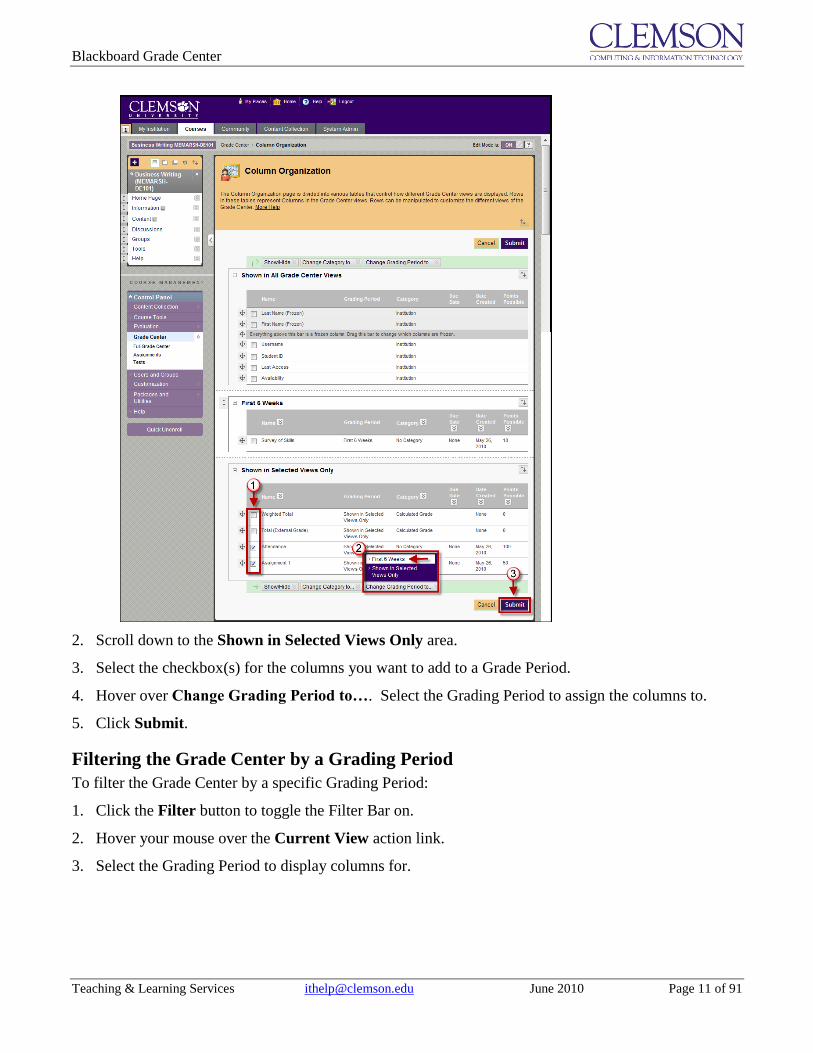
1. Hover your mouse over the Manage action link and select Column Organization.
Blackboard Grade Center
Teaching & Learning Services [email protected] June 2010 Page 11 of 91
2. Scroll down to the Shown in Selected Views Only area.
3. Select the checkbox(s) for the columns you want to add to a Grade Period.
4. Hover over Change Grading Period to…. Select the Grading Period to assign the columns to.
5. Click Submit.
Filtering the Grade Center by a Grading Period
To filter the Grade Center by a specific Grading Period:
1. Click the Filter button to toggle the Filter Bar on.
2. Hover your mouse over the Current View action link.
3. Select the Grading Period to display columns for.

Blackboard Grade Center
Teaching & Learning Services [email protected] June 2010 Page 12 of 91
4. Click a Grading Period to set it as your new default view of the Grade Center.
Grading Schemas
Grading Schemas take the actual points scored from a Grade Item and compare it to the total points
possible for that item to derive a percentage. This percentage is mapped to a range of scores in order to
display a grade.
For example, a student’s raw numeric score on a quiz that has 100 possible points is an 88. In a Grading
Schema in which a percentage of 87.5 to 89.5 equals a B+, this score results in a B+. If the grade
display Letter option is chosen, the B+ will display to the Student.
The Grade Center includes a copy of a default grading schema. Grading Schemas may be edited or
added to an ongoing Course and grades will be edited to reflect the changes.
Creating a Grading Schema
To create a Grading Schema:
1. Hover your mouse over the Manage action link and select Grading Schemas.
2. Click Create Grading Schema.

Blackboard Grade Center
Teaching & Learning Services [email protected] June 2010 Page 13 of 91
3. Enter a Name and Description for the Grading Schema. The Name will appear in the drop-down
menu for Primary Display and Secondary Display when adding an item to the Grade Center as well
as on the Manage Grading Schema page.
4. Enter the Schema Mapping information. By default any new grading schema will have two ranges
of percentiles from 50% to 100% and from 0% to less than 50%.
5. Click the arrow to insert a new row into the schema to enter additional values to the schema.
6. Click Delete Row to remove a row from the schema.
Blackboard Grade Center
Teaching & Learning Services [email protected] June 2010 Page 14 of 91
7. Enter the range for each grade value as a percentage. This percentage must be less than the value
listed above it, and more than the value listed below it. However, there should also be overlap. For
example:
A = 90 – 100%
B = 80 – 90%
C = 70 – 80%
D = 60 – 70%
F = 0 – 60%
This ensures that there are no gaps. The range of 80 – 90% includes all grades up to but not
including 90%. The top range however does include 100%.
Note: The dash symbol “ – ˮ cannot be used as an entry in the percentage range. The dash
represents a Null value.
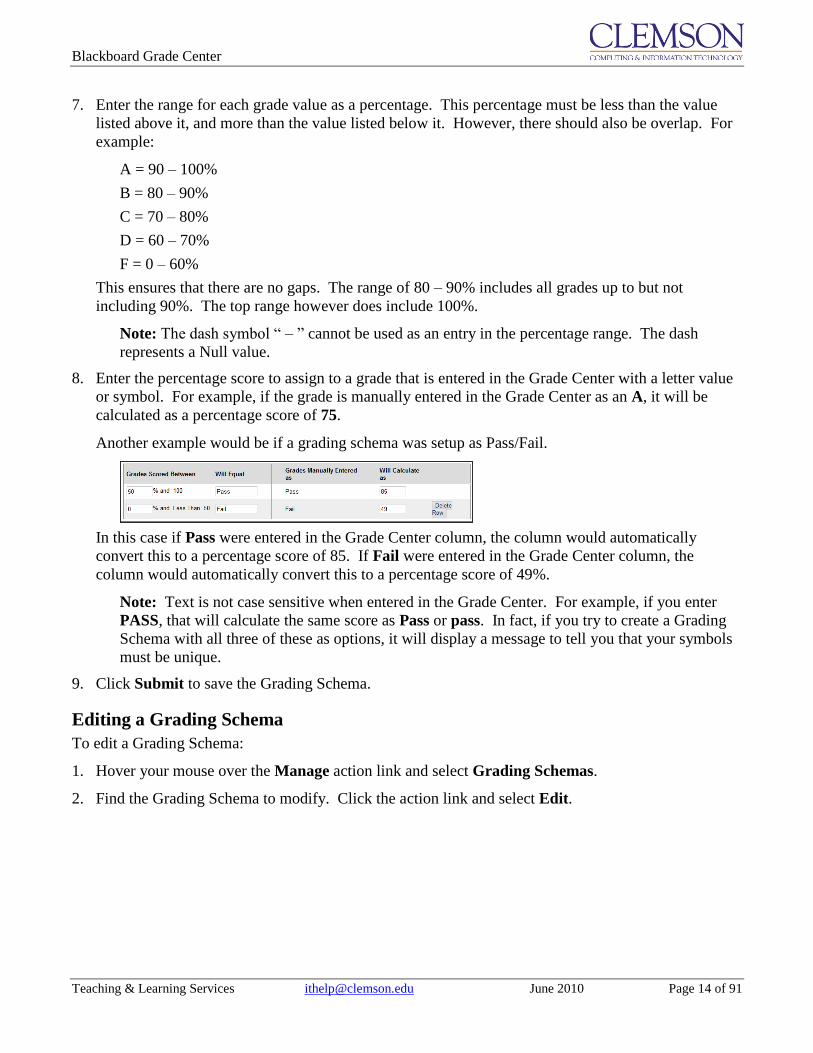
8. Enter the percentage score to assign to a grade that is entered in the Grade Center with a letter value
or symbol. For example, if the grade is manually entered in the Grade Center as an A, it will be
calculated as a percentage score of 75.
Another example would be if a grading schema was setup as Pass/Fail.
In this case if Pass were entered in the Grade Center column, the column would automatically
convert this to a percentage score of 85. If Fail were entered in the Grade Center column, the
column would automatically convert this to a percentage score of 49%.
Note: Text is not case sensitive when entered in the Grade Center. For example, if you enter
PASS, that will calculate the same score as Pass or pass. In fact, if you try to create a Grading
Schema with all three of these as options, it will display a message to tell you that your symbols
must be unique.
9. Click Submit to save the Grading Schema.
Editing a Grading Schema
To edit a Grading Schema:
1. Hover your mouse over the Manage action link and select Grading Schemas.
2. Find the Grading Schema to modify. Click the action link and select Edit.

Blackboard Grade Center
Teaching & Learning Services [email protected] June 2010 Page 15 of 91
3. The Edit Grading Schema page.
4. Modify the grading schema. Then click Submit.
Deleting a Grading Schema
To delete a Grading Schema:
1. Hover your mouse over the Manage action link and select Grading Schemas.
2. The Grading Schemas page is displayed.
3. Find the Grading Schema to delete.

Blackboard Grade Center
Teaching & Learning Services [email protected] June 2010 Page 16 of 91
4. Click the action link and select Delete.
5. You will be prompted to confirm deletion of the schema.
6. Click OK.
Copying a Grading Schema
To copy a Grading Schema:
1. Hover your mouse over the Manage action link and select Grading Schemas.
2. The Grading Schemas page is displayed.
3. Find the Grading Schema to copy.

Blackboard Grade Center
Teaching & Learning Services [email protected] June 2010 Page 17 of 91
4. Click the action link and select Copy. The new Grading Schema is displayed on the Grading
Schemas page.
5. Review the steps in Editing a Grading Schema to learn how to modify the copied schema.
Assigning a Grading Schema to a Grade Center Column
To assign a Grading Schema to a Grade Center Column:
1. Click the action link for the Grade Center Column to assign the Grading Scheme.
2. Select Edit Column Information.
3. The Edit Column page is displayed.

Blackboard Grade Center
Teaching & Learning Services [email protected] June 2010 Page 18 of 91
4. From the Primary Display drop down menu select the Grading Schema to assign to the selected
column.
5. Then click Submit.
Categories
Categories can be created to organize the Grade Center and run reports on specific types of grades.
Default categories include Assignment, Discussion, Survey, and Test. Faculty can create their own
categories like Labs, Group Work, Quizzes, etc. Faculty can then sort the Grade Center by a specific
Category to compare how all the Students scores in a specific category. Categories can also be used to
create Smart Views and Calculated Columns.
Creating a Category
To create a category:
1. Hover your mouse over the Manage action link and select Categories.
2. The Categories page is displayed.
3. Click Create Category.

Blackboard Grade Center
Teaching & Learning Services [email protected] June 2010 Page 19 of 91
4. Enter a Name for the category.
5. Enter a Description. This can help differentiate categories and explain the purpose of the category.
6. Click Submit.
Editing a Category
To edit a category:
1. Hover your mouse over the Manage action link and select Categories.
2. The Categories page is displayed.
3. Click the action link for the Category to edit.
4. Select Edit.

Blackboard Grade Center
Teaching & Learning Services [email protected] June 2010 Page 20 of 91
5. The Edit Category page is displayed.
6. Modify the category. Then click Submit.
Deleting a Category
To delete a category:
1. Hover your mouse over the Manage action link and select Categories.
2. The Categories page is displayed.
3. Click the action link for the Category to delete.
Note: The action link will only appear for those categories that can be deleted from the system.
The six default categories cannot be removed.
4. Select Delete.

Blackboard Grade Center
Teaching & Learning Services [email protected] June 2010 Page 21 of 91
Assigning a Category to Multiple Columns
To assign a category to multiple columns:
1. Hover your mouse over the Manage action link and select Column Organization.
2. The Column Organization page is displayed.
3. Select the column(s) for which to change the category.
4. Hover your mouse over Change Category to … and select the category to assign to the selected
columns.

Blackboard Grade Center
Teaching & Learning Services [email protected] June 2010 Page 22 of 91
5. The category changes are reflected automatically.
6. Click Submit to save the changes to the columns properties.
Smart View
A Smart View is a focused look at the Grade Center. Smart Views are used to quickly find data when
the Grade Center includes a great number of Students and Columns. They enable faculty to create
certain views of the Grade Center based on performance criteria for gradable items such as Assessments
or Assignments that quickly track Students. There are four different types of Smart Views that specify
student information:
Group allows the faculty member to filter for members of a Group, which was created in the
course. Groups are subsections created in the User Management area of the Control Panel. They
are a collection of students selected by the faculty member.
Performance allows the faculty member to filter based on students’ performance on a single
gradable item such as a mid-term exam.
User allows the faculty member to view individual student information.
Category and Status allows the faculty member to select from a full list of student attributes
including categories and status.
Custom allows the faculty member to build a custom query based on user criteria.
Smart Views become part of the Current View drop-down list. Any Smart View can be saved as the
default view of the Grade Center. Smart Views can also be tagged as a Favorite. Favorites are
displayed in the Control Panel under the Grade Center heading. There are two system generated Smart
Views that are displayed in the Grade Center heading: Tests and Assignments.
Note: System generated Smart Views can be removed from the Grade Center heading by
customizing the Smart View. To customize a Smart View, hover over the Manage action link
and select Smart View. Click the green star to remove the Smart View from the Grade Center
heading. Click OK to accept these changes.
Creating a Group Smart View
A Group Smart View can be used if you have combined multiple sections into a single Blackboard
Learn course, and would like to filter the Grade Center by a particular section. You can separate the
students into specific groups by the sections they are enrolled in. Then create a Smart View to use to
filter the Grade Center by specific groups.
Note: Groups must be made before they can be selected for a Smart View.
To create a Group Smart View:
1. Hover your mouse over the Manage action link and select Smart Views.
2. The Smart Views page is displayed.
Blackboard Grade Center
Teaching & Learning Services [email protected] June 2010 Page 23 of 91
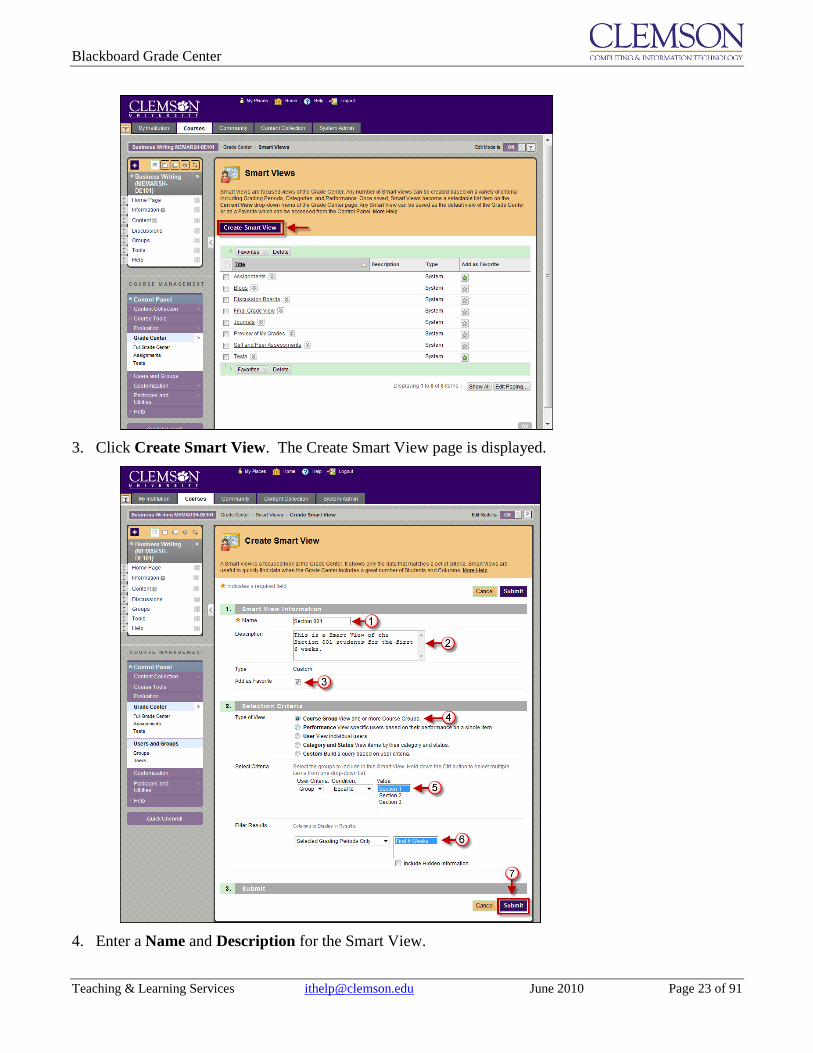
3. Click Create Smart View. The Create Smart View page is displayed.
4. Enter a Name and Description for the Smart View.
Blackboard Grade Center
Teaching & Learning Services [email protected] June 2010 Page 24 of 91
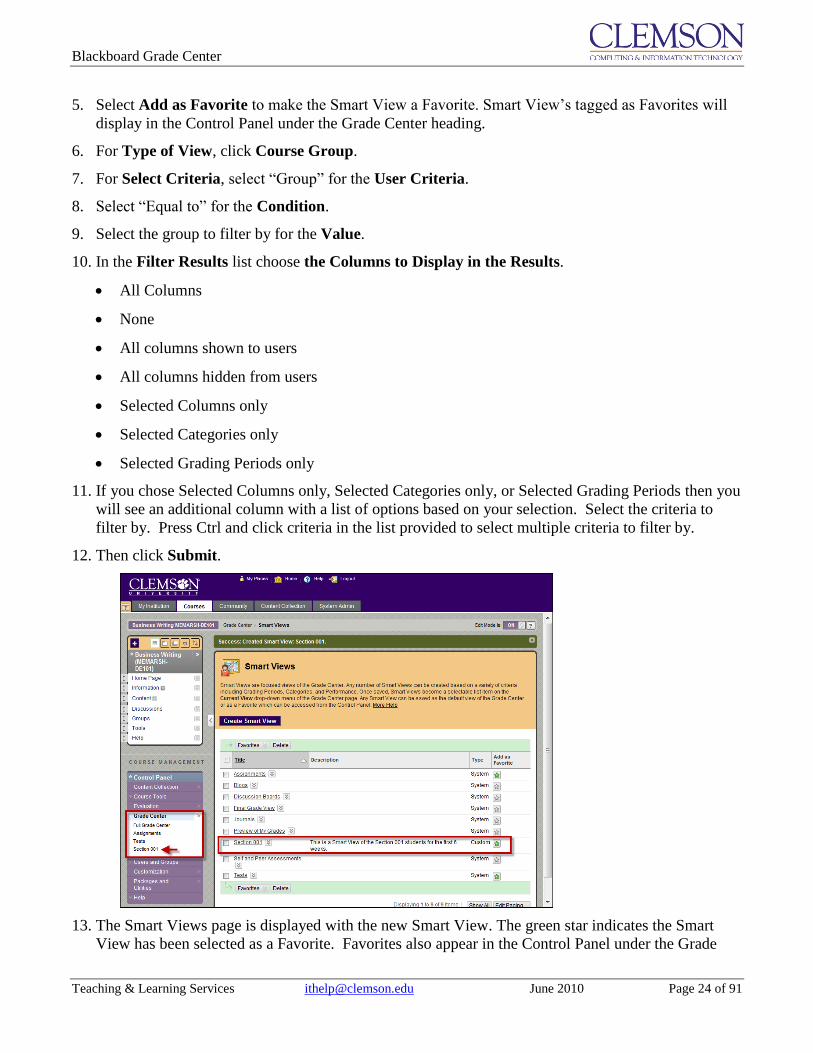
5. Select Add as Favorite to make the Smart View a Favorite. Smart View’s tagged as Favorites will
display in the Control Panel under the Grade Center heading.
6. For Type of View, click Course Group.
7. For Select Criteria, select “Group” for the User Criteria.
8. Select “Equal to” for the Condition.
9. Select the group to filter by for the Value.
10. In the Filter Results list choose the Columns to Display in the Results.
All Columns
None
All columns shown to users
All columns hidden from users
Selected Columns only
Selected Categories only
Selected Grading Periods only
11. If you chose Selected Columns only, Selected Categories only, or Selected Grading Periods then you
will see an additional column with a list of options based on your selection. Select the criteria to
filter by. Press Ctrl and click criteria in the list provided to select multiple criteria to filter by.
12. Then click Submit.
13. The Smart Views page is displayed with the new Smart View. The green star indicates the Smart
View has been selected as a Favorite. Favorites also appear in the Control Panel under the Grade

Blackboard Grade Center
Teaching & Learning Services [email protected] June 2010 Page 25 of 91
Center heading. To disable this Smart View from being a Favorite, click the green star. Click OK
to accept these changes.
Creating a Performance Smart View
A Performance Smart View can be used if you want to track at risk students. Select the columns and
then specify the cutoff point below which students are in danger. You could also use this feature to
figure out the students that excel so that you can create a list of possible tutors.
To create a Performance Smart View:
1. Hover your mouse over the Manage action link and select Smart Views.
2. The Smart Views page is displayed.
3. Click Create Smart View. The Create Smart View page is displayed.

Blackboard Grade Center
Teaching & Learning Services [email protected] June 2010 Page 26 of 91
4. Enter a Name and Description for the Smart View.
5. Select Add as Favorite to make the Smart View a Favorite. Smart View’s tagged as Favorites will
display in the Control Panel under the Grade Center heading.
6. For Type of View, click Performance.
7. For Select Criteria, select “Grade on Total (Score)” for the User Criteria.
8. Select “Less than or Equal to” for the Condition.
9. Set the score to filter by for the Value.
10. In the Filter Results list choose the columns to display in the results.
11. Then click Submit.
12. The Smart Views page is displayed with the new Smart View.
Creating a User Smart View
The User Smart View can be used to monitor a specific set of students. An example might be if there
were students that were given permission to take the course without taking pre-requisite courses. You
can monitor those particular students in the Grade Center by creating a Focus Smart View.
To create a User Smart View:
1. Hover your mouse over the Manage action link and select Smart Views.

Blackboard Grade Center
Teaching & Learning Services [email protected] June 2010 Page 27 of 91
2. The Smart Views page is displayed.
3. Click Create Smart View. The Create Smart View page is displayed.

Blackboard Grade Center
Teaching & Learning Services [email protected] June 2010 Page 28 of 91
4. Enter a Name and Description for the Smart View.
5. Select Add as Favorite to make the Smart View a Favorite. Smart View’s tagged as Favorites will
display in the Control Panel under the Grade Center heading.
6. For Type of View, click Focus (Select individual users).
7. For Select Criteria, select “Selected Users” for the User Criteria. Then select the specific users to
include in the Smart View.
8. In the Filter Results list choose the columns to display in the results.
9. Then click Submit.
10. The Smart Views page is displayed with the new Smart View.
Creating a Category and Status Smart View
The Category and Status Smart View allows the Faculty to select from a full list of Student attributes.
This is a combination of the other two options. There are some default Smart Views like, Assignments
and Tests that use categories and statuses to follow student progress. Additional Category and Status
Smart Views can be created. An example of a Category and Status Smart View could include finding all
incomplete assignments.

Blackboard Grade Center
Teaching & Learning Services [email protected] June 2010 Page 29 of 91
To create a Category and Status Smart View:
1. Hover your mouse over the Manage action link and select Smart Views.
2. The Smart Views page is displayed.
3. Click Create Smart View. The Create Smart View page is displayed.

Blackboard Grade Center
Teaching & Learning Services [email protected] June 2010 Page 30 of 91
4. Enter a Name and Description for the Smart View.
5. Select Add as Favorite to make the Smart View a Favorite. Smart View’s tagged as Favorites will
display in the Control Panel under the Grade Center heading.
6. For Type of View, click Category and Status.
7. For Select Criteria, select “Assignment” for the Categories. Then select the specific users to
include in the Smart View.
8. In the Filter Results list choose the status to filter for. In this example, you would select “Not
Attempted.”
9. Then click Submit.
10. The Smart Views page is displayed with the new Smart View.
Creating a Custom Build Smart View
The Custom Build Smart View allows you to use multiple user criteria. Criteria are added as AND
statements. As each criterion is added, it is assigned a number. This number is reflected in the Formula
Editor, which appears below the criteria. Each criterion that is added can have a condition such as equal
to, greater than, and less than. Each condition requires a value to compare with the condition.
After all the criteria have been entered, the formula for the query appears. The formula can be manually
edited to change the operators and to insert parenthesis to change the way the formula is completed.

Blackboard Grade Center
Teaching & Learning Services [email protected] June 2010 Page 31 of 91
To create a Custom Smart View:
1. Hover your mouse over the Manage action link and select Smart Views.
2. The Smart Views page is displayed.
3. Click Create Smart View. The Create Smart View page is displayed.

Blackboard Grade Center
Teaching & Learning Services [email protected] June 2010 Page 32 of 91
4. Enter a Name and Description for the Smart View.
5. For Type of View, click Custom.
6. For Select Criteria, select a User Criteria.
7. Then select a Condition.
8. Enter or choose a Value.
9. To insert more User Criteria, click Add User Criteria. To remove a User Criteria, click Delete.
10. As User Criteria are added to the query, the Formula Editor will be populated with Selection Criteria
and Operators.
11. Click Manually Edit to modify the operators and insert parenthesis into the formula.
Blackboard Grade Center
Teaching & Learning Services [email protected] June 2010 Page 33 of 91
12. In the Filter Results list choose the columns to display in the results.
13. Then click Submit.
14. The Smart Views page is displayed with the new Smart View.
Applying a Smart View to the Grade Center
There are two ways to apply a Smart View to the Grade Center. You can use the Smart Views that you
saved as Favorites, or you can navigate to the Full Grade Center and use the Filter option.
Option 1
To apply a Smart View Favorite to the Grade Center:
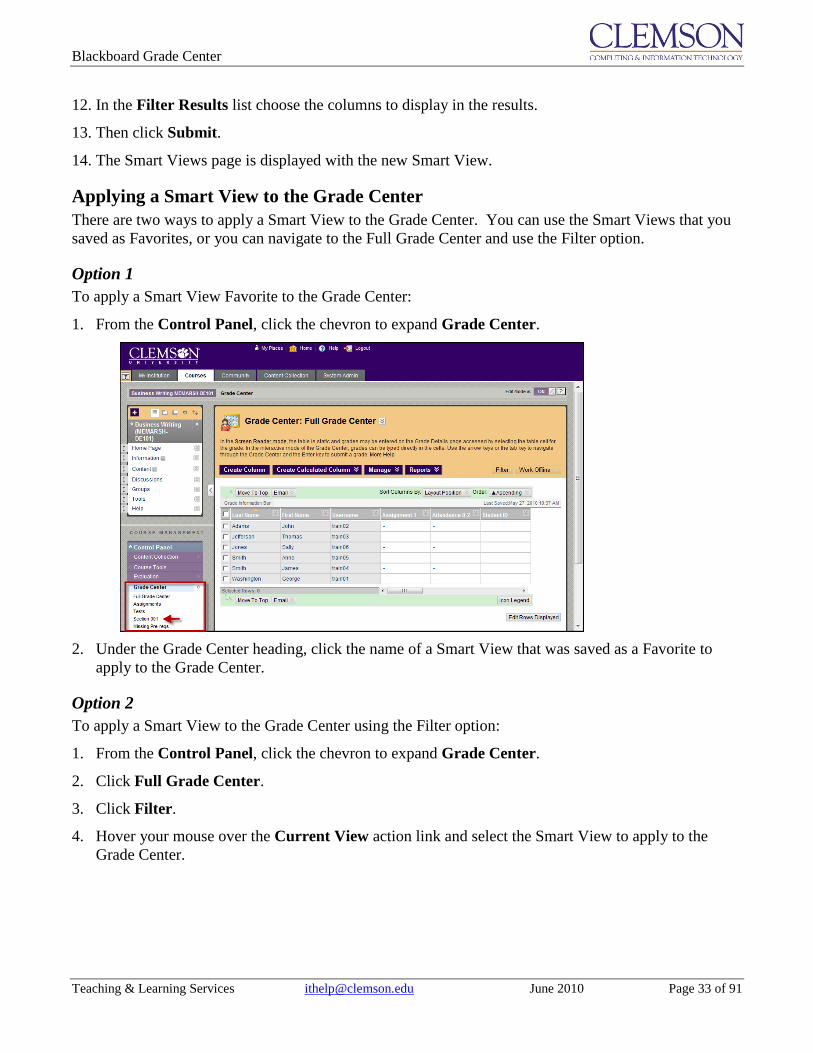
1. From the Control Panel, click the chevron to expand Grade Center.
2. Under the Grade Center heading, click the name of a Smart View that was saved as a Favorite to
apply to the Grade Center.
Option 2
To apply a Smart View to the Grade Center using the Filter option:
1. From the Control Panel, click the chevron to expand Grade Center.
2. Click Full Grade Center.
3. Click Filter.
4. Hover your mouse over the Current View action link and select the Smart View to apply to the
Grade Center.

Blackboard Grade Center
Teaching & Learning Services [email protected] June 2010 Page 34 of 91
5. The Grade Center will update to show only those columns and rows that meet the Smart View query
criteria.
6. The system will display the Smart View name in the page title.
7. Hover your mouse over the Current View action link and select Full Grade Center (Default) to
display all records in the Grade Center.

Blackboard Grade Center
Teaching & Learning Services [email protected] June 2010 Page 35 of 91
Column Organization
The Column Organization page allows you to configure the columns in the Grade Center display. The
Grade Center display can be customized to:
Freeze or unfreeze columns. If a column is frozen, when scrolling through the Grade Center
view, that column will remain stationary.
Hide or show columns
Edit the Categories of columns
Edit the Grading Periods of columns
Some of these technologies are also available through the drag-and-drop capabilities of the page.
To organize columns in the grade center:
1. Hover your mouse over the Manage action link and select Column Organization.
2. The Column Organization page is displayed.
Freezing/Unfreezing Columns
Grade Center columns can be frozen in place so they do not move while scrolling the other data. The
columns containing students’ first and last names are frozen by default. Frozen columns remain in
position on the left side of the Grade Center while the rest of the columns can be scrolled through.
To freeze or unfreeze a column in the Grade Center:
1. Hover your mouse over the Manage action link and select Column Organization.
2. The Column Organization page is displayed.
3. To freeze a column:
a. Click for the gray bar and drag it below the desired row.
b. Click for the row and drag it above the gray bar.
Blackboard Grade Center
Teaching & Learning Services [email protected] June 2010 Page 36 of 91
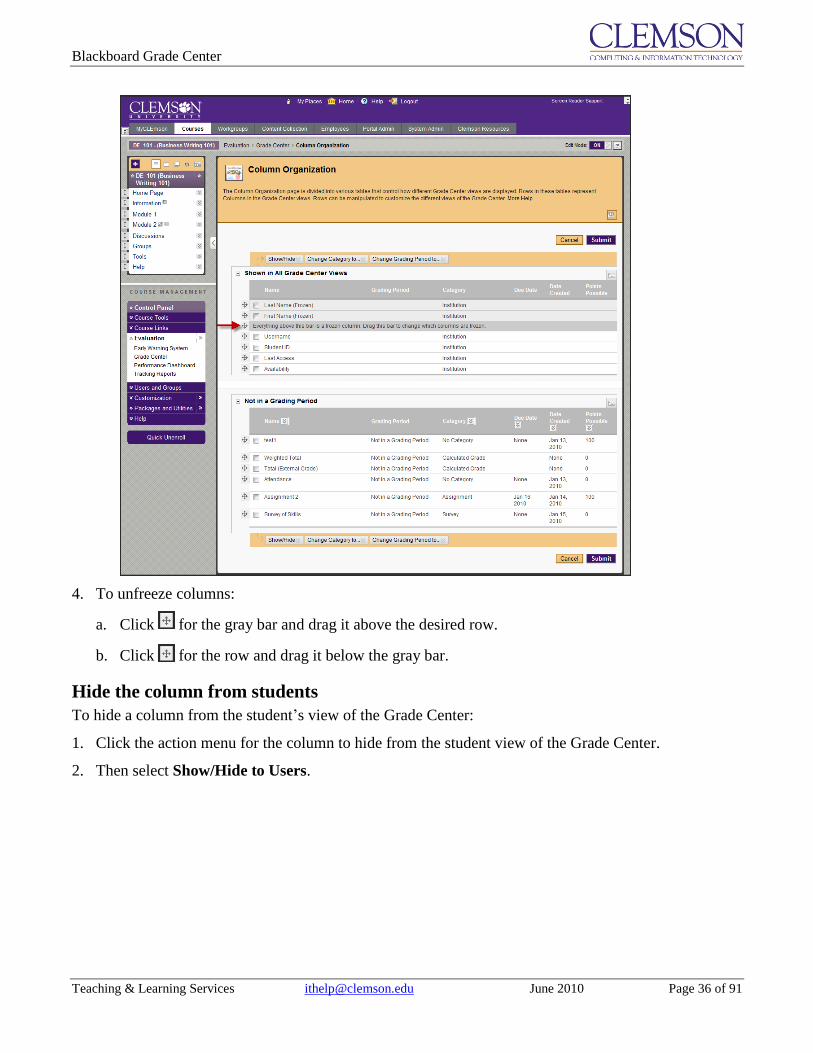
4. To unfreeze columns:
a. Click for the gray bar and drag it above the desired row.
b. Click for the row and drag it below the gray bar.
Hide the column from students
To hide a column from the student’s view of the Grade Center:
1. Click the action menu for the column to hide from the student view of the Grade Center.
2. Then select Show/Hide to Users.

Blackboard Grade Center
Teaching & Learning Services [email protected] June 2010 Page 37 of 91
3. The system disables the selected column from the student view of the Grade Center.
4. The system also puts the Column Not Visible to Users icon at the top of the column in the view that
Faculty see.
Hide the column from the Grade Center
To hide a column from the Grade Center:
1. Click the action menu for the column to hide from the Grade Center.
2. Then click Hide Column.
3. The Grade Center refreshes with the selected column removed.

Blackboard Grade Center
Teaching & Learning Services [email protected] June 2010 Page 38 of 91
Displaying a hidden column in the Grade Center
To display a column in the Grade Center that has been hidden:
1. Hover your mouse over the Manage action link and select Column Organization.
2. The Column Organization page is displayed.
3. The columns that are hidden can be identified by the italic text and the word (Hidden) after the
column Name.
4. Select the checkbox for the hidden column to display in the Grade Center.
5. Hover your mouse over the Show/Hide action link and select Show Selected Columns. The
Column Organization page automatically updates to show the column.
6. Then click Submit.
Moving or Re-arranging Columns in the Grade Center
To move or re-arrange columns in the Grade Center:
1. Hover your mouse over the Manage action link and select Column Organization.
2. The Column Organization page is displayed.

Blackboard Grade Center
Teaching & Learning Services [email protected] June 2010 Page 39 of 91
3. Click for the column to move.
4. Then drag the column up in the list to move it to the left in the Grade Center. Drag the column down
the list in order to move it to the right in the Grade Center.
5. Drop the column in its new location in the Grade Center.
Deleting Columns from the Grade Center
Note: You can only delete columns from the Grade Center that were created in the Grade Center.
If a column was automatically generated as part of an assignment, test, etc. The item associated
with the column has to be removed first before the column can be deleted from the Grade Center.
For example, if Assignment 1 is under the Module 1 link in the menu, Assignment 1 has to be
removed from Module 1 before you can delete the related column from the Grade Center.
Note: There are specific columns used by Blackboard Learn that cannot be removed from the
Grade Center. These columns include: First Name, Last Name, Username, Student ID, Last
Access, Availability, and Total. Some of these columns can be hidden if necessary.
To delete a column from the Grade Center:
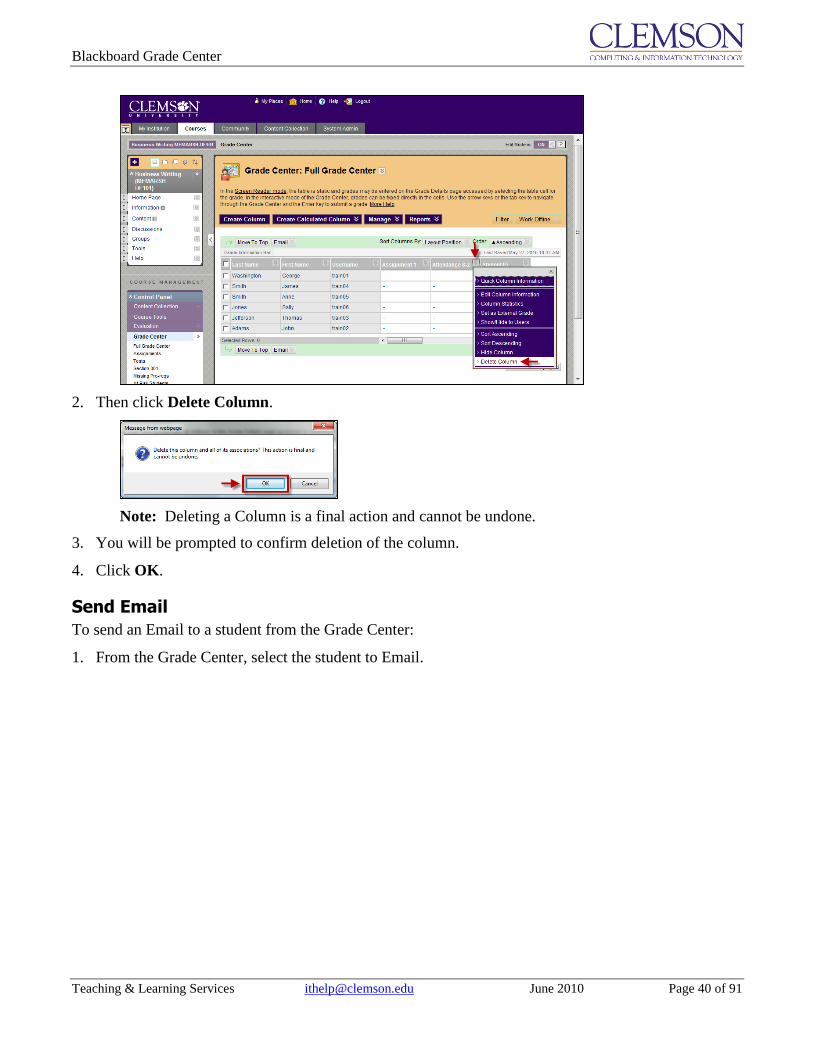
1. Click the action link for the Column to delete from the Grade Center.
Blackboard Grade Center
Teaching & Learning Services [email protected] June 2010 Page 40 of 91
2. Then click Delete Column.
Note: Deleting a Column is a final action and cannot be undone.
3. You will be prompted to confirm deletion of the column.
4. Click OK.
Send Email
To send an Email to a student from the Grade Center:
1. From the Grade Center, select the student to Email.

Blackboard Grade Center
Teaching & Learning Services [email protected] June 2010 Page 41 of 91
2. Then hover your mouse over the Email button.
3. Click Email Selected Users.
4. The Send Email page is displayed.
5. Enter a Subject for the Email message.
6. Then enter the Message.
7. Select Include list of recipients to add a list of the recipients to the email.

Blackboard Grade Center
Teaching & Learning Services [email protected] June 2010 Page 42 of 91
8. Click Attach a file then Browse and select the file to attach.
9. Click Submit.
Note: You can also click the action link at the end of the Last Name, First Name, Username,
StudentID, Last Access, and Availability columns for a specific student and select to Email
User.
Creating a Grade Center Column
Manually Creating a Grade Center Column
To manually create a Grade Center column:
1. Click Create Column.
2. The Create Grade Column page is displayed.

Blackboard Grade Center
Teaching & Learning Services [email protected] June 2010 Page 43 of 91
3. Enter a Column Name. This is a formal name, and is displayed in the Grade Center if no Grade
Center Display Name is entered. This field will accept 15 characters.
4. Enter the Grade Center Display Name. This appears as the column header in the Grade Center.
This field will accept 15 characters in the column header. The Grade Center is the only area where
this name is used.
5. Enter a Description of the column.
6. Select a Primary Display from the drop down menu. The default choice is Score. The format
chosen is the primary or only format displayed to Students.
a. Score – will display the grade as a score. Points Correct out of Points Available.
b. Text – will display the grade in alphanumeric format. An example may be Satisfactory or
Unsatisfactory. Text columns can contain non-graded information like a students home town,
their lab partner, or their preferred name. Text columns cannot be included in Calculated
Columns such as Weighted Grade, Total Points, Average Grade, and Minimum/Maximum
grades.
c. Percentage – will display the grade as a percentage. Points Correct divided by Points Available.
Note: Simply entering a Score for Grade Column that uses the Primary Display of Percentage
will not calculate Percentage. To calculate a Score’s Percentage select “Score” from the
Primary Display drop down menu and select “Percentage” from the Secondary Display drop
down menu.
d. Letter – will display a letter grade A, B, C, D, F based on the points or percentage values
defined in the Grading Schema.
e. Complete/Incomplete – will display the words Complete or Incomplete for the grade to indicate
whether the assignment has been completed.
f. Grading Schema – once grading schemas are created they will appear as an option in the
Primary and Secondary Display options.

Blackboard Grade Center
Teaching & Learning Services [email protected] June 2010 Page 44 of 91
7. Select a Secondary Display from the drop down menu. This selection displays the secondary
format for this Grade Item in the Grade Center in parenthesis.
8. Select a Category from the drop down menu. This associates the column to a Category.
Note: Default Categories are included in the Grade Center. User defined Categories must first
be created before they can be associated with a column.
Note: Categories classify Grade Center Columns and can be used to create Smart Views that
focus the view of Grade Center data or to create Calculated Columns.
9. Enter Points Possible. Denote the number of points assigned to this column. Non-numeric entries
are not accepted.
10. Select a Grading Period from the drop down menu. The Grading Period drop down menu will
only be displayed if Grading Periods have been defined.
Note: Columns that are assigned a Due Date are automatically associated with a Grading Period
if the Due Date falls within the date range of the Grading Period. This option to automatically
associate columns with a grading period is an option you can select when creating the Grading
Period.
11. The system added field Date Created, displays the date the Grade Item was created. This
information cannot be edited.
12. Enter a Due Date. Select from the following:
a. None – there will be no due date for the Grade Item.
b. Due On – specify the due date for the Grade Item, including month, day and year.

Blackboard Grade Center
Teaching & Learning Services [email protected] June 2010 Page 45 of 91
13. Set additional Options for the column by clicking Yes or No for the following:
a. Include this Column in Grade Center Calculations – the column is included in the possible
selections of items when creating Calculated Columns, such as Weight Grades Columns or Total
Point Columns.
b. Show this Column to Students – Grades will appear in My Grades, View Grades and the
Report Card module when available.
c. Show Statistics (average and median) to Students in My Grades – includes statistical
information with the grade value when shown to students.
14. Click Submit.
15. The new column is added to the far right side of the Grade Center. However, you can always change
the order of this column by hovering your mouse over the Manage action link and selecting Column
Organization
Creating Calculated Columns
In the Grade Center, you can calculate grades by combining multiple columns to attain performance
results, such as class averages, final grades that are based on a weighted scale, or total points, or to drop
the lowest quiz score, etc. These are called Calculated Columns. These columns, which display
performance results, can be displayed to students or remain accessible to only the Faculty member, TA,
and Grader. The possible Calculated Columns include the following:
Average Column
Minimum/Maximum Column
Total Column
Weighted Column

Blackboard Grade Center
Teaching & Learning Services [email protected] June 2010 Page 46 of 91
Creating an Average Column
An Average Column calculates and displays the numeric average for a selected number of Columns. An
example of an Average Column would be if a faculty member wanted to display the average for all
Tests, or display the average grade for each Student for a grading period. You also have the option of
dropping the lowest or highest score before the average is taken.
To create an Average Column:
1. Hover your mouse over the Create Calculated Column action link and select Average Column.
2. The Create Average Column page is displayed.
3. Enter a Column Name. This is a formal name, and is displayed in the Grade Center if no Grade
Center Display Name is entered. This field will accept 15 characters.
4. Enter the Grade Center Display Name. This appears as the column header in the Grade Center.
This field will accept 15 characters in the column header. The Grade Center is the only area where
this name is used.
5. Enter a Description for the Average Column.

Blackboard Grade Center
Teaching & Learning Services [email protected] June 2010 Page 47 of 91
6. Select a Primary Display from the drop down menu. The default choice is Score. The format
chosen is the primary or only format displayed to Students.
7. Select a Secondary Display from the drop down menu. This selection displays the secondary
format for this Grade Item in the Grade Center in parenthesis.
8. Use the drop down list to select a Grading Period. This selects all the columns associated with a
Grading Period. The Grading Period list will not display unless Grading Periods have been created.
9. Date Created is automatically populated based on the system date and time.
10. In the Select Columns area, click the radio button to select which Columns, Categories or Grading
Periods to include when calculating the Average Column. An Average Column can include the
following options:
All Grade Columns – Includes all Grade Columns in the average.
All Grade Columns in Grading Period – Includes All Grade Columns in a specific Grading
Period when generating the average.
Selected Columns and Categories – Includes specific columns or categories in the average.
Note: Columns and Categories that are not set to “Include in Grade Center Calculations” are
ignored when calculating the Average.

Blackboard Grade Center
Teaching & Learning Services [email protected] June 2010 Page 48 of 91
11. In the Columns to Select box, select the Columns to include in the calculation of the Average
Column.
12. Then click the right arrow button to move the columns to the Selected Columns area.
13. In the Categories to Select box, select the Categories of Columns to include in the calculation of the
Average Column.
14. Then click the right arrow button to move the columns in the selected categories to the Selected
Columns area.
15. To remove items from the Selected Columns area, click for the item to remove.
16. Click Yes for Calculate as Running Total to include only items that have grades or attempts in the
Running Total. Selecting No includes all items in the calculations, using a value of 0 for any item
that contains no grade.

Blackboard Grade Center
Teaching & Learning Services [email protected] June 2010 Page 49 of 91
17. Click No to Include this Column in Grade Center Calculations.
18. Click No if you do not want to Show this Column to Students.
19. Click Yes if you want to Show Statistics (average and median) for this column to Students in
My Grades.
20. Then click Submit.
21. The Grade Center is displayed with the new Calculated Column at far right.
Creating a Minimum/Maximum Column
A Minimum or Maximum Grade column displays either the minimum or maximum grade for a selection
of Columns. This column can be displayed to the Students or just the Faculty. For instance, Faculty
may choose to find the minimum scores of all the Tests from a Grading Period and display it only to the
Faculty.
To create a Minimum/Maximum Column:
1. Hover your mouse over the Create Calculated Column action link and select
Minimum/Maximum Column.
2. The Create Minimum/Maximum Column page is displayed.

Blackboard Grade Center
Teaching & Learning Services [email protected] June 2010 Page 50 of 91
3. Enter a Column Name. This is a formal name, and is displayed in the Grade Center if no Grade
Center Display Name is entered. This field will accept 15 characters.
4. Enter the Grade Center Display Name. This appears as the column header in the Grade Center.
This field will accept 15 characters in the column header. The Grade Center is the only area where
this name is used.
5. Enter a Description for the Minimum/Maximum Column.
6. Select a Primary Display from the drop down menu. The default choice is Score. The format
chosen is the primary or only format displayed to Students.
7. Select a Secondary Display from the drop down menu. This selection displays the secondary
format for this Grade Item in the Grade Center in parenthesis.
8. Use the drop down list to select a Grading Period. This selects all the columns associated with a
Grading Period. The Grading Period list will not display unless Grading Periods have been created.

Blackboard Grade Center
Teaching & Learning Services [email protected] June 2010 Page 51 of 91
9. Date Created is automatically populated based on the system date and time.
10. In the Select Columns area, select a radio button for the Calculation Type. This can be either
Minimum or Maximum.
11. Next, click the radio button to select which Columns, Categories or Grading Periods to include when
calculating the Minimum/Maximum Column. In creating a Minimum/Maximum Grade column, the
Faculty can select from the following:
All Grade Columns – Includes all Grade Columns in the minimum/maximum.
All Grade Columns in Grading Period – Includes All Grade Columns in a specific Grading
Period in the calculation of the minimum/maximum.
Selected Columns and Categories – Includes specific columns or categories in the
minimum/maximum.
Note: Columns and Categories that are not set to “Include in Grade Center Calculations” are
ignored when calculating the Minimum/Maximum.
12. In the Columns to Select box, select the Columns to include in the calculation of the
Minimum/Maximum Column.
13. Then click the right arrow button to move the columns to the Selected Columns area.
14. In the Categories to Select box, select the Categories of Columns to include in the calculation of the
Minimum/Maximum Column.
15. Then click the right arrow button to move the columns in the selected categories to the Selected
Columns area.
16. To remove items from the Selected Columns area, click for the item to remove.

Blackboard Grade Center
Teaching & Learning Services [email protected] June 2010 Page 52 of 91
17. Click Yes for Calculate as Running Total to include only items that have grades or attempts in the
Running Total. Selecting No includes all items in the calculations, using a value of 0 for any item
that contains no grade.
18. Click No to Include this Column in Grade Center Calculations.
19. Click No if you do not want to Show this Column to Students.
20. Click Yes if you want to Show Statistics (average and median) for this column to Students in
My Grades.
21. Then click Submit.
22. The Grade Center is displayed with the new Calculated Column at far right.

Blackboard Grade Center
Teaching & Learning Services [email protected] June 2010 Page 53 of 91
Creating a Total Column
A Grade Center Total Points column is a grade based on the cumulative points received, related to the
points allowed.
For example, Faculty may create a column to determine the final grade for the first quarter by creating a
Grade Center Total Points column that includes all of the columns in the first quarter Grading Period.
Alternatively, Faculty can create a Grade Center Total Points column that displays the percentages of a
particular Grade Center column, or a Category or Categories.
You also have the option of dropping the lowest or highest score before the average is taken.
To create a Total Column:
1. Hover your mouse over the Create Calculated Column action link and select Total Column.
2. The Create Total Column page is displayed.
3. Enter a Column Name. This is a formal name, and is displayed in the Grade Center if no Grade
Center Display Name is entered. This field will accept 15 characters.
4. Enter the Grade Center Display Name. This appears as the column header in the Grade Center.
This field will accept 15 characters in the column header. The Grade Center is the only area where
this name is used.
5. Enter a Description for the Total Column.

Blackboard Grade Center
Teaching & Learning Services [email protected] June 2010 Page 54 of 91
6. Select a Primary Display from the drop down menu. The default choice is Score. The format
chosen is the primary or only format displayed to Students.
7. Select a Secondary Display from the drop down menu. This selection displays the secondary
format for this Grade Item in the Grade Center in parenthesis.
8. Use the drop down list to select a Grading Period. This selects all the columns associated with a
Grading Period. The Grading Period list will not display unless Grading Periods have been created.
9. Date Created is automatically populated based on the system date and time.
10. Click the radio button to select which Columns, Categories or Grading Periods to include when
calculating the Total Column. In creating a Total column, the Faculty can select from the following:
All Grade Columns – Includes all Grade Columns in the total.
All Grade Columns in Grading Period – Includes All Grade Columns in a specific Grading
Period in the calculation of the total.
Selected Columns and Categories – Includes specific columns or categories in the total.
Note: Columns and Categories that are not set to “Include in Grade Center Calculations” are
ignored when calculating the Total.

Blackboard Grade Center
Teaching & Learning Services [email protected] June 2010 Page 55 of 91
11. In the Columns to Select box, select the Columns to include in the calculation of the Total Column.
12. Then click the right arrow button to move the columns to the Selected Columns area.
13. In the Categories to Select box, select the Categories of Columns to include in the calculation of the
Total Column.
14. Then click the right arrow button to move the columns in the selected categories to the Selected
Columns area.
15. If you choose a category to include in the Total Column, additional options will be available in the
Selected Columns area.
a. Select a Grading Period for the Category is only available when Grading Periods have been
created.
b. Drop Grades removes a number of either the highest or lowest grades for the Category from the
calculation.
c. Use Only the Lowest or Highest Value to Calculate removes all grades from the calculation
except for the best or worst score.
16. To remove items from the Selected Columns area, click for the item to remove.

Blackboard Grade Center
Teaching & Learning Services [email protected] June 2010 Page 56 of 91
17. Click Yes for Calculate as Running Total to include only items that have grades or attempts in the
Running Total. Selecting No includes all items in the calculations, using a value of 0 for an item if
there is no grade.
18. Click Yes to Include this Column in Grade Center Calculations.
19. Click Yes if you want to Show this Column to Students.
20. Click No if you do not want to Show Statistics (average and median) for this column to Students
in My Grades.
21. Then click Submit.
22. The Grade Center is displayed with the new Total Column at far right.

Blackboard Grade Center
Teaching & Learning Services [email protected] June 2010 Page 57 of 91
Creating a Weighted Column
Most faculty identify in their syllabus for students the categories that their overall grade will be
composed of. Students might see something similar to this:
Quizzes: 20%
Exams: 50%
Attendance: 5%
Group Projects: 15%
Assignments: 10%
These are the weights assigned to specific categories. In Blackboard Learn you can create not only
categories to assign to items in the Grade Center. You can also use these categories to create weighted
columns and weighted totals.
For example, Faculty may create a Weighted Grade column that calculates a quarterly grade (grade for
one quarter of the year), in which each Category, such as Test, Survey, and Assignment are given a
certain percentage of the final quarter's grade. Alternatively, the Faculty may create a Weighted Grade
that is the final grade for a course, with the quarters and exams included in the Weighted Grade.
Faculty can create any number of Weighted Grade columns, including Weighted Grade columns that
include other Weighted Grade columns. For example
(Quiz = 20%) + (Homework = 10%) + (Participation = 20%) + (Exam = 50%) = (Quarter Grade)
(Quarter 1 = 25%) + (Quarter 2 = 25%) + (Quarter 3 = 25%) + (Quarter 4 = 25%) = (Year Grade)
Faculty can create a Weighted Grade based on any column, or any Category in the Grade Center.
Blackboard Grade Center
Teaching & Learning Services [email protected] June 2010 Page 58 of 91
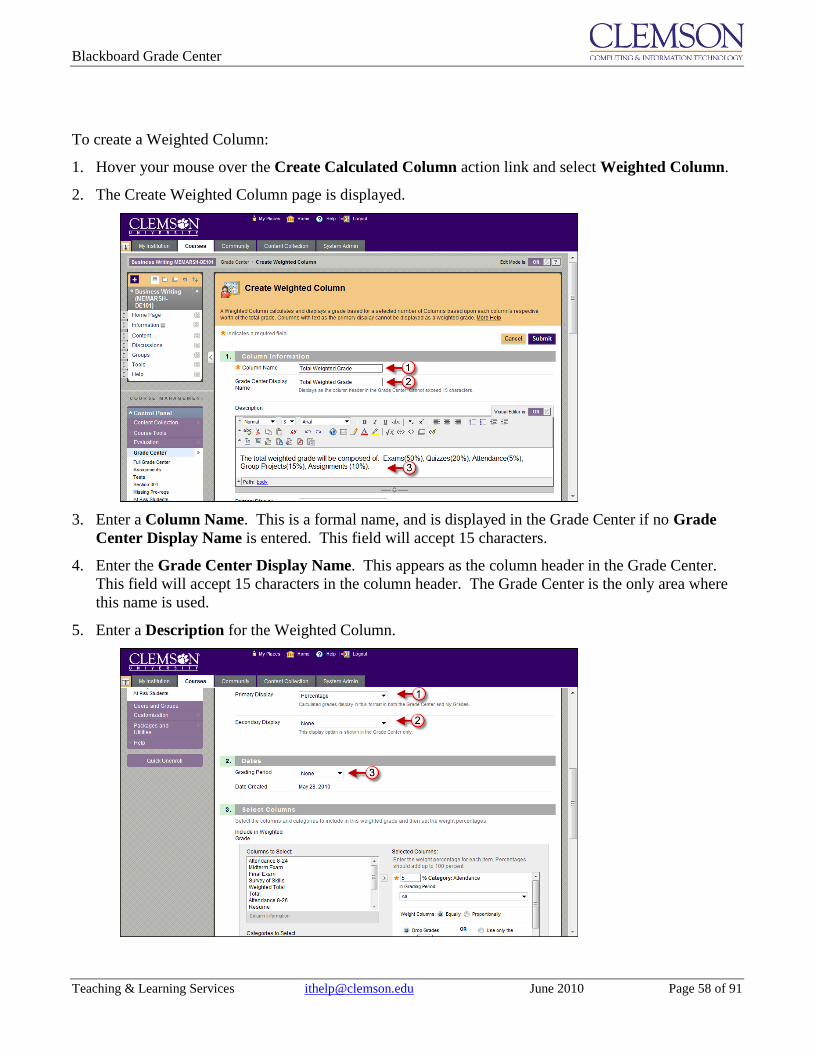
To create a Weighted Column:
1. Hover your mouse over the Create Calculated Column action link and select Weighted Column.
2. The Create Weighted Column page is displayed.
3. Enter a Column Name. This is a formal name, and is displayed in the Grade Center if no Grade
Center Display Name is entered. This field will accept 15 characters.
4. Enter the Grade Center Display Name. This appears as the column header in the Grade Center.
This field will accept 15 characters in the column header. The Grade Center is the only area where
this name is used.
5. Enter a Description for the Weighted Column.

Blackboard Grade Center
Teaching & Learning Services [email protected] June 2010 Page 59 of 91
6. Select a Primary Display from the drop down menu. The default choice is Score. The format
chosen is the primary or only format displayed to Students.
7. Select a Secondary Display from the drop down menu. This selection displays the secondary
format for this Grade Item in the Grade Center in parenthesis.
8. Use the drop down list to select a Grading Period. This selects all the columns associated with a
Grading Period. The Grading Period list will not display unless Grading Periods have been created.
9. Date Created is automatically populated based on the system date and time.
Note: In Blackboard Learn Weighted Columns can consist of a combination of both Columns
and Categories. You do not have to choose one or the other.
10. In the Columns to Select box, select the Columns to include in the calculation of the Weighted
Column.
11. Then click the right arrow button to move the columns to the Selected Columns area.
12. In the Categories to Select box, select the Categories of Columns to include in the calculation of the
Weighted Column.
13. Then click the right arrow button to move the columns in the selected categories to the Selected
Columns area.
14. To remove items from the Selected Columns area, click for the item to remove.
15. Enter a percentage that reflects the weight for each selected Column.
16. If you chose categories, select how to Weight Columns within the Category:
a. Equally applies equal value to all columns within a Category.
b. Proportionally values each Column based on its points possible compared to other Columns in
the Category. Choose this option when you have assignments within a given category that have
different point values.

Blackboard Grade Center
Teaching & Learning Services [email protected] June 2010 Page 60 of 91
17. Drop Grades removes a number of either the highest or lowest grades for the Category from the
calculation.
18. Use Only the Lowest or Highest Value to Calculate removes all grades from the calculation
except for the best or worst score.
19. The percentages of all Columns and Categories together should add up to 100 percent (or more).
20. Click Yes for Calculate as Running Total to include only items that have grades or attempts in the
Running Total. Selecting No includes all items in the calculations, using a value of 0 for an item if
there is no grade.
Note: The Calculate as Running Total can affect the Grade Distribution on the Column
Statistics report.
21. Click Yes to Include this Column in Grade Center Calculations.
22. Click Yes if you want to Show this Column to Students.
23. Click No if you do not want to Show Statistics (average and median) for this column to Students
in My Grades.
24. Then click Submit.

Blackboard Grade Center
Teaching & Learning Services [email protected] June 2010 Page 61 of 91
25. The Grade Center is displayed with the new Weighted Column at far right.
Creating a Text Column
A Text Column will display in the grade in alphanumeric format. An example may be Satisfactory or
Unsatisfactory. Text Columns can contain non-graded information like a student’s home town, their lab
partner, or their preferred name. Text Columns cannot be included in Calculated Columns such as
Weighted Grade, Total Points, Average Grade, and Minimum/Maximum grades.
To create a Text Column:
1. Click Create Column.
2. The Create Grade Column page is displayed.

Blackboard Grade Center
Teaching & Learning Services [email protected] June 2010 Page 62 of 91
3. Enter a Column Name. This is a formal name, and is displayed in the Grade Center if no Grade
Center Display Name is entered. This field will accept 15 characters.
4. Enter the Grade Center Display Name. This appears as the column header in the Grade Center.
This field will accept 15 characters in the column header. The Grade Center is the only area where
this name is used.
5. Enter a Description for the column.
6. Select Text from the Primary Display drop down menu.
7. Enter 0 for the Points Possible.
8. Click None for Due Date.

Blackboard Grade Center
Teaching & Learning Services [email protected] June 2010 Page 63 of 91
9. Set additional Options for the column by clicking Yes or No for the following:
a. Include this Column in Grade Center Calculations – the column is included in the possible
selections of items when creating Calculated Columns, such as Weight Grades Columns or Total
Point Columns.
b. Show this Column to Students – Grades will appear in My Grades, View Grades and the
Report Card module when available.
c. Show Statistics (average and median) to Students in My Grades – includes statistical
information with the grade value when shown to students.
10. Click Submit.
11. The new column is added to the far right side of the Grade Center. However, you can always change
the order of this column by clicking Manage and selecting Column Organization.

Blackboard Grade Center
Teaching & Learning Services [email protected] June 2010 Page 64 of 91
Reports
Column Statistics and Grade Distribution
To view the Column Statistics and Grade Distribution:
1. Click the action link for the selected column.
2. Then select Column Statistics.
3. The Column Statistics page is displayed. The Column Statistics page displays numerous statistics
for a Grade Item, including average, median, standard deviation, and so on.
4. View Column Statistics for a different column by clicking the arrows for Previous Column or Next
Column.

Blackboard Grade Center
Teaching & Learning Services [email protected] June 2010 Page 65 of 91
5. Alternately, you can select a column name from the Jump to Column drop down menu. Then click
Go.
6. Click OK to return to the Grade Center.
Viewing Statistics by Student
To view the Statistics by Student:
1. Hover your mouse over the First Name, Last Name, Student ID or Username of the student for
which you want to view statistics.
2. Then click the Action link to view the contextual menu.
3. Click View User Statistics.

Blackboard Grade Center
Teaching & Learning Services [email protected] June 2010 Page 66 of 91
4. The Student Statistics page is displayed. The Student Statistics page displays a Student’s statistics in
the Categories.
5. View Student Statistics for a different column by clicking the arrows for Previous User or Next
User.
6. Alternately, you can select a Student Name from the Jump to User drop down menu. Then click
Go.
7. Click OK to return to the Grade Center.
Create a Report
Faculty can create printable Reports for their Courses and Students. For example a Faculty member can
create a Report, like a progress report, that contains all of the grades from a particular marking period
for a defined group of Students in a class, such as special-needs students or transfer students. This
Report can then be printed, and handed out to each Student, Parent, or Guardian.
Reports can display all or a number of Students, Groups; and Grade Columns or Calculated Columns, a
Grading Period, or all of the columns in a Category.
Reports can be customized in a variety of ways, including Report header and footer information. Reports
can also include a signature line, date, Course Information, and so on.
Reports print one Student per page.
To create a report:
1. Hover your mouse over the Reports action link and select Create Report.
Blackboard Grade Center
Teaching & Learning Services [email protected] June 2010 Page 67 of 91
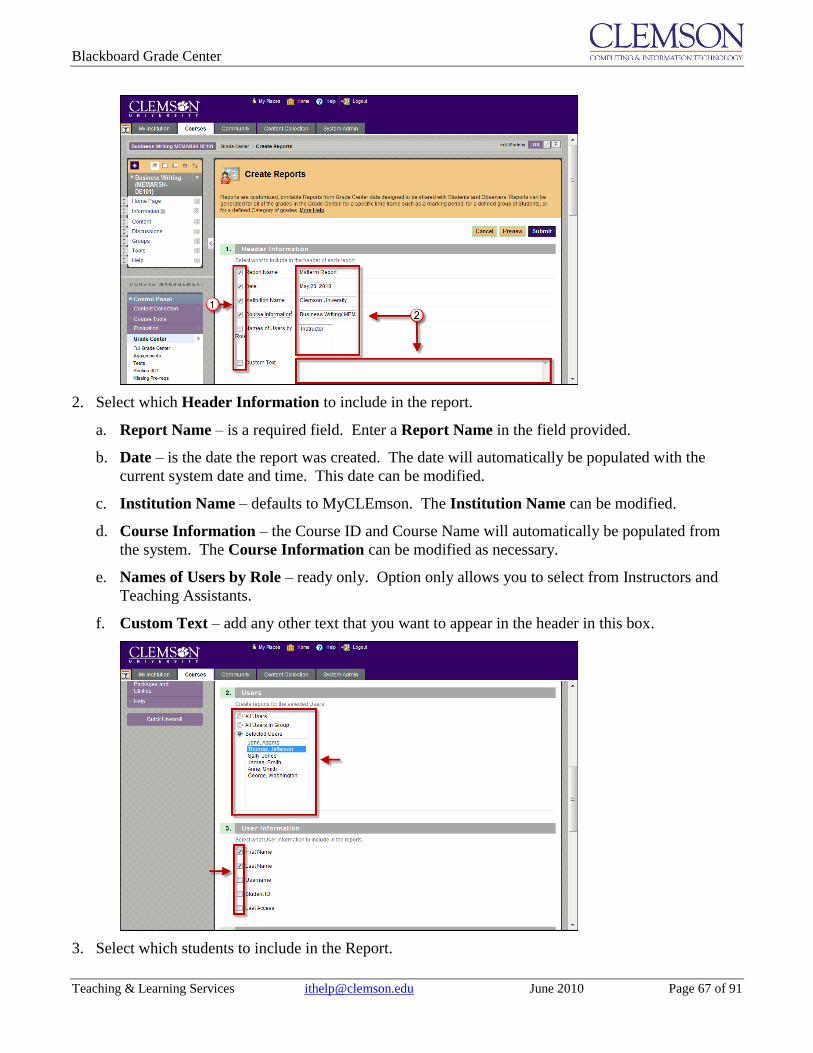
2. Select which Header Information to include in the report.
a. Report Name – is a required field. Enter a Report Name in the field provided.
b. Date – is the date the report was created. The date will automatically be populated with the
current system date and time. This date can be modified.
c. Institution Name – defaults to MyCLEmson. The Institution Name can be modified.
d. Course Information – the Course ID and Course Name will automatically be populated from
the system. The Course Information can be modified as necessary.
e. Names of Users by Role – ready only. Option only allows you to select from Instructors and
Teaching Assistants.
f. Custom Text – add any other text that you want to appear in the header in this box.
3. Select which students to include in the Report.

Blackboard Grade Center
Teaching & Learning Services [email protected] June 2010 Page 68 of 91
a. All Users – includes all Users enrolled in the class.
b. All Users in Group – allows you to select specific Groups of users to include in the report.
Control + Click or Shift + Click to select multiple Groups.
c. Selected Users – allows you to select specific Users to include in the report. Control + Click or
Shift + Click to select multiple Users.
4. Select the User Information to include in the report.
5. Select the Columns to include in the report.
a. All Columns – includes all Columns in the Grade Center in the report.
b. All Columns in Grading Period – includes all Columns in a selected Grading Period(s).
Control + Click or Shift + Click to select multiple Grading Periods.
c. All Columns in Category – includes all Columns in selected Categories. Control + Click or
Shift + Click to select multiple Categories.
d. Selected Columns – allows you to select specific columns to include in the report. Control +
Click or Shift + Click to select multiple Columns.

Blackboard Grade Center
Teaching & Learning Services [email protected] June 2010 Page 69 of 91
6. Select the Column Information to include in the report. Name and Grade are included by default.
a. Description – includes the Column Description in the report.
b. Due Date – includes the Column Due Date in the report.
c. Statistics – allows you to include the Average, the Median, or the Median and Average in the
report.
7. Select the Footer Information to include in the report.
a. Custom Text – add any other text that you want to appear in the footer in this box.
b. Signature Line – adds a line for a signature to the report.
c. Date – is the date the report was created. The date will automatically be populated with the
current system date and time. This date can be modified.
d. Course Information – the Course ID and Course Name will automatically be populated from
the system. The Course Information can be modified as necessary.
8. Click Submit.
Blackboard Grade Center
Teaching & Learning Services [email protected] June 2010 Page 70 of 91
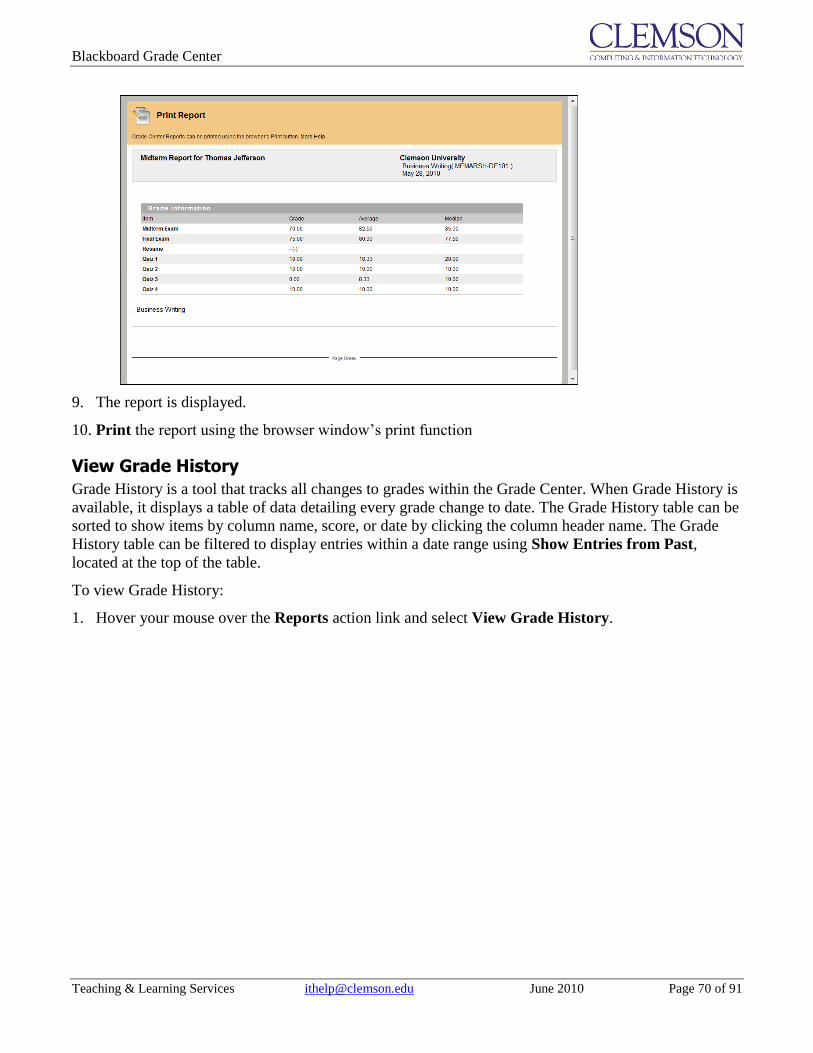
9. The report is displayed.
10. Print the report using the browser window’s print function
View Grade History
Grade History is a tool that tracks all changes to grades within the Grade Center. When Grade History is
available, it displays a table of data detailing every grade change to date. The Grade History table can be
sorted to show items by column name, score, or date by clicking the column header name. The Grade
History table can be filtered to display entries within a date range using Show Entries from Past,
located at the top of the table.
To view Grade History:
1. Hover your mouse over the Reports action link and select View Grade History.

Blackboard Grade Center
Teaching & Learning Services [email protected] June 2010 Page 71 of 91
2. The Grade History page is displayed.
3. From the Grade History page you can view the history of all changes that have been made to the
Grade Center.
4. Filter the Grade History page by clicking the Show Entries from Past drop down menu and
selecting a date range. Then click Go.
5. To clear the Grade History at the end of the semester, click Clear Grade History. A pop-up
message will confirm that you want to Clear Grade History, and warn you that this action is final and
cannot be undone.
Download Grade History
To Download Grade History:
1. Hover your mouse over the Reports action link and select View Grade History.

Blackboard Grade Center
Teaching & Learning Services [email protected] June 2010 Page 72 of 91
2. The Grade History page is displayed.
3. Click Download.
4. The Download Grade History page is displayed.
5. Select the Delimiter Type.
6. Select whether to Include Comments.
7. Then click Submit.
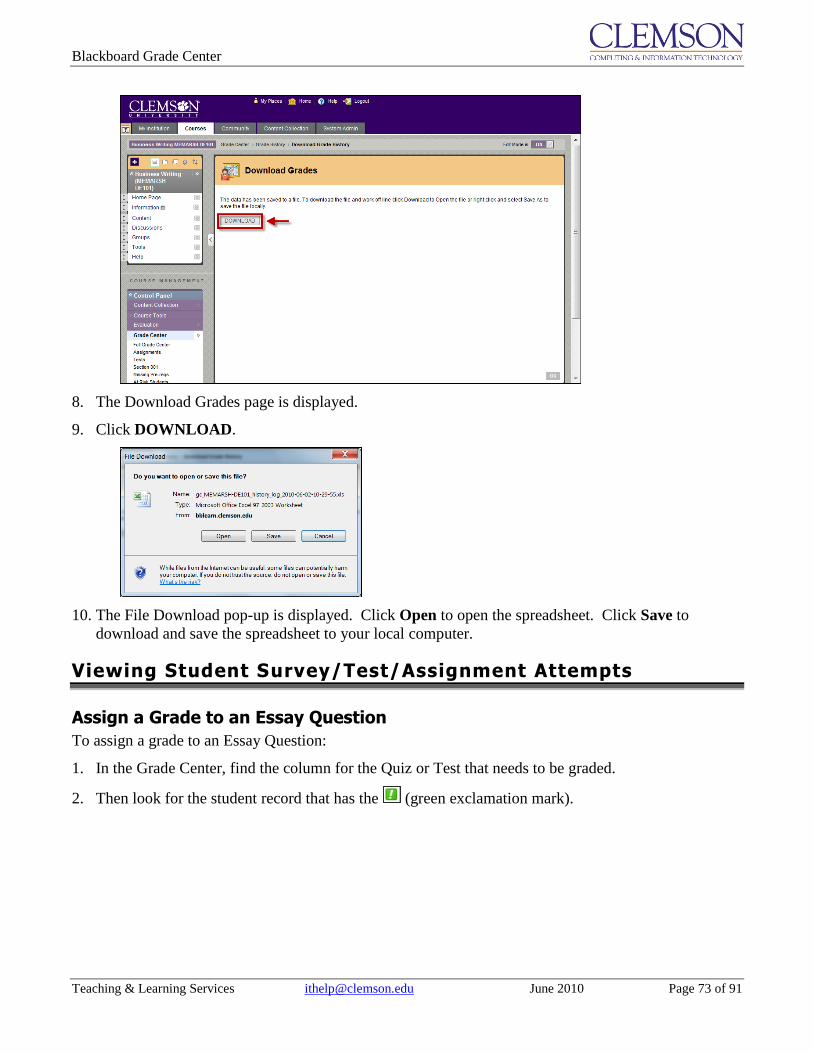
Blackboard Grade Center
Teaching & Learning Services [email protected] June 2010 Page 73 of 91
8. The Download Grades page is displayed.
9. Click DOWNLOAD.
10. The File Download pop-up is displayed. Click Open to open the spreadsheet. Click Save to
download and save the spreadsheet to your local computer.
Viewing Student Survey/Test/Assignment Attempts
Assign a Grade to an Essay Question
To assign a grade to an Essay Question:
1. In the Grade Center, find the column for the Quiz or Test that needs to be graded.
2. Then look for the student record that has the (green exclamation mark).

Blackboard Grade Center
Teaching & Learning Services [email protected] June 2010 Page 74 of 91
3. Click the action link to the right of the (green exclamation mark) and select View Grade Details.
4. Select the Attempt to grade.
5. The Grade Test page is displayed.

Blackboard Grade Center
Teaching & Learning Services [email protected] June 2010 Page 75 of 91
6. Enter a Score for each Essay question.
7. Enter your Response Feedback.
8. Then click Save and Exit to save the updated test and return to the Grade Center.
Entering Grades manually in the Grade Center
On occasion faculty may have assignments that require grading outside of Blackboard. So instead of
creating an assignment in the course, they just create a column in the Grade Center and enter the score or
grade for that assignment. For example, in a class on campus, they may give pop quizzes or take
attendance. The scores for these items are entered manually as they were not created in an electronic
format in Blackboard.
To enter grades manually in the Grade Center:
1. In the Grade Center, find the column that requires manual grading.

Blackboard Grade Center
Teaching & Learning Services [email protected] June 2010 Page 76 of 91
2. Click one of the cells in the column.
3. Then enter the Grade or Score and press Enter.
4. When you press Enter the cursor will automatically navigate to the next cell, if the cell is empty.
5. Otherwise, you will have to use the up or down arrow key on the keyboard or your mouse to select
the previous or next cell.
Changing a Grade
There are two ways to change a Grade. The first is to simply click on the cell in the Grade Center, enter
a new grade and then press Enter. The second is to use the Edit Grade option on the Grade Details
page.
To change a Grade from the Grade Details page:
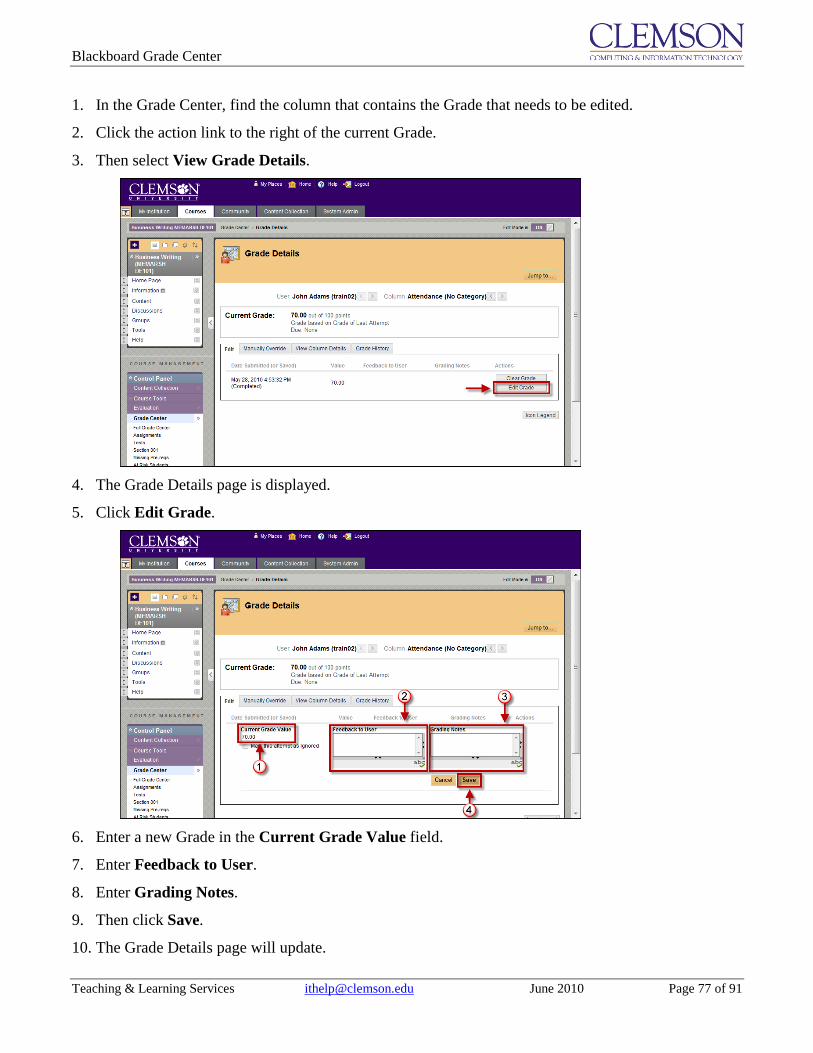
Blackboard Grade Center
Teaching & Learning Services [email protected] June 2010 Page 77 of 91
1. In the Grade Center, find the column that contains the Grade that needs to be edited.
2. Click the action link to the right of the current Grade.
3. Then select View Grade Details.
4. The Grade Details page is displayed.
5. Click Edit Grade.
6. Enter a new Grade in the Current Grade Value field.
7. Enter Feedback to User.
8. Enter Grading Notes.
9. Then click Save.
10. The Grade Details page will update.

Blackboard Grade Center
Teaching & Learning Services [email protected] June 2010 Page 78 of 91
11. Click Return to Grade Center to return to the Grade Center.
Overriding a Grade
There are two ways to override a grade. The first is to simply click on the cell in the Grade Center that
already contains a Grade. Then enter a new grade and press Enter. The second is to use the Override
option on the Grade Details page.
To override a grade from the Grade Details page:
1. In the Grade Center, find the column that contains the Grade that needs to be edited.
2. Click the action link to the right of the current Grade.
3. Then select View Grade Details.
4. The Grade Details page is displayed.
5. Click the Manually Override tab.

Blackboard Grade Center
Teaching & Learning Services [email protected] June 2010 Page 79 of 91
6. Enter a new Grade in the Override Grade field.
7. Enter Feedback to User.
8. Enter Grading Notes.
9. Then click Save.
10. The Grade Details page will update.
11. Click Return to Grade Center to return to the Grade Center.

Blackboard Grade Center
Teaching & Learning Services [email protected] June 2010 Page 80 of 91
Reverting a Grade
To revert a Grade that has been overwritten to the previous Grade:
1. In the Grade Center, find the column that contains the Grade that needs to be edited.
2. Click the action link to the right of the current Grade.
3. Then select View Grade Details.
4. The Grade Details page is displayed.
5. In the Current Grade area click Revert.
6. The system will display a pop-up window to verify that you want to revert the Grade.
7. Click Ok.

Blackboard Grade Center
Teaching & Learning Services [email protected] June 2010 Page 81 of 91
8. The Grade Details page will refresh showing the original grade.
Exempting a Grade
Faculty can exempt students from any grade item in the Grade Center to take into consideration students
that transfer, add a course late, drop a course, or require other accommodations. Exempted items are not
added into any statistical or total grade calculations.
Existing grades that have been exempted are not deleted but are ignored in all total and statistical
calculations. No secondary display value is shown for items that are Exempting.
Exemptions entered for system-generated column are saved as the Override grade. Exemptions entered
for manually created columns are saved as the grade for the column when no Override grade exists.
Students can be exempted from a grade from the Grade Center or the Grade Details page. Exempted
grades display an Exempted icon in the cell. Comments can be added to any exempted grade.
There are two ways to exempt a grade. The first is to simply click on the cell in the Grade Center that
already contains a Grade. Then click the action link to the right of the current Grade and select Exempt
Grade. The second is to use the Exempt option on the Grade Details page.
To exempt a grade from the Grade Details page:
1. In the Grade Center, find the column that contains the Grade that needs to be exempted.
2. Click the action link to the right of the current Grade.
3. Then select View Grade Details.
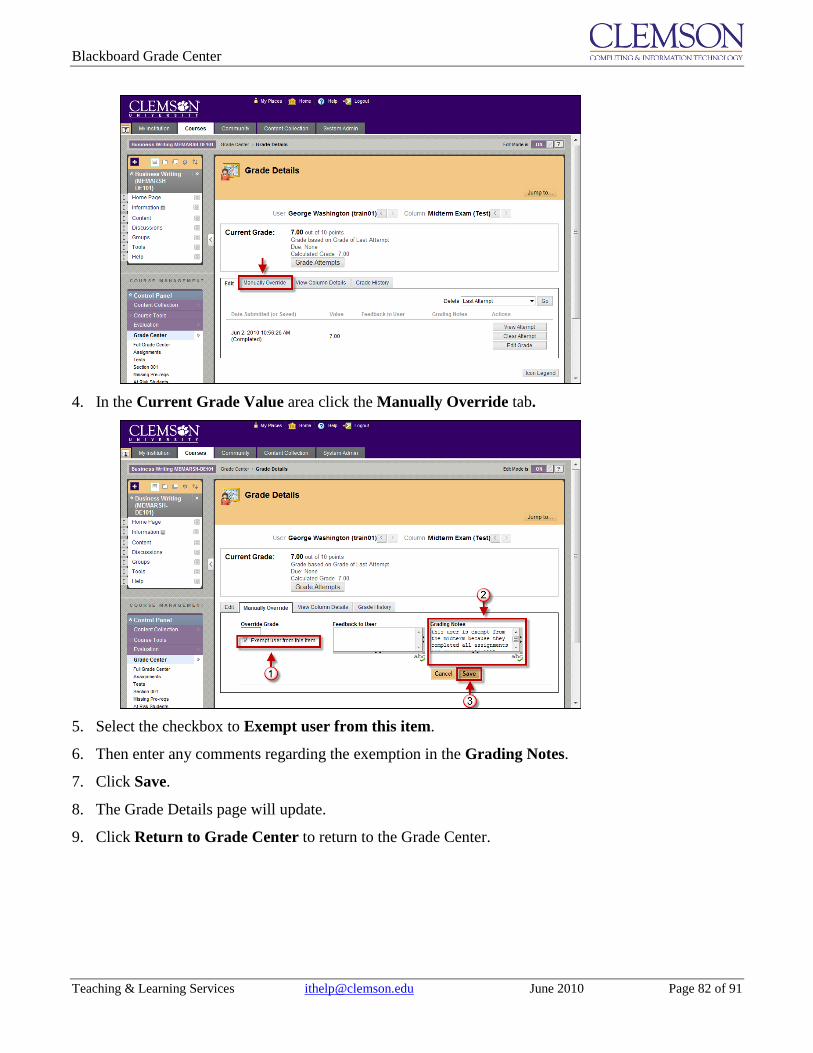
Blackboard Grade Center
Teaching & Learning Services [email protected] June 2010 Page 82 of 91
4. In the Current Grade Value area click the Manually Override tab.
5. Select the checkbox to Exempt user from this item.
6. Then enter any comments regarding the exemption in the Grading Notes.
7. Click Save.
8. The Grade Details page will update.
9. Click Return to Grade Center to return to the Grade Center.

Blackboard Grade Center
Teaching & Learning Services [email protected] June 2010 Page 83 of 91
10. The cell in the Grade Center will now contain a (blue crosshatch square). This is the icon to
indicate that this grade is exempt.
11. To clear and exemption, click on the action link to the right of the (blue crosshatch square).
Then select Clear Exemption.
Grading Student Assignments
To grade a student assignment:
1. In the Grade Center, find the column for the Assignment that needs to be graded.
2. Then look for the student record that has the (green exclamation mark).
3. Click the action link to the right of the (green exclamation mark) and select View Grade Details.

Blackboard Grade Center
Teaching & Learning Services [email protected] June 2010 Page 84 of 91
4. Select the Attempt to grade.
5. The Grade Assignment page is displayed.
6. In the Review Current Attempt area, click the links for the Attached Files to download the
document submitted for the selected assignment.
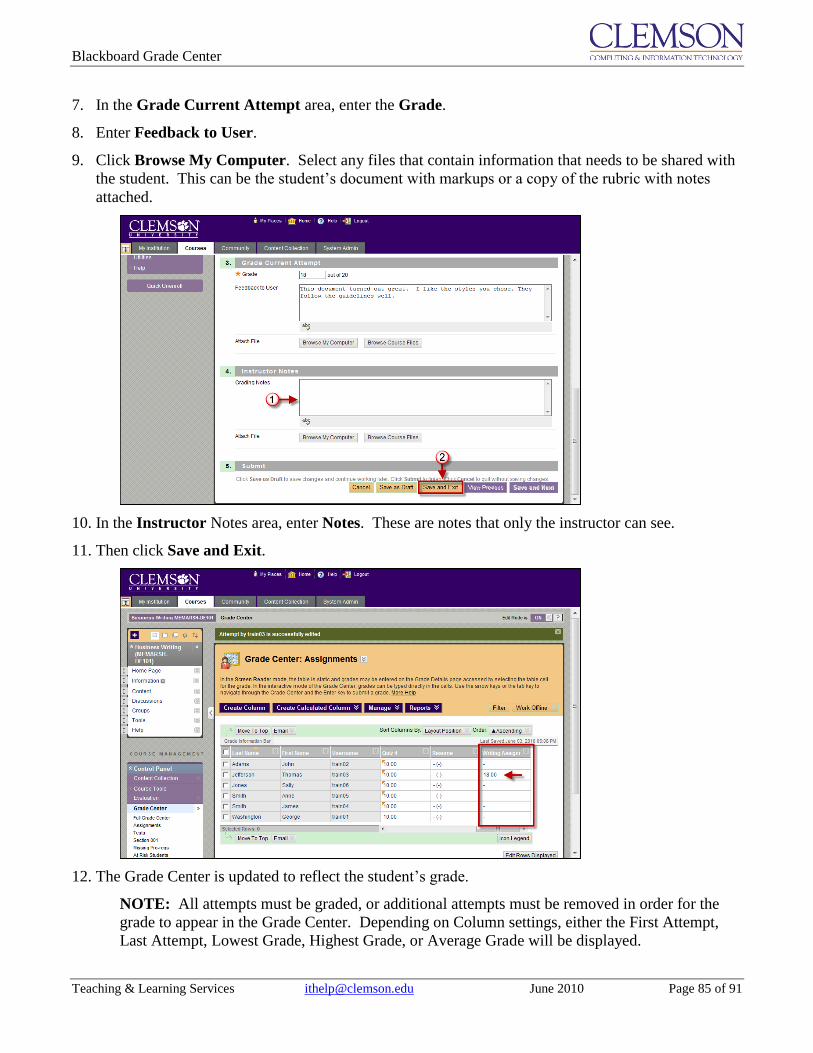
Blackboard Grade Center
Teaching & Learning Services [email protected] June 2010 Page 85 of 91
7. In the Grade Current Attempt area, enter the Grade.
8. Enter Feedback to User.
9. Click Browse My Computer. Select any files that contain information that needs to be shared with
the student. This can be the student’s document with markups or a copy of the rubric with notes
attached.
10. In the Instructor Notes area, enter Notes. These are notes that only the instructor can see.
11. Then click Save and Exit.
12. The Grade Center is updated to reflect the student’s grade.
NOTE: All attempts must be graded, or additional attempts must be removed in order for the
grade to appear in the Grade Center. Depending on Column settings, either the First Attempt,
Last Attempt, Lowest Grade, Highest Grade, or Average Grade will be displayed.

Blackboard Grade Center
Teaching & Learning Services [email protected] June 2010 Page 87 of 91
Clearing Survey/Test/Assignment Attempts
Clear Attempts for all Users
To clear attempts for all users:
1. In the Grade Center, find the column for which to clear attempts for all users.
2. Click the action link to the right of the column name.
3. Select Clear Attempts for All Users.
4. Select whether to clear a specific attempt or to clear attempts by a date range.
a. Click the first radio button. Then select the attempt to remove or clear from the available drop
down list.
Last Attempt – will remove the score for the last scored submission.
First Attempt – will remove the score for the first scored submission.
Lowest Scored Attempt – will remove the score for the lowest scored attempt.

Blackboard Grade Center
Teaching & Learning Services [email protected] June 2010 Page 88 of 91
Highest Scored Attempt – will remove the score for the highest scored attempt.
All Attempts – will remove all submitted and scored attempts.
b. Click Attempts Between Dates. Then select a Start Date and an End Date. All attempts
submitted or scored during the selected date range will be removed.
5. Then click Submit.
6. The system will display a pop-up window to verify that you want to continue. The actions are final
and cannot be undone.
7. Click OK.
8. The Grade Center updates and displays the updated column.
Clearing a Student Attempt
To clear a specific Student Attempt:
1. In the Grade Center, find the column for the attempt that needs to be cleared. This could be for an
assignment or a quiz or test.
2. Then look for the student record.
3. Click the action link to the right of the students score, or the (green exclamation mark).
4. Select View Grade Details.
5. The Grade Details page is displayed.
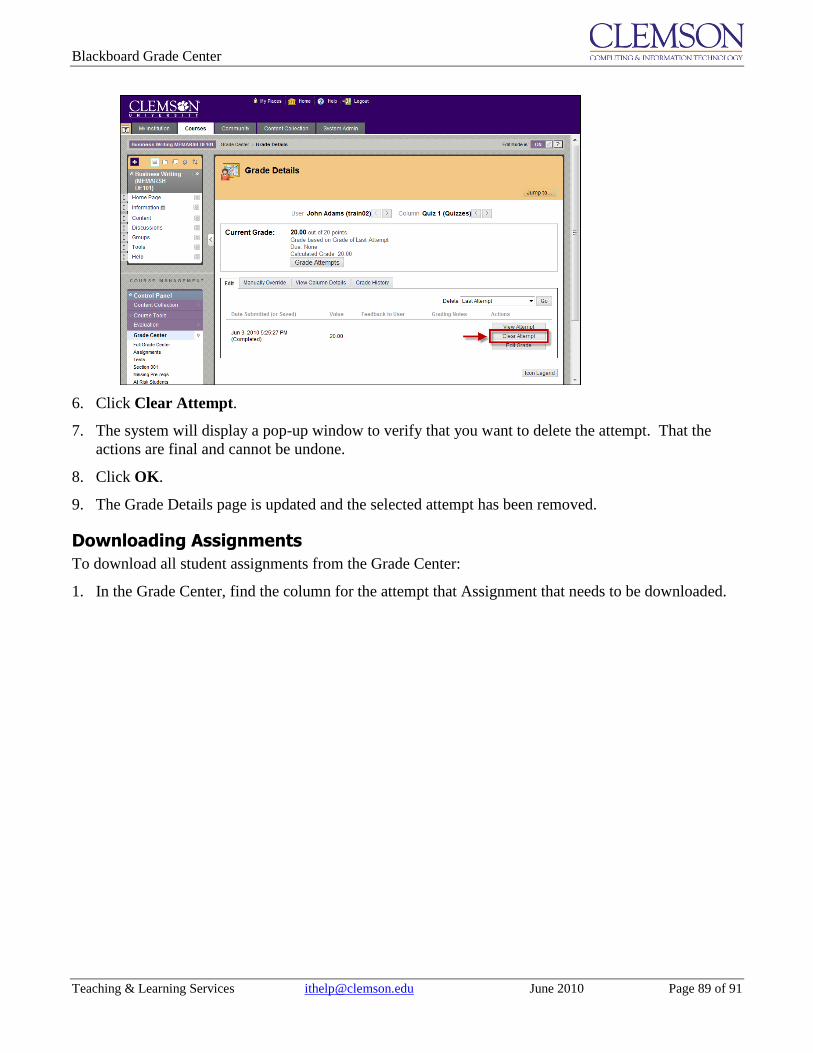
Blackboard Grade Center
Teaching & Learning Services [email protected] June 2010 Page 89 of 91
6. Click Clear Attempt.
7. The system will display a pop-up window to verify that you want to delete the attempt. That the
actions are final and cannot be undone.
8. Click OK.
9. The Grade Details page is updated and the selected attempt has been removed.
Downloading Assignments
To download all student assignments from the Grade Center:
1. In the Grade Center, find the column for the attempt that Assignment that needs to be downloaded.

Blackboard Grade Center
Teaching & Learning Services [email protected] June 2010 Page 90 of 91
2. Click the action link to the right of the column name.
3. Select Assignment File Download.
4. The Download Assignment page is displayed.
5. Select the user’s assignments that should be included in the download.
6. Then click Submit.

Blackboard Grade Center
Teaching & Learning Services [email protected] June 2010 Page 91 of 91
7. Click the Download assignments now link.
Note: Each students submission included in the .ZIP file automatically includes the following
items in the filename: The assignment name, the username of the person who submitted the
assignment, and the original filename of the file the student attached. If students also added
comments, you will also find a related txt file that contains those comments.
8. The file is a .ZIP file. You will need WINRAR or WINZIP to Open the .ZIP file.
9. You can also click Save and browse for a place on your local computer to place the .ZIP file.