BLACK ROCK MINING PFS CONFIRMS HIGH MARGIN, … · blackrockmining.com.au page 1 . asx announcement...
62
PAGE 1 BLACKROCKMINING.COM.AU ASX ANNOUNCEMENT 24 APRIL 2017 BLACK ROCK MINING PFS CONFIRMS HIGH MARGIN, LOW CAPEX POTENTIAL FOR MAHENGE GRAPHITE MINE HIGHLIGHTS • Preliminary Feasibility Study (PFS) completed for Mahenge Graphite Mine, delivering: o Post-tax unlevered project NPV10 of US$624m (NPV8 of US$798m) o Post-tax, unlevered IRR of 48.2% o EBITDA in first full year of production US$135 million (EBITDA margin of 66%) o Two 83k tonnes per annum staged modules with second module being self-funded o 32-year life of mine with average grade of 8.9% TGC • Ore Reserve declared of 48.3 million tonnes at average grade of 8.7% Total Graphite Contained (TGC) • More than 75% of the 32-year Life of Mine (LoM) is from Reserves, with the first 10 years based primarily on Reserves • Strip Ratio of 0.8:1 delivers sustained low cost operations throughout mine life • Steady state production of 167k tonnes per annum of high purity graphite with a concentrate grade between 98%- 99% from a two-phase construction program • DFS expected to benefit from further phases given size and scale of Resource • Operational expenditure (“opex”) in full production estimated at US$382/tonne • Average (basket) price of US$1,241/tonne • Pre-production capital expenditure (“capex”) estimated at US$90.1 million including a 15% contingency • Total capex estimated at US$159 million including 15% contingency • PFS prepared by independent engineering firm Battery Limits • Encouraging discussions underway with potential partners for financing, offtake, product development and sales and marketing • Construction partner discussions advanced with preferred partner confirmation expected Q2 2017 • Commencement of construction remains on track for 2018 with initial production in 2019. Tanzanian graphite developer Black Rock Mining Limited (BKT: ASX) (“Black Rock” or “the Company”) is pleased to announce it has completed the Preliminary Feasibility Study (“PFS”) for its 100%-owned Mahenge Graphite Project (“the Project”), confirming its outstanding potential as a long life, low capex, high margin operation. The PFS is based on mining and milling 61.1 million tonnes of Resource and Reserve at an average grade of 8.9% TGC for a life of mine (LoM) production of 5.1 million tonnes of concentrate. The LoM strip ratio is exceptionally low, at 0.8:1, benefiting from an even distribution of mining material at high grades through both pits. Metallurgical test work indicates the concentrate will have commercially desirable product size, and purity attributes. The mine plan is also advantaged by bulking in all mineralisation above cut-off grade resulting in limited need for costly selective mining methods. The Ore Reserve is inclusive of the broader Mineral Resource Estimate (“MRE”) for the Mahenge Project, of 202.9 million tonnes at an average grade of 7.8% TGC (ASX 12/12/2016).
Transcript of BLACK ROCK MINING PFS CONFIRMS HIGH MARGIN, … · blackrockmining.com.au page 1 . asx announcement...

PAGE 1 BLACKROCKMINING.COM.AU
ASX ANNOUNCEMENT 24 APRIL 2017
BLACK ROCK MINING PFS CONFIRMS HIGH MARGIN,
LOW CAPEX POTENTIAL FOR MAHENGE GRAPHITE MINE
HIGHLIGHTS
• Preliminary Feasibility Study (PFS) completed for Mahenge Graphite Mine, delivering: o Post-tax unlevered project NPV10 of US$624m (NPV8 of US$798m) o Post-tax, unlevered IRR of 48.2% o EBITDA in first full year of production US$135 million (EBITDA margin of 66%) o Two 83k tonnes per annum staged modules with second module being self-funded o 32-year life of mine with average grade of 8.9% TGC
• Ore Reserve declared of 48.3 million tonnes at average grade of 8.7% Total Graphite Contained (TGC) • More than 75% of the 32-year Life of Mine (LoM) is from Reserves, with the first 10 years based primarily on
Reserves • Strip Ratio of 0.8:1 delivers sustained low cost operations throughout mine life • Steady state production of 167k tonnes per annum of high purity graphite with a concentrate grade between 98%-
99% from a two-phase construction program • DFS expected to benefit from further phases given size and scale of Resource • Operational expenditure (“opex”) in full production estimated at US$382/tonne • Average (basket) price of US$1,241/tonne • Pre-production capital expenditure (“capex”) estimated at US$90.1 million including a 15% contingency • Total capex estimated at US$159 million including 15% contingency • PFS prepared by independent engineering firm Battery Limits • Encouraging discussions underway with potential partners for financing, offtake, product development and sales
and marketing • Construction partner discussions advanced with preferred partner confirmation expected Q2 2017 • Commencement of construction remains on track for 2018 with initial production in 2019.
Tanzanian graphite developer Black Rock Mining Limited (BKT: ASX) (“Black Rock” or “the Company”) is pleased to announce it has completed the Preliminary Feasibility Study (“PFS”) for its 100%-owned Mahenge Graphite Project (“the Project”), confirming its outstanding potential as a long life, low capex, high margin operation.
The PFS is based on mining and milling 61.1 million tonnes of Resource and Reserve at an average grade of 8.9% TGC for a life of mine (LoM) production of 5.1 million tonnes of concentrate. The LoM strip ratio is exceptionally low, at 0.8:1, benefiting from an even distribution of mining material at high grades through both pits. Metallurgical test work indicates the concentrate will have commercially desirable product size, and purity attributes. The mine plan is also advantaged by bulking in all mineralisation above cut-off grade resulting in limited need for costly selective mining methods.
The Ore Reserve is inclusive of the broader Mineral Resource Estimate (“MRE”) for the Mahenge Project, of 202.9 million tonnes at an average grade of 7.8% TGC (ASX 12/12/2016).
PAGE 2 BLACKROCKMINING.COM.AU
ASX ANNOUNCEMENT 24 APRIL 2017
Black Rock’s Interim CEO and Executive Director, John de Vries commented:
“The PFS builds on a compelling scoping study and reconfirms the Mahenge Graphite Project’s potential to be a globally significant graphite producer, with industry leading low capex, and sustained high margins. The mine metrics are driven by low strip ratios and high grade ore, that can be relatively simply converted into large high purity, premium flake concentrates.
“Mahenge is financeable with a unique combination of ultra-low pre-preproduction capex, sustained bottom quartile operating costs and a premium high purity large flake product, that as an investment, is simply not available in any other projects.
“Our staged development model, of two 83kt per annum modules is unique in our sector. The approach is to be large enough to be investable, but small enough not to disrupt the overall flake market, while generating sufficient cash to self-fund the second module. The self-funding, sequential module strategy is sized to accommodate the expanding market in high purity flake without being overly disruptive. It simplifies and de-risks our build by utilising modular assembly and flat-pack, off-site construction where possible.
“We are now completing negotiations with DFS, and construction partners, and expect to commence work quickly on optimising the PFS and commencing detailed engineering with a view to commencing construction in 2018.”
A summary of the PFS is attached to this release.
John de Vries Interim CEO Executive Director
+61 438 356 590 [email protected]
Simon Hinsley Investor Relations NWR Communications
+61 401 809 653 [email protected]
Charlie Bendon Tamesis Partners LLP (UK)
+ 44 7968 167 030 [email protected]

PAGE 3 BLACKROCKMINING.COM.AU
ASX ANNOUNCEMENT 24 APRIL 2017
JORC Compliance Statement
Resource
The information in this report that relates to Mineral Resources is based on and fairly represents information compiled by Mr Lauritz Barnes, (Consultant with Trepanier Pty Ltd), Mr Aidan Platel (Consultant with Platel Consulting Pty Ltd) and Mr Steven Tambanis (previous Managing Director of Black Rock Mining Limited). Mr Barnes, Mr Platel and Mr Tambanis are members of the Australian Institute of Mining and Metallurgy and have sufficient experience of relevance to the styles of mineralisation and types of deposits under consideration, and to the activities undertaken to qualify as Competent Persons as defined in the 2012 Edition of the Joint Ore Reserves Committee (JORC) Australasian Code for Reporting of Exploration Results, Mineral Resources and Ore Reserves. Specifically, Mr Tambanis is the Competent Person for the database and geological model, Mr Barnes is the Competent Person for the resource. Both Mr Platel (independent of Black Rock Mining) and Mr Tambanis completed the site inspections. Mr Barnes, Mr Platel and Mr Tambanis consent to the inclusion in this report of the matters based on their information in the form and context in which they appear. Mr Tambanis holds performance rights in the company as part of his total remuneration package.
The information in this report that relates to the Ore Reserve Statement, has been compiled in accordance with the guidelines of the Australasian Code for Reporting of Exploration Results, Mineral Resources and Ore Reserves (The JORC Code – 2012 Edition).
Reserve
The Ore Reserves have been compiled by Oreology Consulting Pty Ltd, under the direction of Mr John de Vries, who is a Member and Chartered Professional of the Australasian Institute of Mining and Metallurgy. Mr de Vries is the interim CEO and an Executive Director of Black Rock Mining and holds performance rights in the company as part of his total remuneration package. Mr de Vries has sufficient experience in Ore Reserve estimation relevant to the style of mineralisation and type of deposit under consideration to qualify as a Competent Person as defined in the 2012 Edition of the “Australasian Code for Reporting of Mineral Resources and Ore Reserves”.

PAGE 4 BLACKROCKMINING.COM.AU
ASX ANNOUNCEMENT 24 APRIL 2017
Mahenge Graphite Project Pre-feasibility study Short form summary

PAGE 5 BLACKROCKMINING.COM.AU
ASX ANNOUNCEMENT 24 APRIL 2017
Black Rock Mining Limited (ASX:BKT) is an ASX-listed graphite exploration and development company. Black Rock is focused on developing the 100%-owned Mahenge Graphite Project, which is located within 324km2 of exploration tenements in the Ulanga district of Tanzania. The Mahenge Project is the fourth largest (JORC compliant), contained graphite resource in the World.
The Company has completed a Pre-Feasibility Study (PFS) on the Mahenge project, and is moving towards commencing a Definitive Feasibility Study (DFS). With a successful DFS and associated financing, construction could commence in 2018 with first production in 2019.
Figure 1: Location of Black Rock’s Mahenge Graphite Project within Tanzania
The PFS built on the Scoping Study completed in March 2016, confirming the technical viability of the project and its ability to deliver robust financial returns under various financial and operating scenarios.
The Scoping Study and PFS was completed by BatteryLimits Ltd, a leading independent Australian, project development and consulting engineering group with significant experience in the graphite sector.
Black Rock is commencing pilot plant and variability test work at SGS Lakefield Laboratories in Canada, and intends to appoint a DFS Engineer shortly.
PAGE 6 BLACKROCKMINING.COM.AU
ASX ANNOUNCEMENT 24 APRIL 2017
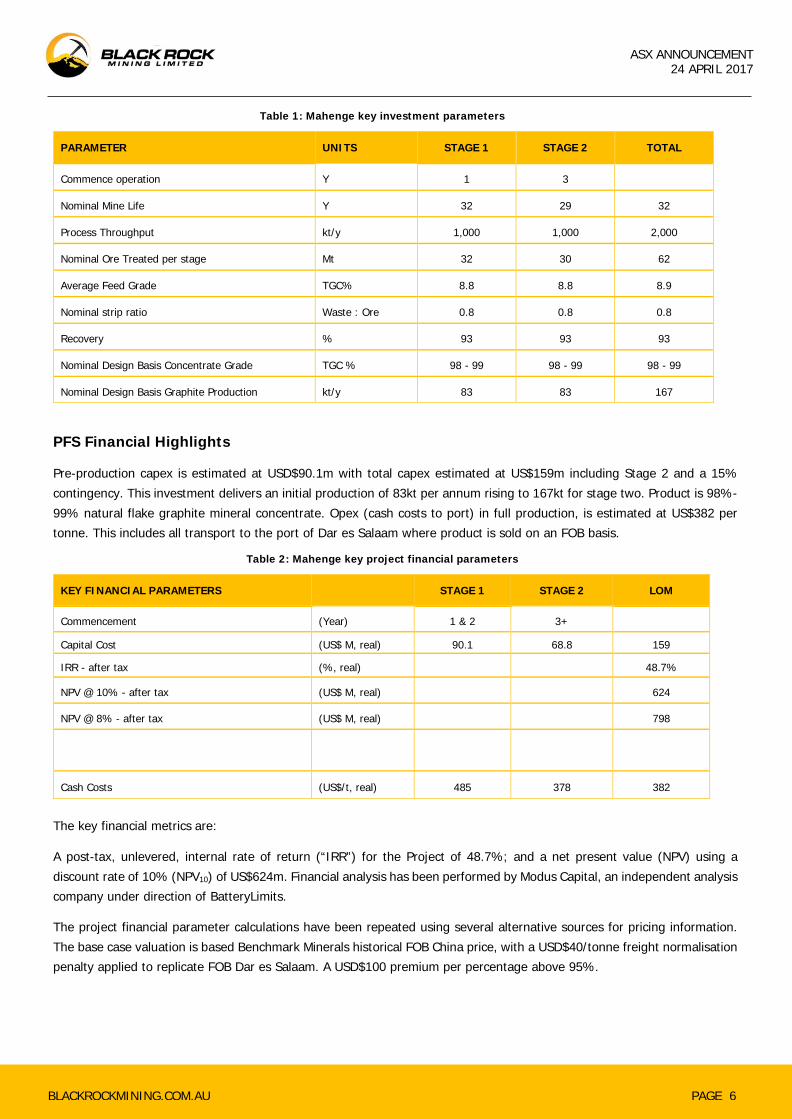
Table 1: Mahenge key investment parameters
PARAMETER UNITS STAGE 1 STAGE 2 TOTAL
Commence operation Y 1 3
Nominal Mine Life Y 32 29 32
Process Throughput kt/y 1,000 1,000 2,000
Nominal Ore Treated per stage Mt 32 30 62
Average Feed Grade TGC% 8.8 8.8 8.9
Nominal strip ratio Waste : Ore 0.8 0.8 0.8
Recovery % 93 93 93
Nominal Design Basis Concentrate Grade TGC % 98 - 99 98 - 99 98 - 99
Nominal Design Basis Graphite Production kt/y 83 83 167
PFS Financial Highlights
Pre-production capex is estimated at USD$90.1m with total capex estimated at US$159m including Stage 2 and a 15% contingency. This investment delivers an initial production of 83kt per annum rising to 167kt for stage two. Product is 98%-99% natural flake graphite mineral concentrate. Opex (cash costs to port) in full production, is estimated at US$382 per tonne. This includes all transport to the port of Dar es Salaam where product is sold on an FOB basis.
Table 2: Mahenge key project financial parameters
KEY FINANCIAL PARAMETERS STAGE 1 STAGE 2 LOM
Commencement (Year) 1 & 2 3+
Capital Cost (US$ M, real) 90.1 68.8 159
IRR - after tax (%, real) 48.7%
NPV @ 10% - after tax (US$ M, real) 624
NPV @ 8% - after tax (US$ M, real) 798
Cash Costs (US$/t, real) 485 378 382
The key financial metrics are:
A post-tax, unlevered, internal rate of return (“IRR”) for the Project of 48.7%; and a net present value (NPV) using a discount rate of 10% (NPV10) of US$624m. Financial analysis has been performed by Modus Capital, an independent analysis company under direction of BatteryLimits.
The project financial parameter calculations have been repeated using several alternative sources for pricing information. The base case valuation is based Benchmark Minerals historical FOB China price, with a USD$40/tonne freight normalisation penalty applied to replicate FOB Dar es Salaam. A USD$100 premium per percentage above 95%.

PAGE 7 BLACKROCKMINING.COM.AU
ASX ANNOUNCEMENT 24 APRIL 2017
TGC Chinese FOB grade, has been used to normalise the grade premium for Mahenge’s 98% nominal grade product. This price protocol compares conservatively, using publicly reported price protocols from a peer group of East African graphite developers. The Ore Reserve Protocol reflects the base case valuation; however, the grade premium is suppressed for finer fractions. All price protocols support a robust project.
Mining will be by conventional open-cut mining techniques. Waste will primarily be used for tailings dam wall construction, or will be stacked in waste dumps to form integrated landforms.
Processing will be by well-proven crushing, grinding and flotation methods, with the plant development in two stages, comprising:
• Stage One - processing plant and infrastructure at a nominal design basis rate of 1 Mt/y to produce up to 83 kt/y graphite concentrate in the first two years of production
• Stage Two - a second 1Mt/y plant and associated additional infrastructure doubling throughput to 2Mt/y and graphite concentrate production to 167kt/y from Year 3 of operation.
Table 3 : Mahenge Investment Performance
FOB CHINA 3 YEAR TRAILING PRICE
INVESTMENT CASE
FOB CHINA 3 YEAR AMENDED FINES RESERVE CASE
EAST AFRICAN
PEER AVERAGE HIGHEST PEER*
PRICING USD $/T FOB DAR USD $/T FOB DAR USD $/T FOB DAR USD $/T FOB DAR
500 um 2,235 2,235 3,527 3,948
300 um 1,676 1,676 2,237 2,664
180 um 1,287 1,287 1,522 1,894
150 um 1,144 1,144 1,020 1,701
75 um 998 898 821 1,220
-75 um 892 568 568 1,027
Basket Price LoM 1,241 1,174 1,346 1,777
Basket Price Ulanzi 1,201 1,123 1,261 1,694
Basket Price Cascade 1,281 1,226 1,435 1,862
Post tax IRR 49% 45% 52% 74%
Post Tax NPV 8 $USD M 1,164 1,042 1,305 2,169
Post Tax NPV 10 $USD M 624 554 695 1,105
*Peer con spec is 98.3% TGC

PAGE 8 BLACKROCKMINING.COM.AU
ASX ANNOUNCEMENT 24 APRIL 2017
Proven and Probable Ore Reserve
The Ore Reserve used in the PFS for mine design is based upon the updated Mineral Resource estimate (“MRE”), calculated by Trepanier Pty Ltd and released to the ASX in December 2016.
The total mineral resource is 203Mt @ 7.8% TGC, including a high grade proportion of 38.7Mt @ 9.9% TGC. The Ulanzi mineral resource currently stands at 111Mt @ 8.2% TGC.
In summary, total Resource includes 15.9Mt of contained graphite, with 10% of resource tonnes in the Measured and 40% in the Indicated categories.
On the basis of these results, the Mahenge Project is the fourth largest JORC-compliant graphite mineral resource in the world. (Refer ASX Announcement 6 October 2016)
Table 4: Mahenge Global Resource summary reporting table
CATEGORY TONNES (MILLIONS)
TGC (%)
CONTAINED TGC (MILLIONS TONNES)
Measured 21.2 8.6 1.8
Indicated 81.1 7.8 6.4
Inferred 100.7 7.7 7.7
TOTAL 203.0 7.8 15.9
Table 5: Resource breakdown by prospect
PROSPECT CATEGORY TONNES (MILLIONS)
TGC (%)
CONTAINED TGC (MILLIONS TONNES)
Ulanzi Measured 13.3 8.9 1.2
Indicated 48.0 8.2 3.9
Inferred 50.5 8.0 4.0
Sub-total 111.8 8.2 9.2
Epanko Measured
Indicated 17.6 6.4 1.1
Inferred 20.8 5.9 1.2
Sub-total 38.4 6.1 2.3
Cascades Measured 7.8 8.0 0.6
Indicated 15.5 8.4 1.3
Inferred 29.4 8.4 2.5
Sub-total 52.8 8.3 4.4
COMBINED MEASURED 21.2 8.6 1.8
INDICATED 81.1 7.8 6.4
INFERRED 100.7 7.7 7.7
TOTAL 203.0 7.8 15.9

PAGE 9 BLACKROCKMINING.COM.AU
ASX ANNOUNCEMENT 24 APRIL 2017
The PFS contemplates an initial mine life of 32 years, based on Probable Ore Reserves and an assumed conversion of Inferred Resource to ore.
The Ore Reserve is based on a processing cut-off which varies by deposit (based on the different financial parameters for each). The processing cut-off grades are 6.5% TGC for Ulanzi and 3.5% TGC for Cascade. Cut off grades have been determined from an analysis determining that 8.9% total feed grade delivering the maximum NPV for the project. Economic cut off grades are significantly lower, and lower than the cut-off grades used in reporting the Mineral Resource.
The Ore Reserve estimate is based on the conversion of the total resource inventory contained within the pit as either Measured or Indicated converting to Probable Ore Reserve, subject to the application of modifying factors. Pit shells used in Reserve estimation, have all Inferred material reclassified as waste. Irrespective of the geological confidence expressed in the Resource estimate, the Ore Reserve estimate will continue to be classified as Probable, until mining and export licences are granted, and firm sales contracts are in place.
The Ore Reserve estimate, is based upon a basket price of US$1,174 per tonne of graphite concentrate averaged over graphite products as in Table 3. The basket price selected for Ore Reserve determination has referenced the basket price selected for project evaluation, that being the three-year trailing price FOB China with a freight normalisation of $40/tonne applied. A conservative price modification has been applied to the fines fraction as a provision should the purity price premium not fully translate to the fines fraction. This is considered conventional practice, where an Ore Reserve estimate references a lower price protocol relative to the business valuation.
Table 6: Reserve concentrate price construction
ITEM UNITS MAHENGE
% IN CON PRICE USD/T
super jumbo >500 1 2,235
jumbo 300- 500 20 1,676
coarse 180-300 30 1,287
medium 150-180 15 1,144
small 75-150 20 898
fine <75 14 568
Average Price 1,174 Business model
The business model of a staged expansion to 167kt per annum is based on a whole of business optimisation. This optimisation identified that a planned feed grade of 8.9% TGC over the life of mine, delivered the best overall financial outcome. Module sizing indicated at 83kt per annum, economies of scale of scale flatlined, and the planned plant was close to the maximum size that could modularised or “flat packed”.
The planned approach of modularising where possible is designed to reduce project risk by simplifying site activities, reducing build exposure to the wet season and to minimise potential for scope and cost creep by defining clear completion tests and cost points at factory delivery.

PAGE 10 BLACKROCKMINING.COM.AU
ASX ANNOUNCEMENT 24 APRIL 2017
Self-funding of the second module achieves significant investment scale, while restricting total investment contribution to that required to establish the first module. The second module is nominally considered to start two years after the first module. The flexible approach to timing of startup of the second module provides Black Rock with significant flexibility to respond to market and investment opportunities as they emerge.
Mining
Mining will be by owner-operator using conventional open-cut mining techniques. The Mining strategy is to mine out the lower strip ratio Ulanzi deposit, followed by the Cascade deposit commencing in year 13. The mining strategy is to initially develop the oxide ore, which can be cost-effectively mined at lower strip ratios, and to then develop the transition and fresh ore pits.
Figure 2: Ore feed and waste mining by pit and by year
Figure 3: Annual ore processing by weathering type

PAGE 11 BLACKROCKMINING.COM.AU
ASX ANNOUNCEMENT 24 APRIL 2017
Figure 4: Annual processing by Resource Confidence
The contribution of inferred material to business plan is 1.25% for the first 10 years. This is considered negligible and does not materially contribute to the risk profile of the business during the investment payback period.
Waste will primarily be used for tailings dam wall construction and will be stacked in waste dumps to form integrated landforms. This approach reduces haul distances, and permits smaller tailings dam establishment, allowing for land to returned to alternative land uses progressively through the project life. This avoids large reclamation expenses at the end of mine life.
The adoption of a whole of ore envelope mining strategy, simplifies grade control, reduces dilution and significantly lowers the strip ratio. Ulanzi has an average strip ratio of 0.5 for the first 14 years, followed by Cascade with an average strip ratio of 1.1. The life of mine strip ratio is 0.8.
0.0
0.5
1.0
1.5
2.0
2.5
Y0 Y1 Y2 Y3 Y4 Y5 Y6 Y7 Y8 Y9 Y10
Y11
Y12
Y13
Y14
Y15
Y16
Y17
Y18
Y19
Y20
Y21
Y22
Y23
Y24
Y25
Y26
Y27
Y28
Y29
Y30
Y31
Y32
Measured Indicated Inferred

PAGE 12 BLACKROCKMINING.COM.AU
ASX ANNOUNCEMENT 24 APRIL 2017
0.0
0.5
1.0
1.5
2.0
2.5
Y0 Y2 Y4 Y6 Y8 Y10
Y12
Y14
Y16
Y18
Y20
Y22
Y24
Y26
Y28
Y30
Y32
Strip
Rat
io
Strip Ratio
Figure 5: LoM strip ratio graph
Mining volumes are low, and will utilise 40-tonne articulated trucks during oxide mining where trafficability conditions could impact a conventional fleet. Fresh ore will be mined with 65-tonne rigid body trucks, further reducing operating costs in the later part of the mine life.
Geotechnical conditions are expected to be good once fresh material is encountered. The wall slope parameter guidance for the Pre-Feasibility open pit optimization process was provided by independent geotechnical consultants Peter O’Bryan & Associates. Specific geotechnical information for the Cascade deposit was not available at the time of report preparation. However, with mining commencing in year 14 with the same geological setting as the adjacent Ulanzi deposit, Cascade slope design has been based on those adopted for Ulanzi.
Ulanzi
Cascades

PAGE 13 BLACKROCKMINING.COM.AU
ASX ANNOUNCEMENT 24 APRIL 2017
Figure 6: Production Profile – Mining
The Cascade wall parameters are shown in table 7 and table 8. In comparison, the inter-ramp slope angle (49˚) in transition material is much steeper than for Ulanzi (35˚) but this was deemed acceptable due to the thin nature of the Cascade transition zone. This steeper slope angle assumption avoided excessive flat overall slope angles without affecting the stability. The final pit design was checked and approved by Peter O’Bryan & Associates.
Table 7: Inter-ramp slope angles
INTER-RAMP SLOPE ANGLE
DOMAIN UNIT OXIDE TRANSITION FRESH
East Wall degrees 32.4 49 54.5
West Wall degrees 32.4 49 50.8
North & South Walls degrees 32.4 49 58.3
Table 8: Berm / batter configurations
BERM / BATTER CONFIGURATION
UNIT UNIT OXIDE TRANSITION FRESH
Batter height m 5 10 20
Batter angle degrees 60 75 variable
Berm width m 5 6 7.0

PAGE 14 BLACKROCKMINING.COM.AU
ASX ANNOUNCEMENT 24 APRIL 2017
Figure 7: Mine pit design and site layout
Tailings Storage Facility (TSF) Design
ATC Williams (Perth) conducted the TSF assessment process, and has recommended conventional wet dams as the tailings management strategy.
A geochemical evaluation of mine tailings was conducted by Graeme Campbell & Associates to evaluate oxide and primary ore tailings, generated from the BV flotation test work program. The TSF will utilise the abundant marble mineralisation within and adjacent to the mining pits for long-term management primary tailings.

PAGE 15 BLACKROCKMINING.COM.AU
ASX ANNOUNCEMENT 24 APRIL 2017
Metallurgy
In addition to providing overall project management and engineering design, the processing flow sheet has been developed by BatteryLimits, a Perth-based processing engineering consulting company.
The flowsheet adopted is for a conventional graphite plant. Reagents include diesel, kerosene and MIBC for flotation, and fluctuant for thickening. The flowsheet consists of three stage crushing, coarse rod milling, flotation and regrind facility. Graphite concentrate is then dried and bagged. The overall facility is developed in two stages:
• Stage One - plant processing at a nominal design basis 1Mt/y to produce a up to a nominal 83kt/y of high-grade graphite concentrate
• Stage Two - a second 1Mt/y module to produce a combined nominal 167kt/y of graphite concentrate. Common facilities to both modules are:
• Tailings storage facility
• Bores and water supply
• Office and workshop facilities
• Communications infrastructure
• Generators for process plant and ancillary power
• Access roads within the plant and the Project site
• Camp facilities.
A 6MW generator plant using diesel will supply power to the plant for Stage One, followed by grid power connection in Year 3, for site power.
Water supply will comprise borefield and river intake water. Water will also be recovered for reuse from plant thickeners, pit seepage and inflow, and from the tailings storage facility.
There will be two warehouse facilities for bagged product: a smaller dispatch and storage centre on site and a larger warehouse facility near Dar es Salaam. The product will be loaded into 1t “bulka” bags at the Project site, and transported by truck to a warehouse adjacent to the Dar es Salaam port where they will be stuffed in 20-foot shipping containers and stored in preparation for export.
A bulk sample of Ulanzi and Cascade ores has been shipped to SGS Lakefield for flow sheet optimisation, and pilot plant operation. This work will commence from late April 2017 and continue until June. Tests will confirm variability of ore types and will be used for final basis of design for the Definitive Feasibility Study. Concentrate generated during the pilot plant will be made available for customer acceptance testing.

PAGE 16 BLACKROCKMINING.COM.AU
ASX ANNOUNCEMENT 24 APRIL 2017
Figure 8: Mahenge PFS Level Flowsheet
Figure 9: Mahenge Production Profile – Processing Schedule

PAGE 17 BLACKROCKMINING.COM.AU
ASX ANNOUNCEMENT 24 APRIL 2017
Environmental Impact Assessment
A Draft EIS has been completed by independent environmental consultants Harmonic Biosphere Tanzania, and will be updated with the outcome of this Pre-Feasibility Study. The associated permitting process for the Mining Licence, and the environmental/community context in which the Mahenge Graphite Project is being developed, and will be available during the Definitive Feasibility Study.
The scope of the EIS is based on initial Environmental Impact Assessment (EIA) conducted from December 2016 to January 2017. The study is based on Terms of Reference approved by National Environmental Monitoring Committee (NEMC) as per reference letter no. NEMC/HC/EIA/02/02227/VOL.I/4 of 29 November 2016, for Mahenge Resources Limited Graphite mines at Epanko north, Kisewe (Cascades) and Mdindo (Ulanzi) villages. The scope entails the following:
• Complete Environmental and Social Impact Assessment within defined spatial, temporal and institutional boundaries of the proposed project area
• Identification and classification of impacts, and development of appropriate mitigation measures
• Identification and analysis of alternatives where the likelihood of an impact to environmental and social conditions exceeds tolerable levels
• Propose mitigation measures with implementation strategies including monitoring programs for environmental and social parameters
• Mitigation measures identified, and where appropriate implanted as part of the project implementation plan.
ESIA Process
Tanzania has a relatively mature mining industry resulting is a transparent and well understood permitting process. The steps in the EIA process for the project are as shown below:
• Submission of project registration form and project brief
• Baseline information, scoping, meeting with key stakeholders and formulation of terms of reference (ToR) and public notification of the EIA process
• Submission of Scoping report and draft ToR to NEMC with continued consultation with stakeholders
• Complete EIA and preparation of the draft report
• Submission of 15 copies of draft EIA report and 15 copies of non-technical executive summary to NEMC
• Notification of Site verification and Technical Advisory Committee (TAC) meeting
• Site visit and TAC meeting
• Integration of comments from TAC meeting and Submission of final EIS report to NEMC and Acquire Environmental Certificate.

PAGE 18 BLACKROCKMINING.COM.AU
ASX ANNOUNCEMENT 24 APRIL 2017
Regional Demographic Context
The Mahenge prospecting licence intersects three village areas, Epanko, Kisewe and Mdindo villages. Initial mine development, and the first 15 years of project life, is on the Ulanzi orebody, with the remaining life being at the Cascades orebody. The PFS identified that Epanko North should not considered in the project development sequence. This then excludes any impact upon Epanko and Kisewe village areas.
The proposed project site is within land classified as village land at Mdindo. Land use is dominated by subsistence agriculture and forestry, traditional housing and artisanal gem mining. Land use is a combination of open grazing land in steeper areas, with flatter areas, farmed with annual crops. The area does not have cashew plantations, however food trees such as mango and bananas are distributed on flatter areas of the project area.
A forested area adjacent to the Epanko area is of cultural significance, and while within the exploration licence is well outside of any planned mining activity.
Provision for land resumption, resettlement and compensation for the entire site area has been made within the capital estimate, with costs timed with site establishment.
Figure 10: Mahenge Project demographics and farming areas – Ulanzi and Cascades

PAGE 19 BLACKROCKMINING.COM.AU
ASX ANNOUNCEMENT 24 APRIL 2017
Mine Closure
The mine life exceeds the nominal 20-year horizon considered in the economic analysis of the investment parameters of the mining licence. No provision has been made for reclamation within the economic time frame as it assumed operations will continue beyond the nominal time horizon, and the NPV impact at year 32, is within the error range of the estimate. However, operations have been designed and scheduled to allow for progressive rehabilitation of land throughout the project life, and for land to be returned to traditional uses as quickly as possible post mining.
A feature of the project is the low life of mine strip ratio, of 0.8:1; producing relatively small waste volumes compared to tailings generation. Almost all mine waste will be used for tailings dam wall construction, with minimal non tailings impounding, waste dump formation. This minimizes costs associated with dump closure, and forces dump closure planning and costs to be concurrent with normal operating activities.
Tailings dams will be developed using a valley infill strategy, integrating developed landforms composed of mine waste and tailings into the rolling terrain. Relatively small tailings dams, allow for progressive reclamation throughout the project life. This provides an opportunity to return affected areas to alternative land uses early, and minimises reclamation costs and the end of mine life. At closure, all buildings, plant and equipment will be removed or repurposed.
Logistics
Black Rock Mining has invested substantial resources into proving the capabilities and condition of local infrastructure in from the Mahenge site to the port at Dar es Salaam.
For the purposes of the PFS, the Company has elected to truck product by road to Dar es Salaam port, where products will be stuffed into containers for shipping to customers. Costs used in the PFS are based on costs provided to Black Rock for loading, hauling, container stuffing and ship loading by reputable Tanzanian based logistics companies.
The port of Dar es Salaam is a significant deep water port in East Africa, and is a major export terminal for mineral products from Tanzania, Zambia, and the DRC. A significant volume of container traffic to ports in key markets, permits relatively small but high frequency cargos and a minimal requirement for charters.
Product Verification Testing
Black Rock Mining have engaged several independent specialist consultants, in key marketing regions in the USA, Japan and Europe to develop and supervise the completion of a series of detailed metallurgical test work programs to independently verify our product quality.
The objectives of this testwork in the key markets is to confirm the purity of the Mahenge graphite product, and more importantly to determine the amenability of Mahenge graphite to satisfy customers’ requirements and tailor specifications where necessary. This work is ongoing as part of product development program.
A Memorandum of Understanding has been signed with Meiwa corporation of Japan, a large chemical processing and trading organization, with an important position in the graphite value chain. Meiwa’s input will support further refining our product development strategy.

PAGE 20 BLACKROCKMINING.COM.AU
ASX ANNOUNCEMENT 24 APRIL 2017
Ulanzi bulk sample testwork
This testwork program was completed in June 2016 and delivered significant incremental improvements to graphite purity. 99.2% TGC purity was achieved for 180μm and 300μm size fraction, which represents 53.1% of concentrate volume. Furthermore, flake distribution is biased towards coarser jumbo (premium) flake. The entire +75μ size fraction returned a weighted average of 99.1% TGC for 86% of the entire sample. This test work confirms Mahenge flake graphite as a premium product across the size range.
Importantly these results were achieved using a conventional flotation circuit. Potential improvement will be explored during the pilot plant run, for inclusion in the DFS. At this level of purity, it is possible to minimise acid purification for refining of natural graphite to battery grade product or avoid the acid process by utilising thermal purification. Lower impurities should result in lower temperature thermal purification temperatures. This has major cost, environmental and productivity advantages for the battery supply chain.
Table 9: Ulanzi bulk sample assay results by size fraction and %TGC. TGC assays are by double LOI method.
Testing completed in July 2016 improved on the June 2016 testing, yielding better results for Ulanzi and Epanko North primary mineralisation achieving results of more than 99% TGC as per figure 6 below. Once again this has excellent implications for further processing and potentially allows for the manufacture of spherical graphite used in lithium-ion battery anode production, free of chemical purification.
The entire +75 to +500 micron portion of flake graphite is now achieving 99.1% TGC purity and this represents 86% of the sample by weight. Over the next test phase, there is scope to further improve the concentrate purities with additional cleaner work.
The key outcome from this test is that exceptionally high purities in the 98%-99% range can be achieved in a straightforward processing circuit whilst preserving flake size. Graphite at this high purity level will be sought after for battery graphite and other applications and is expected to attract a price premium.
SCREEN SIZE MICRONS
TGC ASSAY %
DISTRIBUTION %
CUMULATIVE DISTRIBUTION %
WEIGHTED AV. GRADE %
+500 μm 98.3 1.1 1.1 98.3
+300 μm 99.2 17.9 19.0 99.1
+180 μm 99.2 35.2 54.3 99.2
+150 μm 98.9 9.5 63.8 99.1
+106 μm 99.0 12.9 76.6 99.1
+75 μm 98.9 9.3 86.0 99.1
+25 μm 97.5 8.8 94.8 98.9
-25 μm 81.5 5.2 100.0 98.0
PAGE 21 BLACKROCKMINING.COM.AU
ASX ANNOUNCEMENT 24 APRIL 2017
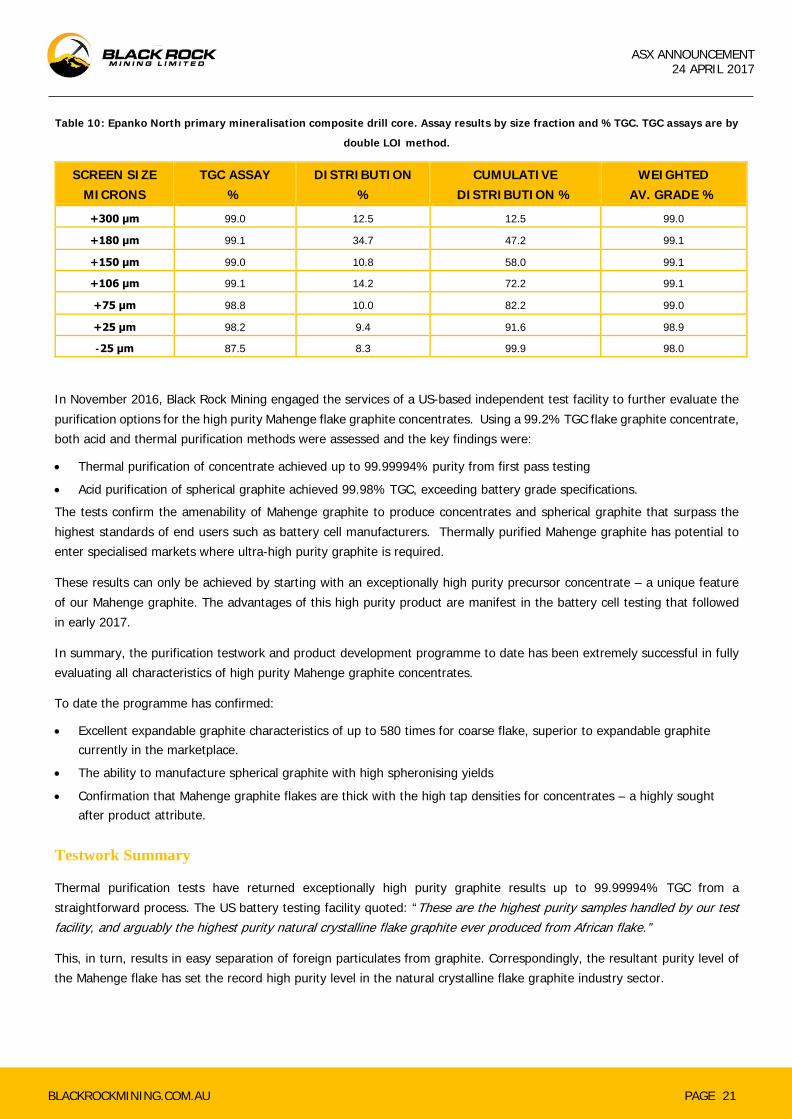
Table 10: Epanko North primary mineralisation composite drill core. Assay results by size fraction and %TGC. TGC assays are by
double LOI method.
SCREEN SIZE MICRONS
TGC ASSAY %
DISTRIBUTION %
CUMULATIVE DISTRIBUTION %
WEIGHTED AV. GRADE %
+300 μm 99.0 12.5 12.5 99.0
+180 μm 99.1 34.7 47.2 99.1
+150 μm 99.0 10.8 58.0 99.1
+106 μm 99.1 14.2 72.2 99.1
+75 μm 98.8 10.0 82.2 99.0
+25 μm 98.2 9.4 91.6 98.9
-25 μm 87.5 8.3 99.9 98.0
In November 2016, Black Rock Mining engaged the services of a US-based independent test facility to further evaluate the purification options for the high purity Mahenge flake graphite concentrates. Using a 99.2% TGC flake graphite concentrate, both acid and thermal purification methods were assessed and the key findings were:
• Thermal purification of concentrate achieved up to 99.99994% purity from first pass testing
• Acid purification of spherical graphite achieved 99.98% TGC, exceeding battery grade specifications. The tests confirm the amenability of Mahenge graphite to produce concentrates and spherical graphite that surpass the highest standards of end users such as battery cell manufacturers. Thermally purified Mahenge graphite has potential to enter specialised markets where ultra-high purity graphite is required.
These results can only be achieved by starting with an exceptionally high purity precursor concentrate – a unique feature of our Mahenge graphite. The advantages of this high purity product are manifest in the battery cell testing that followed in early 2017.
In summary, the purification testwork and product development programme to date has been extremely successful in fully evaluating all characteristics of high purity Mahenge graphite concentrates.
To date the programme has confirmed:
• Excellent expandable graphite characteristics of up to 580 times for coarse flake, superior to expandable graphite currently in the marketplace.
• The ability to manufacture spherical graphite with high spheronising yields
• Confirmation that Mahenge graphite flakes are thick with the high tap densities for concentrates – a highly sought after product attribute.
Testwork Summary
Thermal purification tests have returned exceptionally high purity graphite results up to 99.99994% TGC from a straightforward process. The US battery testing facility quoted: “These are the highest purity samples handled by our test facility, and arguably the highest purity natural crystalline flake graphite ever produced from African flake.”
This, in turn, results in easy separation of foreign particulates from graphite. Correspondingly, the resultant purity level of the Mahenge flake has set the record high purity level in the natural crystalline flake graphite industry sector.

PAGE 22 BLACKROCKMINING.COM.AU
ASX ANNOUNCEMENT 24 APRIL 2017
Source: ProGraphite 2017
The Company has now confirmed that both acid and thermal purification routes are viable options to achieve ultra pure end products of the highest standards
• Thermal purification can be adjusted to achieve desired purities for specific end products
• Acid purification of Mahenge Graphite is expected to require much lower reagent volumes (and lower cost) than competitor graphite concentrates to achieve desired spherical graphite purities
• Battery cell testing of ultra high purity spherical graphite conducted in the USA has proven that Mahenge graphite converted to spherical graphite is highly amenable to lithium-ion battery production with superior charging cycle testwork indicating that the spheroids maintain their integrity much longer than other graphite, potentially extending battery cycle life.
Markets
Black Rock Mining has identified four target markets for its product:
I. Europe; II. The United States of America;
III. North-east Asia including Japan and South Korea; and IV. China.
A prudent marketing approach involves producing product amenable to the high-growth sectors while keeping channels open to mature market sectors where specifications are not as stringent, thus ensuring maximum product sell-through.
The charts below are a snapshot of the relative volumes between sectors and their respective growth potential forecast for 2025.
Recarburisers/refractories, foundries and lithium-ion batteries are the three most prominent and are addressed below.
PAGE 23 BLACKROCKMINING.COM.AU
ASX ANNOUNCEMENT 24 APRIL 2017
Recarburiser/Refractories
Recarburiser applications involve using carbon materials to adjust carbon content in steel before casting, while still in molten form. Natural graphite is highly suitable for use as a recarburiser due to comprising of pure carbon, soluble in molten metal and lower impurities than other carbon sources. The competing substitutes are synthetic graphite, amorphous graphite and coke. Customers are particularly price sensitive and likely to shift to a substitute in volatile price environment.
The World Steel Association data suggests that global recarburiser demand for the top 18 steel producers is as high as 955,000tpa for total graphite content (TGC) in 2016. Therefore, recarburisers represent a significant volume graphite marketing opportunity, due to market size and potential to displace synthetic graphite.
Foundries
In the foundry sector graphite is used in the forming of mould castings. Historically this is the most traditional application of graphite, originally used to produce graphite crucibles. Furthermore natural graphite is the main component of blast furnace bricks. Prior to the emergence of the lithium ion battery sector foundries were the key consumer of natural graphite where pricing is generally low and the product is sold on an undifferentiated basis, meaning that no premium is given for higher graphite purity.
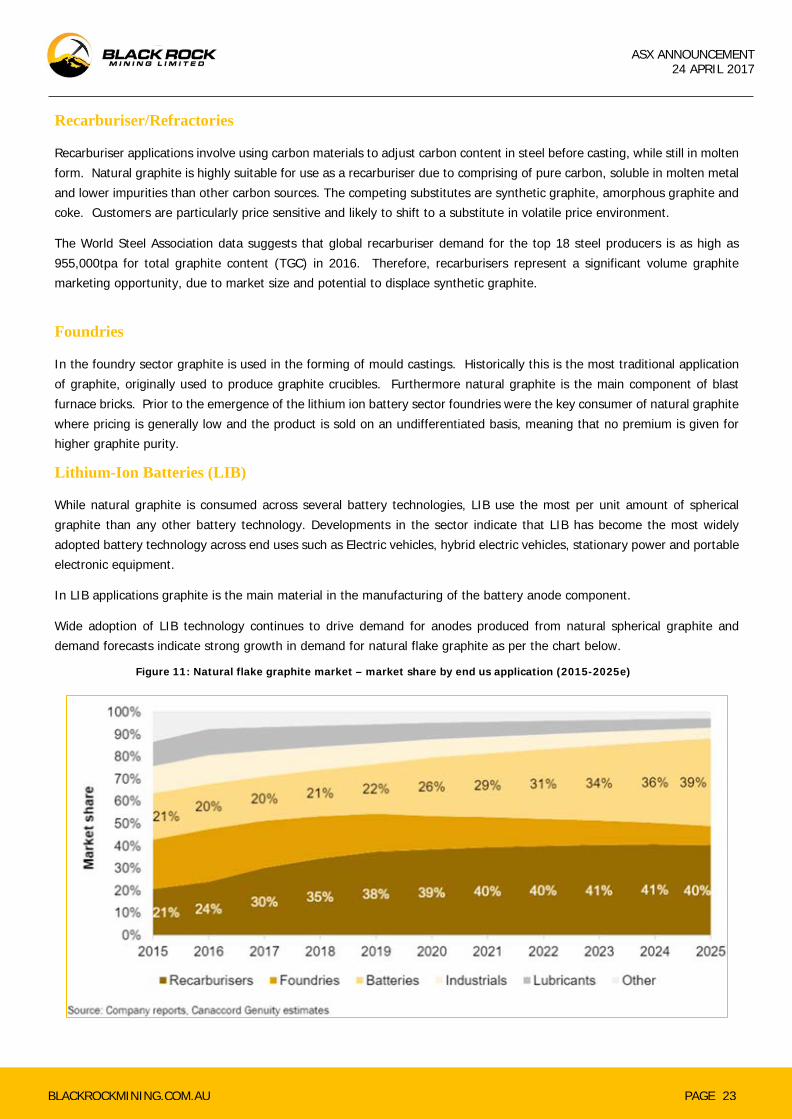
Lithium-Ion Batteries (LIB)
While natural graphite is consumed across several battery technologies, LIB use the most per unit amount of spherical graphite than any other battery technology. Developments in the sector indicate that LIB has become the most widely adopted battery technology across end uses such as Electric vehicles, hybrid electric vehicles, stationary power and portable electronic equipment.
In LIB applications graphite is the main material in the manufacturing of the battery anode component.
Wide adoption of LIB technology continues to drive demand for anodes produced from natural spherical graphite and demand forecasts indicate strong growth in demand for natural flake graphite as per the chart below.
Figure 11: Natural flake graphite market – market share by end us application (2015-2025e)

PAGE 24 BLACKROCKMINING.COM.AU
ASX ANNOUNCEMENT 24 APRIL 2017
From ongoing discussions with potential offtakers, it is clear the LIB sector represents the best opportunity for Black Rock in terms of demand for natural graphite product offtake. The global trend in clean energy storage reinforces the demand for product in the form of energy storage applications where natural graphite is a key input in the manufacture of the battery anode. Recent power supply reliability issues in South Australia is a local example of the growing need for energy reliability, preferably from a clean source.
Market research substantiates Black Rock’s strategy in focussing on the high-growth sectors and the sector(s) with least likely occurrence of market disruption.
The PFS assumes all product be sold in a mineral concentrate form. It should be noted that within the natural graphite market there are distinct markets and applications for each size fraction (and purity) with specific price points. While market information indicates a price premium for the coarser flake product, in the interests of testing the resilience of the Mahenge Project a conservative position with no annual escalation or CAGR was applied.
Human Resources
Under the prospecting licences granted for the Mahenge Project, there will be a training program that ensures on-the-job training and employment opportunities for Tanzanian citizens. Where an expatriate is employed, a localisation program will be developed to ensure a smooth transition to local employment where possible. Black Rock will also encourage the development of local businesses to support a long-term mining operation to provide addional long term employment opportunities.
Implementation Schedule
Black Rock has adopted a seamless approach to its study stages that accommodates change through the Prefeasibility Study (PFS) and into the Definitive Feasibility Study (DFS) stages of work.
On completion of the DFS, the Project implementation plan will be developed to provide certainty of strategy and design while aiming to ensure that the Project is delivered to schedule and the ramp up capacity to full production is achieved in an efficient and productive timeframe. A high-level project schedule has been developed as shown in Figure 11.
Figure 12: Mahenge Project implementation schedule

PAGE 25 BLACKROCKMINING.COM.AU
ASX ANNOUNCEMENT 24 APRIL 2017
The projected timeline from the completion of the PFS (April 2017) to completion of construction (June 2019) is 27 months.
To meet the proposed schedule, the implementation strategy will be structured into three stages:
• Pre-Construction, including final permitting, basic design of the treatment plant and infrastructure, and pioneer construction activities
• Construction including earthworks, civils, architectural, structural, mechanical / piping installation, electrical, instrumentation and other disciplines
• Plant commissioning and handover.
The most likely contracting strategy will involve Black Rock engaging an experienced engineering firm (Engineer) to provide Engineering, Procurement and Construction Management (EPCM) services associated with the development of the process plant and infrastructure. Specialist consultants will be engaged to address specific elements of the Project not within the core competency of the Engineer.
Responsibility for the execution and delivery of the various Project scope elements will be divided between the Engineer and Black Rock. The implementation approach requires close integration with and collaboration between Black Rock and the Engineer to ensure all aspects of the Project development are delivered efficiently.
Capital and Operating Cost Estimate Breakdown
The capital costs have been prepared to an accuracy of ±15%. Operating cost estimates are to ±15%. The capital cost estimate summary for both Stages 1 and 2 of Project development is US$159M and is shown in Table 11.
The operating cost estimate is US$382/t concentrate, averaged on an FOB basis excluding royalties for the life of mine (LOM) and is shown in Table 12.
Figure 13: Capex summary for Stages 1 & 2 of Project development

PAGE 26 BLACKROCKMINING.COM.AU
ASX ANNOUNCEMENT 24 APRIL 2017
Figure 14: Opex summary for Stages 1 & 2 of Project development
$-
$100
$200
$300
$400
$500
$600
2 3 4 5 6 7 8 9 10 11 12 13 14 15 16 17 18 19 20 21 22 23 24 25 26 27 28 29 30 31 32 33To
tal /
Av.
Operating Expenditure (incld. royalties & levies) per tonne of Concentrate (US$/t, real)
Mining Reagents, Consumables & Water FuelPower Transport General & AdminMaintenance Employees Other ExpenditureRoyalties & Levies

PAGE 27 BLACKROCKMINING.COM.AU
ASX ANNOUNCEMENT 24 APRIL 2017
Table 11: Capital cost estimate summary
AREA PFS STAGE 1 PFS STAGE 2 TOTAL
(US$'000) (US$'000) (US$'000)
Process Plant
Area 101 - Crushing 4,393 4,393 8,787
Area 102 - Milling and Classification 4,570 4,570 9,139
Area 103/4/5 - Rougher & Cleaner Flotation 11,578 11,578 23,155
Area 106 - Tailings and Decant Return 1,816 1,960 3,776
Area 107 - Concentrate Dewatering and drying 3,754 3,754 7,508
Area 107 - Concentrate Screening and Packaging 4,056 4,056 8,112
Area 108/9 - Reagents 1,457 1,457 2,915
Area 110/111 - Services 3,646 3,646 7,292
Process water dam 152 152 303
Process plant bldgs (Offices/amenities/MCCs/Ctrl Rooms) 1,565 1,565 3,130
Process plant buildings (Warehouse & Maint Workshop) 605 605 1,211
Plant bulk earthworks 1,496 1,496 2,992
Total Process Plant 39,088 39,232 78,320
Site Infrastructure
TSF (Starter embankment only) 3,064 1,610 4,674
Borefield 1,328 1,328 2,656
Roads 2,870
2,870
Power 3,048 5,000 8,048
Camp 4,527 665 5,192
Mine establishment works 1,625 0 1,625
Total Infrastructure 16,461 8,603 25,064
Indirect costs
Process plant vehicles, mobile equipment 1,319 455 1,774
Mining fleet, ancillary equipment 7,551 2,723 10,274
Spares 1,097 815 1,912
Plant EPCM (15%) 5,863 5,885 11,748
Infrastructure EPCM (12.5%) 2,058 1,075 3,133
Contingency (15%) 9,663 7,652 17,315
Project and Freight Insurance 892 681 1,573
Customs and Border Levies 613 560 1,173
Owner's costs (excl vehicles) 5,508 1,075 6,583
Total EPCM & Contingency 34,563 20,921 55,484
TOTAL 90,112 68,756 158,869
PAGE 28 BLACKROCKMINING.COM.AU
ASX ANNOUNCEMENT 24 APRIL 2017
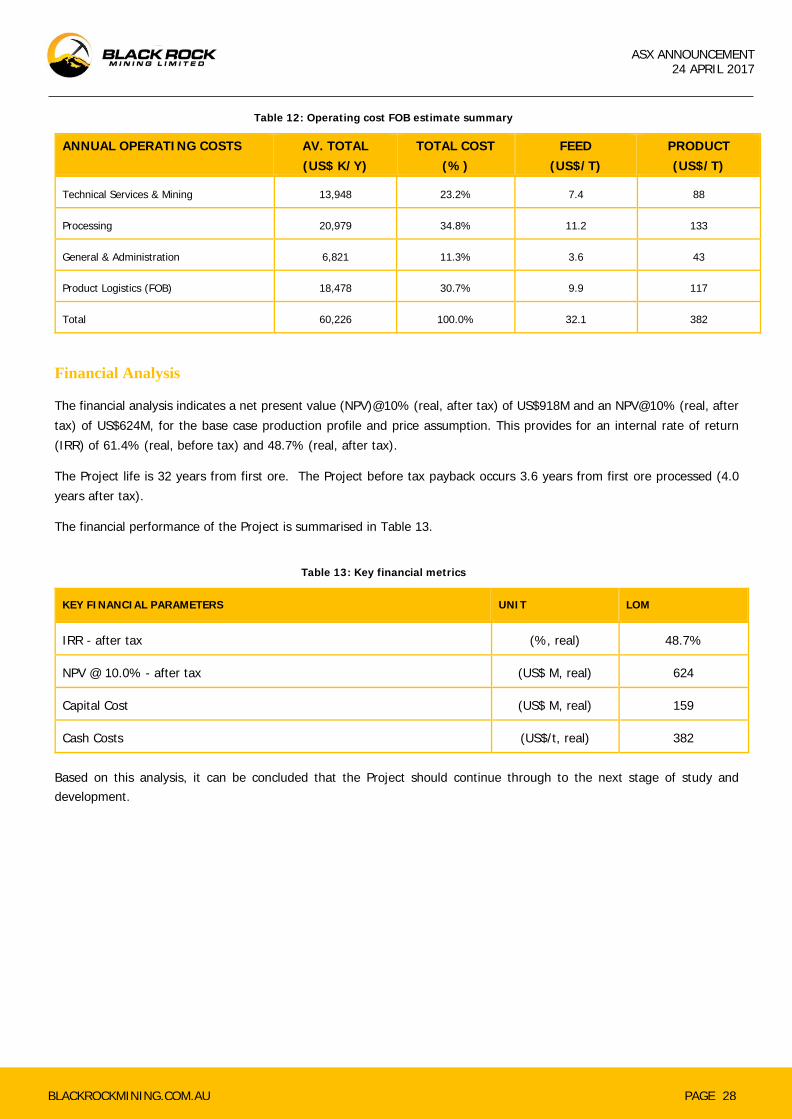
Table 12: Operating cost FOB estimate summary
ANNUAL OPERATING COSTS AV. TOTAL (US$ K/Y)
TOTAL COST (%)
FEED (US$/T)
PRODUCT (US$/T)
Technical Services & Mining 13,948 23.2% 7.4 88
Processing 20,979 34.8% 11.2 133
General & Administration 6,821 11.3% 3.6 43
Product Logistics (FOB) 18,478 30.7% 9.9 117
Total 60,226 100.0% 32.1 382
Financial Analysis
The financial analysis indicates a net present value (NPV)@10% (real, after tax) of US$918M and an NPV@10% (real, after tax) of US$624M, for the base case production profile and price assumption. This provides for an internal rate of return (IRR) of 61.4% (real, before tax) and 48.7% (real, after tax).
The Project life is 32 years from first ore. The Project before tax payback occurs 3.6 years from first ore processed (4.0 years after tax).
The financial performance of the Project is summarised in Table 13.
Table 13: Key financial metrics
KEY FINANCIAL PARAMETERS UNIT LOM
IRR - after tax (%, real) 48.7%
NPV @ 10.0% - after tax (US$ M, real) 624
Capital Cost (US$ M, real) 159
Cash Costs (US$/t, real) 382
Based on this analysis, it can be concluded that the Project should continue through to the next stage of study and development.

PAGE 29 BLACKROCKMINING.COM.AU
ASX ANNOUNCEMENT 24 APRIL 2017
Project Sensitivities
A sensitivity analysis has been conducted as part of the financial analysis. Given the low capital cost, the project is relatively insensitive to capex, however remains sensitive to margin assumptions of price, grade and operating margin. The project is most sensitive to basket price by an order of magnitude, represented below. The pricing used for the Pre-Feasibility Study is highlighted.
$279m$394m
$509m$624m
$739m$854m
$969m
$375m
$516m
$657m
$798m
$939m
$1080m
$1221m
$m
$200m
$400m
$600m
$800m
$1000m
$1200m
$1400m
866 989 1113 1237 1360 1484 1608
USD$ Basket Price
Sensitivity Analysis (NPV @ 8%, 10%, after tax, real)
NPV @ 10.0% - after tax NPV @ 8.0% - after tax

PAGE 30 BLACKROCKMINING.COM.AU
ASX ANNOUNCEMENT 24 APRIL 2017
Funding
Black Rock has focussed on minimising the pre-production capital expenditure, whilst maximising phase one production to reduce operational expenditure given economies of scale. The Company believes it has found the optimum position with industry leading pre-production capex at scale and industry leading opex relative to concentrate grade.
Given these two key metrics, the Company believes it is well placed to secure necessary funding for the project. Options being actively pursued are:
1. Project finance 2. Partner financing 3. Offtake related financing 4. Equipment financing 5. Contract mining to reduce capex 6. Equity capital markets support.
The Company is confident the project is imminently fundable. The NPV10 to pre-production capex ratio of 6.5 times based on a low-end price deck, suggests it has exceptional financial metrics, and its likely lowest quartile cash cost to port is a further positive indicative on the project’s likely success.
Moving forward, the Company’s intention is to continue to pursue all funding alternatives whilst demonstrating to the financial markets a commitment to building out an appropriately qualified management team to ensure the Company has the necessary capability to design, construct and operate a graphite mine.
Project Risks
A risk assessment workshop for the Project was conducted that identified fifty-four risks, of which three were rated for “priority action” and 26 listed for “management action”. These risks reflect the current stage of development of the Company and the Project, as well as specific risks associated with characteristics of the Project itself and the graphite market more generally.
The three priority action risks identified were:
• Delays that extend beyond the anticipated window of opportunity in the marketplace
• Funding sources may not be forthcoming following a FS for FID (Finance Investment Decision)
• The market does not attach adequate value to graphite or the Company’s product. In addition to the stage of development of BKT and the Project, the ranking of risks identified reflects the company’s strategic position in the graphite market, its capital funding requirements, and issues and challenges inherent in the graphite market.
The individual issues also interact with each other in number of key respects, particularly in that market and funding risks have the greatest uncontrolled potential to delay development of the Project. Therefore, a combination of gaining access to additional capital funding and the securing of binding marketing agreements would effectively mitigate the key Priority Action risks facing the company.

PAGE 31 BLACKROCKMINING.COM.AU
ASX ANNOUNCEMENT 24 APRIL 2017
Priority Action Risks
Priority Action risks are summarised in Table 14.
Table 14: Priority Action risk summary
AREA DESCRIPTION TREATMENT STRATEGY
1 Corporate The risk is that development is
delayed beyond the
anticipated window of
opportunity in current
marketplace
Focus on development strategy & project management
Establish a realistic development schedule
Develop the project team
Produce samples for end user evaluation
Conduct detailed testing of concentrates for all end uses
Understand the long term growth potential of the LIB market
2 Corporate The risk is that funding
sources are not forthcoming
following a FS for FID (Finance
Investment Decision)
Fast track project to be a market forerunner
Seek a corner-stone investor/offtake
Differentiate the Project from others coming on-stream
Market the differentiation – low capex, high product quality, multi generational
minelife potential
Develop niche markets
Understand what financiers require
Look at alternative financing arrangements - e.g. Export Credit Facilities (export
development banks), equity
3 Corporate The risk is that the market
does not value graphite or
Black Rock's product
Demonstrate product qualities of Mahenge graphite
Focus on development of marketing strategy
expand commercial/technical/marketing capabilities
Produce bulk samples for marketing availability
Develop niche marketing strategy for product
Develop on competitive advantage & differentiation in marketing
Develop strategy to fast track project in conjunction with FS
PAGE 32 BLACKROCKMINING.COM.AU
ASX ANNOUNCEMENT 24 APRIL 2017
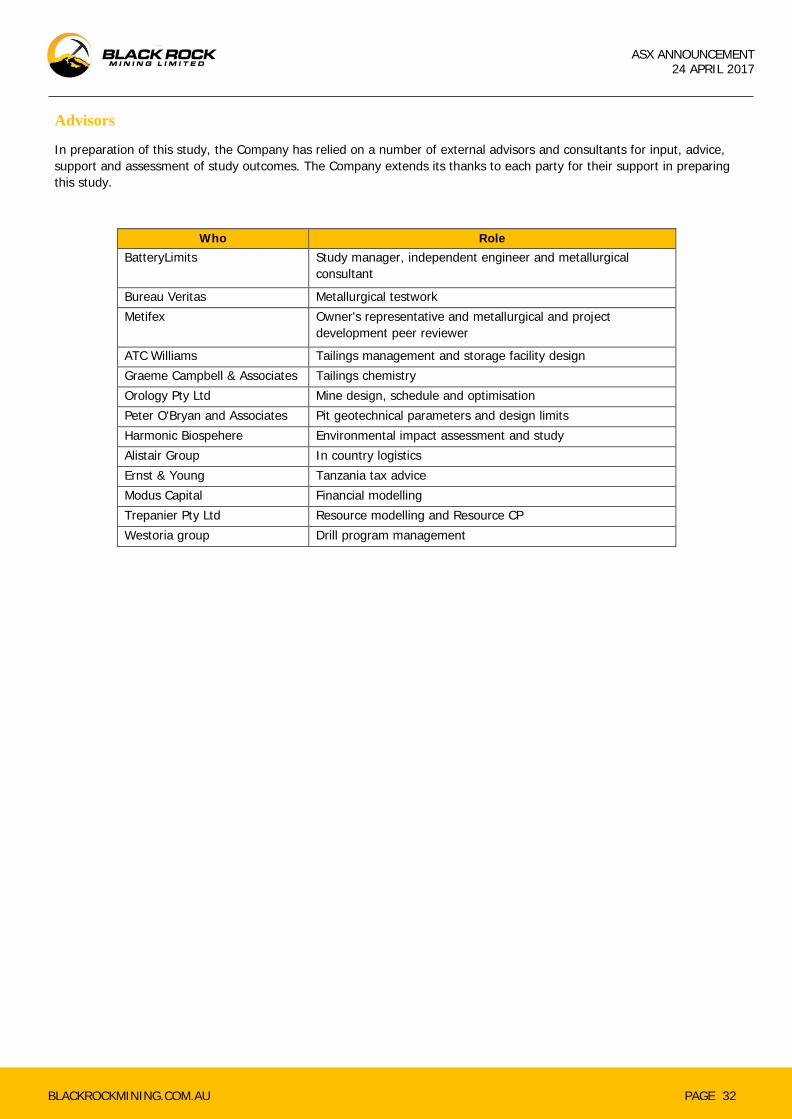
Advisors
In preparation of this study, the Company has relied on a number of external advisors and consultants for input, advice, support and assessment of study outcomes. The Company extends its thanks to each party for their support in preparing this study.
Who Role BatteryLimits Study manager, independent engineer and metallurgical
consultant Bureau Veritas Metallurgical testwork Metifex Owner's representative and metallurgical and project
development peer reviewer ATC Williams Tailings management and storage facility design Graeme Campbell & Associates Tailings chemistry Orology Pty Ltd Mine design, schedule and optimisation Peter O'Bryan and Associates Pit geotechnical parameters and design limits Harmonic Biospehere Environmental impact assessment and study Alistair Group In country logistics Ernst & Young Tanzania tax advice Modus Capital Financial modelling Trepanier Pty Ltd Resource modelling and Resource CP Westoria group Drill program management

PAGE 33 BLACKROCKMINING.COM.AU
ASX ANNOUNCEMENT 24 APRIL 2017
JORC TABLE 1,
SECTION 4

PAGE 34 BLACKROCKMINING.COM.AU
ASX ANNOUNCEMENT 24 APRIL 2017
SUMMARY OF RESOURCE ESTIMATE AND REPORTING CRITERIA
As per ASX Listing Rule 5.9 and the 2012 JORC reporting guidelines, a summary of the material information used to estimate the Mineral Resource is detailed below (for more detail please refer to JORC Table 1, Sections 1 to 3 included below.
Geology and geological interpretation
The Mahenge Mineral Resource is hosted within the rocks of the Proterozoic Mozambique Orogenic Belt that extends along the eastern border of Africa from Ethiopia, Kenya and Tanzania. It consists of high-grade mid-crustal rocks with a Neoproterozoic metamorphic overprint. The Mozambique Belt is divided into the Western Granulite and Eastern Granulite where Mahenge is situated. The Granulites are separated by flat-lying thrust zones and younger sedimentary basins of the Karoo.
The belt has undergone granulite phase metamorphism that has been subsequently retrograded to upper amphibolite facies. Structurally the Mahenge region has undergone intense deformation forming a tight poly-phase sequence of marble, mafic and felsic gneiss and graphitic schists as part of the kilometre scale Mahenge synform. The Mineral Resources are located on the western flank of the synform where the bedding and foliation dips towards the east between 60 and 80˚. The units typically strike to the north and rotate to the northeast as they wrap around the fold nose.
The geological interpretation used in this Resource estimate has been based on mapping of surface outcrop, multiple pits and trenches in conjunction with two phases of RC and DD drilling. The 3D geological wireframes were created using well defined footwall and hanging wall boundaries based primarily on changes from graphite dominated gneiss to mica or garnet gneissic units, which as expected also reflected a decrease in graphite grade. The geological wireframes were extended along strike and between areas of drilling approximately half the distance between drill sections.
Drilling techniques and hole spacing
The Mahenge estimation has been based on a combination of reverse circulation (RC) and diamond core (DD) drilling with the majority of the sample and geological data from two campaigns of RC (6inch) and DD drilling (PQ and HQ). The Company has used 100m x 100m, 100m x 50m and 50m x 50m grid drill spacing, which has been sufficient to show geological and grade continuity. The drilling has been oriented perpendicular to the mineralisation or as close to perpendicular as possible subject to drill access. The drill collars have been surveyed using a high accuracy differential global position (DGPS) measurements for the X, Y and Z co-ordinates and the Z component has been checked by draping the collar position over a high quality digital terrain model and photographic imagery flown for the Company. There is a high degree of confidence in the locations of the collars and trenches based on DGPS pick-ups and the high definition topographic and photographic survey.
Sampling and sub-sampling techniques
The trenches were sampled using 2m composites with samples taken from in-situ oxide, transition or fresh rock as a continuous chip channel sample across the trench wall. Pit samples were taken as individual point samples at the base of the pit. The surface samples weighed between 2.5 and 3.5kg. A high degree of care was taken to ensure no transported material was sampled from the trenches or pits. There was no sub-sampling from the pits or trenches.
At the drill rig the RC samples were split using a 3-tier riffle splitter to 1m intervals then composited as two x 1m samples with a combined weight of approximately 3.0kg. Samples in excess of 3kg were riffle split to reduce the weight to approximately 3kg. The calico samples bags were uniquely numbered and recorded prior to bagging in polyweave bags.

PAGE 35 BLACKROCKMINING.COM.AU
ASX ANNOUNCEMENT 24 APRIL 2017
After geological and geotechnical logging the HQ diamond core was half cored and then quarter cored; the PQ diamond core was slivered. The quarter core or sliver was composited to 2m intervals which were placed into uniquely numbered calico bags and then bagged into polyweaves. All of the polyweave bags were secured with a numbered plastic security tag prior to submission to the laboratory. There were no sub-sampling techniques past the sample dispatch from Mahenge.
Sample analysis method
The trench, RC and diamond core samples were sent to Mwanza in Tanzania for preparation and the pulps were then sent to Brisbane for carbon analysis using Total Graphitic Carbon (TGC) C-IR18 LECO Total Carbon. Graphitic C is determined by digesting sample in 50% HCl to evolve carbonate as CO2. Residue is filtered, washed, dried and then roasted at 425C. The roasted residue is analysed for carbon by high temperature Leco furnace with infrared detection. Method precision is ± 15% with a reporting limit of 0.02 to 100%.
All TGC analysis has been carried out by a certified laboratory – ALS Global. TGC is the most appropriate method to analyse for graphitic carbon and it is a total analysis. ALSC Global inserted its own standards and blanks and completed its own QAQC for each batch of samples. No failures were reported. Black Rock Mining has employed its own QA/QC strategy that involved field duplicates, blanks, insertion of certified reference material and check analysis using a secondary laboratory. The Company is satisfied that TGC results are accurate and precise and no systematic bias has been introduced.
Deleterious element analysis was also conducted using a multi-element ICP method.
Cut-off grades
Grade envelopes have been wireframed to an approximate 4% to 5% TGC cut-off allowing for continuity of the mineralised zones. Based on visual and statistical analysis of the drilling results and geological logging of the graphite rich zones, this cut-off tends to be a natural geological change and coincides with the contact between the graphite rich gneiss and the other adjacent country rocks (i.e. garnet gneisses and occasional marbles). Distinctly higher grade internal veins at Cascade were modelled at approximately a 9% to 10% allowing for continuity.
Estimation Methodology
Drilling, surface test pit, trench sampling and geological mapping data was utilised to control the interpretation of the mineralised zones. Three broader domains with three higher grade internal veins in a main domain were wireframed using Leapfrog™ software’s vein modelling tools with contacts determined by coincident geology (graphitic gneiss) and a significant increase in TGC grade (> 4-5% TGC or > 9-10% TGC for the internal higher grade veins).
Grade estimation was by Ordinary Kriging (“OK”) for Total Graphitic Carbon (TGC %) using GEOVIA Surpac™ software into the domains. The estimate was resolved into 10m (E) x 25m (N) x 10m (RL) parent cells that had been sub-celled at the domain boundaries for accurate domain volume representation. Estimation parameters were based on the variogram models, data geometry and kriging estimation statistics. Potential top-cuts were evaluated by completing an outlier analysis using a combination of methods including grade histograms, log probability plots and other statistical tools. Based on this statistical analysis of the data population, no top-cuts were required.

PAGE 36 BLACKROCKMINING.COM.AU
ASX ANNOUNCEMENT 24 APRIL 2017
Classification criteria
The Mineral Resource has been classified on the basis of confidence in the geological model, continuity of mineralised zones, drilling density, available mapping, pit sampling and trenching data, confidence in the underlying database and the available bulk density information. The Mahenge Mineral Resource in part has been classified as Measured and Indicated with the remainder as Inferred according to JORC 2012.
Minimum drill spacing for Measured Resources is 50m (northing) by 50m (easting), for Indicated Resources is 100m (northing) by 50-75m (easting) with larger drill spacing zones categorized as Inferred Resources.
Mining and metallurgical methods and parameters
Initial indications are that the Mineral Resources at Mahenge will be amendable to conventional open pit mining with low strip ratios and conventional crush, grind and flotation processing to produce a potential saleable graphite concentrate.
Metallurgical sample composites were prepared at Bureau Veritas Minerals laboratory in Perth from half cut diamond drill core from the DD drilling programmes. The representative composite samples comprise: Epanko North fresh, Epanko oxide, Ulanzi fresh and Ulanzi oxide materials. The ore composites were generated to assess the ore's amenability to beneficiation by froth flotation and also to identify the nature, flake size and occurrence of the graphite in a selection of drill core samples and flotation products. Cascades oxide and primary mineralisation has been tested with similar results to that of Ulanzi mineralisation.
Preliminary metallurgical test work on the oxide and primary mineralisation at Ulanzi and Epanko north has consistently returned up to 99% TGC concentrates.
• High purity and coarse flake concentrate made from a straightforward four-stage flotation process
• Independent expandable graphite testing indicates that Mahenge concentrates are highly suitable for this application with superior expansion ratios to current Chinese expandable graphite on the market
• Independent spherical graphite test work indicates that Mahenge concentrates can meet/exceed battery grade graphite specifications with conventional processing and purification methods. Acid purification of spherical graphite has returned up to 99.98% TGC and thermal purification has returned > 99.999% assays.
Composite oxide samples from Cascades have been tested, confirming similar metallurgical results to Ulanzi. Core samples from cascades are being tested to confirm concentrate grades from primary mineralised zones. Results to date indicate that Cascades mineralisation performs remarkably similar to that of Ulanzi and Epanko North. A 120t bulk sample of Ulanzi and Cascades oxide and primary mineralisation is being delivered to a metallurgical testing facility for bulk flotation and pilot scale processing. This programme will be completed in Q1 2017 and will deliver an optimised processing flowsheet for equipment selection.
The Company believes that the combination of large tonnage, high graphite grades, potential low cost mining and conventional processing, the Mahenge Project could produce a saleable graphite concentrate and shows good potential for economic development
PAGE 37 BLACKROCKMINING.COM.AU
ASX ANNOUNCEMENT 24 APRIL 2017
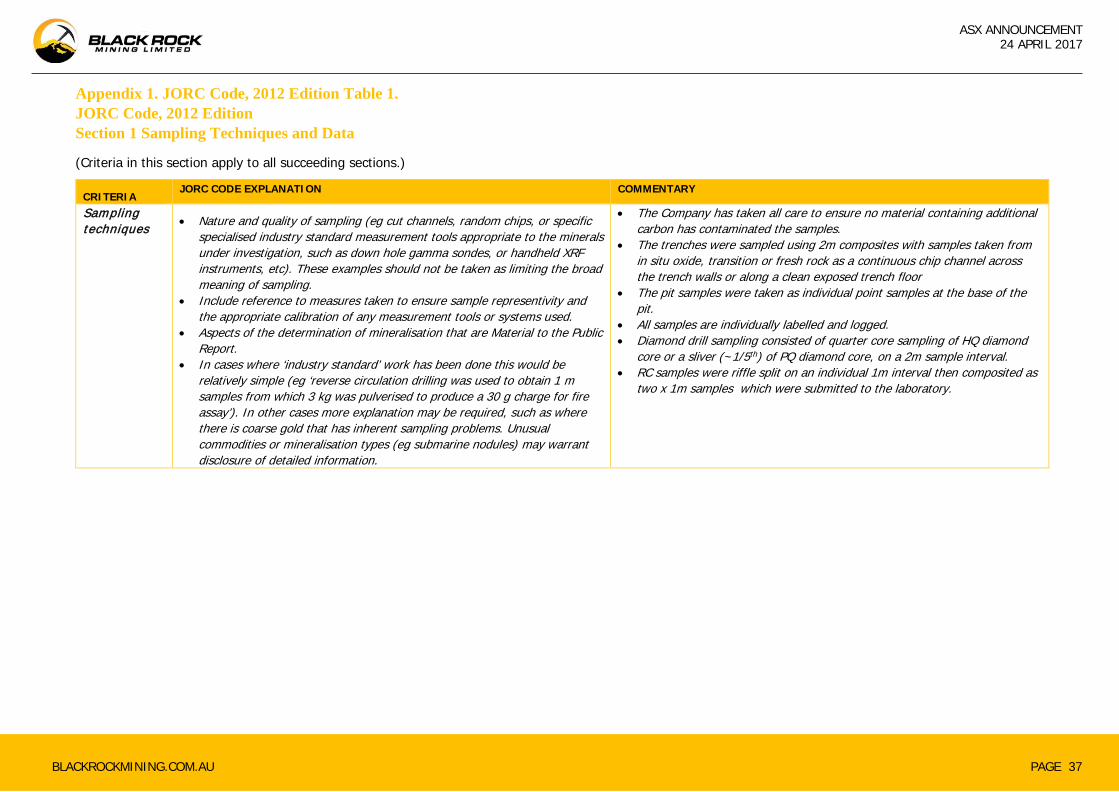
Appendix 1. JORC Code, 2012 Edition Table 1. JORC Code, 2012 Edition Section 1 Sampling Techniques and Data
(Criteria in this section apply to all succeeding sections.)
CRITERIA JORC CODE EXPLANATION COMMENTARY
Sampling techniques • Nature and quality of sampling (eg cut channels, random chips, or specific
specialised industry standard measurement tools appropriate to the minerals under investigation, such as down hole gamma sondes, or handheld XRF instruments, etc). These examples should not be taken as limiting the broad meaning of sampling.
• Include reference to measures taken to ensure sample representivity and the appropriate calibration of any measurement tools or systems used.
• Aspects of the determination of mineralisation that are Material to the Public Report.
• In cases where ‘industry standard’ work has been done this would be relatively simple (eg ‘reverse circulation drilling was used to obtain 1 m samples from which 3 kg was pulverised to produce a 30 g charge for fire assay’). In other cases more explanation may be required, such as where there is coarse gold that has inherent sampling problems. Unusual commodities or mineralisation types (eg submarine nodules) may warrant disclosure of detailed information.
• The Company has taken all care to ensure no material containing additional carbon has contaminated the samples.
• The trenches were sampled using 2m composites with samples taken from in situ oxide, transition or fresh rock as a continuous chip channel across the trench walls or along a clean exposed trench floor
• The pit samples were taken as individual point samples at the base of the pit.
• All samples are individually labelled and logged. • Diamond drill sampling consisted of quarter core sampling of HQ diamond
core or a sliver (~1/5th) of PQ diamond core, on a 2m sample interval. • RC samples were riffle split on an individual 1m interval then composited as
two x 1m samples which were submitted to the laboratory.

PAGE 38 BLACKROCKMINING.COM.AU
ASX ANNOUNCEMENT 24 APRIL 2017
CRITERIA JORC CODE EXPLANATION COMMENTARY
Drill ing techniques • Drill type (eg core, reverse circulation, open-hole hammer, rotary air blast,
auger, Bangka, sonic, etc) and details (eg core diameter, triple or standard tube, depth of diamond tails, face-sampling bit or other type, whether core is oriented and if so, by what method, etc).
• Both diamond core (HQ and PQ single tube) and reverse circulation (6” face sampling) drilling methods have been used. All core is oriented using a spear or ACT back-end orientation device.
Drill sample recovery • Method of recording and assessing core and chip sample recoveries and
results assessed. • Measures taken to maximise sample recovery and ensure representative
nature of the samples. • Whether a relationship exists between sample recovery and grade and
whether sample bias may have occurred due to preferential loss/gain of fine/coarse material.
• Diamond drill sample recoveries have been measured for all holes and found to be acceptable. Method was linear metre core recovery for every meter drilled.
• RC recoveries were estimated by measuring the weight of every 1m interval. Grade /recovery correlation was found to be acceptable.
• Twin hole comparison of RC vs Diamond indicates that no sample bias has occurred for graphite.
Logging • Whether core and chip samples have been geologically and geotechnically
logged to a level of detail to support appropriate Mineral Resource estimation, mining studies and metallurgical studies.
• Whether logging is qualitative or quantitative in nature. Core (or costean, channel, etc) photography.
• The total length and percentage of the relevant intersections logged.
• Pits and trenches were logged for geology and structures, and photographs were also recorded for the trench samples.
• All drill holes have been comprehensively logged for lithology, mineralisation, recoveries, orientation, structure and RQD (core). All drill holes have been photographed. Sawn diamond core has been retained for a record in core trays. RC chips stored in both chip trays and 1-3kg individual metre samples as a record.
Sub-sampling techniques and sample preparation
• If core, whether cut or sawn and whether quarter, half or all core taken. • If non-core, whether riffled, tube sampled, rotary split, etc and whether
sampled wet or dry. • For all sample types, the nature, quality and appropriateness of the sample
preparation technique. • Quality control procedures adopted for all sub-sampling stages to maximise
representivity of samples. • Measures taken to ensure that the sampling is representative of the in situ
material collected, including for instance results for field duplicate/second-half sampling.
• Whether sample sizes are appropriate to the grain size of the material being sampled.
• The pit and trench samples were not sub sampled. • HQ diamond core samples were halved with one half then quartered. A
quarter core sample was taken for laboratory analysis. The remaining quarter core sample is retained for a record and a half core sample retained for metallurgical testwork. PQ diamond core was slivered with a core saw and the sliver (~20%) taken for laboratory analysis. The remaining core was retained for metallurgical testwork and for a record.
• RC samples were collected for every down-hole metre in a separate RC bag. Each metre sample was split through a three-tier riffle splitter and a 1.5kg sample taken of each metre. Two one-metre samples, totalling 3kg in weight were composited for assay submission. Field duplicates were taken to test precision up to the compositing and splitting stage.
• Sample sizes for all medium (i.e. trenches, pits, DD and RC drilling) were appropriate for this style of graphite mineralisation.
•
PAGE 39 BLACKROCKMINING.COM.AU
ASX ANNOUNCEMENT 24 APRIL 2017
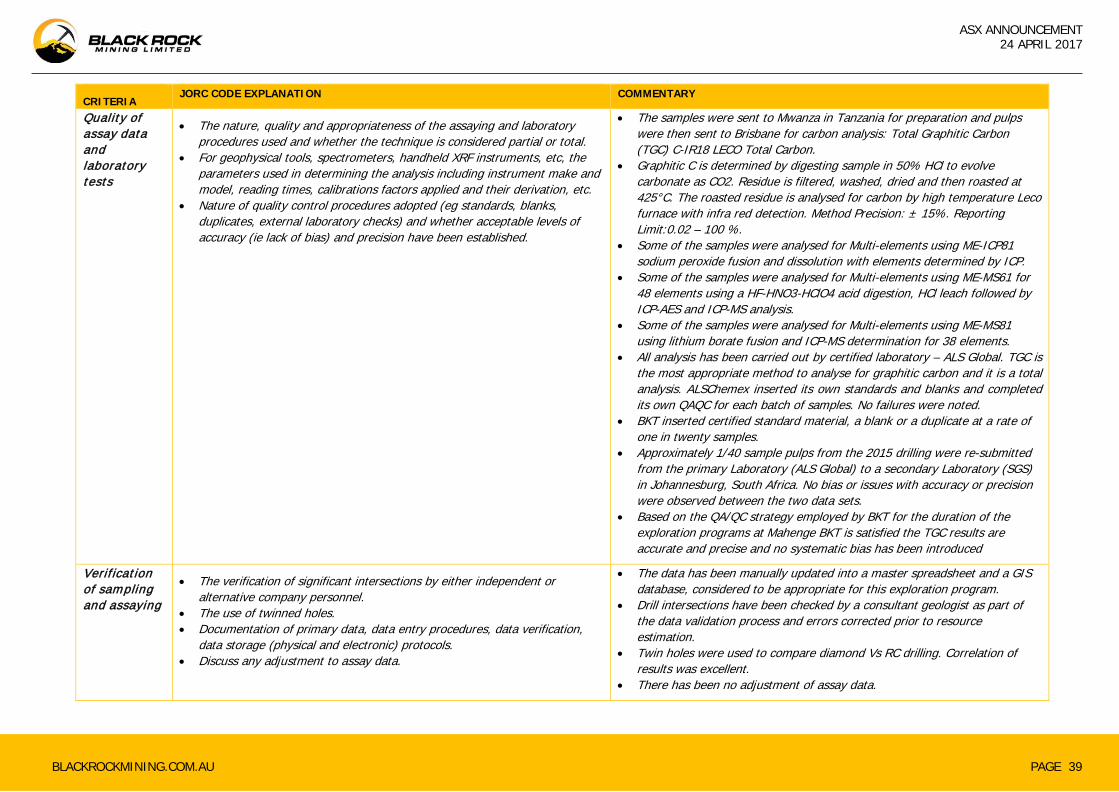
CRITERIA JORC CODE EXPLANATION COMMENTARY
Quality of assay data and laboratory tests
• The nature, quality and appropriateness of the assaying and laboratory procedures used and whether the technique is considered partial or total.
• For geophysical tools, spectrometers, handheld XRF instruments, etc, the parameters used in determining the analysis including instrument make and model, reading times, calibrations factors applied and their derivation, etc.
• Nature of quality control procedures adopted (eg standards, blanks, duplicates, external laboratory checks) and whether acceptable levels of accuracy (ie lack of bias) and precision have been established.
• The samples were sent to Mwanza in Tanzania for preparation and pulps were then sent to Brisbane for carbon analysis: Total Graphitic Carbon (TGC) C-IR18 LECO Total Carbon.
• Graphitic C is determined by digesting sample in 50% HCl to evolve carbonate as CO2. Residue is filtered, washed, dried and then roasted at 425°C. The roasted residue is analysed for carbon by high temperature Leco furnace with infra red detection. Method Precision: ± 15%. Reporting Limit:0.02 – 100 %.
• Some of the samples were analysed for Multi-elements using ME-ICP81 sodium peroxide fusion and dissolution with elements determined by ICP.
• Some of the samples were analysed for Multi-elements using ME-MS61 for 48 elements using a HF-HNO3-HClO4 acid digestion, HCl leach followed by ICP-AES and ICP-MS analysis.
• Some of the samples were analysed for Multi-elements using ME-MS81 using lithium borate fusion and ICP-MS determination for 38 elements.
• All analysis has been carried out by certified laboratory – ALS Global. TGC is the most appropriate method to analyse for graphitic carbon and it is a total analysis. ALSChemex inserted its own standards and blanks and completed its own QAQC for each batch of samples. No failures were noted.
• BKT inserted certified standard material, a blank or a duplicate at a rate of one in twenty samples.
• Approximately 1/40 sample pulps from the 2015 drilling were re-submitted from the primary Laboratory (ALS Global) to a secondary Laboratory (SGS) in Johannesburg, South Africa. No bias or issues with accuracy or precision were observed between the two data sets.
• Based on the QA/QC strategy employed by BKT for the duration of the exploration programs at Mahenge BKT is satisfied the TGC results are accurate and precise and no systematic bias has been introduced
Verification of sampling and assaying
• The verification of significant intersections by either independent or alternative company personnel.
• The use of twinned holes. • Documentation of primary data, data entry procedures, data verification,
data storage (physical and electronic) protocols. • Discuss any adjustment to assay data.
• The data has been manually updated into a master spreadsheet and a GIS database, considered to be appropriate for this exploration program.
• Drill intersections have been checked by a consultant geologist as part of the data validation process and errors corrected prior to resource estimation.
• Twin holes were used to compare diamond Vs RC drilling. Correlation of results was excellent.
• There has been no adjustment of assay data.

PAGE 40 BLACKROCKMINING.COM.AU
ASX ANNOUNCEMENT 24 APRIL 2017
CRITERIA JORC CODE EXPLANATION COMMENTARY
Location of data points • Accuracy and quality of surveys used to locate drill holes (collar and down-
hole surveys), trenches, mine workings and other locations used in Mineral Resource estimation.
• Specification of the grid system used. • Quality and adequacy of topographic control.
• A handheld GPS was used to identify the positions of the pits in the field. • The handheld GPS has an accuracy of +/- 5m. • The datum used is: WGS84, zone 37 south. • Drill collars have been surveyed with a DGPS for sub-metre accuracy for the
X, Y and Z components and the Ulanzi, Cascade and Epanko North prospects have been surveyed with a high resolution aerial drone to generate an accurate contour map and high resolution photo image. The Z component has also been checked by draping the collar position over a high quality digital terrain model and comparing to the DGPS Z reading.
• The locations and RLs of the trenches have been checked using the detailed aerial/topo survey and modified accordingly for both x/y and z components.
• BKT is satisfied the location of trenches, pits and drill holes have been located with a high degree of accuracy.
Data spacing and distribution
• Data spacing for reporting of Exploration Results. • Whether the data spacing and distribution is sufficient to establish the
degree of geological and grade continuity appropriate for the Mineral Resource and Ore Reserve estimation procedure(s) and classifications applied.
• Whether sample compositing has been applied.
• Data spacing and distribution is considered to be appropriate for the estimation of a Mineral Resource.
• The company has used 100 x 100m or 100 x 50m or 50 x 50m grid spacing which has been sufficient to show geological and grade continuity.
• The drill spacing is appropriate for Resource Estimation. • No further sample compositing has been applied post the sub-sampling
stage.
Orientation of data in relation to geological structure
• Whether the orientation of sampling achieves unbiased sampling of possible structures and the extent to which this is known, considering the deposit type.
• If the relationship between the drilling orientation and the orientation of key mineralised structures is considered to have introduced a sampling bias, this should be assessed and reported if material.
• Drilling is oriented perpendicular to mineralisation or as close to perpendicular to mineralisation as possible.
• The orientation of the drill direction has not introduced a sample bias.

PAGE 41 BLACKROCKMINING.COM.AU
ASX ANNOUNCEMENT 24 APRIL 2017
CRITERIA JORC CODE EXPLANATION COMMENTARY
Sample security • The measures taken to ensure sample security. • The samples were taken under the supervision of an experienced geologist
employed as a consultant to BKT. • The samples were transferred under BKT supervision from site to the local
town of Mahenge where the samples were then transported from Mahenge to Dar es Salaam and then transported to Mwanza where they were inspected and then delivered directly to the ALS Global process facility.
• Chain of custody protocols were observed to ensure the samples were not tampered with post-sampling and until delivery to the laboratory for preparation and analysis.
• Tamper proof plastic security tags were fastened to the samples bags. No evidence of sample tampering was reported by the receiving laboratory.
• Transport of the pulps from Tanzania to Australia was under the supervision of ALS Global.
Audits or reviews • The results of any audits or reviews of sampling techniques and data. • Trenching and drilling information collected by BKT has been evaluated for
sampling techniques, appropriateness of methods and data accuracy by an external geological consultant.

PAGE 42 BLACKROCKMINING.COM.AU
ASX ANNOUNCEMENT 24 APRIL 2017
Section 2 Reporting of Exploration Results
CRITERIA JORC CODE EXPLANATION COMMENTARY Mineral tenement and land tenure status
• Type, reference name/number, location and own • • ership including agreements or material issues with third parties such as joint
ventures, partnerships, overriding royalties, native title interests, historical sites, wilderness or national park and environmental settings.
• The security of the tenure held at the time of reporting along with any known impediments to obtaining a licence to operate in the area.
• The sampling was undertaken on granted license PL 7802/2012. • It has an area of 293km2. • The license is 100% owned by BKT. • Landowners of nearby villages are supportive of the recently completed
sampling and exploration program.
Exploration done by other parties
• Acknowledgment and appraisal of exploration by other parties. • Previous explorers completed some limited RC drilling and rockchip sampling but the original data has not been located apart from what has been announced via ASX releases by Kibaran Resources during 2011 and 2013.
Geology • Deposit type, geological setting and style of mineralisation. • The deposit type is described as schist hosted flaky graphite.
• The mineralisation is hosted within upper amphibolite facies gneiss of the Mozambique Mobile Belt.
• Over 95% of the exposures within the tenement comprise 3 main rock types that include alternating sequences of:
• Graphitic schist – feldspar and quartz rich varieties. • Marble and, • Biotite and hornblende granulites. • Less common rock types include quartzite.

PAGE 43 BLACKROCKMINING.COM.AU
ASX ANNOUNCEMENT 24 APRIL 2017
CRITERIA JORC CODE EXPLANATION COMMENTARY Drill hole Information • A summary of all information material to the understanding of the exploration
results including a tabulation of the following information for all Material drill holes: o easting and northing of the drill hole collar o elevation or RL (Reduced Level – elevation above sea level in metres) of
the drill hole collar o dip and azimuth of the hole o down hole length and interception depth o hole length.
• If the exclusion of this information is justified on the basis that the information is not Material and this exclusion does not detract from the understanding of the report, the Competent Person should clearly explain why this is the case.
• A summary of all material drill intervals are provided in Appendix 1.
Data aggregation methods
• In reporting Exploration Results, weighting averaging techniques, maximum and/or minimum grade truncations (eg cutting of high grades) and cut-off grades are usually Material and should be stated.
• Where aggregate intercepts incorporate short lengths of high grade results and longer lengths of low grade results, the procedure used for such aggregation should be stated and some typical examples of such aggregations should be shown in detail.
• The assumptions used for any reporting of metal equivalent values should be clearly stated.
• Exploration results have been reported as weighted averages allowing up to 2m of internal waste and minimum grades at 5% TGC.
• No maximum or top- cutting was applied during the calculation of drill holes intersects.
• Drill intervals are provided in Appendix 1.
Relationship between mineralisation w idths and intercept lengths
• These relationships are particularly important in the reporting of Exploration Results.
• If the geometry of the mineralisation with respect to the drill hole angle is known, its nature should be reported.
• If it is not known and only the down hole lengths are reported, there should be a clear statement to this effect (eg ‘down hole length, true width not known’).
• Drill hole results are reported as down-hole metres. • Sufficient drilling, mapping and trenching has been completed at the main
prospects to understand the orientation of mineralised lodes. A range of drill holes angles were used during the exploration program with the majority drilled at -60˚ (refer to Appendix 1).

PAGE 44 BLACKROCKMINING.COM.AU
ASX ANNOUNCEMENT 24 APRIL 2017
(Criteria listed in the preceding section also apply to this section.)
CRITERIA JORC CODE EXPLANATION COMMENTARY Diagrams • Appropriate maps and sections (with scales) and tabulations of intercepts
should be included for any significant discovery being reported These should include, but not be limited to a plan view of drill hole collar locations and appropriate sectional views.
• Figures show plan location of drill holes, appropriately scaled and referenced. • Refer to images in the main body of the text
Balanced reporting
• Where comprehensive reporting of all Exploration Results is not practicable, representative reporting of both low and high grades and/or widths should be practiced to avoid misleading reporting of Exploration Results.
• All drill holes have been reported in their entirety. • All drilling results have been reported in past Exploration announcements.
Other substantive exploration data
• Other exploration data, if meaningful and material, should be reported including (but not limited to): geological observations; geophysical survey results; geochemical survey results; bulk samples – size and method of treatment; metallurgical test results; bulk density, groundwater, geotechnical and rock characteristics; potential deleterious or contaminating substances.
• 1 in 10 samples from the first drill programme were assayed for deleterious elements using a 40 element ICP method. No deleterious elements were observed, with background (low) levels of uranium and thorium.
• 1,078 bulk density measurements using the water displacement method from the oxide (limited) transitional and fresh zones.
• The samples for the bulk density measurements were taken from diamond drill core.
• Every diamond hole drilled used in this Resource Estimate has had intervals tested for bulk density generating a high quality dataset.
Further work • The nature and scale of planned further work (eg tests for lateral extensions or depth extensions or large-scale step-out drilling).
• Diagrams clearly highlighting the areas of possible extensions, including the main geological interpretations and future drilling areas, provided this information is not commercially sensitive.
• Additional drilling is was conducted in the second half of 2016 to define further extensions of mineralisation at Cascades, with the intention of defining additional high grade, near surface resources
• Ongoing metallurgical testwork – flotation and particle size optimization. • Additional bulk density testwork is planned, particularly focused on the oxide
and transition material.

PAGE 45 BLACKROCKMINING.COM.AU
ASX ANNOUNCEMENT 24 APRIL 2017
Section 3 Estimation and Reporting of Mineral Resources (Criteria listed in section 1, and where relevant in section 2, also apply to this section.)
CRITERIA JORC CODE EXPLANATION COMMENTARY
Database integrity
• Measures taken to ensure that data has not been corrupted by, for example, transcription or keying errors, between its initial collection and its use for Mineral Resource estimation purposes.
• Data validation procedures used.
• The drillhole database was compiled by BKT as Excel spreadsheets. • Maps, lithology, drill holes, trenches and test pit samples were also
supplied for use in GIS format (Mapinfo/Discover) and Excel spreadsheets.
• The data have then been imported into a relational SQL Server database using DataShed™ (industry standard drillhole database management software).
• The data are constantly audited and any discrepancies checked by BKT personnel before being updated in the database.
• Normal data validation checks were completed on import to the SQL database and when viewing in Surpac and Leapfrog.
Site visits • Comment on any site visits undertaken by the Competent Person and the outcome of those visits.
• If no site visits have been undertaken indicate why this is the case.
• Steven Tambanis, Competent Person, has regularly worked on site from July 2014 to present, covering all aspects of work from early exploration through to the current drilling.
• Aidan Platel, Competent Person, completed a site visit in August 2016 covering all aspects of site work for the current drilling program.
•
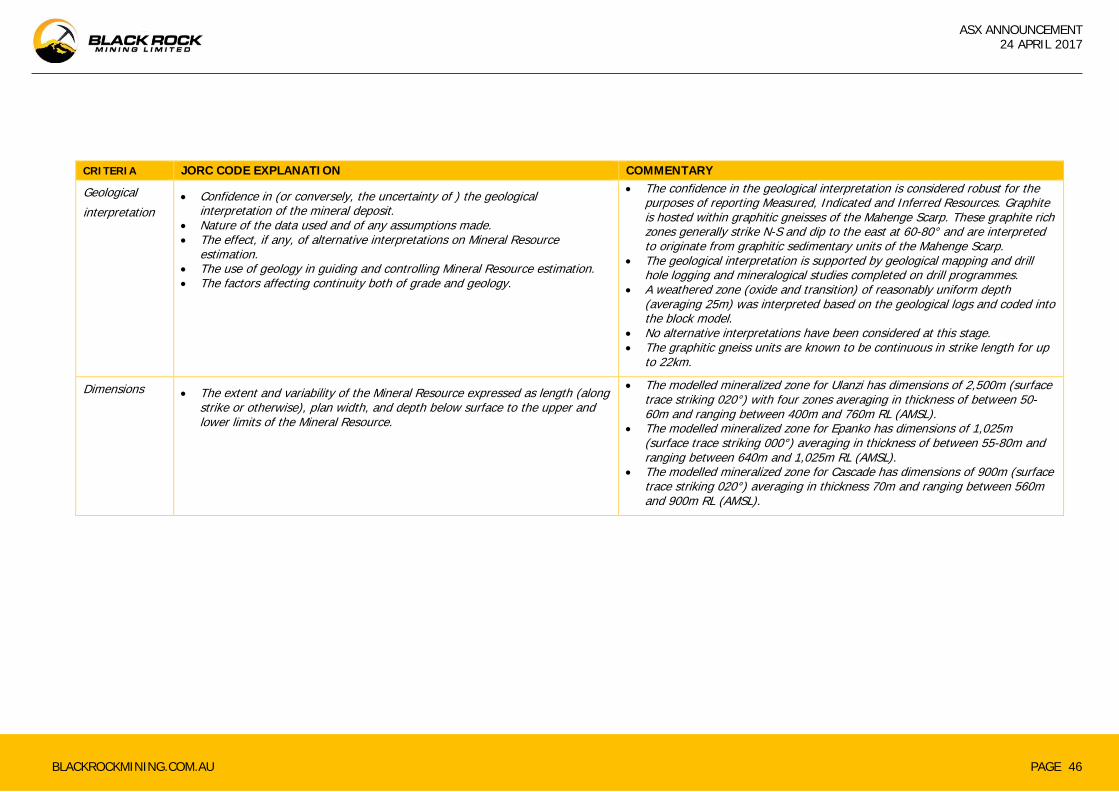
PAGE 46 BLACKROCKMINING.COM.AU
ASX ANNOUNCEMENT 24 APRIL 2017
CRITERIA JORC CODE EXPLANATION COMMENTARY Geological interpretation
• Confidence in (or conversely, the uncertainty of ) the geological interpretation of the mineral deposit.
• Nature of the data used and of any assumptions made. • The effect, if any, of alternative interpretations on Mineral Resource
estimation. • The use of geology in guiding and controlling Mineral Resource estimation. • The factors affecting continuity both of grade and geology.
• The confidence in the geological interpretation is considered robust for the purposes of reporting Measured, Indicated and Inferred Resources. Graphite is hosted within graphitic gneisses of the Mahenge Scarp. These graphite rich zones generally strike N-S and dip to the east at 60-80° and are interpreted to originate from graphitic sedimentary units of the Mahenge Scarp.
• The geological interpretation is supported by geological mapping and drill hole logging and mineralogical studies completed on drill programmes.
• A weathered zone (oxide and transition) of reasonably uniform depth (averaging 25m) was interpreted based on the geological logs and coded into the block model.
• No alternative interpretations have been considered at this stage. • The graphitic gneiss units are known to be continuous in strike length for up
to 22km.
Dimensions • The extent and variability of the Mineral Resource expressed as length (along strike or otherwise), plan width, and depth below surface to the upper and lower limits of the Mineral Resource.
• The modelled mineralized zone for Ulanzi has dimensions of 2,500m (surface trace striking 020°) with four zones averaging in thickness of between 50-60m and ranging between 400m and 760m RL (AMSL).
• The modelled mineralized zone for Epanko has dimensions of 1,025m (surface trace striking 000°) averaging in thickness of between 55-80m and ranging between 640m and 1,025m RL (AMSL).
• The modelled mineralized zone for Cascade has dimensions of 900m (surface trace striking 020°) averaging in thickness 70m and ranging between 560m and 900m RL (AMSL).

PAGE 47 BLACKROCKMINING.COM.AU
ASX ANNOUNCEMENT 24 APRIL 2017
CRITERIA JORC CODE EXPLANATION COMMENTARY
Estimation and modelling techniques
• The nature and appropriateness of the estimation technique(s) applied and key assumptions, including treatment of extreme grade values, domaining, interpolation parameters and maximum distance of extrapolation from data points. If a computer assisted estimation method was chosen include a description of computer software and parameters used.
• The availability of check estimates, previous estimates and/or mine production records and whether the Mineral Resource estimate takes appropriate account of such data.
• The assumptions made regarding recovery of by-products. • Estimation of deleterious elements or other non-grade variables of economic
significance (eg sulphur for acid mine drainage characterisation). • In the case of block model interpolation, the block size in relation to the average
sample spacing and the search employed. • Any assumptions behind modelling of selective mining units. • Any assumptions about correlation between variables. • Description of how the geological interpretation was used to control the resource
estimates. • Discussion of basis for using or not using grade cutting or capping. • The process of validation, the checking process used, the comparison of model
data to drill hole data, and use of reconciliation data if available.
• Grade estimation using Ordinary Kriging (OK) was completed using Geovia Surpac™ software for TGC (%).
• Drill spacing typically ranges from 50m to 100m. • Drillhole samples were flagged with wireframed domain codes. Sample data was
composited for TGC to 2m using a best fit method with a minimum of 50% of the required interval to make a composite. These were combined with 2m spaced trench samples plus individual 50m by 50m spaced base of test pit assays.
• Potential influences of extreme sample distribution outliers were investigated to determine whether they needed to be reduced by top-cutting on a domain basis. The investigation used a combination of methods including grade histograms, log probability plots and statistical tools. Based on this, it was determined that some top cuts were required. The four Ulanzi domains were top-cut between 16.0% and 17.6% TGC. No top-cuts were required at Cascade.
• Directional variograms were modelled by domain using traditional variograms. Nugget values for TGC are low to moderate (around 15 to 30%) and structure ranges up to 270m.
• Block model was constructed with parent blocks of 10m (E) by 25m (N) by 10m (RL) and sub-blocked to 5m (E) by 12.5m (N) by 5m (RL). All estimation was completed to the parent cell size. Discretisation was set to 5 by 5 by 2 for all domains.
• Three estimation passes were used with differing distances at Epanko vs. Ulanzi and Cascade. This was done due to a tighter drill spacing at Epanko and Cascade. At Ulanzi , the first pass had a limit of 150m, the second pass 300m and the third pass searching a large distance to fill the blocks within the wireframed zones. At Epanko and Cascade, the first pass had a limit of 75m, the second pass 150m and the third pass searching a large distance to fill the blocks within the wireframed zones. Each pass used a maximum of 24 samples, a minimum of 8 samples and maximum per hole of 5 samples.
• Search ellipse sizes were based primarily on a combination of the variography and the trends of the wireframed mineralized zones. Hard boundaries were applied between all estimation domains.
• Validation of the block model included a volumetric comparison of the resource wireframes to the block model volumes. Validation of the grade estimate included comparison of block model grades to the declustered input composite grades plus swath plot comparison by easting, northing and elevation. Visual comparisons of input composite grades vs. block model grades were also completed.

PAGE 48 BLACKROCKMINING.COM.AU
ASX ANNOUNCEMENT 24 APRIL 2017
CRITERIA JORC CODE EXPLANATION COMMENTARY
Moisture • Whether the tonnages are estimated on a dry basis or with natural moisture, and the method of determination of the moisture content.
• Tonnes are estimated on a dry basis.
Cut-off parameters
• The basis of the adopted cut-off grade(s) or quality parameters applied. • Grade envelopes have been wireframed to an approximate 4 to 5% TGC cut-off allowing for continuity of the mineralised zones. Based on visual and statistical analysis of the drilling results and geological logging of the graphite rich zones, this cut-off tends to be a natural geological change and coincides with the contact between the graphite rich gneiss and the other adjacent country rocks (i.e. garnet gneisses and occasional marbles).
Mining factors or assumptions
• Assumptions made regarding possible mining methods, minimum mining dimensions and internal (or, if applicable, external) mining dilution. It is always necessary as part of the process of determining reasonable prospects for eventual economic extraction to consider potential mining methods, but the assumptions made regarding mining methods and parameters when estimating Mineral Resources may not always be rigorous. Where this is the case, this should be reported with an explanation of the basis of the mining assumptions made.
• As graphite mineralisation is consistent along strike, has consistent widths and outcrops on steep ridges or ridge slopes (indicating low strip ratios), open pit mining methods are assumed.
Metallurgical factors or assumptions
• The basis for assumptions or predictions regarding metallurgical amenability. It is always necessary as part of the process of determining reasonable prospects for eventual economic extraction to consider potential metallurgical methods, but the assumptions regarding metallurgical treatment processes and parameters made when reporting Mineral Resources may not always be rigorous. Where this is the case, this should be reported with an explanation of the basis of the metallurgical assumptions made.
• BatteryLimits Pty Ltd has managed a comprehensive metallurgical test work programme in Perth, using BV laboratories to conduct the test work. Rock types sampled consist of oxide and primary mineralisation at Epanko North and Ulanzi plus oxide mineralisation at Cascades. Cascades primary mineralisation is being tested. These samples (taken as surface outcrop and diamond core) are considered to be representative of the mineralised zones.
• All rock types tested from both lodes have returned high quality concentrates with coarse flake sizing and high purities.
• Refer to earlier ASX announcements.
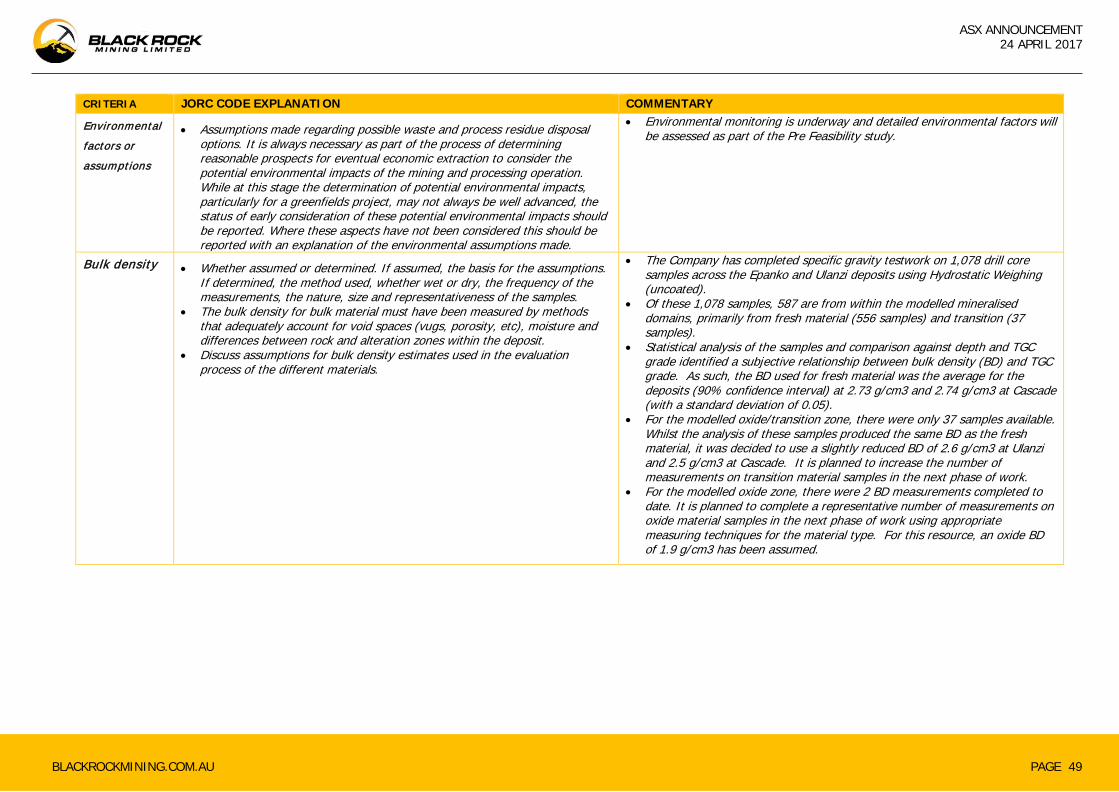
PAGE 49 BLACKROCKMINING.COM.AU
ASX ANNOUNCEMENT 24 APRIL 2017
CRITERIA JORC CODE EXPLANATION COMMENTARY
Environmental factors or assumptions
• Assumptions made regarding possible waste and process residue disposal options. It is always necessary as part of the process of determining reasonable prospects for eventual economic extraction to consider the potential environmental impacts of the mining and processing operation. While at this stage the determination of potential environmental impacts, particularly for a greenfields project, may not always be well advanced, the status of early consideration of these potential environmental impacts should be reported. Where these aspects have not been considered this should be reported with an explanation of the environmental assumptions made.
• Environmental monitoring is underway and detailed environmental factors will be assessed as part of the Pre Feasibility study.
Bulk density • Whether assumed or determined. If assumed, the basis for the assumptions. If determined, the method used, whether wet or dry, the frequency of the measurements, the nature, size and representativeness of the samples.
• The bulk density for bulk material must have been measured by methods that adequately account for void spaces (vugs, porosity, etc), moisture and differences between rock and alteration zones within the deposit.
• Discuss assumptions for bulk density estimates used in the evaluation process of the different materials.
• The Company has completed specific gravity testwork on 1,078 drill core samples across the Epanko and Ulanzi deposits using Hydrostatic Weighing (uncoated).
• Of these 1,078 samples, 587 are from within the modelled mineralised domains, primarily from fresh material (556 samples) and transition (37 samples).
• Statistical analysis of the samples and comparison against depth and TGC grade identified a subjective relationship between bulk density (BD) and TGC grade. As such, the BD used for fresh material was the average for the deposits (90% confidence interval) at 2.73 g/cm3 and 2.74 g/cm3 at Cascade (with a standard deviation of 0.05).
• For the modelled oxide/transition zone, there were only 37 samples available. Whilst the analysis of these samples produced the same BD as the fresh material, it was decided to use a slightly reduced BD of 2.6 g/cm3 at Ulanzi and 2.5 g/cm3 at Cascade. It is planned to increase the number of measurements on transition material samples in the next phase of work.
• For the modelled oxide zone, there were 2 BD measurements completed to date. It is planned to complete a representative number of measurements on oxide material samples in the next phase of work using appropriate measuring techniques for the material type. For this resource, an oxide BD of 1.9 g/cm3 has been assumed.

PAGE 50 BLACKROCKMINING.COM.AU
ASX ANNOUNCEMENT 24 APRIL 2017
CRITERIA JORC CODE EXPLANATION COMMENTARY
Classification • The basis for the classification of the Mineral Resources into varying confidence categories.
• Whether appropriate account has been taken of all relevant factors (ie relative confidence in tonnage/grade estimations, reliability of input data, confidence in continuity of geology and metal values, quality, quantity and distribution of the data).
• Whether the result appropriately reflects the Competent Person’s view of the deposit.
• The Mineral Resource has been classified on the basis of confidence in the geological model, continuity of mineralised zones, drilling density, confidence in the underlying database and the available bulk density information. Maximum drill spacing for Measured Resource classification is 50m (northing) by 50m (easting). Indicated Resource classification is 100m (northing) by 50-75m (easting). Wider drill spacing is categorised into the Inferred Resources.
• All factors considered; the resource estimate has in part been assigned to Measured and Indicated with the remainder as Inferred Resources.
• The result reflects the Competent Person’s view of the deposit.
Audits or reviews
• The results of any audits or reviews of Mineral Resource estimates. • Whilst Mr. Barnes (Competent Person) is considered Independent of the Company, no third party review has been conducted.
Discussion of relative accuracy/ confidence
• • •
Where appropriate a statement of the relative accuracy and confidence level in the Mineral Resource estimate using an approach or procedure deemed appropriate by the Competent Person. For example, the application of statistical or geostatistical procedures to quantify the relative accuracy of the resource within stated confidence limits, or, if such an approach is not deemed appropriate, a qualitative discussion of the factors that could affect the relative accuracy and confidence of the estimate.
• The statement should specify whether it relates to global or local estimates, and, if local, state the relevant tonnages, which should be relevant to technical and economic evaluation. Documentation should include assumptions made and the procedures used.
• These statements of relative accuracy and confidence of the estimate should be compared with production data, where available.
• The relative accuracy of the Mineral Resource estimate is reflected in the reporting of the Mineral Resources as per the guidelines of the 2012 JORC Code.
• The statement relates to global estimates of tonnes and grade.

PAGE 51 BLACKROCKMINING.COM.AU
ASX ANNOUNCEMENT 24 APRIL 2017
Table 1 – JORC Table 1, Section 4
ESTIMATION AND REPORTING OF ORE RESERVES
CRITERIA EXPLANATION COMMENTARY
Mineral Resource estimate for conversion to Ore Reserves
Description of the Mineral Resource estimate used as a basis for the conversion to an Ore Reserve.
The Mahenge Project includes the Ulanzi, Cascade and Epanko North deposits. Resource estimate updates for Ulanzi (October 2016) and Cascade (December 2016) were prepared by Mr Lauritz Barnes (Trepanier Pty Ltd), the competent person for these resource estimations At a cut-off grade of 3.0% Total Graphitic Carbon (TGC) the Ulanzi resource contains 111.4Mt of Measured, Indicated and Inferred materials with an average grade of 8.2% TGC. At a cut-off grade of 3.0% TGC Cascades contains 52.8Mt of Measured, Indicated and Inferred materials with an average grade of 8.3% TGC. The Measured and Indicated proportions of these two resources were used as a basis for the conversion to the Ore Reserve. Epanko North resource has been excluded from the Pre-Feasibility Study (PFS) and is not represented in the Reserve estimate.
Clear statement as to whether the Mineral Resources are reported additional to, or inclusive of, the Ore Reserves.
The Mineral Resources are reported inclusive of the Ore Reserves.
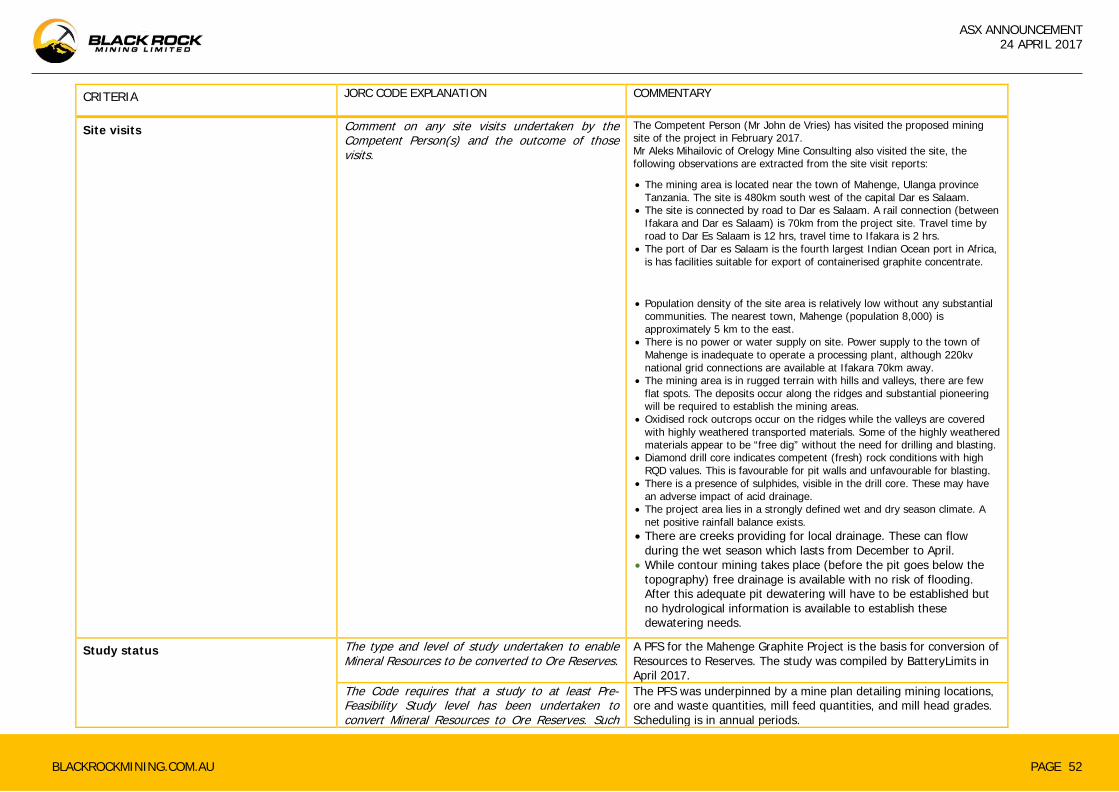
PAGE 52 BLACKROCKMINING.COM.AU
ASX ANNOUNCEMENT 24 APRIL 2017
CRITERIA JORC CODE EXPLANATION COMMENTARY
Site visits
Comment on any site visits undertaken by the Competent Person(s) and the outcome of those visits.
The Competent Person (Mr John de Vries) has visited the proposed mining site of the project in February 2017. Mr Aleks Mihailovic of Orelogy Mine Consulting also visited the site, the following observations are extracted from the site visit reports:
• The mining area is located near the town of Mahenge, Ulanga province Tanzania. The site is 480km south west of the capital Dar es Salaam.
• The site is connected by road to Dar es Salaam. A rail connection (between Ifakara and Dar es Salaam) is 70km from the project site. Travel time by road to Dar Es Salaam is 12 hrs, travel time to Ifakara is 2 hrs.
• The port of Dar es Salaam is the fourth largest Indian Ocean port in Africa, is has facilities suitable for export of containerised graphite concentrate.
• Population density of the site area is relatively low without any substantial communities. The nearest town, Mahenge (population 8,000) is approximately 5 km to the east.
• There is no power or water supply on site. Power supply to the town of Mahenge is inadequate to operate a processing plant, although 220kv national grid connections are available at Ifakara 70km away.
• The mining area is in rugged terrain with hills and valleys, there are few flat spots. The deposits occur along the ridges and substantial pioneering will be required to establish the mining areas.
• Oxidised rock outcrops occur on the ridges while the valleys are covered with highly weathered transported materials. Some of the highly weathered materials appear to be “free dig” without the need for drilling and blasting.
• Diamond drill core indicates competent (fresh) rock conditions with high RQD values. This is favourable for pit walls and unfavourable for blasting.
• There is a presence of sulphides, visible in the drill core. These may have an adverse impact of acid drainage.
• The project area lies in a strongly defined wet and dry season climate. A net positive rainfall balance exists.
• There are creeks providing for local drainage. These can flow during the wet season which lasts from December to April.
• While contour mining takes place (before the pit goes below the topography) free drainage is available with no risk of flooding. After this adequate pit dewatering will have to be established but no hydrological information is available to establish these dewatering needs.
Study status The type and level of study undertaken to enable Mineral Resources to be converted to Ore Reserves.
A PFS for the Mahenge Graphite Project is the basis for conversion of Resources to Reserves. The study was compiled by BatteryLimits in April 2017.
The Code requires that a study to at least Pre-Feasibility Study level has been undertaken to convert Mineral Resources to Ore Reserves. Such
The PFS was underpinned by a mine plan detailing mining locations, ore and waste quantities, mill feed quantities, and mill head grades. Scheduling is in annual periods.

PAGE 53 BLACKROCKMINING.COM.AU
ASX ANNOUNCEMENT 24 APRIL 2017
studies will have been carried out and will have determined a mine plan that is technically achievable and economically viable, and that material Modifying Factors have been considered.
Mine planning activities included pit optimisation, final and interim stage pit designs, mine scheduling, concentrate production estimation, and mining cost estimation. Modifying factors considered during the mine planning process included slope design criteria, mining dilution and ore loss, processing recoveries, processing costs, general and administration costs, concentrate price and royalties, land access and permitting. The results of the PFS demonstrate that the Mahenge Graphite Project is technically achievable and economically viable.
Cut-off parameters
The basis of the adopted cut-off grade(s) or quality parameters applied.
The mine plan adopted a processing plant feed grade of 8.75% TGC. To achieve this target, cut-off grades of 6.5% TGC and 3.8% TGC were applied at Ulanzi and Cascade respectively. These grades are designed to deliver the maximum NPV at the NPV max LoM planned grade of 8.75%. The mine plan is based on Measured, Indicated and Inferred resource materials however only the Measured and Indicated materials were converted to Ore Reserves. No other quality parameters were applied during the reserve determination.
Mining factors or assumptions The method and assumptions used as reported in the Pre-Feasibility or Feasibility Study to convert the Mineral Resource to an Ore Reserve (i.e. either by application of appropriate factors by optimisation or by preliminary or detailed design).
Pit optimisations were undertaken and pit designs generated from which a mining schedule was developed incorporating both Ulanzi and Cascade. Factors such as slope design criteria, mining dilution and ore loss, processing recoveries, processing costs, general and administration costs, concentrate price and royalties were applied as part of the pit optimisation process.
The choice, nature and appropriateness of the selected mining method(s) and other mining parameters including associated design issues such as pre-strip, access, etc.
A conventional open pit mining method using proven technology was chosen as the basis of the PFS due to the near surface presentation of the graphite mineralisation, the relatively low stripping ratio and availability of land required to support the selected mining method. This method is suitable as it is well proved with standard off the shelf equipment (i.e. low risk) and, due to the low population density, the presence of mine infrastructure such as pits and waste dumps will have limited negative land use impact on the local population. Mine design criteria include: minimum mining width, ramp width and gradient, pit exit location and slope design parameters.

PAGE 54 BLACKROCKMINING.COM.AU
ASX ANNOUNCEMENT 24 APRIL 2017
The mining fleet consisting of a single 90t excavator matched with 40t articulated dump trucks was selected to initially establish access and subsequent development of mining areas including the requirement to excavate highly weathered materials, high in clay content. Following the pioneering activities, a fleet of 65t rigid body trucks are used to take advantage of improved mining productivity and lower mining cost.
The assumptions made regarding geotechnical parameters (e.g. pit slopes, stope sizes, etc.), grade control and pre-production drilling.
A high level geotechnical assessment was undertaken by geotechnical consultants Peter O’Bryan and Associates resulting in pit slope design guidelines. These guidelines, which vary with weathering classification appear appropriate and had been applied in the pit optimisation and pit design activities. The final pit designs were then validated by Peter O’Bryan and Associates for adherence to the design guidelines. Without a specific grade control program in place for this PFS, an allowance for grade control drilling, sample collection and assaying activities was applied proportionally to the ore quantity mined in any one year.
The major assumptions made and Mineral Resource model used for pit and stope optimisation (if appropriate).
The Mineral Resource Estimates used as a basis for the conversion to the Ore Reserve were the Ulanzi October 2016 resource model (bkt_mahenge_2016_09_v1_bm_Surpac) and the Cascade December 2016 resource model (bkt_mahenge_cascade_2016_12_v1). Slope design criteria and processing recoveries were applied in the pit optimisation process together with mining, processing, “General & Administration” and concentrate transport cost estimates, concentrator performance, including recovery and concentrate grade predictions, and revenue projections.
The mining dilution factors used. To allow for the effects of material mixing during blasting and the effects of ore-waste delineation inaccuracies in the pit, the resource models were reblocked with smoothing to model mixing of materials and by applying dilution and ore loss to edge blocks. For Ulanzi the process was applied to Measured and Indicated resource materials, for Cascade it was applied to Measured, Indicated and Inferred materials. This method reduces the Ulanzi Measured and Indicated resource materials from 52.5Mt @ 8.7%TGC to 51.3Mt @ 8.5%TGC (at 7% TGC cut-off grade) and the Cascade Measured, Indicated and Inferred resource materials from 46.7Mt @ 8.70%Cg to 46.2Mt @ 8.54%TGC (at 6%Cg cut-off). These reductions are a combination of dilution and recovery.

PAGE 55 BLACKROCKMINING.COM.AU
ASX ANNOUNCEMENT 24 APRIL 2017
The mining recovery factors used. See above.
Any minimum mining widths used. Ulanzi pits were designed in November 2016 and the Cascade pits were designed in January 2017. As the project evolved over time, the scale of the project increased. As a consequence, the Ulanzi pits were designed for 40t trucks, the Cascade pit was designed for 65t trucks. Hence the design criteria as different for these pits. Ulanzi: Dual lane ramps: 13.5m wide road surface, 10% gradient max. Single lane ramps: 8.5m wide road surface, 10% gradient max. Minimum mining width 20m, 15m in final bench and good-bye cuts. Cascade: Dual lane ramps: 17m wide road surface, 10% gradient max. Single lane ramps: 11.3m wide road surface, 10% gradient max. Minimum mining width 30m, 20m in final 2 benches, 8m in good-bye cuts.
The manner in which Inferred Mineral Resources are utilised in mining studies and the sensitivity of the outcome to their inclusion.
No Inferred resource materials have been included in the Ore Reserve estimate. The production schedule includes Inferred resource materials. The percentage of Inferred materials mined is 6% during the first 2 years, 2% during the following 2 years and 1% during the 7 years thereafter. From then on it gradually increases. The risk of including the Inferred materials in the production schedule is low as:
• The volumes during the first 12 years are low. • Further refinements in scheduling may reduce the
dependency on Inferred materials during the earlier years. • An allowance to upgrade the Inferred materials to Indicated
level has been included in the project cost estimate (from Year 12 onwards).
The infrastructure requirements of the selected mining methods.
The infrastructure for mining include fuel & oil storage facilities, fuel bay, workshops, wash bay, magazines, AN storage facility, offices, lunch and ablution facilities, an assay laboratory and a first aid room.
Metallurgical factors or assumptions
The metallurgical process proposed and the appropriateness of that process to the style of mineralisation.
The concentrator plant utilises crushing, grinding and flotation technology to produce graphite concentrate at a grade of 98% TGC. The concentrate will be transported via public roads to the port of Dar es Salaam.

PAGE 56 BLACKROCKMINING.COM.AU
ASX ANNOUNCEMENT 24 APRIL 2017
The initial concentrator has a nameplate capacity of 1Mtpa of ore with a feed grade of 8.75% TGC. At Year 3 a second module is commissioned doubling capacity with ore processed at a rate of 2Mtpa. The concentrator process was designed and costed by BatteryLimits to achieve a graphite recovery of 93%.
Whether the metallurgical process is well-tested technology or novel in nature.
The concentrator flowsheet is common for the treatment of graphitic carbon ores and metallurgical laboratory test work undertaken by Bureau Veritas at Perth (WA) has been used as a basis for the plant design. This testwork underpins the confidence that the plant is to meet expectations for throughput, recovery, concentrate grade and concentrate flake size.
The nature, amount and representativeness of metallurgical test work undertaken, the nature of the metallurgical domaining applied and the corresponding metallurgical recovery factors applied.
Metallurgical test work was carried out by Bureau Veritas in Perth (WA). Flowsheet selection was based on results of numerous flotation/attrition tests undertaken on a bulk composite which provided high recoveries and high graphite purity. Variability follow up work was conducted on several drill hole samples to ensure the results were repeatable along strike and down dip in the significant mineralized zones. When the samples were subjected to the same flowsheet, consistent and repeatable results were obtained suggesting low variability with regard to recovery outcomes while targeting high concentrate grade. Pit optimisations are sensitive to concentrate pricing, and by definition flake size distribution and purity. Pricing assumptions used in the pit optimisation are based on prices supplied by benchmark Minerals March 2017 and are consistent with pricing used in the scoping study. For mine planning purposes an assumption of a homogenous distribution of flake distribution has been made.
Any assumptions or allowances made for deleterious elements.
Metallurgical testwork had not identified any deleterious or radioisotopes. During the reserve estimation, no allowances have been made for deleterious elements.
The existence of any bulk sample or pilot scale test work and the degree to which such samples are considered representative of the orebody as a whole
No further testwork was carried out beyond the batch testing outlined above. Additional bulk test work and pilot scale test work is currently underway to optimise the BV programme outlined above.

PAGE 57 BLACKROCKMINING.COM.AU
ASX ANNOUNCEMENT 24 APRIL 2017
For minerals that are defined by a specification, has the ore reserve estimation been based on the appropriate mineralogy to meet specifications?
Not Applicable
Environmental
The status of studies of potential environmental impacts of the mining and processing operation. Details of waste rock characterisation and the consideration of potential sites, status of design options considered and, where applicable, the status of approvals for process residue storage and waste dumps should be reported.
An Environmental Impact Assessment was completed between December 2016 and January 2017. The assessment did not indicate any contra indications for the project. Subsequent to, the EIA, an Environmental Impact Study (EIS) process has commenced, and an application for a Mining Licence has been made. The project has been designated Application Reference Number (ARN) 6259 by the National Environmental Council of Tanzania. The company has no reason to believe that a mining licence will not be granted, at the conclusion of the EIS process.
Infrastructure
The existence of appropriate infrastructure: availability of land for plant development, power, water, transportation (particularly for bulk commodities), labour, accommodation; or the ease with which the infrastructure can be provided, or accessed.
The project is located 3km from the Mahenge access road. The project assumes on-site power generation from diesel generators for the first two years, with access to grid power thereafter. Grid power cost assumptions are based industry standard costs and quotes from Tanesco (Tanzania national power authority) Onsite water treatment, on site accommodation are considered part of the project. Land for development of pits, plant and tailings storage facilitates is present within the project area. A well-defined process exists within Tanzania for land access for mining projects with a quantifiable pathway for determining compensation for loss of amenity or relocation. Provision for compensation has been included in the capital estimate.
Costs
The derivation of, or assumptions made, regarding projected capital costs in the study. The methodology used to estimate operating costs.
Mining costs were estimated from first principles for an owner operator scenario. Basis for the estimate are the mining schedule, haulage profiles and productivity assumptions, to estimate the resources for the activities (Clearing, Topsoil removal, Haulroad construction, Grade control drilling, Drilling, Blasting, Loading, Hauling, Rehandle) required to meet the schedule. Mining capital costs were estimated from the initial equipment requirements and their replacement costs during the life of the operation using January 2017 equipment prices. Mining operating costs include equipment maintenance and operating costs such as personnel, fuel, tyres, explosives, ground engaging tools.

PAGE 58 BLACKROCKMINING.COM.AU
ASX ANNOUNCEMENT 24 APRIL 2017
Capital and operating costs for milling and onsite infrastructure have been estimated from a first principals’ basis and where appropriate vendor pricing. Vendor pricing forms greater than 30% of the estimated capital costs for the concentrator. Freight estimates are based on firm quotes from reputable, in country logistics suppliers.
Allowances made for the content of deleterious elements.
Metallurgical testwork had not identified any deleterious elements or radioisotopes. During the Reserve estimation, no allowances have been made for deleterious elements.
The derivation of assumptions made of metal or commodity price(s), for the principal minerals and co- products.
Product sales are by long term contracts, on a peer to peer basis. Public price data is considered competitive industry intelligence with little disclosure of long term pricing, other than through third party consulting organisations. Basket pricing used in this Reserve estimate has referenced pricing supplied by Benchmark Minerals in March 2017. Market pricing is based on average three year trailing prices FOB China. This is considered as spot pricing. A premium has been applied to account for the increased purity (98%-99%) of Black Rock’s product relative to the reference Chinese basket of 94% - 95%. A further adjustment was made to equalise freight between China and Dar es Salaam to ensure pricing is based on equivalent basis. Freight cost were estimated from peer and market analysis. Basket prices used in reserve assessment is based on sub baskets of flake of different sizes and composited to form a weighted average price for each deposit. Basket pricing is set out below for 98% - 99% product.
Size um Adjusted BM 3yr Trailing
500 $2,235 300 $1,676 180 $1,287 150 $1,144 75 $898 -75 $568

PAGE 59 BLACKROCKMINING.COM.AU
ASX ANNOUNCEMENT 24 APRIL 2017
Using the above methodology, the weighted average basket price use for Ulanzi was $USD 1,123 and for Cascades $USD 1,226
Derivation of transportation charges. Transport changes are based on quotes from reputable in country logistics suppliers.
The basis for forecasting or source of treatment and refining charges, penalties for failure to meet specification, etc.
Pricing basis is FOB Dar es Salaam. See above for derivation of basket price.
The allowances made for royalties payable, both Government and private. All royalties and taxes have been considered in the assessment. VAT
is assumed to be fully refunded on export of product.
Revenue factors The derivation of, or assumptions made regarding revenue factors including head grade, metal or commodity price(s) exchange rates, transportation and treatment charges, penalties, net smelter returns, etc.
Pricing basis is FOB Dar es Salaam. Marketing and realisation costs have been considered are not part of the operating cost and revenue assumptions estimated on an FOB China basis.
The derivation of assumptions made of metal or commodity price(s), for the principal metals, minerals and co-products.
Price assumptions are based on data supplied by Benchmark Minerals to Black Rock
Market assessment
The demand, supply and stock situation for the particular commodity, consumption trends and factors likely to affect supply and demand into the future.
Graphite flake is an internationally traded industrial mineral concentrate. Traditional uses include refractory, lubrication and expanded flake for insulation. Significant growth in the Lithium Ion Battery sector, of which graphite is a key input, is widely forecast to increase volumes in the near term.
A customer and competitor analysis along with the identification of likely market windows for the product.
Chinese production currently dominates freely traded graphite production, and is considered to form spot pricing. The discovery of the East African graphite province has lead to a number of projects being identified. Development of all projects will exceed current projection for demand. Mahenge’s staged development strategy is designed to ensure market shocks associated with significant increases in available volume are managed.
Price and volume forecasts and the basis for these forecasts. Graphite is sold by contract based on the performance of market
samples provided to customers.

PAGE 60 BLACKROCKMINING.COM.AU
ASX ANNOUNCEMENT 24 APRIL 2017
Current graphite market volumes are estimated at 580 Kt, with most production being of Chinese origin. Industry analyst Pro Graphite estimate that 2025, global volume will rise to 920kt, a compound growth rate of 5%. The energy storage segment is expected to deliver most of the volume growth with a compound growth rate of 15%, for a total volume of 266kt by 2025. Black Rock’s product of above average industry purity, is well suited for the energy storage market. In the absence of transparent pricing and contracted volumes, the Reserve is considered to be of a Probable level of confidence.
Economic
The inputs to the economic analysis to produce the net present value (NPV) in the study, the source and confidence of these economic inputs including estimated inflation, discount rate, etc.
The project economic analysis has been performed by Modus Capital on behalf of battery Limits and Black Rock. The assumptions used in the Ore Reserve analysis are as follows:
• All Inferred material assigned zero value and assumed to be waste
• 10% discount real • LoM Cash costs USD$382 • NPV10 USD$624M Real after tax - unlevered • NPV8 USD$798M Real after tax - unlevered • IRR 48.2% Real after tax - unlevered • Capital stage 1 – USD$90.1M for 1Mtpa throughput for • Capital stage 2 – USD$68.8M
The staged investment strategy ensures each discrete investment is below the USD$100m trigger that would result in project dilution with co-investment from the Tanzanian government.
NPV ranges and sensitivity to variations in the significant assumptions and inputs. The project is relatively insensitive to capital and operating costs.
However is sensitive to grade and price. A 10% change in grade impacts NPV by 16%, and a 10% change in price impacts NPV by 19%.
Social
The status of agreements with key stakeholders and matters leading to social licence to operate. The EIS process commenced in February 2017. The EIS is on schedule
to deliver a mining licence in time for project development in Q2 2018.
Other Any identified material naturally occurring risks. A risk analysis was undertaken and summarised by BatteryLimits. Three key risks were identified:

PAGE 61 BLACKROCKMINING.COM.AU
ASX ANNOUNCEMENT 24 APRIL 2017
To the extent relevant, the impact of the follow ing on the project and/ or on the estimation and classification of the Ore Reserves.
• Delays to the project would result in the project missing the anticipated capital and offtake market windows
• Risk of funding not being available to find the project to construction and full operation
• Risk that Black Rock is able to achieve full pricing for it’s product
The status of material legal agreements and marketing arrangements. Mining licence application is underway as part of the EIS process.
There is no reason to believe the EIS will be unreasonably withheld.
The status of government agreements and approvals critical to the viability of the project, such as mineral tenement status and government and statutory approvals. There must be reasonable grounds to expect that all necessary Government approvals will be received within the timeframes anticipated in the Pre-Feasibility or Feasibility study. Highlight and discuss the materiality of any unresolved matter that is dependent on a third part on which extraction of the reserve is contingent.
EIS application is underway. It is anticipated that an application for a mining licence will be completed by December 2017 and supported by a Definitive Feasibility Study. In the absence of a granted Mining Licence the reserve is considered to be of a Probable level of confidence.
The basis for the classification of the Ore Reserves into varying confidence categories. Whether the result appropriately reflects the Competent Person’s view of the deposit. The proportion of Probable Ore Reserves that have been derived from Measured Mineral Resources (if any).
Because there is no certainty that all assumptions will materialise the Measured and Indicated materials within the schedule have been converted to the Probable reserve category.
Classification
The results of any audits or reviews of Ore Reserve estimates. As this is the first declaration of an Ore Reserve and it is supported
by a current PFS, no external audits have been undertaken.
Audits or reviews
Where appropriate a statement of the relative accuracy and confidence level in the Ore Reserve estimate using an approach or procedure deemed appropriate by the Competent Person. For example, the application of statistical or geostatistical procedures to quantify the relative accuracy of the reserve within stated confidence limits, or, if such an approach is not deemed appropriate, a qualitative discussion of the factors which could affect the relative accuracy and confidence of the estimate.
The Reserve is based on a current PFS completed in April 2017. Economic assumptions are based on current pricing as at March 2017 and reflect current economic circumstances. The Resource estimate was completed in October and December 2016. Statistical investigations have been undertaken on 2m composites within the mineralised domains (zones), as applied to an Ordinary Kriged grade estimate. The relative precision of an estimate is consistent with the JORC classification methodology. A very low

PAGE 62 BLACKROCKMINING.COM.AU
ASX ANNOUNCEMENT 24 APRIL 2017
portion of non-classified material is noted for the first 20 years of the mine schedule with increasing portions thereafter. A large portion of resource is classified as Measured in the production schedule. All Ore Reserve estimates are considered as Probable due to marketing considerations, the absence of a Definitive Feasibility study, and a fully granted Mining Licence.
Discussion of relative accuracy/ confidence
The statement should specify whether it relates to global or local estimates, and, if local, state the relevant tonnages, which should be relevant to technical and economic evaluation. Documentation should include assumptions made and the procedures used.
The resource, and hence the associated reserve, relate to global estimates.
Accuracy and confidence discussions should extend to specific discussions of any applied Modifying Factors that may have a material impact on Ore Reserve viability, or for which there are remaining areas of uncertainty at the current study stage.
The project is at the study stage. Continued advancement through pilot plant and Definitive Feasibility Study will reduce risk to the invest cost and operating parameters of the project. This will be expressed as a reduction of contingency applied to the capital estimate, EPCM estimate and operating cost estimate. Irrespective of reduced contingency as a consequence improved study precision, the Reserve will continue to classified as Probable until there is enforceable offtake agreement for an economically important volume of production.
It is recognised that this may not be possible or appropriate in all circumstances. These statements of relative accuracy and confidence of the estimate should be compared with production data, where available.
Project has completed a Pre-Feasibility study. An absence of production data precludes comment further comment.