BLACK-FOOTED FERRET SPATIAL USE OF PRAIRIE DOG …
71
BLACK-FOOTED FERRET SPATIAL USE OF PRAIRIE DOG COLONIES IN SOUTH DAKOTA by Travis M. Livieri A Thesis Submitted in partial fulfillment of the requirements of the degree MASTERS OF SCIENCE IN NATURAL RESOURCES (WILDLIFE) College of Natural Resources UNIVERSITY OF WISCONSIN Stevens Point, Wisconsin May 2007 ii
Transcript of BLACK-FOOTED FERRET SPATIAL USE OF PRAIRIE DOG …

BLACK-FOOTED FERRET SPATIAL USE OF PRAIRIE DOG COLONIES IN SOUTH DAKOTA
by
Travis M. Livieri
A Thesis Submitted in partial fulfillment of the requirements of the degree
MASTERS OF SCIENCE IN
NATURAL RESOURCES (WILDLIFE) College of Natural Resources
UNIVERSITY OF WISCONSIN Stevens Point, Wisconsin
May 2007
ii
ABSTRACT
Endangered black-footed ferrets (Mustela nigripes) rely exclusively upon prairie dogs
(Cynomys spp.) for food and shelter. The details of the relationship between ferrets and
their habitat is not well understood. I examined habitat factors that may influence ferret
use of prairie dog colonies and ferret home ranges within prairie dog colonies. Using
logistic regression and estimated ferret densities I modeled ferret use of prairie dog
colonies as related to colony variables including size, prairie dog and prairie dog burrow
density, intercolony distance and the proportion of colonies within the landscape. I found
ferrets occur more often on larger prairie dog colonies but may not necessarily select for
large colonies. Ferret density was negatively associated with colony size (P < 0.001, r2 =
0.732) although colony size showed no correlations with relative fitness, prairie dog
density or prairie dog burrow density. The potential fitness advantages to lower densities
of ferrets on larger prairie dog colonies remains unknown. To investigate ferret spatial
use within a prairie dog colony I used spotlighting locations to estimate home ranges for
ferrets and assessed factors that may influence range size. Multiple regression models of
ferret home ranges indicated a larger range for males( x = 131.8 ± 40.3 ha) than females
( x = 64.7 ± 11.6 ha) but no difference was detected between captive- and wild-born
animals. Mean female home range size was and differenFemale home range size was
negatively related to male density and male home range size was positively associated
with age. Inter-sexual overlap and intra-sexual exclusivity of home ranges was evident,
suggesting ferrets conform to a typical mustelid spacing pattern. Core activity areas had
higher estimated prairie dog densities than home ranges. Management of prairie dog
iii

colonies should focus on a mosaic of colony sizes to account for the territoriality and
reproductive needs to sustain a black-footed ferret population.
iv

Table of Contents
ABSTRACT……………………………………………………………………………...iii ACKNOWLEDGEMENTS………………………………………………………….…...iv LIST OF TABLES………………………………………………………………………...v LIST OF FIGURES………………………………………………………………………vi CHAPTER 1 – BLACK-FOOTED FERRET SELECTION OF PRAIRIE DOG COLONIES IN SOUTH DAKOTA 1. Abstract………………………………………………………………………...1 2. Introduction…………………………………………………………………….2 3. Study Area……………………………………………………………………..6 4. Methods………………………………………………………………………..6 Black-footed ferret location data………………………………………….6 Prairie dog colony variables……………………………………………….8 Data analysis……………………………………………………………..10 5. Results………………………………………………………………………...11 6. Discussion…………………………………………………………………….12 7. Management Implications…………………………………………………….14 8. Literature Cited……………………………………………………………….15 CHAPTER 2 – BLACK-FOOTED FERRET HOME RANGES IN CONATA BASIN, SOUTH DAKOTA 1. Abstract……………………………………………………………………….29 2. Introduction…………………………………………………………………...30 3. Study Area……………………………………………………………………32 4. Methods……………………………………………………………………….33 Black-footed ferret locations……………………………………………..33 Data analysis……………………………………………………………..34 5. Results……………………………………………………………………...…36 Sample size………………………………………………………………36 Annual home range………………………………………………………36 Overlap…………………………………………………………………...38 Lifetime home range……………………………………………………..38 6. Discussion…………………………………………………………………….39 Annual home range………………………………………………………39 Overlap…………………………………………………………………...40 Lifetime home range……………………………………………………..41 7. Management Implications………………………………………………….....41 8. Literature Cited……………………………………………………………….42
v
ACKNOWLEDGEMENTS
This project is the result of the labors of many individuals within UW-Stevens Point
and the black-footed ferret recovery community. First, I must thank my graduate
committee of Dr. Eric Anderson, Dr. Tim Ginnett and Dr. Chris Yahnke. Eric, your
unending patience and enthusiasm is the primary reason this project was accomplished.
Statistically, Dr. Ginnett was invaluable and Dr. Yahnke provided excellent guidance.
During the course of my thesis I had many UW-Stevens Point professors on my
committee and all provided valuable assistance including, Dr. Evelyn Merrill, Dr. Mark
Boyce, Dr. Mike Hansen, Dr. Neal Niemuth, Dr. Dave Naugle and Dr. Brad Swanson.
I am indebted to Dr. Glenn Plumb and Bill Perry for encouraging and funding this
study. Without Glenn’s guidance I may never have entered graduate school. Bill, you
are my partner in crime, mentor and most importantly my friend. I also received field
support from Doug Albertson, Doug Sargent, Greg Schroeder, Bruce Bessken, Dean
Biggins, Jerry Godbey and numerous technicians. Conversations over drinks with Randy
Matchett and Dean Biggins helped my thought processes. I also thank my parents for
their support and patience throughout my graduate career.
Funding support was provided by Badlands National Park, UW-Stevens Point, US
Forest Service, the Zoological Society of Milwaukee County, UWSP Doug Stephens
Grant, and World Wildlife Fund.
Most importantly, I would like to thank the hundreds of black-footed ferrets and
thousands of prairie dogs of Conata Basin. Their proliferation fueled my career as a
biologist and provided me with a proud feeling of accomplishment, even though the
accomplishment was all theirs.
vi

List of Tables
CHAPTER 1 1. Prairie dog colony attributes collected at Conata Basin/Badlands, South Dakota…...21 2. Mean and standard error for prairie dog colony variables used and unused by black-footed ferrets at Conata Basin/Badlands, South Dakota…………………………………22 3. All logistic regression candidate models for black-footed ferret selection of prairie dog colonies in South Dakota………………………………………………………………...23 CHAPTER 2 4. Biological and environmental variables measured in association with black-footed ferret home ranges………………………………………………………………………..48 5. All candidate multiple regression models of female black-footed ferret 95 % fixed kernel annual home range size in South Dakota. Model parameters in italics had a negative correlation and in bold had a positive correlation with home range size………49 6. All candidate multiple regression models of female black-footed ferret 50 % fixed kernel annual home range size in South Dakota. Model parameters in italics had a negative correlation and in bold had a positive correlation with home range size………50 7. All candidate multiple regression models of female black-footed ferret minimum convex polygon annual home range size in South Dakota. Model parameters in italics had a negative correlation and in bold had a positive correlation with home range size..51 8. All candidate multiple regression models of male black-footed ferret 95% fixed kernel annual home range size in South Dakota. Model parameters in italics had a negative correlation and in bold had a positive correlation with home range size………………...52 9. All candidate multiple regression models of male black-footed ferret 50% fixed kernel annual home range size in South Dakota. Model parameters in italics had a negative correlation and in bold had a positive correlation with home range size………………...53 10. All candidate multiple regression models of male black-footed ferret minimum convex polygon annual home range size in South Dakota. Model parameters in italics had a negative correlation and in bold had a positive correlation with home range size……………………………………………………………………………………….54 11. Percent of black-footed ferret annual home range inter-sexual and intra-sexual overlap in Conata Basin, South Dakota………………………………………………….55 12. Density of active prairie dog burrows and number of prairie dogs encompassed by the annual home range of 4 black-footed ferrets………………………………………...56
vii

13. Prairie dog density within the home range of 4 black-footed ferrets in South Dakota……………………………………………………………………………………57
viii

List of Figures
CHAPTER 1 1. Map of prairie dog colonies in Conata Basin/Badlands, South Dakota, 1999………..24 2. Relationship between adult female black-footed ferret density and prairie dog colony size at Conata Basin/Badlands, South Dakota…………………………………………...25 3. Relationship between kits per adult female black-footed ferret (relative fitness) and colony size in South Dakota……………………………………………………………..26 4. Relationship between prairie dog density and prairie dog colony size in South Dakota……………………………………………………………………………………27 5. Relationship between active prairie dog burrow density and prairie dog colony size in South Dakota……………………………………………………………………………..28 CHAPTER 2 6. Example of an unclipped black-footed ferret home range (A) and a home range clipped to include only prairie dog colony (B)…………………………………………58 7. Area-per-observation curve for 95% fixed kernel home range of 8 black-footed ferrets. Solid line-squares represent mean home range size with successive locations. Dashed line-diamonds represent mean percent change in home range size with successive locations………………………………………………………………………………….59 8. Area-per-observation curve for 100% minimum convex polygon home range of 8 black-footed ferrets. Solid line-squares represent mean home range size with successive locations. Dashed line-diamonds represent mean percent change in home range size with successive locations……………………………………………………………………...60
ix
List of Appendices
CHAPTER 2
Number Title Page
1. Summary of black-footed ferret home ranges (ha) in this 61 study.
x
CHAPTER 1
BLACK-FOOTED FERRET SELECTION OF PRAIRIE DOG COLONIES IN SOUTH
DAKOTA
ABSTRACT
Black-footed ferrets (Mustela nigripes) are obligate predators of prairie dogs
(Cynomys spp.) and occur only on prairie dog colonies. However, all prairie dog colonies
might not represent equally suitable habitat for ferrets. I compared attributes of prairie
dog colonies occupied by black-footed ferrets in the Conata Basin portion of the Buffalo
Gap National Grassland and Badlands National Park, South Dakota (n=64) with those
without ferret presence (n=46). Univariate tests found that ferrets occupied prairie dog
towns that were significantly larger ( x =56.7 ha vs x =8.9 ha), with a higher area-
weighted intercolony distance ( x =0.0116 vs x =0.0006) and that were closer to
colonies on which black-footed ferrets were released ( x =840 m vs x =1276 m)
(P<0.05). Although sample sizes were considerably smaller, prairie dog density and
burrow densities did not appear to influence selection of colonies. I also used binary
logistic regression to construct models of black-footed ferret selection. The resulting
models indicated the size of prairie dog colony had the largest influence on black-footed
ferret occupation of prairie dog colonies. However, due to passive sampling issues the
use of larger colonies may have only been an artifact of the greater likelihood of a ferret
encountering the area, not because of selection. To explore the relationship of colony
size to ferret selection, I looked at the relationship of ferret density to colony size. Prairie
dog colony size was negatively correlated with black-footed ferret density (P <0.001, r2 =
0.732), indicating ferrets are more widely spaced on large colonies. Since the number of
1
ferret kits per female, prairie dog density, and prairie dog burrow density are no different
on large colonies versus small, the decrease in ferret density on larger colonies is difficult
to explain. However, since data on survivorship of ferret adults or kits is unavailable,
potential fitness advantages to lower ferret densities on larger colonies is unknown and
should be investigated further. Management should focus on a mosaic of colony sizes to
ensure ferret population persistence.
INTRODUCTION
Black-footed ferrets are a federally endangered species and were reintroduced into the
Conata Basin/Badlands (CB/B) area of southwestern South Dakota from 1994-1999.
They are obligate predators of prairie dogs (Biggins et al. 1993; 2006a) and occur only on
prairie dog colonies (Linder et al. 1972, Hillman et al. 1979), therefore coarse habitat
attributes for ferrets are essentially prairie dog colony attributes because the two species
occur sympatrically (Forrest et al. 1985). However, repeated observations of ferret
occurrence and distribution suggests that all prairie dog colonies do not represent equally
suitable habitat for selection and successful use by reintroduced or subsequently wildborn
ferrets (Plumb et al. 1996). Consequently, there may be some level(s) of resource
selection occurring. Managers suspect that among colonies there may be acceptable
levels of habitat “quality” as defined by a suite of habitat variables which will likely
increase or decrease the probability of resource selection and use of a colony by ferrets.
As of 2001, the CB/B black-footed ferret reintroduction project had resulted in a small,
growing population (N>200) of reintroduced and wildborn individuals distributed across
a 400-km2 black-tailed prairie dog (Cynomys ludovicianus) complex. Ferrets were
reintroduced into 13 sites across six states and Mexico since 1991 with varied success at
2
establishing populations (Lockhart et al. 2006). To develop sound management
guidelines, managers require a better understanding of the relationship between habitat
variation and selection by ferrets.
A number of habitat variables may influence prairie dog colony selection by black-
footed ferrets. Forrest et al. (1985) identified seven habitat features for assessing
suitability of prairie dog colonies to support ferret populations (in order of descending
importance): complex size, colony size, colony distribution, prey density and distribution,
vegetation composition and structure, burrow structure, and predators. These habitat
features were the basis for a Habitat Suitability Index developed by Houston et al. (1986).
Biggins et al. (1993) recommended a minimum size of 400 ha for the combined area of
all colonies in a prairie dog complex for consideration as a ferret reintroduction site
regardless of prairie dog species. The historic range of black-footed ferrets encompassed
three prairie dog species, black-tailed (BTPD), white-tailed (Cynomys leucurus; WTPD)
and Gunnison's prairie dogs (Cynomys gunnisoni; GPD) (Fagerstone 1987). BTPDs
generally have a larger body size, higher burrow density and smaller colony size than
WTPDs and GPDs (Hoogland 1995).
Distribution of colonies within a complex is important because ferrets are more likely
to encounter large, closely spaced colonies than small, distant colonies (Forrest et al.
1985, Houston et al. 1986, Miller et al. 1988). For ferrets, the consequences of
occupying small, distant colonies could be reduced gene flow, decreased colonization
rates and dispersal success, and decreased mating success (Biggins et al. 1993), leading to
higher probabilities of extinction. At Meeteetse, Wyoming, site of the last known wild
population of ferrets, the average distance between WTPD colonies was 0.9 km (Clark
3
1989) compared with 5.2 km for BTPDs at Mellette County, South Dakota (Hillman et al.
1979), which supported the only wild ferret population on BTPDs ever studied.
Colony size may be important for establishment and maintenance of black-footed
ferret populations, although smaller colonies incapable of supporting long-term ferret
occupancy may be important for dispersal and inter-colony movements (Forrest et al.
1985). At Meeteetse, WTPD colony sizes were 0.5-1,302 ha and the smallest colony
supporting an individual ferret was 12.5 ha. Litters were found only on colonies >49 ha
(Clark 1989). Hillman et al. (1979) recommended a minimum colony size of 12 ha for an
individual ferret and 40 ha for litters, based on observations at Mellette County, South
Dakota (BTPDs). In contrast, Stromberg et al. (1983) recommended 167 to 355 ha of
prairie dog colony per ferret. Beck and Gebhart (1978) observed ferrets on 17 BTPD
colonies averaging 24 ha, compared with 13 ha for colonies where ferrets were not
observed. Forrest et al. (1985) found that colonies >180 ha were continuously occupied
by ferrets, whereas smaller colonies were used seasonally or not at all.
Within and among prairie dog colonies there is substantial variation in attributes
which may influence black-footed ferret selection. Prey availability has been shown to
influence habitat selection by other mustelids such as river otters (Lontra canadensis;
Melquist and Hornocker 1983) and least weasels (Mustela nivalis; Erlinge 1974). Since
prairie dogs comprise approximately 90% of the ferret diet (Sheets et al. 1972, Campbell
et al. 1987), it is likely that prairie dog density influences the quality of habitat for ferrets.
Biggins et al. (1993) reported that higher prairie dog densities are required to support
ferret reproduction than to sustain individual animals. Average BTPD densities across
their historic distribution range from 10-55/ha (O’Meilia et al. 1982, Knowles 1986,
4

Archer et al. 1987). At Meeteetse, mean WTPD density was 3.8/ha and mean burrow
opening density was 37.6/ha (Clark 1989). Among BTPD complexes, Hoogland (1995)
noted that burrow opening densities varied from 10-250/ha. Forrest et al. (1985)
suggested high burrow densities may be desirable for the added protection they provide
to ferrets as escape from predators. Collins and Lichvar (1986) examined the vegetation
of the Meeteetse study area and concluded that vegetative parameters were less important
in defining ferret habitat than other variables, although, the presence of tall vegetation
may influence the ability of a ferret to detect predators.
Carlson (1993) studied habitat selection by black-footed ferrets immediately following
release (1-11 days) and found no correlation between ferret use sites and prairie dog
density, but concluded ferrets released in the fall may initially exhibit exploratory
behavior rather than selecting areas with characteristics beneficial to survival. Managers
at CB/B observed further post-release ferret selection of prairie dog colonies during
definite periods such as breeding season and parturition, suggesting that some colonies
may be selected to fulfill biological requirements. Because the CB/B ferret population
was comprised of released animals and their offspring the selection of release colonies by
biologists might have influenced colony selection. In essence, biologists made the first
colony selection for ferrets and if ferrets did not move to non-release colonies, that
influence should remain.
My objective was to examine black-tailed prairie dog colony attributes in relation to
black-footed ferret selection of a colony. I constructed logistic regression models with
data from the combination of released and wild-born ferrets at CB/B and expected that
5

ferrets would select prairie dog colonies non-randomly, in a pattern that was predictable
from prairie dog colony attributes.
STUDY AREA
I collected prairie dog colony attribute and black-footed ferret location data at the
Conata Basin/Badlands area of southwestern South Dakota (Figure 1) on public lands
administered by the National Park Service, Badlands National Park, USDA Forest
Service, Buffalo Gap National Grassland, and adjoining private lands. Ferrets were
reintroduced to prairie dog colonies in CB/B annually from 1994-1999. The climate of
the area was semi-arid with an average annual precipitation of 39.9 cm. Mean annual
temperature was 10.3 °C and monthly mean temperatures range from -4.6 °C in January
to 25.5 °C in July (National Oceanic and Atmospheric Administration 1993).
Topography is level but broken by small drainages generally running north to south.
Soils are young and poorly developed with textural classes dominated by clay. Badlands
buttes and formations are scattered throughout the landscape. Vegetation was mixed-
grass prairie, dominated by western wheatgrass (Agropyron smithii), buffalograss
(Buchloe dactyloides), and blue grama (Bouteloua gracilis) (Severson and Plumb 1998).
METHODS
Black-footed Ferret Location Data
During 1997-2004, black-footed ferrets were located on prairie dog colonies using
spotlighting methods (Clark et al. 1983, Biggins et al. 2006b). Spotlight surveys
occurred throughout the year, with the exception of June, on prairie dog colonies where
ferrets were released and surrounding colonies to document dispersal. Snow-track
surveys (Richardson et al. 1987) were used to indicate presence of ferrets on outlying
6

colonies and were followed up by spotlight surveys. Ferret locations were temporarily
marked with a driveway reflector and assigned a location using differentially-corrected
Trimble® global positioning system (GPS) equipment. Released ferrets were uniquely
identified by previously implanted passive integrated transponder (PIT) tags (Fagerstone
and Johns 1987, Stoneberg 1996). Wild-born ferrets were live-trapped and implanted
with PIT tags (Biggins et al. 2006b).
Once the identification number and the location colony of the black-footed ferret was
known then sex, location date, and release date data were obtained from release records
and spotlighting data. By subtracting the location date from the release date, I estimated
the number of known days the ferret had survived in the wild since release. Released
ferrets experience an acclimation period when selection is essentially random (Carlson
1993). Survival to 30-days post-release is indicative of a higher probability of long-term
survival (D. Biggins, U.S. Geological Survey-Biological Resources Division, Fort
Collins, CO, personal communication). Thus data collected prior to 30-days post-release
were discarded.
Parturition in the wild is typically in May-June. Kits first come above ground at
approximately 60 days of age (July-August), and disperse from their mothers at 90-120
days of age (September-October). Hence, for wild-born animals their ‘release date’ was
considered to be 1 September, and data were used for ferret locations only after 30-days
post-release.
Spotlight surveys during the study were considered a complete census and the
population closed since it was a reintroduced population in an area containing no ferrets
and >90% of the known ferrets present were accounted for after intensive sampling. The
7

sampling units were prairie dog colonies, with each colony being designated as used by
the detection of at least one ferret.
Prairie Dog Colony Variables
Prairie dog colony attributes were compared between colonies that were used and
unused by black-footed ferrets. Prairie dog colonies in the study area were mapped in
1999 and 2004 using differentially corrected Trimble GPS (Global Positioning Systems)
equipment. A Geographic Information System (GIS) was used to calculate 9 landscape
metrics for each prairie dog colony (Table 1). At Meeteetse, a white-tailed prairie dog
complex, the longest nightly moves recorded for ferrets were approximately 7 km
(Richardson et al. 1987, Biggins et al. 1993). I suspected longest nightly moves for
ferrets on black-tailed prairie dog colonies were <7 km since black-tail colonies are more
clustered and dense than white-tail (Tileston and Lechleitner 1966). Thus I used a 7-km
buffer from the colony edge to calculate the percentage of landscape occupied by prairie
dog colony at 1 km increments as “donuts” (%1KM-%7KM). Another measure of patch
isolation was developed by taking the harmonic means of distances to all other colonies
and weighting them by the size of the colony. This variable, called an area-weighted
inter-colony distance (AWIC), was calculated by:
AWIC = 1
1
1
−
∑−
=
ndan
i i
i
,
where d is the distance from the closest edge of the target colony to all other colonies (n-
1), and a is the area (ha) of the distant colony, excluding the target colony. Therefore, a
colony with large colonies nearby would have a higher AWIC than a colony surrounded
by small, distantly spaced colonies. Variables %1KM-%7KM were all highly correlated
8
(r > 0.5) with AWIC and with each other, the highest correlations among the closest
variables (e.g. %2KM was most correlated with %1KM and %3KM). AWIC was
analyzed separately from all %KM variables.
Prairie dog density was estimated 1996-1999 on a random sample of 21 colonies
although only data from 8 colonies was able to be used in modeling. Prairie dog density
was obtained by visual counts (Fagerstone and Biggins 1986, Menkens and Anderson
1993, Severson and Plumb 1998) on one randomly selected 16-ha plot per colony to yield
an estimate of prairie dogs/ha (PDOG DENS). Density of active (ACT BURR) and total
(TOT BURR) prairie dog burrows/ha was estimated on 34 colonies using transect
methods outlined by Biggins et al. (1993) although only data from 24 colonies was able
to be used in modeling. To assess the influence of release colony selection by biologists I
measured the minimum edge-to-edge distance in meters from a release colony
(RELDIST) with release colonies having a value of zero.
Using prairie dog colony size (HA) in the logistic regression models was problematic
because larger colonies effectively represent larger samples and the probability of a ferret
occupying a large colony is greater than a small colony by simple random chance. This
problem is known as “passive sampling” (Johnson 2001). I avoided the issue of passive
sampling by regressing adult female density against prairie dog colony size to assess the
influence of colony size on ferret selection as measured by density. Data from 2003-04
were used because reintroduction was no longer occurring and the population was >99%
wild-born. Black-footed ferret densities for each colony were calculated by the number
of adult females present on a colony in 2003 and 2004. A paired t-test indicated that the
densities between years were not significantly different (P=0.714), so I averaged both
9
-
years to provide one density estimate for each colony. If ferrets were selecting for larger
prairie dog colonies I expected to find an increased ferret density in larger colonies.
Sampling effort per unit area was not equivalent across all colonies and was generally
cumulatively greater on large colonies than on small colonies.
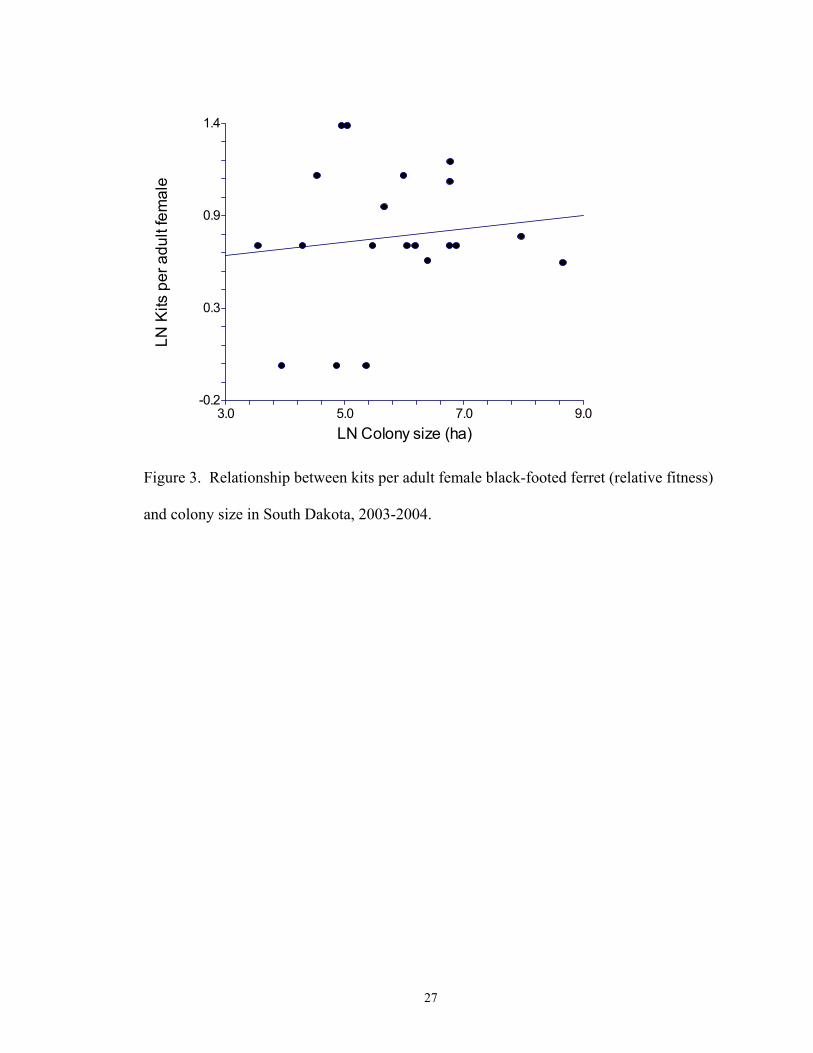
I also assessed the relationship between one measure of fitness, kits per adult female,
and colony size. The number of unmarked kits present on a colony was divided by the
number of adult females to estimate kits per adult female. I regressed both prairie dog
density and prairie dog burrow density against colony size to determine if colony size
was related to prey density.
Data Analysis
Attributes of prairie dog colonies used/unused by black-footed ferrets for each gender
were compared using Mann-Whitney U-tests and pooled if groups were not significantly
different. To determine if selection occurred at a univariate level, Mann-Whitney U-tests
were used to compare used and unused prairie dog colony attributes. Variables that were
not highly correlated (r ≤ 0.5) were used in a binary logistic regression model. Models
were evaluated for goodness-of-fit using r2, Akaike’s Information Criterion corrected for
small sample size (AICc; Burnham and Anderson 2002) and Akaike weights. AICc uses
log-likelihood and the number of parameters to evaluate the bias and precision of all
possible model subsets. The top models had the lowest AICc score, highest Akaike
weight and evidence and high r2. Significance level was α = 0.05 for all tests unless
noted.
10
-
RESULTS
From 1997 to 2001, 110 of 195 prairie dog colonies were sampled for ferrets and 8,309
locations were collected on 501 individual black-footed ferrets (251 females, 250 males)
from 66 prairie dog colonies (60 used by females and 61 by males). Data from 1997-
2001 were used in logistic regression modeling while data from 2003-04 (115 individual
adult females on 17 colonies) were used for density regression. Collection of ferret
location data was accomplished by personnel of the U.S. Forest Service and National
Park Service and myself.
Prairie dog colonies (N = 195) had a mean size of 28.4 ha (SE = 5.2) with a mean
edge-to-edge inter-colony distance of 304.8 m (SE = 33.4). Mean prairie dog density on
a sample of 21 colonies was 28.7 prairie dogs/ha (SE = 5.4) and mean active burrow
density on a sample of 34 colonies was 139.6 active burrows/ha (SE = 7.1).
There were no significant differences between used colony attributes for females and
males for all variables, thus sexes were pooled. Ferrets were found in colonies that were
larger in size (P = 0.005), had a greater area-weighted inter colony distance (AWIC; P =
0.049) and where the distance to a release colony was less (RELDIST; P = 0.018) (Table
2).
Logistic regression models indicated HA had a large influence on black-footed ferret
selection of prairie dog colonies (Table 3). Despite a generally greater sampling effort on
large colonies, density of adult female black-footed ferrets was negatively associated with
prairie dog colony size (P <0.001, r2 = 0.732; Fig. 2). The number of kits per female, as a
measure of fitness, did not change with colony size (P = 0.595, r2 = 0.016; Fig. 3).
11
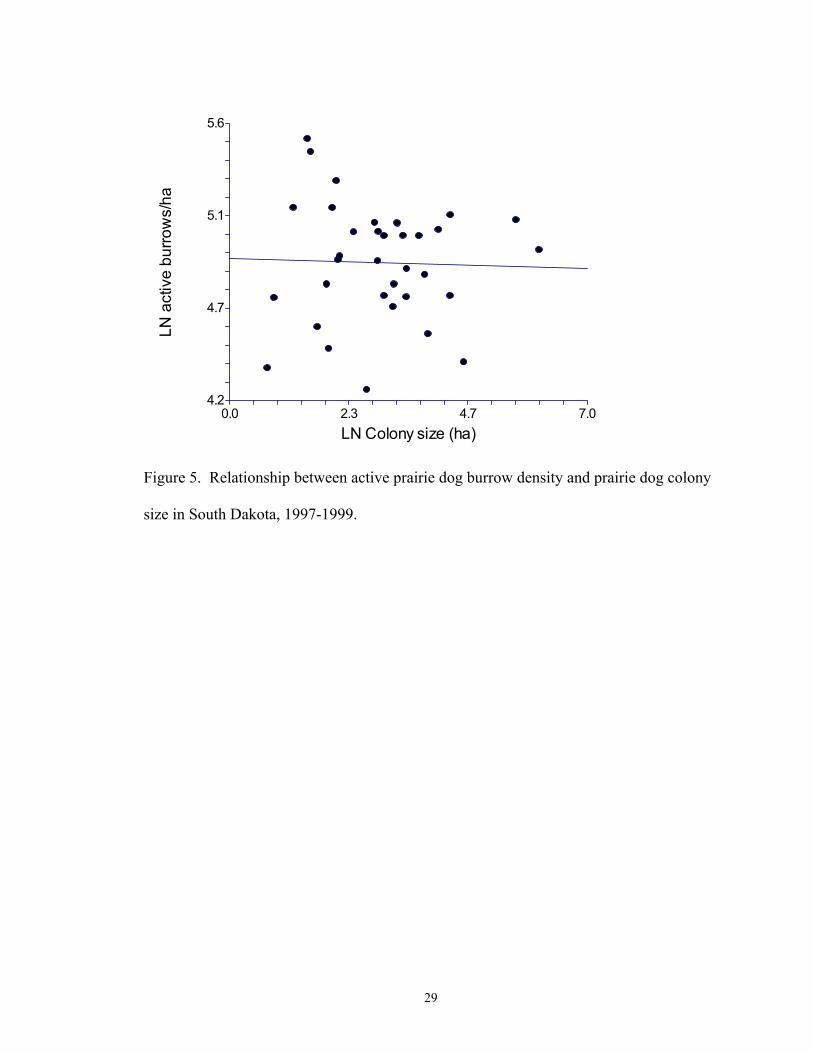
Neither prairie dog density (P = 0.651, r2 = 0.011; Fig. 4) nor prairie dog burrow density
(P = 0.876, r2 <0.001; Fig. 5) were related to colony size.
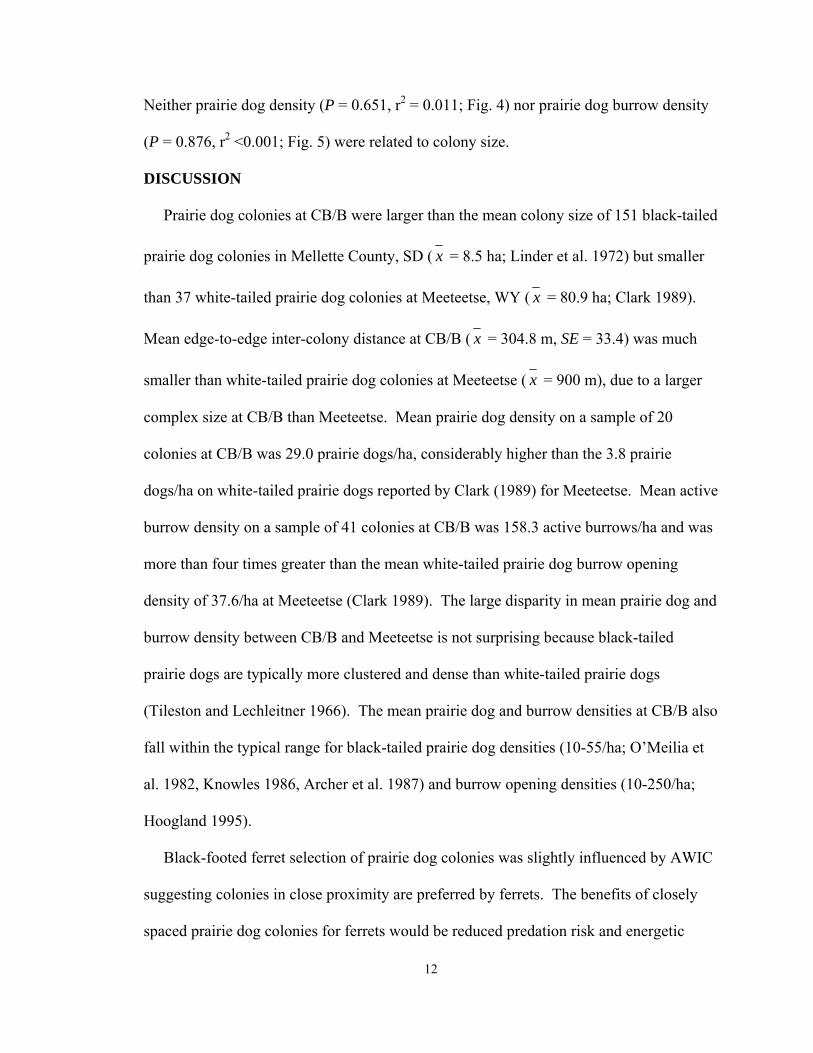
DISCUSSION
Prairie dog colonies at CB/B were larger than the mean colony size of 151 black-tailed
prairie dog colonies in Mellette County, SD ( x = 8.5 ha; Linder et al. 1972) but smaller
than 37 white-tailed prairie dog colonies at Meeteetse, WY ( x = 80.9 ha; Clark 1989).
Mean edge-to-edge inter-colony distance at CB/B ( x = 304.8 m, SE = 33.4) was much
smaller than white-tailed prairie dog colonies at Meeteetse ( x = 900 m), due to a larger
complex size at CB/B than Meeteetse. Mean prairie dog density on a sample of 20
colonies at CB/B was 29.0 prairie dogs/ha, considerably higher than the 3.8 prairie
dogs/ha on white-tailed prairie dogs reported by Clark (1989) for Meeteetse. Mean active
burrow density on a sample of 41 colonies at CB/B was 158.3 active burrows/ha and was
more than four times greater than the mean white-tailed prairie dog burrow opening
density of 37.6/ha at Meeteetse (Clark 1989). The large disparity in mean prairie dog and
burrow density between CB/B and Meeteetse is not surprising because black-tailed
prairie dogs are typically more clustered and dense than white-tailed prairie dogs
(Tileston and Lechleitner 1966). The mean prairie dog and burrow densities at CB/B also
fall within the typical range for black-tailed prairie dog densities (10-55/ha; O’Meilia et
al. 1982, Knowles 1986, Archer et al. 1987) and burrow opening densities (10-250/ha;
Hoogland 1995).
Black-footed ferret selection of prairie dog colonies was slightly influenced by AWIC
suggesting colonies in close proximity are preferred by ferrets. The benefits of closely
spaced prairie dog colonies for ferrets would be reduced predation risk and energetic
12
expenditure during inter-colony movements. I did find a negative correlation between
adult female ferret density and colony size suggesting female ferrets are more widely
spaced on large colonies. In CB/B the smallest colony supporting a litter was 12ha.
Hillman et al. (1979) found 5 of 9 litters in Mellette County, SD on colonies <16 ha and
Biggins et al. (2006c) reported a female ferret raised two kits on a 5 ha colony in
Montana.
The lower density of female ferrets on larger colonies may be the result of several
different factors: 1) low density may increase individual female fitness by increasing
survivorship rates, or; 2) prey density or burrow density may be more heterogeneous in
large colonies, hence larger areas are required for females to meet their energetic
demands. Since the number of kits per female, prairie dog density and prairie dog
burrow density did not differ with colony size, those factors do not appear to be
influencing colony selection. Rigorous survival data was unavailable to assess the
relationship between black-footed ferret survival and selection of prairie dog colonies
which ultimately would identify the best colonies for ferrets to occupy. While small
colonies may meet the biological requirements of individual ferrets, larger colonies are
probably needed to sustain a population. The historic Mellette County (BTPD) ferret
population had small, isolated prairie dog colonies ( x = 8.5 ha; Linder et al. 1972), more
than 3 times smaller than the mean colony size at CB/B and the population ultimately
disappeared.
Prairie dog density was untestable in the univariate tests because there was only one
unused colony that had prairie dog density calculated. While prairie dog density is
expected to be important to ferrets, there is likely a range of densities that influence
13
-
colony selection with an upper and lower threshold. At high prairie dog densities ferrets
are probably not limited by prey availability thus other variables, such as territoriality,
likely influence selection under those circumstances. The high prairie dog and burrow
densities found at CB/B may be above the upper threshold of densities that influence
colony selection, but obviously I was unable to test for this relationship.
The distance of a prairie dog colony from a ferret-release colony (RELDIST) was
significant in univariate tests and appeared in competing models but not the preferred
model. Biologists initially chose 17 large prairie dog colonies to release captive-born
ferrets or translocate wild-born ferrets. Through reproduction and dispersal, ferrets
occupied non-release colonies throughout CB/B. Because this reintroduction of ferrets is
relatively recent I expected distance from a release colony (RELDIST) to have a
relationship with ferret colony selection. The significance of RELDIST in univariate
tests suggested a lingering influence of where biologists initially placed ferrets, although
it was not large enough to dominate the logistic model.
MANAGEMENT IMPLICATIONS
My results suggest black-footed ferrets prefer closely spaced prairie dog colonies but
may not specifically select for large colonies. Although ferrets may fulfill biological
requirements on small colonies it is likely that small colonies are more susceptible to
localized extinctions, requiring immigration from large colonies that may serve as source
populations. The observed higher density of ferrets on smaller colonies suggest these
“islands” of habitat may support more ferrets per unit area by reducing the effects of
territoriality (Biggins et al. 2006a). Within a prairie dog colony, black-footed ferrets
select for patches of high prairie dog burrow density and prior residency may impart a
14

competitive advantage (Biggins et al. 2006a). Competition for high burrow density
patches among ferrets may lead to higher dispersal rates from large colonies. My results
support Biggins et al. (2006a) suggestion that “the energetics-based model commonly
used to predict ferret densities at reintroduction sites does not consider competition,
which likely leads to overestimation of the densities of ferrets attainable in high-quality
habitat.”
While small colonies may meet the biological requirements of individual ferrets,
larger colonies are needed to sustain a population. Biggins et al. (2006c) suggest colonies
<10 ha may not have sufficient prairie dog numbers to sustain ferret reproduction in
consecutive years without a severe depletion of prairie dogs. Biologically, managing
prairie dog complexes for black-footed ferret recovery may require a mosaic of colony
sizes. Although large prairie dog colonies may not support high densities of ferrets we do
not yet understand their role in the population dynamics or their relationship to fitness
and long-term persistence of black-footed ferret populations on the landscape.
LITERATURE CITED
Archer, S., M. G. Garrett, and J. K. Detling. 1987. Rates of vegetative change associated
with prairie dog (Cynomys ludovicianus) grazing in North American mixed grass
prairie. Vegetatio 72: 159-166.
Beck, D. A., and J. L. Gebhart. 1978. Ecological requirements of the black-footed ferret.
South Dakota Department of Game, Fish and Parks, Pittman-Robertson Project
W-97-R.
Biggins, D. E., J. L. Godbey, M. R. Matchett, L. R. Hanebury, T. M. Livieri, and P. E.
Marinari. 2006b. Monitoring black-footed ferrets during reestablishment of free-
15
ranging populations: discussion of alternative methods and recommended
minimum standards. Pages 155-174 in J. E. Roelle, B. J. Miller, J. L. Godbey,
and D. E. Biggins, editors. Recovery of the black-footed ferret – progress and
continuing challenges. U.S. Geological Survey Scientific Investigations Report
2005-5293.
Biggins, D. E., J. L. Godbey, M. R. Matchett and T. M. Livieri. 2006a. Habitat
preferences and intraspecific competition in black-footed ferrets. Pages 129-140
in J. E. Roelle, B. J. Miller, J. L. Godbey, and D. E. Biggins, editors. Recovery of
the black-footed ferret – progress and continuing challenges. U.S. Geological
Survey Scientific Investigations Report 2005-5293.
Biggins, D. E., J. M. Lockhart, and J. L. Godbey. 2006c. Evaluating habitat for black-
footed ferrets: revision of an existing model. Pages 143-150 in J. E. Roelle, B. J.
Miller, J. L. Godbey, and D. E. Biggins, editors. Recovery of the black-footed
ferret – progress and continuing challenges. U.S. Geological Survey Scientific
Investigations Report 2005-5293.
Biggins, D. E., B. J. Miller, L. R. Hanebury, B. Oakleaf, A. H. Farmer, R. Crete, and A.
Dood. 1993. A technique for evaluating black-footed ferret habitat. Pages 73-88
in J. L. Oldemeyer, D. E. Biggins, and B. J. Miller, editors. Proceedings of the
symposium on the management of prairie dog complexes for the reintroduction of
the black-footed ferret. U.S. Fish and Wildlife Service Biological Report 13.
Burnham, K. P., and D. R. Anderson. 2002. Model selection and multi-model inference:
a practical information-theoretic approach. Second edition. Springer-Verlag,
New York, New York, USA.
16
Campbell, T. M., III, T. W. Clark, L. Richardson, S. C. Forrest, and B. R. Houston.
1987. Food habits of Wyoming black-footed ferrets. American Midland
Naturalist 117: 208-210.
Carlson, J. C. 1993. Release box use and habitat selection by black-footed ferrets
(Mustela nigripes) released into Shirley Basin, Wyoming. Thesis, University of
Wyoming, Laramie, Wyoming, USA.
Clark, T. W. 1989. Conservation biology of the black-footed ferret. Wildlife
Preservation Trust Special Scientific Report No. 3.
Clark, T. W., T. M. Campbell III, M. H. Schroeder, and L. Richardson. 1983. Handbook
of methods for locating black-footed ferrets. Wyoming BLM Wildlife Technical
Bulletin No. 1.
Collins, E. I., and R. W. Lichvar. 1986. Vegetation inventory of current and historic
black-footed ferret habitat in Wyoming. Great Basin Naturalist Memoirs 8: 85-
93.
Erlinge, S. 1974. Distribution, territoriality and numbers of the weasel Mustela nivalis in
relation to prey abundance. Oikos 26: 308-314.
Fagerstone, K. A. 1987. Black-footed ferret, long-tailed weasel, short-tailed weasel, and
least weasel. Pages 549-573 in M. Novak, J. A. Baker, M. E. Obbard, and B.
Malloch, editors. Wild furbearer management and conservation in North
America. Ontario Ministry of Natural Resources.
Fagerstone, K. A., and D. E. Biggins. 1986. Comparison of capture-recapture and visual
count indices of prairie dog densities in black-footed ferret habitat. Great Basin
Naturalist Memoirs 8: 94-98.
17
Fagerstone, K. A., and B. E. Johns. 1987. Transponders as permanent identification
markers for domestic ferrets, black-footed ferrets, and other wildlife. Journal of
Wildlife Management 51: 294-297.
Forrest, S. C., T. W. Clark, L. Richardson, and T. M. Campbell, III. 1985. Black-footed
ferret habitat: some management and reintroduction considerations. Wyoming
BLM Wildlife Technical Bulletin No. 2.
Hillman, C. N., R. L. Linder, and R. B. Dahlgren. 1979. Prairie dog distribution in areas
inhabited by black-footed ferrets. American Midland Naturalist 102: 185-187.
Hoogland, J. L. 1995. The black-tailed prairie dog: social life of a burrowing mammal.
University of Chicago, Chicago, Illinois, USA.
Houston, B. R., T. W. Clark, and S. C. Minta. 1986. Habitat suitability index model for
the black-footed ferret: a method to locate transplant sites. Great Basin Naturalist
Memoirs 8:99-114.
Johnson, D. H. 2001. Habitat fragmentation effects on birds in grasslands and wetlands:
a critique of our knowledge. Great Plains Research 11: 211-213.
Knowles, C. J. 1986. Some relationships of black-tailed prairie dogs to livestock
grazing. Great Basin Naturalist 46: 198-203.
Linder, R. L., R. B. Dahlgren, and C. N. Hillman. 1972. Black-footed ferret-prairie dog
interrelationships. Pages 22-37 in Symposium on rare and endangered wildlife of
the Southwestern United States. New Mexico Department of Game and Fish,
Santa Fe, New Mexico, USA.
Lockhart, J. M., E. T. Thorne, and D. R. Gober. 2006. A historical perspective on
recovery of the black-footed ferret and the biological and political challenges
18

affecting its future. Pages 6-19 in J. E. Roelle, B. J. Miller, J. L. Godbey, and D.
E. Biggins, editors. Recovery of the black-footed ferret – progress and continuing
challenges. U.S. Geological Survey Scientific Investigations Report 2005-5293.
Melquist, W. E., and M. G. Hornocker. 1983. Ecology of river otters in west central
Idaho. Wildlife Monographs 83: 1-60.
Menkens, G. E., Jr., and S. H. Anderson. 1993. Mark-recapture and visual counts for
estimating population size of white-tailed prairie dogs. Pages 67-72 in J. L.
Oldemeyer, D. E. Biggins, and B. J. Miller, editors. Proceedings of the
symposium on the management of prairie dog complexes for the reintroduction of
the black-footed ferret. U.S. Fish and Wildlife Service Biological Report 13.
Miller, B. J., G. E. Menkens, and S. H. Anderson. 1988. A field habitat model for
black-footed ferrets. Pages 98-102 in D. W. Uresk, G. L. Schenbeck, and R.
Cefkin, technical coordinators. Eighth Great Plains wildlife damage control
workshop proceedings. U.S. Forest Service General Technical Report RM-154.
National Oceanic and Atmospheric Administration. 1993. Climatological data annual
summary, volume 8, number 13. National Oceanic and Atmospheric
Administration, National Climatic Data Center, Asheville, North Carolina, USA.
O’Meilia, M. E., F. L. Knopf, and J. C. Lewis. 1982. Some consequences of competition
between prairie dogs and beef cattle. Journal of Range Management 35: 580-
585.
Plumb, G. E., P. M. McDonald, and D. A. Searls. 1996. Black-footed ferret
reintroduction in South Dakota: project description and 1994 protocol. Pages 1-
34 in P. M. McDonald, P. E. Marinari, and G.E. Plumb, editors. Black-footed
19

ferret reintroduction: year one completion report, Conata Basin/Badlands, South
Dakota. U.S. Forest Service, Wall, South Dakota, USA.
Richardson, L., T. W. Clark, S. C. Forrest, and T. M. Campbell III. 1987. Winter
ecology of black-footed ferrets (Mustela nigripes) at Meeteetse, Wyoming.
American Midland Naturalist 117: 225-239.
Severson, K. E., and G. E. Plumb. 1998. Comparison of methods to estimate population
densities of black-tailed prairie dogs. Wildlife Society Bulletin 26: 859-866.
Sheets, R. G., R. L. Linder, and R. B. Dahlgren. 1972. Food habits of two litters of
black-footed ferrets in South Dakota. American Midland Naturalist 87: 249-251.
Stoneberg, R. 1996. Implanted microchips used to individually identify black-footed
ferrets in Montana. Prairie Naturalist 28: 163-168.
Stromberg, M. R., R. L. Rayburn, and T. W. Clark. 1983. Black-footed ferret prey
requirements: an energy balance estimate. Journal of Wildlife Management 47:
67-73.
Tileston, J. V., and R. R. Lechleitner. 1966. Some comparisons of the black-tailed and
white-tailed prairie dogs in north-central Colorado. American Midland Naturalist
75: 292-316.
20
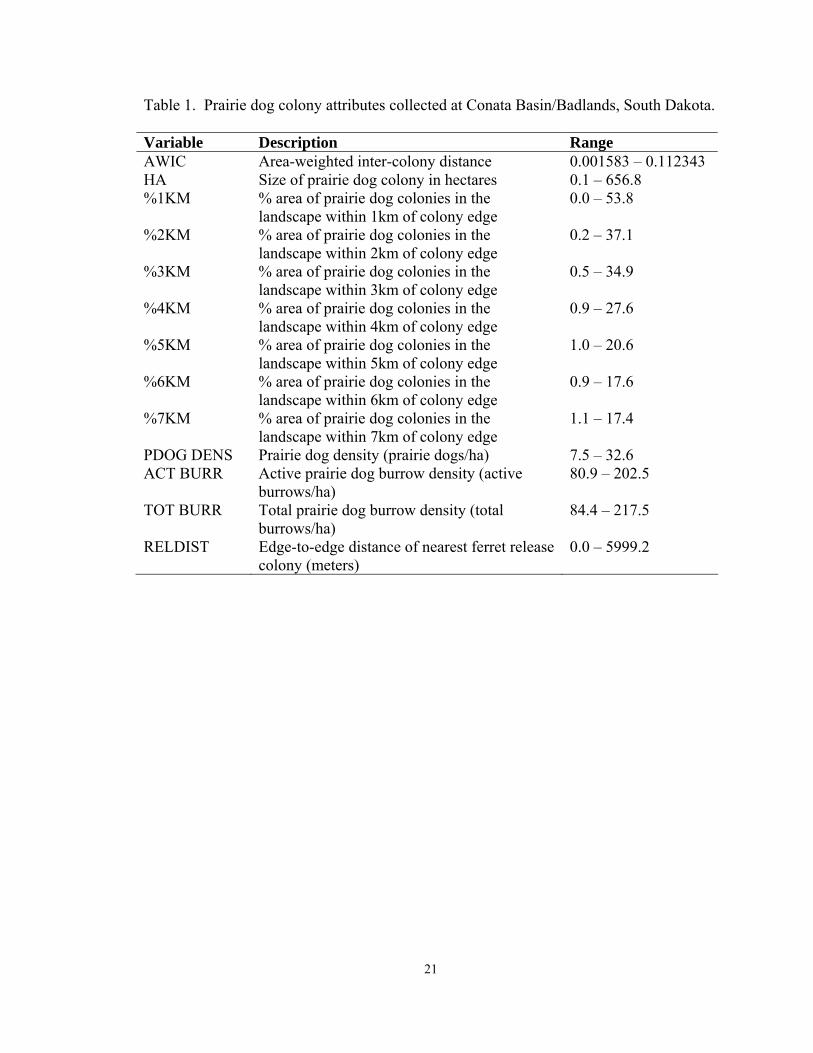
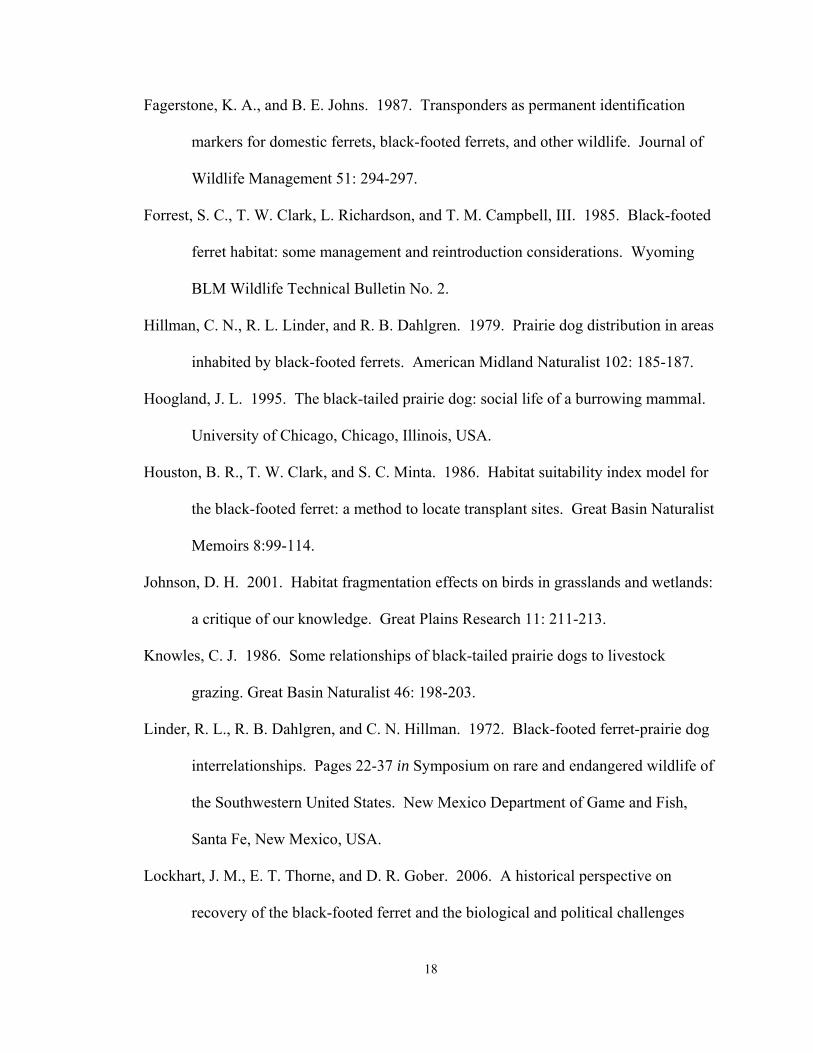
Table 1. Prairie dog colony attributes collected at Conata Basin/Badlands, South Dakota.
Variable Description Range AWIC Area-weighted inter-colony distance 0.001583 – 0.112343 HA Size of prairie dog colony in hectares 0.1 – 656.8 %1KM % area of prairie dog colonies in the
landscape within 1km of colony edge 0.0 – 53.8
%2KM % area of prairie dog colonies in the landscape within 2km of colony edge
0.2 – 37.1
%3KM % area of prairie dog colonies in the landscape within 3km of colony edge
0.5 – 34.9
%4KM % area of prairie dog colonies in the landscape within 4km of colony edge
0.9 – 27.6
%5KM % area of prairie dog colonies in the landscape within 5km of colony edge
1.0 – 20.6
%6KM % area of prairie dog colonies in the landscape within 6km of colony edge
0.9 – 17.6
%7KM % area of prairie dog colonies in the landscape within 7km of colony edge
1.1 – 17.4
PDOG DENS Prairie dog density (prairie dogs/ha) 7.5 – 32.6 ACT BURR Active prairie dog burrow density (active
burrows/ha) 80.9 – 202.5
TOT BURR Total prairie dog burrow density (total burrows/ha)
84.4 – 217.5
RELDIST Edge-to-edge distance of nearest ferret release colony (meters)
0.0 – 5999.2
21

Table 2. Mean and standard error for prairie dog colony variables used and unused by
black-footed ferrets at Conata Basin/Badlands, South Dakota.
Variable Used x (SE) n Unused x (SE) n AWIC 0.01168 (0.00206)* 64 0.00653 (0.00062)* 46 HA 56.7 (14.2)* 64 8.9 (1.6)* 46 %1KM 10.3 (1.4) 64 10.0 (1.3) 46 %2KM 12.1 (1.2) 64 9.6 (1.2) 46 %3KM 12.4 (1.0) 64 10.3 (1.1) 46 %4KM 11.8 (0.7) 64 10.3 (0.9) 46 %5KM 10.9 (0.6) 64 9.8 (0.7) 46 %6KM 10.2 (0.5) 64 9.2 (0.6) 46 %7KM 9.4 (0.5) 64 8.5 (0.5) 46 PDOG DENS (dogs/ha) 19.2 (3.9) 7 25.6 (0.0) 1 ACT BURR (per ha) 138.5 (6.7) 20 138.8 (15.0) 4 TOT BURR (per ha) 147.7 (8.0) 20 148.4 (9.3) 4 RELDIST (m) 840.2 (128.6)* 64 1275.7 (194.5)* 46 *Significant difference at α = 0.05.
22
23
Table 3. All logistic regression candidate models for black-footed ferret selection of
prairie dog colonies in South Dakota.
Models Log-
likelihood K
AICc Delta Weight Evidence
r2
HA + %7KM -60.83 3 127.88 0 0.14 0.207
HA -62.06 2 128.24 0.35 0.12 1.2 0.190
HA + %6KM -61.17 3 128.57 0.69 0.10 1.4 0.203
HA + AWIC -61.20 3 128.62 0.74 0.10 1.4 0.202
HA + %5KM -61.59 3 129.40 1.52 0.06 2.1 0.198
HA + %4KM -61.63 3 129.49 1.60 0.06 2.2 0.197
HA + %3KM -61.74 3 129.71 1.83 0.05 2.5 0.196
HA + RELDIST -61.75 3 129.73 1.84 0.05 2.5
0.196
HA + RELDIST + %7KM -60.83 4 130.04 2.15 0.05 2.9
0.208
HA + %1KM -61.95 3 130.12 2.23 0.04 3.1 0.193
HA + %2KM -62.00 3 130.22 2.33 0.04 3.2 0.193
HA + AWIC + RELDIST -61.13 4 130.64 2.76 0.03 4.0
0.205
HA + RELDIST + %1KM -61.14 4 130.67 2.78 0.03 4.0
0.204
HA + RELDIST + %6KM -61.17 4 130.72 2.84 0.03 4.1
0.204
HA + RELDIST + %5KM -61.55 4 131.48 3.59 0.02 6.0
0.200
HA + RELDIST + %4KM -61.59 4 131.55 3.67 0.02 6.3
0.199
HA + RELDIST + %3KM -61.66 4 131.71 3.82 0.02 6.8
0.198
HA + -61.75 4 131.88 3.99 0.02 7.4 0.197

RELDIST + %2KM
AWIC -71.28 2 146.68 18.79 0.00 12057.1 0.061
AWIC + RELDIST -70.98 3 148.18 20.30 0.00 25536.7
0.066
RELDIST -72.90 2 149.91 22.03 0.00 60655.2 0.033
%1KM + RELDIST -72.36 3 150.95 23.06 0.00 101857.9
0.043
%3KM -73.63 2 151.37 23.48 0.00 125547.2 0.021
%2KM -73.76 2 151.64 23.75 0.00 143644.9 0.018
%4KM -73.76 2 151.64 23.75 0.00 143724.9 0.018
%3KM + RELDIST -72.78 3 151.79 23.91 0.00 155319.4
0.036
%7KM + RELDIST -72.79 3 151.82 23.93 0.00 157229.8
0.036
%2KM + RELDIST -72.82 3 151.86 23.98 0.00 160952.6
0.035
%4KM + RELDIST -72.83 3 151.88 24.00 0.00 162390.3
0.035
%6KM + RELDIST -72.86 3 151.95 24.06 0.00 168070.7
0.034
%5KM + RELDIST -72.87 3 151.97 24.08 0.00 169657.3
0.034
%7KM -73.94 2 152.00 24.11 0.00 172306.3 0.015
%5KM -73.99 2 152.08 24.20 0.00 179676.7 0.014
%6KM -74.03 2 152.17 24.29 0.00 188009.6 0.013
%1KM -74.75 2 153.62 25.73 0.00 387402.0 0.000
24
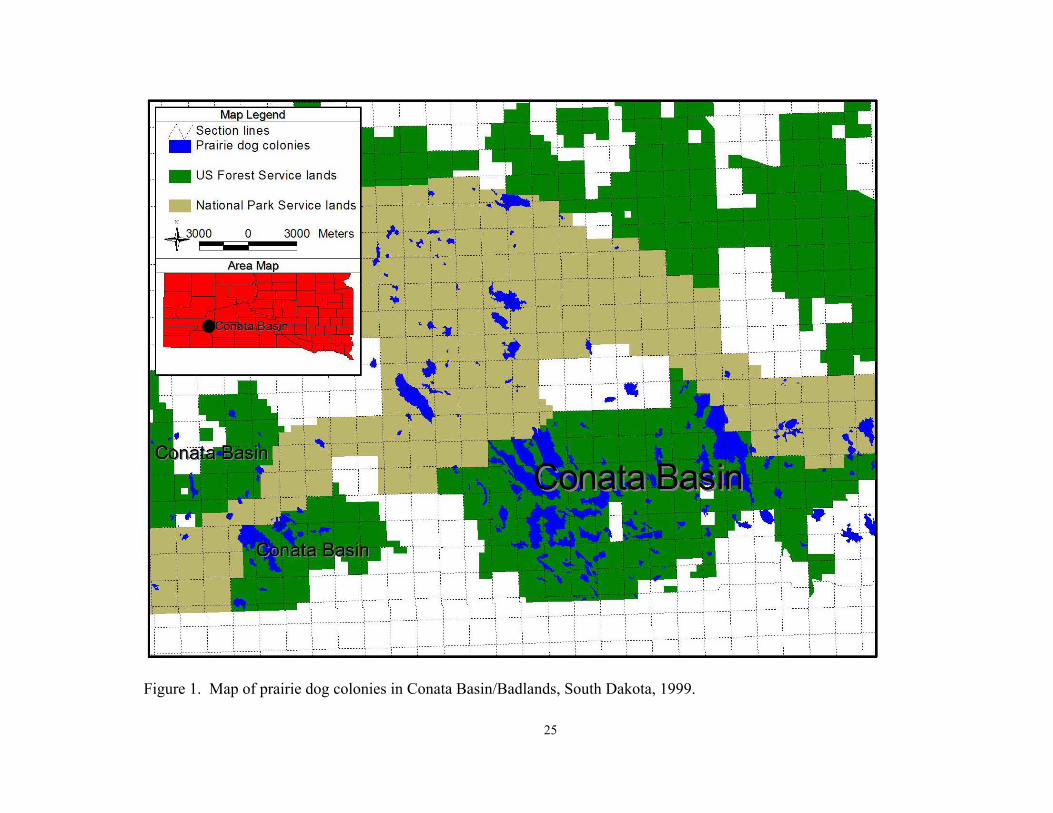
Figure 1. Map of prairie dog colonies in Conata Basin/Badlands, South Dakota, 1999.
25
end ,: ,/ Section lines - Prairie dog colonies
• US Forest Service lands
- National Park Service lands
0 3000 Meters :--.,. ; .:..-----, ····-··-\· . . ·;;,;·- ··-i· , ~'(' ' .. .., '
... : ... -1- -- ---;'···-··

-5.5
-4.7
-3.8
-3.0
3.0 4.7 6.3 8.0LN Colony size (ha)
LN m
ean
adul
t fem
ale
dens
ity
Figure 2. Relationship between adult female black-footed ferret density and prairie dog
colony size at Conata Basin/Badlands, South Dakota, 2003-2004.
26
• • • • •
• •
• •• •
•
-0.2
0.3
0.9
1.4
3.0 5.0 7.0 9.0LN Colony size (ha)
LN K
its p
er a
dult
fem
ale
Figure 3. Relationship between kits per adult female black-footed ferret (relative fitness)
and colony size in South Dakota, 2003-2004.
27
-• • • •
• • • • •• -• •
• • •

2.0
3.0
4.0
5.0
1.0 3.0 5.0 7.0LN Colony size (ha)
LN p
rairi
e do
gs/h
a
Figure 4. Relationship between prairie dog density and prairie dog colony size in South
Dakota, 1997-1999.
28
•
• • • • • •
•• • • • • • • • •
• • •
4.2
4.7
5.1
5.6
0.0 2.3 4.7 7.0LN Colony size (ha)
LN a
ctiv
e bu
rrow
s/ha
Figure 5. Relationship between active prairie dog burrow density and prairie dog colony
size in South Dakota, 1997-1999.
29
• • •
• • • • • • • • .. • • • • • • • • • • • •
• • • • •
•

CHAPTER 2
BLACK-FOOTED FERRET HOME RANGES IN CONATA BASIN, SOUTH
DAKOTA
ABSTRACT
Estimates of black-footed ferret (Mustela nigripes) spatial use of prairie dog (Cynomys
spp.) colonies are needed for planning prairie dog reserves and ferret reintroductions.
Few previous published estimates of ferret home range size exist and were based upon
ferrets inhabiting white-tailed prairie dog (Cynomys leucurus) colonies, which are
spatially unlike black-tailed prairie dog (Cynomys ludovicianus) colonies. I collected
ferret locations in the Conata Basin of South Dakota through spotlighting methods and
used kernel methods to estimate home range size at the 95 and 50% contours and 100%
minimum convex polygon for both sexes. Amount of inter- and intra-sexual overlap was
calculated by overlaying individual home ranges. A minimum of 23 locations was
sufficient to estimate home ranges of 28 ferrets (20 female, 8 male). Mean (± SE) 95%
and 50% fixed kernel annual home range size of females (64.7 ± 11.6 ha and 12.7 ± 3.0)
was significantly smaller than males (131.8 ± 40.3 and 35.6 ± 16.5). Minimum convex
polygon home range estimates also differed between females (41.9 ± 6.5 ha) and males
(86.3 ± 21.3 ha). Female home range size was negatively related to male density and
male home range size was positively associated with age. Inter-sexual overlap and intra-
sexual exclusivity of home ranges was evident, suggesting ferrets conform to a typical
mustelid spacing pattern. 50% Fixed kernel areas had higher estimated prairie dog
densities than 95% areas suggesting core areas are centered around high prairie dog
30
densities. The large home range and low intra-sexual overlap of ferrets suggest large
areas are needed for conservation of the species.
INTRODUCTION
Black-footed ferrets (Mustela nigripes) are federally endangered mustelids that rely
upon prairie dogs (Cynomys spp.) for food and shelter (Biggins et al. 2006c). Because of
their secretive, nocturnal habits and rarity, only two populations of ferrets were
previously studied. The first population was studied between 1964 – 1974 in Mellette
County, South Dakota and subsequently disappeared in 1974. There was also a
population in Meeteetse, Wyoming that was discovered in 1981 (Forrest et al. 1988).
After a catastrophic decline in the population due to disease, the last 18 individuals were
rescued from the wild and a successful captive breeding program began (Miller et al.
1996). Enough “excess” ferrets were produced in captivity that reintroductions into the
wild began in 1991 and continue to the present in six states and Mexico (Lockhart et al.
2006). Relatively little is known about spatial use of prairie dog colonies by ferrets, the
only habitat they occupy. In the course of planning prairie dog reserves and managing
for black-footed ferret reintroduction an understanding of ferret spatial use is vital to
estimating the size of prairie dog colonies needed to sustain a viable population of ferrets.
There are few previous published estimates of ferret home range size. Indeed, a vast
majority of the previous data on ferret movements came from the Meeteetse, Wyoming
population, which survived on white-tailed prairie dogs (Cynomys leucurus). Tileston and
Lechleitner (1966) found black-tailed prairie dogs (Cynomys ludovicianus) are more
clustered and dense than white-tailed prairie dogs, hence ferret movement estimates from
Meeteetse may not apply in South Dakota, which contains only black-tailed prairie dogs.
31

At Meeteetse, snow-tracking revealed a young female used 16.0 ha from December to
March and was overlapped by a male that used 136.6 ha (Forrest et. al 1985). Biggins et
al. (1985) used minimum convex polygon (MCP; Mohr 1947) to estimate that a radio-
collared female and male used 12.6 and 27.5 ha respectively over a 15-day period and the
female continued to use an MCP range of 53 ha after the first 15 days. Fagerstone (1987)
reported monthly (Aug – Dec) MCP areas for a juvenile female and an adult male at
Meeteetse as 1.2 – 106.8 ha and 13.1 – 257.8 ha respectively.
Evidence from Meeteetse suggests male black-footed ferrets have larger home ranges
than females, a pattern typically observed in solitary polygynous animals (Baker 1978,
Sandell 1989). Forrest et al. (1985) suggest male ferrets select home ranges to primarily
maximize access to females and only secondarily to maximize food resources. Female
range sizes, however, are driven more by the area needed to meet their and their
offspring’s physiological needs. Ferrets likely conform to a typical mustelid spacing
pattern with inter-sexual overlap and intra-sexual exclusion (Powell 1979, Forrest et al.
1985).
In addition to gender, several biological and environmental factors may influence
black-footed ferret home range size. Ferrets born in captivity may exhibit difference in
home ranges, due to lingering influences from captivity, compared to their wild-born
counterparts such as differences in exploratory behaviors or increased time spent above-
ground. Age may affect home range size and Biggins et al. (2006a) postulated older age
may confer a greater social status to males that competitively exclude younger males.
Ferrets have been observed year-round on colonies as small as 17.8 ha in South Dakota
(T. Livieri, unpublished data), thus colony size may influence home range size. Sandell
32
(1989) found density of conspecifics highly negatively correlated with home range size in
solitary carnivores and density is likely related to food abundance. Thus density of
ferrets as a function of prairie dog abundance may influence home range size. Prey
density has been shown to influence home range size of other mustelids, including;
martens (Martes americana; Thompson and Colgan 1987), long-tailed weasels (Mustela
frenata) and short-tailed weasels (Mustela erminea; Fagerstone 1987). Although ferrets
are territorial, the duration of their lifespan may influence home range size as their range
occasionally shifts annually. I have observed several adult female black-footed ferrets
abandoning their home range after weaning their kits, presumably to allow the kits to
inherit her range (T. Livieri, unpublished data).
The objective of this study was to estimate black-footed ferret home range size,
identify factors that may influence home range size, and estimate inter- and intra-sexual
overlap in home range. To achieve this objective ferret locations from Conata Basin, a
portion of the Buffalo Gap National Grassland in southwestern South Dakota, were used
to estimate home range size, and to examine the effects of gender, origin (captive-born or
wild-born), age (1-year old or >1-year old), prairie dog colony size, prairie dog density,
inter- and intra-sexual ferret density and number of locations on range size, as well as
calculating overlap. Annual and lifetime home ranges were estimated.
STUDY AREA
The Conata Basin is a 29,000 ha mixed-grass prairie located on the Buffalo Gap
National Grassland in eastern Pennington County, South Dakota and administered by the
USDA Forest Service. Vegetation was dominated by western wheatgrass (Agropyron
smithii), buffalograss (Buchloe dactyloides), and blue grama (Bouteloua gracilis) and
33
primary land uses were permitted cattle grazing and recreation. The area contained 4,050
ha of prairie dog colonies, mapped in 1999 by driving the perimeter of the colony with a
differentially corrected Global Positioning System (GPS) and imported into ArcView 3.1.
Black-footed ferrets were extirpated from South Dakota by 1974 (Fagerstone 1987) until
146 captive-born animals were reintroduced into Conata Basin from 1996-1999. The
ferret population in this study was comprised of captive-born released individuals and
their wild-born offspring, totaling approximately 200 individuals annually from 2000-
2006 (T. M. Livieri, Prairie Wildlife Research, unpublished report).
METHODS
Black-footed ferret locations
Black-footed ferrets are nocturnal and were located by spotlighting methods on prairie
dog colonies (Clark et al. 1983, Campbell et al. 1985, Biggins et al. 2006b). Locations
were recorded with differentially corrected GPS with a location error of less than one
meter. All animals were marked with passive integrated transponder (PIT) tags
(Fagerstone and Johns 1987, Stoneberg 1996) prior to release or shortly after birth in the
wild. Ferrets were identified using a passive reader at the occupied prairie dog burrow.
Spotlighting occurred throughout the year with the exception of June and the most effort
expended was from September-January during dispersal. Ferret kits typically become
independent of their mothers in September-October and disperse to find their own
territories (Henderson et al. 1969, Biggins et al. 1986, T. Livieri, unpublished data).
Black-footed ferret density was estimated as the maximum number of “resident”
ferrets occupying the same colony in spring and summer divided by the colony size
(Forrest et al. 1985). I defined “resident” ferrets as animals occupying a colony from
34
October 1 through March 1 or beyond, concurrent with breeding, parturition, and
whelping.
I explored the relationship between home range size and prairie dog density using the
GPS locations of all prairie dog burrows of one colony overlaid with ferret home ranges.
Prairie dog burrows were mapped using differentially-corrected GPS units and classified
as active, inactive or plugged based upon presence of fresh scat (Biggins et al. 1993).
Active prairie dog burrow numbers within each ferret home range were converted to
number of prairie dogs to estimate prairie dog density following the calculations of
Biggins et al. (1993; Prairie dog density = 0.179 x active burrow density / 0.566).
Data analysis
Black-footed ferret location data were screened by multiple colony moves, total
number of locations, and temporal distribution. Ferrets that used multiple prairie dog
colonies in a year were removed from analysis because such movement suggests a non-
stationary home range. I used an area-per-observation curve (Odum and Kuenzler 1955)
for 8 ferrets to estimate the minimum number of locations needed to assess home range
size. Locations within the first 30 days post-release or post-dispersal were eliminated to
allow for establishment of a territory after the initial exploratory/dispersal period. For
annual home range estimates I used only ferrets that had one location in at least 6
different months to ensure accurate representation of annual home ranges. Lifetime
home ranges of the same animals were estimated using all locations over the known
duration of life for each animal.
Home range size was estimated using the Animal Movement Extension v2.0 (Hooge
et al. 1999) in ArcView 3.1. Three estimators were used; fixed kernel (FK) at 95% and
35
50% contours (Worton 1989) and 100% MCP (Mohr 1947). Fixed kernel estimates used
least-squares cross-validation. I considered the 95% contour the extent of the range and
the 50% contour as the core area of ferret use. Because ferrets only use prairie dog
colonies (Biggins et al 2006c) resulting home ranges were clipped to include only prairie
dog colonies (Figure 6). MCP was included for comparison to earlier studies despite the
drawbacks of the method for assessing home range size (White and Garrott 1990, Fuller
et al. 2005). I calculated the overlap of home ranges for all methods (95% FK, 50% FK,
MCP) within and between sexes as a percentage of each animal’s range. Only ferrets
whose 95% FK ranges overlapped by more than 1% and all core area overlaps of those
animals were reported. Because not all ferrets identified were used in home range
analyses and some ferrets may not have been located, the estimated degree of overlap is
likely an underestimate of the actual overlap.
Black-footed ferret home range estimates were tested for normality using Shapiro-
Wilk W (Shapiro and Wilk 1965) and normalized using natural logarithm transformations
when necessary. A two-way ANOVA with Tukey-Kramer Multiple Comparison test was
used to compare home range size between gender and origin (captive- or wild-born).
Multiple linear regression was used to determine factors that may influence black-footed
ferret home range size (Table 4). Models were evaluated for goodness-of-fit using r2,
Akaike’s Information Criterion corrected for small sample size (AICc; Burnham and
Anderson 2002) and Akaike weights. AICc uses log-likelihood and the number of
parameters to evaluate the bias and precision of all possible model subsets. The top
competing models had Akaike evidence <3 and high r2. Significance was α=0.10 for all
analyses because of the small sample sizes.
36
RESULTS
Sample size
I constructed an area-per-observation curve (Odum and Kuenzler 1955) to assess
minimum number of locations needed to estimate black-footed ferret annual home range
size. The first 30 independent locations of 8 ferrets (7 female, 1 male) were used. Time
to independence (TTI) was considered 12 hours, ample time for a ferret to traverse its
home range. Seaman et al. (1999) recommended a minimum of 30 observations when
using kernel methods. Mean percent change in 95% fixed kernel home range size for
successive locations showed <3% increase in home range size with >23 locations (Figure
7). Hence, 23 independent locations were considered as the minimum number of
locations needed to describe ferret home ranges. If an animal had >23 independent
locations I then used all locations for home range estimates, regardless of independence
because TTI has little influence on kernel or MCP estimates (Swihart and Slade 1997).
Others have also reported autocorrelated locations do not influence home range estimates
or provide a more accurate estimate (Andersen and Rongstad 1989, Gese et al. 1990,
Reynolds and Laundre 1990, DeSolla et al. 1999). For MCP, increase in home range size
also appeared to slow after 23 locations (Figure 8), but does not plateau (<3% change)
until 27-28 locations, suggesting 23 locations likely underestimates total home range size
by the MCP technique.
Annual home range
Spotlight population monitoring of black-footed ferrets occurred from 1 October 1997
– 30 September 2000 and identified 306 individual ferrets (160 females, 146 males)
4,540 times. Search effort was 239 spotlight nights with the highest effort in the summer
37
and fall months during litter emergence and ferret dispersal (Hillman and Clark 1980,
Clark 1989). Personnel and equipment limitations did not allow for spotlight searches of
all occupied colonies on a given night therefore not all ferrets were available to be
sampled on each search night. Twenty-eight ferrets (4 adult female, 16 juvenile female, 3
adult male, 5 juvenile male; Appendix 1) occupying 6 prairie dog colonies with a total of
834 locations met the data screening criteria and were included in home range analyses.
Locations from 1 Jul – 31 Dec comprised 80.1% of all locations analyzed.
The mean ± SE 95% FK areas for females and males were 64.7 ± 11.6 ha and 131.8 ±
40.3 ha, respectively, and were significantly different (F1,24 = 4.39, P = 0.047) although
no difference was found between wild and captive-born animals (F1,24 = 1.06, P = 0.313).
Estimates for the 95% contour ranged from 13.9 – 202.7 ha for females and 31.7 – 361.4
ha for males. Mean 50% FK areas for females and males were 12.7 ± 3.0 ha and 35.6 ±
16.5 ha, respectively, and were also significantly different (F1,24 = 4.67, P = 0.041) while
there was no difference between captive- and wild-born animals (F1,24 = 1.22, P = 0.280).
Core areas (50% FK) ranged from 1.7 – 56.0 ha for females and 3.9 – 142.9 ha for males.
Mean MCP areas for females and males were 41.9 ± 6.5 ha and 86.3 ± 21.3 ha,
respectively, and differed significantly (F1,24 = 5.22, P = 0.031). There were no
differences based on captive versus wild-born ferrets (F1,24 = 0.29, P = 0.593). Estimates
for MCP ranged from 9.0 – 119.1 ha for females and 20.2 – 180.7 ha for males.
In the absence of prairie dog density as a variable, multiple linear regression models
revealed increasing female black-footed ferret home range size was most strongly
associated with decreasing male density for all three models (95% FK, 50% FK, MCP;
Tables 5-7). A positive association with colony size was also present in the top
38
competing models for the 95% and 50% FK. For males, age alone was positively related
to home range size for 95% FK and MCP models. The competing 50% FK models
identified colony size and age as positively related to male home range size, and
negatively related to densities of males, females and combined genders (Tables 8-10).
Overlap
Intra-sexual overlap of annual home ranges (95% FK and MCP) was evident in both
genders. Core areas had very little intra-sexual overlap (Table 11). Males overlapped a
higher proportion of female ranges than females overlapping males. Core areas for males
had no intra-sexual overlap and only 2 females had core area intra-sexual overlap
suggesting a high level of intra-sexual territoriality. Home range overlap was most likely
underestimated because several animals that were present within the range of another
ferret did not meet the minimum number of locations to estimate their home ranges and
were excluded from the analysis.
Lifetime home range
All locations over the known lifetimes of the same 28 black-footed ferrets were used
to estimate lifetime home ranges. Mean 95% FK home range sizes were 81.7 ± 14.2 ha
and 157.4 ± 51.9 for females and males, respectively, but not significantly different
between gender (F1,24 = 2.68, P = 0.114) nor origin (F1,24 = 0.44, P = 0.515). Estimates
of 95% FK area ranged from 16.2 – 263.0 ha for females and 30.6 – 419.8 ha for males.
For 50% FK, mean home range sizes were 15.1 ± 4.0 ha and 42.9 ± 18.4 ha for females
and males respectively and were significantly different (F1,24 = 3.24, P = 0.085), ranging
from 2.0 -79.6 ha for females and 4.1 – 129.8 ha for males. I found no difference in
origin (F1,24 = 1.00, P = 0.327) for 50% FK ranges. MCP mean home range size was 63.2
39
± 10.2 ha for females and 125.1 ± 44.2 ha for males and was not different between
genders (F1,24 = 2.75, P =0.111) nor origin (F1,24 = 0.16, P = 0.696). MCP area ranged
from 11.6 – 181.6 ha and 24.7 – 401.2 ha for females and males, respectively.
Lifetime home range size was significantly larger than annual home range for male
MCP ranges (P = 0.017) but not for 95% FK (P = 0.152) or 50% FK (P = 0.689). Home
range size of female ferrets was significantly different for 95% FK (P = 0.003) and MCP
(P <0.001) but not for 50% FK (P = 0.199). Not surprisingly, both male and female
lifetime home range regression models were positively associated with duration of life.
In 1999 I mapped 21,800 prairie dog burrows (19,105 active, 2,307 inactive, 388
plugged) on one prairie dog colony. The home ranges of 4 ferrets (1 male, 3 female)
were overlaid on burrow distribution to estimate burrow density and prairie dog density
per range (Table 12). The small sample size of ferret home ranges (4) precluded a
meaningful regression analysis of the relationship between prairie dog density and ferret
home range size. Using a paired t-test I found a significantly higher prairie dog density
in 50% FK areas than 95% FK areas (P = 0.047), suggesting core area may be
concentrated in areas of higher prairie dog density (Table 13).
DISCUSSION
Annual home range
At Conata Basin male black-footed ferret home ranges were significantly larger than
females similar to the findings of Biggins et al. (1985) and Fagerstone (1987) at
Meeteetse. The MCP estimates of 16.0 ha and 136.6 ha for a female and male ferret
respectively at Meeteetse (Biggins et al. 1985) both fall within the range of estimates at
Conata Basin. Although my research did not attempt to measure prairie dog density in
40
relation to home range size, females may select home ranges to maximize resources such
as high prey density whereas males may be maximizing access to females (Baker 1978,
Sandell 1989, Miller et al. 1996). Ferrets in Montana and Conata Basin preferred areas
with higher prairie dog density (Biggins et al. 2006c) which may explain some of the
variation in home range size at Conata Basin, although Forrest et al. (1985) found white-
tailed prairie dog burrow density did not appear to influence activity area size for 21
unidentified ferrets.
Male ferret density was negatively related to female ferret home range size, while
colony size was positively related. This suggests that as prairie dog colonies become
larger and as male density decreases, female home range size increases.
Age influenced male 95% FK and MCP home range size suggesting older males may
be more dominant and willing to travel further to extend their breeding opportunities.
They may also be more successful at excluding younger males as suggested by Biggins et
al. (2006a). Forrest et al. (1988) found adult ferrets exhibited annual site fidelity,
implying established older animals can successfully defend their home ranges from
younger ferrets. Biggins et al. (2006c) found prior residency of ferrets imparted an
advantage in selecting areas with higher burrow density (habitat quality) over
newcomers. Colony size positively influenced male 50% FK area sizes.
Overlap
Ferrets seem to conform to a typical mustelid spacing pattern of inter-sexual overlap
and intra-sexual exclusion (Powell 1979, Forrest et al. 1985) although there is some
tolerance of intra-sexual overlap at the 95% FK and MCP levels. The relatively high
male-male overlap observed in the 95% FK is likely due to 3 locations of one ferret in
41
another male territory during one night in April 2000. When these 3 locations are
removed from the data set the mean male-male overlap at 95% FK falls to 1.4% and
MCP to zero. These locations might have been exploratory or an attempt at breeding a
female outside the normal territory. Individual males overlapped a higher proportion of
individual female ranges than individual females overlapped on individual males which is
a consequence of males having larger ranges than females.
Lifetime home range
Duration of lifetime positively influenced the 50% FK range size in females indicating
ranges may shift over time. This may be a possible response to temporary depletion of
prairie dogs by a ferret or may be the result of competitive interactions with adjacent
female ferrets. Occasionally an adult female will abandon her range to her kits and
establish a new range (T. Livieri, personal observation), which would inflate range size
over a longer life span rather than a typical sedentary pattern.
MANAGEMENT IMPLICATIONS
Ferguson and Lariviere (2004) suggest mustelids in general occupy highly seasonal
environments, have larger home ranges and lower population densities than other
terrestrial carnivores. In the absence of catastrophic factors, such as sylvatic plague
(Yersinia pestis), black-footed ferrets occupy a relatively stable environment compared to
the conspecific Siberian polecat (Mustela eversmanii; Biggins 2000) and other mustelids
but the home range of ferrets is large in relation to energetic needs. Converting active
burrow densities to number of prairie dogs (Biggins et al. 1993), the 50% FK home range
of 4 ferrets in Conata Basin had higher prairie dog density than the 95% FK area
suggesting a relationship between prairie dog density and location of core activity areas.
42
The 95% FK area encompassed more than several times the 272.5 – 763 prairie dogs
modeled by Biggins et al. (1993) estimated to sustain a ferret family (Table 12) implying
prairie dog density may not influence the size of the 95% FK range. However, the
difference between prairie dog density in the 50% FK and remaining 95% FK suggests
prairie dog density may influence the location of core (50% FK) areas. The low amount
of intra-sexual overlap and large home range of ferrets suggest large areas are needed for
conservation of the species. My home range estimates of black-footed ferrets could be
used with habitat suitability models to estimate carrying capacity and provide needed data
for recovery planning and prairie dog reserve designs.
LITERATURE CITED
Andersen, D. E., and O. J. Rongstad. 1989. Home-range estimates of red-tailed hawks
based on random and systematic relocations. Journal of Wildlife Management 53:
802-807.
Baker, R. R. 1978. The evolutionary ecology of animal migration. Holmes and Meier,
New York, New York, USA.
Biggins, D. E. 2000. Predation on black-footed ferrets (Mustela nigripes) and Siberian
polecats (M. eversmanii): conservation and evolutionary implications.
Dissertation, Colorado State University, Fort Collins, CO, USA.
Biggins, D. E., J. L. Godbey, T. M. Livieri, M. R. Matchett, and B. Bibles. 2006a.
Postrelease movements and survival of adult and young black-footed ferrets.
Pages 191-200 in J. E. Roelle, B. J. Miller, J. L. Godbey, and D. E. Biggins,
editors. Recovery of the black-footed ferret – progress and continuing challenges.
U.S. Geological Survey Scientific Investigations Report 2005-5293.
43
Biggins, D. E., J. L. Godbey, M. R. Matchett, L. R. Hanebury, T. M. Livieri, and P. E.
Marinari. 2006b. Monitoring black-footed ferret during reestablishment of free-
ranging populations: discussion of alternative methods and recommended
minimum standards. Pages 155-174 in J. E. Roelle, B. J. Miller, J. L. Godbey,
and D. E. Biggins, editors. Recovery of the black-footed ferret – progress and
continuing challenges. U.S. Geological Survey Scientific Investigations Report
2005-5293.
Biggins, D. E., J. L. Godbey, M. R. Matchett and T. M. Livieri. 2006c. Habitat
preferences and intraspecific competition in black-footed ferrets. Pages 129-140
in J. E. Roelle, B. J. Miller, J. L. Godbey, and D. E. Biggins, editors. Recovery of
the black-footed ferret – progress and continuing challenges. U.S. Geological
Survey Scientific Investigations Report 2005-5293.
Biggins, D. E., B. J. Miller, L. R. Hanebury, B. Oakleaf, A. H. Farmer, R. Crete, and A.
Dood. 1993. A technique for evaluating black-footed ferret habitat. Pages 73-87
in J. Oldemeyer, D. Biggins, and B. Miller, eds., Management of Prairie Dog
Complexes for the Reintroduction of the Black-footed Ferret. U.S. Fish and
Wildlife Service Biological Report 93-13, Washington, D.C., USA.
Biggins, D. E., M. Schroeder, S. Forrest, and L. Richardson. 1985. Movements and
habitat relationships of radio-tagged black-footed ferrets. Pages 11.1-11.17 in S.
H. Anderson and D. B. Inkley, editors. Black-footed ferret workshop proceedings.
Wyoming Game and Fish Department, Cheyenne, Wyoming, USA.
Biggins, D. E., M. H. Schroeder, S. C. Forrest, and L. Richardson. 1986. Activity of
radio-tagged black-footed ferrets. Great Basin Naturalist Memoirs 8: 135-140.
44
Burnham, K. P., and D. R. Anderson. 2002. Model selection and multi-model inference.
Springer Verlag Inc., New York, New York, USA.
Campbell, T. M. III, D. E. Biggins, S. C. Forrest and T. W. Clark. 1985. Spotlighting as
a method to locate and study black-footed ferrets. Pages 24.1-24.7 in S. H.
Anderson and D. B. Inkley, editors. Proceedings of the black-footed ferret
workshop. Wyoming Game and Fish Department, Cheyenne, Wyoming, USA.
Clark, T. W. 1989. Conservation biology of the black-footed ferret. Wildlife
Preservation Trust Special Scientific Report No. 3.
Clark, T. W., T. M. Campbell III, M. H. Schroeder, and L. Richardson. 1983. Handbook
of methods for locating black-footed ferrets. Wyoming Bureau of Land
Management Wildlife Technical Bulletin No. 1.
De Solla, S. R., R. Bonduriansky, and R. J. Brooks. 1999. Eliminating autocorrelation
reduces biological relevance of home range estimates. Journal of Animal Ecology
68: 221-234.
Fagerstone, K. A. 1987. Black-footed ferret, long-tailed weasel, short-tailed weasel, and
least weasel. Pages 549-573 in M. Novak, J. A. Baker, M. E. Obbard, and B.
Malloch, editors. Wild furbearer management and conservation in North
America. Ontario Ministry of Natural Resources.
Fagerstone, K. A., and B. E. Johns. 1987. Transponders as permanent identification
markers for domestic ferrets, black-footed ferrets, and other wildlife. Journal of
Wildlife Management 51: 294-297.
Ferguson, S. H., and S. Lariviere. 2004. Is mustelid life history different? Pages 2-19 in
D. J. Harrison, A. K. Fuller, and G. Proulx, editors. Martens and fishers (Martes)
45
in human-altered environments: an international perspective. Kluwer Academic
Publishers, Norwell, Massachusetts, USA.
Forrest, S. C., D. E. Biggins, L. Richardson, T. W. Clark, T. M. Campbell, III, K. A.
Fagerstone, and E. T. Thorne. 1988. Population attributes for the black-footed
ferret (Mustela nigripes) at Meeteetse, Wyoming, 1981-1985. Journal of
Mammalogy 69: 261-273.
Forrest, S. C., T. W. Clark, L. Richardson, and T. M. Campbell, III. 1985. Black-footed
ferret habitat: Some management and reintroduction considerations. Wyoming
Bureau of Land Management Wildlife Technical Bulletin No. 2.
Fuller, M. R., J. J. Millspaugh, K. E. Church, and R. E. Kenward. 2005. Wildlife
radiotelemetry. Pages 377-417 in C. E. Braun, editor. Techniques for wildlife
investigations and management. Sixth edition. The Wildlife Society, Bethesda,
Maryland, USA.
Gese, E. M., D. E. Andersen, and O. J. Rongstad. 1990. Determining home range size of
resident coyotes from point and sequential locations. Journal of Wildlife
Management 54: 501-506.
Henderson, F. R., P. F. Springer, and R. Adrian. 1969. The black-footed ferret in South
Dakota. South Dakota Game, Fish and Parks Technical Bulletin No. 4.
Hillman, C. N., and T. W. Clark. 1980. Mustela nigripes. Mammalian species 126: 1-3.
Hooge, P. N., B. Eichenlaub, and E. Solomon. 1999. The animal movement program.
Alaska Biological Science Center, U.S. Geological Survey, Anchorage, Alaska,
USA.
Lockhart, J. M., E. T. Thorne, and D. R. Gober. 2006. A historical perspective on
46
recovery of the black-footed ferret and the biological and political challenges
affecting its future. Pages 6-19 in J. E. Roelle, B. J. Miller, J. L. Godbey, and D.
E. Biggins, editors. Recovery of the black-footed ferret – progress and continuing
challenges. U.S. Geological Survey Scientific Investigations Report 2005-5293.
Miller, B., R. P. Reading, and S. Forrest. 1996. Prairie night: black-footed ferrets and
the recovery of endangered species. Smithsonian Institution Press, Washington,
D.C., USA.
Mohr, C. O. 1947. Table of equivalent populations of North American small mammals.
American Midland Naturalist 37: 223-449.
Odum, E. P. and E. J. Kuenzler. 1955. Measurement of territory and home range size in
birds. Auk 72: 128-137.
Powell, R. A. 1979. Mustelid spacing patterns: variations on a theme by Mustela.
Zeitschrift fur Tierpsychologie 50: 153-165.
Reynolds, T. D., and J. W. Laundre. 1990. Time intervals for estimating pronghorn and
coyote home ranges and daily movements. Journal of Wildlife Management 54:
316-322.
Sandell, M. 1989. The mating tactics and spacing patterns of solitary carnivores. Pages
164-182 in J. L. Gittleman, editor. Carnivore behavior, ecology, and evolution
Volume 1. Cornell University Press, Ithaca, New York, USA.
Seaman, D. E., J. J. Millspaugh, B. J. Kernohan, G. C. Brundige, K. J. Raedeke and R. A.
Gitzen. 1999. Effects of sample size on kernel home range estimates. Journal of
Wildlife Management 63: 739-747.
Shapiro, S. S., and M. B. Wilk. 1965. An analysis of variance test for normality
47
(complete samples). Biometrika 52: 591-611.
Stoneberg, R. 1996. Implanted microchips used to individually identify black-footed
ferrets in Montana. Prairie Naturalist 28: 163-168.
Swihart, R. K. and N. A. Slade. 1997. On testing for independence of animal
movements. Journal of Agricultural, Biological and Environmental Statistics 2:
48-63.
Thompson, I. D. and P. W. Colgan. 1987. Numerical responses of martens to a food
shortage in northcentral Ontario. Journal of Wildlife Management Manage. 51:
824-835.
Tileston, J. V., and R. R. Lechleitner. 1966. Some comparisons of the black-tailed and
white-tailed prairie dogs in north-central Colorado. American Midland Naturalist
75: 292-316.
White, G. C., and R. A. Garrott. 1990. Analysis of wildlife radio-tracking data.
Academic Press, San Diego, California, USA.
Worton, B. J. 1989. Kernel methods for estimating the utilization distribution in home-
range studies. Ecology 70: 164-168.
48
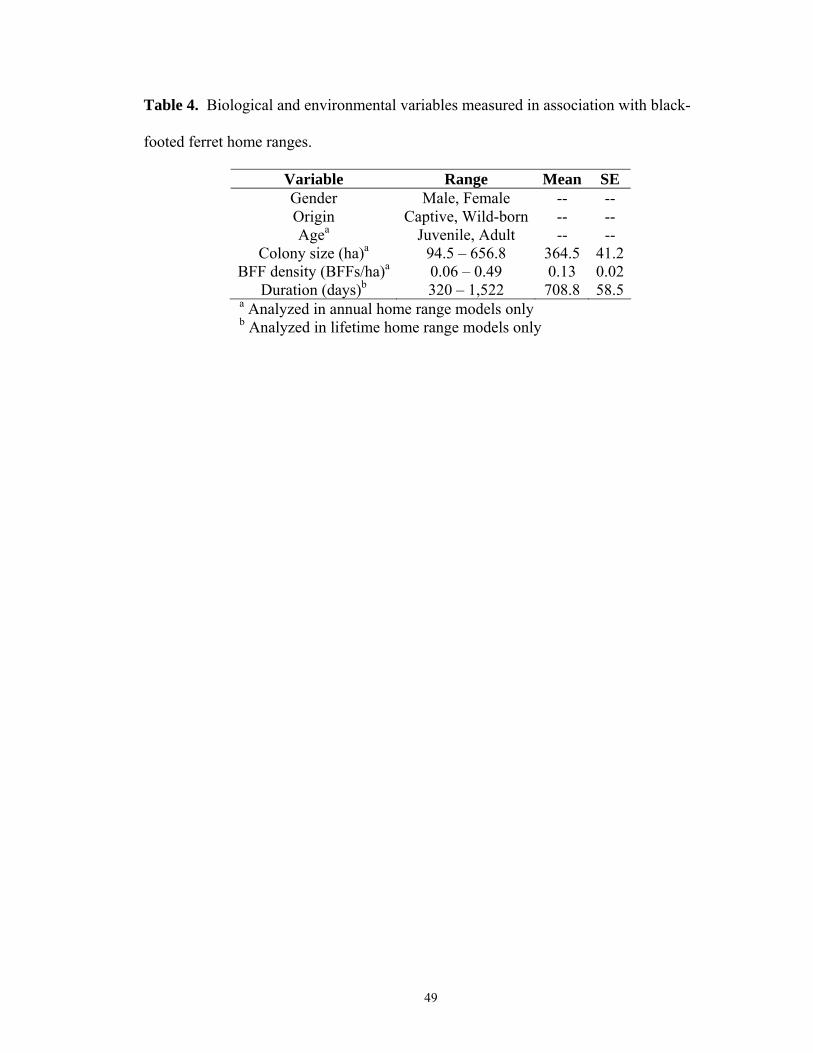
Table 4. Biological and environmental variables measured in association with black-
footed ferret home ranges.
Variable Range Mean SE Gender Male, Female -- -- Origin Captive, Wild-born -- -- Agea Juvenile, Adult -- --
Colony size (ha)a 94.5 – 656.8 364.5 41.2 BFF density (BFFs/ha)a 0.06 – 0.49 0.13 0.02
Duration (days)b 320 – 1,522 708.8 58.5 a Analyzed in annual home range models only b Analyzed in lifetime home range models only
49
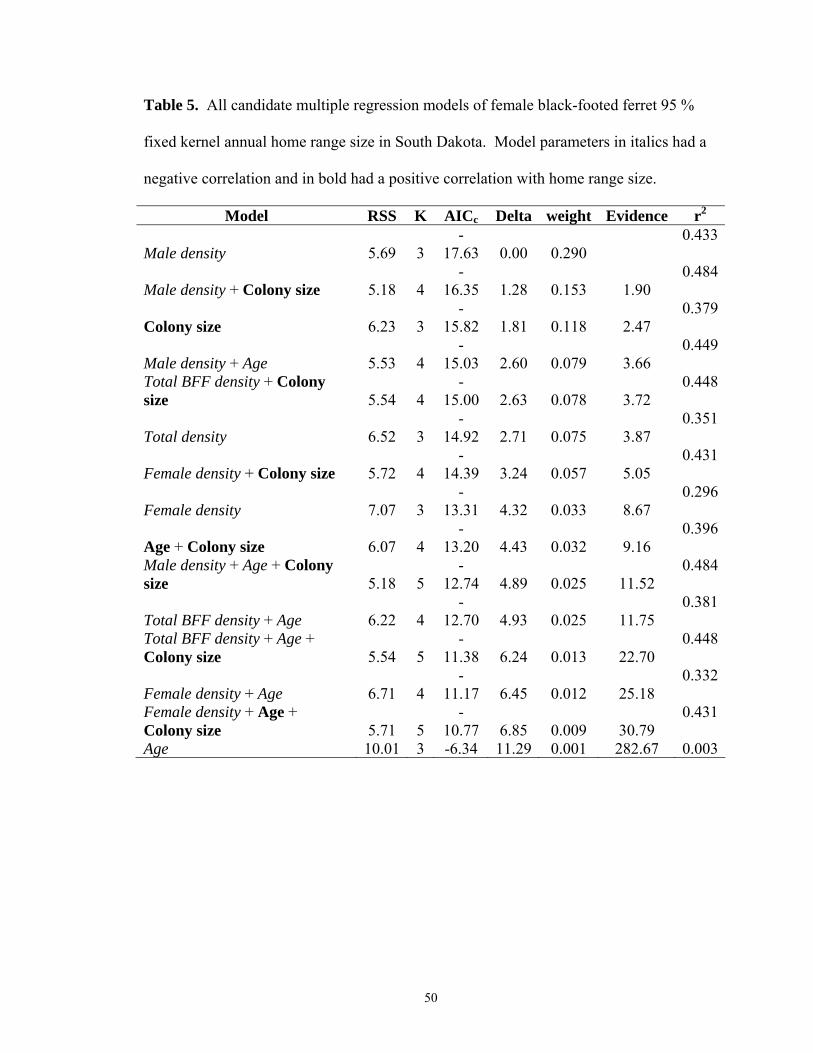
Table 5. All candidate multiple regression models of female black-footed ferret 95 %
fixed kernel annual home range size in South Dakota. Model parameters in italics had a
negative correlation and in bold had a positive correlation with home range size.
Model RSS K AICc Delta weight Evidence r2
Male density 5.69 3 -
17.63 0.00 0.290 0.433
Male density + Colony size 5.18 4 -
16.35 1.28 0.153 1.90 0.484
Colony size 6.23 3 -
15.82 1.81 0.118 2.47 0.379
Male density + Age 5.53 4 -
15.03 2.60 0.079 3.66 0.449
Total BFF density + Colony size 5.54 4
-15.00 2.63 0.078 3.72
0.448
Total density 6.52 3 -
14.92 2.71 0.075 3.87 0.351
Female density + Colony size 5.72 4 -
14.39 3.24 0.057 5.05 0.431
Female density 7.07 3 -
13.31 4.32 0.033 8.67 0.296
Age + Colony size 6.07 4 -
13.20 4.43 0.032 9.16 0.396
Male density + Age + Colony size 5.18 5
-12.74 4.89 0.025 11.52
0.484
Total BFF density + Age 6.22 4 -
12.70 4.93 0.025 11.75 0.381
Total BFF density + Age + Colony size 5.54 5
-11.38 6.24 0.013 22.70
0.448
Female density + Age 6.71 4 -
11.17 6.45 0.012 25.18 0.332
Female density + Age + Colony size 5.71 5
-10.77 6.85 0.009 30.79
0.431
Age 10.01 3 -6.34 11.29 0.001 282.67 0.003
50
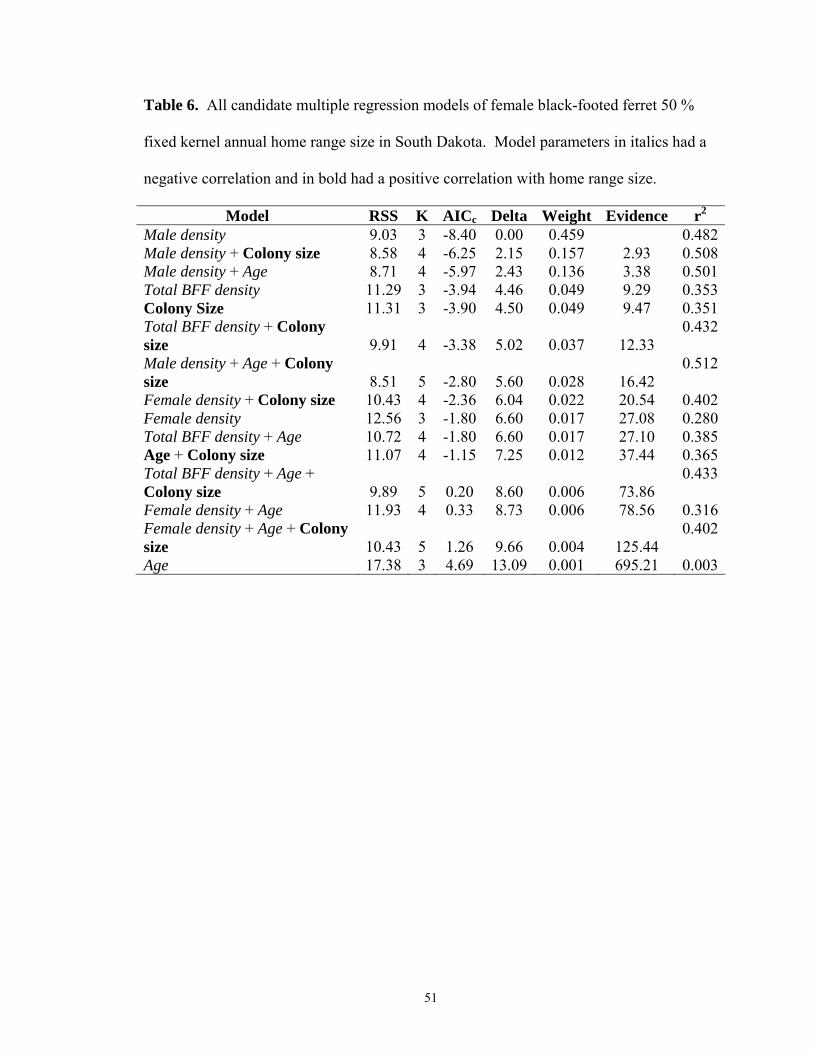
Table 6. All candidate multiple regression models of female black-footed ferret 50 %
fixed kernel annual home range size in South Dakota. Model parameters in italics had a
negative correlation and in bold had a positive correlation with home range size.
Model RSS K AICc Delta Weight Evidence r2
Male density 9.03 3 -8.40 0.00 0.459 0.482Male density + Colony size 8.58 4 -6.25 2.15 0.157 2.93 0.508Male density + Age 8.71 4 -5.97 2.43 0.136 3.38 0.501Total BFF density 11.29 3 -3.94 4.46 0.049 9.29 0.353Colony Size 11.31 3 -3.90 4.50 0.049 9.47 0.351Total BFF density + Colony size 9.91 4 -3.38 5.02 0.037 12.33
0.432
Male density + Age + Colony size 8.51 5 -2.80 5.60 0.028 16.42
0.512
Female density + Colony size 10.43 4 -2.36 6.04 0.022 20.54 0.402Female density 12.56 3 -1.80 6.60 0.017 27.08 0.280Total BFF density + Age 10.72 4 -1.80 6.60 0.017 27.10 0.385Age + Colony size 11.07 4 -1.15 7.25 0.012 37.44 0.365Total BFF density + Age + Colony size 9.89 5 0.20 8.60 0.006 73.86
0.433
Female density + Age 11.93 4 0.33 8.73 0.006 78.56 0.316Female density + Age + Colony size 10.43 5 1.26 9.66 0.004 125.44
0.402
Age 17.38 3 4.69 13.09 0.001 695.21 0.003
51
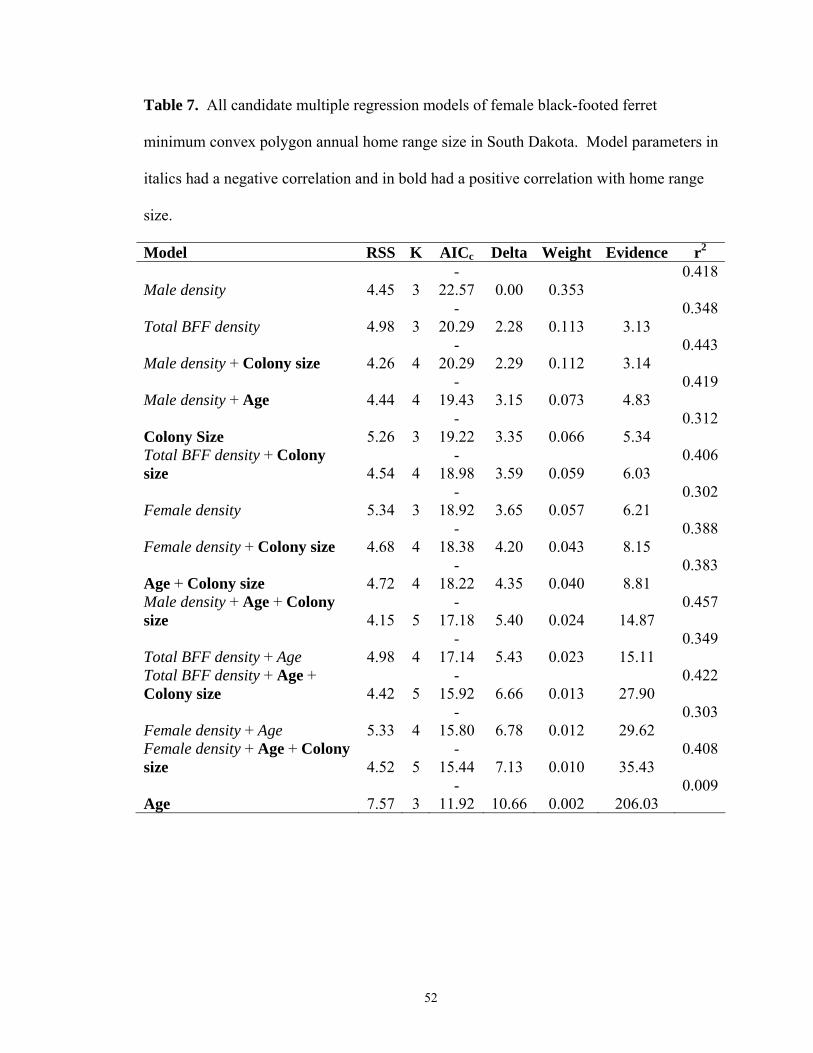
Table 7. All candidate multiple regression models of female black-footed ferret
minimum convex polygon annual home range size in South Dakota. Model parameters in
italics had a negative correlation and in bold had a positive correlation with home range
size.
Model RSS K AICc Delta Weight Evidence r2
Male density 4.45 3 -
22.57 0.00 0.353 0.418
Total BFF density 4.98 3 -
20.29 2.28 0.113 3.13 0.348
Male density + Colony size 4.26 4 -
20.29 2.29 0.112 3.14 0.443
Male density + Age 4.44 4 -
19.43 3.15 0.073 4.83 0.419
Colony Size 5.26 3 -
19.22 3.35 0.066 5.34 0.312
Total BFF density + Colony size 4.54 4
-18.98 3.59 0.059 6.03
0.406
Female density 5.34 3 -
18.92 3.65 0.057 6.21 0.302
Female density + Colony size 4.68 4 -
18.38 4.20 0.043 8.15 0.388
Age + Colony size 4.72 4 -
18.22 4.35 0.040 8.81 0.383
Male density + Age + Colony size 4.15 5
-17.18 5.40 0.024 14.87
0.457
Total BFF density + Age 4.98 4 -
17.14 5.43 0.023 15.11 0.349
Total BFF density + Age + Colony size 4.42 5
-15.92 6.66 0.013 27.90
0.422
Female density + Age 5.33 4 -
15.80 6.78 0.012 29.62 0.303
Female density + Age + Colony size 4.52 5
-15.44 7.13 0.010 35.43
0.408
Age 7.57 3 -
11.92 10.66 0.002 206.03 0.009
52

Table 8. All candidate multiple regression models of male black-footed ferret 95% fixed
kernel annual home range size in South Dakota. Model parameters in italics had a
negative correlation and in bold had a positive correlation with home range size.
Model RSS K AICc Delta Weight Evidence r2
Age 1.80 3 -6.94 0.00 0.334 0.671Male density 2.55 3 -4.13 2.81 0.082 4.07 0.532Age + Colony size 1.77 4 -4.05 2.89 0.079 4.24 0.675Male density + Age 1.79 4 -3.99 2.95 0.077 4.36 0.673Total BFF density + Age 1.79 4 -3.96 2.98 0.075 4.43 0.672Female density + Age 1.80 4 -3.95 2.99 0.075 4.46 0.671Female density + Colony size 1.80 4 -3.92 3.02 0.074 4.53 0.670Total BFF density + Colony size 1.91 4 -3.47 3.46 0.059 5.65 0.651Colony Size 3.09 3 -2.62 4.32 0.039 8.65 0.435Total BFF density 3.27 3 -2.15 4.79 0.030 10.95 0.401Male density + Colony size 2.34 4 -1.83 5.11 0.026 12.86 0.571Female density + Age + Colony size 1.73 5 -0.75 6.19 0.015 22.11
0.683
Male density + Age + Colony size 1.76 5 -0.62 6.32 0.014 23.52
0.678
Total BFF density + Age + Colony size 1.77 5 -0.58 6.36 0.014 24.02
0.677
Female density 4.72 3 0.77 7.71 0.007 47.26 0.137
53

Table 9. All candidate multiple regression models of male black-footed ferret 50% fixed
kernel annual home range size in South Dakota. Model parameters in italics had a
negative correlation and in bold had a positive correlation with home range size.
Models RSS K AICc Delta Weight Evidence r2
Female density + Colony size 1.38 4 -6.08 0.00 0.183 0.851Total BFF density + Colony size 1.39 4 -6.01 0.08 0.176 1.04 0.849Age + Colony size 1.45 4 -5.65 0.43 0.147 1.24 0.842Colony Size 2.24 3 -5.19 0.89 0.117 1.56 0.757Male density + Colony size 1.60 4 -4.88 1.21 0.100 1.83 0.826Age 2.61 3 -3.96 2.12 0.063 2.89 0.717Female density + Age 1.92 4 -3.41 2.67 0.048 3.80 0.792Female density + Age + Colony size 1.37 5 -2.63 3.45 0.033 5.62
0.852
Total BFF density + Age + Colony size 1.38 5 -2.57 3.52 0.031 5.81
0.850
Total BFF density + Age 2.16 4 -2.49 3.59 0.030 6.03 0.766Male density 3.23 3 -2.26 3.82 0.027 6.76 0.650Male density + Age + Colony size 1.44 5 -2.24 3.84 0.027 6.82
0.844
Male density + Age 2.55 4 -1.14 4.95 0.015 11.86 0.723Total BFF density 6.54 3 3.39 9.47 0.002 113.87 0.290Female density 8.98 3 5.92 12.01 0.000 405.27 0.025
54

Table 10. All candidate multiple regression models of male black-footed ferret
minimum convex polygon annual home range size in South Dakota. Model parameters in
italics had a negative correlation and in bold had a positive correlation with home range
size.
Model RSS K AICc Delta Weight Evidence r2
Age 2.09 3 -5.73 0.00 0.305 0.536Male density + Age 1.94 4 -3.32 2.41 0.092 3.34 0.569Male density 2.91 3 -3.10 2.63 0.082 3.73 0.355Total BFF density + Age 2.08 4 -2.79 2.94 0.070 4.36 0.539Age + Colony size 2.09 4 -2.74 2.99 0.068 4.46 0.536Female density + Age 2.09 4 -2.73 3.00 0.068 4.48 0.536Colony Size 3.06 3 -2.69 3.04 0.067 4.58 0.321Total BFF density 3.15 3 -2.44 3.29 0.059 5.17 0.300Female density + Colony size 2.19 4 -2.38 3.35 0.057 5.35 0.515Total BFF density + Colony size 2.33 4 -1.87 3.86 0.044 6.88 0.483Male density + Colony size 2.72 4 -0.62 5.11 0.024 12.90 0.395Female density 3.98 3 -0.59 5.14 0.023 13.10 0.117Male density + Age + Colony size 1.93 5 0.14 5.87 0.016 18.85
0.571
Total BFF density + Age + Colony size 2.07 5 0.69 6.43 0.012 24.85
0.540
Female density + Age + Colony size 2.08 5 0.73 6.46 0.012 25.34
0.538
55

Table 11. Percent of black-footed ferret annual home range inter-sexual and intra-sexual
overlap in Conata Basin, South Dakota.
Estimator % of home range
Overlapped by
n Mean % of home range
Range
50% FK Female Female 2 4.1 3.7 - 4.6 95% FK Female Female 18 15.6 1.0 - 34.0
MCP Female Female 10 13.2 3.4 - 31.0 50% FK Female Male 4 40.7 21.9 - 54.0 95% FK Female Male 11 65.6 8.7 - 100.0
MCP Female Male 9 60.1 16.1 - 100.0 50% FK Male Female 4 11.0 5.2 - 14.1 95% FK Male Female 11 30.5 2.7 - 57.3
MCP Male Female 9 26.9 11.0 - 51.1 50% FK Male Male 0 0 0 95% FK Male Male 4 19.3 1.3 - 57.4
MCP Male Male 2 7.6 2.9 - 12.4
56
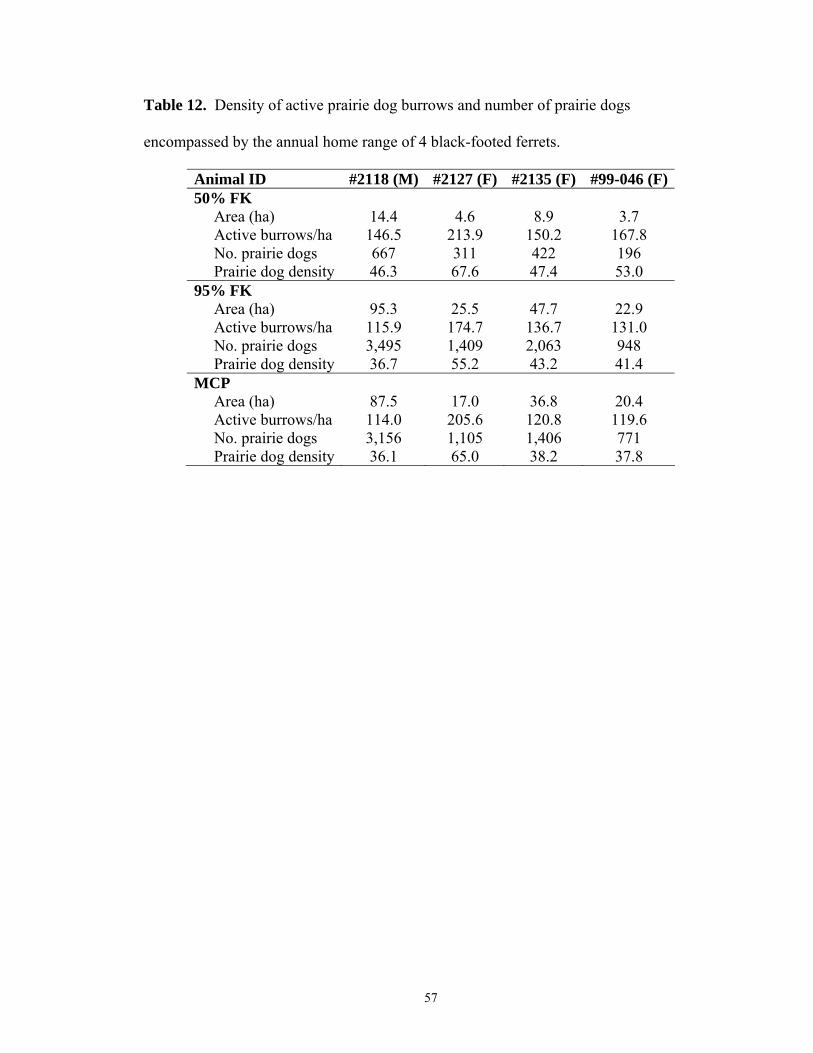
Table 12. Density of active prairie dog burrows and number of prairie dogs
encompassed by the annual home range of 4 black-footed ferrets.
Animal ID #2118 (M) #2127 (F) #2135 (F) #99-046 (F)50% FK Area (ha) 14.4 4.6 8.9 3.7 Active burrows/ha 146.5 213.9 150.2 167.8 No. prairie dogs 667 311 422 196 Prairie dog density 46.3 67.6 47.4 53.0 95% FK Area (ha) 95.3 25.5 47.7 22.9 Active burrows/ha 115.9 174.7 136.7 131.0 No. prairie dogs 3,495 1,409 2,063 948 Prairie dog density 36.7 55.2 43.2 41.4 MCP Area (ha) 87.5 17.0 36.8 20.4 Active burrows/ha 114.0 205.6 120.8 119.6 No. prairie dogs 3,156 1,105 1,406 771 Prairie dog density 36.1 65.0 38.2 37.8
57
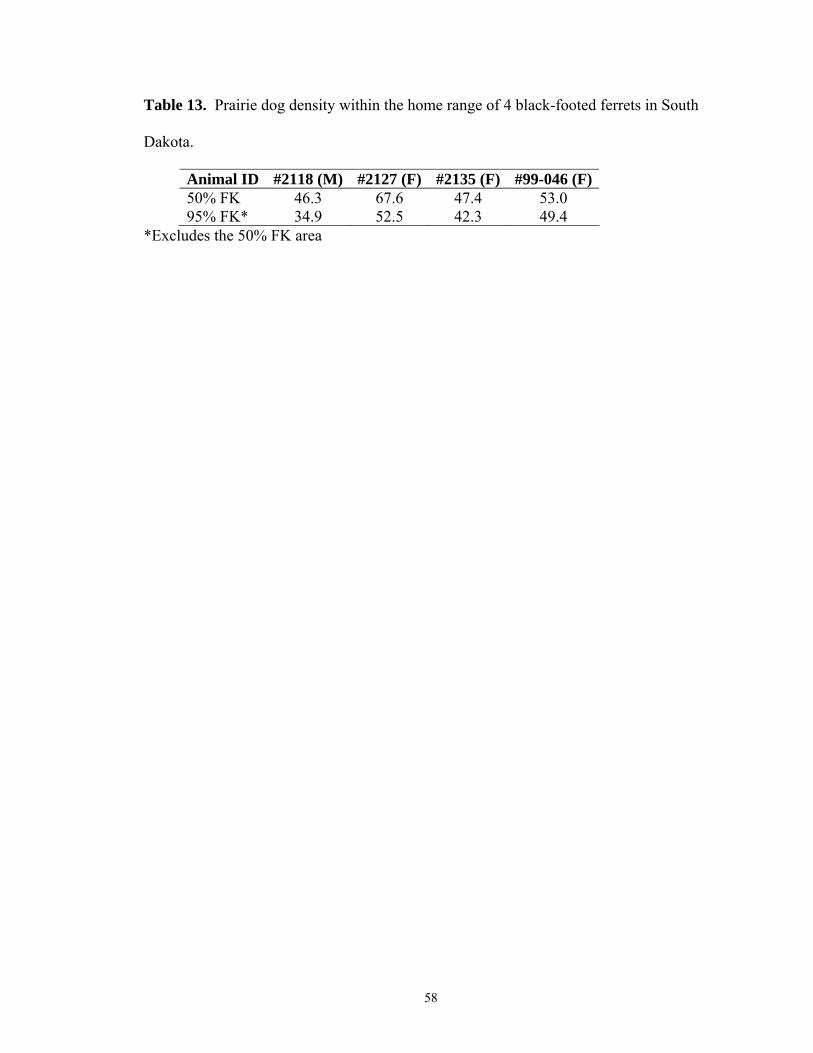
Table 13. Prairie dog density within the home range of 4 black-footed ferrets in South
Dakota.
Animal ID #2118 (M) #2127 (F) #2135 (F) #99-046 (F) 50% FK 46.3 67.6 47.4 53.0 95% FK* 34.9 52.5 42.3 49.4
*Excludes the 50% FK area
58
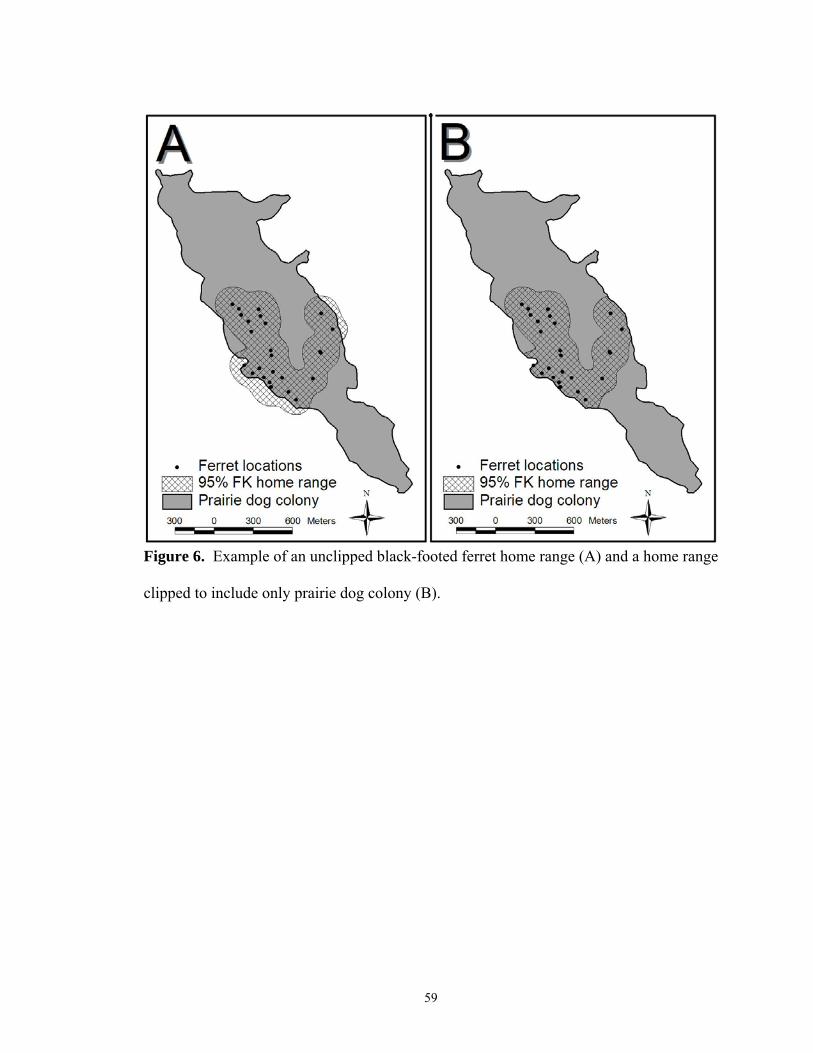
Figure 6. Example of an unclipped black-footed ferret home range (A) and a home range
clipped to include only prairie dog colony (B).
59
A
• Ferret locations ~ 95% FK home range D Prairie dog colony
300 0 300 600 Meters
N
+
B
• Ferret locations ~ 95% FK home range D Prairie dog colony
300 0 300 600 Meters
N
+
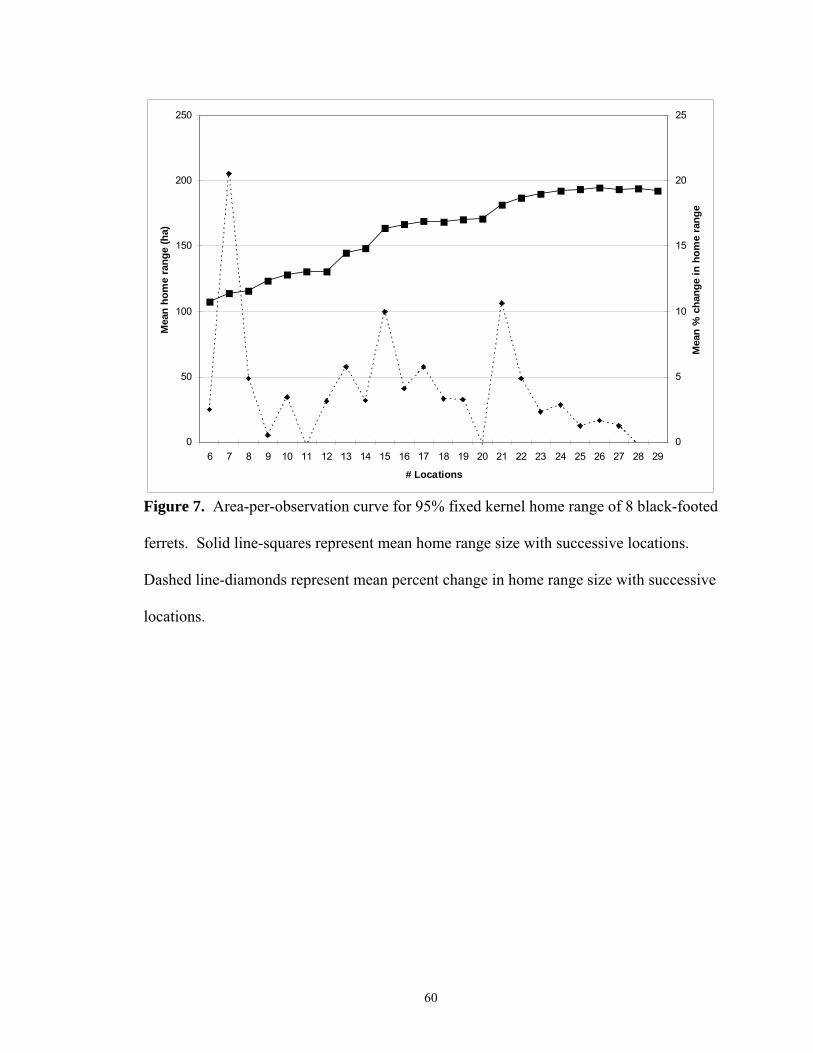
0
50
100
150
200
250
6 7 8 9 10 11 12 13 14 15 16 17 18 19 20 21 22 23 24 25 26 27 28 29
# Locations
Mea
n ho
me
rang
e (h
a)
0
5
10
15
20
25
Mea
n %
cha
nge
in h
ome
rang
e
Figure 7. Area-per-observation curve for 95% fixed kernel home range of 8 black-footed
ferrets. Solid line-squares represent mean home range size with successive locations.
Dashed line-diamonds represent mean percent change in home range size with successive
locations.
60
♦
•

0
20
40
60
80
100
120
6 7 8 9 10 11 12 13 14 15 16 17 18 19 20 21 22 23 24 25 26 27 28 29 30
# Locations
Mea
n ho
me
rang
e (h
a)
0
5
10
15
20
25
30
Mea
n %
cha
nge
in h
ome
rang
e
Figure 8. Area-per-observation curve for 100% minimum convex polygon home range
of 8 black-footed ferrets. Solid line-squares represent mean home range size with
successive locations. Dashed line-diamonds represent mean percent change in home
range size with successive locations.
61
•
•♦ .
•
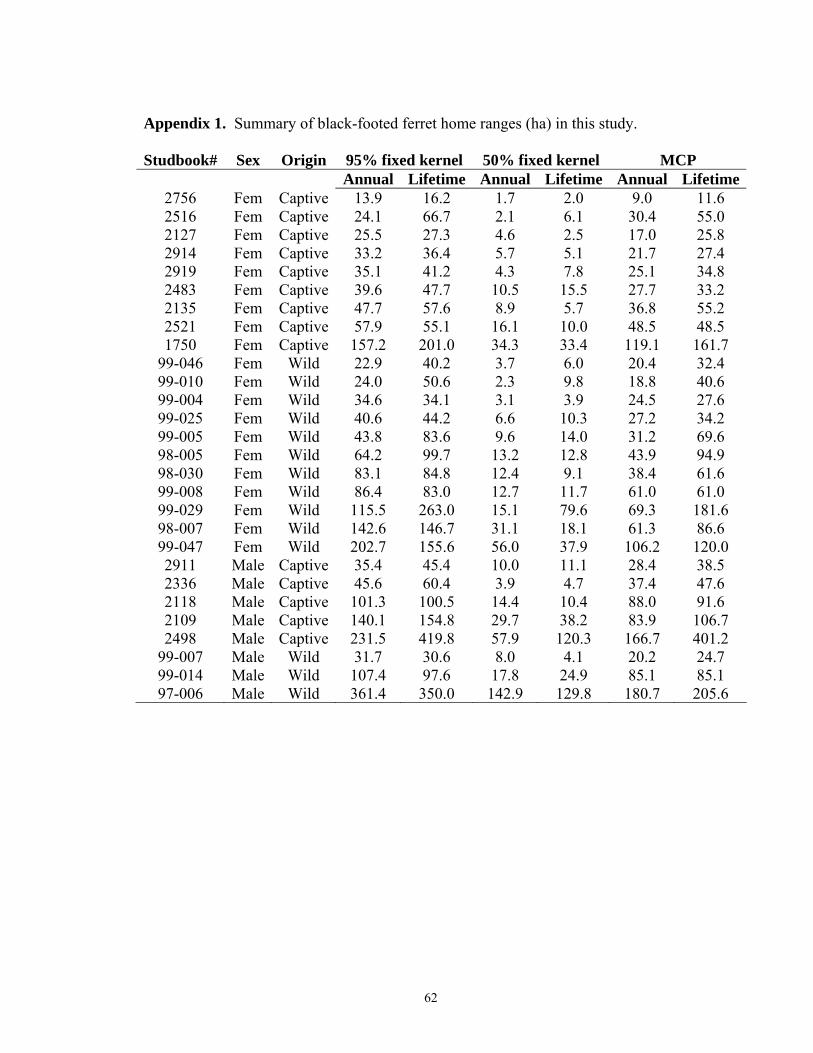
Appendix 1. Summary of black-footed ferret home ranges (ha) in this study.
Studbook# Sex Origin 95% fixed kernel 50% fixed kernel MCP Annual Lifetime Annual Lifetime Annual Lifetime
2756 Fem Captive 13.9 16.2 1.7 2.0 9.0 11.6 2516 Fem Captive 24.1 66.7 2.1 6.1 30.4 55.0 2127 Fem Captive 25.5 27.3 4.6 2.5 17.0 25.8 2914 Fem Captive 33.2 36.4 5.7 5.1 21.7 27.4 2919 Fem Captive 35.1 41.2 4.3 7.8 25.1 34.8 2483 Fem Captive 39.6 47.7 10.5 15.5 27.7 33.2 2135 Fem Captive 47.7 57.6 8.9 5.7 36.8 55.2 2521 Fem Captive 57.9 55.1 16.1 10.0 48.5 48.5 1750 Fem Captive 157.2 201.0 34.3 33.4 119.1 161.7
99-046 Fem Wild 22.9 40.2 3.7 6.0 20.4 32.4 99-010 Fem Wild 24.0 50.6 2.3 9.8 18.8 40.6 99-004 Fem Wild 34.6 34.1 3.1 3.9 24.5 27.6 99-025 Fem Wild 40.6 44.2 6.6 10.3 27.2 34.2 99-005 Fem Wild 43.8 83.6 9.6 14.0 31.2 69.6 98-005 Fem Wild 64.2 99.7 13.2 12.8 43.9 94.9 98-030 Fem Wild 83.1 84.8 12.4 9.1 38.4 61.6 99-008 Fem Wild 86.4 83.0 12.7 11.7 61.0 61.0 99-029 Fem Wild 115.5 263.0 15.1 79.6 69.3 181.6 98-007 Fem Wild 142.6 146.7 31.1 18.1 61.3 86.6 99-047 Fem Wild 202.7 155.6 56.0 37.9 106.2 120.0 2911 Male Captive 35.4 45.4 10.0 11.1 28.4 38.5 2336 Male Captive 45.6 60.4 3.9 4.7 37.4 47.6 2118 Male Captive 101.3 100.5 14.4 10.4 88.0 91.6 2109 Male Captive 140.1 154.8 29.7 38.2 83.9 106.7 2498 Male Captive 231.5 419.8 57.9 120.3 166.7 401.2
99-007 Male Wild 31.7 30.6 8.0 4.1 20.2 24.7 99-014 Male Wild 107.4 97.6 17.8 24.9 85.1 85.1 97-006 Male Wild 361.4 350.0 142.9 129.8 180.7 205.6
62