Black carbon and methane in the Norwegian Barents region
17
REPORT M-276 | 2014 Black carbon and methane in the Norwegian Barents region
Transcript of Black carbon and methane in the Norwegian Barents region

REPORT
M-276 | 2014
Black carbon and methane in the
Norwegian Barents region

Black carbon and methane in the Norwegian Barents region | M276
1
COLOPHON
Executive institution
The Norwegian Environment Agency
Project manager for the contractor Contact person in the Norwegian Environment Agency
Ingrid Lillehagen, The Ministry of Climate and
Environment, section for polar affairs and the
High North
Solrun Figenschau Skjellum
M-no Year Pages Contract number
M-276 2014 15
Publisher The project is funded by
The Norwegian Environment Agency The Norwegian Environment Agency
Author(s)
Maria Malene Kvalevåg, Vigdis Vestreng and Nina Holmengen
Title – Norwegian and English
Black carbon and methane in the Norwegian Barents Region
Svart karbon og metan i den norske Barentsregionen
Summary – sammendrag
In 2011, land based emissions of black carbon and methane in the Norwegian Barents region were 400
tons and 23 700 tons, respectively. The largest emissions of black carbon originate from the transport
sector and wood combustion in residential heating. For methane, the largest contributors to emissions
are the agricultural sector and landfills. Different measures to reduce emissions from black carbon and
methane can be implemented. Retrofitting of diesel particulate filters on light and heavy vehicles,
tractors and construction machines will reduce black carbon emitted from the transport sector.
Measures to reduce black carbon from residential heating are to accelerate the introduction of wood
stoves with cleaner burning, improve burning techniques and inspect and maintain the wood stoves that
are already in use. In the agricultural sector, methane emissions from food production can be reduced
by using manure or food waste as raw material to biogas production. If the population reduce their
waste of food or eat less red meat, the methane emissions from food production will also be reduced.
Reducing emissions of black carbon and methane (as a precursor for ozone) will in addition have
positive effects on human health, especially in more densely populated areas.
4 emneord 4 subject words
Svart karbon, metan, den norsk Barentsregionen, tiltak
Black carbon, methane, the Norwegian Barents region, mitigation
Front page photo
iStockphoto

Black carbon and methane in the Norwegian Barents region | M276
2
Content
Summary......................................................................................................... 3
1. Background .................................................................................................. 4
1.1 An introduction to short-lived climate pollutants .............................................. 4
2. Scope ......................................................................................................... 5
3. Method for emission calculations at the regional level .............................................. 6
3.1 Calculation of black carbon emissions ............................................................ 6
3.2 Calculation of methane emissions ................................................................. 7
3.3 Correspondence between county specific black carbon and methane emissions ......... 7
3.4 Uncertainties in geographically distributed emissions ......................................... 8
4. Emissions of black carbon and methane ................................................................ 8
4.1 Black carbon........................................................................................... 8
4.1.1 Black Carbon emissions in Norway ........................................................ 8
4.1.2 Black Carbon emissions in the Norwegian Barents Region ............................ 9
4.2 Methane ................................................................................................ 9
4.2.1 Methane emissions in Norway ............................................................ 10
4.2.2 Methane emissions in the Norwegian Barents region ................................ 10
5. Climate effect of black carbon and methane emissions ........................................... 11
6. Options for emission reductions in the Norwegian Barents region............................... 12
6.1 Black Carbon measures ............................................................................ 13
6.2 Methane measures ................................................................................. 14
6.3 Organic carbon and SO2 ........................................................................... 14
6.4 Other measures ..................................................................................... 14
7. Uncertainties .............................................................................................. 14
8. References ................................................................................................. 15

Black carbon and methane in the Norwegian Barents region | M276
3
Summary
In 2011, land based emissions of black carbon and methane in the Norwegian Barents region
were 400 tons and 23 700 tons, respectively. The largest emissions of black carbon originate
from the transport sector and wood combustion in residential heating. For methane, the
largest contributors to emissions are the agricultural sector and landfills.
The global climate effect of emissions of black carbon and methane in the Norwegian Barents
Region is 75 % of the CO2-emissions from the same region. Efforts to reduce black carbon,
methane and CO2 in this region will benefit the global climate. Reducing emissions of black
carbon, and methane, as a precursor for ozone, will in addition have positive effects on
human health, especially in more densely populated areas.
Different measures to reduce emissions from black carbon and methane can be implemented.
Retrofitting of diesel particulate filters on light and heavy vehicles, tractors and construction
machines will reduce black carbon emitted from the transport sector. Measures to reduce
black carbon from residential heating are to accelerate the introduction of wood stoves with
cleaner burning, improve burning techniques and inspect and maintain the wood stoves that
are already in use. In the agricultural sector, methane emissions from food production can be
reduced by using manure or food waste as raw material to biogas production. If the
population reduce their waste of food or eat less red meat, the methane emissions from food
production will also be reduced.
Efforts to mitigate short-lived climate pollutants should never replace measures to reduce
CO2. In order to limit global warming and prevent dangerous climate change in the long term,
we need deep and persistent CO2 reductions. Short-lived climate pollutants can help reduce
the rate of warming in the short term and give additional positive effects on health and
environment.

Black carbon and methane in the Norwegian Barents region | M276
4
1. Background
This work is a response to the activity nr. 163 in the Norwegian Environment Agency
assignment letter 2014:
"The Norwegian Environment Agency commissioned by the Ministry of Climate and
Environment tasked to provide an overview of land-based emissions of black carbon and
methane in the Norwegian Barents Region (Nordland, Troms and Finnmark). In addition, a list
of options for reducing these emissions should be included. The report must be written in
English."
1.1 An introduction to short-lived climate
pollutants Short-lived climate pollutants (SLCPs) are atmospheric compounds that have relatively short
lifetime in the atmosphere - a few days to a decade - and an effect on climate predominantly
in the near term after they have been emitted. The SLCP compounds contributing to a
warming of the atmosphere includes methane, which is also a well-mixed greenhouse gas, as
well as black carbon aerosols, tropospheric ozone (including the precursors) and some
halogenated species. Some SLCPs are also dangerous air pollutants, with various damaging
impacts on human health, agriculture and ecosystems. Human exposure to black carbon and
ozone can cause effects on breathing and respiratory systems, damage to lung tissue, cancer,
and premature death.
Limiting anthropogenic climate change and improving air quality are two of the most
important environmental challenges facing humankind. Emission-reducing measures aimed at
SLCPs could contribute to reduce global warming. But, the reduced rate of warming caused by
a cut in SLCPs emissions would itself be short-lived. In order to prevent warming in the longer
term, emissions of long-lived greenhouse gases such as CO2 must be reduced. By
implementing measures aimed at both short-lived climate pollutants and long-lived
greenhouse gases, a more rapid climate benefit could be obtained, thereby increasing the
chances of achieving the 2°C target that the world's leaders have set for preventing
dangerous climate change. Abatement of SLCPs in the Barents region is of special interest
because of its proximity to the Arctic region with large snow and ice cover. The warming in
the Arctic is two times larger than the global average. The warming takes place due to heat
transport from lower latitudes, but also due to emissions within the Arctic itself. Emissions of
black carbon are of special importance because it warms the Arctic both by absorption of
solar radiation in the atmosphere and by deposition on the white surfaces. When deposited,
black carbon absorbs solar radiation and accelerates the melting of the snow and ice covered
surface. The bare ground and ocean absorbs more heat than the reflective snow and ice
covered surfaces thus black carbon deposition cause temperature rise in a positive feedback
loop.
This report is an analysis of black carbon and methane emissions in the Norwegian Barents
region and how these emissions can be reduced in order to benefit the climate, health and
environment.

Black carbon and methane in the Norwegian Barents region | M276
5
Figure 1: The Norwegian Barents region in red. Source: Miljødirektoratet
2. Scope
The Barents region is a geographical region located in the Arctic including parts of four
different countries. About 5.5 million people live in this region and the population density is
on average 3.5 inhabitants per square kilometer. The largest city in the Barents Region is
Arkhangelsk (Russia) with its 350.000 inhabitants.
The surface area of the Barents Region is 1.755.800 km2. This Euro-Arctic region is also
characterized by its harsh climate and long distances. But no other part of Europe and indeed
few places on earth are equally rich in forests, fish, minerals, oil and gas. The Barents Euro-
Arctic Region includes the following 13 territories which also are members of the Barents
Regional Council:
Norway: Finnmark, Troms and Nordland
Russia: Murmansk, Arkhangelsk, Nenets, Komi and Karelia
Finland: Lappland, Oulu and Kainuu
Sweden: Norbotten and Västerbotten
The three Norwegian counties included in the Norwegian Barents region are shown in Figure
1. The land area covered by these counties is approximately 98 000 km2, which is 33 % of the
area of Norway. The population in the Norwegian Barents region is about 470 000, 9 % of the
total Norwegian population. Settlement and economic activity is especially based on the
exploitation of natural resources. Agriculture and fisheries are important sectors in this
region. Although primary industries have declined substantially during the last decades, they
are still of great importance in many municipalities. The service industries have employed an

Black carbon and methane in the Norwegian Barents region | M276
6
increasing share of the economic activity in these counties in parallel with the decline in
primary industries and other industries.
The largest sources of black carbon and methane in this region are from wood combustion for
residential heating in households, diesel consumption in the transport sector and industrial
processes from a few industries. The greatest point source of both black carbon and methane
emissions in the Norwegian Barents region is Melkøya in Hammerfest in Finnmark county.
Melkøya is an industrial facility for receiving and processing natural gas from the Snøhvit gas
field in the Barents Sea. Annual emission from this point source is 2000-3000 tons of methane
per year. Estimated emissions of black carbon from point sources are not available. However,
combustion and flaring at Melkøya also produce black carbon particles.
Offshore emissions in the Norwegian Barents region are related to shipping and petroleum
activity on the coastal areas of these three counties. Offshore emissions of methane are not
distributed to county levels (see chapter 3 on method) and not available for analysis, but
black carbon emissions from shipping is estimated to be approximately 190 tons. Even though
offshore emissions are not included in this report, it is important to note that shipping and
petroleum industry offshore in this part of Norway is also relevant in this context and will
possibly increase in activity in the nearest decades and should not be omitted from a multi-
effect analysis of how to mitigate SLCPs in this region.
3. Method for emission calculations at
the regional level
The emissions of black carbon and methane in Norway are initially calculated at the national
level, and then distributed to counties based on information relevant to the specific emission
sources. The approach for calculating county emissions for black carbon and methane are
based on the same information, but the approach is somewhat different.
3.1 Calculation of black carbon emissions
For geographical distribution of the black carbon emissions, information from the reporting
under the Convention on Long-range transboundary air pollutants (CLRTAP) forms the basis.
Gridded black carbon emissions have not been reported to the CLRTAP, and the national black
carbon emissions have been geographically distributed based on information on the allocation
of particle emissions (PM2.5).
For the reporting under the CLRTAP, emissions of acidifying substances, particles, heavy
metals and persistent organic pollutants (POPs) are distributed in a 50X50 km grid. For
Norway, this distribution is partly made using information on the location of point sources
(mainly industrial plants and installations in the oil and gas industry). In addition, different
types of information are used as "allocation keys" to allocate emissions that cannot be directly
placed at a location. The allocation key will often be the distribution of some of the activity
data used for emission calculations at the national level. This is for instance the case for road
transport and agriculture. Relevant allocation keys here are traffic counts and number of

Black carbon and methane in the Norwegian Barents region | M276
7
livestock of different types in different counties. Emissions are also distributed based on
population data.
The gridding is performed on a more aggregated level than the reporting of emissions by
emission source categories. While the national emission figures reported are distributed on
109 emission source categories, the gridded emissions are spread on 17 different categories.
This for instance means that most of the oil and gas industry and combustion in
manufacturing industries are placed in the same grid category.
As mentioned, the geographical distribution of black carbon is based on information from the
gridding of particles. This implies that the distribution of PM2.5 and black carbon are the
same, but the magnitude of black carbon emissions for each emission source category and
geographical unit is based on national black carbon emission levels.
3.2 Calculation of methane emissions
County specific methane emissions are gathered from the official statistics on emissions to
air, published by Statistics Norway (Statistics Norway, 2014). The national emission figures
forms the basis for the county specific emissions. The same approach as for calculation of
gridded emission figures under the CLRTAP is used, utilizing the best available information on
emission point sources and distribution of activity data.
There are some emission source categories that are included in national emissions, but not in
the statistics on methane emissions by county. This includes emissions that cannot be
allocated to a specific county, such as emissions from oil and gas installations off-shore,
airspace and seas. Some sources are omitted due to lack of sufficient information to
distribute emissions regionally. It applies to for instance shipping.
3.3 Correspondence between county specific
black carbon and methane emissions
The distribution of both the black carbon and methane emissions is based on the best
available information on location of emissions, and generally the same information sources
are used for allocation for both substances. In this respect, the two approaches give
comparable results.
The gridding reported under the CLRTAP convention (used for black carbon) and the statistics
on emissions to air from Statistics Norway (used for methane) have a somewhat different
classification. For instance, as mentioned previously, combustion emissions from oil and gas
industries and manufacturing industries are placed in the same emission source category for
the CLRTAP, while they are different emission sources in the statistics on emissions to air by
counties. The two classifications are made comparable in this study by redistributing the
methane emissions from the statistics to the classification of the CLRTAP gridding.
The gridding reported under the CLRTAP convention (used for black carbon) and the statistics
on emissions to air from Statistics Norway (used for methane) also have somewhat different
Black carbon and methane in the Norwegian Barents region | M276
8
delimitation. For instance, emissions from aviation and shipping are excluded in the methane
emissions, while they are included for black carbon.
3.4 Uncertainties in geographically
distributed emissions
Due to limitations in the data at the county level, the geographically distributed emission
figures will often be more uncertain than the national emission figures. Differences in
uncertainties are primarily dependent on the quality of the information about where the
emissions take place. For black carbon there is the additional uncertainty in using the
allocation keys developed for PM2.5.
Even if a reduction in emissions as a result of measures is captured in the national emission
estimates, the reduction will not always be properly distributed to counties. This will for
instance occur if the allocation key does not capture the measures and the measures at the
same time vary between counties.
4. Emissions of black carbon and
methane
4.1 Black carbon Black carbon is the highly absorbing part of fine particulate matter (PM2.5). It is a major
component of soot and is produced by incomplete combustion of fossil fuel, biofuel and
biomass. It is emitted from various anthropogenic and natural sources including diesel cars
and trucks, residential wood burning stoves, forest fires, agricultural open burning and some
industrial facilities. Its resident time in the atmosphere (the lifetime) varies from a few days
to a few weeks. Black carbon aerosols causes both atmospheric warming and, when deposited
on ice and snow, an increase of the melting rate. It also influences cloud formation and
properties, and impacts regional circulation and rainfall patterns. In addition, black carbon
impacts human health. It is a primary component of particulate matter in air pollution that is
the major environmental cause of premature death globally1.
4.1.1 Black Carbon emissions in Norway The total emissions of black carbon in Norway in 2011 were 5 100 tons. This includes land
based emissions and offshore emissions from shipping and petroleum activity. The largest
source of black carbon emissions nationally is diesel vehicles. On-road and off-road transport
1 - See more at: http://www.unep.org/ccac/Short-
LivedClimatePollutants/Definitions/tabid/130285/Default.aspx#sthash.TLwLcUbj.dpuf
Black carbon and methane in the Norwegian Barents region | M276
9
accounted for 40 % of the national emissions. Wood combustion for residential heating was
responsible for 23 % of the total emissions in 2011. Emissions of black carbon rose by 2 % in
the period 1990-2011. Emissions have remained relatively constant despite increased activity
due to implementation of strict air pollution control policies, especially in the transport,
industry and power plant sectors as well as cleaning measures, changes in production
procedures and lower activity in some industries. In addition, a larger share of the wood is
burned in stoves with new technology.
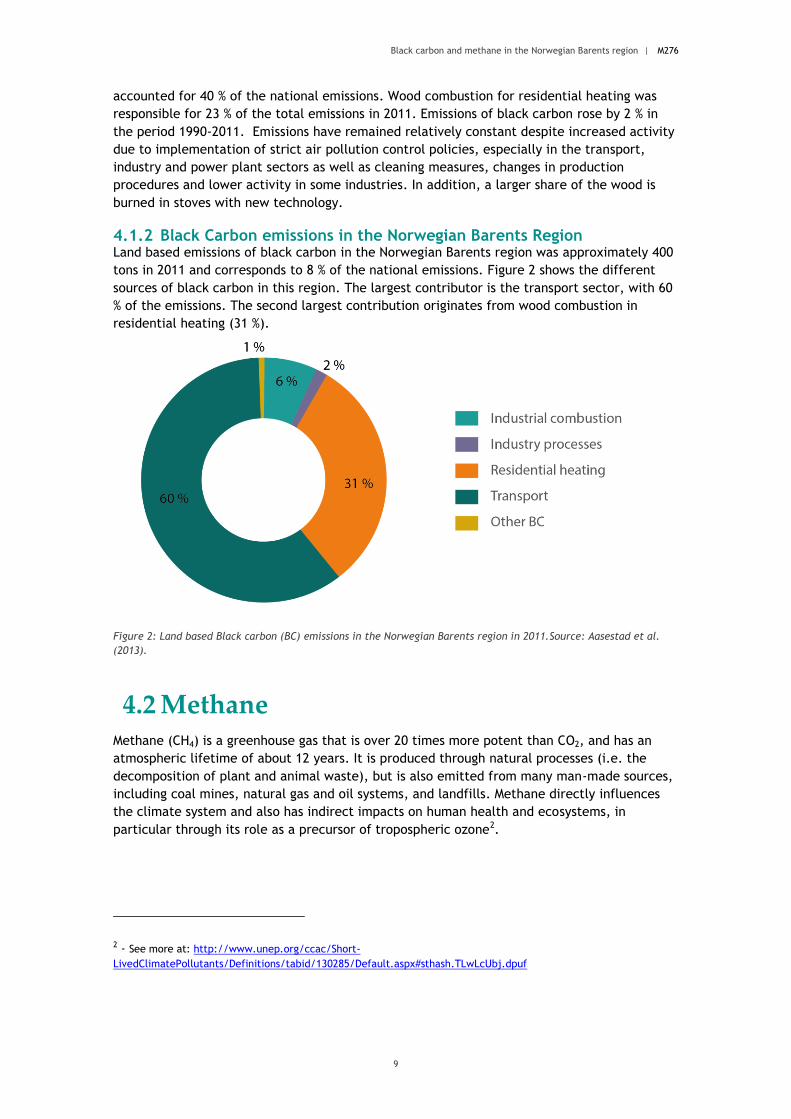
4.1.2 Black Carbon emissions in the Norwegian Barents Region Land based emissions of black carbon in the Norwegian Barents region was approximately 400
tons in 2011 and corresponds to 8 % of the national emissions. Figure 2 shows the different
sources of black carbon in this region. The largest contributor is the transport sector, with 60
% of the emissions. The second largest contribution originates from wood combustion in
residential heating (31 %).
Figure 2: Land based Black carbon (BC) emissions in the Norwegian Barents region in 2011.Source: Aasestad et al.
(2013).
4.2 Methane Methane (CH4) is a greenhouse gas that is over 20 times more potent than CO2, and has an
atmospheric lifetime of about 12 years. It is produced through natural processes (i.e. the
decomposition of plant and animal waste), but is also emitted from many man-made sources,
including coal mines, natural gas and oil systems, and landfills. Methane directly influences
the climate system and also has indirect impacts on human health and ecosystems, in
particular through its role as a precursor of tropospheric ozone2.
2 - See more at: http://www.unep.org/ccac/Short-
LivedClimatePollutants/Definitions/tabid/130285/Default.aspx#sthash.TLwLcUbj.dpuf

Black carbon and methane in the Norwegian Barents region | M276
10
4.2.1 Methane emissions in Norway The national emissions of methane in 2011 was 209 400 tons (NIR, 2013), which corresponds
to 4.4 million tons CO2-equivalents3. This is approximately 8 % of total Norwegian greenhouse
gas emissions. These numbers include emissions from land based, offshore and shipping
activities in Norway. About 46 % of the national methane emissions in 2011 originated from
agriculture, and 24 % originated from solid waste disposal on landfills. Methane emissions
from agriculture are dominated by releases from enteric fermentation. Offshore emissions
from combustion and evaporation/leakage in the oil and gas industry accounted for
approximately 12 % of the total methane emissions in 2011, the largest fraction of which is
releases of methane (venting) during the loading and unloading operations of petroleum
products. Other sources include emissions from petrol cars, residential heating, coal mining,
shipping and oil refineries. During the period 1990-2011 the total CH4 emissions decreased by
almost 13 %. This decrease is primarily due to decreased emissions from waste treatment,
which more than compensated for the growth in emissions from the oil- and gas industry.
4.2.2 Methane emissions in the Norwegian Barents region Land based emissions of methane in the Norwegian Barents region was 23 700 tons in 2011,
this corresponds to 11 % of the national methane emissions. Figure 3 shows that the largest
contributors of methane in this region are the agricultural sector (60 %) and waste treatment
(solid waste disposal, 23 %). Methane from industrial combustion accounted for 13 %,
residential heating for 3 % of the emissions.
Figure 3: Land based methane emissions in the Norwegian Barents region in 2011.Source: Statistic Norway (2014).
3 The GWP100 for methane is 21 (IPCC,1995) and is used to convert methane emissions into CO2-equivalents in order
to compare different green house gas emissions.

Black carbon and methane in the Norwegian Barents region | M276
11
5. Climate effect of black carbon and
methane emissions
The climate effects of the black carbon and methane emissions can only be compared to each
other and summarized after conversion into so-called CO2 equivalents. This can be done by
multiplying emissions in tons by a factor that represents the climate effect per ton of the
component we are interested in relative to the climate effect of a ton of CO2 with certain
given assumptions. The three key assumptions are 1) the method for calculating the climate
effect, typically global warming potential (GWP) or global temperature change potential
(GTP); 2) the period of time over which the climate effect is calculated; and 3) the
geographical region where the emissions occur. This factor is called an emission metric.
Emission metrics for estimating the global climate effect of national and regional emissions of
different short lived climate pollutants were developed for the work with the proposed
Norwegian action plan (Hodnebrog et al. 2013). For instance, the metric named "GTP10,
Norway" can be used for calculating the Global Temperature Potential4 10 years after the
emission occurred in Norway. In the same study, a similar metric was estimated for emissions
occurring in Northern Norway (GTP10, Northern Norway) as shown in Table 1. The effect on climate
from black carbon is separated into 1) the direct effect from atmospheric absorption of solar
radiation, and 2) the albedo effect when black carbon is deposited on snow and ice. This
shows that one ton of black carbon has 2944 times higher effect on climate than one ton of
CO2 when this metric is applied. The effect of emitting one ton of methane in the Norwegian
Barents region is 86 times higher than the climate effect of emitting one ton of CO2 when
GTP10, Northern Norway is applied. By multiplying the emissions (column 1 in Table 1) with the
metric (column 2 in Table 1), the climate effect of all emissions (column 3 in Table 1) can be
calculated.
The global climate effect in the short term of black carbon and methane emissions in 2011 in
the Norwegian Barents region is 3 215 200 tons CO2eq(GTP10, Northern Norway). In comparison, the
land based emissions of CO2 in the Norwegian Barents region were 4 283 000 tons in 2011. This
means that the global climate effect of emissions of black carbon and methane corresponds
to 75 % of the CO2-emissions from this region in the short-term. This highlights the stronger
effect on global climate in the short term of reducing black carbon and methane along with
CO2. In addition, reducing black carbon in cities and densely populated areas will also give
cleaner air and have a positive effect on human health.
4Read more about metrics and Global Temperature Potential in IPCC (2013) working group 1 Chapter 8.7

Black carbon and methane in the Norwegian Barents region | M276
12
Emissions, metrics and climate effects in the Norwegian
Barents Region
Emissions in
the
Norwegian
Barents
Region
(tons)
GTP10,Northern
Norway5
Climate effect
(tons CO2eq(GTP10,
Nothern Norway))
Black carbon
(direct effect) 400 1370 548 000
Black carbon
(albedo effect) 400 1574 629 600
Black carbon 400 2944 1 177 600
Methane 23 700 86 2 038 200
Total 3 215 200
CO2 4 283 000 1 4 283 000
Table 1: Emissions (in tons), emission metric (GTP10, Northern Norway) and climate effect (tons CO2-equivalents) of
black carbon and methane in the Norwegian Barents region.
6. Options for emission reductions in
the Norwegian Barents region
Table 2 shows possible mitigation options for reducing land based black carbon and methane
emissions in the Norwegian Barents region. Emission reductions potentials and costs have not
been calculated for this region separately, but the national emission reduction potentials and
costs for these measures are estimated in the proposed action plan for Norwegian emissions
on SLCPs (NEA, 2013).
5 http://www.miljodirektoratet.no/Global/dokumenter/tema/klima/19092014(CICERO_metrics_English_final).pdf

Black carbon and methane in the Norwegian Barents region | M276
13
Black carbon measures Methane measures
Transport (Diesel particulate Filters
(DPFs)):
Agriculture:
Retrofitting DPFs on light vehicles Phasing in biogas from manure or
food waste on buses6
Retrofitting DPFs on heavy duty vehicles Reduced food waste
Retrofitting DPFs on tractors Transition from red to white meat
Retrofitting DPFs on construction
machines
Residential Heating (Wood
Combustion):
Accelerated introduction of new stoves
and pellet burners
Improved combustion practices,
inspection and maintenance
Table 2: Possible mitigation options for reducing emissions of black carbon and methane in the Norwegian Barents
region.
6.1 Black Carbon measures
Diesel particulate filters (DPFs) are devices that can be installed on older cars (retrofitting)
into the exhaust system of a diesel engine to reduce the portion of black carbon particles of
combustion from light vehicles, heavy duty vehicles, tractors and construction machines.
However, it is argued that DPFs increase concentrations of NO2 which can be harmful for
human beings and cause health problems. Retrofit DPF applications may also cause fuel
penalties and increase CO2-emissions from higher fuel consumption. More research and testing
is therefore needed before implementing DPFs on Norwegian cars.
An introduction of new stoves with cleaner combustion or pellet burners, in addition to the
replacement that is expected to take place anyway, will reduce emissions of black carbon
from residential heating. Improved burning practices (light from the top etc.) together with
inspection and maintenance of wood stoves to reduce leakage and improve combustion, result
in less emissions of black carbon.
6 Phasing in biogas on buses will also reduce emissions of black carbon from combustion in the transport sector
Black carbon and methane in the Norwegian Barents region | M276
14
6.2 Methane measures Methane emissions in the agricultural sector can be reduced by producing biogas from manure
or food waste. The produced biogas can replace fossil fuel in other sectors and give additional
reductions of black carbon. Emissions from meat production, and in particular red meat, can
be reduced if the population eats less red meat and reduce their waste of food. Methane
emissions from landfills are controlled by waste regulations and will be reduced accordingly.
No measures on waste management in landfills have therefor been suggested.
6.3 Organic carbon and SO2 Organic carbon particles are produced by burning of biofuel and fossil fuel. These particles
reflect solar radiation and contribute to cooling and have a negative climate effect. Since
organic carbon always is emitted from the same source and at the same time as black carbon,
organic carbon should always be included when calculating climate effects of measures that
reduce black carbon.
Sulphur dioxide (SO2) is generated by burning substances containing sulfur, mainly oil and
coal, as well as by a number of industrial processes. SO2 is also sometimes co-emitted with
other short-lived climate pollutants and should also be taken into account when analyzing the
effects of a measure. These particles have a cooling effect when present in the atmosphere
(a removal will contribute to warming) and can cause to counteract the climate effect from
reducing SLCPs.
The net climate effect of a measure depends on the ratio of reduced warming and cooling
particles. But a reduction of all these particles will always have a positive health effect.
6.4 Other measures
There might be other and better measures than described in Table 2 that could be
implemented in the Norwegian Barents region. For instance, we have not looked at measures
aimed specifically to reduce CO2-emissions because that was outside the scope for the
proposed action plan on Norwegian emissions of SLCPs (NEA, 2013). Many measures, for
instance traffic reducing initiatives and energy efficiency, reduce both CO2 and SLCPs. The
uncertainty in the black carbon inventory is large, and may have limited our ability to identify
all possible mitigation options.
7. Uncertainties
In addition to the uncertainty related to the distribution of emissions and uncertainties that
arise from the regional resolution of this study (chapter 3), there are uncertainties associated
with the emission estimates and the calculation of the climate effect. According to NIR (2013)
the uncertainty in the national methane emissions data is 14 %. The uncertainty in the black
carbon emissions is not quantified but is considerably higher (NEA, 2013). The uncertainty in
Black carbon and methane in the Norwegian Barents region | M276
15
the black carbon emissions is mostly related to lack of reliable country and technology
specific emissions factors. There are also uncertainties related to the climate effect as a
result of uncertainty in the modeling. The choice of metric has to be considered carefully, in
order to fit with the purpose of the analysis. Sensitivity analyses with various metrics indicate
that the climate effect of measures is generally reduced if the time horizon is increased from
10 years (short term) to 100 years (long term).
8. References
Aasestad et al., 2013, Emissions of black carbon and organic carbon in Norway 1990-2011,
Document 13/2013
Hodnebrog et al. (2013), Climate impact of Norwegian emissions of short-lived climate forcers
http://www.miljodirektoratet.no/Global/dokumenter/tema/klima/19092014(CICERO_metrics_English_f
inal).pdf
IPCC (1995), Houghton, J.T.; Meira Filho, L.G.; Callander, B.A.; Harris, N.; Kattenberg, A.,
and Maskell, K., ed., Climate Change 1995: The Science of Climate Change, Contribution of
Working Group I to the Second Assessment Report of the Intergovernmental Panel on Climate
Change, Cambridge University Press.
IPCC, 2013: Climate Change 2013: The Physical Science Basis. Contribution of Working Group I
to the Fifth Assessment Report of the Intergovernmental Panel on Climate Change [Stocker,
T.F., D. Qin, G.-K. Plattner, M. Tignor, S.K. Allen, J. Boschung, A. Nauels, Y. Xia, V. Bex and
P.M. Midgley (eds.)]. Cambridge University Press, Cambridge, United Kingdom and New York,
NY, USA, 1535 pp, doi:10.1017/CBO9781107415324
NEA- Norwegian Environment Agency (2013), Proposed Action Plan for Norwegian Emissions of
Short Lived Climate Pollutants, M89
http://www.miljodirektoratet.no/no/Publikasjoner/2014/Mars-20141/Summary-of-proposed-
action-plan-for-Norwegian-emissions-of-shortlived-climate-pollutants/
NIR – National Inventory Report (2013), Greenhouse Gas Emissions 1990-2011, NEA, TA3030
http://www.miljodirektoratet.no/no/Publikasjoner/Publikasjoner/2013/April/National_Inven
tory_Report_Greenhouse_Gas_Emissions_1990_2011/
Statistics Norway (2014): Fylkestall for utslipp av klimagasser [Emissions of greenhouse gases
by counties]. http://www.ssb.no/natur-og-miljo/artikler-og-publikasjoner/fylkestall-for-
utslipp-av-klimagasser (In Norwegian only)

The Norwegian Environment Agency’s primary
tasks are to reduce greenhouse gas emissions,
manage Norwegian nature, and prevent pollution.
We are under the Ministry of Climate and
Environment and have over 700 employees at our
two offices in Trondheim and Oslo and at the
Norwegian Nature Inspectorate’s more than sixty
local offices.
Our principal functions include monitoring the
state of the environment, conveying environment-
related information, exercising authority,
overseeing and guiding regional and municipal
authorities, cooperating with relevant industry
authorities, acting as an expert advisor, and
assisting in international environmental efforts.
Norwegian Environment Agency
Telephone: +47 73 58 05 00 | Fax: +47 73 58 05 01
E-mail: [email protected]
Web: www.environmentagency.no
Postal address: Postboks 5672 Sluppen, N-7485 Trondheim
Visiting address Trondheim: Brattørkaia 15, 7010 Trondheim
Visiting address Oslo: Strømsveien 96, 0602 Oslo