BLACK BELT PROJECT INPATIENT DISCHARGE …nargund.com/lss/bbprojects/DBloomquist Black Belt...
35
BLACK BELT PROJECT INPATIENT DISCHARGE TIME GEORGIA STATE UNIVERSITY LEAN SIX SIGMA EXECUTIVE EDUCATION PROGRAM DAVID BLOOMQUIST FEBRUARY 2008
-
Upload
nguyenkhue -
Category
Documents
-
view
219 -
download
1
Transcript of BLACK BELT PROJECT INPATIENT DISCHARGE …nargund.com/lss/bbprojects/DBloomquist Black Belt...

B L A C K B E L T P R O J E C T
I N P A T I E N T D I S C H A R G E T I M E
GEORGIA STATE UNIVERSITY
LEAN SIX SIGMA EXECUTIVE EDUCATION PROGRAM
DAVID BLOOMQUIST
FEBRUARY 2008

1 Six Sigma Black Belt Project © David Bloomquist 2008
Table of Contents
• Background.....................................................................................................................................................4
o The Hospital ...............................................................................................................................................4
o Process Improvement at NAH .............................................................................................................4
o Six Sigma Black Belt Project .................................................................................................................5
o The Project Team .....................................................................................................................................5
• Define ................................................................................................................................................................5
o Financial Implications ............................................................................................................................5
o Voice of the Business (VoB) .................................................................................................................6
o Voice of the Customer (VoC)................................................................................................................6
o “Big Y’s” ........................................................................................................................................................6
o Charter..........................................................................................................................................................7
o SIPOC.............................................................................................................................................................7
• Measure ............................................................................................................................................................8
o Available Data............................................................................................................................................8
o Additional Data Capture ........................................................................................................................9
o Surveys ......................................................................................................................................................10
• Analyze ..........................................................................................................................................................10
o Data Analysis...........................................................................................................................................10
o Swim lane Analysis ...............................................................................................................................11
o Cause and Effect (Fishbone) Diagram ...........................................................................................12
o Focusing on a single unit ....................................................................................................................13
o Measure again.........................................................................................................................................13
o Process Control? ....................................................................................................................................15
o Root cause analysis...............................................................................................................................16
• Improve .........................................................................................................................................................17
o Gold Star Program.................................................................................................................................17
o Discharge Scheduling...........................................................................................................................19
o Results .......................................................................................................................................................21
2 Six Sigma Black Belt Project © David Bloomquist 2008
• Control – Keeping Changes in Effect ..................................................................................................23
o Training.....................................................................................................................................................23
o New HIS.....................................................................................................................................................23
o Installing a DSS.......................................................................................................................................24
o Communications....................................................................................................................................24
• Appendix A – Project Charter................................................................................................................25
Appendix B – Physician Survey.....................................................................................................................29
• Appendix C – Physician Survey Analysis ..........................................................................................31
• Appendix D – ADT Report Analysis ....................................................................................................32
o NAH Admissions by Day-of-the-Week ..........................................................................................32
o NAH Discharges by Day-of-the-Week............................................................................................32
o NAH Total Discharges by Unit ..........................................................................................................33
o NAH Discharge Time-of-Day by Unit (24 hour clock).............................................................34

3 Six Sigma Black Belt Project © David Bloomquist 2008
Table of Figures
Figure 1 - SIPOC Chart .........................................................................................................................................8 Figure 2 - Admission Times VS Discharge Times......................................................................................9 Figure 3 - Patient Observation Table..........................................................................................................10 Figure 4 - Comparison of Discharge Times from Earliest to Latest Unit ......................................11 Figure 5- Swim Lane Analysis........................................................................................................................12 Figure 6- Cause and Effect Diagram ............................................................................................................13 Figure 7 - 7 West Discharge Times Boxplot .............................................................................................14 Figure 8 - 7 West Histogram of Discharge Times...................................................................................14 Figure 9 - 7 West I-MR Chart..........................................................................................................................15 Figure 10 - Impact vs Control ........................................................................................................................17 Figure 11 - Gold Star List Form.....................................................................................................................19 Figure 12 - Discharge Scheduling Process Flow.....................................................................................20 Figure 13 - Discharge Time Slot Map..........................................................................................................21 Figure 14 - Three Months of Improvement..............................................................................................22 Figure 15 – Improvement in Mean and Variation..................................................................................22 Figure 16 - Process Under Control ..............................................................................................................23 Figure 17 - Picture of SSBB Candidate with 7 West Staff....................................................................24

4 Six Sigma Black Belt Project © David Bloomquist 2008
• Background
o The Hospital North Atlanta Hospital, (a real medical center, though not its real name) is a 410 non-profit bed acute stay facility serving the northern suburbs of Atlanta. NAH employs 2,700 personnel, working with over 750 physicians. The hospital campus includes four doctors buildings and two outpatient centers (one cardiac focused and the other oncology). Annually the hospital treats over 28,000 inpatients and over 165,000 outpatients. NAH operates an emergency department (ED) treating 34,000 patients annually. NAH is well known for its cardiac care, but also has areas specializing in neurologic, vascular, gastrointestinal, orthopedic, cancer, and respiratory disorders. The hospital is divided into sixteen “units”, each with approximately 24 beds. Each unit specializes in a certain kind of care, though from time to time, when beds are full in a particular unit, patents may be placed “off unit”, where a different type of patient population is normally treated. Each unit is managed by a nurse manager. All the units are grouped into either one of two service types, each service line with its own director. The two service line directors report to the chief nursing officer, who in turn reports to the hospital CEO. Each unit is usually staffed by six nurses, one of which is designated as “charge nurse”. Additionally, each unit has two patient care techs who assist the nurses, and one secretary who handles the administrative side of each unit. Other functions within the hospital include administration, apothecary, blood bank, care management, central transportation, engineering, environmental services, food & nutrition services, human resources, laboratory services, materials management, medical education, medical records, morgue, patient placement, occupational therapy, pathology, patient access services (admissions), pharmacy, print shop, security, and social services.
o Process Improvement at NAH
It’s fair to say that lives literally hang in the balance depending on the quality of service provided at any hospital. Though quality can be measured in many ways in a healthcare setting, any one lapse can have devastating effects. Hospitals are heavily regulated. The most recognized regulatory body being The Joint Commission on Accreditation of Healthcare Organizations, better known as just the “Joint Commission”.
5 Six Sigma Black Belt Project © David Bloomquist 2008
o Six Sigma Black Belt Project Most hospital quality initiatives revolve around clinical outcomes. However, at NAH, there are two groups working to improve quality: one on the clinical side, and another more focused on business processes. The latter group is chartered mostly on improving efficiency. This group, known at NAH as Business Process Improvement (BIP), has a staff of three: two Six Sigma Black Belts and one Green Belt. Through the hospital’s CEO, I was introduced to the director of NAH’s Business Process Improvement group. After enquiring about a possible black belt project, I was offered the opportunity to join the BIP staff as a “special projects volunteer”. We discussed various process improvement initiatives that management was focusing on, and agreed that I would lead the team working to improve inpatient discharge times, i.e. discharging patients earlier in the day. o The Project Team With the help of the Director of the Business Process Improvement department, a team was assembled to work on the goal of improving discharge times. The team included six unit nursing managers, a care manager, and a nursing administration manager. While other people came and went as needed during the six months that the project moved forward, a core of about six people stayed focused on accomplishing the goal handed down by hospital senior management.
• Define o Financial Implications
Despite being one of the largest hospitals in the Atlanta area, North Atlanta Medical Center often operates at full capacity. When rooms are full, potential new patients are diverted to other facilities, intra-hospital transfers take longer, patient goodwill is lost, hospital assets are underutilized, and new revenues are forfeited.
• At capacity, potential new patients may be diverted to other care facilities. These diversions may occur at the ED (emergency department, also known as emergency room) when ED beds are full, or at the unit level, when a given care unit (hospital wing) is full.
• At capacity, the patient experience deteriorates as patients being transferred from one unit to another (following the normal patient flow of surgery to ICU to recovery) must wait for a room to become available. Additionally, patients may be housed in temporary facilities not well suited to their situation.

6 Six Sigma Black Belt Project © David Bloomquist 2008
• At capacity, hospital assets may be underutilized or misutilized, such as the case when ED beds are temporarily used to house patients that should be transferred to other units, but for which no bed is available.
• Under diversion, when patients are routed to other health care facilities, North Atlanta Medical Center loses the potential revenue and profit associated with treating said patient.
Actual revenue from an average inpatient stay is approximately $12,000.00. Variable costs that can be association with patients stays are 57% of total costs of $11,900.00. The average inpatient stay is approximately 4.9 days. If patient discharge times are improved from the current 3:11 PM to 11:00 AM, average patient costs would drop by roughly $228.00 due to lower variable costs1 including elimination of one meal. This would equate to roughly $6.4M in annual cost savings. o Voice of the Business (VoB)
There are two principle customers with a vested interest in early discharge. The first, as referenced above, is the hospital itself. NAH is a nonprofit provider. Much of NAH’s revenue comes from federal government programs Medicare and Medicaid, both of which limit the amount paid to a fixed fee. Accordingly, much of NAH’s revenues are flat and inelastic. The hospital needs to operate as efficiently as possible in order to continue to provide its services to the public. Early discharges reduce costs against a background of fixed revenues. o Voice of the Customer (VoC) The other customer is the patient who has been admitted to NAH. In a competitive environment such as healthcare, NAH wants to make sure that their services are perceived as being better than the competition. NAH regularly conducts surveys (through 3rd parties) to determine what patients think about NAH service. Great service can be negated if the final hours in the hospital leave a bad impression in the mind of the patient. I have personally observed patients waiting at the door to their room, impatiently pacing back and forth, waiting to be discharged. After spending an average of five days in the hospital, most patients want to leave as soon as possible on their day of discharge.
o “Big Y’s”
There are two “Big Y’s” related to the early discharge of patients from the hospital. One is Average Length of Stay, or ALOS. This is the time frame from when the patient is admitted to a hospital unit to the time they are discharged and subsequently leave the hospital. It should be pointed out the while doctors may write discharge orders (releasing the patient) at one point in time, there are factors that may delay further the actual departure of the patient. ALOS varies from unit to
1 Assumes that costs a linear as a function of stay.
7 Six Sigma Black Belt Project © David Bloomquist 2008
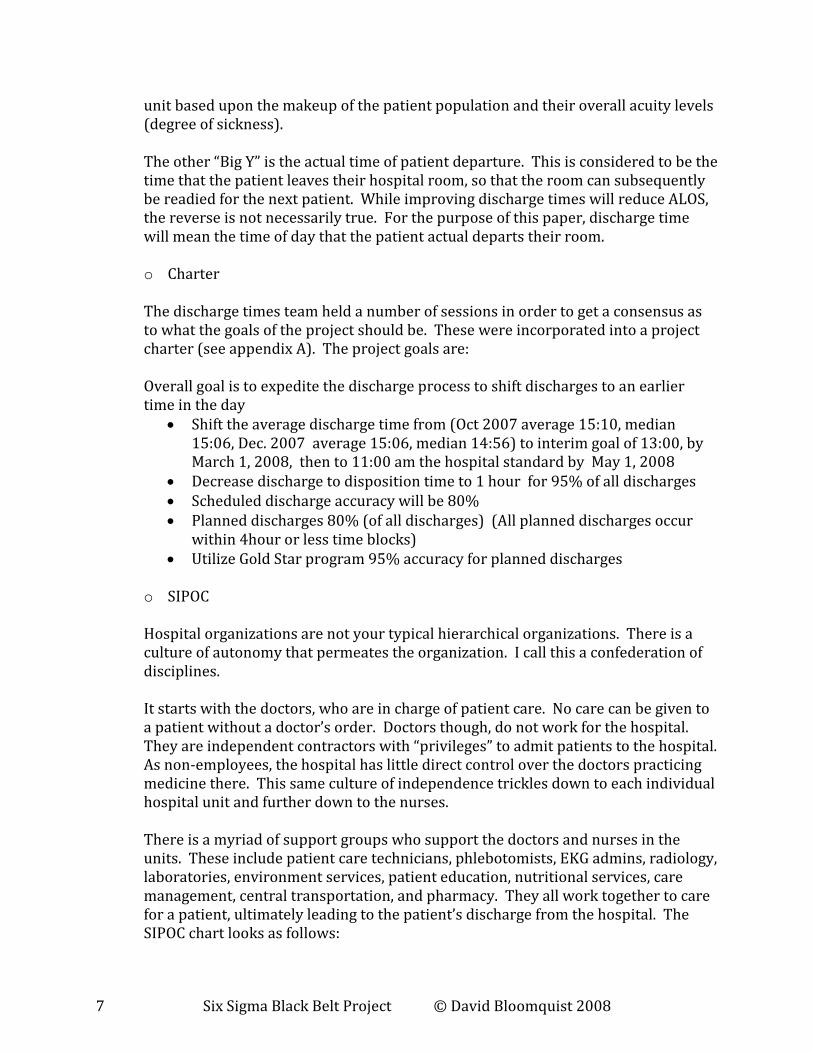
unit based upon the makeup of the patient population and their overall acuity levels (degree of sickness).
The other “Big Y” is the actual time of patient departure. This is considered to be the time that the patient leaves their hospital room, so that the room can subsequently be readied for the next patient. While improving discharge times will reduce ALOS, the reverse is not necessarily true. For the purpose of this paper, discharge time will mean the time of day that the patient actual departs their room. o Charter
The discharge times team held a number of sessions in order to get a consensus as to what the goals of the project should be. These were incorporated into a project charter (see appendix A). The project goals are: Overall goal is to expedite the discharge process to shift discharges to an earlier time in the day
• Shift the average discharge time from (Oct 2007 average 15:10, median 15:06, Dec. 2007 average 15:06, median 14:56) to interim goal of 13:00, by March 1, 2008, then to 11:00 am the hospital standard by May 1, 2008
• Decrease discharge to disposition time to 1 hour for 95% of all discharges
• Scheduled discharge accuracy will be 80%
• Planned discharges 80% (of all discharges) (All planned discharges occur within 4hour or less time blocks)
• Utilize Gold Star program 95% accuracy for planned discharges o SIPOC
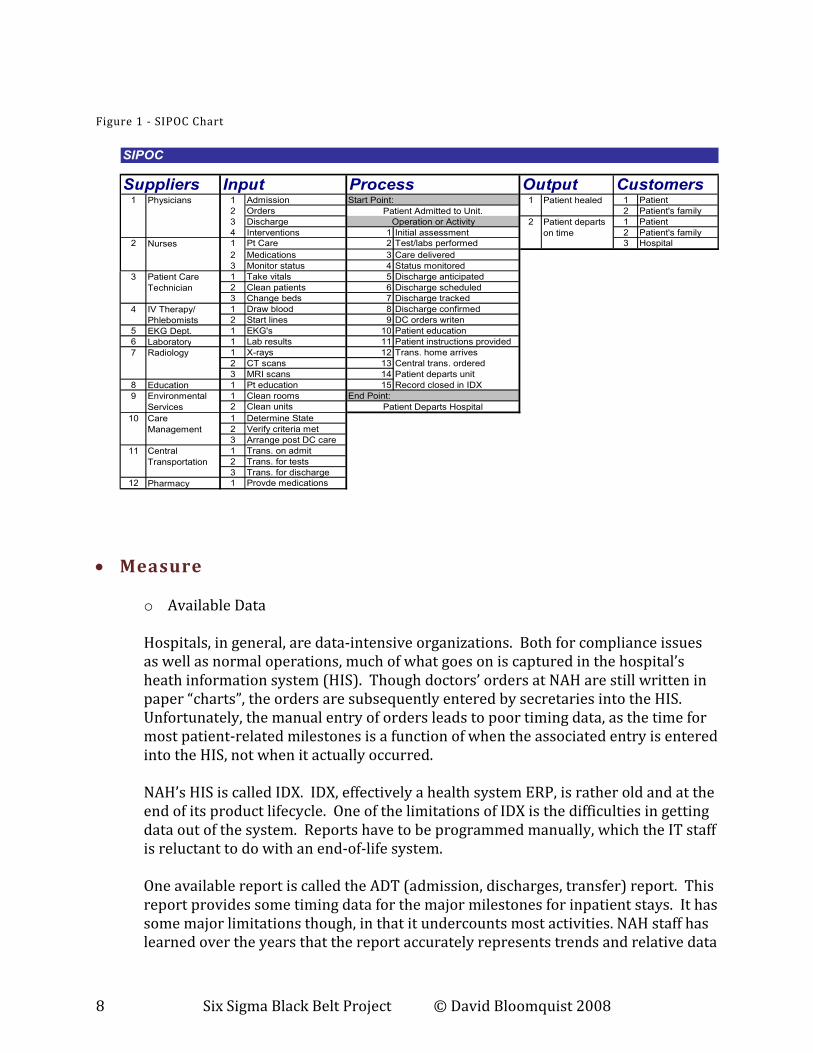
Hospital organizations are not your typical hierarchical organizations. There is a culture of autonomy that permeates the organization. I call this a confederation of disciplines. It starts with the doctors, who are in charge of patient care. No care can be given to a patient without a doctor’s order. Doctors though, do not work for the hospital. They are independent contractors with “privileges” to admit patients to the hospital. As non-employees, the hospital has little direct control over the doctors practicing medicine there. This same culture of independence trickles down to each individual hospital unit and further down to the nurses. There is a myriad of support groups who support the doctors and nurses in the units. These include patient care technicians, phlebotomists, EKG admins, radiology, laboratories, environment services, patient education, nutritional services, care management, central transportation, and pharmacy. They all work together to care for a patient, ultimately leading to the patient’s discharge from the hospital. The SIPOC chart looks as follows:
8 Six Sigma Black Belt Project © David Bloomquist 2008
Figure 1 - SIPOC Chart
Suppliers Input Process Output Customers1 1 Admission Start Point: 1 1 Patient
2 Orders 2 Patient's family
3 Discharge 2 1 Patient
4 Interventions 1 Initial assessment 2 Patient's family
2 1 Pt Care 2 Test/labs performed 3 Hospital
2 Medications 3 Care delivered
3 Monitor status 4 Status monitored
1 Take vitals 5 Discharge anticipated
2 Clean patients 6 Discharge scheduled
3 Change beds 7 Discharge tracked
1 Draw blood 8 Discharge confirmed
2 Start lines 9 DC orders writen
5 EKG Dept. 1 EKG's 10 Patient education
6 Laboratory 1 Lab results 11 Patient instructions provided
1 X-rays 12 Trans. home arrives
2 CT scans 13 Central trans. ordered
3 MRI scans 14 Patient departs unit
8 Education 1 Pt education 15 Record closed in IDX
1 Clean rooms End Point:
2 Clean units
1 Determine State
2 Verify criteria met
3 Arrange post DC care
1 Trans. on admit
2 Trans. for tests
3 Trans. for discharge
12 Pharmacy 1 Provde medications
SIPOC
Patient healed
Patient departs
on time
Patient Care
Technician
Radiology
3
4
7
Nurses
Operation or Activity
10
11
Physicians
IV Therapy/
Phlebomists
Environmental
Services
Patient Admitted to Unit.
Patient Departs Hospital
Care
Management
Central
Transportation
9
• Measure
o Available Data
Hospitals, in general, are data-intensive organizations. Both for compliance issues as well as normal operations, much of what goes on is captured in the hospital’s heath information system (HIS). Though doctors’ orders at NAH are still written in paper “charts”, the orders are subsequently entered by secretaries into the HIS. Unfortunately, the manual entry of orders leads to poor timing data, as the time for most patient-related milestones is a function of when the associated entry is entered into the HIS, not when it actually occurred.
NAH’s HIS is called IDX. IDX, effectively a health system ERP, is rather old and at the end of its product lifecycle. One of the limitations of IDX is the difficulties in getting data out of the system. Reports have to be programmed manually, which the IT staff is reluctant to do with an end-of-life system. One available report is called the ADT (admission, discharges, transfer) report. This report provides some timing data for the major milestones for inpatient stays. It has some major limitations though, in that it undercounts most activities. NAH staff has learned over the years that the report accurately represents trends and relative data
9 Six Sigma Black Belt Project © David Bloomquist 2008
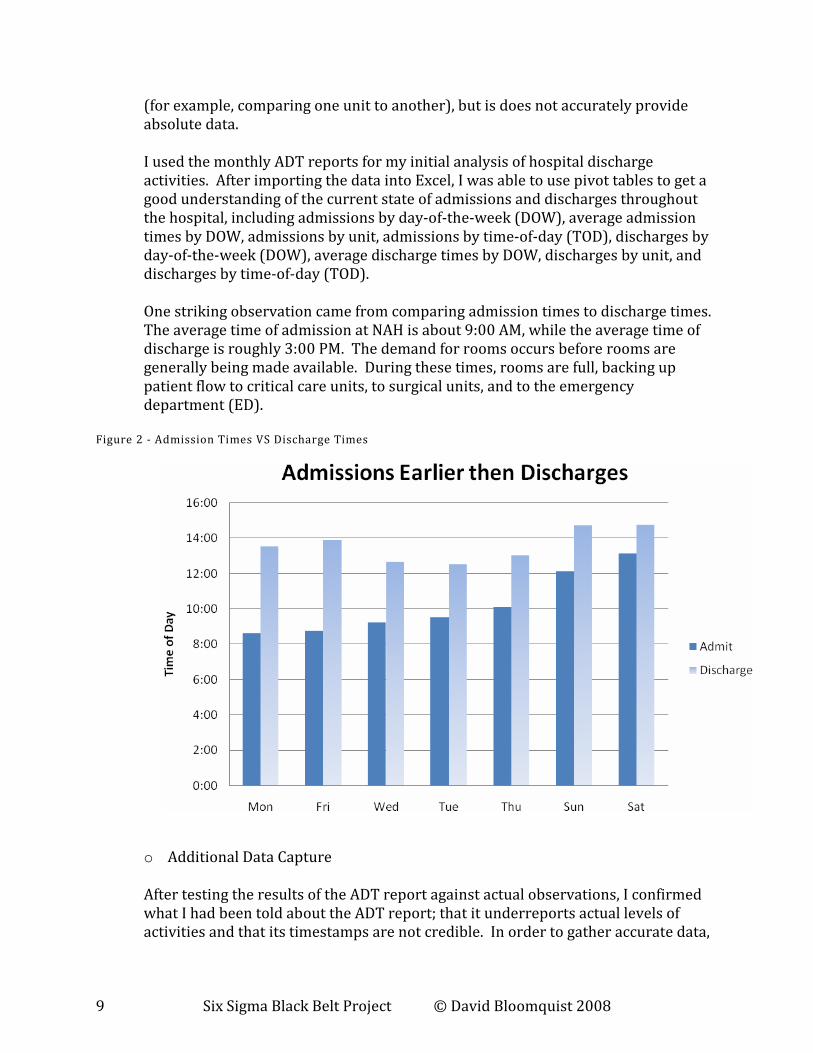
(for example, comparing one unit to another), but is does not accurately provide absolute data. I used the monthly ADT reports for my initial analysis of hospital discharge activities. After importing the data into Excel, I was able to use pivot tables to get a good understanding of the current state of admissions and discharges throughout the hospital, including admissions by day-of-the-week (DOW), average admission times by DOW, admissions by unit, admissions by time-of-day (TOD), discharges by day-of-the-week (DOW), average discharge times by DOW, discharges by unit, and discharges by time-of-day (TOD). One striking observation came from comparing admission times to discharge times. The average time of admission at NAH is about 9:00 AM, while the average time of discharge is roughly 3:00 PM. The demand for rooms occurs before rooms are generally being made available. During these times, rooms are full, backing up patient flow to critical care units, to surgical units, and to the emergency department (ED).
Figure 2 - Admission Times VS Discharge Times
o Additional Data Capture
After testing the results of the ADT report against actual observations, I confirmed what I had been told about the ADT report; that it underreports actual levels of activities and that its timestamps are not credible. In order to gather accurate data,

10 Six Sigma Black Belt Project © David Bloomquist 2008
I spent the better parts of two weeks in different units within the hospital observing patient care. I created table of major milestones which I used for recording my observations. The table looks as follows:
Figure 3 - Patient Observation Table
Date: 12/13/2007 Unit: 7East Case Manager: Sandy
Room #
Condition/
Procedure Nurse Physician Labs Ordered
Time labs
complete
EKG
and
time
Time Med
Recon.
Printed
Time DC
order
written by
Doc
PA or
Doc?
Time DC
order
entered
into IDX
DC
Disposition
to: (home,
SNF, etc.)
Time last
consult
completed
Time PT
Instructions
Completed
by Nurse Scripts
Time
Family
Expecte
d
Time
Transport
Ordered
Time
Transport
Arrived
Time PT
Departs
Time PT
Disposed
in IDX
Time
Room
Clean
Started
Time
Room
Clean
Complete
Time
notification
of next PT
Next PT
arrives
Orders to PT
Leaving
1 atrial fib Wilma Chang Protime 6:05 9:30 3:30 17:50
12 cough/malaise Wilma Toparoff - - - 3:30 Rehab Ambulance 10:59 11:15 11:20 11:07 12:22
16 chest pain Myla Jansen CK/CKMB 8:50 - 3:30 10:00 11:00 Home 11:05 11:13 11:18 11:19 11:32 15:40 1:19
18 angina Dawn Malave CBC/Chem 6:30 7:00 3:30 17:35
22 coronary AS Sonya Palmer
CBC/BN
Panel/CK/CKM
S 7:40 - 3:30 13:32 Home 14:15 14:16 14:27 14:27 14:28 14:32 15:06 14:44 15:32 0:55
23 MI Erika Lieppe BM/Pnl 6:40 - 3:30 Stay
17 chest pain Erika Unterman Chem 9:00 - 11:31 11:31 Home 14:30 15:00 16:00 NT NT 15:50 1:20
21 atrial flutter Dawn Levy Glucose 6:41 - ? 15:37 16:30
23 16:05
5 20:38
Average 12:40 15:41 1:11
o Surveys
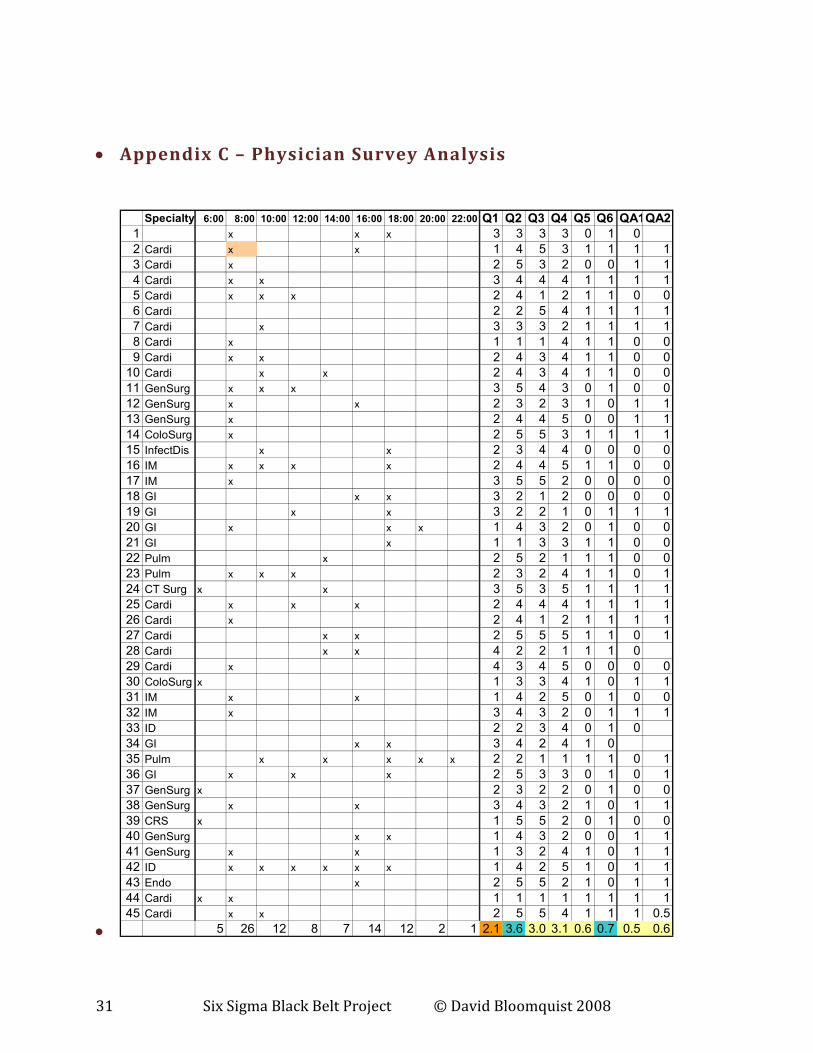
Once the project team got a feeling for the challenge of improving discharge times, they felt it would be appropriate to survey the top 180 most active physicians who admit patients to NAH. The goal of the survey was to see to what degree the doctors thought discharge times should be improved and float a few possible solutions to seek physician feedback (see appendix B). In general, the doctors were mostly neutral on both the significance of the problem and the suggested solutions. This did not surprise the project team, as the doctor’s are not influence by the same forces that affect the hospital. See the analysis of the responses in appendix c.
• Analyze
o Data Analysis
Box Plots There are over a dozen individual hospital units at NAH. They service different patient populations, usually based upon the patient’s disease and acuity (illness) level). Based upon the ADT report data as referenced earlier, we knew there was considerable variation in the discharge times from unit to unit. I ran a box plot and two-sample T-Test to determine whether the earliest discharging unit (3 South) was statistically different then the latest discharging unit (6 West). As you can see in figure #4, with a P-Value of .006, the populations are indeed different.

11 Six Sigma Black Belt Project © David Bloomquist 2008
Figure 4 - Comparison of Discharge Times from Earliest to Latest Unit
o Swim lane Analysis
Given the more-or-less independent relationships of the various constituencies that work together to provide patient care, a single monolithic flow chart does not adequately reflect the numerous processes that happen during the stay of a patient. I created a swim lane chart showing the relative timing of each constituency’s efforts to better convey the activities that ultimately lead to patient discharge:
Two-Sample T-Test and CI: Adj Disch Time_3SOU, Adj Disch
Time_6WST Two-sample T for Adj Disch Time_3SOU vs Adj Disch Time_6WST N Mean StDev SE Mean Adj Disch Time_3SOU 47 0.556 0.142 0.021 Adj Disch Time_6WST 36 0.640 0.127 0.021 Difference = mu (Adj Disch Time_3SOU) - mu (Adj Disch Time_6WST) Estimate for difference: -0.0841 95% CI for difference: (-0.1430, -0.0253) T-Test of difference = 0 (vs not =): T-Value = -2.84 P-Value = 0.006 DF = 79

12 Six Sigma Black Belt Project © David Bloomquist 2008
Figure 5- Swim Lane Analysis
o Cause and Effect (Fishbone) Diagram
As referenced above, there are many groups and forces at play that affect the average length of stay and the discharge time for NAH patients. These are documented in the cause and effect (or fishbone diagram) below.

13 Six Sigma Black Belt Project © David Bloomquist 2008
Figure 6- Cause and Effect Diagram
o Focusing on a single unit
Given the unique patient population from unit to unit, as well as the differing kinds of care provided by each unit, the project team decided to focus its efforts on one unit. In choosing a particular unit, we looked at where we could have the most impact on discharge times (a function of short ALOS, which means that beds turn over more quickly), minimal acuities, and open-mindedness among both doctors and the nursing staff. 7 West, a post-interventional cardiology unit, was selected.
o Measure again
As referenced above, the limitations of the ADT report preclude being able to use it for more than simple trend data. The project team decided to start manually capturing data on 7 West to more accurately understand the current state of the unit and to see the impact of any proposed changes. Based upon one month’s worth of observations, the unit’s discharge times are as follows:

14 Six Sigma Black Belt Project © David Bloomquist 2008
Figure 7 - 7 West Discharge Times Boxplot
Figure 8 - 7 West Histogram of Discharge Times

15 Six Sigma Black Belt Project © David Bloomquist 2008
o Process Control?
Lastly, before moving on to the Improve phase of the project, we ran an I-MR chart to see if the current process (T0) is under control. As you can see below, not only is then mean off from our stated objectives, but there is much variation:
Figure 9 - 7 West I-MR Chart

16 Six Sigma Black Belt Project © David Bloomquist 2008
o Root cause analysis
After limiting its analysis to 7 West, the project team came up with the following possible causes for the delay and variation of patient discharges the unit. They were ranked based upon significance of impact as follows:
1. Physician rounding times 2. High nurse to patient ratio 3. Late family transportation 4. Multiple physician consultations (per patient) 5. Discharge paperwork 6. Lab results on time
However, the team recognized that given the lose coupling of the disciplines that are involved with patient care at NAH, as well as the decentralized organizational structure of the hospital, the we would need to factor in the team’s ability to influence and/or change these root cause issues. Accordingly, the team used a matrix structure to factor in significance of the issues along with the ability to control the issues in order to prioritize its efforts:

17 Six Sigma Black Belt Project © David Bloomquist 2008
Figure 10 - Impact vs Control
Item Impact Influence Level Score
Family / transportation 3 2 6
Labs on time 2 3 6
Consults 2 2 4
DC Paperwork 2 2 4
Nurse/pt ratio & acuity 3 1 3
Physician Rounding 3 1 3
The team decided to focus its efforts on reducing variation in patient transportation times and availability of laboratory results.
• Improve
o Gold Star Program
From the physician surveys that the team had analyzed earlier, according to the doctors, late lab results sometimes prohibited physicians from discharging patients in a timely manner. The team looked for a solution to ensure that lab results would not delay early discharge. The term “labs” actually refers to a number of processes that are used to diagnosis patient condition. Labs includes not only clinical labs, but IV therapy, radiology, and EKG’s. A holdup in any one could delay a patient’s discharge. The team decided to look at how labs are prioritized. Labs are completed as the result of a doctor’s orders (a lab must be ordered by a physician). These orders are scheduled for one or more times per day and may continue to repeat. Emergency or “stat” orders are prioritized over any other regularly timed orders. After stat orders, orders associated with a surgical procedure are prioritized next. After these orders, all regular orders follow.

18 Six Sigma Black Belt Project © David Bloomquist 2008
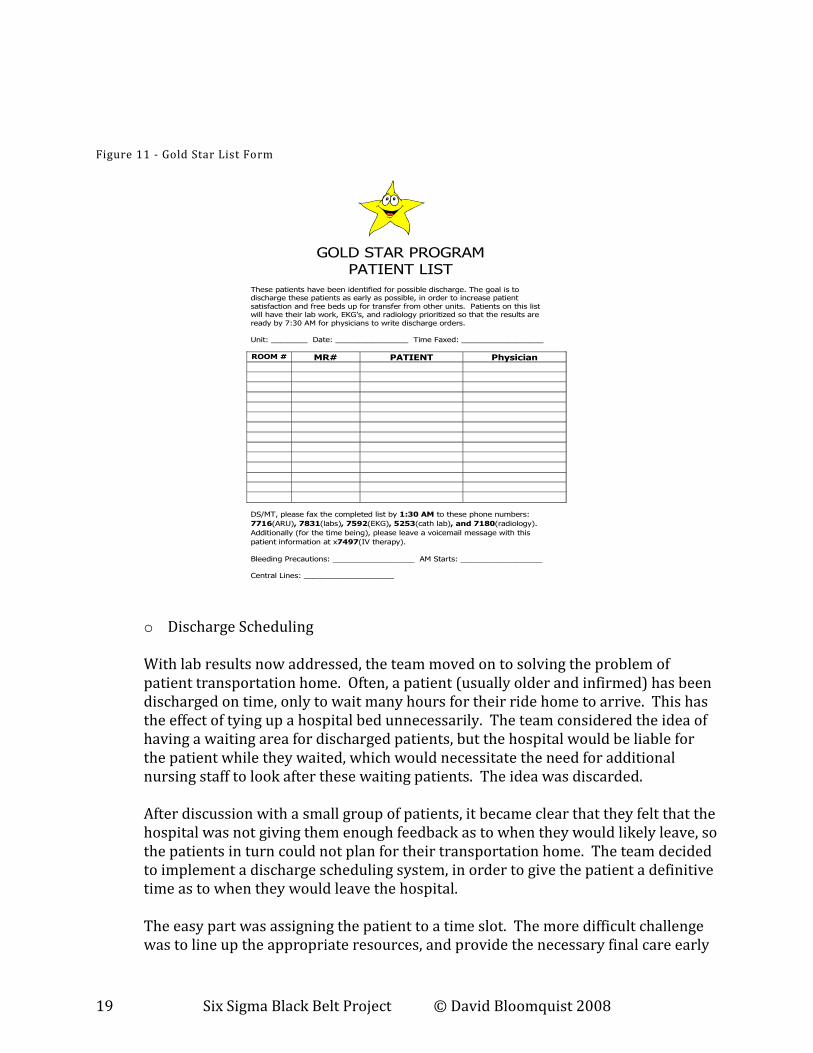
The team borrowed a concept that had been used within the hospital on a very limited basis. The program, called Gold Star, prioritizes patient lab results for patients that are projected to leave the hospital. Each evening, the night charge nurse predicts which patients in the unit will likely leave the next day. These patient names are put on a list and faxed to all ancillary support services early in the morning. The support organizations prioritize these lab orders between stat orders and regularly scheduled orders, with the goal of having all results posted and available by 7:30 AM, the time at which most doctors start to round and issue discharge orders. The project team developed a plan to take the Gold Star program hospital-wide. Over a period of two months various hospital units were incrementally added to the program until all units with relatively short ALOS were on the GS program. Random sampling of patient records on the gold start program indicated virtually 100% availability of lab results by 7:30 AM. The team communicated back to the hospital physician staff that they could now count on labs to be ready when they round early. The project team continued to audit usage of the Gold Star tool, looking for both usage and accuracy. Usage in T1 was 100%, while accuracy (prediction of patients to be discharged exceeded expectations of 90%).
19 Six Sigma Black Belt Project © David Bloomquist 2008
Figure 11 - Gold Star List Form
GOLD STAR PROGRAM
PATIENT LIST These patients have been identified for possible discharge. The goal is to discharge these patients as early as possible, in order to increase patient
satisfaction and free beds up for transfer from other units. Patients on this list will have their lab work, EKG’s, and radiology prioritized so that the results are
ready by 7:30 AM for physicians to write discharge orders.
Unit: ________ Date: ________________ Time Faxed: __________________
ROOM # MR# PATIENT Physician
DS/MT, please fax the completed list by 1:30 AM to these phone numbers:
7716(ARU), 7831(labs), 7592(EKG), 5253(cath lab), and 7180(radiology).
Additionally (for the time being), please leave a voicemail message with this
patient information at x7497(IV therapy).
Bleeding Precautions: __________________ AM Starts: __________________ Central Lines: ____________________
o Discharge Scheduling
With lab results now addressed, the team moved on to solving the problem of patient transportation home. Often, a patient (usually older and infirmed) has been discharged on time, only to wait many hours for their ride home to arrive. This has the effect of tying up a hospital bed unnecessarily. The team considered the idea of having a waiting area for discharged patients, but the hospital would be liable for the patient while they waited, which would necessitate the need for additional nursing staff to look after these waiting patients. The idea was discarded. After discussion with a small group of patients, it became clear that they felt that the hospital was not giving them enough feedback as to when they would likely leave, so the patients in turn could not plan for their transportation home. The team decided to implement a discharge scheduling system, in order to give the patient a definitive time as to when they would leave the hospital. The easy part was assigning the patient to a time slot. The more difficult challenge was to line up the appropriate resources, and provide the necessary final care early
20 Six Sigma Black Belt Project © David Bloomquist 2008
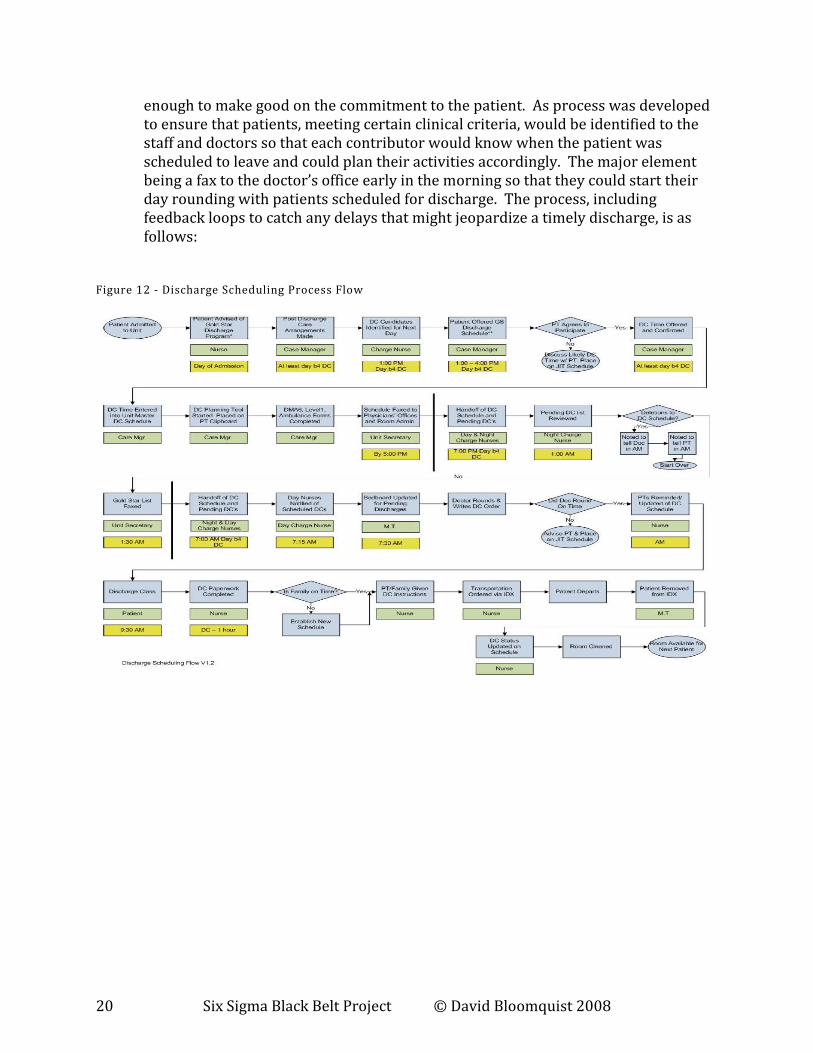
enough to make good on the commitment to the patient. As process was developed to ensure that patients, meeting certain clinical criteria, would be identified to the staff and doctors so that each contributor would know when the patient was scheduled to leave and could plan their activities accordingly. The major element being a fax to the doctor’s office early in the morning so that they could start their day rounding with patients scheduled for discharge. The process, including feedback loops to catch any delays that might jeopardize a timely discharge, is as follows:
Figure 12 - Discharge Scheduling Process Flow

21 Six Sigma Black Belt Project © David Bloomquist 2008
A master schedule based upon unit resource constraints as well as individual nurse constraints was developed:
FIGURE 13 - DISCHARGE TIME SLOT MAP
10:30 Slot A 10:30 Slot B 10:30 Slot C 10:00 Slot A 10:00 Slot B 10:00 Slot C 9:30 Slot A
7:00
7:30 Doctor rounds
8:00 Doctor rounds Doctor rounds Doctor rounds
8:30 Doctor rounds Doctor rounds Doctor rounds Nurse completes patient
instructions sheet9:00 Nurse completes patient
instructions sheet
Nurse completes patient
instructions sheet
Nurse completes patient
instructions sheet
Patient instructions given
9:30 Nurse completes patient
instructions sheet
Nurse completes patient
instructions sheet
Nurse completes patient
instructions sheet
Patient instructions given Patient instructions given Patient instructions given Discharge slot
10:00 Patient instructions given Patient instructions given Patient instructions given Discharge slot Discharge slot Discharge slot
10:30 Discharge slot Discharge slot Discharge slot
11:00
11:30
Patient criteria for discharge scheduling:
Clinical No consults, or consults completed by day before DC
Post- Interventional Cardiology patients
Patients without groin complications (i.e. complication that requires ultrasound or CT scan prior to discharge).
Patients with Integrilin discontinued prior to midnight.
Patients without the diagnosis of a MI.
Patients without central line or other drainage devices
Post Electrophysiology patients
Patients without incisional complications (hematoma at site, bleeding at site, etc.)
Patients that do not need to resume Coumadin and achieve therapeutic INR prior to discharge.
Patients completing bedrest prior to morning.
Patients without central line or other drainage devices
Patient Going home (as opposed to another healthcare facility)
Transportation home available
Notes No more than one discharge slot per nurse. No more than 3 slots per unit.
DC scheduled patient should be placed on gold star list
o Results
The pilot program was run over a period of three months. During this time additional doctors and their corresponding patients were brought into the program. Continuing education program for the nursing staff was provided until institutional learning took effect. After three months, the mean discharge time improved to almost 11:00 AM and the variability improved to a standard deviation of just over an hour as indicated in the trend chart and box plot below:

22 Six Sigma Black Belt Project © David Bloomquist 2008
Figure 14 - Three Months of Improvement
Figure 15 – Improvement in Mean and Variation
23 Six Sigma Black Belt Project © David Bloomquist 2008
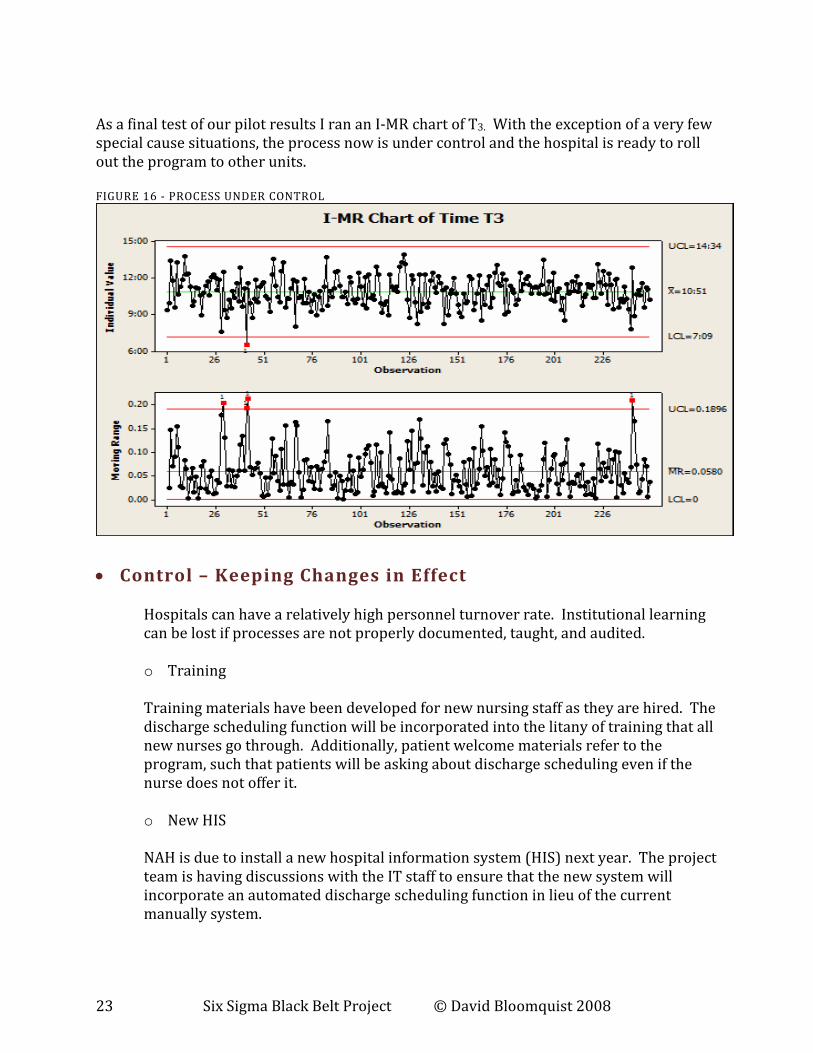
As a final test of our pilot results I ran an I-MR chart of T3. With the exception of a very few special cause situations, the process now is under control and the hospital is ready to roll out the program to other units. FIGURE 16 - PROCESS UNDER CONTROL
• Control – Keeping Changes in Effect
Hospitals can have a relatively high personnel turnover rate. Institutional learning can be lost if processes are not properly documented, taught, and audited. o Training Training materials have been developed for new nursing staff as they are hired. The discharge scheduling function will be incorporated into the litany of training that all new nurses go through. Additionally, patient welcome materials refer to the program, such that patients will be asking about discharge scheduling even if the nurse does not offer it.
o New HIS
NAH is due to install a new hospital information system (HIS) next year. The project team is having discussions with the IT staff to ensure that the new system will incorporate an automated discharge scheduling function in lieu of the current manually system.

24 Six Sigma Black Belt Project © David Bloomquist 2008
o Installing a DSS
As part of the new HIS, it is expected that the new system will have a host of new management tools, including dashboard capabilities. We are proposing that specifications for the new system include metrics for average length of stay, and average discharge time, with the ability to drill down on a unit-by-unit basis, and even down to individual doctors and nurses.
o Communications
Feedback to the doctors and nurses on the successes of the program usually go a long way towards ensuring compliance. The hospital has an employee newsletter that touts these kinds of programs. We plan to write an article recognizing all the participants that were instrumental in the success of the discharge scheduling process.
Figure 17 - Picture of SSBB Candidate with 7 West Staff

25 Six Sigma Black Belt Project © David Bloomquist 2008
• Appendix A – Project Charter
Discharge/ Patient Flow Charter Business Case
Problem Statement
As a result of Atlanta's growing population, the increase in ED visits in addition to our elective procedures has resulted in bed availability constraints. North Altanta Hospital will be reviewing the process to notify patients of their planned discharge the day before in order to have smoother discharges from the facility. It is urgent to begin this effort for all inpatient units (in a phased in approach) in order to be better able to handle patient flow and volume fluctuations to meet current demands and bed availability during times of increased demand. Inefficient bed flow results in long wait times for patients to reach their designated bed. The only way to improve bed turns and bed utilization is to establish synchronicity by matching demand to capacity. Scheduling discharges ahead will improve three key flow foundations - bed availability, reduction of delays, and synchronous operational flow. By improving the discharge process, (pull system) operations for the ED, post surgical anesthesia units, direct admissions, and wait times will improve.
The pull through process is ineffective. Traditionally, the discharge process does not receive priority in the eyes of the nurses who would consider delivery of care to the remaining patient load at hand as their highest priority. From the flow perspective, however, this causes patients with a dire need of clinical care to wait in the ED, on stretchers, in hallways or recovery areas. Unintended consequences are that higher acuity patients upstream experience longer wait times to their inpatient designation as well as receive care in recovery areas or high flow areas(ED) while lower acuity patients who could potentially be discharged from the unit still occupy the bed. Not having a highly structured discharge planning and scheduling process causes patients and family members to become frustrated with untimely discharges and also leads to delays for incoming patients from Direct Admission, Surgery or the Emergency Department. Earlier patient discharges will alleviate capacity constraints; improve patient throughput and bed availability. In short, an efficient discharge process translates into additional beds and new patient revenues. Matching demand to capacity is, however very difficult without having a schedule, and unscheduled discharges risk increasing ALOS. Problems related to non-scheduling include: 1) low utilization of beds due to inability to match demand to capacity, 2) cumbersome decision-making process with multiple isolated players and 3) increased LOS. Scheduling allows for the coordination of events within a controlled discharge process. Furthermore, timely discharges will be beneficial to patients and improve patient satisfaction when not a minute longer than necessary is spent in the hospital.

26 Six Sigma Black Belt Project © David Bloomquist 2008
Goal Statement In Scope Out of Scope
Resources
Key Deliverables
Resources
o Increased bed availability for admission areas o Increased patient satisfaction by releasing patients prior to rush hour o Improve discharge time accuracy
Units piloting new care models
Additional FTE’s. Employee incentive programs Patients who require consults the day before and day of discharge
Overall goal is to expedite the discharge process to shift discharges to an earlier time in the day
• Shift the average discharge time from (Oct 2007 average 15:10, median 15:06, Dec. 2007 average 15:06, median 14:56) to interim goal of 13:00, by March 1, 2008, then to 11:00 am the hospital standard by May 1, 2008
• Decrease discharge to disposition time to 1 hour 95% of all discharges
• Scheduled discharge accuracy will be 80%
• Planned discharges 80% (of all discharges) (All planned discharges occur with in 4hour or less time blocks)
• Utilize Gold Star program 95% accuracy for planned discharges
1 full time project team lead /4 South and 7 West staff
4th South and 7 West Unit Time the physician writes the discharge order to the time the patient leaves the room

27 Six Sigma Black Belt Project © David Bloomquist 2008
Performance Measurements
Name Baseline
Data
Baseline Goal Actual Notes
Name Baseline Data
Baseline Goal Actual Notes
Median /Discharge to Home/ post MD DC order
2:47 Hours
< 1 hour
Minimum of 3 scheduled discharges by 11am Minimum of 3 planned discharges( in addition to the scheduled discharges) by 1 pm.
Daily frequency of AM charge nurse and CM dialog before 11am
# Planned Discharges
% Planned Discharges
% Accuracy of Planned Discharges
80+% (within 2 months)
# Scheduled Discharges
% Scheduled Discharges
% Accuracy of Scheduled Discharges
50% (within 2 months)
Reduce IDX discharge time/actual time
52 Minutes 4 South

28 Six Sigma Black Belt Project © David Bloomquist 2008
/variance within 15 minutes
Specific to unit

29 Six Sigma Black Belt Project © David Bloomquist 2008
Appendix B – Physician Survey
PHYSICIAN SURVEY: PHYSICIAN SURVEY: PHYSICIAN SURVEY: PHYSICIAN SURVEY: LOS AND LOS AND LOS AND LOS AND DISCHARGE TIMESDISCHARGE TIMESDISCHARGE TIMESDISCHARGE TIMES
A number of teams are working to improve A number of teams are working to improve A number of teams are working to improve A number of teams are working to improve length of stay and length of stay and length of stay and length of stay and patient discharge times patient discharge times patient discharge times patient discharge times where where where where appropriate: appropriate: appropriate: appropriate: earlier in the day. earlier in the day. earlier in the day. earlier in the day. The majority of elective admissions occur prior to 10AMThe majority of elective admissions occur prior to 10AMThe majority of elective admissions occur prior to 10AMThe majority of elective admissions occur prior to 10AM or earlier or earlier or earlier or earlier and we strive to obtain physician discharge orders no later than 10AM when appropriate. In and we strive to obtain physician discharge orders no later than 10AM when appropriate. In and we strive to obtain physician discharge orders no later than 10AM when appropriate. In and we strive to obtain physician discharge orders no later than 10AM when appropriate. In addition, our global average length of stay is among the longest in metro Atlanta. addition, our global average length of stay is among the longest in metro Atlanta. addition, our global average length of stay is among the longest in metro Atlanta. addition, our global average length of stay is among the longest in metro Atlanta. Your opinion Your opinion Your opinion Your opinion and input and input and input and input as to how length of stay can be shortened andas to how length of stay can be shortened andas to how length of stay can be shortened andas to how length of stay can be shortened and discharges expedited are critical. discharges expedited are critical. discharges expedited are critical. discharges expedited are critical. PlPlPlPlease take a moment to fill ease take a moment to fill ease take a moment to fill ease take a moment to fill out out out out this questionnaire this questionnaire this questionnaire this questionnaire and and and and return it in the selfreturn it in the selfreturn it in the selfreturn it in the self----addressed envelope.addressed envelope.addressed envelope.addressed envelope. Specialty: ________________________Specialty: ________________________Specialty: ________________________Specialty: ________________________ My hospital rounds are typically at the following times: check all appropriate timMy hospital rounds are typically at the following times: check all appropriate timMy hospital rounds are typically at the following times: check all appropriate timMy hospital rounds are typically at the following times: check all appropriate times on this es on this es on this es on this continuum/timelinecontinuum/timelinecontinuum/timelinecontinuum/timeline
6am 8am 10am 12pm 2pm 4pm 6pm 8pm 10pm
Rate the following on 1= Strongly Agree 2= Agree 3= Neutral 4=Disagree 5=Strongly Disagree
Strongly Agree Agree Neutral Disagree Strongly Disagree
1. I generally have information available 1 2 3 4 5 that I need to make a timely discharge decision.
2. I have some flexibility to push my rounding 1 2 3 4 5 times to earlier in the day.
3. I would be willing to change my rounds in order to expedite 1 2 3 4 5 discharges when the hospital is on diversion.
4. Some specialists routinely write “pre-discharge orders,” 1 2 3 4 5 i.e. “If AM Hgb>10, please discharge Mr. Smith tomorrow” Would this be appropriate for your patients? 5. I utilize other physician extenders (RN, NP, PA) to help facilitate timely discharges �Yes �No �Sometimes 6. If I am unable, I generally have one of my partners discharge my patients �Yes � No
If no, please explain: NAH unsuccessfully trialed a discharge unit some years ago. A new concept is under discussion: a “Pre-Discharge Unit.” This would be a small unit with dedicated telemetry beds and nurses. Patients would transfer to this unit when:
• Discharge criteria met (VSS, labs within limits, etc)

30 Six Sigma Black Belt Project © David Bloomquist 2008
• Discharge education complete
• Seen by physician RN or mid level who support discharge This unit would provide basic care, meds and meals until the attending physician can round to formally discharge. The unit would be operational Monday through Friday 9AM to 5PM. 1. Do you see value in such a unit? �Yes � No Please explain: 2. Would you be willing/interested in utilizing such a unit to facilitate operations? �Yes �No Please explain: 3. What would help you discharge patients earlier?
Your input is appreciated. Please feel free to write further comments on the backYour input is appreciated. Please feel free to write further comments on the backYour input is appreciated. Please feel free to write further comments on the backYour input is appreciated. Please feel free to write further comments on the back....
31 Six Sigma Black Belt Project © David Bloomquist 2008
• Appendix C – Physician Survey Analysis
•
Specialty 6:00 8:00 10:00 12:00 14:00 16:00 18:00 20:00 22:00 Q1 Q2 Q3 Q4 Q5 Q6 QA1QA2
1 x x x 3 3 3 3 0 1 0
2 Cardi x x 1 4 5 3 1 1 1 1
3 Cardi x 2 5 3 2 0 0 1 1
4 Cardi x x 3 4 4 4 1 1 1 1
5 Cardi x x x 2 4 1 2 1 1 0 0
6 Cardi 2 2 5 4 1 1 1 1
7 Cardi x 3 3 3 2 1 1 1 1
8 Cardi x 1 1 1 4 1 1 0 0
9 Cardi x x 2 4 3 4 1 1 0 0
10 Cardi x x 2 4 3 4 1 1 0 0
11 GenSurg x x x 3 5 4 3 0 1 0 0
12 GenSurg x x 2 3 2 3 1 0 1 1
13 GenSurg x 2 4 4 5 0 0 1 1
14 ColoSurg x 2 5 5 3 1 1 1 1
15 InfectDis x x 2 3 4 4 0 0 0 0
16 IM x x x x 2 4 4 5 1 1 0 0
17 IM x 3 5 5 2 0 0 0 0
18 GI x x 3 2 1 2 0 0 0 0
19 GI x x 3 2 2 1 0 1 1 1
20 GI x x x 1 4 3 2 0 1 0 0
21 GI x 1 1 3 3 1 1 0 0
22 Pulm x 2 5 2 1 1 1 0 0
23 Pulm x x x 2 3 2 4 1 1 0 1
24 CT Surg x x 3 5 3 5 1 1 1 1
25 Cardi x x x 2 4 4 4 1 1 1 1
26 Cardi x 2 4 1 2 1 1 1 1
27 Cardi x x 2 5 5 5 1 1 0 1
28 Cardi x x 4 2 2 1 1 1 0
29 Cardi x 4 3 4 5 0 0 0 0
30 ColoSurg x 1 3 3 4 1 0 1 1
31 IM x x 1 4 2 5 0 1 0 0
32 IM x 3 4 3 2 0 1 1 1
33 ID 2 2 3 4 0 1 0
34 GI x x 3 4 2 4 1 0
35 Pulm x x x x x 2 2 1 1 1 1 0 1
36 GI x x x 2 5 3 3 0 1 0 1
37 GenSurg x 2 3 2 2 0 1 0 0
38 GenSurg x x 3 4 3 2 1 0 1 1
39 CRS x 1 5 5 2 0 1 0 0
40 GenSurg x x 1 4 3 2 0 0 1 1
41 GenSurg x x 1 3 2 4 1 0 1 1
42 ID x x x x x x 1 4 2 5 1 0 1 1
43 Endo x 2 5 5 2 1 0 1 1
44 Cardi x x 1 1 1 1 1 1 1 1
45 Cardi x x 2 5 5 4 1 1 1 0.5
5 26 12 8 7 14 12 2 1 2.1 3.6 3.0 3.1 0.6 0.7 0.5 0.6

32 Six Sigma Black Belt Project © David Bloomquist 2008
• Appendix D – ADT Report Analysis
o NAH Admissions by Day-of-the-Week
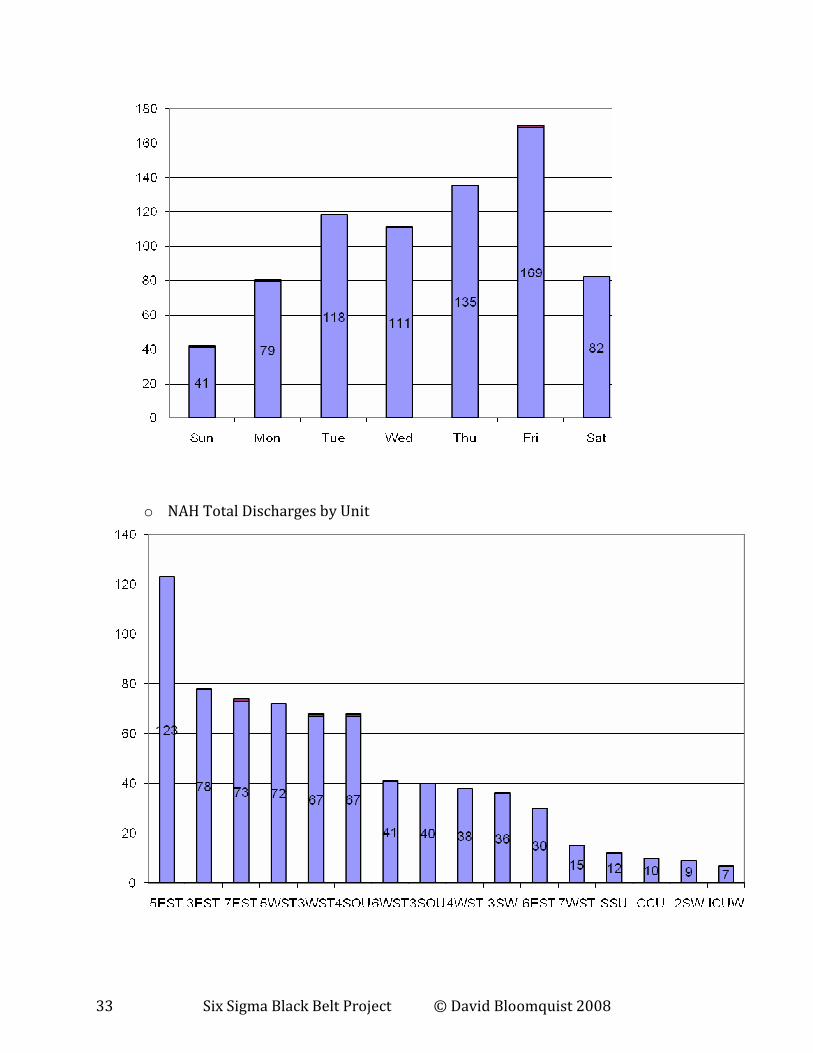
o NAH Discharges by Day-of-the-Week
33 Six Sigma Black Belt Project © David Bloomquist 2008
o NAH Total Discharges by Unit
34 Six Sigma Black Belt Project © David Bloomquist 2008
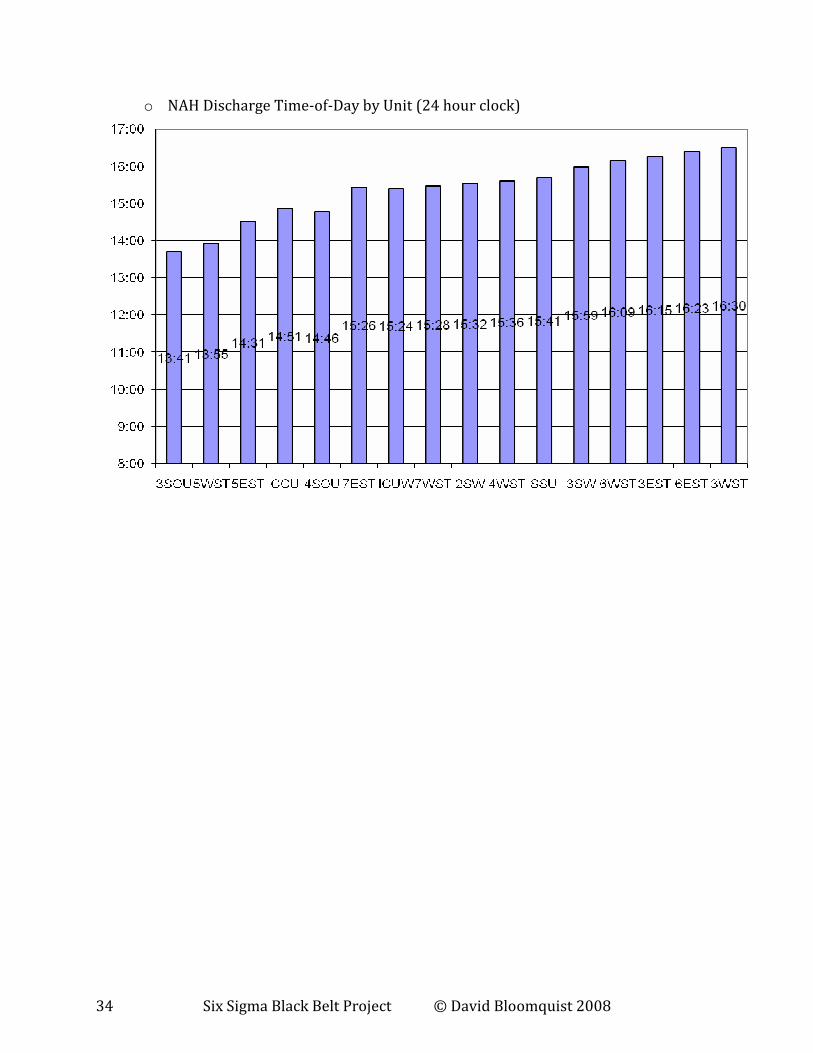
o NAH Discharge Time-of-Day by Unit (24 hour clock)