Bispectral Index and Other Processed Parameters of ... · BISPECTRAL INDEX AND OTHER PROCESSED...
7
Rev Bras Anestesiol REVIEW ARTICLE 2012; 62: 1: 105-117 Revista Brasileira de Anestesiologia 105 Vol. 62, N o 1, January-February, 2012 Received from Hospital São Carlos, Fortaleza, CE, Brazil. 1. PhD in Medicine; Graduated in Clinical Engineering; Vice-Coordinator of Ethics Commit- tee in Research of the Hospital São Carlos, Fortaleza, Ceará 2. Anesthesiology Professor of the College of Medicine, Universidade Federal de Juiz de Fora (UFJF-MG) 3. Undergraduate Medical Student 4. Electrical Engineer, UFC; Graduated in Clinical Engineering Submitted on August 16, 2010. Approved on May 19, 2011. Correspondence to: Dr. Rogean Rodrigues Nunes Avenida Comendador Francisco Ângelo, 1185 Dunas 60181500 – Fortaleza, CE, Brazil E-mail: [email protected] REVIEW ARTICLE Bispectral Index and Other Processed Parameters of Electroencephalogram: an Update Rogean Rodrigues Nunes 1 , Itagyba Martins Miranda Chaves 2 , Júlio César Garcia de Alencar 3 , Suyane Benevides Franco 3 , Yohana Gurgel Barbosa Reis de Oliveira 3 , David Guabiraba Abitbol de Menezes 4 Summary: Nunes RR, Chaves IMM, Alencar JCG, Franco SB, Oliveira YGBR, Menezes DGA – Bispectral Index and Other Processed Parame- ters of Electroencephalogram: an Update. Background and objectives: The processed analysis of electroencephalogram became extremely important to monitor nervous system, being used to obtain a better anesthetic adequacy. The objective was to conduct a review about each processed parameter, defining its real importan- ce. Content: A review was conducted showing mathematical, physical and clinical aspects as well as their correlations and updates, presenting new integrated parameters. Conclusions: An adequate analysis of processed parameters of electroencephalogram may provide more intraoperative safety as well as result in a better outcome for the patient. Keywords: Consciousness Monitors; Electroencephalography; Electromyography. ©2012 Elsevier Editora Ltda. All rights reserved. INTRODUCTION The Greek word for anesthesia (anaisthesia), originally cre- ated by Dioscorides in the 1st century of the Christian Era was used by Holmes for the new science emerging in the begin- ning of 19th century, meaning unconsciousness and sensitiv- ity loss. Anesthesia depth is an old concept 1,2 , based on the depressing effects on autonomic nervous system in answer to progressively higher concentrations of anesthetic ether. With incremental doses of inhalational anaesthetic there is a loss of consciousness followed by suppression of autonomic and motor responses to surgical stimuli (nociceptive). Electroencephalogram (EEG) has been suggested to study intensity of central depression of anesthetics, and its process- ing has been researched to facilitate its interpretation 3 . For this purpose extensive database of EEG readings, coming from patients undergoing different anesthetic regimens, was formed through years. Electroencephalographic measures of sedation intensity were developed based on observation that in general EEG of an anesthetized patient changes from high frequency low amplitude (HFLA) during consciousness to a low frequency high amplitude (LFHA) when deeply anesthetized. In the 90s, bispectral analysis, a type of mathematical processing commonly used in geophysics and oil prospec- tion, was used to process the EEG signal. Bispectral index technology (BIS) was developed from a closed algorithm and suggested to monitor brain activity in answer to different com- binations of anesthetics. HOW IS BIS OBTAINED? BIS (bispectral index) is an index empirically derived and de- pendent on “coherency” measurement among components of quantitative electroencephalogram (EEG) 3 . SIGNAL CAPTURE In process of BIS calculation, the first step is acquisition of EEG signal, which is made through application of four elec- trodes placed on the skin surface that enable an appropriate electrical conduction with low impedance. The assembly used is the unilateral referencial with ex- ploratory electrode in FT9 or FT10 position (frontal-temporal region) and reference electrode in the FPz position (front- polar) 4 (Figure 1). This determines that the obtained EEG lineation is monocanal (left or right, according to position of frontal-temporal electrode). Eletrode in the FT8 position is
Transcript of Bispectral Index and Other Processed Parameters of ... · BISPECTRAL INDEX AND OTHER PROCESSED...

Rev Bras Anestesiol REVIEW ARTICLE2012; 62: 1: 105-117
Revista Brasileira de Anestesiologia 105Vol. 62, No 1, January-February, 2012
Received from Hospital São Carlos, Fortaleza, CE, Brazil.
1. PhD in Medicine; Graduated in Clinical Engineering; Vice-Coordinator of Ethics Commit-tee in Research of the Hospital São Carlos, Fortaleza, Ceará2. Anesthesiology Professor of the College of Medicine, Universidade Federal de Juiz de Fora (UFJF-MG)3. Undergraduate Medical Student 4. Electrical Engineer, UFC; Graduated in Clinical Engineering
Submitted on August 16, 2010.Approved on May 19, 2011.
Correspondence to: Dr. Rogean Rodrigues Nunes Avenida Comendador Francisco Ângelo, 1185Dunas 60181500 – Fortaleza, CE, BrazilE-mail: [email protected]
REVIEW ARTICLE
Bispectral Index and Other Processed Parameters of Electroencephalogram: an Update
Rogean Rodrigues Nunes 1, Itagyba Martins Miranda Chaves 2, Júlio César Garcia de Alencar 3, Suyane Benevides Franco 3, Yohana Gurgel Barbosa Reis de Oliveira 3, David Guabiraba Abitbol de Menezes 4
Summary: Nunes RR, Chaves IMM, Alencar JCG, Franco SB, Oliveira YGBR, Menezes DGA – Bispectral Index and Other Processed Parame-ters of Electroencephalogram: an Update.
Background and objectives: The processed analysis of electroencephalogram became extremely important to monitor nervous system, being used to obtain a better anesthetic adequacy. The objective was to conduct a review about each processed parameter, defining its real importan-ce.
Content: A review was conducted showing mathematical, physical and clinical aspects as well as their correlations and updates, presenting new integrated parameters.
Conclusions: An adequate analysis of processed parameters of electroencephalogram may provide more intraoperative safety as well as result in a better outcome for the patient.
Keywords: Consciousness Monitors; Electroencephalography; Electromyography.
©2012 Elsevier Editora Ltda. All rights reserved.
INTRODUCTION
The Greek word for anesthesia (anaisthesia), originally cre-ated by Dioscorides in the 1st century of the Christian Era was used by Holmes for the new science emerging in the begin-ning of 19th century, meaning unconsciousness and sensitiv-ity loss. Anesthesia depth is an old concept 1,2, based on the depressing effects on autonomic nervous system in answer to progressively higher concentrations of anesthetic ether. With incremental doses of inhalational anaesthetic there is a loss of consciousness followed by suppression of autonomic and motor responses to surgical stimuli (nociceptive).
Electroencephalogram (EEG) has been suggested to study intensity of central depression of anesthetics, and its process-ing has been researched to facilitate its interpretation 3. For this purpose extensive database of EEG readings, coming from patients undergoing different anesthetic regimens, was formed through years.
Electroencephalographic measures of sedation intensity were developed based on observation that in general EEG of an anesthetized patient changes from high frequency low amplitude (HFLA) during consciousness to a low frequency high amplitude (LFHA) when deeply anesthetized.
In the 90s, bispectral analysis, a type of mathematical processing commonly used in geophysics and oil prospec-tion, was used to process the EEG signal. Bispectral index technology (BIS) was developed from a closed algorithm and suggested to monitor brain activity in answer to different com-binations of anesthetics.
HOW IS BIS OBTAINED?
BIS (bispectral index) is an index empirically derived and de-pendent on “coherency” measurement among components of quantitative electroencephalogram (EEG) 3.
SIGNAL CAPTURE
In process of BIS calculation, the first step is acquisition of EEG signal, which is made through application of four elec-trodes placed on the skin surface that enable an appropriate electrical conduction with low impedance.
The assembly used is the unilateral referencial with ex-ploratory electrode in FT9 or FT10 position (frontal-temporal region) and reference electrode in the FPz position (front-polar) 4 (Figure 1). This determines that the obtained EEG lineation is monocanal (left or right, according to position of frontal-temporal electrode). Eletrode in the FT8 position is
RBA - 62-01 - 13 - 663.indd 105RBA - 62-01 - 13 - 663.indd 105 1/9/2012 10:56:09 AM1/9/2012 10:56:09 AM

NUNES, CHAVES, ALENCAR ET AL.
106 Revista Brasileira de Anestesiologia Vol. 62, No 1, January-February, 2012
used in BIS algorithm to increase its calculation in the pres-ence of electromyographic activity, and the FP2 electrode (virtual ground) has the purpose of increasing the rejection of common mode.
DIGITALIZATION
Digitalization is performed after acquisition and amplification of signal. The captured analog signal is presented in regular intervals (frequency expressed in Hz) so that deflections of each wave are defined by a series of positive or negative con-crete values dependent of the moment of data collection.
The frequency of collected data is essential for obtaining a safe digitalized signal as, according to Shannon’s theorem 3,5, it must be superior to double of maximum frequency of the analyzed signal. Maximum frequencies of EEG signal have been considered for a long time, from 30 to 40 Hz, therefore, 70 Hz of frequency would be more real.
If the frequency of samples is small, there is a risk of erro-neously converting, a fast analog wave into a slow digitalized wave (aliasing effect) 3.
RECOGNITION AND FILTRATION OF ARTIFACTS
After digitalization, the signal undergoes a process of artifacts recognition 6. The artifacts produced by signals that exceeded dynamic limit of amplifier, like using of electric scalpel, may be identified in epoch (temporal finite divisions of registration, in which analysis is made: two seconds of duration in BIS case) and then are rejected, since original data can not be recon-stituted.
Other artifacts can be eliminated from contaminated signal and resulting filtered signal may be used for further analysis. Those types of artifacts include the ones that have frequen-cies superior to EEG (for instance, alternating electrical cur-rent). Other artifacts with frequency within limit of EEG waves, like ECG and the ones produced by rotating pumps (CEC) are eliminated as they present regularity. Other detectable contaminants are interferences produced by stimulators of peripheral nerves as well as the ones emitted by stimulators of evocated potentials. In awake patients or with superficial sedation ocular movements creat a slow recognizable undu-latory activity 6.
In BIS specific case, digitalized EEG is filtered to exclude artifacts of high and low frequencies and divided in epochs of two seconds. Each epoch is correlated with an electrocardio-gram (ECG) model and in case pacemaker spicules or ECG signals are shown, the same will be eliminated and lost data will be estimated by interpolation. Eyeball movements are de-tected and epochs contaminated with this artifact, discarded.
Subsequently, the baseline is analyzed and contaminating voltages are eliminated due to low frequencies (for instance, low-frequency noise of electrodes).
TEMPORAL ANALYSIS AND DERIVATIVE PARAMETERS: BURST SUPPRESSION RATIO AND QUAZI SUPPRESSION INDEX
EEG signal after digitalization and filtration of artifacts can be mathematically treated. However, at this moment alterations in voltage can only be evaluated in time domain. From these parameters (voltage and time), many statistical analysis can be carried out resulting in important variables such as: 50% spectral edge frequency (SEF), 95% SEF and much more
Figure 1 – Referential Assembly of Right Side.
RBA - 62-01 - 13 - 663.indd 106RBA - 62-01 - 13 - 663.indd 106 1/9/2012 10:56:09 AM1/9/2012 10:56:09 AM

BISPECTRAL INDEX AND OTHER PROCESSED PARAMETERS OF ELECTROENCEPHALOGRAM: AN UPDATE
Revista Brasileira de Anestesiologia 107Vol. 62, No 1, January-February, 2012
(strict statistic calculation). For statistical analysis of these data in time domain it is necessary to know that EEG is a non deterministic signal, in other words, it is not possible to ex-actly predict its future values. Therefore, EEG is a stochastic signal and some statistical points are not predictable 7 (future values can only be previously predicted due to a probability of distribution of amplitudes observed in the signal). Differ-ent parameters derived from descriptive temporal statistical analysis have been used, such as EEG electrical power 8, to-tal power 9, analysis described by Hjorth 10 involving activity, mobility and complexity, frequency of crossing (of isoelectric line of zero voltage) and Demetrescu’s aperiodic analysis 11
derived from previous parameter. In BIS calculation it is not used any parameter derived from
strict temporal statistical analysis, therefore, its generation is also based in two ad hoc measurements of EEG waves: burst suppression ratio and QUAZI suppression index.
BURST SUPPRESSION RATIO
Suppresion rate is defined as intervals over 0.5 seconds in which EEG voltage is below ± 0.5 µV (Figure 2). Suppression rate 12,13 is the epoch fraction (time period of the analysis of two seconds) in which EEG is isoelectric (does not exceed ± 0.5 µV). Due to the especially variable nature (not station-ary) of suppression rate, it must be calculated on average dur-ing an interval of at least 30 epochs (60 seconds). Regular suppression ratio is zero.
QUAZI SUPPRESSION RATE
QUAZI suppression rate was projected to discover the pres-ence of suppression rates in the presence of erratic voltage of baseline. QUAZI incorporates information of slow waves (< 1.0 Hz), derived from frequency domain to detect the activ-ity of superimposed rates over these slow waves that would somehow contaminate original algorithm of burst suppression ratio (BSR), exceeding voltage criteria established to define electrical silence. With this index, we can detect certain sup-pression periods that could not be discovered with strict crite-
ria of electrical silence (± 5 µV) imposed by definition of burst suppression rate.
WINDOW, FREQUENCY ANALYSIS AND DERIVED PARAMETERS: RELATIVE POWER Β
Before carrying out frequency analysis and to avoid errors in subsequent interpretation of waves, due to artificial disrup-tures in continuous lineation in epochs, each epoch is ana-lyzed according to Blackman window, which reduces distor-tions related to contamination by frequency artifacts created by abrupt transitions in extremes of each epoch.
After signal digitalization and application of the window function of Blackman 14, the same can be mathematically treated through Fourier analysis. This analysis generates a spectrum of frequencies that corresponds to a simple histo-gram of amplitudes in the frequency domain.
The best analogy to understand Fourier analysis is to com-pare EEG with a white light that crosses a crystal prism, creat-ing a rainbow (the spectrum). Each color of light represents a frequency and the luminosity of colors represents the ampli-tude in each frequency.
In clinical monitors, EEG is decomposed into its frequency spectrum by Fast Fourier Transform (FFT) by Cooley and Tukey 15. This algorithm enables an efficient calculation of digitalized data and is presented graphically as a histogram of power in frequency domain, being discarded the phase spectrum. Quantitative analysis of signal obtained through the FFT enables the identification of some general patterns, called bands, where each is defined by a range of frequen-cies: δ = 0.5-3.5 Hz, θ = 3.5-7.0 Hz, α = 7.0-13.0 Hz, β = 13.0-30.0 Hz and β2 = 30.0-50.0 Hz.
Different parameters can be derived from the power spec-trum: total amplitude or power, relative amplitude or power of bands, frequency of peak power, 50% SEF, 95% SEF and extended delta quotient. There are other parameters that combine temporal with frequency analysis, such as limit spectral frequency compensated with burst suppression [Bc-SEF = (1-BSR/100)] 3.
FP2-F8
F8-T8
T8-P8
P8-O2
Burst Supression
Figure 2 – Presence of Burst-Suppression.
RBA - 62-01 - 13 - 663.indd 107RBA - 62-01 - 13 - 663.indd 107 1/9/2012 10:56:09 AM1/9/2012 10:56:09 AM

NUNES, CHAVES, ALENCAR ET AL.
108 Revista Brasileira de Anestesiologia Vol. 62, No 1, January-February, 2012
RELATIVE β POWER
The frequency analysis parameter that uses BIS is the β rela-tive rate, which is defined as log (P30-47 Hz/P11-20 Hz). In other words, it is the logarithm of the quotient between sums of spectral energies (wave amplitude expressed as square volt-age) of frequencies bands. Thus, we have a low-frequency band (11-20 Hz), which is included within two classic spectra: α and β and another one of high frequency, included within β2 spectrum.
BISPECTRAL ANALYSIS AND DERIVED PARAMETERS: SYNCHFASTSLOW
Bispectral analysis incorporates information about the phase related to beginning of considered epoch, from different fre-quencies obtained (Figure 3). Bispectrum measures phase correlation of waves obtained by Fourier analysis among dif-ferent frequencies. In a simplistic model, the higher the de-gree of phase coupling, the smaller the number of “bypass” neurons will be. Bispectral analysis enables to suppress noise Gaussian sources, increasing relationship signal/noise, being able to identify non linear situations important in pro-cess of signal generation. Bispectrum is calculated multiply-ing three complex spectral values (each complex spectral value includes frequency, amplitude and phase information), the spectral value of f1 and f2 primary frequencies by spectral value of modulation frequency (f1+f2). This product is the most important point of bispectral analysis: if in each frequency of tripod (f1, f2 and f1+f2) spectral amplitude is big (there is some sine waive for this frequency) and if phase angles for each of three considered frequencies are aligned, the final product will be big (Figure 4 A). On the contrary, if one of sine components is small or absent, or if phase angles are not aligned, the prod-uct will be small (Figure 4 B) 16.
The only group of frequency combinations to calculate bispectrum is a space in wedge (shaded triangle on Figure 4) of frequency facing frequency. The possible combinations out of this triangular wedge are not necessary to the calculation due to symmetry [B(f1,f2) = B(f2,f1)]. In addition to that, a range of possible modulation frequencies (f1+f2) is limited to frequen-cies ≤ half of sampling frequency.
Bispectrum is expressed in microvolts raised to the third power (µV3) as it is product of three sine waives, each one with an amplitude in microvolts. A value derived from bispec-trum is bicoherence, which numerically varies from 0 to 1 pro-portionally to degree of phase coupling in frequency of con-sidered tripod.
SYNCHFASTSLOW
BIS uses as parameter derived from bispectral analysis fast/slow synchronization, which is logarithm of quotient between sum of all bispectrum peaks in band from 0.5 to 47 Hz and sum of bispetrum in band from 40 to 47 Hz.
WEIGHTED ANALYSIS OF SUBPARAMETERS
BIS number is obtained from weighted analysis of four sub-parameters: burst suppression ratio, QUAZI suppression, beta relative power and fast/slow synchronization, where it is applied a statistical multivariate model using a non linear function 17,18.
Figure 3 – Changes in Phase Angle.
InitialPhaseAngle
InitialVectorPosition
ResultingSignWave
rotation
60º
0º
90º
Figure 4 – Final Product of Phase Angles.
3Hz
10Hz
3Hz
10Hz
13Hz
24
6f2
f12 4 6 8 10 12141618 20
f2f1‘B( )
24
6f2
f12 4 6 8 10 12141618 20
f2f1‘B( )
A
B
RBA - 62-01 - 13 - 663.indd 108RBA - 62-01 - 13 - 663.indd 108 1/9/2012 10:56:09 AM1/9/2012 10:56:09 AM
BISPECTRAL INDEX AND OTHER PROCESSED PARAMETERS OF ELECTROENCEPHALOGRAM: AN UPDATE
Revista Brasileira de Anestesiologia 109Vol. 62, No 1, January-February, 2012
The particular utilization of many subparameters in BIS generation was empirically derived from a database, prospec-tivelly accumulated, of EEG and sedation scales in which it was used a great variety of anesthetic protocols.
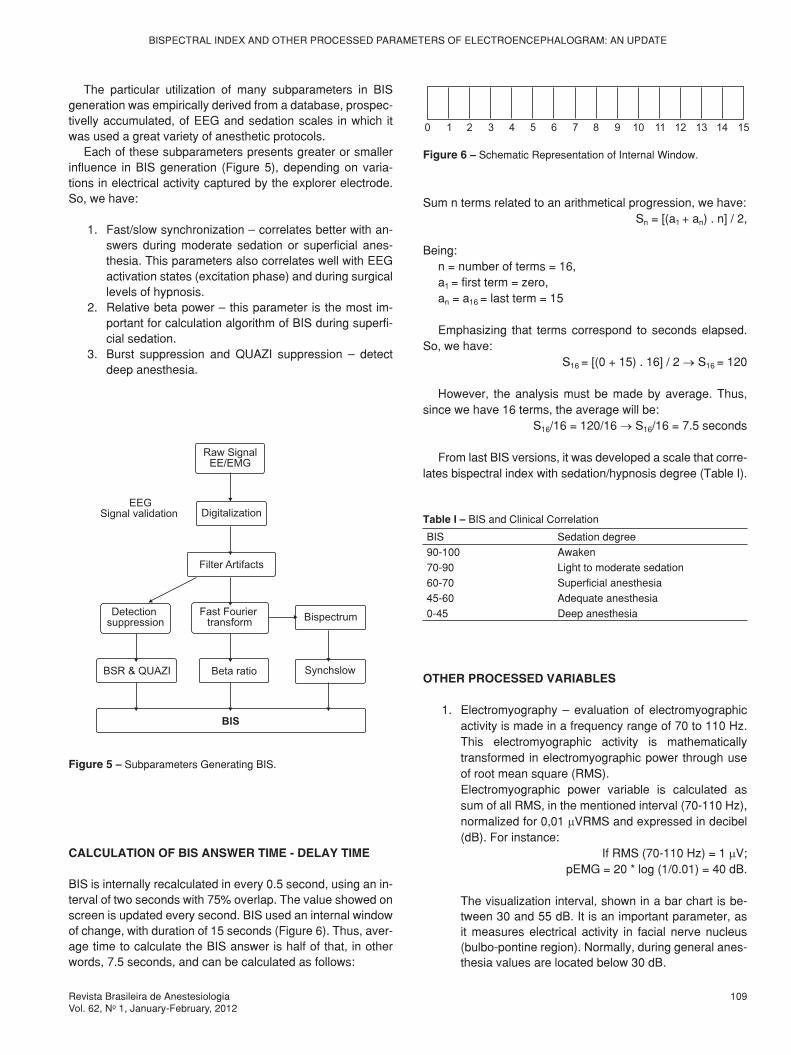
Each of these subparameters presents greater or smaller influence in BIS generation (Figure 5), depending on varia-tions in electrical activity captured by the explorer electrode. So, we have:
1. Fast/slow synchronization – correlates better with an-swers during moderate sedation or superficial anes-thesia. This parameters also correlates well with EEG activation states (excitation phase) and during surgical levels of hypnosis.
2. Relative beta power – this parameter is the most im-portant for calculation algorithm of BIS during superfi-cial sedation.
3. Burst suppression and QUAZI suppression – detect deep anesthesia.
Sum n terms related to an arithmetical progression, we have: Sn = [(a1 + an) . n] / 2,
Being: n = number of terms = 16,a1 = first term = zero,an = a16 = last term = 15
Emphasizing that terms correspond to seconds elapsed. So, we have:
S16 = [(0 + 15) . 16] / 2 → S16 = 120
However, the analysis must be made by average. Thus, since we have 16 terms, the average will be:
S16/16 = 120/16 → S16/16 = 7.5 seconds
From last BIS versions, it was developed a scale that corre-lates bispectral index with sedation/hypnosis degree (Table I).
Table I – BIS and Clinical Correlation
BIS Sedation degree90-100 Awaken70-90 Light to moderate sedation60-70 Superficial anesthesia45-60 Adequate anesthesia0-45 Deep anesthesia
OTHER PROCESSED VARIABLES
1. Electromyography – evaluation of electromyographic activity is made in a frequency range of 70 to 110 Hz. This electromyographic activity is mathematically transformed in electromyographic power through use of root mean square (RMS).
Electromyographic power variable is calculated as sum of all RMS, in the mentioned interval (70-110 Hz), normalized for 0,01 µVRMS and expressed in decibel (dB). For instance:
If RMS (70-110 Hz) = 1 µV; pEMG = 20 * log (1/0.01) = 40 dB.
The visualization interval, shown in a bar chart is be-tween 30 and 55 dB. It is an important parameter, as it measures electrical activity in facial nerve nucleus (bulbo-pontine region). Normally, during general anes-thesia values are located below 30 dB.
Raw SignalEE/EMG
Digitalization
Filter Artifacts
EEGSignal validation
Detection suppression
Fast Fourier transform Bispectrum
Beta ratio SynchslowBSR & QUAZI
BIS
Figure 5 – Subparameters Generating BIS.
0 1 2 3 4 5 6 7 8 9 10 11 12 13 14 15
CALCULATION OF BIS ANSWER TIME - DELAY TIME
BIS is internally recalculated in every 0.5 second, using an in-terval of two seconds with 75% overlap. The value showed on screen is updated every second. BIS used an internal window of change, with duration of 15 seconds (Figure 6). Thus, aver-age time to calculate the BIS answer is half of that, in other words, 7.5 seconds, and can be calculated as follows:
Figure 6 – Schematic Representation of Internal Window.
RBA - 62-01 - 13 - 663.indd 109RBA - 62-01 - 13 - 663.indd 109 1/9/2012 10:56:09 AM1/9/2012 10:56:09 AM

NUNES, CHAVES, ALENCAR ET AL.
110 Revista Brasileira de Anestesiologia Vol. 62, No 1, January-February, 2012
2. Spectral analysis of density (DAS) – corresponds to power density in frequency domain varying from 0 to 30 Hz. The number that represented the limit of spec-tral edge presents frequency below the point in which 95% of EEG total power is (Figure 7). The analysis of chances in spectral densities shows variations in anes-thetic adequacy even if BIS does not vary. Raised per-centages of spectral density near the edge (95% SEF) indicate imminent changes in anesthetic adequacy.
3. Mitigation of BIS tendencies – Current versions have three possibilities of mitigation of tendencies, which are obtained through simple mobile averages 19. This technique consists of calculating arithmetic average of more recent r observations (Mt).
Thus, Mt is an estimate that does not take into account older observations, which is reasonable due to the fact that parameter slightly varies with time. Mobile average name is used because, in each period, the observation is replaced by the most recent one, calculating a new average.
MITIGATION POSSIBILITIES
1. 10 seconds – provides an increased answer to state alterations, such as induction and arousal.
2. 15 seconds – intermediate. 3. 30 seconds – provides a softer tendency, with smaller
variability and sensibility to artifacts.
Global view of EEG derivate parameters (Figure 8).
BILATERAL BIS
Bilateral BIS shows an important innovation with regard to spectral analysis, since it quantifies automatically another pa-rameter: asymmetry. This one is significative when has relative values over 50% in amplitudes, frequencies or both and has been correlated with neuropathological situations (Figure 9).
CONCLUSION
The correct interpretation of EEG parameters provides more security when making decisions not only related to arousal, whose consequences may result in posttraumatic stress dis-order, but also due to the fact that anesthesias with very low BIS values result in negative outcomes 20.
Figure 7 – 95% SEF and Spectral Density.
Figure 8 – Global View of Electroencephalographic Parameters: BIS, 95% SEF, Suppression Rate (SR) and EMG.
Figure 9 – Bilateral BIS and Presence of Left Asymmetry.
RBA - 62-01 - 13 - 663.indd 110RBA - 62-01 - 13 - 663.indd 110 1/9/2012 10:56:10 AM1/9/2012 10:56:10 AM

Revista Brasileira de Anestesiologia 117Vol. 62, No 1, Janeiro-Fevereiro, 2012
ÍNdice BispectRAl e OutROs pARâmetROs pROcessAdOs dO eletROeNceFAlOgRAmA: umA AtuAlizAçãO
REFERÊNCIAS / REFERENCES
1. guedel Ae – inalation Anaesthesia: A fundamental guide, 1st edition, New York, the macmillian company, 1937;1-12.
2. Rees gJ, gray tc – methyl-N-propil ether. Br J Anaesth, 1950;22:83-91.3. Rampill iJ – A primer for eeg signal processing in anesthesia. Anesthesiol-
ogy, 1998;89:980-1002.4. Johansen JW – update on bispectral index monitoring. Best pract Res clin
Anaesthesiol, 2006;20:81-99.5. shannon ce, Weaver W – the mathematical theory of communication.
urbana, university of illinois press, 1962.6. silva Fl, Niedermeyer e – electroencephalography, 4th edition, philadel-
phia, lippincott Williams & Wilkins,1999;781-796.7. mcewen J, Anderson gB – modelling the stationarity and gaussianity of
spontaneous electroencephalographic activity. ieee trans Biomed eng, 1975;22:361-369.
8. Bickford Rg – Automatic electroencephalographic control of general anes-thesia. electroencephalogr clin Neurophysiol, 1950;2:93-96.
9. Arom KV, cohen de, strobl Ft – effect of intraoperative intervention on neurologic outcome based on electroencephalographic monitoring during cardiopulmonary bypass. Ann thorac surg, 1989;48:476-483.
10. Hjorth B – eeg analysis based on time domain properties. electroencepha-logr clin Neurophysiol, 1970;29:306-310.
11. gregory tK, pettus dc – An electroencephalographic processing algorithm specifically intended for analysis of cerebral electrical activity. J clin monit, 1986;2:190-197.
12. Rampil iJ, laster mJ – No correlation between quantitative electroencepha-lographic measurements and movement response to noxious stimuli during isoflurane anesthesia in rats. Anesthesiology, 1992;77:920-925.
13. Rampil iJ, Weiskopf RB, Brown Jg et al. – i653 and isoflurane produce similar dose-related changes in the electroencephalogram of pigs. Anesthe-Anesthe-siology, 1986;69:298-302.
14. diniz psR, da silva eAB, Netto sl – processamento digital de sinais,1ª edição, são paulo, Bookman, 2002;196-255.
15. cooley JW, tukey JW – An algorithm for machine calculation of complex Fourier series. math computation, 1965;19:297-301.
16. proakis Jg, Rader cm, ling F, Nikias cl – signal analysis with higher order spectra, Advanced digital signal processing, 1ª edition, New York, macmil-lan, 1992,550-89.
17. Rosow c, manberg pJ – Bispectral index monitoring. Anesth clin North Am, 1998;2:89-107.
18. sigl Jc, chamoun Ng – An introduction to bispectral analysis for the elec-troencephalogram. J clin monit, 1994;10:392-404.
19. morettin pA, toloi cmc – Análise de séries temporais,1ª edição,são pau-lo, edgard Blücher ltdA, 2004;87-108.
20. monk tg, Weldon Bc – Anesthetic depth is a predictor of mortality. Anes-Anes-thesiology, 2010;112:1070-1072.