
BIS Working Papers · PDF fileBIS Working Papers are written by members of the ... banking,...
25
BIS Working Papers No 115 China’s asset management corporations by Guonan Ma and Ben S C Fung Monetary and Economic Department August 2002
Transcript of BIS Working Papers · PDF fileBIS Working Papers are written by members of the ... banking,...

BIS Working Papers No 115
China’s asset management corporations by Guonan Ma and Ben S C Fung Monetary and Economic Department
August 2002

BIS Working Papers are written by members of the Monetary and Economic Department of the Bank for International Settlements, and from time to time by other economists, and are published by the Bank. The papers are on subjects of topical interest and are technical in character. The views expressed in them are those of their authors and not necessarily the views of the BIS.
Copies of publications are available from:
Bank for International Settlements Press & Communications CH-4002 Basel, Switzerland E-mail: [email protected]
Fax: +41 61 280 9100 and +41 61 280 8100
This publication is available on the BIS website (www.bis.org).
© Bank for International Settlements 2002. All rights reserved. Brief excerpts may be reproduced or translated provided the source is cited.
ISSN 1020-0959

Abstract
To address the banking system’s non-performing loan (NPL) problem, the Chinese government set up four asset management corporations (AMCs). They were to buy up bad debts of the big four state-owned commercial banks and dispose of them over 10 years, taking a large step towards NPL resolution. But in their first two years, these AMCs have made only a limited contribution to resolution of the NPL problem. They have taken over less than half of the NPLs at the big four banks. In addition, while AMC financing have been less than transparent, it appears to have burdened The People’s Bank of China (PBoC) with greater risks to date than the Ministry of Finance (MoF), although there have not been to date any evident monetary consequences. Under plausible recovery scenarios, the AMC losses would surpass the current financial contributions to the AMCs from both the MoF and the PBoC. Since their cash recoveries have lagged their interest obligations, the AMCs face rising cash flow pressure. In response, the government is pushing for speedier asset recovery, as evident in the milestone of the first international NPL auction.
JEL Classification Numbers: G21; O53 Keywords: banking, non-performing loans, asset management companies, China

Table of Contents
1. Introduction .............................................................................................................................. 1 2. The scope of NPL transfers from banks to AMCs ................................................................... 2 3. AMC financing of the NPL purchase ....................................................................................... 4 4. Monetary implications of PBoC financing ................................................................................ 7 5. AMC loss-sharing: the MoF vs the PBoC ................................................................................ 8 6. Cash flow dynamics and asset disposition .............................................................................. 11 7. Debt-for-equity swaps and AMC governance ......................................................................... 13
7.1 Debt-for-equity swaps ................................................................................................... 13 7.2 AMC governance and supervisory environment ........................................................... 14
8. Conclusions ............................................................................................................................. 15 Appendix ............................................................................................................................................ 17 References ......................................................................................................................................... 19

1
1. Introduction1
The scale of the non-performing loan (NPL) problem in China’s banking system is daunting. some estimates put the NPL level within the Chinese system, both carved out and remaining, at around 40% of the total loans outstanding (Lardy (1998), S&P (2001a), Dai (2001), BBC (2002)). The principal factors shaping China’s NPL levels include extensive policy lending during the 40 years of the command economy regime, weak financial performance of the state-owned enterprises (SOEs) and lax internal credit risk controls of the state-owned banks.
A competitive banking system requires effective resolution of China’s NPL problem. To begin to address this “stock” problem and to restore bank balance sheets, the Chinese government set up four state-owned asset management corporations (AMCs) in 1999. Their purpose was to buy bad debts of the four major state-owned commercial banks (the big four banks) and to dispose of them over 10 years. This was a major step forward, underscoring the Chinese government’s determination to restructure the banks. Since the big four banks hold 65% of the Chinese banking sector’s loan portfolio, they are naturally the prime focus of the government’s bank restructuring efforts so far.
The Chinese approach broadly resembles the Swedish model of separate and decentralised NPL management. Each of the four AMCs pairs up with one of these big four banks in China (Table 1). The Ministry of Finance (MoF) provides each AMC with an initial equity capital injection of RMB 10 billion (USD 1.2 billion). In theory, the MoF is the sole owner of the four AMCs; the big four banks do not formally have any direct equity stakes in the AMCs. These big four banks have transferred their NPLs to their respective linked but independent AMC. The four Chinese AMCs have the overriding mandate to maximise asset recovery over 10 years. Their primary roles include acquiring, managing and disposing of NPLs.
More generally, many Asian economies have set up resolution agencies as a preferred tool to handle distressed debts in their financial systems, especially after the recent Asian financial crisis. China appears to have taken a similar broad strategy in dealing with the NPLs in its system. While there has been a large body of literature on emerging Asia’s experiences of using asset management companies to resolve bad debts (Lindgren et al (1999), Claessens et al (2001)), as far as we can tell there has not yet been an in-depth study on the Chinese AMCs. Our paper attempts to fill this gap.
Table 1 China’s AMCs: policy-based NPL transfers during 1999-2000
Asset management corp Matched bank Assets transferred (RMB billions)
Share of bank loans outstanding (% at end-1998)
Orient Asset Management BoC 267.4 20.4%
Great Wall Asset Management ABC 345.8 24.6%
Cinda Asset Management CCB 373.0 21.7%
Huarong Asset Management ICBC 407.7 17.9%
Total 1,393.9 20.7%
Note: BoC = Bank of China, ABC = Agriculture Bank of China, CCB = China Construction Bank and ICBC = Industrial and Commercial Bank of China. In calculating the CCB loan shares, the table takes into account that RMB 100 billion of the assets transferred to Cinda are from China Development Bank and not from any of the big four banks.
Source: Zhu et al (2001a).
1 The authors wish to thank Jason George, Nicholas Lardy, Robert McCauley, Thomas Rawski and participants at the
seminars held at the Bank for International Settlements in Basel and the Hong Kong Institute for Monetary Research in Hong Kong in 2001. The views expressed are those of the authors and do not necessarily reflect those of the Bank for International Settlements.
2
The paper is organised as follows. First, we discuss the uncertainties regarding the scope of the NPL transfers during the period 1999-2000. We try to understand the distinction between the so-called “policy-based” and “non-policy” transfers of NPLs. Second, we attempt to shed light on the less than transparent AMC financing structure in China, with the focus on the role of possible financing provided by The People’s Bank of China (PBoC). Third, we explore the potential monetary implications of the central bank’s financing of the AMCs, commenting on several variants of PBoC financing and sterilisation. Fourth, we examine the relationship between the MoF and the PBoC in sharing the expected AMC loss, arguing that the PBoC to date has taken on greater risk than the MoF. Fifth, we consider the cash flows of the Chinese AMCs and the latest trends in asset disposition. We make the case that cash flow pressures on the AMCs are rising, which may have spurred faster NPL resolution. Sixth, we look into the other AMC-related issues such as debt-for-equity swaps and AMC governance. The final part of the paper briefly summarises our main findings and conclusions.
2. The scope of NPL transfers from banks to AMCs
Setting up the AMCs to take over and dispose of NPLs from the big four banks was one of a series of ambitious banking reforms in China. The Chinese government set up three principal policy banks during 1994-95, with the stated intention to take over most of the policy lending responsibility from the big four banks. The People’s Congress, China’s legislature, passed the Commercial Banking Law in May 1995, for the first time providing the legal basis for commercial banking. Moreover, during 1997-98, the government undertook bank reforms to abolish bank credit quotas and to encourage banks to make their lending decisions on a commercial basis (Lardy (1998), Mo (1999)). In 1998, the Chinese government injected equity to partially recapitalise the big four banks (Mo (1999)). Following that, the establishment of the four AMCs in 1999 and their subsequent carving out of NPLs at the big four banks took large steps towards resolving China’s NPL problem.
The actual transfers of the bad loans from the big four banks to the four AMCs took place over the course of 1999 and 2000. Assets transferred amounted to RMB 1.4 trillion (USD 169 billion), more than 20% of the big four banks’ combined loan books and equivalent to 18% of China’s GDP in 1998 (Table 1). However, there has been confusion regarding the actual scope of the NPL transfer, which complicates our efforts to understand the task facing the AMCs. In this section, we try to clarify, where possible, the scope and the nature of the NPL carve-out.
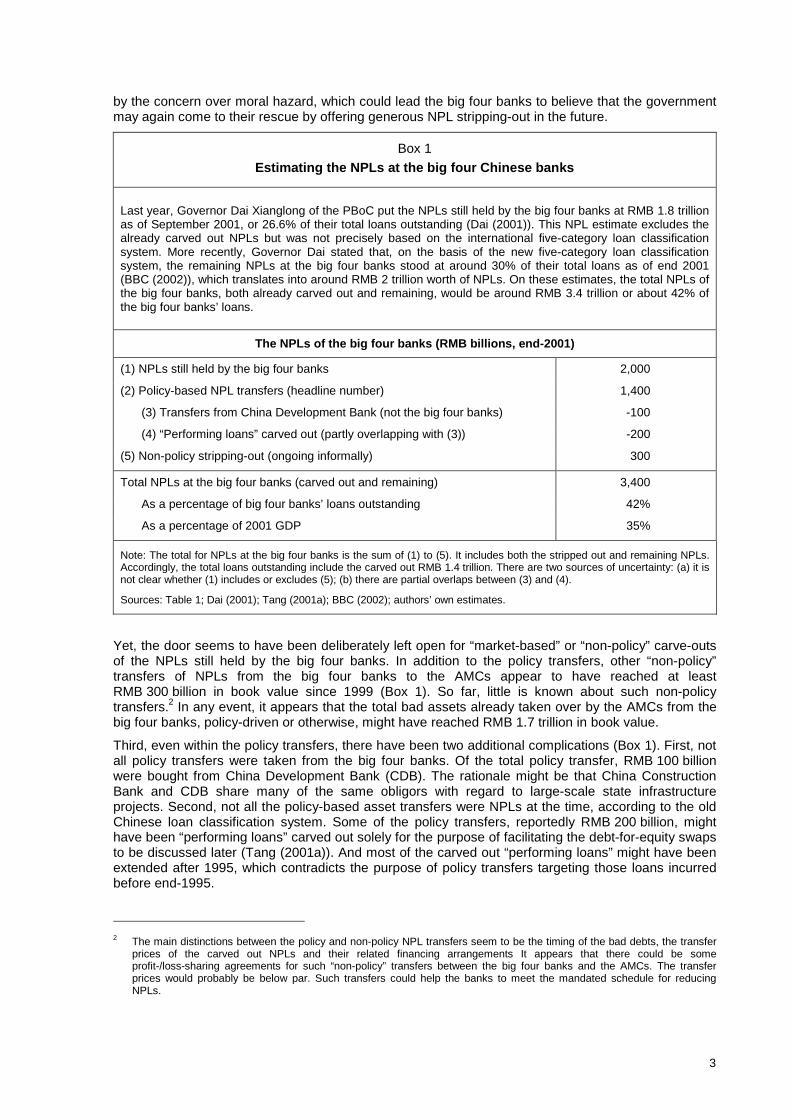
First, it is now clear that far from all NPLs at the big four banks were transferred to the AMCs during 1999-2000. In Box 1, we estimate that the total NPLs of the big four banks, including those already transferred, disposed of or remaining, could have amounted to RMB 3.4 trillion (USD 410 billion) or around 42% of the big four banks’ loans outstanding at the end of 2001. This is compared to the recent peak levels of 40% to 60% for Korea and Indonesia (Claessens et al (2001)). The new official NPL estimate has considerably narrowed the gap between the Chinese government and various market estimates (S&P (2001a)). The new estimate itself takes a step forward, since a realistic diagnosis of the potential magnitude of the NPL problem is often difficult politically (Crockett (1998)). Moreover, there has been improving transparency in Chinese banking statistics, as three out of the big four banks have published their NPL estimates on the basis of the new five-category loan classification system, which resembles international norms. In any event, the NPLs transferred to the Chinese AMCs represent less than half of the total estimated NPLs at the big four banks.
Second, the asset transfers during 1999-2000 are often regarded as “policy-based” for four reasons. First, the AMC purchase of the NPLs was executed uniformly at book value. Second, the government explicitly authorised the related AMC financing that covers such transfers. Third, these NPL transfers were mostly restricted to those loans incurred before the end of 1995 and identified as “substandard” or “doubtful” loans before end-1998 under the old Chinese loan classification system. Fourth, some of the bank assets transferred were selected to serve certain specific government goals such as debt-for-equity swaps (Tang (2001a, 2001b)).
The impression generally conveyed by the indicated scope of the policy transfer is that the government is taking responsibility for potential bank losses from policy lending that took place before 1996, but not for loans made after 1996. This cutoff probably reflects a partial lending regime shift at that time, when banking reforms started to curb government-directed policy loans. Moreover, Governor Dai (2001) has reiterated a recent State Council decision that, in the future, there will be no more policy-driven NPL transfers from the big four banks to the AMCs. This decision is obviously motivated
3
by the concern over moral hazard, which could lead the big four banks to believe that the government may again come to their rescue by offering generous NPL stripping-out in the future.
Box 1 Estimating the NPLs at the big four Chinese banks
Last year, Governor Dai Xianglong of the PBoC put the NPLs still held by the big four banks at RMB 1.8 trillion as of September 2001, or 26.6% of their total loans outstanding (Dai (2001)). This NPL estimate excludes the already carved out NPLs but was not precisely based on the international five-category loan classification system. More recently, Governor Dai stated that, on the basis of the new five-category loan classification system, the remaining NPLs at the big four banks stood at around 30% of their total loans as of end 2001 (BBC (2002)), which translates into around RMB 2 trillion worth of NPLs. On these estimates, the total NPLs of the big four banks, both already carved out and remaining, would be around RMB 3.4 trillion or about 42% of the big four banks’ loans.
The NPLs of the big four banks (RMB billions, end-2001)
(1) NPLs still held by the big four banks 2,000
(2) Policy-based NPL transfers (headline number) 1,400
(3) Transfers from China Development Bank (not the big four banks) -100
(4) “Performing loans” carved out (partly overlapping with (3)) -200
(5) Non-policy stripping-out (ongoing informally) 300
Total NPLs at the big four banks (carved out and remaining) 3,400
As a percentage of big four banks’ loans outstanding 42%
As a percentage of 2001 GDP 35%
Note: The total for NPLs at the big four banks is the sum of (1) to (5). It includes both the stripped out and remaining NPLs. Accordingly, the total loans outstanding include the carved out RMB 1.4 trillion. There are two sources of uncertainty: (a) it is not clear whether (1) includes or excludes (5); (b) there are partial overlaps between (3) and (4).
Sources: Table 1; Dai (2001); Tang (2001a); BBC (2002); authors’ own estimates.
Yet, the door seems to have been deliberately left open for “market-based” or “non-policy” carve-outs of the NPLs still held by the big four banks. In addition to the policy transfers, other “non-policy” transfers of NPLs from the big four banks to the AMCs appear to have reached at least RMB 300 billion in book value since 1999 (Box 1). So far, little is known about such non-policy transfers.2 In any event, it appears that the total bad assets already taken over by the AMCs from the big four banks, policy-driven or otherwise, might have reached RMB 1.7 trillion in book value.
Third, even within the policy transfers, there have been two additional complications (Box 1). First, not all policy transfers were taken from the big four banks. Of the total policy transfer, RMB 100 billion were bought from China Development Bank (CDB). The rationale might be that China Construction Bank and CDB share many of the same obligors with regard to large-scale state infrastructure projects. Second, not all the policy-based asset transfers were NPLs at the time, according to the old Chinese loan classification system. Some of the policy transfers, reportedly RMB 200 billion, might have been “performing loans” carved out solely for the purpose of facilitating the debt-for-equity swaps to be discussed later (Tang (2001a)). And most of the carved out “performing loans” might have been extended after 1995, which contradicts the purpose of policy transfers targeting those loans incurred before end-1995.
2 The main distinctions between the policy and non-policy NPL transfers seem to be the timing of the bad debts, the transfer
prices of the carved out NPLs and their related financing arrangements It appears that there could be some profit-/loss-sharing agreements for such “non-policy” transfers between the big four banks and the AMCs. The transfer prices would probably be below par. Such transfers could help the banks to meet the mandated schedule for reducing NPLs.

4
In short, the AMCs neither address the entire NPL problem of the big four banks nor focus solely on it. Box 1 provides a summary of the complications involved in the NPL transfers by the AMCs, pointing to the possibility of overlapped mandates facing the four Chinese AMCs. This raises the questions of transparency and complexity of the AMC operations. For the rest of this paper, we will focus exclusively on the policy-based NPL transfer, given the information constraints.
3. AMC financing of the NPL purchase
How have the Chinese AMCs been financed? International experience suggests that insufficient resources for recognising losses often delay bank restructuring and ultimately render it more costly. In particular, well funded AMCs are a key ingredient for efficient NPL resolution (Crockett (1998), Lindgren et al (1999), Claessens et al (2001)). In China’s case, it is generally thought that the AMCs simply financed their purchase of the NPLs by issuing 10-year AMC bonds to the big four banks. However, we argue that the AMC financing of the policy-based NPL transfers consisted not only of AMC bonds but also of cash. Moreover, we make the case that the PBoC credit has been the principal source of cash financing for the AMCs.
Government regulations (State Council (2000)) stipulate that the four permitted sources of AMC financing are MoF equity, borrowing from the PBoC, commercial borrowing from other financial institutions and AMC bonds. Our task is to estimate their respective contributions. As discussed, the MoF injected RMB 10 billion in equity capital into each AMC and thus committed a total of RMB 40 billion to the financing of the four AMCs. This MoF equity capital injection was tiny, funding less than 3% of the policy purchase of NPLs.3 For the other three financing sources, our strategy is first to focus on the two remaining sources of cash financing and then to derive the bond financing as a residual. A major hindrance is that only one AMC has disclosed its balance sheet.4 So we must proceed in an uncomfortably inferential manner.
Box 2 explains the reasoning behind the absence of AMC borrowing from other financial institutions and derives a lower-bound estimate of the PBoC financing to the four AMCs of RMB 192 billion. On these estimates, cash financing amounts to 17% of the policy NPL purchase – 3% from MoF equity and 14% from the PBoC credit. That leaves 83% of the policy transfer to be financed with the non-tradable AMC bonds held by the big four banks. Note that on the basis of our lower-bound estimate, the PBoC provided the AMCs with five RMBs for every RMB provided by the MoF so far.
With this estimated financing structure, we can visualise the NPL transfers between the big four banks and the four AMCs in two steps. The first step is the establishment of the four AMCs, with the MoF and PBoC together providing the founding capital of RMB 232 billion. The second step is an asset swap of RMB 1.4 trillion of NPLs for RMB 1,168 billion in AMC bonds and RMB 232 billion in cash (The Appendix details the balance sheet adjustments of each step). As noted later, this is a simplification of a possibly more complex set of transactions. Nevertheless, the essence of the policy transfers is captured.
It is useful to combine these two steps and analyse the balance sheet adjustments of the PBoC, the AMCs and the big four banks (Table 2). The top panel of Table 2 shows the T account of the PBoC following the policy transfer. After the NPL transfer, the PBoC balance sheet expands by the amount of its loans to the AMCs, which represent 6% of reserve money at that time. Note that the PBoC credit initially provided to the four AMCs served to increase free reserves held by the big four banks.
The centre panel of Table 2 presents the aggregate balance sheet of the four AMCs, showing that their policy-based NPL purchase is financed with 3% MoF equity capital, 14% PBoC credit and 83%
3 It is not clear how the MoF raised the RMB 40 billion, as the 1998, 1999 and 2000 government budgets and their outturns all
gave no details regarding the expected budgetary appropriations. A part of the MoF equity might not be cash but contributions in kind (such as equipment). For simplicity, we treat MoF equity as all cash.
4 So far, Huarong is the only AMC to have provided a detailed balance sheet, which explicitly and directly recognises that its NPL purchase was partly financed by borrowing from the PBoC.

5
Box 2 Estimating AMC borrowing from the PBoC and other financial institutions
Of the two sources of cash financing other than MoF equity, available information suggests the absence of commercial borrowing from other financial institutions so far. First, no publicly available source, of which we are aware, has documented any such borrowing. Second, the incentive for the AMCs to borrow from other financial institutions is weak, on the assumption that commercial borrowing would be priced at the current official one-year lending rate of 5.31%, above the 2.25% AMC bond coupon. Therefore, we assume that AMC commercial borrowing from other financial institutions is zero.
By contrast, evidence points to the use of PBoC credit to finance the AMCs (Lardy (2001)). For example, in an official publication, Gao (2001) explicitly stated that in 2000 alone, the PBoC provided financing of RMB 174.5 billion to the four AMCs. The challenge is to estimate the total PBoC credit to the four AMCs during 1999-2000. Our approach is to derive a lower-bound estimate of PBoC financing to the AMCs for this two-year period. First, Bank of China received “cash payments” of RMB 107 billion from Orient Asset Management Corp (Orient) for its NPL transfer (BoC (2000)). Based on the assumption of zero AMC borrowing from other financial institutions, the PBoC financing to Orient would be at least RMB 97 billion (after accounting for the RMB 10 billion in MoF equity). Second, Huarong Asset Management Corp (Huarong) explicitly recognises that the PBoC provided it with RMB 95 billion worth of financing (Huarong (2001)). Therefore, we estimate that the PBoC financing to these two AMCs alone was at least RMB 192 billion.
This RMB 192 billion represents the lower-bound estimate of the PBoC credit to the four AMCs, funding 14% of the policy NPL transfers. We will use this conservative estimate as our baseline case throughout the rest of our analysis. A possible upper-bound estimate of the PBoC financing to the four AMCs would be RMB 563 billion, the cumulative rise in PBoC claims on non-monetary financial institutions (NMFIs) during 1999-2000. The doubling of the PBoC claims on them suggests possibly much larger PBoC financing to the AMCs (Panel A of Graph 1). This is both because the AMCs are so classified and because most policy transfers actually took place in this period.
Graph 1 (A) PBoC claims on non-monetary financial institutions (RMB billions)
(B) PBoC claims on non-monetary financial institutions (% of reserve money)
Source: PBoC.
0 100
200
300
400
500
600
700
800
900
1,000
Mar
96
Jun
96
Sep
96
Dec
96
Mar
97
Jun
97
Sep
97
Dec
97
Mar
98
Jun
98
Sep
98
Dec
98
Mar
99
Jun
99
Sep
99
Dec
99
Mar
00
Jun
00
Sep
00
Dec
00
Mar
01
Jun
01
RMB billions
0%
5%
10%
15%
20%
25%
30%
1Q 9
62Q
96
3Q 9
64Q
96
1Q 9
72Q
97
3Q 9
74Q
97
1Q 9
82Q
98
3Q 9
84Q
98
1Q 9
92Q
99
3Q 9
94Q
99
1Q 0
02Q
00
3Q 0
04Q
00
1Q 0
12Q
01

6
AMC bonds.5 Note that the combined AMC balance sheet is highly leveraged, with a debt-to-equity ratio of 34. Taking another view, one can interpret the sum of the PBoC credit and the MoF equity capital as the founding capital of the four AMCs. That is, one might sensibly regard the PBoC credit as being effectively subordinated to the AMC bonds. The rationale is that in the event of debt servicing difficulties, the state would sooner service the AMC bonds than the PBoC credit. Given the assumption of effective subordination and the expected AMC losses, the five-to-one financial contribution to the AMC founding capital implies that the PBoC might to date have taken on much greater risk in the AMC financing than the MoF.
Table 2 The case of simple PBoC lending to the AMCs (zero sterilisation)
(a) Changes in the balance sheet of the PBoC
Assets (RMB billions) Liabilities and equity (RMB billions)
Claims on financial institutions Reserves
Credits to big four banks 0 Due to big four banks 192 Credits to AMCs 192 Due to AMCs 0
Total assets 192 Total liabilities and equity 192
(b) Combined balance sheet of the four AMCs
Assets (RMB billions) Liabilities and equity (RMB billions)
Reserves at PBoC 0 Paid-in capital (from the MoF) 40
NPLs from the big four banks 1,400 Borrowing from the PBoC 192 10-year AMC bonds 1,168
Total assets 1,400 Total liabilities and equity 1,400
(c) Changes in the combined balance sheet of the big four banks
Assets (RMB billions) Liabilities and equity (RMB billions)
Reserves 232 Liabilities due to the PBoC 0
10-year AMC bonds 1,168 Domestic non-bank claims -1,400
Total assets 0 Total liabilities and equity 0
Note: This table combines Table A1 and Table A2 of the Appendix. In addition, we assume that the MoF equity is all paid out for the policy-based NPL purchases. No sterilisation of the central bank credit to the AMCs is represented.
Sources: Table 1; authors’ own estimates.
The bottom panel of Table 2, showing the adjustment of the combined balance sheet of the big four banks, suggests that their asset composition may improve upon the NPL transfer, since some of their NPLs are replaced at par with 83% AMC bonds and 17% cash. However, whether the policy transfer has really improved the quality of the big four banks’ balance sheets hinges on two crucial assumptions. First, the “performing loan” transfers of around RMB 200 billion noted earlier would not exceed the total cash payments that the big four banks received from the AMCs. This assumption is largely met by our estimated AMC cash payments. Second, the AMC bonds are implicitly backed by the state. While most market analysts believe that there is no explicit guarantee from the government
5 Note that the AMC balance sheet and its adjustment are identical.
7
(S&P (2001b)), one of the big four banks has remarked that the AMC bonds are “state-backed” (CCB (1999)). As will be discussed later, this so-called “constructive ambiguity” towards state backing of the AMC bonds leaves open the allocation of the expected AMC loss among the MoF, the PBoC and the big four banks.
In China, the general belief is that the government could ill afford to let the AMCs default on their bonds. Without any implicit state backing, the AMC bonds held by the big four banks cannot possibly achieve a better risk rating than their underlying assets – the originally carved out NPLs. In other words, in the absence of implicit state backing for the AMC bonds, any improvement of the big four banks’ combined balance sheet from the policy-based NPL transfer would be illusory.
Even if the AMC bonds are not guaranteed by the government, a case can still be made that the establishment of the AMCs improved the measured risk-based capital ratio of the big four banks, given that “agency” bonds attract a lower risk weight according to the current Basel rules. Government regulations stipulate that the AMCs are “state-owned non-bank financial institutions set up by the State Council” and that “at the closure of the AMCs, the MoF will propose solutions to final AMC loss” (State Council (2000)). Therefore, the Chinese AMCs can be viewed as government-sponsored agencies. In this case, a risk rating of 20% on the AMC bonds (compared to 100% on the NPLs) could reduce the big four banks’ required core capital by almost RMB 40 billion.6 Whether any such reduction in the banks’ required capital is warranted, however, remains to be seen.
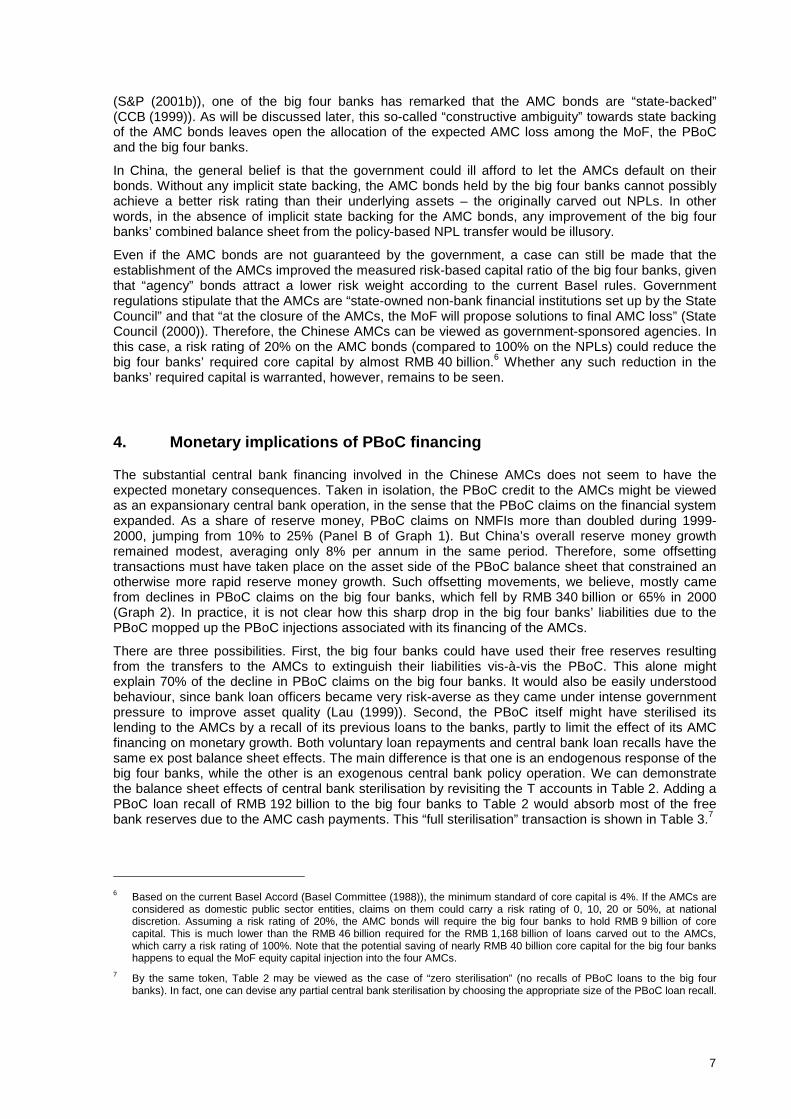
4. Monetary implications of PBoC financing
The substantial central bank financing involved in the Chinese AMCs does not seem to have the expected monetary consequences. Taken in isolation, the PBoC credit to the AMCs might be viewed as an expansionary central bank operation, in the sense that the PBoC claims on the financial system expanded. As a share of reserve money, PBoC claims on NMFIs more than doubled during 1999-2000, jumping from 10% to 25% (Panel B of Graph 1). But China’s overall reserve money growth remained modest, averaging only 8% per annum in the same period. Therefore, some offsetting transactions must have taken place on the asset side of the PBoC balance sheet that constrained an otherwise more rapid reserve money growth. Such offsetting movements, we believe, mostly came from declines in PBoC claims on the big four banks, which fell by RMB 340 billion or 65% in 2000 (Graph 2). In practice, it is not clear how this sharp drop in the big four banks’ liabilities due to the PBoC mopped up the PBoC injections associated with its financing of the AMCs.
There are three possibilities. First, the big four banks could have used their free reserves resulting from the transfers to the AMCs to extinguish their liabilities vis-à-vis the PBoC. This alone might explain 70% of the decline in PBoC claims on the big four banks. It would also be easily understood behaviour, since bank loan officers became very risk-averse as they came under intense government pressure to improve asset quality (Lau (1999)). Second, the PBoC itself might have sterilised its lending to the AMCs by a recall of its previous loans to the banks, partly to limit the effect of its AMC financing on monetary growth. Both voluntary loan repayments and central bank loan recalls have the same ex post balance sheet effects. The main difference is that one is an endogenous response of the big four banks, while the other is an exogenous central bank policy operation. We can demonstrate the balance sheet effects of central bank sterilisation by revisiting the T accounts in Table 2. Adding a PBoC loan recall of RMB 192 billion to the big four banks to Table 2 would absorb most of the free bank reserves due to the AMC cash payments. This “full sterilisation” transaction is shown in Table 3.7
6 Based on the current Basel Accord (Basel Committee (1988)), the minimum standard of core capital is 4%. If the AMCs are
considered as domestic public sector entities, claims on them could carry a risk rating of 0, 10, 20 or 50%, at national discretion. Assuming a risk rating of 20%, the AMC bonds will require the big four banks to hold RMB 9 billion of core capital. This is much lower than the RMB 46 billion required for the RMB 1,168 billion of loans carved out to the AMCs, which carry a risk rating of 100%. Note that the potential saving of nearly RMB 40 billion core capital for the big four banks happens to equal the MoF equity capital injection into the four AMCs.
7 By the same token, Table 2 may be viewed as the case of “zero sterilisation” (no recalls of PBoC loans to the big four banks). In fact, one can devise any partial central bank sterilisation by choosing the appropriate size of the PBoC loan recall.

8
Graph 2 The big four banks’ liabilities vis-à-vis the PBoC
RMB billions
Source: Annual reports of the big four banks, various issues.
Third, the PBoC financing of the AMCs might have taken the form of so-called “liability transfers”. Basically, the PBoC could have transferred its claims on the big four banks to their respective AMCs so that the four AMCs could “pay” for their NPL purchases by assuming the big four banks’ liabilities to the PBoC (Tang (2001b)). This more indirect approach can be interpreted as a combination of PBoC credit to the AMCs and recalls of PBoC loans to the big four banks. For example, the case of pure AMC assumption of the big four banks’ liabilities to the PBoC is equivalent to the case of full sterilisation in Table 3. One possible consideration of adopting this indirect approach is that some of the PBoC credit transferred to the AMCs might have been associated in some manner with directed policy lending by the big four banks.
Any one of these three possibilities effectively explains the coexistence of rising PBoC lending to the NMFIs and falling PBoC loans to the big four banks during this period. In reality, there could have been a mix of these different sterilising transactions. The big four banks could have paid down their borrowing from the PBoC, and the free reserves for doing so might have come from the cash from the AMCs. The PBoC could have sterilised its AMC financing through loan recalls or open market operations. The indirect approach of liability transfers might have functioned as one mechanism to allocate PBoC financing among the four AMCs. In any event, whether there were endogenous loan repayments, a policy of sterilisation or liability transfers, the monetary consequence would have been largely the same. They share the common feature that offsetting movements on the asset side of the PBoC balance sheet sterilised the PBoC financing to the AMCs and thus helped to restrain monetary expansion.
5. AMC loss-sharing: the MoF vs the PBoC
This section focuses on the implications of the AMC financing for the allocation of AMC losses. We first demonstrate that under all plausible recovery scenarios, the Chinese AMCs should be expected to run up substantial losses, which ultimately represent a part of China’s quasi-fiscal deficits. Then, we show that under reasonable assumptions, the PBoC is likely to lose all of its RMB 192 billion lending to the AMCs. Finally, we argue that under the current AMC financing arrangement, the ultimate sharing of the expected total AMC loss between the PBoC and the MoF remains uncertain.
521 517
178
0
100
200
300
400
500
600
1998 1999 2000

9
Table 3 The case of PBoC financing with RMB 192 billion PBoC loan recall (full sterilisation)
(a) Changes in the balance sheet of the PBoC
Assets (RMB billions) Liabilities and equity (RMB billions)
Claims on financial institutions Reserves Credits to big four banks -192 Due to big four banks 0 Credits to AMCs 192 Due to AMCs 192
Total assets 0 Total liabilities and equity 192
(b) Changes in the combined balance sheet of the four AMCs
Assets (RMB billions) Liabilities and equity (RMB billions)
Reserves at PBoC 0 Paid-in capital (from the MoF) 40 NPLs from the big four banks 1,400 Borrowing from the PBoC 192
10-year AMC bonds 1,168
Total assets 1,400 Total liabilities and equity 1,400
(c) Changes in the combined balance sheet of the big four banks
Assets (RMB billions) Liabilities and equity (RMB billions)
Reserves 40 Liabilities due to the PBoC -192 10-year AMC bonds 1,168
Domestic non-bank claims 1,400
Total assets -192 Total liabilities and equity -192
Note: This table is derived by adding to Table 2 a recall of RMB 192 billion in PBoC loans to the big four banks. This PBoC loan recall worth RMB 192 billion is defined as “full sterilisation”, on the basis of our estimated PBoC financing to the AMCs.
Sources: Table 2; authors’ own estimates.
Instead of the actual AMC financing, the Chinese government could have taken a more straightforward approach to AMC financing by issuing government bonds or providing full state guarantees for the AMC liabilities. The MoF would directly bear any loss from disposing of the NPLs. Any asset recovery by the AMCs would then contribute towards paying down government liabilities. The currently more ambiguous AMC financing arrangement leaves open questions as to how the AMC loss will be shared between the MoF and the PBoC.
Before discussing the possible sharing of the expected AMC loss, it is helpful to put the general PBoC-MoF relationship in perspective. The PBoC is not an independent central bank by international standards, since key PBoC appointments and major monetary policies (such as interest rate decisions) are decided at the level of the State Council, China’s cabinet. Nevertheless, it is important to note that the PBoC does not report to the MoF. In fact, both the PBoC and the MoF are under the direct guidance of the State Council. The MoF historically tended to have greater political clout than the PBoC within China’s general political framework. In the case at hand, the State Council decided how to distribute risks across the MoF and the PBoC.
The AMCs’ liabilities are expected to exceed their assets, leading to overall AMC losses to be allocated somehow. The AMCs can be expected to run up substantial losses, since a mere 18% write-off of the policy transfers would erase the entire AMC founding capital. Even with the upper-bound estimate of PBoC financing (RMB 563 billion), our conclusion still stands, if we make the reasonable assumption that the average recovery rate does not exceed 55%.
Graph 3 illustrates the sharing of AMC losses under different plausible scenarios of recovery. The solid line indicates that as the recovery rate rises, the total AMC loss declines. Absent the PBoC financing, the total AMC loss and the MoF loss would be identical, under the assumption of implicit
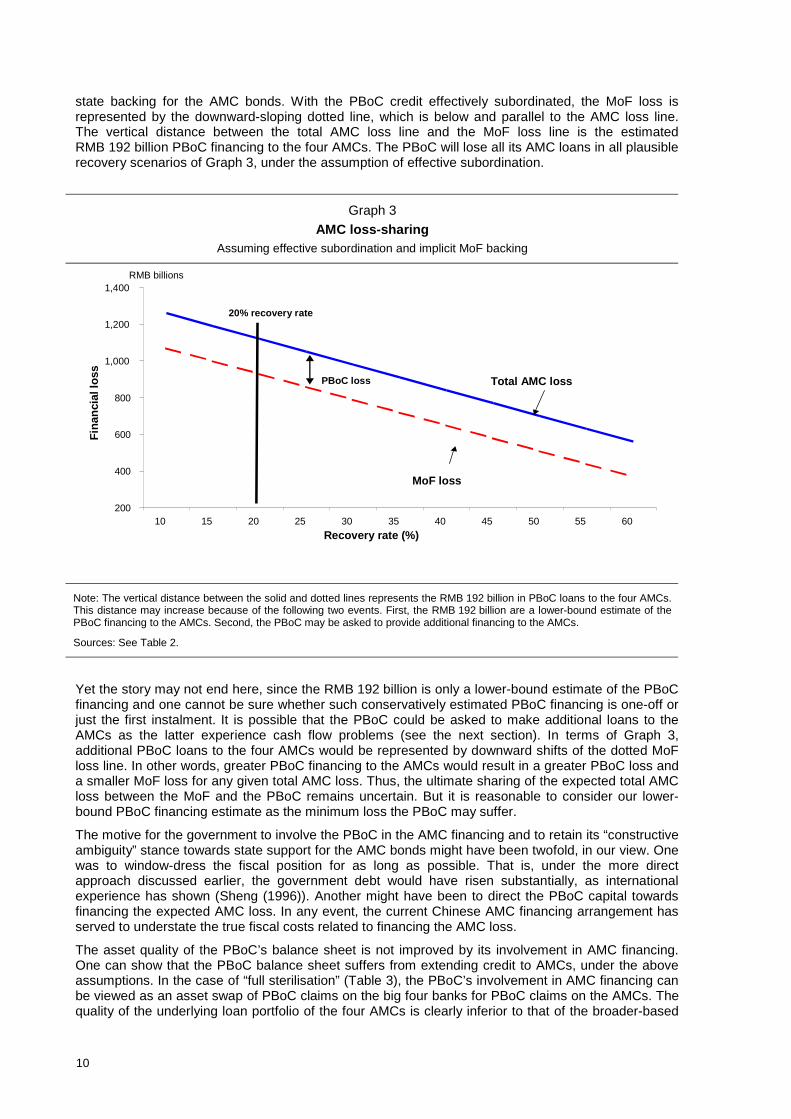
10
state backing for the AMC bonds. With the PBoC credit effectively subordinated, the MoF loss is represented by the downward-sloping dotted line, which is below and parallel to the AMC loss line. The vertical distance between the total AMC loss line and the MoF loss line is the estimated RMB 192 billion PBoC financing to the four AMCs. The PBoC will lose all its AMC loans in all plausible recovery scenarios of Graph 3, under the assumption of effective subordination.
Graph 3 AMC loss-sharing
Assuming effective subordination and implicit MoF backing
Note: The vertical distance between the solid and dotted lines represents the RMB 192 billion in PBoC loans to the four AMCs. This distance may increase because of the following two events. First, the RMB 192 billion are a lower-bound estimate of the PBoC financing to the AMCs. Second, the PBoC may be asked to provide additional financing to the AMCs.
Sources: See Table 2.
Yet the story may not end here, since the RMB 192 billion is only a lower-bound estimate of the PBoC financing and one cannot be sure whether such conservatively estimated PBoC financing is one-off or just the first instalment. It is possible that the PBoC could be asked to make additional loans to the AMCs as the latter experience cash flow problems (see the next section). In terms of Graph 3, additional PBoC loans to the four AMCs would be represented by downward shifts of the dotted MoF loss line. In other words, greater PBoC financing to the AMCs would result in a greater PBoC loss and a smaller MoF loss for any given total AMC loss. Thus, the ultimate sharing of the expected total AMC loss between the MoF and the PBoC remains uncertain. But it is reasonable to consider our lower-bound PBoC financing estimate as the minimum loss the PBoC may suffer.
The motive for the government to involve the PBoC in the AMC financing and to retain its “constructive ambiguity” stance towards state support for the AMC bonds might have been twofold, in our view. One was to window-dress the fiscal position for as long as possible. That is, under the more direct approach discussed earlier, the government debt would have risen substantially, as international experience has shown (Sheng (1996)). Another might have been to direct the PBoC capital towards financing the expected AMC loss. In any event, the current Chinese AMC financing arrangement has served to understate the true fiscal costs related to financing the AMC loss.
The asset quality of the PBoC’s balance sheet is not improved by its involvement in AMC financing. One can show that the PBoC balance sheet suffers from extending credit to AMCs, under the above assumptions. In the case of “full sterilisation” (Table 3), the PBoC’s involvement in AMC financing can be viewed as an asset swap of PBoC claims on the big four banks for PBoC claims on the AMCs. The quality of the underlying loan portfolio of the four AMCs is clearly inferior to that of the broader-based
200
400
600
800
1,000
1,200
1,400
10 15 20 25 30 35 40 45 50 55 60
RMB billions
Total AMC loss
MoF loss
Recovery rate (%)
PBoC loss
Fina
ncia
l los
s
20% recovery rate

11
loan portfolio of the big four banks. The asset quality of the PBoC balance sheet accordingly deteriorates, therefore, unless we assume full MoF backing for the AMC bonds.8
Finally, the PBoC credit to the AMCs should not be confused with a lender of last resort operation to extend emergency liquidity. Instead, it should be considered as medium-term central bank financing of China’s bank restructuring. Two considerations support this view. First, no new source of finance has replaced the PBoC financing since 1999, when the AMCs were first established. Second, the PBoC financing to the AMCs is unrelated to major liquidity crunches, since there has been ample liquidity within the Chinese banking system, especially among the big four banks – excess reserves are believed to be as high as half of the total reserves held at the PBoC by the banks. In any case, the principal challenge facing the Chinese banking system as a whole is not liquidity but solvency (Dornbusch and Giavazzi (1999)).9
In sum, PBoC exposure to the AMCs represents no small risk to the institution and its further development as a modern central bank. As argued above, the PBoC is likely to lose its RMB 192 billion credit to the AMCs. This potential financial loss would be more than five times the PBoC’s own capital. Thus, such a large exposure to the AMCs may pose risks to the PBoC’s own capital base and could potentially weaken the PBoC’s monetary management and its own capacity to act as lender of last resort over the long term. More generally, extensive direct involvement in bank restructuring may unduly burden a central bank in terms of its balance sheet, core monetary policy functions and potential conflicts of interests (Dziobek and Pazarbasioglu (1997)).
6. Cash flow dynamics and asset disposition
What are the main factors affecting the asset recovery of the Chinese AMCs? How likely is it that the AMCs will meet their interest payments? The financial sustainability of the AMCs, in cash flow terms, depends on the dynamics of both cash inflows and outflows. While the AMCs’ cash outflows have been largely determined by their financing structure, the pace of asset disposition and the rate of asset recovery are two principal factors influencing their cash inflows. We first focus on the cash outflows of the AMCs, inferring that the interest payment obligations of the four AMCs exceed RMB 30 billion per annum. Then, we show that the expected cash recovery from NPLs may not exceed 20% of their book value. Finally, we suggest that the cash flow pressure on the Chinese AMCs has been rising, since their cash recoveries have lagged their accruing interest obligations. In response, the government is pushing for a faster pace of NPL disposals.
The interest burden of the Chinese AMCs is a product of high leverage and a low nominal rate on their obligations. The government has apparently set an annual interest rate of 2.25% on both the AMC bonds and the PBoC credit to the AMCs, which was the same as the official one-year bank deposit rate in 2001 (State Council (2000)). Given the MoF equity of RMB 40 billion and the policy purchase of RMB 1.4 trillion, the four AMCs borrowed RMB 1.36 trillion, and thus, their combined annual interest obligation exceeds RMB 30 billion. To meet this obligation, therefore, the four AMCs must come up with a like amount of cash, assuming zero overheads.10 Failing that, the AMCs would face a liquidity problem, in the absence of additional cash injections from either the MoF or the PBoC.
The cash recovery (inflows) of the AMCs mostly depends on the speed of NPL disposition and the cash recovery rate. It appears that asset liquidation has not kept pace with accruing interest. Nearly all of the NPL disposals and asset recovery since 1999 took place in 2001, when the four AMCs disposed of RMB 125 billion in bad debts (less than 10% of the policy transfer) and recovered RMB 26 billion in
8 The only case in which the PBoC’s own balance sheet might not deteriorate is if the transferred portion of its previous
lending to the big four banks had been non-performing to begin with. 9 There has been some liquidity problem in some smaller financial institutions in recent years, as flight to quality might have
hit these weaker players (Liu (1999)). We believe that another factor behind the steep jumps in the PBoC’s claims on the non-monetary financial institutions in 1999-2000 was the emergency short-term liquidity support provided by the PBoC to these non-monetary financial institutions.
10 For simplicity, we ignore overhead-related AMC cash outflows, which are reported to be RMB 1.5 billion annually for the four AMCs (Yang (2001)). Moreover, the one-year official interest rate was trimmed in February 2002 to 1.98% from 2.25%.

12
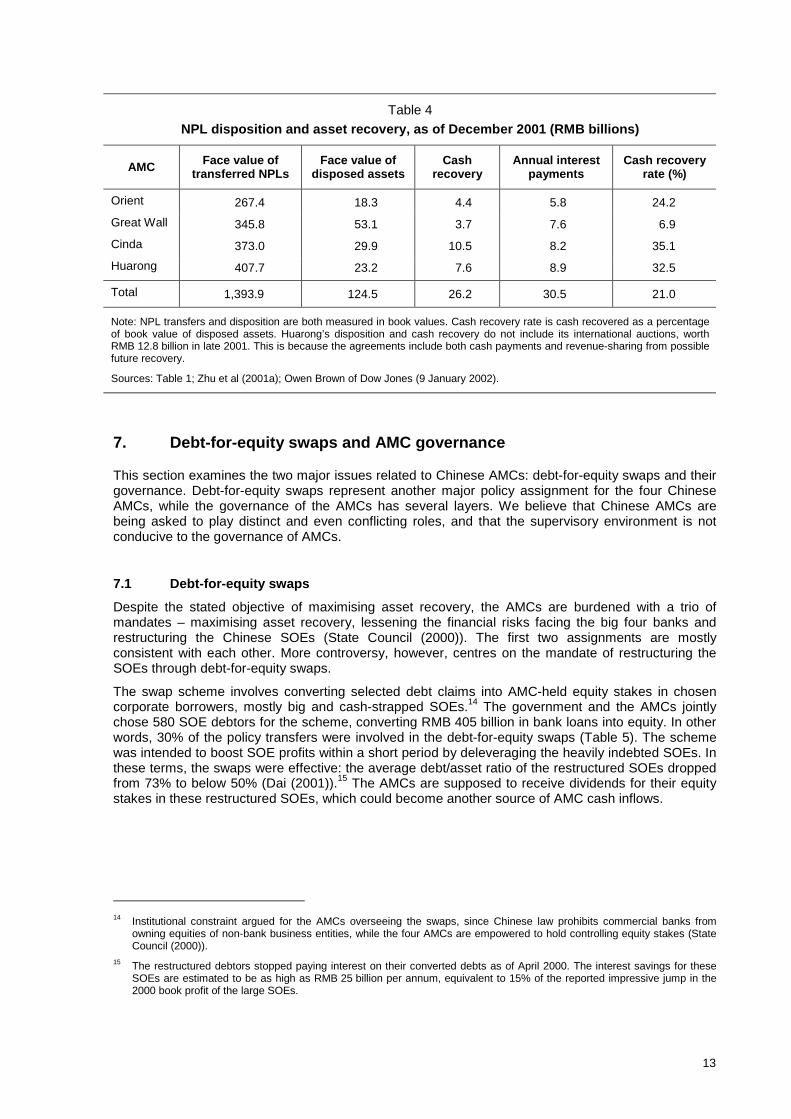
cash (Table 5). Although the implied 21% cash recovery rate sounds respectable, the cash recoveries by the four AMCs in their first two years cover less than half of their interest costs. Apparently, the cash flow pressure on the AMCs is mounting.
In response to the rising cash flow pressure, the government is pressing for faster NPL disposals. The MoF has established AMC performance indicators such as cash recovery ratios and unveiled an incentive scheme to encourage higher and faster cash recoveries.11 Of late, the AMCs have been more actively pursuing loan sales, auctions, debt restructuring, foreclosures, litigation and liquidations (Lou (2001), Huarong (2001)). In late 2001, the first international NPL auctions in China took place, with Huarong selling RMB 13 billion of its bad debts to two international consortia. The auction was a milestone, since for the first time it revealed credible information on market prices for the NPLs (Lague (2001), Huarong (2001)). Reportedly, Huarong would receive up to 21% of the book value, but there are reasons to believe that such a headline recovery rate may not be sustained. First, the collateral coverage of the sold NPL bundles by Huarong (2001) exceeds that of its overall policy-based NPL portfolio. Second, there is a tendency for more saleable assets to be liquidated first. Third, the effective cash recovery rate from Huarong’s international auction could be lower than the reported 21% recovery rate, as one consortium paid only half of the headline price in cash up front.12
More generally, the quality of the underlying assets held by the Chinese AMCs will be a major factor influencing the recovery performance. Considering the low coverage of collateral within the AMCs’ portfolio and given that most of these NPLs have been confirmed as problem loans for more than four years, one cannot expect a high recovery rate. Moreover, real estate, which tends to be more collectable, accounts for only 7% of policy-based NPL carve-outs, while manufacturing, which is typically more difficult to recover, represents 46%. By contrast, 47% of the assets managed by the US Resolution Trust Corporation were real estate (Lou (2001), Klingebiel (2000)). If international experience is any guide, the likely asset recovery of the Chinese AMCs may underperform that of their Asian counterparts, given the aforementioned unfavourable initial conditions (S&P (2002)).
Consistent with the importance of real estate collateral, the four AMCs differ noticeably in terms of recovery performance (Table 4). Take away Cinda, and the cash recovery rate of the remaining three AMCs would drop to 17%. Assets associated with Cinda’s NPL portfolio are apparently better than those of the other three AMCs, in part because of the higher real estate share in Cinda’s portfolio (Lou (2001), Zhu et al (2001a)). Moreover, Cinda’s NPL portfolio is closely tied to large-scale infrastructure projects. Cinda alone accounts for nearly 40% of all the cash recovery by the four AMCs to date.
Thus, some AMCs may face more severe cash flow problems than others (Table 4). If some AMCs are not able to meet their interest obligations on their own, their corresponding banks could end up having swapped NPLs for AMC bonds that may not provide the expected cash streams. For instance, the cash recovery of Great Wall Asset Management Corporation for the first two years is not enough to meet half of its own annual interest obligation.13
One possible reason for the apparently slow asset disposals during 1999-2000 could be that the four AMCs were preoccupied with the large-scale debt-for-equity swaps in this period. The debt-for-equity swap scheme, championed by the government, mostly served the political goal of lifting the financial performance of the SOEs within three years. We next turn to this controversial topic.
11 The MoF’s incentive scheme specifies 1% bonus of realised cash recovery for Cinda and Huarong and 1.2% for Great Wall
and Orient (MoF (2001)). That would translate into an impressive RMB 10,000 cash bonus per AMC staffer a year on the assumptions of RMB 1.4 trillion NPLs, a 15% cash recovery and 20,000 staffers of the four AMCs over a 10-year period.
12 The Morgan Stanley-led consortium paid only 10% cash up front. The remaining payments will come through further cash recoveries from a joint venture formed by the consortium and Huarong itself (Lague (2001)).
13 In April 2002, Huarong made its first interest payment to the Industrial and Commercial Bank of China since its establishment (People’s Daily, 23 April 2002, p 11). The amount paid is RMB 7.5 billion, about the same as the reported cash recovery so far by Huarong but less than its estimated interest obligation for one year. The same source makes no reference to whether it has made any interest payment to the PBoC on its large borrowing from the PBoC.
13
Table 4 NPL disposition and asset recovery, as of December 2001 (RMB billions)
AMC Face value of transferred NPLs
Face value of disposed assets
Cash recovery
Annual interest payments
Cash recovery rate (%)
Orient 267.4 18.3 4.4 5.8 24.2 Great Wall 345.8 53.1 3.7 7.6 6.9 Cinda 373.0 29.9 10.5 8.2 35.1 Huarong 407.7 23.2 7.6 8.9 32.5
Total 1,393.9 124.5 26.2 30.5 21.0
Note: NPL transfers and disposition are both measured in book values. Cash recovery rate is cash recovered as a percentage of book value of disposed assets. Huarong’s disposition and cash recovery do not include its international auctions, worth RMB 12.8 billion in late 2001. This is because the agreements include both cash payments and revenue-sharing from possible future recovery.
Sources: Table 1; Zhu et al (2001a); Owen Brown of Dow Jones (9 January 2002).
7. Debt-for-equity swaps and AMC governance
This section examines the two major issues related to Chinese AMCs: debt-for-equity swaps and their governance. Debt-for-equity swaps represent another major policy assignment for the four Chinese AMCs, while the governance of the AMCs has several layers. We believe that Chinese AMCs are being asked to play distinct and even conflicting roles, and that the supervisory environment is not conducive to the governance of AMCs.
7.1 Debt-for-equity swaps Despite the stated objective of maximising asset recovery, the AMCs are burdened with a trio of mandates – maximising asset recovery, lessening the financial risks facing the big four banks and restructuring the Chinese SOEs (State Council (2000)). The first two assignments are mostly consistent with each other. More controversy, however, centres on the mandate of restructuring the SOEs through debt-for-equity swaps.
The swap scheme involves converting selected debt claims into AMC-held equity stakes in chosen corporate borrowers, mostly big and cash-strapped SOEs.14 The government and the AMCs jointly chose 580 SOE debtors for the scheme, converting RMB 405 billion in bank loans into equity. In other words, 30% of the policy transfers were involved in the debt-for-equity swaps (Table 5). The scheme was intended to boost SOE profits within a short period by deleveraging the heavily indebted SOEs. In these terms, the swaps were effective: the average debt/asset ratio of the restructured SOEs dropped from 73% to below 50% (Dai (2001)).15 The AMCs are supposed to receive dividends for their equity stakes in these restructured SOEs, which could become another source of AMC cash inflows.
14 Institutional constraint argued for the AMCs overseeing the swaps, since Chinese law prohibits commercial banks from
owning equities of non-bank business entities, while the four AMCs are empowered to hold controlling equity stakes (State Council (2000)).
15 The restructured debtors stopped paying interest on their converted debts as of April 2000. The interest savings for these SOEs are estimated to be as high as RMB 25 billion per annum, equivalent to 15% of the reported impressive jump in the 2000 book profit of the large SOEs.

14
Table 5 Debt-for-equity swaps and the AMCs
AMC Assets transferred (RMB billions)
Debt-equity swaps (RMB billions)
Share of swaps in carved out loans (%)
Number of SOEs involved
Orient 267.4 63.9 23.9 65
Great Wall 345.8 12.5 3.6 21
Cinda 373.0 154.5 41.4 168
Huarong 407.7 110.0 27.0 333
Sum 1,393.9 340.9 24.5 587
Official total 1,393.9 405.0 29.1 580
Note: This table lists the involvement of the lead banks in debt-for-equity swaps. We could not reconcile the differences between the sums and the officially reported totals.
Sources: Table 4; Tang (2001a); Zhu et al (2001b).
Most preliminary debt-for-equity conversion agreements between the AMCs and the SOEs feature three clauses. First, many restructured SOEs are required to repurchase their equity stakes from the AMCs at agreed prices within 10 years. Second, the restructured SOEs promise certain returns on the AMC-held equity stake, through paid dividends or a repurchase price premium. Third, local governments are often asked to guarantee that the AMCs have exit priority in stock market listings, acquisitions or buyouts. With these clauses, the AMC-held equity stakes resemble preferred shares. One motive for the debt-for-equity swaps is that the AMCs could prepare for sales of equity in the restructured SOEs through IPOs or secondary placements. Yet the recent declines of more than 30% in China’s local currency stock market, which featured an average P/E of 60, may have dimmed the prospects for any quick sales of the AMC-held equities.
Finally, the debt-for-equity swaps provide the rationale for banks’ transferring their “performing loans” to the AMCs. The government was eager to lift the short-term financial performance of the big SOEs and thus might have requested the big four banks to transfer some of their performing loans as a condition for carving out some of their NPLs. Alternatively, such loans should have been classified as NPLs by international norms to begin with. Yet, under the old Chinese loan classification system based on payment status rather than risk assessment, such loans might still be regarded as being properly serviced and therefore performing (Lardy (1998)).16
In short, the debt-for-equity swaps mean that the Chinese AMCs are being asked to perform two distinct functions: to dispose of assets rapidly on the one hand and to restructure SOEs over the medium term on the other (Klingebiel (2000)). These functions require very different skills, political bases, monitoring criteria and incentive structures. The AMCs, therefore, may be burdened with multiple and even conflicting tasks, which might have impeded their speedy asset liquidation in their first two years.
7.2 AMC governance and supervisory environment AMC governance and their regulatory and supervisory environment could potentially affect their performance. Here we focus on three specific issues: the regulatory environment, AMC/bank relationships and incentive structures of the AMCs.
16 We tend to take the view that by international standards, most of the bank loans carved out for debt-for-equity swaps could
have already been distressed and, therefore, should reasonably have been classified as NPLs. This view is also consistent with the secular trend of deteriorating financial conditions of the SOEs throughout the 1990s (Lardy (1999)).

15
First, the four AMCs are operating within a less than benign environment of multiple government agencies, which may have conflicting agendas. The three most important government agencies for the AMCs are the MoF, the PBoC and China Securities Regulatory Commission (CSRC). They all have their representatives sitting on all the AMC supervisory boards. The MoF, in theory the sole provider of equity for the AMCs, commands the post of the chairmanship of each AMC’s supervisory board. Nevertheless, as discussed earlier, there are no explicit MoF guarantees for the AMC bonds. The PBoC, effectively the largest provider of the founding capital for the AMCs, issues licences defining their business scope and supervises their corresponding banks. The CSRC issues securities-related business permits and regulates such business activities of the AMCs.17
Second, the relationship between each AMC and its respective big four bank is far from clear-cut, despite the absence of formal equity links between them: most AMC staff members come from the banks, which produced the bad loans to begin with. Moreover, the president of each bank is also the party chief of its corresponding AMC. The rules governing loss-/profit-sharing of the “non-policy” NPL transfers are not clear. And finally, loans to the same obligor are often artificially carved up into policy NPL purchase, non-policy transfers, remaining NPLs and performing loans (Liu (2001)). This less clear-cut AMC/bank relationship seemed to aim for enhanced cooperation in asset recovery between each AMC and its respective big four bank. Nevertheless, it may not contribute to transparency.
Third, the AMCs’ involvement in market-based commercial activities could also prove a mixed blessing, potentially distorting their incentives. For instance, the AMCs are empowered to broker securities, in order to facilitate sales of equity holdings through stock listing. Nevertheless, several complications could arise: (i) these AMCs will compete directly with the private sector; (ii) the prospects of becoming major players in China’s securities industry may entice the AMCs to prolong their lives beyond the mandated 10 years; (iii) the AMCs could evolve into the government agencies, mixing policy mandates (NPL disposition) with commercial drives.
In the end, since 85% of the policy transfers of NPLs involve SOEs, all the above issues underscore the potentially conflicting roles assigned to the Chinese AMCs. As the owner of the state-owned banks, the government could behave as a creditor, requiring the AMCs to maximise asset recoveries. But as the owner of the SOEs, the government could act like a debtor, pleading for generous debt restructuring terms. Given this interlocking relationship among the state-owned AMCs, the SOEs and the state-owned banks, a meaningful resolution of the Chinese NPL problem might be helped by substantial participation from foreign and domestic private sector investors.
8. Conclusions
In this paper, we analyse the four Chinese AMCs, which were established to transfer a large portion of the NPLs at the big four banks and to dispose of them in 10 years. The RMB 1.4 trillion of NPLs carved out in 1999-2000 by the AMCs represent some 40% of the estimated total NPLs of the big four banks. Most NPL transfers in this period are “policy-based”, as the government took responsibility for bank losses related to policy lending prior to 1996. The AMCs financed the policy-based NPL transfer with 3% MoF equity, 14% PBoC credit and 83% AMC bonds. Our estimate of PBoC credit to the AMCs must be considered as conservative. To further complicate the matter, the government stance towards the state backing for AMC bonds is carefully structured as “constructive ambiguity”.
We argue that the monetary consequences from the PBoC financing for the AMCs have been limited, mainly because of the offsetting reduction of PBoC claims on the banking system. Nevertheless, the PBoC has to date taken on greater risks in AMC financing than the MoF, and this medium-term PBoC claim on the AMCs appears large relative to the PBoC’s own capital base.
The risk is already evident, as lagging recoveries is putting cash flow pressure on the AMCs, despite low interest rates. On current evidence, the cash recovery rate may not exceed 20%. Furthermore, the AMCs are burdened with multiple tasks of quick asset disposition and medium-term corporate
17 In addition, the AMCs have to deal with other government departments such as the State Economic and Trade Commission
(for implementing debt-for-equity swaps) and the Ministry of Foreign Trade and Economic Cooperation (for paving the way for foreign participation), as well as local governments (for foreclosures and litigation).

16
restructuring. Finally, the Chinese AMCs are supervised by multiple government agencies and could face overlapping objectives, while greater transparency regarding the AMC/bank relationship would benefit China’s efforts to resolve the NPL problem.
Going forward, the main challenge for the Chinese AMCs is to maintain the momentum of more rapid asset recovery. First, international experience shows that speedy and effective asset recoveries are key to managing the fiscal costs of bank restructuring. Second, through market-based disposals involving foreign and domestic private sector investors, SOE reform can be pushed forward. This in turn will help contain flows of new NPLs in the Chinese banking system. Third, the government could request the AMCs to shoulder additional responsibilities for NPL disposition in the future, given that the Chinese banking sector beyond the big four banks may also carry a heavy NPL burden.
17
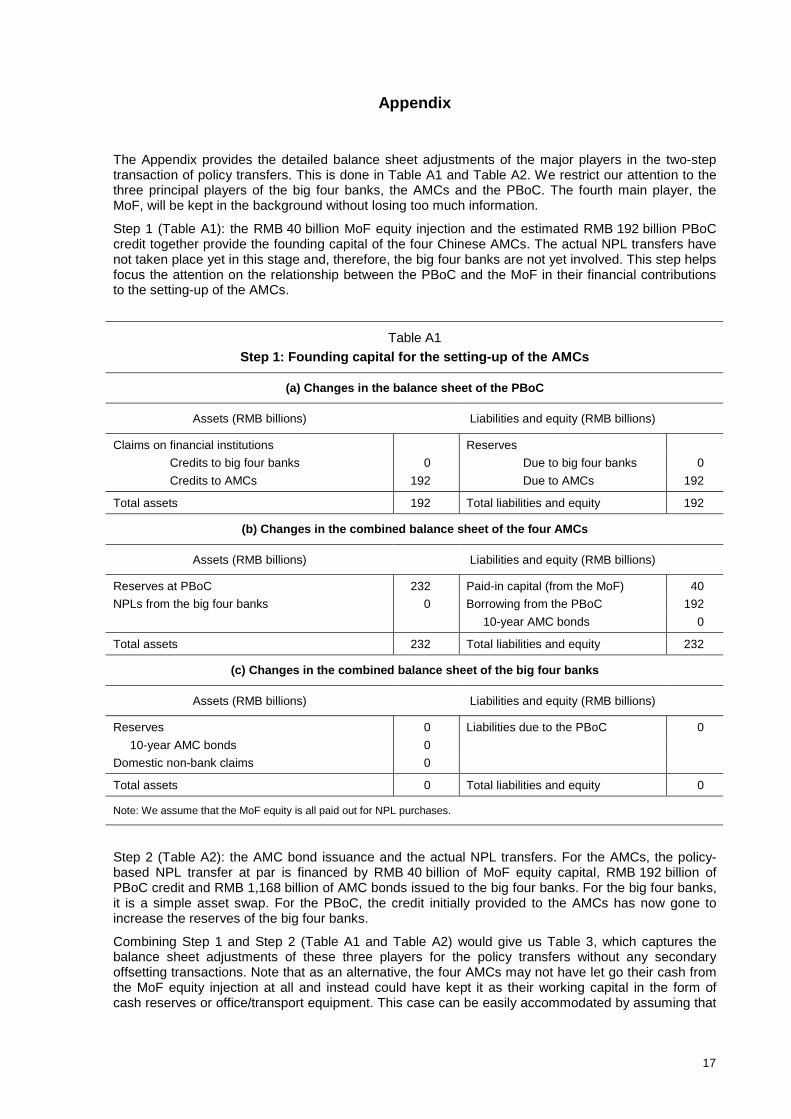
Appendix
The Appendix provides the detailed balance sheet adjustments of the major players in the two-step transaction of policy transfers. This is done in Table A1 and Table A2. We restrict our attention to the three principal players of the big four banks, the AMCs and the PBoC. The fourth main player, the MoF, will be kept in the background without losing too much information.
Step 1 (Table A1): the RMB 40 billion MoF equity injection and the estimated RMB 192 billion PBoC credit together provide the founding capital of the four Chinese AMCs. The actual NPL transfers have not taken place yet in this stage and, therefore, the big four banks are not yet involved. This step helps focus the attention on the relationship between the PBoC and the MoF in their financial contributions to the setting-up of the AMCs.
Table A1 Step 1: Founding capital for the setting-up of the AMCs
(a) Changes in the balance sheet of the PBoC
Assets (RMB billions) Liabilities and equity (RMB billions)
Claims on financial institutions Reserves Credits to big four banks 0 Due to big four banks 0 Credits to AMCs 192 Due to AMCs 192
Total assets 192 Total liabilities and equity 192
(b) Changes in the combined balance sheet of the four AMCs
Assets (RMB billions) Liabilities and equity (RMB billions)
Reserves at PBoC 232 Paid-in capital (from the MoF) 40 NPLs from the big four banks 0 Borrowing from the PBoC 192
10-year AMC bonds 0
Total assets 232 Total liabilities and equity 232
(c) Changes in the combined balance sheet of the big four banks
Assets (RMB billions) Liabilities and equity (RMB billions)
Reserves 0 Liabilities due to the PBoC 0 10-year AMC bonds 0
Domestic non-bank claims 0
Total assets 0 Total liabilities and equity 0
Note: We assume that the MoF equity is all paid out for NPL purchases.
Step 2 (Table A2): the AMC bond issuance and the actual NPL transfers. For the AMCs, the policy-based NPL transfer at par is financed by RMB 40 billion of MoF equity capital, RMB 192 billion of PBoC credit and RMB 1,168 billion of AMC bonds issued to the big four banks. For the big four banks, it is a simple asset swap. For the PBoC, the credit initially provided to the AMCs has now gone to increase the reserves of the big four banks.
Combining Step 1 and Step 2 (Table A1 and Table A2) would give us Table 3, which captures the balance sheet adjustments of these three players for the policy transfers without any secondary offsetting transactions. Note that as an alternative, the four AMCs may not have let go their cash from the MoF equity injection at all and instead could have kept it as their working capital in the form of cash reserves or office/transport equipment. This case can be easily accommodated by assuming that

18
the four AMCs issue RMB 1,208 billion of AMC bonds instead of RMB 1,168 billion of AMC bonds in Table A2. In this scenario, the big four banks would receive from the AMCs RMB 192 billion in cash and RMB 1,208 billion in AMC bonds for the policy-driven carving-out of the RMB 1.4 trillion NPLs. The overall analysis would not be affected materially.
Table A2 Step 2: AMC bond issues and policy-based NPL transfers
(a) Changes in the balance sheet of the PBoC
Assets (RMB billions) Liabilities and equity (RMB billions)
Claims on financial institutions Reserves Credits to big four banks 0 Due to big four banks 192 Credits to AMCs 0 Due to AMCs -192
Total assets 0 Total liabilities and equity 0
(b) Changes in the combined balance sheet of the four AMCs
Assets (RMB billions) Liabilities and equity (RMB billions)
Reserves at PBoC -232 Paid-in capital (from the MoF) 0 NPLs from the big four banks 1,400 Borrowing from the PBoC 0
10-year AMC bonds 1,168
Total assets 1,168 Total liabilities and equity 1,168
(c) Changes in the combined balance sheet of the big four banks
Assets (RMB billions) Liabilities and equity (RMB billions)
Reserves 232 Liabilities due to the PBoC 0 10-year AMC bonds 1,168
Domestic non-bank claims -1,400
Total assets 0 Total liabilities and equity 0
Note: We assume that the MoF equity is all paid out for NPL purchases.
19
References
Bank of China (2000): Bank of China Annual Report 2000, Beijing.
Basel Committee on Banking Supervision (1988): International convergence of capital measurement and capital standards, Basel Committee Publications no 4, Basel, July.
BBC (2002): “China’s central bank governor details commercial bank’ bad loans”, BBC Monitoring Service, United Kingdom, 25 March.
China Construction Bank (1999): China Construction Bank Annual Report 1999, Beijing.
Claessens, Stijn, Daniel Klingebiel and Luc Laeven (2001): “Financial restructuring in banking and corporate sector crises: what policy to pursue?”, World Bank Working Paper, World Bank, Washington DC, April.
Crockett, Andrew (1998): From banking crisis to solid macroeconomic growth: lessons for Japan from other industrial countries, speech at the IMF-Kobe University Symposium, Kobe, 14 July.
Dai, Xianglong (2001): speech at the Beijing 2001 NPL Forum, October, Beijing.
Dornbusch, Rudi and Francesco Giavazzi (1999): “Heading off China’s financial crisis”, in BIS Policy Papers, no 7, Strengthening the banking system in China: issues and experience, October, Basel, pp 40-58.
Dziobek, Claudia and Ceya Pazarbasioglu (1997): “Lessons from systemic bank restructuring: a survey of 24 countries”, IMF Working Paper, WP/97/161, International Monetary Fund, Washington DC, December.
Gao, Cailin (2001): “The influence of bad assets on inflation and monetary policy”, China Finance (Zhongguo Jinrong), no 5, pp 17-23.
Huarong Asset Management Corporation (2001): An introduction to China Huarong Asset Management Corporation, Beijing.
Klingebiel, Daniela (2000): “The use of asset management companies in the resolution of banking crisis – cross-country experiences”, World Bank Working Paper, World Bank, Washington DC.
Lague, David (2001): “A finger in the dyke”, Far Eastern Economic Review, vol 164, no 50, 20 December, pp 30-2.
Lardy, Nicholas (1998): China’s unfinished economic revolution, Brookings Institution Press, Washington DC.
——— (1999): “The challenges of bank restructuring in China”, in BIS Policy Papers, no 7, Strengthening the banking system in China: issues and experience, October, Basel, pp 17-39.
——— (2001): “China’s worsening debts”, Financial Times, 22 June, p 13.
Lau, Lawrence (1999): “The macroeconomy and reform of the banking sector in China”, in BIS Policy Papers, no 7, Strengthening the banking system in China: issues and experience, October, Basel, pp 59-89.
Lindgren, Carl-Johan, Tomas J T Balino, Charles Enoch, Anne-Marie Gulde, Marc Quintyn and Leslie Teo (1999): “Financial sector crisis and restructuring: lessons from Asia”, IMF Occasional Paper 188, International Monetary Fund, Washington DC.
Liu, Guangming (2001): Cooperation between the AMCs and banks in NPL disposition, 2 November, Development Research Centre of the State Council, Beijing.
Liu, Shiyu (1999): “China’s experience in small and medium financial institution resolution”, in BIS Policy Papers, no 7, Strengthening the banking system in China: issues and experience, October, Basel, pp 298-303.
Lou, Jiwei (2001): speech at the Beijing 2001 NPL Forum, October, Beijing.
Ministry of Finance (2001): Incentives measures for disposal of non-performing assets held by asset management corporations (tentative), Beijing, November.
Mo, Y K (1999): “A review of recent banking reforms in China”, in BIS Policy Papers, no 7, Strengthening the banking system in China: issues and experience, October, Basel, pp 90-109.
20
Sheng, Andrew (ed) (1996): Bank restructuring: lessons from the 1980s, The World Bank Press, Washington DC.
Standard and Poor’s (2001a): Global financial system stress, 9 October.
——— (2001b): Bank industry risk analysis: China, 24 October.
——— (2002): Lower recovery rates exacerbate problem assets for banks in emerging Asia, 17 April.
State Council (2000): Regulations on financial asset management corporations, Executive Order no 297 of the State Council of the People’s Republic of China, November, Beijing.
Tang, Shuangning (2001a): “From debt-equity swap to equity-cash conversion”, China Finance (Zhongguo Jinrong), no 2, pp 16-20.
——— (2001b): “Dealing with NPLs and mitigating financial risks”, China Finance (Zhongguo Jinrong), no 1, pp 20-1.
Yang, Kaisheng (2001): The patterns and features of Chinese AMCs, China Huarong Asset Management Corporation website http://www.chamc.com.cn, 26 September.
Zhu, Dengshan, Yang Kaisheng, Wang Xingyi and Bai Shizhen (2001a): conference speeches at the Beijing 2001 NPL Forum, October, Beijing.
——— (2001b): “The development of China’s financial asset management corporations”, Economic Daily (Jingji Ribao), 14 November, Beijing.

21
Recent BIS Working Papers
No Title Author
114 July 2002
Asset prices, financial and monetary stability: exploring the nexus
Claudio Borio and Philip Lowe
113 July 2002
The link between default and recovery rates: effects on the procyclicality of regulatory capital ratios
Edward I Altman, Andrea Resti and Andrea Sironi
112 June 2002
Determinants of international bank lending to emerging market countries
Serge Jeanneau and Marian Micu
111 April 2002
Output trends and Okun’s law Gert Schnabel
110 March 2002
A survey of the institutional and operational aspects of modern-day currency boards
Corrinne Ho
109 January 2002
Optimal dynamic hedging using futures under a borrowing constraint
Akash Deep
108 December 2001
The determinants of private sector credit in industrialised countries: do property prices matter?
Boris Hofmann
107 December 2001
Bank runs, welfare and policy implications Haibin Zhu
106 December 2001
Bank runs without self-fulfilling prophecies Haibin Zhu
105 December 2001
Macroeconomic news and the euro/dollar exchange rate Gabriele Galati and Corrinne Ho
104 September 2001
The changing shape of fixed income markets Study group on fixed income markets
103 August 2001
The costs and benefits of moral suasion: evidence from the rescue of Long-Term Capital Management
Craig Furfine
102 August 2001
Allocating bank regulatory powers: lender of last resort, deposit insurance and supervision.
Charles M Kahn and João A C Santos
101 July 2001
Can liquidity risk be subsumed in credit risk? A case study from Brady bond prices.
Henri Pagès
100 July 2001
The impact of the euro on Europe’s financial markets Gabriele Galati and Kostas Tsatsaronis
99 June 2001
The interbank market during a crisis Craig Furfine
98 January 2001
Money and inflation in the euro area: a case for monetary indicators?
Stefan Gerlach and Lars E O Svensson
97 December 2000
Information flows during the Asian crisis: evidence from closed-end funds
Benjamin H Cohen and Eli M Remolona
96 December 2000
The real-time predictive content of money for output Jeffery D Amato and Norman N Swanson
95 November 2000
The impact of corporate risk management on monetary policy transmission: some empirical evidence
Ingo Fender
94 November 2000
Corporate hedging: the impact of financial derivatives on the broad credit channel of monetary policy
Ingo Fender
93 October 2000
Trading volumes, volatility and spreads in foreign exchange markets: evidence from emerging market countries
Gabriele Galati
92 October 2000
Recent initiatives to improve the regulation and supervision of private capital flows
William R White