BIS Working Papers · always remains high due to their operational needs for dollar funding. As a...
40
BIS Working Papers No 843 Dollar borrowing, firm- characteristics, and FX-hedged funding opportunities by Leonardo Gambacorta, Sergio Mayordomo and Jose Maria Serena Monetary and Economic Department February 2020 JEL classification: E44, F3, F55, G12, G15, G23, G28, G32. Keywords: covered interest rate parity, credit spread, debt issuance, dollar convenience yield, foreign exchange rate hedge, limits of arbitrage.
Transcript of BIS Working Papers · always remains high due to their operational needs for dollar funding. As a...

BIS Working Papers No 843 Dollar borrowing, firm-characteristics, and FX-hedged funding opportunities by Leonardo Gambacorta, Sergio Mayordomo and Jose Maria Serena
Monetary and Economic Department
February 2020
JEL classification: E44, F3, F55, G12, G15, G23, G28, G32.
Keywords: covered interest rate parity, credit spread, debt issuance, dollar convenience yield, foreign exchange rate hedge, limits of arbitrage.

BIS Working Papers are written by members of the Monetary and Economic Department of the Bank for International Settlements, and from time to time by other economists, and are published by the Bank. The papers are on subjects of topical interest and are technical in character. The views expressed in them are those of their authors and not necessarily the views of the BIS.
This publication is available on the BIS website (www.bis.org).
© Bank for International Settlements 2020. All rights reserved. Brief excerpts may be reproduced or translated provided the source is stated.
ISSN 1020-0959 (print) ISSN 1682-7678 (online)

1
Dollar borrowing, firm-characteristics, and FX-hedged funding opportunities1
Leonardo Gambacorta∗†, Sergio Mayordomo§, and Jose Maria Serena∗
∗Bank for International Settlements, § Banco de España, and †CEPR
Abstract
We explore the link between firms’ dollar bond borrowing and their FX-hedged funding
opportunities, as reflected in a positive corporate basis (the relative cost of local to synthetic
currency borrowing). Consistent with previous research, we first document that firms substitute
domestic for dollar borrowing when they have higher dollar revenues or long-term assets and
when the corporate basis widens. Importantly, our novel firm-level dataset enables to show that
when these funding opportunities appear, the currency substitution is stronger for high-grade
firms, as they can offer to investors close substitutes for safe dollar assets. However, firms with
higher dollar revenues or long-term assets do not react to changes in the corporate basis.
Altogether, the composition of dollar borrowers shifts when the basis widens, as high-grade
firms gain importance, relative to firms with operational needs.
JEL Code: E44, F3, F55, G12, G15, G23, G28, G32.
Keywords: Covered interest rate parity, credit spread, debt issuance, dollar convenience yield, foreign exchange rate hedge, limits of arbitrage.
1 The authors thank Hyun Song Shin, Robert McCauley, Patrick McGuire, Andreas Schrimpf, Vlad Sushko, Egon Zakrajsek, and participants at a BIS Research Meeting. Sergio Mayordomo developed parts of this project while visiting the Bank for International Settlements under the Central Bank Research Fellowship Programme. The views expressed are those of the authors and do not necessarily reflect those of the Banco de España or the Bank for International Settlements.

2
1. Introduction
Dollar bonds constitute the major alternative to local currency debt for non-US firms, an aspect
which research relates to favorable funding conditions or strong operational needs. For
instance, non-US firms with dollar revenues (Gopinath and Stein, 2019) or long-term assets
(Allayannis et al., 2001) may issue dollar bonds to hedge their asset-side exposures.
Simultaneously, dollar borrowing is associated with strong safe asset demand that could lead
to FX-hedged cost-saving opportunities (Liao, 2017), in particular for high-grade issuers as
shown by Krishnamurthy and Lustig (2019). In any case, dollar borrowing seems intimately
related to various firm-level attributes, whose role may change over time.
In this paper, we study how dollar borrowing by non-financial firms headquartered in advanced
economies relates to both firm attributes and FX-hedged funding opportunities. The latter arise
when the corporate basis, defined as the relative cost of local to synthetic currency borrowing,
turns positive. For instance, a positive dollar-euro corporate basis opened in 2012, reflecting
that issuing bonds in dollars and swapping the proceeds back into euros was cheaper than
directly borrowing in euros.2 We find that, on average, non-US firms increase their dollar
issuances when the corporate basis widens but the response differs across types of firm. Very
high-grade firms react more to the widening of the corporate basis, since they can offer to
investors closer substitutes for safe dollar assets. Firms with dollar revenues or long-term assets
do not respond to changes in the corporate basis, although their share of dollar borrowing
always remains high due to their operational needs for dollar funding.
As a first step of our analysis, we estimate the corporate bases for a series of currencies, relative
to the US dollar. We follow the well-established method used by Gilchrist, Yankov and
Zakrajsek (2009), Gilchrist and Zakrajsek (2012), and Liao (2017) and obtain the residualized
credit spread for each currency as a residual from a cross-sectional regression of bond spreads,
controlling for bond and firm-specific characteristics. We select all the bonds issued by the
subsample of non-financial firms that have issued bonds in at least one currency. Then we
estimate a bond-pricing model, regressing the spread over swap rates of the corporate bonds
on a number of bond and issuer-characteristics, including a dummy for each currency of
denomination. The estimated coefficients for these currency dummy variables are the ones that
determine the residualized credit spreads, which following Liao (2017) we interpret as
2 The strong dollar demand during this period led to the widening of the CIP deviation, which became large enough to compensate for the bond yield differentials.

3
differences in the price of credit risk across currencies. For instance, the differential in the price
of credit risk of the pairwise EUR-USD is the difference between the coefficients associated
with the euro (EUR) and the dollar (USD) dummy variables. Finally, we obtain the corporate
basis as the sum of the cross-currency basis (ie the deviation from the covered interest rate
parity, CIP), and the residualized corporate credit spread (ie the deviation in the price of risk
across currencies).
Importantly, in the analysis we use the corporate basis, which is a risk-adjusted differential in
the corporate covered credit spread, obtained comparing the yields of bonds of same issuers in
pairs of currencies (Liao, 2017). Such a comparison is particularly needed for the analysis of
the bond market in the last decade, when discrepancies in the price of risk might have widened,
constituting a major source of funding opportunities. This differentiates our paper from
previous research, which uses broader measures for FX-hedged funding opportunities
(McBrady et al., 2013; Black and Munro, 2010), or sovereign yield differentials (McBrady and
Schill, 2007).
In our baseline analysis, we focus on non-financial companies headquartered in the euro area,
Japan, United Kingdom, Switzerland, and Canada, analysing their bond issuances during the
period 2007–2016 in the respective local currency, and the dollar. The sample selection seeks
to focus the analysis on the firms that borrow across currencies for both operational needs
and/or cost-saving reasons. Our focus on the main advanced economies allows us to leave aside
possible concerns regarding borrowings due to incomplete home-currency markets. In other
words, our dataset ensures us to work under the hypothesis that market frictions are limited and
that currencies are quite close substitutes for the issuers. This is important since previous
research has shown that market incompleteness is a driver of foreign currency issuance for
companies in emerging economies - for instance, if they need to raise long term funding (Black
and Munro, 2010).
Our model of currency switching is based on Allayannis, Brown, and Klapper (2003) and
Bruno and Shin (2017). The dependent variable is the fraction of dollar to total (dollar plus
local) bond borrowing, at the firm-quarter level. Given that a linear prediction of a proportion
variable bounded between zero and one could lead to some specification errors (Cook et al.
2008), we use a generalized linear model (GLM) with a logistic link function as in O’Connor
Keefe and Yaghoubi (2016). We explore how the share of dollar borrowing relates to the
corporate basis and two key firm-level attributes: their operational needs – reflected in dollar

4
revenues and long-term assets – and their credit risk. As control variables, we include a
comprehensive number of firm-specific and time-varying demand factors of foreign currency
borrowing.
As anticipated above, our first finding is that a widening of the corporate basis has a positive
impact on the share of dollar bonds as a fraction of total (dollar plus local currency) bond
borrowing. This indicates that, when cost-saving opportunities arise, non-US firms increase
dollar borrowings. The analysis of different subsamples shows that this result is stronger over
the period 2013-2016, when distortions in credit markets and CIP deviations were larger. We
find similar results when we examine the substitution between local currency and EUR
borrowing by non-euro area firms confirming that firms respond to funding opportunities
associated with covered FX borrowing independently of the currency employed as the one of
reference.
Our results relate our paper to the literature on dollar borrowing, considering firms as
opportunistic borrowers such as Black and Munro (2010), McBrady et al. (2013) or Liao
(2017). Our major contribution is the analysis of firms’ responses to cost-saving opportunities
depending on two firms’ crucial attributes: their credit risk and their asset-side exposures to the
dollar.
We proceed in two steps. First, to examine the role of firms’ credit risk, we augment the
baseline empirical model adding interactions between the corporate basis and proxies for the
firm’s risk (measured with the rating, an Altman Z-score-based measure, and the distance-to-
default). We find that the dollar-borrowing share of safer firms is more sensitive to the
corporate basis. This suggests that they can offer to investors close substitutes of safe dollar
assets (Krisnamurthy and Lustig, 2019).
Second, we explore the role of dollar asset-side exposures, measured with their dollar revenues
and long-term assets.3 We find that the share of dollar borrowing is higher for firms with dollar
long-term assets or revenues, which suggests that firms match the currency composition of
asset and liabilities. This is consistent with the hypothesis that the importance of the dollar in
3 We use data on the supplementary notes of firm financial statements to measure firms’ dollar assets exposures. In these notes companies breakdown their financial statements (balance-sheet, income and cash-flow statements) by key operating segments. In particular, we use the geographical breakdown of financial statements, in which firms detail the countries that account for a material fraction of their revenues or assets to proxy if a firm has dollar exposures (i.e., it is exposed to the United States or the Americas) or not. We posit that a firm has dollar asset-side exposures if has long-term assets or revenues in dollars. Data limitations prevent us exploring the role of euro asset-side exposures.

5
international debt markets relates to dollar invoicing in international trade (Gopinath and Stein,
2019), and also with the findings of Allayannis et al. (2001), Aabo (2006), or Hoberg and Moon
(2017), among others. In addition, we show that firms with local (and no dollar) asset exposures
increase their dollar borrowing when the corporate basis widens. This novel evidence suggests
that they substitute local for synthetic local borrowing. We confirm that this result is not related
to firms’ size, orthogonalizing asset-side exposures and total assets.
Altogether, our results underscore that firm-level attributes are key determinants of their
reliance on dollar bond borrowing. Firms with dollar asset-side exposures borrow in dollars to
hedge them independently of the sign of the corporate basis. Firms also issue dollar bonds to
exploit FX-hedged cost-saving opportunities – but firm attributes play an important role. Safe
firms and those without dollar asset-side exposures represent the type of firms that respond
more frequently to such opportunities.4 As a result, the widening of the corporate basis changes
the composition of dollar borrowers: issuers became safer, and the fraction of borrowers with
dollar assets or revenues decreases.
The rest of the paper is structured as follows. Section 2 discusses the data. Section 3 presents
the empirical model used to obtain covered credit spreads. Section 4 describes the model used
to study currency choice. Section 5 summarizes the main results on dollar borrowing by non-
US firms and presents several extensions and robustness tests. In Section 6, we show that the
risky firms and those with no assets and revenues in dollar are more sensitive to cost-saving
opportunities. Section 7 summarises the main conclusions.
2. Data
We construct a matched firm-bond level dataset, merging firms’ financial statements with their
bond issuances on a consolidated basis. More specifically, our sample consists of 7,211 non-
financial firms that were constituents of the main global equity indexes as of December 2016.5
We restrict our sample to companies headquartered in the United States, the euro area, Japan,
the United Kingdom, Switzerland, and Canada. This sample selection seeks to focus our
analysis on those firms that borrow across currencies for hedging operational needs and/or
opportunistic reasons but not due to incomplete home-currency markets. The distribution of
4 For instance, Nippon Telegraph is an example of a very high-grade Japanese corporation with no dollar exposure, which has tapped dollar bond markets recently, as the JPY-USD corporate basis has turned positive. 5 Bloomberg Global Index plus additional major indices: Bloomberg European 500 Index, FTSE 350, CRSP US Total Market Index, S&P/ASX 200 Index, FTSE All-Share Index, S&P/Toronto Stock Exchange Composite Index, FTSE Canada Index.

6
firms across the six economic areas listed before is as follows: 2,450 of firms are based in the
United States, 395 in the euro area, 448 in Japan, 301 in the United Kingdom, 193 in Canada,
and 136 in Switzerland.
Besides the information on financial statements (assets and liabilities balance-sheet, cash-flow,
and income statements), our dataset contains information on the firm functional currency, its
two-digit North American Industry Classification System (NAICS) code, and the firm
International Securities Identification Number (ISIN). The functional currency indicates the
currency associated with the environment where the company conducts most of its activity.
Multinationals usually conduct part of their activities using other currencies. Thus, if firms seek
to match the currency composition of assets and liabilities, they might raise foreign currency
debt. The NAICS code is an industry identifier that serves as a proxy for (time-invariant)
operational demand for foreign currency. Finally, we use the ISIN as a common identifier,
which is available for all companies in our database since all firms are listed.6
In addition to firm-level information, we retrieve (from Thompson Reuters Eikon) all the bonds
issued by non-financial corporations over the period 2007Q1–2016Q4. Bond information
includes the amount, currency of denomination, issuance and maturity date. For each bond, we
identify the direct issuer, the guarantor, and the ultimate parent company of the issuer. This
information is essential for a proper matching with the firm dataset, given that we classify
bonds as liabilities of the guarantor. If no entity explicitly guarantees them, bonds are classified
as liabilities of the ultimate parent company and if the company is not an affiliate, they are
classified as liabilities of the direct issuer. This is equivalent to consolidating bonds at the
ultimate parent level, but treating standalone affiliates (which issue bonds without the legal
backing of its parent companies) as independent companies. Next, we construct firm-quarter
series of bond issuances, with currency breakdowns for: US dollar, euro, British pound, Swiss
franc, Japanese yen, and Canadian dollar. In the analysis, when this does not create confusion,
we will identify the “US dollar” simply as the dollar.
The two datasets are matched using the firm ISIN, which uniquely identifies entities in both
datasets. Table 1 shows descriptive statistics for key firm-level variables for non-US firms
issuing dollar bonds and for non-euro area (EA) firms issuing EUR bonds.
6 We drop duplicated firms in case a company has more than one common share. All the data is from Thompson Reuters Eikon.

7
< Insert Table 1 here >
Table 2 reports information on the number of bonds issued in each of the six currencies over
time in total (Panel A), by local (Panel B) and by foreign (Panel C) issuers in our sample. The
US dollar and the euro are the two foreign currencies most widely used in bond issuances. We
will conduct our baseline analysis on the issuances in US dollars as the foreign currency, while
we will use the euro for some checks. There are insufficient bond issuances in other foreign
currencies for us to conduct a proper econometric analysis.
< Insert Table 2 here >
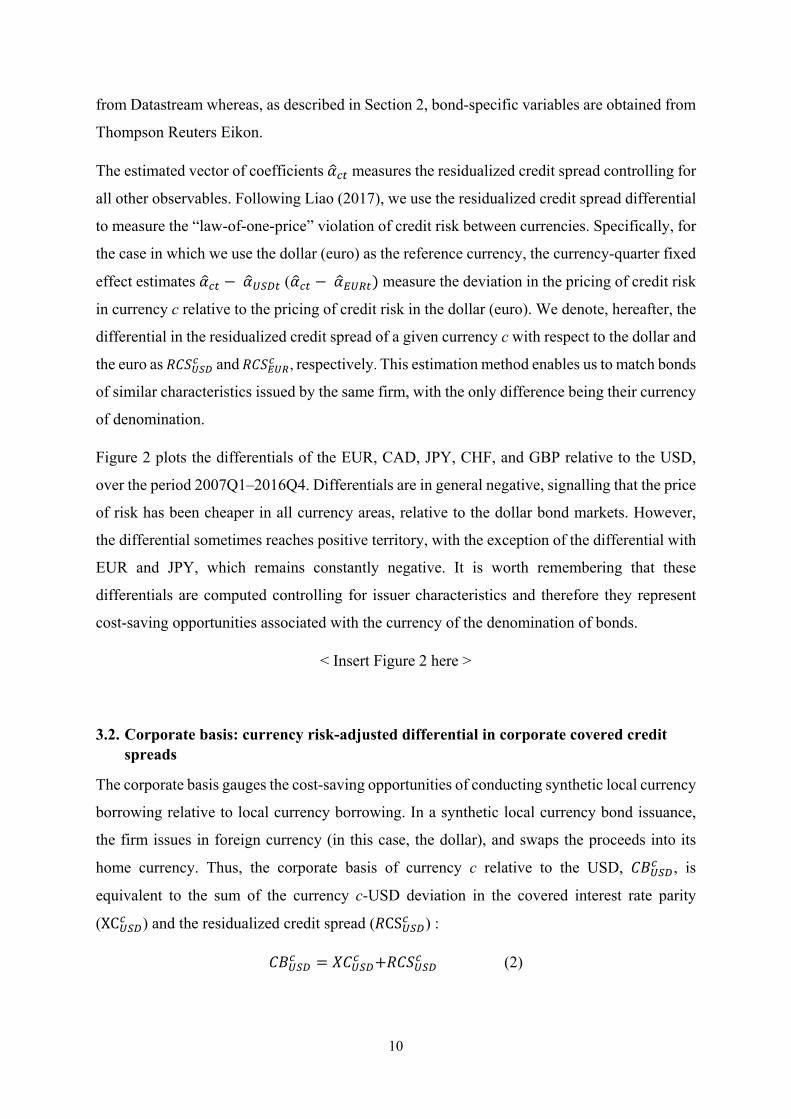
We exclude US firms from our baseline analysis. Unlike firms in any of the other five
countries/economic areas, US firms finance themselves mainly in dollars and the proportion of
bonds issued in foreign currency is only around 10% (see Figure 1). Given such a home bias,
it seems reasonable to exclude them when studying the substitution of local vs foreign currency
bonds. Nevertheless, we extend the baseline analysis to include US firms considering issuances
in EUR as the foreign currency (ie, the second most frequent currency for bond issuances in
foreign currency), which will help us to validate the main results. The distribution of firms
issuing dollar bonds by region is the following: 253 in Japan, 208 in the Euro Area, 126 in the
United Kingdom, 101 in Canada, and 41 in Switzerland.
< Insert Figure 1 here >
We also use information on the prices of all bonds (denominated in any of the six currencies)
issued by any firm around the world to obtain the residualized corporate basis, as will be
detailed in the next section. Finally, we use the supplementary notes of the financial statements,
available at Thompson Reuters Eikon, to measure firms’ dollar assets exposures. These notes
are compulsory under IFRS and the US GAAP – to which all firms in our sample are subject –
and include additional information not included in the balance-sheet, income, and cash-flow
statements. Specifically, we exploit the fact that companies break down some financial
statement items by key operating segment, such as business lines and geographical regions.7
We focus on the geographical breakdown of long-term assets and revenues. The appendix
contains an example for one firm in our sample.
We examine the full list of categories (names of countries and regions) and define as a “dollar
region” either the United States or the Americas region, when the information is not detailed
7 These breakdowns seek to show which business lines/regions are important for firms, and to illustrate how they contribute to companies’ financial performance.

8
at country level but at a broader region level. Thus, we assume that a given firm has dollar
asset-side exposures if it has long-term assets in, or revenues from, the “dollar region”. To
compute these exposures, we use the last available financial statement for each firm. We are
assuming that any exposure to the Americas region implies some exposure to the dollar and
that the exposures are relatively uniform through the whole sample period. We explore the
evolution of the geographical breakdown of exposures for a handful of firms of different
sectors, and conclude that the above assumption is not restrictive, since exposures tend to be
stable over time.8
3. Measuring the corporate basis
We gauge the cost-saving opportunities of conducting synthetic local currency borrowing
relative to local currency borrowing by calculating a measure of corporate basis. The corporate
basis is the sum of the currency c-USD deviation in the covered interest rate parity, and the
differential in the residualized credit spread. The more positive the corporate basis, the cheaper
it is to borrow in the foreign currency relative to home currency borrowing.
3.1. Residualized corporate credit spreads
We use individual bond yields to compute the residualized credit spreads, which are
differentials in credit risk spreads across currencies. We follow the methodology proposed by
Liao (2017), and hence we estimate these differentials from monthly corporate bond spreads,
which are calculated as the average bond yield in a given month over the swap rate with a
similar maturity.
Our initial database includes a total of 147,579 bonds issued during the period 2004Q1–
2016Q4 by any firm around the world with a maturity at issuance equal or larger than one year.
Since we are interested in price differentials between the six major currencies: US dollar
(USD), euro, (EUR) British pound (GBP), Swiss franc (CHF), Japanese yen (JPY), and
Canadian dollar (CAD). Hence, we disregard bonds issued in other currencies. In addition, we
exclude all bonds without an ISIN, since we need it to match bond prices in secondary markets.
This leaves us with 50,971 bonds, for which we have the original and residual maturity, amount
issued, and currency of denomination. Finally, we drop callable bonds and those in which the
8 Constructing a time-varying measure is difficult, as the lack of harmonisation over time unfortunately does not allow a perfect comparison among the categories that need to be examined. Since exposures tend to be stable over time, we think there is little gain in defining a time-varying measure.

9
issuer is not identified. The final sample consists of 40,614 corporate bonds, which have been
issued by a total of 5,082 companies.9
To construct differentials in how credit risk is priced across pairs of currencies, we restrict our
analysis to those issuers with outstanding bonds in at least two of the six currencies considered
in our analysis, one of them being the reference currency. We construct two differentials in
which the currencies of reference are the US dollar and the euro. Thus, for the case in which
the US dollar (euro) is the reference currency, we use issuers with outstanding bonds in both
the US dollar (euro) and any of the other five currencies. In total 416 (398) firms, out of the
5,082 firms considered, have issued bonds in US dollar (euro) and any other of the remaining
five currencies over the sample period. Issuance in more than two currencies is infrequent: 103
firms have issued in three currencies, 45 in four, 24 in five, and 12 in the six currencies
considered.
The number of bonds issued by companies that tap more than one currency market at the same
time is 6,130 conditioned on having issued in dollars and 6,058 conditioned on having issued
in euros. Next, we estimate for each quarter t the following cross-sectional regression, in which
the bond spread over the swap curve for each bond i, denominated in currency c, issued by firm
f , with time-to-maturity m, age a, and rating r, is regressed on a series of bond characteristics,
an issuer dummy, and a currency dummy: 𝑆 = 𝛼 + 𝛽 + 𝛾 + 𝜃 + 𝛿 + 𝜀 , 𝑡 = 2004𝑄1, … , 2016𝑄4 (1)
where 𝛼 denotes a vector of currency-quarter fixed effects (ie, dummy variables that are equal
to one for each quarter and each of the six currencies considered in our paper, where c = CAD,
CHF, EUR, GBP, JPY, USD) and zero otherwise. 𝛽 indicates firm fixed effects, which control
for any other bond characteristics that are common at the firm level (ie, industry, location,…).
We classify bonds in several buckets of maturities (ie, 1-3 years, 3-7 years, 7-10 years, and
more than 10 years) and use a set of fixed effects for each of these buckets (𝛾 ). Another
important dimension to consider is the bond term and for this reason we use fixed effects for
five age buckets (𝜃 ): less than 1 year, 1-3 years, 3-7 years, 7-10 years, and more than 10 years.
In addition, we use fixed effects for investment grade and high-yield rating categories (𝛿 )
based on Standard & Poor’s ratings on long-term debt. The bonds whose rating is not available
are classified in the same bucket as those with high-yield category. Bond spreads are retrieved
9 As in the firm-bond level dataset, we define the issuer as the bond-guarantor, ultimate parent company of the issuer, or direct issuer.
10
from Datastream whereas, as described in Section 2, bond-specific variables are obtained from
Thompson Reuters Eikon.
The estimated vector of coefficients 𝛼 measures the residualized credit spread controlling for
all other observables. Following Liao (2017), we use the residualized credit spread differential
to measure the “law-of-one-price” violation of credit risk between currencies. Specifically, for
the case in which we use the dollar (euro) as the reference currency, the currency-quarter fixed
effect estimates 𝛼 − 𝛼 (𝛼 − 𝛼 ) measure the deviation in the pricing of credit risk
in currency c relative to the pricing of credit risk in the dollar (euro). We denote, hereafter, the
differential in the residualized credit spread of a given currency c with respect to the dollar and
the euro as 𝑅𝐶𝑆 and 𝑅𝐶𝑆 , respectively. This estimation method enables us to match bonds
of similar characteristics issued by the same firm, with the only difference being their currency
of denomination.
Figure 2 plots the differentials of the EUR, CAD, JPY, CHF, and GBP relative to the USD,
over the period 2007Q1–2016Q4. Differentials are in general negative, signalling that the price
of risk has been cheaper in all currency areas, relative to the dollar bond markets. However,
the differential sometimes reaches positive territory, with the exception of the differential with
EUR and JPY, which remains constantly negative. It is worth remembering that these
differentials are computed controlling for issuer characteristics and therefore they represent
cost-saving opportunities associated with the currency of the denomination of bonds.
< Insert Figure 2 here >
3.2. Corporate basis: currency risk-adjusted differential in corporate covered credit spreads
The corporate basis gauges the cost-saving opportunities of conducting synthetic local currency
borrowing relative to local currency borrowing. In a synthetic local currency bond issuance,
the firm issues in foreign currency (in this case, the dollar), and swaps the proceeds into its
home currency. Thus, the corporate basis of currency c relative to the USD, 𝐶𝐵 , is
equivalent to the sum of the currency c-USD deviation in the covered interest rate parity
(XC ) and the residualized credit spread (𝑅CS ) : 𝐶𝐵 = 𝑋𝐶 +𝑅𝐶𝑆 (2)

11
Following Liao (2017), we measure the deviation in the interest parity by means of the five-
year cross-currency swap basis. Persistent and wide cross-currency swap bases (XC ) have
emerged for several currencies over the last years, as a result of strong FX hedging demand
and limits to arbitrage due to financial intermediaries’ balance-sheet constraints (Sushko et al.,
2016 and Du et al, 2018). Figure 3 depicts the corporate basis, which summarises the FX-
hedged funding opportunities for corporate borrowers. Positive corporate bases emerge for
several currencies despite negative residualized credit spreads, since constraints on the capacity
of intermediaries to provide FX hedges can result in the emergence of wider CIP deviations
(cross-currency basis). A positive EUR-USD basis means that borrowing in dollars and
swapping to euros saves some basis points. The corporate basis of euro area firms became
positive during short periods of 2009, 2011 and 2012 (see Figure 4).
< Insert Figures 3 and 4 here >
4. Empirical model
Our dependent variable is the fraction borrowed in dollar-denominated bonds by a given non-
US firm i, in country c , with rating category r, in quarter t relative to the sum of local currency
and dollar borrowing in that quarter (FCRicrt). This variable takes the value of one when all the
debt is raised in dollars, and zero when is raised in the home currency. To mitigate the
estimation problems derived from the fact that the dependent variable is a proportion variable
bounded between zero and one, we use a generalized linear model (GLM) with a logistic link
function as in O’Connor Keefe and Yaghoubi (2016):10 𝐸(𝐹𝐶𝑅 𝐶𝐵 , ,𝑌 = 𝐺(𝛼 + 𝛼 + 𝛼 + 𝛽 𝐶𝐵 , + 𝛽 𝑈𝑆𝐷 + 𝛾W + 𝛿Z + 𝜀 )
(3)
where G(.) is the logistic link function, 𝛼 ,𝛼 ,𝛼 indicate currency, year-quarter and rating
category fixed effects. The variable 𝐶𝐵 , refers to the corporate basis defined in equation (2)
and accounts for the funding opportunities in the local currency c in quarter t as compared to
dollar. 𝑈𝑆𝐷𝑖 is a dummy that is equal to one if the firm has long-term assets or revenues
denominated in dollars (ie, asset-side exposure). As discussed in the previous section, since we
focus on switching between the home currency and the dollar, we have defined the measures
of funding cost differentials in the home currency relative to the dollar. In addition we include
10 See Kieschnick and McCullough (2003) or Cook et al (2008) for more details on the specification errors in using a linear prediction equation to model a dependent variable that is a fraction.

12
a set of lagged firm specific control variables (W ) that capture time-varying characteristics
which can be related to ability to borrow in foreign currency. These firm characteristics are: (i)
firm size (measured with the logarithm of total assets), (ii) price-to-book ratio, (iii) operating
margin, (iv) a dummy variable that indicates if the firm had previously issued bonds in dollar
and (v) firm risk (measured by the leverage ratio).
Finally, we include several economic area/country lagged specific variables (Z ) that could
also affect the willingness of firms to borrow in foreign currency. These additional controls
are: (i) exchange rate volatility; (ii) public debt to GDP; (iii) current account balance to GDP;
(iv) GDP growth; and (v) the sovereign yield differential based on the five-year maturity. All
explanatory variables are standardized (ie, mean zero and standard deviation one) to facilitate
their interpretation and comparison. The standard errors are clustered at the currency- quarter
level.
5. Corporate basis and dollar borrowing by non-US firms
Table 3 contains the results obtained from the estimation of equation (3). Column (I) refers to
the whole sample period (ie, 2007Q1–2016Q4). We find that the corporate basis has a positive
impact on the ratio of the amount of bonds issued in dollar relative to total bond borrowing in
local currency and dollar. This is consistent with firms increasing their synthetic local
borrowing, that is, issuing dollar bonds and swapping them into their home market when cost-
saving opportunities arise. In columns (II) and (III) we split the sample in two periods: crisis
period (2007Q1–2012Q2) and post-crisis period (2012Q3–2016Q4). This split enables us to
verify that firms exploit funding opportunities in a significant way in the post-crisis period,
when bond issuance by the non-financial sector started to grow at a fast pace.11
< Insert Table 3 here >
The signs associated with the control variables are consistent with the different capital structure
theories summarized in Allayannis, Brown, and Klapper (2003) for the case of the currency
choice. The sign obtained for firm size is positive and significant, consistent with the market
depth hypothesis according to which large firms are more likely to exhaust local currency
lending markets and so depend to a greater extent on foreign markets.
11 We consider that the post-crisis period starts after ECB President Mario Draghi’s promise in May 2012 to do “whatever it takes” to preserve the euro.

13
The negative and significant sign obtained for leverage suggests that access to foreign financial
markets is more restricted for riskier firms, as will be analyzed in later sections in more detail.
The operating margin exhibits a positive coefficient, which is higher for the crisis period,
although not statistically significant. Firms that are more profitable tend to be less restricted to
access foreign financial markets in turbulent periods.
The dummy “previous issuer”, which indicates if the firm has issued dollar-denominated debt
in the past, is positive and significant. This result probably reflects the role of the monitoring
and agency cost theory according to which firms that issue debt in foreign markets are exposed
to closer scrutiny. In addition, these firms are able to develop a reputation effect in foreign
markets that make it easier for them to issue a larger stock of debt in foreign currencies.
Importantly, the sign associated with the dummy variable denoting the existence of dollar-
denominated assets or revenues is positive and significant. The latter finding is consistent with
the view that the roles of the dollar in trade and debt markets are intertwined (Gopinah and
Stein, 2018). It is also consistent with recent evidence of Aabo et al. (2015) in the European
context, showing that firms with direct asset exposure to euros, pounds, or Swedish kronar
issue, on average, more bonds denominated in these currencies for hedging purposes (see also
Allayannis et al., 2001; Aabo, 2006; or Hoberg and Moon, 2017; among others). The fact that
foreign currency asset-side exposures increase firms’ issue of bonds in foreign currency
suggests that firms aim at avoiding the build-up of balance-sheet currency mismatches.
In Table 4, we extend the baseline results reported in Table 3 to a different sample of non-euro
area firms by analyzing their EUR borrowing. In this case, we also consider US firms. The
number of EUR bonds issued by non-euro area firms is much smaller and, as a result, the
proportion of censored observations is much higher than in the analysis that uses the dollar as
the reference currency. Therefore, the results should be taken with caution. With this caveat in
mind, our main finding is that firms also respond to a positive corporate basis relative to the
EUR, increasing their fraction of EUR borrowing during the post-crisis period. This evidence
also supports the idea that firms may engage in synthetic local borrowing in euro area markets.
< Insert Table 4 here >
6. The role of firm-specific characteristics
6.1. Credit risk

14
The corporate basis tends to widen when CIP deviations are wider, which means that the
demand for dollar safe assets is stronger (Liao, 2017). High-grade firms are natural candidates
to benefit from this arbitrage funding opportunity, since as stated by Krishnamurthy and Lustig
(2019) they can offer to investors closer substitutes of dollar safe assets in a context of safe
assets’ scarcity. We now test whether the previous statement is true and explore if firms’
responses to funding opportunities depend on their risk as measured from their credit rating.
Thus, we extend equation (3) with the interaction of our measure of funding opportunities (CB)
and a dummy for very high-grade or safe firms: 𝐸(𝐹𝐶𝑅 |𝐶𝐵 ,𝑌𝑖𝑐𝑟𝑡−1) = 𝐺(𝛼 + 𝛼 + 𝛼 + 𝛽 CB + 𝛽 Safe + 𝛽 CB ∙Safe + 𝛽 𝑈𝑆𝐷 + 𝛽 𝐶𝐵 ∙ 𝑈𝑆𝐷 + 𝛾W + 𝛿Z + 𝜀 ) (4)
where Safeit-1 is a dummy variable that is equal to one if the firm’s rating is in the very high-
grade rating category, which we define as a rating above AA-, and zero if it is a high-yield, low
investment grade or a non-rated firm (hereafter we refer to them as the “control group”). To
interpret the interaction effect, we compute the marginal effect of a one standard deviation
increase in the CB on the share of dollar borrowing, for two types of firm: high-grade firms
and the control group.
The results are summarized in column (I) of Table 5. We find that only very high-grade firms
increase their dollar share in response to funding opportunities. Hence, the results indicate that
safe firms are more prone to currency migration because of investors’ appetite for dollar safe
assets. In column (II) of Table 5, we restrict the sample to those firms with a rating and results
are very similar.
One may argue that the effects associated with the firm rating category could be due, at least
in part, to the firm size, given that very high-grade firms are more than three times larger than
those in the control group. To disentangle the effect that is really due to firm risk but not to
firm size, we extend the analyses further by matching very high-grade firms and the control
group, according to their total assets. More specifically, we use coarsened exact matching
(CEM) techniques to balance the size of groups of very high-grade firms and the control group.
We use the baseline-matching algorithm (Iacus, King, and Porro, 2008) and obtain weights for
each observation to adjust the imbalance in the size of very high-grade firms and the ones in
the control group. Then, we run weighted regressions using the CEM weights. Since firms in a
very high-grade rating category are larger, this methodology overweights small firms with very

15
high-grade rating category (and large firms in the control group). The results are reported in
column (III) of Table 5 and are fully consistent with those in column (I) and (1I).
< Insert Table 5 here >
In columns (IV) to (IV), we extend the previous analysis to the issuances of bonds denominated
in euros. Importantly, once we use the CEM technique, we do not find a significant response
of safe firms to the deviations in the corporate basis. This may reflect that the positive corporate
bases relative to the euro are driven by the strong compression in credit spreads in euro-
denominated bonds (relative to home currency bond markets), and do not signal a strong
preference of euro-denominated safe assets by international investors.
In order to corroborate the above results, we consider additional proxies for firm risk and
estimate the GLM model using new CEM weights to adjust the imbalance in the size of safe
firms for each risk measure. The analysis is reported in Table 6. In column (II) we use a risk
measure based on the Altman Z-score (Altman, 1968). More specifically, we use a dummy
variable that is equal to one if the firm is above the percentile 75 of the distribution (ie, the Z-
score above 2.8). Results are fully consistent with those contained in column (I), which
reproduce column (III) of Table 5 for comparability reasons, and suggest that safe firms
arbitrage the deviations in the corporate basis to a higher extent. Column (III) contains the
results obtained for an alternative proxy that classifies firms as safe when the distance to default
is in the top quartile of the distribution for the firms in our sample. The distance to default is
obtained as in Bharath and Shumway (2008), who use a reduced-form model inspired by the
model to price corporate bond debt in Merton (1974). In this case the results are also
qualitatively similar.
< Insert Table 6 here >
6.2. Dollar assets
Dollar asset-side exposures increase firms’ dollar borrowing, since companies tend to match
the currency composition of asset and liabilities. For the same reason, they may dampen firms’
response to the corporate basis, which reflects the scope for substituting local for synthetic
local currency debt. To examine this aspect, we augment equation (3) with an interaction term
between the corporate basis and the dummy variable for asset-side dollar exposures used in
equation (2): 𝐸(𝐹𝐶𝑅 |𝐶𝐵 ,𝑌𝑖𝑐𝑟𝑡−1) = 𝐺(𝛼 + 𝛼 + 𝛼 + 𝛽 CB + 𝛽 𝑈𝑆𝐷 + 𝛽 𝐶𝐵 ∙ 𝑈𝑆𝐷 +𝛾W + 𝛿Z + 𝜀 (5)

16
The marginal effects reported in column (I) of Table 7 are obtained for firms with and without
dollar asset exposures. The results show that only firms without dollar asset-side exposures
issue dollar-denominated bonds when the corporate basis widens.
< Insert Table 7 here >
Next, we distinguish between firms with dollar long-term assets and revenues (that is,
operational or accounting exposures, respectively). Specifically, we define two binary
variables: one measuring dollar accounting exposures (𝑈𝑆𝐷 ) that takes value one if a firm
has long-term assets in dollars and another one assessing dollar operational exposures (𝑈𝑆𝐷 )
that takes value one if a firm has dollar revenues. According to Aabo, Hansen, and Muradoglu
(2015), the two measures convey different information: the accounting exposure proxy reflects
long-term balance-sheet exposures, whereas the operational exposure proxy gauges short-term
cash-flow exposures. The distinction is important, since the two types of exposure are
associated with different hedging needs. Columns (II) and (III) of Table 7 show, alternatively,
the results obtained using the dummy for accounting and operational exposures, and their
interactions with the corporate basis. Firms without dollar long-term assets or revenues in
dollars issue dollar-denominated bonds when the corporate basis widens, whereas firms with
dollar long-term assets or revenues do not.
The size of dollar asset-side exposures varies considerably across firms, with some firms
reporting positive but negligible exposures. As a result, our binary variables do not perfectly
gauge the importance of dollar asset-side exposures. To overcome this problem, we substitute
each binary variable for a continuous measure: the fraction of dollar revenues (long-term
assets) to total revenues (long-term assets). A second issue associated with the measures of
dollar exposures – in the form of either assets or revenues – is that they may reflect firm size.
To make sure we are not capturing the impact of firm size on the share of dollar borrowing, we
construct an orthogonalized ratio of dollar exposures, regressing each of the ratios on total
assets and using the residual in place of the continuous measure of exposures. Column (IV)
reports the results using the ratio of dollar long-term assets whereas column (V) contains the
results obtained when we use the orthogonalized ratio. Columns (VI) and (VII) are analogous
to the two previous columns but using the measure of dollar revenues.
The marginal effects in columns (IV) to (VII) are obtained for firms without and with dollar
asset-side exposures (defined as one standard deviation above the mean). Results in columns
(IV) and (V) show that firms without long-term dollar assets are more likely to issue dollar

17
bonds when the corporate basis widens than their peers. Firms without dollar revenues are also
less responsive to the corporate basis, independently of whether we measure their exposures
with a continuous variable (column VI) or if it is orthogonalized (column VII).
Taken together, these results suggest that only firms without dollar exposures react to
deviations in the corporate basis (column I). This result holds for accounting (columns II, IV
and V) and operational exposures (columns III, VI and VII). The last finding is consistent with
McBrady and Schill (2007), but importantly we complement their evidence documenting that
firms without accounting exposures also react more to FX-hedged cost-saving opportunities.
A caveat of our analysis is that we have measured operational dollar exposures exploiting the
geographical breakdown of assets disclosed in the financial statements. However, companies
outside the United States may have operational exposures when they operate in certain sectors.
Thus, we modify our measure of operational exposures, and assume that firms from the
“Utilities” and “Mining, Quarrying, and Oil and Gas Extraction” sectors have dollar
operational exposures (they represent 11% and 7% of the firms in our sample, respectively).12
The results (not reported for the sake of brevity) are very similar to those obtained in Table 7,
which further confirms that firms with no dollar asset-side exposures are more sensitive to FX-
hedged funding opportunities.
6.3. Composition of the pool of borrowers
In this section, we study the effects of the corporate basis conditioning jointly on firms’ risk
and dollar asset-side exposures. In particular, we extend equation (3) with the interaction of the
corporate basis and (i) the high-grade firm dummy (equal to one when the rating is above AA-
and zero otherwise)13, and (ii) measures of asset-side exposure to the dollar. Specifically, we
consider three proxies for dollar exposures. In column (I) of Table 8, we use a composite
measure: the simple average of the ratio of dollar revenues and the ratio of long-term dollar
assets. As in the previous section, each ratio is orthogonalized by regressing it on total assets.
In columns (II) and (III) we use the (orthogonalized) ratio of long-term dollar assets and
revenues, respectively.
12 NAICS codes 20 and 21. 13 We exclude non-rated firms from this analysis.

18
The results imply that the composition of dollar borrowers changes when the corporate basis
widens. Specifically, a widening in the corporate basis increases the fraction of dollar bonds
issued by very high-grade firms and firms with no dollar assets or revenues.
Then, we tackle potential biases due to the larger size of very high-grade firms and estimate
the GLM model using CEM weights, which are obtained as in Section 6.1. Column (IV) shows
the results obtained when we use the average of the (orthogonalized) ratio of dollar revenues
and the (orthogonalized) ratio of long-term dollar assets whereas columns (V) and (VI) refer
the (orthogonalized) ratio of long-term dollar assets and revenues, respectively. The results are
qualitatively similar to those obtained in columns (I) – (III).
< Insert Table 8 here >
To evaluate the economic magnitude of our findings, we depict in Figure 5 the impact of the
corporate basis on dollar borrowing for the two types of firm based on their risk and exposure
to the dollar. In the left-hand panel we plot the impact of the corporate basis on dollar borrowing
by very high-grade firms and the other firms (control group), using the results reported in
column I of Table 8. The fraction of dollar borrowing by very high-grade firms (red dots)
increases by 23 pp when the corporate basis increases from its mean value to twice its standard
deviation. The fraction of dollar borrowing by the firms in the control group (blue dots) remains
almost flat at 25 pp independently of the level of the corporate basis.
The right-hand panel of Figure 5, also based on the results reported in column I of Table 8,
shows the increase in the fraction of dollar borrowing by firms with local assets and dollar
assets. For companies with assets in local currencies (red dots), a similar widening in the
corporate basis (twice the standard deviation) leads to a 15 pp increase in the share of dollar
borrowing. Despite this increase, the share of dollar borrowing by firms with dollar exposures
(blue dots) is constantly higher than the one of firms without dollar exposures independently
of the change in the corporate basis but remains flat at 35 pp. Comparing the red dots in the
two panels in Figure 5, it is evident that the corporate basis increases dollar borrowing by very
high-grade firms to a much greater extent, relative to firms with local currency assets (ie the
red dots in the left-hand panel are structurally higher than those in the right-hand panel).
< Insert Figure 5 here >

19
7. Conclusions
In this paper, we analyse how firms headquartered in advanced economies switch their bond
borrowing across currencies in response to FX-hedged cost-saving opportunities. We find that
non-US firms increase their dollar issuances when the pairwise differential in the corporate
basis (defined as the relative cost of local to synthetic currency borrowing) is larger than the
cost of swapping the dollar proceeds into domestic currency.
We also show that the response differs across types of firm. Very high-grade firms take greater
advantage of FX hedged funding opportunities, as they can offer investors a closer substitute
for dollar safe assets in the context of a scarcity of safe assets. This result holds for different
measures of firms’ credit risk (ie, high Altman z-score, or greater distance to default).
Similarly, firms without dollar-asset exposures react more to the widening of the corporate
basis. By contrast, firms with higher dollar revenues or long-term assets borrow more heavily
in dollars, but they do not react to changes in dollar funding opportunity, reflecting their
operational needs. Altogether, the composition of dollar borrowers shifts when the corporate
basis widens, as high-grade firms gain importance, relative to firms with operational needs.

20
References
Aabo, T. (2006). “The Importance of Corporate Foreign Debt in Managing Exchange Rate Exposure in Non-Financial Companies”. European Financial Management, 12, 633-649.
Aabo, T., Hansen, M. A., Muradoglu, Y. G. (2015). “Foreign Debt Usage in Non-Financial
Firms: A Horse Race between Operating and Accounting Exposure Hedging”. European Financial Management, 21, 590-611.
Allayannis, G., Brown, G.W., Klapper, L.F. (2003). “Capital structure and financial risk:
evidence from foreign debt use in East Asia”. Journal of Finance, 58, 2667–2709. Allayannis, G. Ihrig, J., and Weston, J. P. (2001). “Exchange-Rate Hedging: Financial versus
Operational Strategies”, American Economic Review, 91, 391-395. Altman, E. I. (1968). Financial Ratios, Discriminant Analysis and the Prediction of Corporate
Bankruptcy. Journal of Finance 23, 589-609. Bharath, S. T., and Shumway, T. (2008). Forecasting Default with the Merton Distance to
Default Model. Review of Financial Studies, 21, 1339-1369. Black, S., and A. Munro (2010). “Why Issue Bonds Offshore?”, BIS Papers 52, 1-47. Bruno, V., and Shin, H. S. (2017). “Global dollar credit and carry trades: A firm-level analysis”,
Review of Financial Studies, 30, 703-749. Cook, D., Kieschnick, R., and McCullough, B. D. (2008) “Regression analysis of proportions
in finance with self selection”, Journal of Empirical Finance, 15, 860 – 867. Du, W., Tepper, A., and Verdelhan, A. (2018). “Deviations from Covered Interest Rate Parity”,
The Journal of Finance, 73, 915-957. Faust, J., S. Gilchrist, J. H. Wright, and Egon Zakrajšek (2013) “Credit spreads as predictors
of real-time economic activity: A Bayesian model-averaging approach. “ Review of Economics and Statistics 95(5), 1501–1519.
Gilchrist, S., V. Yankov, and E. Zakrajšek. (2009). “Credit Market Shocks and Economic
Fluctuations: Evidence from Corporate Bond and Stock Markets”, Journal of Monetary Economics 56 (4), 471–493.
Gilchrist, S. and E. Zakrajšek. (2012). “Credit Spreads and Business Cycle Fluctuations”,
American Economic Review, 102(4), 1692–1720.

21
Gilchrist, S., and C. P. Himmelberg (1998). ‘Investment: Fundamentals and finance.’ In NBER Macroeconomic Annual, ed. B. S. Bernanke and J. J. Rotemberg (Cambridge: The MIT Press), 223–274.
Gopinath, G., and J. C. Stein (2018). “Trade Invoicing, Bank Funding, and Central Bank
Reserve Holdings.” American Economic Review Papers and Proceedings 108, 542-46. Guedes, J., and T. Opler,. (1996). “The Determinants of the Maturity of Corporate Debt
Issues”, Journal of Finance, 51, 1809-1833. Hoberg, G., and S. K. Moon, (2017). “Offshore activities and financial vs operational hedging”,
Journal of Financial Economics, 125, 217-244. Iacus, S., G. King, and G. Porro (2008). “Matching for Causal Inference Without Balance
Checking”, mimeo. Kieschnick, R., and McCullough, B. D. (2003). “Regression analysis of variates observed on
(0,1): percentages, proportions and fractions”, Statistical Modelling, 3, 193. Krishnamurthy, A. and H. Lustig (2019). “Mind the Gap in Sovereign Debt Markets: The U.S.
Treasury basis and the Dollar Risk Factor”, mimeo. Liao, G. Y. (2017). “Credit Migration and Covered Interest Rate Parity”, Project on Behavioral
Finance and Financial Stability Working Paper Series. Maggiori, M., B. Neiman, and J. Schreger (2018). “International Currencies and Capital
Allocation” NBER Working Paper No. 24673. McBrady, M. R., and Schill, M. J. (2007). “Foreign currency-denominated borrowing in the
absence of operating incentives”, Journal of Financial Economics, 86, 145-177. McBrady, M. R., and Schill, M. J. (2013). “Opportunistic foreign currency debt issuance”, in
G. Caprio (ed.), The Evidence and Impact of Financial Globalization, Elsevier, North Holland.
Merton, R. C. (1974). “On the Pricing of Corporate Debt: The Risk Structure of Interest Rates”,
Journal of Finance, 29, 449-70. O’Connor Keefe, M. and Yaghoubi, M (2016). “The influence of cash flow volatility on capital
structure and the use of debt of different maturities”, Journal of Corporate Finance, 38, 18-36.

22
Papke, L. E., and J. M. Wooldridge (1996). “Econometric methods for fractional response variables with an application to 401(k) plan participation rates.” Journal of Applied Econometrics, 11(6), 619–632.
Sushko, V., Borio, C., McCauley, R., and McGuire, P. (2017). “The failure of covered interest
parity: FX hedging demand and costly balance sheets”, BIS Working Papers, 590.

23
Appendix. Geographical segment breakdown
In this appendix, we describe the use of the geographical breakdown of long-term assets and
revenues provided in the notes to the financial statements. According to the International
Financial Reporting Standards (IFRS), public companies are obliged to disclose information
about their operating segments, products and services, the geographical areas in which they
operate, and their major customers. In particular, they need to disclose their non-current assets
and revenues by area and, when exposures are material, by individual country.14 As part of the
consolidated financial statements, the geographical breakdowns are audited and thus duly
reflect the asset-side exposures of companies.
Example of geographical segment breakdown. Linde AG In per cent of total Figure A.1
Long-term assets Revenues
Source: Authors’ elaboration, Thompson Reuters Eikon
Figure A.1 provides the geographical segment breakdown disclosed by Linde AG in 2017.
Linde AG is a Germany-based company engaged in industrial gases manufacture. The
company books 10% of its long-term assets in the United States (left-hand side of the figure),
where it obtains 23% of its external revenues. Consistently, with its high geographical
diversification, Linde AG had 18 outstanding bonds as of April 2019, issued in four different
currencies (US dollar, euros, British pound, and Australian dollar).15 This example suggests
that the geographical location of assets and revenue conditions the currency denomination of
bonds.
14 To measure the geographical breakdown of revenues we use external revenues, which measures revenues acquired from external customers. 15 For instance, Linde AG booked 5% of its long-term assets in Australia, and had an AUD bond outstanding.
510
17
17 19
30
Europe (other)Asia/Pacific (other)United States
North America (other)OtherGermany
78
16
18 23
27
United StatesGermanyChina
Europe (other)Asia/Pacific (other)Other
24
Proportion of bonds issued in domestic/foreign currency by non-financial firms domiciled in each country or economic area In per cent Figure 1
Source: Thompson Reuters Eikon
1.0
0.8
0.6
0.4
0.2
0.0USEACACHGBJP
Domestic Foreign:USD Foreign: EUR Foreign: Other

25
Residualized credit spreads, relative to the US dollar In percent Figure 2
Note: Evolution of the c-USD residualized credit spread estimated from equation (1). Source: own elaboration, Bloomberg, Thompson Reuters Eikon
50
0
–50
–100
–150
–200
–250201720152013201120092007
CHF CAD EUR GBP JPY

26
Corporate basis, relative to the US dollar In percent Figure 3
Note: Evolution of the corporate basis, obtained from equation (2). This is the difference between the CIP deviation (cross-currency basis) and the residualized credit spread obtained from equation (1) Source: own elaboration, Bloomberg, Thompson Reuters Eikon
50
0
–50
–100
–150
–200201720152013201120092007
CHF CAD EUR GBP JPY

27
Corporate basis EUR, relative to the US dollar. Breakdown. In percent Figure 4
Note: Decomposition of the USD-EUR corporate basis, as the sum of the residualized credit spread (dashed red line), and the CIP deviation (cross-currency basis, dashed yellow line) Source: own elaboration, Bloomberg, Thompson Reuters Eikon
50
0
–50
–100
–150
–200201720152013201120092007
Residualized credit spread Corporate basis Cross-currency basis (CIP deviation)

28
Fraction of dollar borrowing and the corporate basis 1 In per cent Figure 5
By credit risk By currency composition of assets
1 This figure shows the impact of the corporate basis on dollar borrowing for different types of firm, using Column (I) in Table 8. Panel A breaks them down according to their credit risk (very high-grade, vs the rest); and Panel B by the currency composition of their assets (local and dollar assets). The impact differs across the levels of the covered credit spread (standardized around its mean) reported on the horizontal axis. In Panel B firms with dollar (local) assets are those with a ratio of long-term assets to total assets at the 75th (25th) percentile. Source: own elaboration.
35
25
15
521.510.50-0.5-1-1.5
All firms Other Very high grade Corporate basis (standard deviations around the mean)
35
30
25
20
15
1021.510.50-0.5-1-1.5
All firms Dollar assets Local assetsCorporate basis (standard deviations around the mean)

29
Table 1. Firm-level variables
Panel A. Non-US firms
p25 p50 p75 mean Leverage 15% 27% 41% 27% Price to book 1.1 1.6 2.4 2.1 Operating margin 4% 7% 13% 10% Tangible assets ratio 32% 67% 99% 70% Current ratio 88% 116% 148% 129% Total Assets (in USD millions) 6,410 17,200 46,900 42,700
Panel B. Non-euro area firms
p25 p50 p75 mean Leverage 12% 28% 40% 24% Price to book 1.3 2.0 3.4 3.7 Operating margin 3% 9% 16% -50%Tangible assets ratio 18% 47% 88% 56%Current ratio 94% 130% 188% 182%Total Assets (in USD millions) 3,100 9,930 30,400 30,000 Source: Thompson Reuters.

30
Table 2: Bond issuances by currency
Panel A. Number of bond issued, by currency USD JPY GBP EUR CHF CAD Pre–2007 9,252 3,099 438 1,384 115 363
2007 900 346 64 161 30 43 2008 1,297 521 75 236 62 67 2009 1,183 357 81 277 42 58 2010 1,909 607 44 249 27 107 2011 1,050 324 24 146 37 67 2012 1,365 357 51 267 42 94 2013 1,364 349 34 288 23 88 2014 1,341 325 54 294 39 87 2015 1,641 360 47 388 47 76 2016 1,872 648 116 707 49 137
Total 23,174 7,293 1,028 4,397 513 1,187
Panel B. Number of local currency bond issued, by currency USD JPY GBP EUR CHF CAD Pre–2007 6,818 2,826 200 888 51 228
2007 681 322 34 87 12 17 2008 978 459 43 129 23 37 2009 918 333 50 222 29 52 2010 1,505 563 29 186 16 94 2011 853 298 11 114 23 48 2012 1,058 338 23 216 30 57 2013 1,048 340 12 211 13 60 2014 1,070 320 25 197 21 63 2015 1,362 351 18 214 20 46 2016 1,537 636 73 379 25 66
Total 17,828 6,786 518 2,843 263 768

31
Table 2: Bond issuances by currency (cont.) Panel C. Number of foreign currency bond issued, by currency USD JPY GBP EUR CHF CAD Pre-2007 2,434 273 238 496 64 135
2007 219 24 30 74 18 26 2008 319 62 32 107 39 30 2009 265 24 31 55 13 6 2010 404 44 15 63 11 13 2011 197 26 13 32 14 19 2012 307 19 28 51 12 37 2013 316 9 22 77 10 28 2014 271 5 29 97 18 24 2015 279 9 29 174 27 30 2016 335 12 43 328 24 71
Total 5,346 507 510 1,554 250 419

32
Table 3: Non-US firms’ US dollar bond borrowing This table shows the determinants of the fraction of dollar bond issuances to total bond issuances, which is bounded between zero and one, by non-US non-financial firms (FCRicrt), at a quarterly frequency. We estimate the following equation using a GLM (Generalized Linear Model) with a logistic link function:
where G(.) is the logistic link function, the covered credit spread (CBc
USD,t) is the sum of the residualized credit spread of currency c and the deviations from currency c-USD covered interest rate parity. It reflects the cost saving of a firm conductingsynthetic local currency borrowing (ie, issuing a fixed-coupon bond in dollars and swapping the proceeds back into an equivalent domestic currency bond, relative to issuing a domestic currency bond). 𝑈𝑆𝐷 is a dummy variable that takes value 1 if the firm has long-term dollar assets or revenues, and zero otherwise. α coefficients indicate the use of currency (c), year-quarter (t), and rating category (r) fixed effects. The vector W represents a set of lagged firm specific control variables:price-to-book, operating margin, total assets, leverage, and previous issuance dummy, and dollar asset-side exposure. We included several economic area/country lagged specific variables (Z ): sovereign yield differential, exchange ratevolatility, public debt to GDP, current account balance to GDP, and GDP growth. All variables are standardized. Panel A reports the coefficients and Panel B the marginal effects of one-standard deviation change in the covered credit spread andthe marginal effected associated with firms with dollar exposure. Column I is estimated using the whole sample (2007Q1–2016Q4), and columns II and II correspond to the results obtained with two subsamples (2007Q1–2012Q2 and 2012Q3–2016Q4, respectively). Robust standard errors in parentheses (clustered at the currency- quarter level). Both the coefficients and standards errors are reported in percentage points (i.e., they are multiplied by 100). The symbols *, ** and *** indicatesignificance at the 10%, 5% and 1% levels, respectively.
Dependent variable: FCR=USD Debt / (USD Debt + Local Curr Debt) I II III 2007Q1-2016Q4 2007Q1-2012Q2 2012Q3-2016Q4 Panel A: Coefficients Corporate basis 0.145* 0.042 0.577** (0.08) (0.09) (0.24) USD asset-side exposure 0.426*** 0.365** 0.440***
(0.10) (0.16) (0.14) PriceToBook 0.03 0.089 -0.05 (0.05) (0.06) (0.08) Operating margin 0.049 0.075 0.036 (0.04) (0.06) (0.07) Total assets 0.275*** 0.207** 0.311** (0.08) (0.10) (0.14) Leverage -0.096** -0.211*** 0.019 (0.04) (0.06) (0.06) Previous issuer 0.491*** 0.512*** 0.479*** (0.12) (0.18) (0.18) Panel B: Marginal effect of Corporate basis 1.58* 0.47 5.92** (0.88) (1.02) (2.46) Observations 4,005 2,094 1,911 Firm Controls YES YES YES Country Controls YES YES YES Rating FE YES YES YES Quarter FE YES YES YES Currency FE YES YES YES
𝐸(𝐹𝐶𝑅 𝐶𝐵 , ,𝑌 = 𝐺(𝛼 + 𝛼 + 𝛼 + 𝛽𝐶𝐵 , + 𝑈𝑆𝐷 + 𝛾W + 𝛿Z + 𝜀 )

33
Table 4. Marginal effect of the corporate basis (CB) on firms' foreign currency bond borrowing.
Euro borrowing by non-Euro Area firms. This table shows the determinants of the fraction of euro bond issuances to total bond issuances, which is boundedbetween zero and one, by non- Euro Area non-financial firms (FCRicrt), at a quarterly frequency. We estimate thefollowing equation using a GLM (Generalized Linear Model) with a logistic link function
where G(.) is the logistic link function, the corporate basis (CBcEUR,t) is the sum of the residualized credit spread
of currency c and the deviations from currency c-EUR covered interest rate parity. It reflects the cost saving of a firm conducting synthetic local currency borrowing (ie, issuing a fixed-coupon bond in euros and swapping the proceeds back into an equivalent domestic currency bond, relative to issuing a domestic currency bond). We report only the marginal effect of one-standard deviation change in the covered credit spread on the expected value of the ratio of foreign currency borrowing. The set of control variables is the same used in Table 3 but using euros as the reference currency with the exception of the euro-asset side exposure which is not available in that currency. Column I is estimated using the whole sample (2007Q1–2016Q4), and columns II and III correspond to the results obtained with two subsamples (2007Q1–2012Q2 and 2012Q3–2016Q4, respectively). Robust standard errors in parentheses (clustered at the currency- quarter level). Both the coefficients and standards errors are reported in percentage points (i.e., they are multiplied by 100). The symbols *, ** and *** indicate significance at the 10%, 5% and 1% levels, respectively.
Dependent variable: FCR=EUR Debt / (EUR Debt + Local Curr Debt) I II III 2007Q1-2016Q4 2007Q1-2012Q2 2012Q3-2016Q4 Marginal effect of Corporate basis 1.36* 0.24 3.91* (0.80) (0.48) (2.11) Observations 7,468 3,872 3,596 Firm Controls YES YES YES Country Controls YES YES YES Rating FE YES YES YES Quarter FE YES YES YES Currency FE YES YES YES
𝐸(𝐹𝐶𝑅 |𝐶𝐵 , ,𝑌 ) = 𝐺(𝛼 + 𝛼 + 𝛼 + 𝛽𝐶𝐵 , + 𝛾W + 𝛿Z + 𝜀 )

34
Table 5. Conditional marginal effects of the corporate basis (CB) on foreign currency bond borrowing depending on firms’ rating
This table shows the determinants of the fraction of dollar (euro) bond issuances to total bond issuances, which is bounded between zero and one, by non-US (non-Euro Area) non-financial firms (FCRicrt), at a quarterly frequency. To explore if the impact of the corporate basis depends on firms' risk we modify the original equation used in Table 3 including an interaction term and estimate the following equation using a GLM (Generalized Linear Model) with a logistic link function: where G(.) is the logistic link function and Safeit-1 is a dummy variable that is equal to one if the firm’s rating is in the very high-grade rating category, which we define as a rating above AA-, and zero if it is a high-yield, low investment grade category or it is not rated (hereafter we refer to them as the “control group”). The corporate basis (CBc
DomC,t) is the sum of the residualized credit spread of currency c and the deviations from currency c-USD (c- EUR) covered interest rate parity. We report only the marginal effect of one-standard deviation change in the covered credit spread on the expected value of the ratio of foreign currency borrowing for very high-grade firms (i.e., Safeit-1 is equal to one) and the control group (i.e., Safeit-1 is equal to one). All models include the covariates described in Table 3. Columns I - III report the results obtained when the foreign currency is the dollar (USD) and the sample consists of non-US firms whereas columns IV and VI contain the results obtained when the foreign currency is the euro (EUR) and the sample consists of non-Euro Area firms. In columns I and IV we use the whole sample of firms whereas in columns II and V we restrict the sample to those firms with a rating. In columns III and V, we use coarsened exact matching (CEM) techniques to balance the size of groups of very high-grade firms and the rest of firms with a rating. We use the baseline matching algorithm (Iacus, King, and Porro, 2008), and obtain weights for each observation. Then, we run weighted GLM regressions using the CEM weights. Robust standard errors in parentheses (clustered at the currency- quarter level). Both the coefficients and standards errors are reported in percentage points (i.e., they are multiplied by 100). The symbols *, ** and *** indicate significance at the 10%, 5% and 1% levels, respectively.
Dep. variable FCR: USD/(USD+Local Curr Debt) EUR/(EUR+LC Local Curr Debt) I II III IV V VI Safe 5.59*** 4.30*** 5.85*** 5.17* 3.16 5.54 (1.65) (1.57) (2.09) (2.99) (3.02) (3.75) Rest 0.33 -1.59 3.45 0.64 -0.29 0.47 (0.88) (1.32) (2.79) (0.76) (1.03) (1.90) Observations 4,005 2,162 811 8,134 5,316 3,667 Firm Controls YES YES YES YES YES YES Country Controls YES YES YES YES YES YES Rating FE YES YES YES YES YES YES Quarter FE YES YES YES YES YES YES Currency FE YES YES YES YES YES YES
𝐸(𝐹𝐶𝑅 𝐶𝐵 , ,𝑌= 𝐺(𝛼 + 𝛼 + 𝛼 + 𝛽 𝐶𝐵 , + 𝛽 𝑆𝑎𝑓𝑒 + 𝛽 𝐶𝐵 , 𝑥𝑆𝑎𝑓𝑒 + 𝛾W+ 𝛿Z + 𝜀 )

35
Table 6. Conditional marginal effects of the corporate basis (CB) on foreign currency bond borrowing depending on firms’ risk
This table shows the determinants of the fraction of dollar bond issuances to total bond issuances, which is bounded between zero and one, by non-US non-financial firms (FCRicrt), at a quarterly frequency. To explore if the impact of the corporate basis depends on firms’ risk we modify the original equation used in Table 3 including an interaction term and estimate the following equation using a GLM (Generalized Linear Model) with a logistic link function: where G(.) is the logistic link function and Safeit-1 is the measure of firms’ credit risk. In column (I) we measure the firm’s risk based on a dummy variable that is equal to one if the firm’s rating is in the very high-grade rating category, which we define as a rating above AA-, and zero if it is a high-yield or low investment grade category (i.e., we exclude non-rated firms). In column (II) we use a risk measure based on the Altman Z-score. More specifically, we use a dummy variable that is equal to one if the firm is in the top quartile of the Z-score distribution for the firms in our sample, which means it is in the “safe” zone. In column (III) we use an alternative proxy that classifies firms as risky when the distance to default is in the bottom quartile of the distribution of distance to default measures for the firms in our sample. The corporate basis (𝐶𝐵 , ) is the sum of the residualized credit spread of currency c and the deviations from currency c-USD covered interest rate parity. We use coarsened exact matching (CEM) techniques to balance the size of groups of firms within the safe category and the rest of the firms . We use the baseline matching algorithm (Iacus, King, and Porro, 2008), and obtain weights for each observation. Then, we run weighted GLM regressions using the CEM weights. We report only the marginal effect of one-standard deviation change in the corporate basis on the expected value of the ratio of foreign currency borrowing for safe and riskier firms according to the definition in each column. All models include the covariates described in Table 3. Robust standard errors in parentheses (clustered at the currency- quarter level). Both the coefficients and standards errors are reported in percentage points (i.e., they are multiplied by 100). The symbols *, ** and *** indicate significance at the 10%, 5% and 1% levels, respectively.
Rating
Z-score Distance to
default I II III
Safe 5.85*** 3.06* 4.32* (2.09) (1.83) (2.51) Rest 3.45 0.39 0.79 (2.79) (1.05) (1.38) Observations 811 3,873 2,489 Firm Controls YES YES YES Country Controls YES YES YES Rating FE YES YES YES Quarter FE YES YES YES Currency FE YES YES YES
𝐸(𝐹𝐶𝑅 𝐶𝐵 , ,𝑌= 𝐺(𝛼 + 𝛼 + 𝛼 + 𝛽 𝐶𝐵 , + 𝛽 𝑆𝑎𝑓𝑒 + 𝛽 𝐶𝐵 , 𝑥𝑆𝑎𝑓𝑒 + 𝛿 𝑌+ 𝜀 )

36
Table 7. Conditional marginal effects of the corporate basis (CB) on foreign currency bond borrowing depending on firms’ dollar exposures
This table shows the determinants of the fraction of dollar bond issuances to total bond issuances, which is bounded between zero and one, by non-US non-financial firms (FCRicrt), at a quarterly frequency. To explore if the impact of the corporate basis depends on firms' risk we modify the original equation used in Table 3 including an interaction term and estimate the following equation using a GLM (Generalized Linear Model) with a logistic link function: 𝐸(𝐹𝐶𝑅 |𝐶𝐵 , ,𝑌 )= 𝐺(𝛼 + 𝛼 + 𝛼 + 𝛽 𝐶𝐵 , + 𝛽 𝑈𝑆𝐷 + 𝛽 𝐶𝐵 , ∙ 𝑈𝑆𝐷 + 𝛾W + 𝛿Z + 𝜀 ) where G(.) is the logistic link function and 𝑈𝑆𝐷 is a dummy variable that denotes the existence of dollar long-term assets and/or revenues. More specifically, in column (I) this variable equal to one when the firm has assets or revenues in USD whereas in columns (II) and (III) we split the measure in two and distinguish between both exposures such that column (II) refers to long-term assets in USD and column (III) to the existence of revenues in that currency. In columns (IV) – (VII) we use a continuous measure. Column (IV) reports the results using the continuous variable of dollar long-term assets whereas column (V) contains the results obtained when we use the orthogonalized variable (the orthogonalized measure is the residual that is obtained after regressing the continuous variable measuring dollar exposures on total assets). Columns (VI) and (VII) are analogous to the two previous columns but using the measure of dollar revenues. The corporate basis (𝐶𝐶𝑆 , ) is the differential in the corporate basis of currency c in excess of the deviations from currency c-USD covered interest rate parity. In columns (I) – (III) we report only the marginal effect of one-standard deviation change in the corporate basis on the expected value of the ratio of foreign currency borrowing for firms with and without dollar exposures according to the definition in each column. The marginal effects in columns (IV) – (VII) are obtained for firms whose exposures are one standard deviation above the mean and for the rest of firms. Robust standard errors in parentheses (clustered at the currency- quarter level). Both the coefficients and standards errors are reported in percentage points (i.e., they are multiplied by 100). The symbols *, ** and *** indicate significance at the 10%, 5% and 1% levels, respectively.
Exposure: yes/no Exposure: continuous measure I II III IV V VI VII USD Asset-side exposure: NO 1.91*
(1.07)
USD Asset-side exposure: YES 0.33
(1.01)
USD LT assets: NO 1.72* 1.76** 2.00**
(0.96) (0.86) (0.88)
USD LT assets: YES -0.15 -0.09 -0.26
(1.21) (1.00) (1.03)
USD Revenues: NO 1.76* 2.34** 2.61*** (1.06) (0.91) (0.95)
USD Revenues: YES 0.39 -0.36 -0.34
(1.02) (1.04) (1.04) Observations 4,005 4,005 4,005 4,005 4,005 4,005 4,005 Firm Controls YES YES YES YES YES YES YES Country Controls YES YES YES YES YES YES YES Rating FE YES YES YES YES YES YES YES Quarter FE YES YES YES YES YES YES YES Currency FE YES YES YES YES YES YES YES

37
Table 8. Conditional marginal effects of the corporate basis (CB) on foreign currency bond borrowing depending on firms’ rating and dollar exposures
This table shows the determinants of the fraction of dollar bond issuances to total bond issuances, which is bounded between zero and one, by non-US non-financial firms (FCRicst), at a quarterly frequency. To explore if the impact of the corporate basis depends on firms' risk we modify the original equation used in Table 3 including an interaction term and estimate the following equation using a GLM (Generalized Linear Model) with a logistic link function: where G(.) is the logistic link function and Safeit-1 is a dummy variable that is equal to one if the firm’s rating is in the very high-grade rating category, which we define as a rating above AA-, and zero if it is a high-yield or low investment grade category (i.e., we exclude non-rated firms). 𝑈𝑆𝐷 is a variable that measures the existence of dollar long-term assets and/or revenues. More specifically, in columns I and IV this variable is equal to the average of the (orthogonalized) ratio of dollar revenues and the (orthogonalized) ratio of long-term dollar assets. Columns II and V are obtained using the (orthogonalized) ratio of long-term dollar assets whereas columns III and VI are obtained using the (orthogonalized) ratio of dollar revenues. The corporate basis (𝐶𝐵 , ) is the differential in the residualized credit spread of currency c and the deviations from currency c-USD covered interest rate parity. In columns IV – VI we use coarsened exact matching (CEM) techniques to balance the size of groups of firms within the safe category and the rest of the firms. We use the baseline matching algorithm (Iacus, King, and Porro, 2008), and obtain weights for each observation. Then, we run weighted GLM regressions using the CEM weights. We report only the marginal effect of one-standard deviation change in the covered credit spread on the expected value of the ratio of foreign currency borrowing for very high-grade (i.e., Safeit-1 is equal to one) and the rest of rated firms (i.e., Safeit-1 is equal to one). All models include the covariates described in Table 3. Robust standard errors in parentheses (clustered at the currency- quarter level). Both the coefficients and standards errors are reported in percentage points (i.e., they are multiplied by 100). The symbols *, ** and *** indicate significance at the 10%, 5% and 1% levels, respectively. All models include firm and country controls, and rating, quarter, and currency FE. Baseline CEM I II III IV V VI Safe 6.20*** 6.36*** 5.91*** 9.20*** 9.49*** 9.34*** (2.00) (2.01) (2.00) (2.87) (2.94) (2.86) Rest -1.62 -1.66 -1.52 4.48 4.33 5.19* (1.39) (1.38) (1.39) (3.05) (2.99) (3.13) USD Asset-side exposure: NO 4.66*** 7.23** (1.51) (2.91) USD Asset-side exposure: YES -2.16 5.10 (2.22) (3.14) USD LT assets: NO 4.15*** 6.91** (1.48) (2.71) USD LT assets: YES -0.66 5.67* (1.85) (2.95) USD Revenues: NO 4.35*** 8.78*** (1.49) (3.19) USD Revenues: YES 1.08 3.23 (1.47) (3.14) Observations 2,162 2,162 2,162 811 811 811
𝐸(𝐹𝐶𝑅 𝐶𝐵 , ,𝑌= 𝐺(𝛼 + 𝛼 + 𝛼 + 𝛽 𝐶𝐵 , + 𝛽 𝑆𝑎𝑓𝑒 + 𝛽 𝐶𝐵 , 𝑥𝑆𝑎𝑓𝑒 + 𝛽 𝑈𝑆𝐷+ 𝛽 𝐶𝐵 , 𝑥𝑈𝑆𝐷 + 𝛾W + 𝛿Z + 𝜀 )

Previous volumes in this series
842 February 2020
Do credit card companies screen for behavioural biases?
Hong Ru and Antoinette Schoar
841 February 2020
On fintech and financial inclusion Thomas Philippon
840 February 2020
Operational and cyber risks in the financial sector
Iñaki Aldasoro, Leonardo Gambacorta, Paolo Giudici and Thomas Leach
839 February 2020
Corporate investment and the exchange rate: The financial channel
Ryan Banerjee, Boris Hofmann and Aaron Mehrotra
838 January 2020
The economic forces driving fintech adoption across countries
Jon Frost
837 January 2020
Bad bank resolutions and bank lending Michael Brei, Leonardo Gambacorta, Marcella Lucchetta and Bruno Maria Parigi
836 January 2020
FX spot and swap market liquidity spillovers Ingomar Krohn and Vladyslav Sushko
835 December 2019
The Cost of Steering in Financial Markets: Evidence from the Mortgage Market
Leonardo Gambacorta, Luigi Guiso, Paolo Emilio Mistrulli, Andrea Pozzi and Anton Tsoy
834 December 2019
How do machine learning and non-traditional data affect credit scoring? New evidence from a Chinese fintech firm
Leonardo Gambacorta, Yiping Huang, Han Qiu and Jingyi Wang
833 December 2019
Central Counterparty Exposure in Stressed Markets
Wenqian Huang, Albert J. Menkveld and Shihao Yu
832 December 2019
Hedger of Last Resort: Evidence from Brazilian FX Interventions, Local Credit and Global Financial Cycles
Rodrigo Barbone Gonzalez, Dmitry Khametshin, José-Luis Peydró and Andrea Polo
831 December 2019
Believing in bail-in? Market discipline and the pricing of bail-in bonds
Ulf Lewrick, José Maria Serena and Grant Turner
830 December 2019
De jure benchmark bonds Eli Remolona and James Yetman
829 December 2019
Central banking in challenging times Claudio Borio
All volumes are available on our website www.bis.org.