
BIS international banking statistics at end-September 2017 · PDF fileStatistical releaseBIS...
15
1/15 18 January 2018 Statistical release: BIS international banking statistics at end-September 2017 The latest BIS locational and consolidated banking statistics refer to end-September 2017. The statistics can be browsed in the BIS Statistics Explorer, searched in the BIS Statistics Warehouse, viewed as PDF tables or downloaded in a single CSV file. Technical terms are explained in the online glossary. Data are subject to change. Publication dates for revisions and updates are announced in the release calendar. Questions about the BIS international banking statistics may be addressed to [email protected]. Contents 1. Developments in the latest data............................................................................................ 2 Cross-border credit to non-bank borrowers continues to expand ........................ 2 Sustained contraction in derivatives positions since 2015 ........................................ 3 Cross-border lending to EMEs continues to increase.................................................. 4 The Philippines starts reporting locational banking statistics .................................. 5 2. Revisions and breaks .................................................................................................................. 6 Data repeated from previous quarters .............................................................................. 6 Locational banking statistics: revisions and breaks ...................................................... 6 Consolidated banking statistics: revisions and breaks ................................................ 7 Annexes ................................................................................................................................................... 9 A. Locational banking statistics: charts .......................................................................... 9 B. Consolidated banking statistics: charts .................................................................. 14
-
Upload
truongdung -
Category
Documents
-
view
220 -
download
6
Transcript of BIS international banking statistics at end-September 2017 · PDF fileStatistical releaseBIS...

1/15
18 January 2018
Statistical release: BIS international banking statistics at end-September 2017
The latest BIS locational and consolidated banking statistics refer to end-September 2017. The statistics can be browsed in the BIS Statistics Explorer, searched in the BIS Statistics Warehouse, viewed as PDF tables or downloaded in a single CSV file. Technical terms are explained in the online glossary.
Data are subject to change. Publication dates for revisions and updates are announced in the release calendar. Questions about the BIS international banking statistics may be addressed to [email protected].
Contents
1. Developments in the latest data ............................................................................................ 2
Cross-border credit to non-bank borrowers continues to expand ........................ 2
Sustained contraction in derivatives positions since 2015 ........................................ 3
Cross-border lending to EMEs continues to increase.................................................. 4
The Philippines starts reporting locational banking statistics .................................. 5
2. Revisions and breaks .................................................................................................................. 6
Data repeated from previous quarters .............................................................................. 6
Locational banking statistics: revisions and breaks ...................................................... 6
Consolidated banking statistics: revisions and breaks ................................................ 7
Annexes ................................................................................................................................................... 9
A. Locational banking statistics: charts .......................................................................... 9
B. Consolidated banking statistics: charts .................................................................. 14
2/15
1. Developments in the latest data
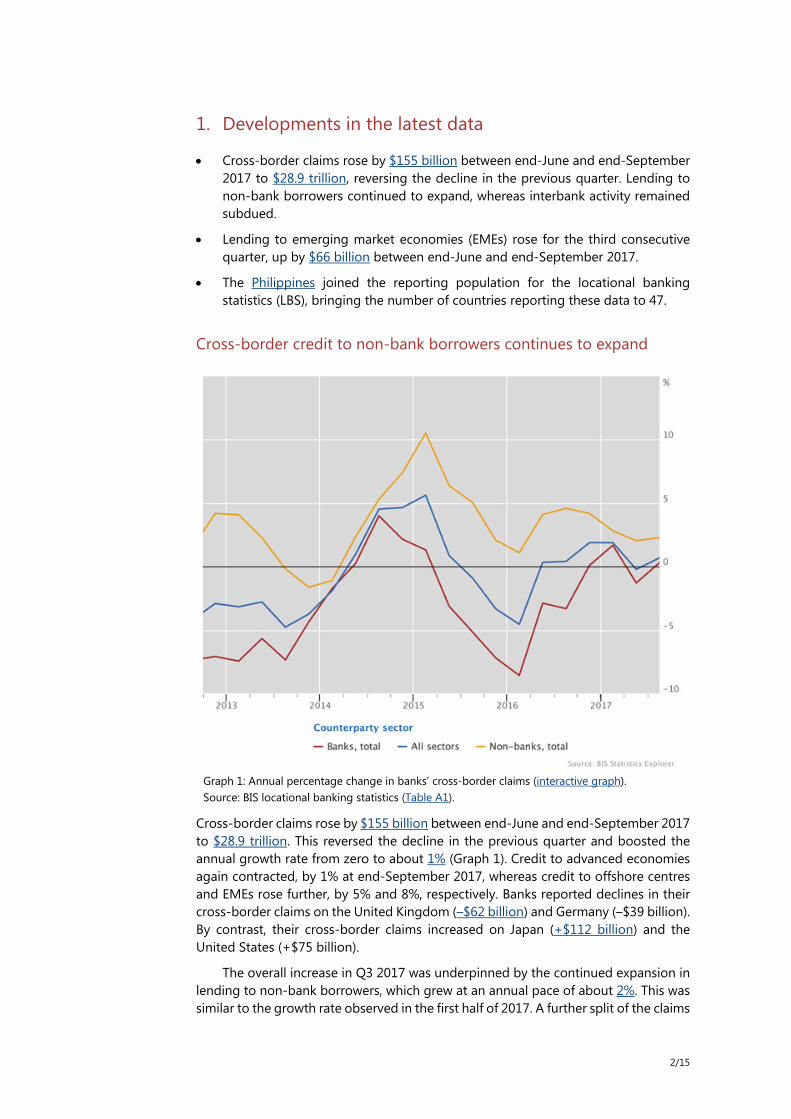
• Cross-border claims rose by $155 billion between end-June and end-September 2017 to $28.9 trillion, reversing the decline in the previous quarter. Lending to non-bank borrowers continued to expand, whereas interbank activity remained subdued.
• Lending to emerging market economies (EMEs) rose for the third consecutive quarter, up by $66 billion between end-June and end-September 2017.
• The Philippines joined the reporting population for the locational banking statistics (LBS), bringing the number of countries reporting these data to 47.
Cross-border credit to non-bank borrowers continues to expand
Graph 1: Annual percentage change in banks’ cross-border claims (interactive graph). Source: BIS locational banking statistics (Table A1).
Cross-border claims rose by $155 billion between end-June and end-September 2017 to $28.9 trillion. This reversed the decline in the previous quarter and boosted the annual growth rate from zero to about 1% (Graph 1). Credit to advanced economies again contracted, by 1% at end-September 2017, whereas credit to offshore centres and EMEs rose further, by 5% and 8%, respectively. Banks reported declines in their cross-border claims on the United Kingdom (–$62 billion) and Germany (–$39 billion). By contrast, their cross-border claims increased on Japan (+$112 billion) and the United States (+$75 billion).
The overall increase in Q3 2017 was underpinned by the continued expansion in lending to non-bank borrowers, which grew at an annual pace of about 2%. This was similar to the growth rate observed in the first half of 2017. A further split of the claims

3/15
on the non-bank sector reveals that, in Q3 2017, credit rose to both non-bank financial institutions (+$107 billion) and the non-financial sector (+$87 billion).
In contrast to lending to non-bank borrowers, interbank activity remained subdued. In Q3 2017, cross-border credit to banks fell by $41 billion. Diverging trends in lending to banks and non-banks have been the dominant pattern in the international banking market since 2011 (Graph 1).
Sustained contraction in derivatives positions since 2015
Graph 2: Outstanding consolidated derivatives claims on all counterparties (blue line) and foreign counterparties, excluding claims on residents of banks’ home country (red line) (interactive graph). Source: BIS consolidated banking statistics on an ultimate risk basis (Table B3).
The instrument composition of cross-border claims shows that bank loans rose by $182 billion in Q3 2017, taking their annual growth rate to 3%. Banks’ holdings of debt securities were up by $13 billion. However, overall cross-border activity was depressed by a decline in other instruments, which include equities and derivatives. Such other instruments contracted by $46 billion.
The BIS consolidated banking statistics show the derivatives positions of the largest banking systems to have declined substantially since 2015. Banks’ consolidated derivatives claims – that is, the sum of the derivatives contracts between reporting banks and counterparties that have a positive market value – fell from $5.8 trillion at end-March 2015 to $3.1 trillion at end September 2017 (Graph 2, blue line). Most of the decline was against foreign counterparties residing outside the home country of the reporting bank (Graph 2, red line). This decline mirrors the fall in market values reported by dealers contributing to the BIS OTC derivatives statistics. The latter statistics indicate that, as of end-June 2017, the gross market value of

4/15
outstanding OTC derivatives contracts had dropped to its lowest level since 2007, owing to falling notional amounts and changes in market interest rates.
Cross-border lending to EMEs continues to increase
Graph 3: Adjusted changes in banks’ cross-border claims (interactive graph). Source: BIS locational banking statistics (Table A3).
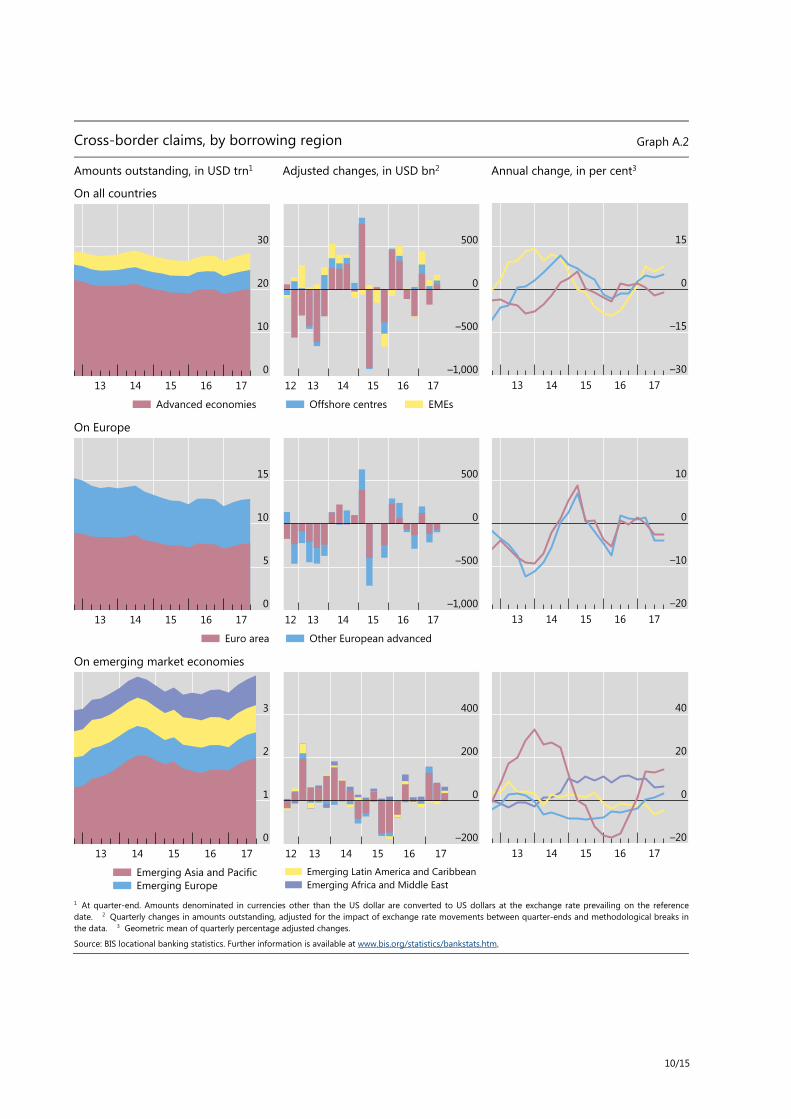
Cross-border claims on EMEs continued to trend upwards in Q3 2017. They expanded for the third consecutive quarter, up by $66 billion. The increase was more broadly based than in previous quarters, when it had been driven mainly by lending to China. Claims on China rose again, up by a modest $10 billion in Q3 2017. Several other EMEs also experienced notable increases, including Chinese Taipei (+$16 billion), India (+$6 billion), the United Arab Emirates (+$6 billion) and Argentina (+$5 billion).

5/15
The Philippines starts reporting locational banking statistics
Graph 4: Outstanding cross-border claims of banks in selected LBS-reporting countries (interactive graph). Source: BIS locational banking statistics (Table A2).
The Philippines joined the population of reporting countries for the locational banking statistics, bringing to 47 the number of jurisdictions reporting these data. At end-September 2017, banks in the Philippines had outstanding cross-border claims of $27 billion and liabilities of $18 billion. The cross-border claims of banks in the Philippines are larger than those of banks located in Chile and Indonesia but smaller than in the case of Turkey (Graph 4).
The largest cross-border claims of banks in the Philippines were on the United States ($8 billion) and neighbouring Asian economies such as Indonesia ($3 billion) and Japan ($3 billion). Banks in the Philippines are net suppliers of US dollar (on-balance sheet) funding in the international banking market. This is because they invest a portion of their local US dollar liabilities abroad. Close to 20% of their local liabilities to Philippine residents are denominated in US dollars.

6/15
2. Revisions and breaks
The reporting guidelines set out requirements for the reporting of the BIS international banking statistics. The consistency of banks’ reporting practices with the guidelines varies across reporting countries. Key discrepancies are highlighted in countries’ summaries of their banks’ reporting practices.
The statistics are subject to revision and are affected by breaks in series – or changes in compilation – over time. Breaks in series may arise from: changes in the population of reporting institutions, including the addition of new reporting countries; changes in reporting practices; or methodological improvements. Break sizes are shown in the BIS Statistics Explorer, under measure B. For a summary of breaks in the locational banking statistics, see Table A2 and Table A4, and in the consolidated banking statistics Table B1.
Significant revisions and breaks included for the first time with the statistics at end-September 2017 are explained below. At the request of reporting countries, the size of some breaks or revisions is not shown for confidentiality reasons (indicated in the published data by “\”.).
Data repeated from previous quarters
The latest statistics include some data repeated from previous quarters, so as to improve the comparability across quarters of aggregates composed of data reported by all countries. The reporting countries for which data are carried forward from the previous quarter are shown in Table 1.
Locational banking statistics: revisions and breaks
Adjusted changes were recalculated for all reporting countries using the BIS’s new US dollar exchange rate data. Previously, the main source for the exchange rates used by the BIS to calculate exchange rate- and break-adjusted changes in stocks in the LBS was the IMF’s International Financial Statistics database. The BIS’s new US dollar exchange rate data are sourced mainly from the ECB and the US Federal Reserve,
End-September 2017 data repeated from previous quarters Table 1
Locational banking statistics (LBS) Consolidated banking statistics (CBS)
LBS-reporting country Period carried forward CBS-reporting country Period carried forward
The Bahamas (LBS by nationality) End-December 2013 Denmark End-September 2016 The Bahamas (LBS by residence) End-June 2017 Panama End-June 2017 Curaçao End-March 2017 Isle of Man End-March 2017 Panama End-June 2017 Malaysia End-June 2017
For a complete list of countries that report the international banking statistics, see the BIS website.

7/15
supplemented with data from other central banks and the IMF.1 This change in sources affected the calculation of adjusted changes over the full history of the LBS, from 1977 onwards. While the impact on adjusted changes varied across breakdowns depending on the currency composition of the underlying stocks, overall the quantitative impact of the change in sources was minor.
Indonesia implemented the Stage 2 enhancements recommended by the Committee on the Global Financial System (CGFS).2 For data from end-March 2017 onwards, additional details are now reported, including a breakdown of the non-bank sector into non-bank financial institutions, non-financial corporations, governments and households. Indonesia also improved its coverage of banks’ claims and liabilities, in particular positions captured under other instruments. At end-September 2017, the total (cross-border plus local) outstanding claims of banks in Indonesia were $510 billion and liabilities $492 billion.
Italy revised its confidentiality settings to make more data free for publication. In Table A6.2, data are now available from Q4 2014 on the claims and liabilities of banks in Italy against counterparties in more than 130 countries.
The Philippines started to report the locational banking statistics, taking the number of LBS-reporting countries from 46 to 47. The claims and liabilities of banks located in the Philippines are included in the global aggregates for data from end-December 2016 onwards. At end-September 2017, the outstanding cross-border claims of banks in the Philippines totalled $27 billion and their liabilities $18 billion.
Spain reported additional details as part of the enhancements recommended by the CGFS. From end-March 2017, the positions of banks in Spain on the non-bank sector are further disaggregated into non-bank financial institutions, non-financial corporations, governments and households. At the same time, Spain implemented methodological changes to align reporting practices more closely with the BIS’s guidelines. The most significant methodological changes involved adding derivatives to other instruments (they were previously excluded) and starting to allocate debt securities issues by country of the holder (they were previously unallocated by counterparty). Other changes included reporting short positions as negative assets and reallocating holdings of euro cash from claims on Germany to claims on Spain. These changes increased the outstanding cross-border claims and liabilities of banks in Spain by $114 billion and $125 billion, respectively, at end-March 2017.
Consolidated banking statistics: revisions and breaks
Spain reported additional details as part of the enhancements recommended by the CGFS. From end-March 2017, the exposures of Spanish banks on the non-bank private sector are further disaggregated into non-bank financial institutions, non-financial corporations, and households on an immediate counterparty and ultimate risk basis. In addition, consolidated data on liabilities by instrument and total equity are now reported. At the same time, Spain implemented methodological changes to align banks’ reporting practices more closely with the BIS’s guidelines. For example,
1 For an explanation of the US dollar exchange rate data, see BIS, “Recent enhancements to the BIS
statistics”, BIS Quarterly Review, September 2017, pp 25–35, www.bis.org/publ/qtrpdf/r_qt1709c.htm.
2 For an explanation of the enhancements, see S Avdjiev, P McGuire and P Wooldridge, “Enhanced data to analyse international banking”, BIS Quarterly Review, September 2015, pp 53–68, www.bis.org/publ/qtrpdf/r_qt1509f.htm.

8/15
short positions are now reported as negative assets, and holdings of euro cash outside the euro area are now reported as claims on Germany. These methodological changes did not have a significant impact on Spanish banks’ worldwide consolidated positions.

9/15
Annexes
A. Locational banking statistics: charts
Cross-border claims, by sector, currency and instrument Graph A.1
Amounts outstanding, in USD trn1 Adjusted changes, in USD bn2 Annual change, in per cent3
By sector of counterparty
By currency
By instrument
1 At quarter-end. Amounts denominated in currencies other than the US dollar are converted to US dollars at the exchange rate prevailing on the reference date. 2 Quarterly changes in amounts outstanding, adjusted for exchange rate movements between quarter-ends and methodological breaks. 3 Geometric mean of quarterly percentage changes. 4 Includes central banks and banks unallocated by subsector between intragroup and unrelated banks. 5 Other reported currencies, calculated as all currencies minus US dollar, euro, yen and unallocated currencies. The currency is known but reporting is incomplete.
Source: BIS locational banking statistics. Further information is available at www.bis.org/statistics/bankstats.htm.
30
20
10
01716151413
Non-bank Related offices
500
0
–500
–1,000171615141312
Unrelated banks4 Unallocated
10
0
–10
–201716151413
30
20
10
01716151413
US dollar Euro Yen
500
0
–500
–1,000171615141312
Other currencies5 Unallocated
10
0
–10
–201716151413
30
20
10
01716151413
Loans and deposits Debt securities
500
0
–500
–1,000171615141312
Other instruments Unallocated
15
0
–15
–301716151413
10/15
Cross-border claims, by borrowing region Graph A.2
Amounts outstanding, in USD trn1 Adjusted changes, in USD bn2 Annual change, in per cent3
On all countries
On Europe
On emerging market economies
1 At quarter-end. Amounts denominated in currencies other than the US dollar are converted to US dollars at the exchange rate prevailing on the reference date. 2 Quarterly changes in amounts outstanding, adjusted for the impact of exchange rate movements between quarter-ends and methodological breaks in the data. 3 Geometric mean of quarterly percentage adjusted changes.
Source: BIS locational banking statistics. Further information is available at www.bis.org/statistics/bankstats.htm.
30
20
10
01716151413
Advanced economies
500
0
–500
–1,000171615141312
Offshore centres EMEs
15
0
–15
–301716151413
15
10
5
01716151413
Euro area
500
0
–500
–1,000171615141312
Other European advanced
10
0
–10
–201716151413
3
2
1
01716151413
Emerging Asia and PacificEmerging Europe
400
200
0
–200171615141312
Emerging Latin America and CaribbeanEmerging Africa and Middle East
40
20
0
–201716151413

11/15
Cross-border claims, by borrowing country Graph A.3
Amounts outstanding, in USD trn1 Adjusted changes, in USD bn2 Annual change, in per cent3
On selected advanced economies
On selected offshore centres
On selected emerging market economies
1 At quarter-end. Amounts denominated in currencies other than the US dollar are converted to US dollars at the exchange rate prevailing on the reference date. 2 Quarterly changes in amounts outstanding, adjusted for the impact of exchange rate movements between quarter-ends and methodological breaks in the data. 3 Geometric mean of quarterly percentage adjusted changes.
Source: BIS locational banking statistics. Further information is available at www.bis.org/statistics/bankstats.htm.
15
10
5
01716151413
United States United Kingdom
450
0
–450
–900171615141312
France Germany Japan
15
0
–15
–301716151413
3
2
1
01716151413
Cayman Islands Hong Kong SAR
200
0
–200
–400171615141312
Singapore Jersey Bahamas
30
0
–30
–601716151413
1.5
1.0
0.5
0.01716151413
China Brazil India
300
150
0
–150171615141312
Russia South Africa
100
50
0
–501716151413

12/15
Cross-border claims, by nationality of reporting bank and currency of denomination Graph A.4
Amounts outstanding, in USD trn1 Adjusted changes, in USD bn2 Annual change, in per cent3
All currencies
US dollar
Euro
1 At quarter-end. Amounts denominated in currencies other than the US dollar are converted to US dollars at the exchange rate prevailing on the reference date. 2 Quarterly changes in amounts outstanding, adjusted for the impact of exchange rate movements between quarter-ends and methodological breaks in the data. 3 Geometric mean of quarterly percentage adjusted changes.
Source: BIS locational banking statistics. Further information is available at www.bis.org/statistics/bankstats.htm.
30
20
10
01716151413
JapanUnited States
500
0
–500
–1,000171615141312
FranceGermany
Other
10
0
–10
–201716151413
15
10
5
01716151413
JapanUnited States
500
0
–500
–1,000171615141312
United KingdomSwitzerland
Other
15
0
–15
–301716151413
12
8
4
01716151413
GermanyFrance
300
0
–300
–600171615141312
NetherlandsUnited Kingdom
Other
20
0
–20
–401716151413

13/15
Cross-border liabilities of reporting banks Graph A.5
Amounts outstanding, in USD trn1 Adjusted changes, in USD bn2 Annual change, in per cent3
To emerging market economies
To central banks
By currency type and location
1 At quarter-end. Amounts denominated in currencies other than the US dollar are converted to US dollars at the exchange rate prevailing on the reference date. 2 Quarterly changes in amounts outstanding, adjusted for the impact of exchange rate movements between quarter-ends and methodological breaks in the data. 3 Geometric mean of quarterly percentage adjusted changes.
Source: BIS locational banking statistics. Further information is available at www.bis.org/statistics/bankstats.htm.
3
2
1
01716151413
Emerging Asia and PacificEmerging Europe
100
0
–100
–200171615141312
Emerging Latin America and CaribbeanEmerging Africa and Middle East
15
0
–15
–301716151413
1.2
0.8
0.4
0.01716151413
US dollar Euro Yen
50
0
–50
–100171615141312
Other currencies Unallocated
50
0
–50
–1001716151413
30
20
10
01716151413
Cross-border in all currenciesResident in foreign currencies
600
0
–600
–1,200171615141312
Unallocated
10
0
–10
–201716151413

14/15
B. Consolidated banking statistics: charts
Consolidated claims of reporting banks on advanced economies Graph B.1
Foreign claims and local positions, in USD bn1, 2
Foreign claims of selected creditors,in USD bn1, 3
International claims, by sector and maturity, in per cent4
On the euro area
On the United States
On Japan
AU = Australia; CH = Switzerland; DE = Germany; ES = Spain; FR = France; GB = United Kingdom; JP = Japan; TW = Chinese Taipei; US = United States. 1 Amounts outstanding at quarter-end. Amounts denominated in currencies other than the US dollar are converted to US dollars at the exchange rate prevailing on the reference date. 2 Excludes domestic claims. 3 Foreign claims on an ultimate risk basis, by nationality of reporting bank. The banking systems shown arenot necessarily the largest foreign bank creditors on each reference date. 4 As a percentage of international claims outstanding. 5 On an immediate counterparty basis. Includes the unconsolidated claims of banks headquartered outside but located inside CBS-reporting countries. 6 On an ultimate risk basis.
Source: BIS consolidated banking statistics. Further information on is available at www.bis.org/statistics/consstats.htm.
7,500
5,000
2,500
01716151413
1,200
800
400
01716151413
FRUS
GBJP
ES
45
30
15
01716151413
6,000
4,000
2,000
01716151413
1,500
1,000
500
01716151413
JPGB
CHFR
DE
60
40
20
01716151413
750
500
250
0
1716151413
Foreign claims (immediate)5
Foreign claims (ultimate)6
Local claims in local currencyLocal liabilities in local currency
300
200
100
0
1716151413
USFR
GBTW
AU
75
50
25
0
1716151413
BanksOfficial sectorNon-bank private sector≤ 1 year
15/15
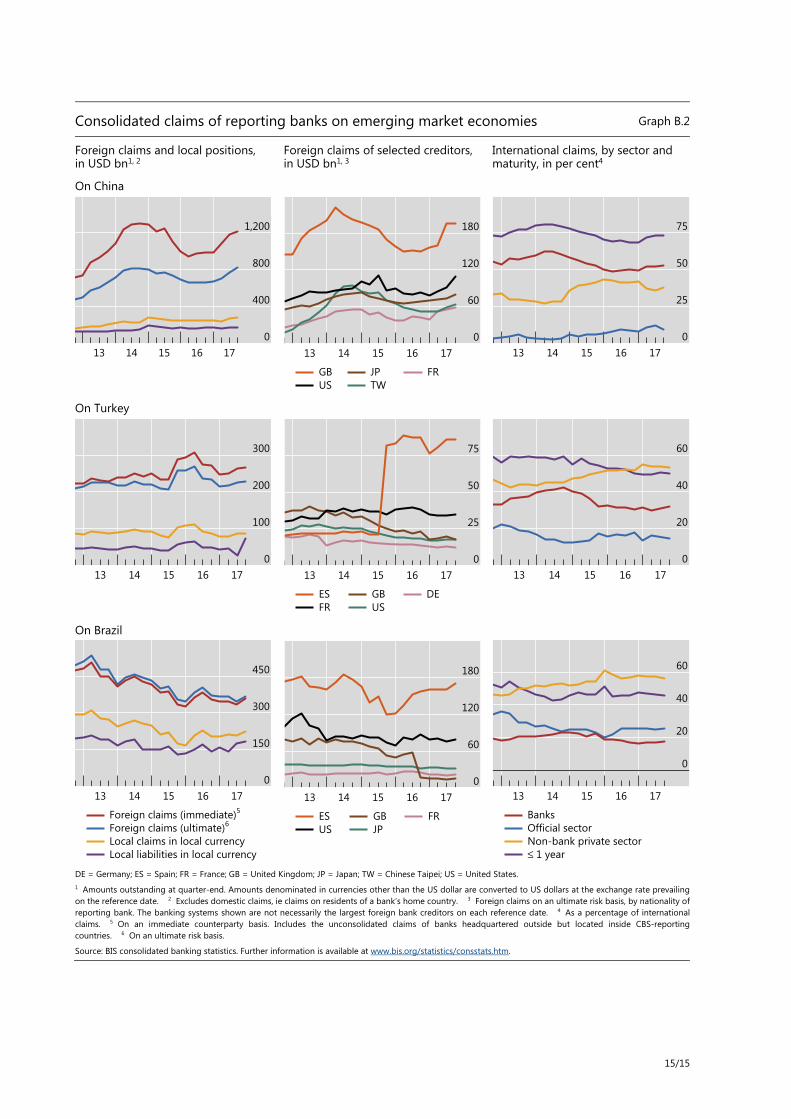
Consolidated claims of reporting banks on emerging market economies Graph B.2
Foreign claims and local positions, in USD bn1, 2
Foreign claims of selected creditors,in USD bn1, 3
International claims, by sector and maturity, in per cent4
On China
On Turkey
On Brazil
DE = Germany; ES = Spain; FR = France; GB = United Kingdom; JP = Japan; TW = Chinese Taipei; US = United States. 1 Amounts outstanding at quarter-end. Amounts denominated in currencies other than the US dollar are converted to US dollars at the exchange rate prevailing on the reference date. 2 Excludes domestic claims, ie claims on residents of a bank’s home country. 3 Foreign claims on an ultimate risk basis, by nationality of reporting bank. The banking systems shown are not necessarily the largest foreign bank creditors on each reference date. 4 As a percentage of international claims. 5 On an immediate counterparty basis. Includes the unconsolidated claims of banks headquartered outside but located inside CBS-reporting countries. 6 On an ultimate risk basis.
Source: BIS consolidated banking statistics. Further information is available at www.bis.org/statistics/consstats.htm.
1,200
800
400
01716151413
180
120
60
01716151413
GBUS
JPTW
FR
75
50
25
01716151413
300
200
100
01716151413
75
50
25
01716151413
ESFR
GBUS
DE
60
40
20
01716151413
450
300
150
01716151413
Foreign claims (immediate)5
Foreign claims (ultimate)6
Local claims in local currencyLocal liabilities in local currency
180
120
60
01716151413
ESUS
GBJP
FR
60
40
20
0
1716151413
BanksOfficial sectorNon-bank private sector≤ 1 year


