Birth Ratios in England and Wales - gov.uk · Birth ratios in England and Wales ... analysis, we...
25
May 2014 Birth Ratios in England and Wales A report on gender ratios at birth in England and Wales
Transcript of Birth Ratios in England and Wales - gov.uk · Birth ratios in England and Wales ... analysis, we...

May 2014
Birth Ratios in England and Wales A report on gender ratios at birth in England and Wales

2
You may re-use the text of this document (not including logos) free of charge in any format or medium, under the terms of the Open Government Licence. To view this licence, visit www.nationalarchives.gov.uk/doc/open-government-licence/
© Crown copyright Published to gov.uk, in PDF format only.
www.gov.uk/dh
3
Birth Ratios in England and Wales A report on gender ratios at birth in England and Wales Prepared by Analytical Team, Department of Health

4
Contents Birth Ratios in England and Wales ............................................................................................. 1
A report on gender ratios at birth in England and Wales ............................................................ 1
Birth ratios in England and Wales .............................................................................................. 3
A report on gender ratios at birth in England and Wales .......................................................... 3
Birth Ratios in England and Wales ............................................................................................. 5
Introduction ............................................................................................................................. 5
Key Results ............................................................................................................................... 6
Method .................................................................................................................................... 6
Results .................................................................................................................................... 10
Births in England and Wales .................................................................................................. 10
Table 1: Birth ratios by birth order, England and Wales, 2008-2012 ................................... 10
Births by mother’s country of birth ....................................................................................... 11
Births by ethnicity .................................................................................................................. 11
Discussion on relationship with the analysis by The Independent ...................................... 11
Summary ................................................................................................................................ 12
Table 2: Birth ratios (number of boys per 100 girls) by mothers’ country of birth, births registered in England and Wales, 2008-2012 ....................................................................... 13
Table 3: Birth ratios and test results by child’s ethnicity, births notifications in England and Wales, 2007-2011 ........................................................................................................... 21
Appendix A ............................................................................................................................ 22
The multiple testing problem and the Benjamini–Hochberg procedure ............................. 22
Appendix B ............................................................................................................................. 23
Power calculations ................................................................................................................. 23
Birth ratios in England and Wales
Page 5 of 25
Birth Ratios in England and Wales Introduction
1. In May 2013, the Department of Health published the results of an analysis of male to female birth ratios in the UK. This covered overall birth ratios alongside breakdowns by the mother’s country of birth. In that analysis, no group was found to have a ratio that was statistically significantly different from the range that might be expected to occur naturally, leading to the conclusion that analysis of birth ratios did not offer evidence of sex selection occurring in the UK1.
2. The Department made the commitment to publish further analysis annually, in line with the recommendation of the Council of Europe Parliamentary Assembly that member states should ‘collect the ratio at birth, monitor its development and take prompt action to tackle possible imbalances’ and ‘encourage research on sex ratios at birth among specific communities’2.
3. The original analysis used the most up to date information that was available at the time, covering births in the five-year period from 2007 to 2011, broken down by the mother’s country of birth. Since that analysis was carried out, data has become available for 2012 and so this second report uses data covering the five-year period from 2008 to 2012.
4. In addition to an update of the overall gender ratio analysis carried out in
the previous report, two further pieces of analysis have been carried out and are reported here:
• Birth ratios by birth order, broken down by the mother’s country of birth.
This is also based on the period 2008 to 2012.
• Overall birth ratios and birth ratios by birth order, broken down by the child’s ethnicity as stated by the mother. This is based on the period 2007 to 2011 – the most recent five-year period for which data are available.
5. The report also contains a discussion of how the results relate to the analysis of household composition data reported by The Independent newspaper in January 2014.
1 Birth Ratios in the UK – A report on gender ratios at birth in the UK (2013)
2 http://assembly.coe.int/Main.asp?link=/Documents/AdoptedText/ta11/ERES1829.htm
Birth ratios in England and Wales
Page 6 of 25
Key Results
• The analyses by country of birth and ethnicity do not offer evidence of sex selection taking place within England and Wales.
• Without exception, the wide variation in birth ratios was within the bounds expected as a result of genetics, socio-economic differences and random variation. In both the analysis by country of birth and the analysis by ethnicity, no group was associated with a boy to girl birth ratio higher than the expected upper limit of 107. That was the case for both the overall birth ratio and by birth order.
• However, it should be noted that the numbers of births within many groups
in the analysis are such that large differences in birth ratios would need to be observed for the ratio to be identified as higher than the expected upper limit. That is, evidence would only be identified through this means if sex selection is taking place on a significant scale. It is therefore important to remain receptive to reports of such practice.
Method
6. As with the results reported in May 2013, this analysis has been quality assured by the Methodology Advisory Service at the Office for National Statistics.
7. The gender ratio at birth is the subject of numerous academic articles, with general consensus that a birth ratio of around 105 male births for every 100 female births is normal3. There is evidence that a number of factors can influence the sex of a child, including paternal and maternal age, coital rates and the number and sex of previous children4. Even within large populations, observed birth ratios vary considerably over time. For example, Figure 1 below shows that the birth ratio in England and Wales has varied considerably, ranging from 106.5 in 1944 and 1973 to 103.2 in 1898. The previous analysis examined whether any ratios were statistically significantly higher than 108. This analysis uses 107 instead. Using 107 means it is more likely that a result will be found to be statistically significant. This change has been made in the light of a further
3 Eberstadt, N. (2011) The Global War Against Baby Girls. The New Atlantis. 4 Jacbosen, R. et al (1999). Natural variation in the human sex ratio. Human Reproduction vol.14 no.12.

Birth ratios in England and Wales
Page 7 of 25
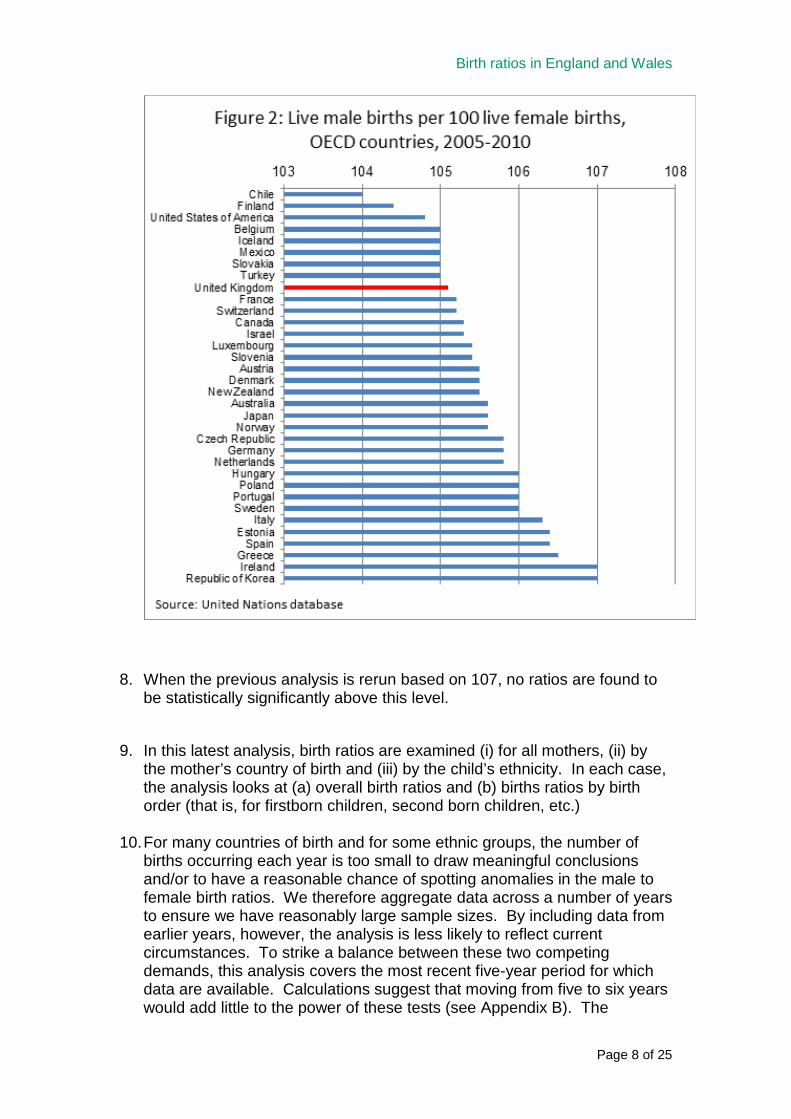
review of the available literature5,6, advice from academic experts and an examination of data on birth ratios in more developed countries. Data from the UN database7 show that birth ratios in the 34 OECD countries in the period 2005-10 ranged from 104 in Chile to 107 in Ireland and the Republic of Korea (Figure 2).
5 Hesketh, T. and Xing, Z W. (2006) Abnormal sex ratios in human populations: Causes and consequences. Proceedings of the National Academy of Sciences 6 Chahnazarian, A. (1988). "Determinants of the sex ratio at birth: Review of recent literature." Biodemography and Social Biology 35(3-4): 214-235 7 See http://esa.un.org/unpd/wpp/Excel-Data/fertility.htm.
Birth ratios in England and Wales
Page 8 of 25
8. When the previous analysis is rerun based on 107, no ratios are found to be statistically significantly above this level.
9. In this latest analysis, birth ratios are examined (i) for all mothers, (ii) by the mother’s country of birth and (iii) by the child’s ethnicity. In each case, the analysis looks at (a) overall birth ratios and (b) births ratios by birth order (that is, for firstborn children, second born children, etc.)
10. For many countries of birth and for some ethnic groups, the number of
births occurring each year is too small to draw meaningful conclusions and/or to have a reasonable chance of spotting anomalies in the male to female birth ratios. We therefore aggregate data across a number of years to ensure we have reasonably large sample sizes. By including data from earlier years, however, the analysis is less likely to reflect current circumstances. To strike a balance between these two competing demands, this analysis covers the most recent five-year period for which data are available. Calculations suggest that moving from five to six years would add little to the power of these tests (see Appendix B). The

Birth ratios in England and Wales
Page 9 of 25
information by country of birth is derived from birth registrations, for which the latest five-year period runs from 2008 to 2012. The information by ethnicity is derived from birth notifications8, for which the latest five-year period runs from 2007 to 2011.
11. Even though five years’ data have been used, the numbers for some countries and ethnic groups are still very small. We excluded those countries with fewer than 100 births in the period and merged some ethnic categories. This gives us datasets comprising over 3.5 million live births and figures for 171 countries and 13 ethnic groups. The majority of births were to mothers born in England and Wales (74%) and were of children in the ‘White British’ ethnic group (64%).
12. Information on parents' country of birth is routinely collected from
parents/guardians when births are registered. Although both mothers’ and fathers’ country of birth are recorded, we report results for mothers only, as information for fathers is not recorded for births outside of marriage and registered only by the mother. We believe there to be no substantial quality issues affecting the data on mothers’ country of birth, and any unidentified issues are likely to impact equally on male and female births.
13. Information on the child’s ethnicity is routinely collected from mothers as a part of the birth notification data from the NHS Number for Babies (NN4B) system. The Office for National Statistics carried out an assessment of the quality of these ethnicity data for 2005 to 2008. The data at that time were assessed as being of sufficient quality at national level, but not consistently robust sub-nationally. The proportion of 'not stated's were higher than country of birth, although that is not expected to affect male and female births differently. The ethnic categories used are groupings of the NHS categories collected at birth notification and are broadly in line with the GSS harmonised standard on ethnic group.
14. The information on previous children used for the analysis by birth order
was only available for births within marriage. There is no evidence that natural sex ratios are affected by marital status.
15. In testing whether a result is statistically significant, it is common practice to determine whether the likelihood of an extreme observation occurring by
8 The Office for National Statistics (ONS) routinely produces statistics on births and infant deaths in England and Wales using information collected when the birth or death is registered. But some important information – including on ethnicity - is not collected at birth registration. This information is however available to the NHS. ONS has been provided with access to full year’s information since 2006 and is derived from the birth notification record (known as the NN4B linked dataset). Over 99% of birth registration records are successfully linked to their corresponding birth notification record each year. These figures will not, therefore, match figures based solely on birth registrations.

Birth ratios in England and Wales
Page 10 of 25
chance is less than 5% (that is, the odds are less than 1 in 20). However, as there are nearly 171 countries and 13 ethnic groups being tested in this analysis, we would expect a birth ratio with that level of deviance to occur for several countries and some ethnic groups through random variation (around 8 to 9 countries). We could then be in the position of mistakenly stating that some groups have birth ratios which are so low/high that they are unlikely to happen naturally. To deal with this problem, known as the ‘multiple testing’ problem, we used a technique called the Benjamini–Hochberg procedure (as for the May 2013 analysis). Details of the procedure are given in Appendix A.
16. It should be noted that a consequence and a limitation of using the techniques for multiple testing are that the groups being analysed will generally need to be large (that is, have a high number of births) for relatively small differences in birth rates to be found to lie outside the expected range. Many of the groups in this analysis are small and so would require large differences in birth rates to be identified as different from the expected range.
Results
Births in England and Wales
17. In the period 2008 to 2012 there were 3.6 million births registered in England and Wales and a ratio of boys to girls of 105.2. This is not statistically significantly higher than the expected upper limit of 107.
18. The ratio did not vary significantly by birth order (see Table 1 below). The ratio among the 780 thousand second born children was 105.4 and among the 490 thousand children born third or more in line was 105.0. Again, these are within the expected range of 104 to 107 and not statistically significantly higher than 107.
Table 1: Birth ratios by birth order, England and Wales, 2008-2012
Birth order Number of births Birth ratio All births 3,588,909 105.2 First born 876,889 105.2 Second born 774,175 105.4 Third born or more 488,942 105.0
Birth ratios in England and Wales
Page 11 of 25
Births by mother’s country of birth
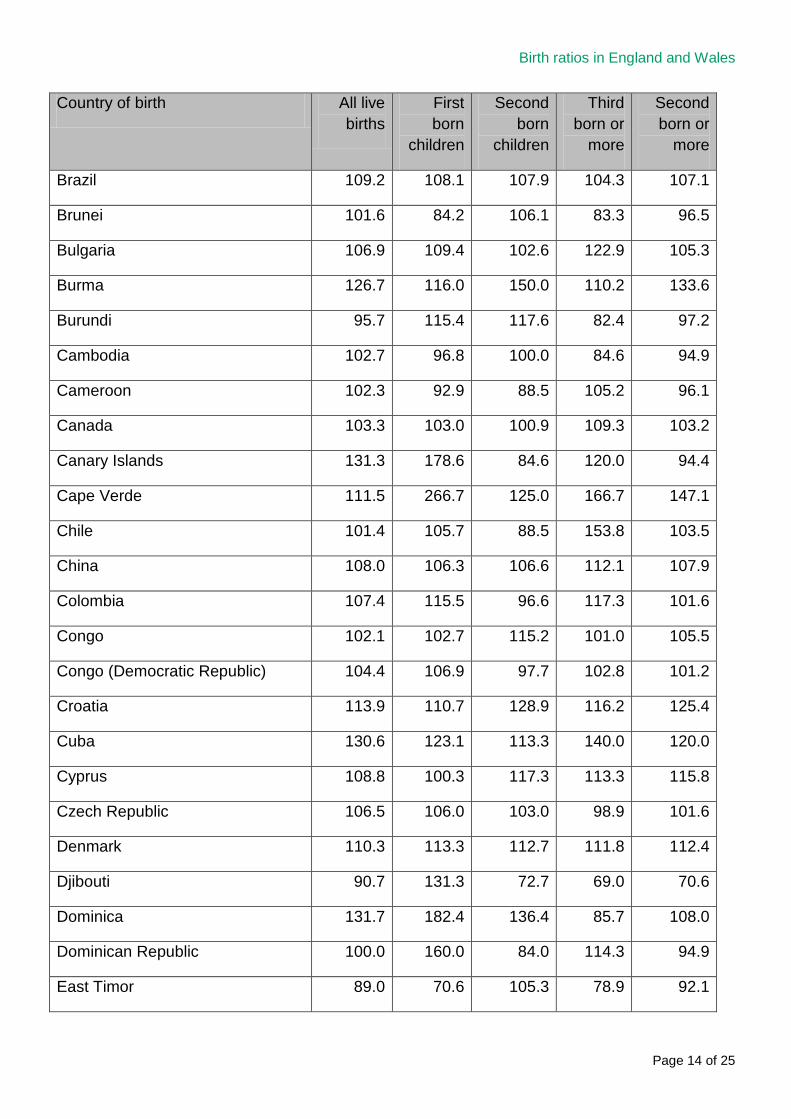
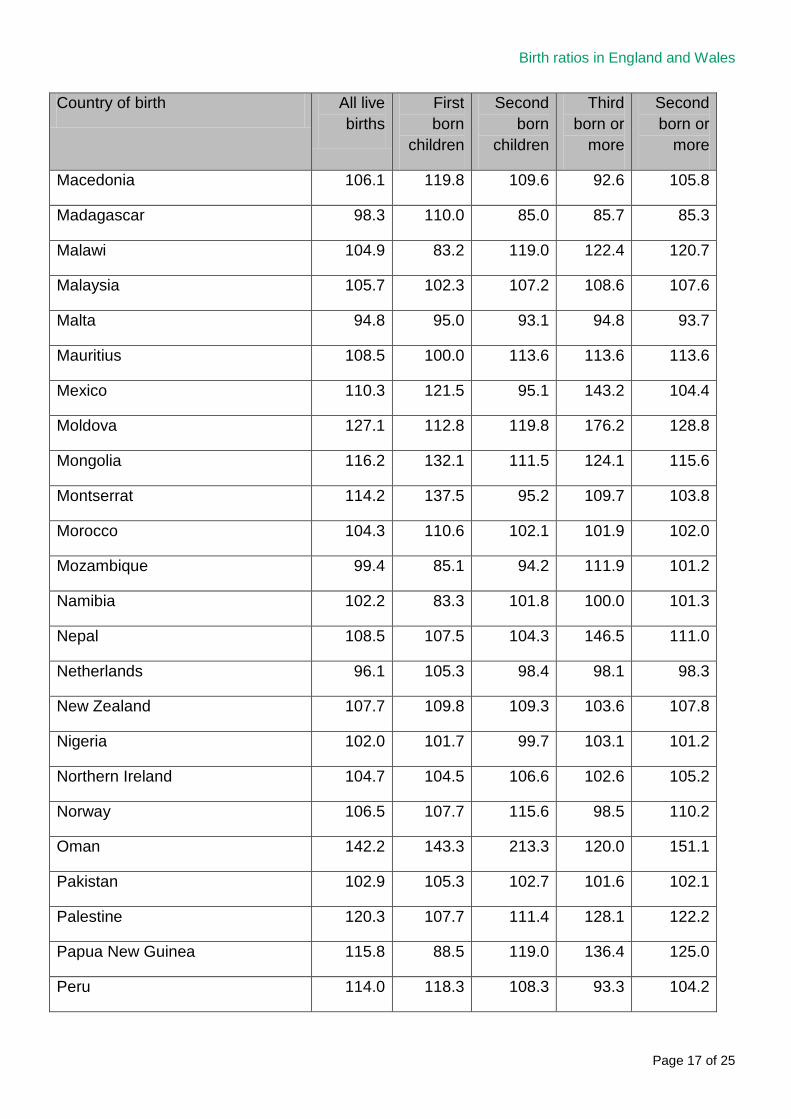
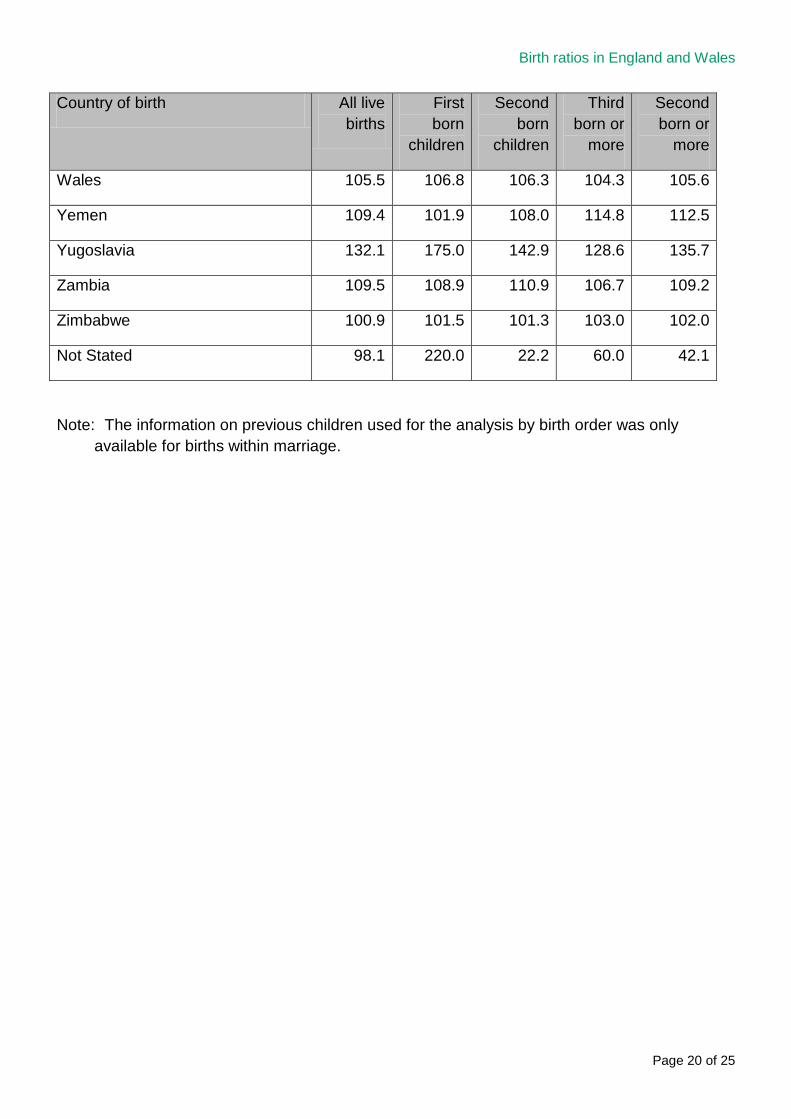
19. An analysis was conducted of birth ratios by the mother’s country of birth, both for the overall ratio and by birth order. As stated above, tests were carried out to examine whether any ratios were statistically significantly higher than 107. In doing so, account was taken of the issue of multiple testing. Table 2 shows the births ratios for the countries analysed.
20. In the case of the overall birth ratio and birth ratios by birth order, no ratio was found to be significantly higher than 107.
Births by ethnicity
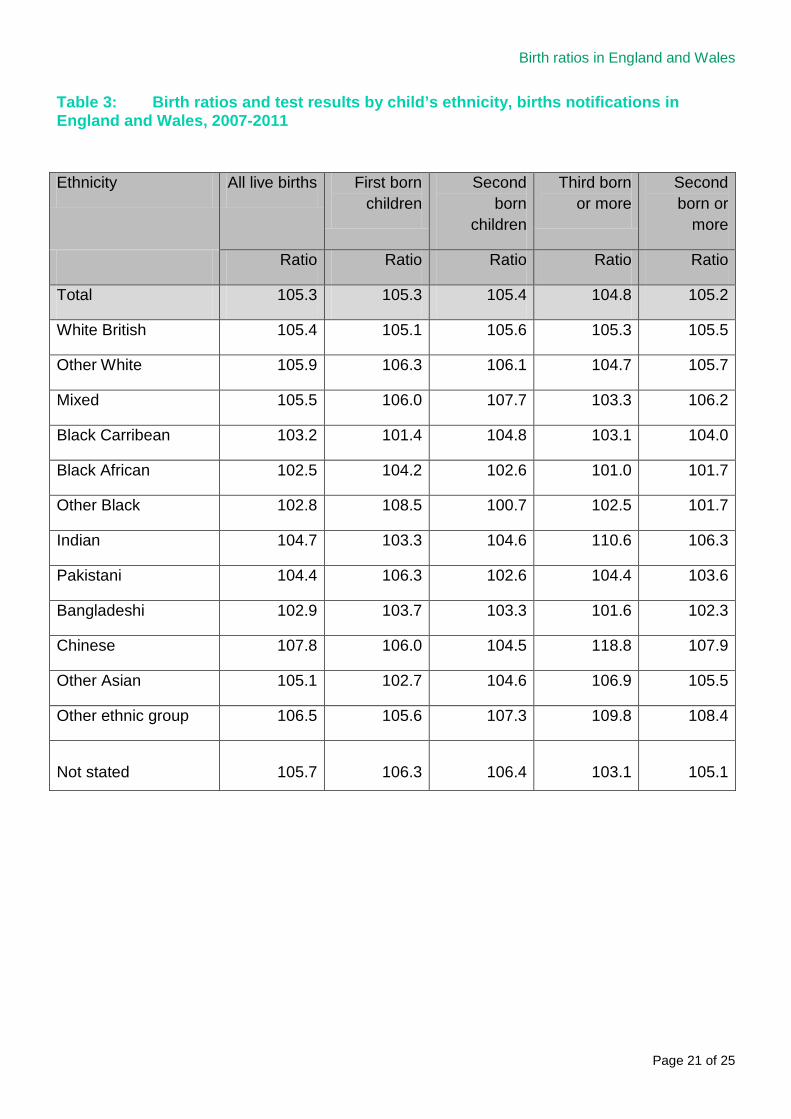
21. An analysis was also conducted of birth ratios by the child’s ethnicity, again both for the overall birth ratio and by birth order. Table 3 reports the results.
22. As before, in the case of both the overall birth ratio and birth ratios by birth order, no ratio was found to be significantly higher than 107.
Discussion on relationship with the analysis by The Independent
23. In January 20149, The Independent published an article summarising its analysis of household data from the 2011 Census in England and Wales. The analysis focussed on households where the mother was born in one of a handful of particular countries and where the oldest usually-resident dependent child was female. The analysis looked at the gender mix of the younger dependent children living in the household. Figures for the number of boys per 100 girls that were significantly higher than the England and Wales average were presented as evidence that sex selection had taken place within some of those households.
24. There are a number of factors other than sex selection that may affect the gender mix of dependent children within households, such as differences in:
• Mortality rates between boys and girls (both before and after migration) • The extent to which parents are accompanied by their male and female
offspring when emigrating 9 See http://www.independent.co.uk/news/science/the-lost-girls-thousands-of-missing-girls-revealed-by-analysis-of-uks-2011-census-results-9059905.html
Birth ratios in England and Wales
Page 12 of 25
• The proportion of boys and girls staying on in education after the age of 16
• The proportion of boys and girls leaving the household to live elsewhere in England and Wales or overseas (for example, because of marriage or living with family)
25. These and other factors could account for the observed household gender mix. It cannot therefore be concluded from the results that sex selection has taken place and, more specifically, that it has taken place within the UK.
26. The results presented in this report are therefore not at odds with the household data. Births data have considerably greater utility in assessing whether or not sex selection is taking place in England and Wales, as they are not affected by a wide range of events that occur after birth.
Summary
1. Analyses by country of birth and ethnicity do not offer evidence of sex selection taking place within England and Wales.
2. Without exception, the wide variation in birth ratios was within the bounds expected as a result of genetics, socio-economic differences and random variation. In both the analysis by country of birth and the analysis by ethnicity, no group was associated with a boy to girl birth ratio higher than the expected range of 107. That was the case for both the overall birth ratio and by birth order.
3. It should be noted that the numbers of births within many groups in the
analysis are such that large differences in birth ratios would need to be observed for the ratio to be identified as higher than the expected upper limit. That is, evidence would only be identified through this means if sex selection is taking place on a significant scale.
4. DH will repeat this analysis on an annual basis following publication of birth data by ONS and in the light of any other analyses that are conducted.

13
Table 2: Birth ratios (number of boys per 100 girls) by mothers’ country of birth, births registered in England and Wales, 2008-2012
Country of birth All live births
First born
children
Second born
children
Third born or
more
Second born or
more
Total for all countries 105.2 105.2 105.4 105.0 105.0
Afghanistan 104.7 99.9 107.0 106.9 107.0
Africa (NOS) 105.0 117.1 102.4 111.6 107.1
Albania 110.9 103.5 115.9 136.8 120.9
Algeria 105.3 108.8 99.6 107.0 103.2
Angola 102.1 108.2 104.6 91.2 96.2
Argentina 116.0 125.0 96.4 133.9 106.3
Armenia 92.0 84.0 78.9 181.8 102.0
Asia (except Middle East) (NOS) 101.4 102.4 86.2 128.3 103.6
Australia 107.0 107.9 107.1 117.0 109.7
Austria 100.8 116.9 89.3 92.2 90.4
Azerbaijan 104.9 114.1 110.9 81.5 101.2
Bahrain 105.3 118.1 101.8 90.0 97.7
Bangladesh 102.9 103.8 99.6 104.2 102.4
Barbados 91.7 56.6 134.4 104.5 122.2
Belarus 110.0 105.7 120.4 113.8 118.9
Belgium 104.2 91.8 112.8 104.4 108.8
Benin 137.5 222.2 157.1 140.0 147.1
Bermuda 115.2 92.3 131.6 285.7 173.1
Bolivia 103.5 87.1 121.0 126.5 122.9
Bosnia and Herzegovina 97.4 101.2 91.3 125.6 99.4
Botswana 113.7 98.1 102.1 150.0 116.4
Birth ratios in England and Wales
Page 14 of 25
Country of birth All live births
First born
children
Second born
children
Third born or
more
Second born or
more
Brazil 109.2 108.1 107.9 104.3 107.1
Brunei 101.6 84.2 106.1 83.3 96.5
Bulgaria 106.9 109.4 102.6 122.9 105.3
Burma 126.7 116.0 150.0 110.2 133.6
Burundi 95.7 115.4 117.6 82.4 97.2
Cambodia 102.7 96.8 100.0 84.6 94.9
Cameroon 102.3 92.9 88.5 105.2 96.1
Canada 103.3 103.0 100.9 109.3 103.2
Canary Islands 131.3 178.6 84.6 120.0 94.4
Cape Verde 111.5 266.7 125.0 166.7 147.1
Chile 101.4 105.7 88.5 153.8 103.5
China 108.0 106.3 106.6 112.1 107.9
Colombia 107.4 115.5 96.6 117.3 101.6
Congo 102.1 102.7 115.2 101.0 105.5
Congo (Democratic Republic) 104.4 106.9 97.7 102.8 101.2
Croatia 113.9 110.7 128.9 116.2 125.4
Cuba 130.6 123.1 113.3 140.0 120.0
Cyprus 108.8 100.3 117.3 113.3 115.8
Czech Republic 106.5 106.0 103.0 98.9 101.6
Denmark 110.3 113.3 112.7 111.8 112.4
Djibouti 90.7 131.3 72.7 69.0 70.6
Dominica 131.7 182.4 136.4 85.7 108.0
Dominican Republic 100.0 160.0 84.0 114.3 94.9
East Timor 89.0 70.6 105.3 78.9 92.1

Birth ratios in England and Wales
Page 15 of 25
Country of birth All live births
First born
children
Second born
children
Third born or
more
Second born or
more
Ecuador 104.4 107.8 100.7 99.0 100.0
Egypt 105.9 103.5 108.7 105.6 107.3
El Salvador 84.2 71.4 70.0 12.5 53.6
England 105.3 105.0 105.6 105.3 105.5
Eritrea 99.7 108.3 108.1 98.1 102.6
Estonia 108.0 111.7 110.6 108.8 110.1
Ethiopia 104.6 105.9 102.5 107.8 104.9
Fiji 101.8 100.7 104.3 103.2 103.8
Finland 106.8 111.7 104.9 79.5 98.2
France 104.5 105.0 102.2 105.2 103.2
Georgia 103.3 102.1 129.1 108.0 122.5
Germany 104.6 102.6 109.1 100.1 106.0
Ghana 101.1 100.6 102.3 97.1 99.8
Gibraltar 102.8 101.1 100.0 90.2 96.2
Greece 109.8 110.2 115.3 106.9 113.5
Grenada 97.7 117.4 52.0 89.5 68.2
Guadeloupe 119.1 150.0 69.2 183.3 105.3
Guernsey 111.6 125.0 108.6 56.8 88.4
Guinea 109.6 120.6 119.2 104.5 111.2
Guinea-Bissau 83.8 96.8 77.1 77.3 77.2
Guyana 106.5 102.9 122.2 94.0 107.1
Hong Kong (special admin. region of China) 100.4 100.6 101.1 102.8 101.6
Hungary 105.0 104.0 106.3 107.3 106.5
Iceland 109.8 105.9 100.0 88.9 94.9

Birth ratios in England and Wales
Page 16 of 25
Country of birth All live births
First born
children
Second born
children
Third born or
more
Second born or
more
India 106.5 104.5 107.2 112.1 108.3
Indonesia 103.9 106.9 110.2 96.7 105.8
Iran 104.6 101.7 108.5 104.3 107.5
Iraq 105.7 108.2 103.8 104.0 103.9
Ireland 105.3 105.4 103.5 107.9 105.2
Isle of Man 97.9 83.0 119.5 75.7 105.3
Israel 110.5 100.6 114.5 112.8 113.5
Italy 105.8 105.6 107.8 110.2 108.4
Ivory Coast 112.3 136.3 121.6 94.9 107.1
Jamaica 102.0 100.6 100.2 105.6 102.8
Japan 106.1 109.5 104.4 102.8 104.1
Jersey 126.9 118.1 153.6 78.0 125.5
Jordan 98.8 92.4 102.1 104.9 103.5
Kazakhstan 102.0 101.5 103.4 133.3 109.7
Kenya 105.1 105.9 105.3 96.4 102.3
Korea (South) 113.8 123.7 99.2 115.5 102.9
Kosova 117.5 109.3 125.3 122.6 123.9
Kuwait 105.4 117.0 114.9 93.1 102.5
Kyrgyzstan 125.0 116.7 135.5 200.0 150.0
Latvia 105.3 103.5 98.3 101.5 99.1
Lebanon 103.4 90.7 106.1 119.2 112.7
Liberia 124.6 173.9 104.7 111.5 108.4
Libya 104.0 100.3 113.2 101.9 106.5
Lithuania 106.5 103.0 107.1 121.6 110.1
Birth ratios in England and Wales
Page 17 of 25
Country of birth All live births
First born
children
Second born
children
Third born or
more
Second born or
more
Macedonia 106.1 119.8 109.6 92.6 105.8
Madagascar 98.3 110.0 85.0 85.7 85.3
Malawi 104.9 83.2 119.0 122.4 120.7
Malaysia 105.7 102.3 107.2 108.6 107.6
Malta 94.8 95.0 93.1 94.8 93.7
Mauritius 108.5 100.0 113.6 113.6 113.6
Mexico 110.3 121.5 95.1 143.2 104.4
Moldova 127.1 112.8 119.8 176.2 128.8
Mongolia 116.2 132.1 111.5 124.1 115.6
Montserrat 114.2 137.5 95.2 109.7 103.8
Morocco 104.3 110.6 102.1 101.9 102.0
Mozambique 99.4 85.1 94.2 111.9 101.2
Namibia 102.2 83.3 101.8 100.0 101.3
Nepal 108.5 107.5 104.3 146.5 111.0
Netherlands 96.1 105.3 98.4 98.1 98.3
New Zealand 107.7 109.8 109.3 103.6 107.8
Nigeria 102.0 101.7 99.7 103.1 101.2
Northern Ireland 104.7 104.5 106.6 102.6 105.2
Norway 106.5 107.7 115.6 98.5 110.2
Oman 142.2 143.3 213.3 120.0 151.1
Pakistan 102.9 105.3 102.7 101.6 102.1
Palestine 120.3 107.7 111.4 128.1 122.2
Papua New Guinea 115.8 88.5 119.0 136.4 125.0
Peru 114.0 118.3 108.3 93.3 104.2

Birth ratios in England and Wales
Page 18 of 25
Country of birth All live births
First born
children
Second born
children
Third born or
more
Second born or
more
Philippines 111.7 115.5 108.6 113.2 110.1
Poland 105.2 106.0 104.6 100.5 103.8
Portugal 103.1 100.1 114.1 106.4 111.3
Qatar 102.5 138.9 83.8 91.4 87.5
Romania 104.9 106.7 100.0 95.2 98.4
Russia 106.1 111.8 98.5 114.3 102.3
Rwanda 117.4 123.6 129.2 122.9 125.9
Sao Tome and Principe 112.0 106.7 139.1 147.6 143.2
Saudi Arabia 107.9 109.5 107.3 107.2 107.2
Scotland 105.8 107.5 105.4 106.5 105.7
Senegal 110.4 100.0 126.5 91.5 107.4
Serbia 115.0 122.4 111.1 71.7 97.0
Seychelles 112.1 97.8 128.1 145.5 132.6
Sierra Leone 100.6 104.2 95.0 105.9 100.2
Singapore 107.6 98.5 133.6 93.9 121.0
Slovakia 107.9 106.2 113.3 108.4 111.6
Slovenia 95.5 61.5 105.0 50.0 84.4
Somalia 102.4 104.5 102.6 102.5 102.6
South Africa 105.4 102.0 103.8 115.3 106.7
Spain 107.4 106.5 103.0 102.1 102.7
Sri Lanka 101.2 99.0 101.2 104.1 102.2
St Helena and Dependencies 121.3 100.0 107.1 112.5 109.1
St Lucia 105.8 85.5 91.3 177.3 119.1
St Vincent 106.0 88.1 70.3 126.7 86.5

Birth ratios in England and Wales
Page 19 of 25
Country of birth All live births
First born
children
Second born
children
Third born or
more
Second born or
more
Sudan 2 108.2 110.9 111.4 101.1 105.4
Swaziland 146.5 133.3 105.9 166.7 126.9
Sweden 108.1 109.9 107.2 105.1 106.6
Switzerland 109.3 111.7 114.1 95.9 105.4
Syria 114.1 105.5 117.3 123.5 120.1
Taiwan (Province of China) 97.1 98.2 91.2 112.0 95.0
Tanzania 105.4 114.1 101.2 103.9 102.4
Thailand 108.0 105.2 111.0 109.3 110.5
The Bahamas 139.1 82.8 188.9 300.0 213.0
The Gambia 100.6 111.4 84.2 106.4 94.6
Togo 102.0 112.0 90.3 93.2 92.0
Trinidad and Tobago 103.6 110.9 100.9 114.3 105.3
Tunisia 112.0 113.6 98.0 105.2 100.6
Turkey 107.2 107.6 111.8 104.4 108.8
Turkmenistan 116.4 185.2 58.3 114.3 71.0
Uganda 97.4 105.0 97.3 86.2 92.1
Ukraine 104.4 100.9 104.8 99.2 103.6
Union of Soviet Socialist States 140.6 162.1 100.0 166.7 112.9
United Arab Emirates 102.5 98.0 101.4 102.0 101.6
United States 105.7 104.3 107.9 106.8 107.5
Uruguay 113.2 95.7 115.8 150.0 125.9
Uzbekistan 113.4 106.2 122.9 86.8 111.6
Venezuela 101.8 92.2 106.9 110.3 107.6
Vietnam 108.4 110.8 111.3 109.1 110.6
Birth ratios in England and Wales
Page 20 of 25
Country of birth All live births
First born
children
Second born
children
Third born or
more
Second born or
more
Wales 105.5 106.8 106.3 104.3 105.6
Yemen 109.4 101.9 108.0 114.8 112.5
Yugoslavia 132.1 175.0 142.9 128.6 135.7
Zambia 109.5 108.9 110.9 106.7 109.2
Zimbabwe 100.9 101.5 101.3 103.0 102.0
Not Stated 98.1 220.0 22.2 60.0 42.1
Note: The information on previous children used for the analysis by birth order was only available for births within marriage.
Birth ratios in England and Wales
Page 21 of 25
Table 3: Birth ratios and test results by child’s ethnicity, births notifications in England and Wales, 2007-2011
Ethnicity All live births First born children
Second born
children
Third born or more
Second born or
more
Ratio Ratio Ratio Ratio Ratio
Total 105.3 105.3 105.4 104.8 105.2
White British 105.4 105.1 105.6 105.3 105.5
Other White 105.9 106.3 106.1 104.7 105.7
Mixed 105.5 106.0 107.7 103.3 106.2
Black Carribean 103.2 101.4 104.8 103.1 104.0
Black African 102.5 104.2 102.6 101.0 101.7
Other Black 102.8 108.5 100.7 102.5 101.7
Indian 104.7 103.3 104.6 110.6 106.3
Pakistani 104.4 106.3 102.6 104.4 103.6
Bangladeshi 102.9 103.7 103.3 101.6 102.3
Chinese 107.8 106.0 104.5 118.8 107.9
Other Asian 105.1 102.7 104.6 106.9 105.5
Other ethnic group 106.5 105.6 107.3 109.8 108.4
Not stated 105.7 106.3 106.4 103.1 105.1

Birth ratios in England and Wales
Page 22 of 25
Appendix A
The multiple testing problem and the Benjamini–Hochberg procedure
The ‘multiple testing problem’ arises because the significance level for a single test, α, (which measures the probability that we detect a difference under the assumption that there isn’t one) is not maintained if we do lots of tests. The chances of getting a significant result in at least one of a large number of tests is actually quite high. In order to detect results which are still unusual when we are doing lots of tests, we need to make a correction to α. Many approaches have been developed and one of them, the Benjamini-Hochberg procedure, is used in the analyses presented here.
The Benjamini–Hochberg procedure (BH step-up procedure) controls the false discovery rate (at level α). This means that the proportion of tests in the set which falsely find a significant effect is no more than α. The B-H procedure works as follows:
1. Find the significance level (p-value) for each individual test. 2. Rank the tests in descending order of p-values, and call the rank of a test in the ordered
list k.
3. For a given overall α, find the smallest k such that ( )1k
m kp
mα− +
<
4. Then say that for all tests , ,i k m= that there is a significant effect.

Birth ratios in England and Wales
Page 23 of 25
Appendix B
Power calculations
In testing whether a result is statistically significant, it is common practice to determine whether the likelihood of an extreme observation occurring by chance is less than 5% (that is, the odds are less than 1 in 20). This is known as the alpha (α) value.
However, as there are nearly 171 countries and 13 ethnic groups being tested in this analysis, we would expect a birth ratio with that level of deviance to occur for several countries and some ethnic groups through random variation (around 8 to 9 countries). We could then be in the position of mistakenly stating that some groups have birth ratios which are so low/high that they are unlikely to happen naturally. To deal with this problem, known as the ‘multiple testing’ problem, we used a technique called the Benjamini–Hochberg procedure (see Appendix A).
A consequence and a limitation of using this technique for multiple testing is that the groups being analysed will generally need to be large (that is, have a high number of births) for relatively small differences in birth rates to be found to lie outside the expected range. Many of the groups in this analysis are small and so would require large differences in birth rates to be identified as different from the expected range.
Calculations were conducted to determine the birth ratio that would need to be observed for a particular country of birth or ethnic group in order to have a good chance (i.e. 80%) of correctly concluding that the true value lies above the expected upper limit of 107 boys for every 100 girls. The required ratio depends on the number of births registered for that country or ethnic group. The fewer the number of births, the greater the observed ratio needs to be to ensure this chance is maintained. The levels of power and significance were set to 80% and 5% respectively and the calculation carried out for a one-tailed test, i.e. results greater than 107:100.
Use of the Benjamini-Hochberg (B-H) procedure cannot easily be factored into a power calculation. A minimum level of power was deduced by using the critical value of (i/N) * α that is associated with the 171st country and 13th ethnic group, rather than the α that is used when calculating the effect size for a single hypothesis test. In the case of the 171st country, i=1, N=171 and α=0.05, giving a critical value of 0.000292. In the case of the 13th country, i=1, N=13 and α=0.05, giving a critical value of 0.00384.

Birth ratios in England and Wales
Page 24 of 25
The required effect size for groups of varying size is shown in the table below. For example, an ethnic group with 10,000 registered births would need a birth ratio of 114 or more; and a country associated with 10,000 registered births would need a birth ratio of 116 or more.
Ratio of Boys: 100 girls
Sample size:
Single test
13th ethnic group
171st country
500 133 146 157
1000 125 133 140
5000 114 118 120
10000 112 114 116
50000 109 110 111
100000 108 109 109

Birth ratios in England and Wales
Page 25 of 25