Birth Defects and Developmental Disabilities: CDC … · Cooperative Agreements for Birth Defects...
25
TM Centers for Disease Control and Prevention National Center on Birth Defects and Developmental Disabilities Centers for Disease Control and Prevention National Center on Birth Defects and Developmental Disabilities Coleen Boyle, PhD Coleen Boyle, PhD Birth Defects and Developmental Birth Defects and Developmental Disabilities: CDC Activities Disabilities: CDC Activities
Transcript of Birth Defects and Developmental Disabilities: CDC … · Cooperative Agreements for Birth Defects...

TM
Centers for Disease Control and Prevention
National Center on Birth Defectsand Developmental Disabilities
Centers for Disease Control and Prevention
National Center on Birth Defectsand Developmental Disabilities
Coleen Boyle, PhDColeen Boyle, PhD
Birth Defects and Developmental Birth Defects and Developmental Disabilities: CDC ActivitiesDisabilities: CDC Activities

TM 2
Birth Defects: ImpactBirth Defects: Impact
1 in every 33 babies is born with a major birth defect17 most significant birth defects and cerebral palsy: $8 billion annually30% of admissions to pediatric hospitals Leading cause of infant deathSome causes entirely preventable

TM 3
10 Leading Causes of Infant Deaths – United States, 2004*10 Leading Causes of Infant
Deaths – United States, 2004*
5622
4642
2246
1715
1052
1042
875
827
616
593
0 1000 2000 3000 4000 5000 6000
Birth Defects
LBW and prematurity
SIDS
Maternal complications
Unintentional injuries
Complications of placenta,cord, and membranes
Respiratory distress syndrome
Spesis
Neonatal hemorrhage
Circulatory system disease
Source: Centers for Disease Control and Prevention, National Vital Statistics System, Mortality

TM 4
Developmental Disabilities: Impact Developmental Disabilities: Impact Developmental Disabilities: Impact
17% of children 18 years and younger have a developmental disability
3% have a severe disability with lifelong consequences
Significant impact on families and costs for health care and education services

TM 5
Estimated Lifetime Economic Costs of Selected Developmental Disabilities – U.S.*
Estimated Lifetime Economic Costs of Selected Developmental Disabilities – U.S.*
$566,000$2.484Vision Impairment
$417,000$2.102Hearing Loss
$921,000$11.470Cerebral Palsy
$1,014,000$51.237Mental Retardation
Average Costs Per Person
Total Costs (billions)
Developmental Disabilities
* Present value estimates, in 2003 dollars, of lifetime costs for persons born in 2000, based on a 3% discount rate. Source: CDC. MMWR January 30, 2004 53(03); 57-59

TM 6
Number of Children with Autism Served under IDEA*, Part B, 1992–93 to 2000-01, 6–21 years
Number of Children with Autism Served under IDEA*, Part B, 1992–93 to 2000-01, 6–21 years
01000020000300004000050000600007000080000
1992-1993
(n=49)
1993-1994
(n=51)
1994-1995
(n=52)
1995-1996
(n=52)
1996-1997
(n=52)
1997-1998
(n=52)
1998-1999
(n=52)
1999-2000
(n=52)
2000-2001
(n=52)
School Year (# states reporting) *includes DC & PR
Child
ren
wit
h A
utis
m S
erv
ed
IDEA = Individuals with Disabilities Education Act; State DOE reporting of autism eligibility mandated in 1992Source: U.S. Department of Education, Office of Special Education Programs, Data Analysis System (DANS)

TM 7
CDC Public Health CycleCDC Public Health Cycle
Surveillance Research
Prevention

TM 8
CDC Public Health CycleCDC Public Health Cycle
Surveillance Research
Prevention
TM 9
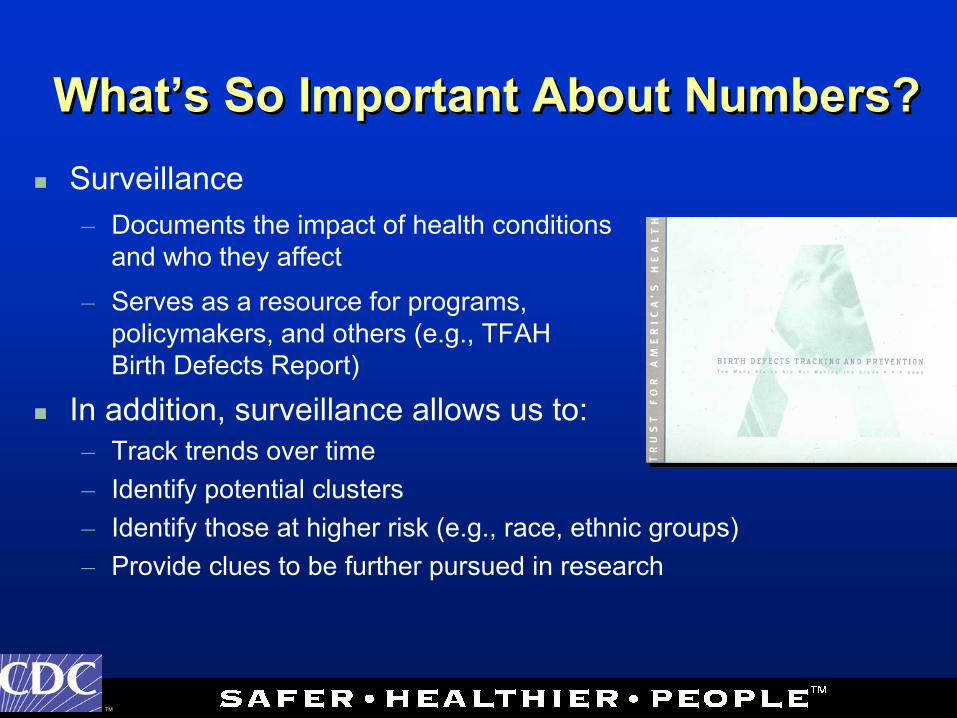
What’s So Important About Numbers?What’s So Important About Numbers?Surveillance– Documents the impact of health conditions
and who they affect
– Serves as a resource for programs, policymakers, and others (e.g., TFAH Birth Defects Report)
In addition, surveillance allows us to:– Track trends over time– Identify potential clusters– Identify those at higher risk (e.g., race, ethnic groups)– Provide clues to be further pursued in research

TM 10
ColoradoMichiganMinnesotaNew Hampshire
OklahomaRhode IslandVirginia
2005-2010
Centers for Birth Defects Research
ArkansasCalifornia
CDCIowa
MassachusettsNew York
North CarolinaTexasUtah
ArizonaFloridaIllinois New Jersey
New YorkOhio Puerto RicoVermont
2003-2008
Cooperative Agreements for Birth Defects ActivitiesCooperative Agreements for Birth Defects Activities

TM 11
Estimated Birth Defects Surveillance Cost by Methods*
Estimated Birth Defects Surveillance Cost by Methods*
$500,000 -$1,500,000$250-$750$10-$30Best
Intensive Surveillance (10 states)
$250,000 -$500,000
$125- $250$5-$10GoodMandatory Hospital Reporting (11 states) – with follow-up & quality control
$50,000 –$250,000
$25-$125$1-$5FairMandatory Hospital Reporting (12 states)- without follow-up
NoneNone---PoorBirth Certificates (1 state)
Total Cost for 50,000 births
each year
Cost Per Case
Ascertained
Cost Per Live Birth
Quality of Data
Birth Defects Surveillance Method
*These are estimates and can vary greatly depending on the specific methodology used.

TM 12
Organizational Location of U.S. Population-based Birth Defects Programs
Organizational Location of U.S. Population-based Birth Defects Programs
9
27
3
74
0
5
10
15
20
25
30
DOH, Vital/
Health Statistics
DOH, MCH/CSHCN/Fa
mily Health
DOH, Genetics University Other (non-profit, hospital, CDC,
DOD)

TM 13
Georgia
Hawaii
CDC
ADDM Phase 1 (2000-2006): 16 Sites (15+CDC)
ADDM Phase 2 (2006-2010): 11 Sites (10+CDC)
CDC Autism ActivitiesCDC Autism Activities
+
CADDRE

TM 14
CDC Public Health CycleCDC Public Health Cycle
Monitoring Research
Prevention

TM 15
Causes of Birth Defects and Developmental Disabilities
Causes of Birth Defects and Developmental Disabilities
Most causes of birth defects and developmental disabilities are unknown
Causes of Birth DefectsFrom Nelson and Holmes, NEJM January 5, 1989
3%3%
66%
28%
Unknown
Known Genetic Factors
Uterine Factors
Teratogens, e.g., Thalidomide
TM 16
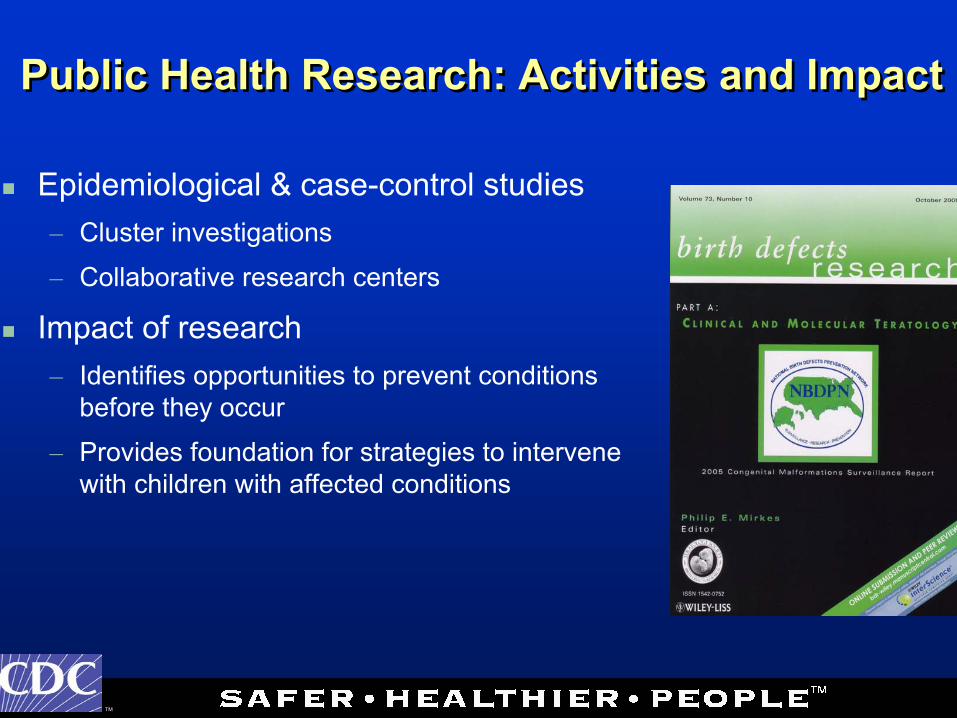
Public Health Research: Activities and ImpactPublic Health Research: Activities and Impact
Epidemiological & case-control studies– Cluster investigations
– Collaborative research centers
Impact of research– Identifies opportunities to prevent conditions
before they occur
– Provides foundation for strategies to intervene with children with affected conditions

TM 17
Recent Research ResultsRecent Research Results
Predictors of vitamin use among reproductiveaged women
Over the counter medication use in pregnancy
Progestin intake and certain birth defects
Maternal smoking and certain birth defects
Maternal nutrient intake and cleft lip/palate
Claritin® use and certain birth defects

TM 18
CDC Public Health CycleCDC Public Health Cycle
Monitoring Research
Prevention

TM 19
Birth Defects and Disabilities:Potential for Prevention and Intervention
Birth Defects and Disabilities:Potential for Prevention and Intervention
Restricted Prescription & Distribution
Thalidomide
Folic Acid Fortification & Supplementation
Spina Bifida
Conjugated Hib VaccineMental Retardation Caused by Hib Meningitis
ActionActionRisk FactorRisk Factor
Newborn ScreeningLate Diagnosis of Metabolic Conditions and Hearing Loss
Brief Interventions with high risk women
Prenatal Alcohol Exposure

TM 20
Folic Acid Prevents Neural Tube Defects!
Folic Acid Prevents Neural Tube Defects!
PHS recommendation: 400 micrograms (µg) daily for women capable of becoming pregnant to reduce the risk of having a pregnancy affected with a neural tube defect
FDA mandates food fortification that began in 1998
TM 21
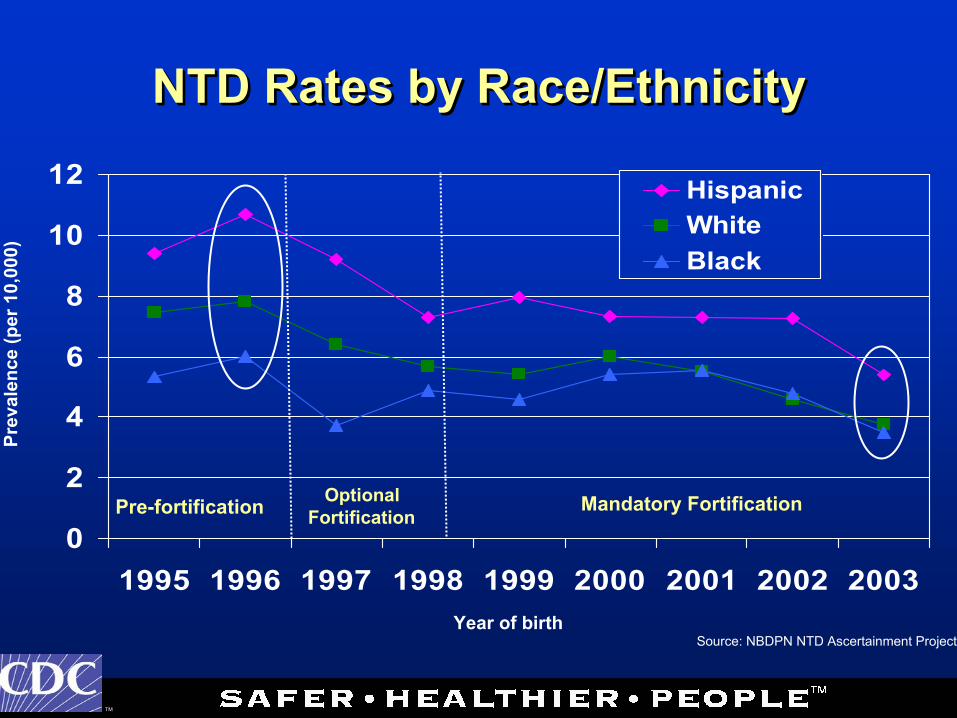
NTD Rates by Race/EthnicityNTD Rates by Race/EthnicityNTD Rates by Race/Ethnicity
Year of birth
0
2
4
6
8
10
12
1995 1996 1997 1998 1999 2000 2001 2002 2003
HispanicWhiteBlack
Prev
alen
ce (p
er 1
0,00
0)
Pre-fortification Optional Fortification
Mandatory Fortification
Source: NBDPN NTD Ascertainment Project

TM 22
Corn flour available in the United States
No Folic Acid
Folic Acid
Corn flour available in other countries, such as Costa Rica
Corn Flour FortificationCorn Flour Fortification

TM 23
Spina Bifida and Folic Acid Fortification:Direct Cost Savings
Spina Bifida and Folic Acid Fortification:Direct Cost Savings
Savings in direct costs of care for children with spina bifida (SB) due to folic acid fortification (conservative estimates):
600 x $300,000 = $180,000,000 SAVINGS
– 600 – babies born free of SB each year– $300,000 – lifetime savings in direct costs for
each child born free of SB – $180,000,000 – total savings per year in direct
cost as a result of folic acid fortification

TM 24
Screening and Intervention as a Tool for Improving Children’s Health
Screening and Intervention as a Tool for Screening and Intervention as a Tool for Improving Children’s HealthImproving Children’s Health
Screening to identify health conditions– Hearing loss: nation-wide screening for
hearing loss improved from 46% to 65%Referral and intervention– Colorado Birth Defects Program: 65% of
families that it refers for intervention services are new to the local system
Health promotion for people with disabilities– Quality of life for children and
adolescents with spina bifida

TM 25