
Birds, Birds, Birds: Co-worker Similarity, Workplace ... · Birds, Birds, Birds: Co-worker...
37
Birds, Birds, Birds: Co-worker Similarity, Workplace Diversity, and Voluntary Turnover Boris Hirsch Leuphana University of Lüneburg and Halle Institute for Economic Research (IWH) Elke Jutta Jahn Institute for Employment Research (IAB) and University of Bayreuth Thomas Zwick University of Würzburg (May 2019) LASER Discussion Papers - Paper No. 113 (edited by A. Abele-Brehm, R.T. Riphahn, K. Moser and C. Schnabel) Correspondence to: Elke Jutta Jahn, Regensburger Str. 104, 90478 Nürnberg, Germany, Email: [email protected].
Transcript of Birds, Birds, Birds: Co-worker Similarity, Workplace ... · Birds, Birds, Birds: Co-worker...
Birds, Birds, Birds: Co-worker Similarity, Workplace Diversity, andVoluntary Turnover
Boris HirschLeuphana University of Lüneburg and Halle Institute for Economic Research (IWH)
Elke Jutta JahnInstitute for Employment Research (IAB) and University of Bayreuth
Thomas ZwickUniversity of Würzburg
(May 2019)
LASER Discussion Papers - Paper No. 113
(edited by A. Abele-Brehm, R.T. Riphahn, K. Moser and C. Schnabel)
Correspondence to:
Elke Jutta Jahn, Regensburger Str. 104, 90478 Nürnberg, Germany, Email: [email protected].

Abstract
We investigate how the demographic composition of the workforce along the sex, nationality,education, age, and tenure dimension affects voluntary turnover. Fitting duration models for workers�job-to-job moves that control for workplace fixed effects in a representative sample of largemanufacturing plants in Germany during 1975-2016, we find that larger co-worker similarity in allfive dimensions substantially depresses voluntary turnover whereas workplace diversity is of limitedimportance. In line with conventional wisdom, which has that birds of one feather flock together, ourresults suggest that workers prefer having co-workers of their kind and place less value on diverseworkplaces.
Birds, Birds, Birds:
Co-worker Similarity, Workplace Diversity,
and Voluntary Turnover
Boris Hirsch*, Elke J. Jahn†, and Thomas Zwick‡
Abstract: We investigate how the demographic composition of the workforce along the sex,
nationality, education, age, and tenure dimension affects voluntary turnover. Fitting duration
models for workers’ job-to-job moves that control for workplace fixed effects in a representa-
tive sample of large manufacturing plants in Germany during 1975–2016, we find that larger
co-worker similarity in all five dimensions substantially depresses voluntary turnover whereas
workplace diversity is of limited importance. In line with conventional wisdom, which has that
birds of one feather flock together, our results suggest that workers prefer having co-workers
of their kind and place less value on diverse workplaces.
Keywords: workforce demography, co-worker similarity, workplace diversity, voluntary turn-
over
JEL classification: J63, J62, J21, J19
* Boris Hirsch, Leuphana University of Lüneburg, Halle Institute for Economic Research (IWH), and IZA Insti-
tute of Labor Economics, Universitätsallee 1, 21335 Lüneburg, Germany, email: [email protected] † Elke J. Jahn, Institute for Employment Research (IAB), University of Bayreuth, and IZA Institute of Labor
Economics, Regensburger Str. 104, 90478 Nürnberg, Germany, email: [email protected] ‡ Thomas Zwick, University of Würzburg, Centre for European Economic Research (ZEW), and Research Cen-
tre for Education and the Labour Market (ROA), Sanderring 2, 97070 Würzburg, Germany, email: [email protected]

1
1 Introduction
Empirical analyses of job mobility are at the heart of labour economics. Studies are legion that
investigate which worker and which employer characteristics, such as workers’ sex, age, and
education as well as firm size and industry (e.g. Anderson and Meyer, 1994; Royalty, 1998;
Griffeth et al., 2000; Frederiksen, 2008), drive voluntary as well as involuntary turnover. Yet,
up to now, little is known on how the demographic composition of the workforce along key
dimensions, such as sex, nationality, education, age, and tenure, affects individual workers’ quit
behaviour. In other words, we lack evidence on workers’ revealed preferences about workforce
demography, specifically on whether workers value demographically diverse work environ-
ments and/or prefer having co-workers of their kind.
To be sure, there exists a broad management literature on the turnover effect of what
has been termed “organisational demography” (Pfeffer, 1985) that documents lower turnover
in demographically more homogenous work environments (see the surveys by Williams and
O’Reilly, 1998, and Joshi et al., 2011). Moreover, turnover and especially worker-initiated vol-
untary turnover have been shown to harm firm performance (Park and Shaw, 2013), so that
“wrong” workforce demography poses a possible threat to a firm’s competitiveness. Usually,
though, evidence on the influence of workforce demography on turnover comes from the labor-
atory or from small-scale field studies. These contributions often consider how the demographic
composition of teams affects team members’ turnover, and thus refer to very specific settings
that render external validity questionable. On the other hand, existing observational studies that
aim at more general conclusions lack a credible research design in that data constraints prevent
them from moving beyond mere correlations between workforce demography and turnover to
causal effects. The only exception, we are aware of, is the study by Leonard and Levine (2006)
whose panel data permits the authors to control workplace fixed effects (we will discuss their
study in some detail in the following section).
2
Apart from these limitations in terms of internal and external validity, existing studies
only examine single aspects of workforce demography. When it comes to measuring workforce
demography, most studies thus ignore that it encompasses two related, yet distinct components:
overall workplace diversity and co-worker similarity at the workplace level from an individual
worker’s perspective. At the aggregate level of the workplace, the workforce may be more or
less diverse, e.g. along the age dimension with either a lot or just a little variation in workers’
age. Yet at the same time, from an individual worker’s perspective, he or she may have more
or less same-age co-workers for any given level of age diversity at the workplace. Hence,
whereas workplace diversity reflects the variation of a demographic characteristic in the entire
workforce, co-worker similarity mirrors the abundance of demographically similar co-workers
there from an individual worker’s perspective. Consequently, co-worker similarity is a distinct
determinant of voluntary turnover on top of workplace diversity if workers prefer having co-
workers of their kind, which is suggested by many analyses.
In this paper, we move beyond the extant literature by investigating the impact of both
workplace diversity and co-worker similarity on voluntary turnover along many different de-
mographic dimensions for a large representative set of plants, i.e. single production sites or
workplaces, in the West German manufacturing industry. Our unique data contain information
on more than 3,000,000 full-time jobs in almost 1,800 large workplaces over an observation
window spanning the years 1975–2016 and thus more than four decades. The data allow us to
examine in detail how workplace diversity and co-worker similarity along the sex, nationality,
education, age, and tenure dimension affect voluntary turnover based on duration models for
workers’ job-to-job turnover rate that control for permanent workplace unobservables and an
unusually broad set of further determinants of voluntary employee turnover.
Our main finding will be that co-worker similarity along all five dimensions signifi-
cantly reduces voluntary turnover, whereas workplace diversity plays a less important and a
less unanimous role. In line with conventional wisdom, which has that birds of one feather flock
3
together, our findings suggest that workers prefer having co-workers of their kind, but place
less value on working in diverse workplaces.
The remainder of this paper is structured as follows. Section 2 builds our hypotheses
and reviews some of the relevant literature on the turnover effect of workforce demography.
Section 3 introduces our data and empirical strategy and discusses possible threats to identifi-
cation. Section 4 presents and discusses our empirical results, and Section 5 concludes.
2 Theoretical considerations and empirical challenges
Empirical research on job mobility is abundant with numerous studies examining the drivers of
worker turnover at the worker and the employer level. Yet, convincing empirical evidence on
how workforce demography affects worker turnover is still scant. In particular, little is known
about its impact on worker-initiated voluntary turnover, which in turn would allow inferring
workers’ preferences about workforce demography. Although there exists a well-established
management literature on the turnover effect of workplace demography (see the surveys by
Williams and O’Reilly, 1998, and Joshi et al., 2011), existing observational studies almost
unanimously lack a credible research design, so that they hardly move beyond mere correla-
tions, and typically present only a narrow picture in analysing only few aspects of workforce
demography.
In terms of dimensions, most studies consider only a single dimension of workforce
demography, such as workers’ sex or race, or, at best, few such dimensions at the same time.
In terms of aggregation, studies either analyse measures of workplace diversity that capture the
variation of a demographic characteristic across the entire workforce, such as an entropy index
of workers’ race, or similarity measures between an individual worker and his or her co-work-
ers, such as the share of same-race co-workers at a workplace. However, workplace diversity
and co-worker similarity capture distinct components of workforce demography, such as group
4
dissimilarity and relational demography (Leonard and Levine, 2006; Ilmakunnas and Ilmakun-
nas, 2011; Garnero et al., 2014). They are thus neither orthogonal nor likely to affect workers’
quit behaviour in the same way.
Taking the stance of an individual worker, we expect co-worker similarity to reduce
voluntary turnover. Because of homophily (McPherson et al., 2001), demographically similar
workers are likely to share attitudes, values, and beliefs and for this reason are likely to feel
attracted to each other. Hence, if demographically similar co-workers are more abundant, ce-
teris paribus, we expect an individual worker to be less inclined to quit. This expectation is also
borne out of discrimination theory, where in-group bias gives rise to a taste for discrimination
(Becker, 1971). This taste for discrimination causes workers to suffer a disutility from being
surrounded by dissimilar (out-group) workers, and we expect this disutility, in turn, to increase
workers’ quit rate.
Turning to the workplace level, theoretical predictions on the effect of workplace diver-
sity on workers’ quit rate are less clear-cut. On the one hand, having a more diverse workforce
is expected to hamper communication and conflict resolution (Lang, 1986) and is thus likely to
translate into less cooperation, more conflict, and a higher quit rate. On the other hand, it has
been argued that workers value diversity because they show a love for variety in social interac-
tions (Breit and Horowitz, 1995), which would depress workers’ quit rate.
Furthermore, from the employer’s perspective, dealing with a diverse workforce that is
more prone to conflict is likely to involve higher transaction costs and to harm firm productivity
(Breit and Horowitz, 1995). However, a more diverse workforce may also raise productivity by
enhancing decision making and problem solving (Kochan et al., 2003), by improving the firm’s
adaptability to diverse product market environments (Osborne, 2000), through better
knowledge transfer (Lazear, 1999), or through increased knowledge creation (Berliant and Fu-
jita, 2008). And arguably better firm performance, in turn, facilitates worker retention. Reso-
nating these conflicting predictions, studies have reached mixed conclusions on the productivity
5
effect of workforce diversity (e.g. Barrington and Troske, 2001; Ozgen and De Graff, 2013;
Parrotta et al., 2014; and Trax et al., 2015). Therefore, it remains unclear how diversity affects
workers’ quit behaviour.
In terms of internal and external validity, “[c]onvincing studies are rare in part because
it is challenging to measure the effects of workplace diversity” (Leonard and Levine, 2006:
548). Problems arise not only because one needs to have detailed information on the entire
workforce to construct measures of co-worker similarity and workplace diversity along differ-
ent demographic dimensions, but also because of workplace unobservables that influence
worker turnover, such as local labour market conditions, management practices, job content,
training opportunities, etc. Absent truly random variation in workplace demography, omitting
these workplace unobservables would yield bias, and to mitigate concerns one would thus like
to control for workplace fixed effects in longitudinal data, which are rarely available to re-
searchers.
To the best of our knowledge, Leonard and Levine (2006) is the only study in the liter-
ature that investigates how co-worker similarity and workplace diversity along the sex, race,
and age dimension affect workers’ overall turnover rate based on a credible research design.
They analyse longitudinal data for over 800 workplaces of one large multi-establishment ser-
vice-sector employer in the U.S. during an observation period of 30 months in 1996–1998. In
contrast to existing observational studies, their data comprise many demographically varied
workplaces and contain variation in workforce composition within workplaces, so that they can
control for permanent unobserved workplace characteristics. Fitting linear probability models
that account for workplace fixed effects, they find no consistent evidence that workplace diver-
sity affects turnover, whereas co-worker similarity tends to lower the turnover rate.1
That said, Leonard and Levine’s (2006) evidence, albeit superior to existing research in
1 In a companion paper using the same data and the same research design, Giuliano et al. (2011) further find that
workers have lower turnover and higher promotion rates when staff and managers are of the same race pointing at the racial composition of superiors as another relevant dimension of workforce demography.
6
terms of internal validity, is still borne out of data for a single large employer from the service
industry within a short observational window and thus refers to a very specific setting. In par-
ticular, the jobs under consideration are part-time jobs with very high turnover that only require
basic skills and where workers receive only little training. It thus remains unclear whether their
findings generalise to other settings, such as long-lasting jobs involving high (specific) human
capital or jobs in different industries and occupations. What is more, they just examine overall
turnover, but not voluntary turnover initiated by workers. Yet, only investigating workforce
demography’s effect on voluntary turnover allows drawing conclusions on workers’ prefer-
ences about workforce diversity and co-worker similarity. In contrast, our analysis considers
all full-time jobs held at a representative sample of large workplaces in the West German man-
ufacturing industry over an observation window spanning more than four decades and examines
workers’ job-to-job turnover as a proxy of voluntary turnover.
3 Data and empirical strategy
3.1 Administrative linked employer–employee data
In our empirical analysis of the impact of workplace demography on voluntary turnover, we
will fit duration models for workers’ job-to-job transition rate on administrative linked em-
ployer–employee data for West Germany that encompass the years 1975–2016. Our data stem
from the Integrated Employment Biographies (IEB) provided by the Institute for Employment
Research (IAB) that are based on the notification procedure of the German health, pension, and
unemployment insurances (for details on the IEB, see Jacobebbinghaus and Seth, 2007). This
notification procedure requires employers to report all the information on their workers that is
necessary to calculate social security contributions and thus renders these highly reliable data
especially suited for analysing job durations and wages. Overall, the IEB covers about 80 per-
7
cent of all people employed in Germany and contains information on those workers’ job dura-
tions (at daily frequency), daily gross wages (deflated by the consumer price index), occupation,
and individual characteristics (sex, age, education, and nationality). Absent from the data are
civil servants and the self-employed, who do not contribute to the social security system.
The IEB data further include identifiers that allow us to assign workers and their jobs to
plants, i.e. single production sites or workplaces, so that we can assume that there is interaction
between workers at their workplaces (see also Cornelissen et al., 2017). To arrive at our sample,
we select out of the universe of the IEB all workers holding jobs in a stratified 15 percent
random sample of large workplaces in the manufacturing sector in West Germany, where re-
stricting to large workplaces allows workforce demography to vary smoothly along several of
its dimensions.2 We define five strata over plant size comprising the intervals 200–299, 300–
399, 400–499, 500–999, and at least 1000 workers and assign a workplace to one of the size
intervals whenever its minimum workforce during our period of observation lies within this
interval. Furthermore, we exclude all workplaces that change their sector classification and that
we observe for less than ten years, which leads to a sample of workplaces where stable, long-
lasting jobs are possible.
In the workplaces in our sample, we consider an inflow sample of all non-managerial
jobs (based on occupational codes) that started after 1st January 1975, which is the first day
observed in the IEB, and follow these jobs until they either end with the worker leaving the
current employer (i.e. until a job separation) or until 31st December 2016, in which case the job
duration is right-censored at this point. We further ignore job separations if the same employer
recalls the worker within three months. In contrast to many studies on workers’ job mobility –
as well as to other papers using other data sets generated from the IAB data, such as Boockmann
and Steffes (2010), Hirsch et al. (2010), and Schaffner (2011) –, the high frequency and the
2 We exclude East German workplaces because information on the jobs held in these is only available from 1992
onward.
8
long time span of our data set allows us to fit duration models on an inflow sample of possibly
long-lasting jobs thereby accounting for left-truncation and right-censoring of job durations.
Whereas the information on job durations and daily gross wages included in our data is
highly reliable, the data do not contain detailed information on hours worked. In addition, wages
are top-coded at the social security contribution ceiling. Since we include workers’ entry wage
and wage growth as covariates in our duration models, we decided to deal with these drawbacks
by considering jobs of full-time workers only, for whom wages are comparable, and by imput-
ing wages above the contribution ceiling using a heteroscedastic single imputation approach
developed by Büttner and Rässler (2008) for the IAB data. Furthermore, information on work-
ers’ education is provided by employers on a voluntary basis and is therefore inconsistent or
missing for some workers. To mitigate this problem, we impute the missing information on
education by employing a procedure proposed by Fitzenberger et al. (2008) that allows incon-
sistent education information to be corrected.
3.2 Measuring voluntary turnover and workforce demography
Clearly, considering overall job separations mixes up both employer-initiated involuntary dis-
missals and worker-initiated voluntary quits, where only quits following changing workplace
demography are informative on workers’ preferences. In our data, we cannot directly distin-
guish employer-initiated and worker-initiated separations, but we do observe whether jobs end
with a separation to employment, which refers to a new job with another plant, or with a sepa-
ration to non-employment, which refers to a subsequent period of registered unemployment or
no observation in the IEB data at all.3 In line with evidence from other German data sources
3 The latter implies either that the worker has changed to non-employment without receiving unemployment
benefits or that he or she has become, for instance, self-employed and is not recorded in the IEB data. Although our data do not permit us to disaggregate this category of unknown destination, information from other German data sets suggests that the vast majority of workers in this category have indeed moved into non-employment and misclassification is only a minor issue (see, e.g., Hirsch et al., 2018, for a comparison of the administrative data we use to the German Socio-Economic Panel that entails for example self-employment).
9
(see, e.g., Hirsch, 2016, for a comparison to the Socio-Economic Panel that allows distinguish-
ing voluntary and involuntary turnover), we argue that separations to employment primarily
mirror worker-initiated turnover whereas separations to non-employment predominantly mirror
employer-initiated turnover and, therefore, proxy voluntary turnover by considering workers’
job-to-job separation rate. In a later check of robustness, we will scrutinise whether our findings
are sensitive to restricting to job-to-job moves or carry over when considering overall turnover.
In our data, we observe all workers in a workplace and, thus, we can use the information
on individual workers to arrive at workplace-level and individual-level information on work-
force demography. In our analysis, we will consider workforce demography along the sex, na-
tionality, education, age, and tenure dimension both from the individual worker’s perspective
in terms of co-worker similarity and from the overall workplace perspective in terms of work-
force diversity.
Specifically, for the three dimensions of workforce demography measured at nominal
scale we distinguish female and male workers, German and non-German workers, as well as
low-skilled (i.e. no vocational training), medium-skilled (i.e. with vocational training), and
high-skilled (i.e. with academic education) workers. To capture co-worker similarity along
these three dimensions, we consider the shares of same-sex, same-nationality, and same-educa-
tion workers in the workforce of the workplace.
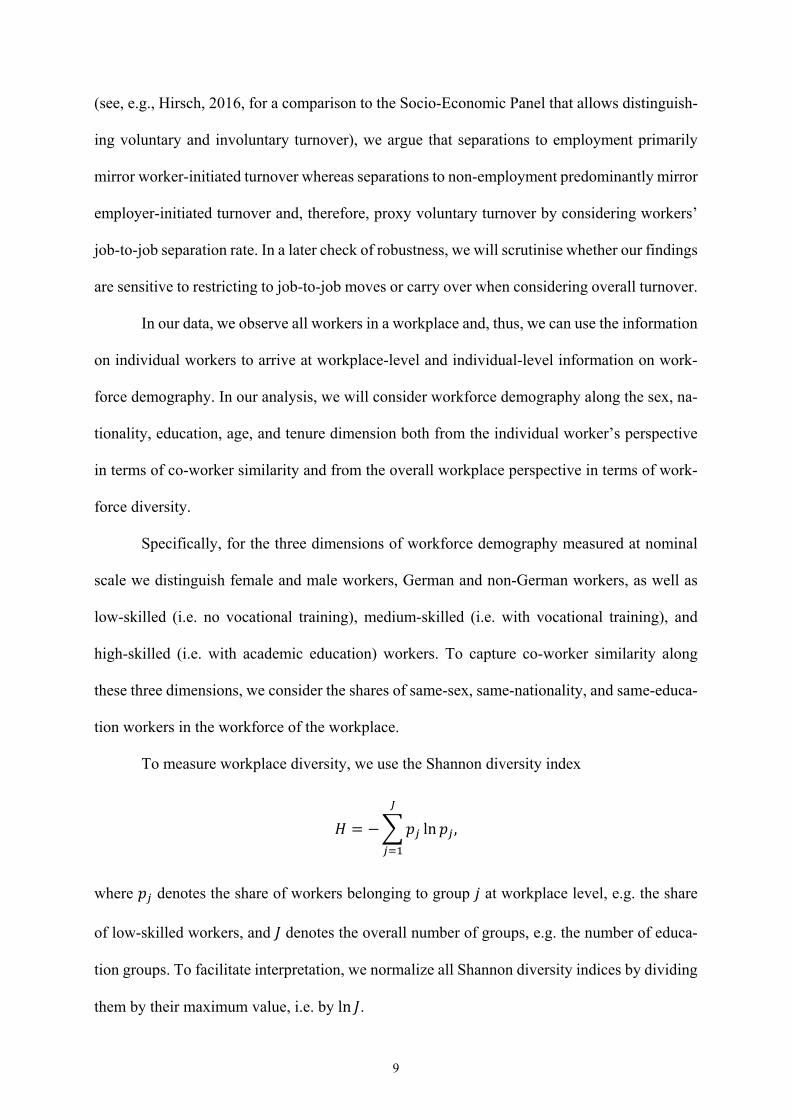
To measure workplace diversity, we use the Shannon diversity index
𝐻 𝑝 ln 𝑝 ,
where 𝑝 denotes the share of workers belonging to group 𝑗 at workplace level, e.g. the share
of low-skilled workers, and 𝐽 denotes the overall number of groups, e.g. the number of educa-
tion groups. To facilitate interpretation, we normalize all Shannon diversity indices by dividing
them by their maximum value, i.e. by ln 𝐽.

10
For the two metric dimensions of workforce demography, age and tenure, we capture
co-worker similarity by considering the share of co-workers with the same age, i.e. co-workers
neither older nor younger than two and a half years compared to the worker, and the share of
co-workers with the same tenure, i.e. neither longer nor shorter tenure than six months com-
pared to the worker. As measures of workplace diversity, we use the standard deviation in
workers’ age and tenure at workplace level.
3.3 Econometric approach
To investigate how workforce demography affects workers’ job-to-job turnover rate, we fit
hazard rate models for the duration of non-managerial jobs including our measures of co-worker
similarity and workplace diversity. As a baseline specification, we model the instantaneous job-
to-job separation rate of non-managerial job 𝑖 at workplace 𝑗 𝑖 held by worker 𝑚 𝑖 as a Cox
model
𝑠 𝑡 𝐱 𝑡 , 𝐳 𝑡 𝑠 𝑡 exp 𝐱 𝑡 𝜷 𝐳 𝑡 𝜸 ,
where 𝑠 𝑡 denotes the baseline hazard depending on job duration 𝑡, 𝐱 𝑡 is a vector of
worker covariates including our measures of co-worker similarity, 𝐳 𝑡 is a vector of work-
place covariates including our measures of workforce diversity, and 𝜷 and 𝜸 are vectors of
coefficients. Our main point of interest are the coefficients of our measures of workforce de-
mography that inform us on how larger co-worker similarity and workplace diversity along the
sex, nationality, education, age, and tenure dimension affects the job-to-job turnover rate prox-
ying voluntary turnover.
As worker controls, we include groups of dummies for age (in five year intervals), edu-
cation, and occupation, a sex dummy, and a dummy for non-German citizenship, the worker’s
log entry wage as well as the log wage growth, i.e. the log difference between the current and
the entry wage. On top of standard demographic drivers of workers’ turnover rate identified in
11
the previous literature (briefly surveyed in the introduction), inclusion of entry wages and wage
growth is important because previous research, in particular the seniority wage literature initi-
ated by Lazear (1979), has shown that high-wage (growth) employers experience lower volun-
tary turnover (Bronars and Famulari, 1997; Zwick, 2012).
Workplace controls include groups of share variables that capture the composition of
the workforce along the sex, nationality, education, age, and tenure dimension (the latter two in
five-year intervals), dummies for two-digit industry and plant size, a full set of year dummies,
and two dummy variables indicating an expanding or a shrinking workforce (by more than 10
percent), respectively.4 The latter two variables are meant to control for employers’ hiring and
firing behaviour. Previous studies, such as Varejão and Portugal (2007), have established
marked non-convexities in employment adjustment costs meaning that labour adjustment is
expected to be lumpy and that phases of active hiring and firing are visible from large changes
in the workforce. Such phases of active employment adjustment, in turn, may not only trigger
changes in workforce demography but also changes in (unobserved) worker quality with, as a
case in point, “surviving” workers during a phase of active firing being high-quality workers
likely to have better outside options and thus a higher quit rate. To avoid bias stemming from
such active hiring and firing, we control for large changes in the workforce.
One obvious concern with our Cox regression is omitted variables bias stemming from
unobserved workplace characteristics that are correlated with voluntary turnover. To address
4 Hence, the Cox regression includes a dummy variable indicating whether a job belongs to an individual worker
who, say, is female, the share of female workers in the workforce, and the share of same-sex workers in the workforce at individual level. Intuitively, this means that in essence the impact of co-worker sex similarity is identified from the differential effect of the share of female workers for male and female workers or, in other words, from an interaction effect of the female dummy and the female share. Yet, we decided against including this interaction in the Cox regressions and stuck to the share of same-sex workers because estimating the in-teraction effect renders interpretation very cumbersome. As a side remark, since identification of the effect of co-worker sex similarity in essence rests on an interaction effect of the female dummy and the female share, it is not possible to check for heterogeneous effects for female and male workers in separate Cox regressions, and analogously for other dimensions of workforce demography.
12
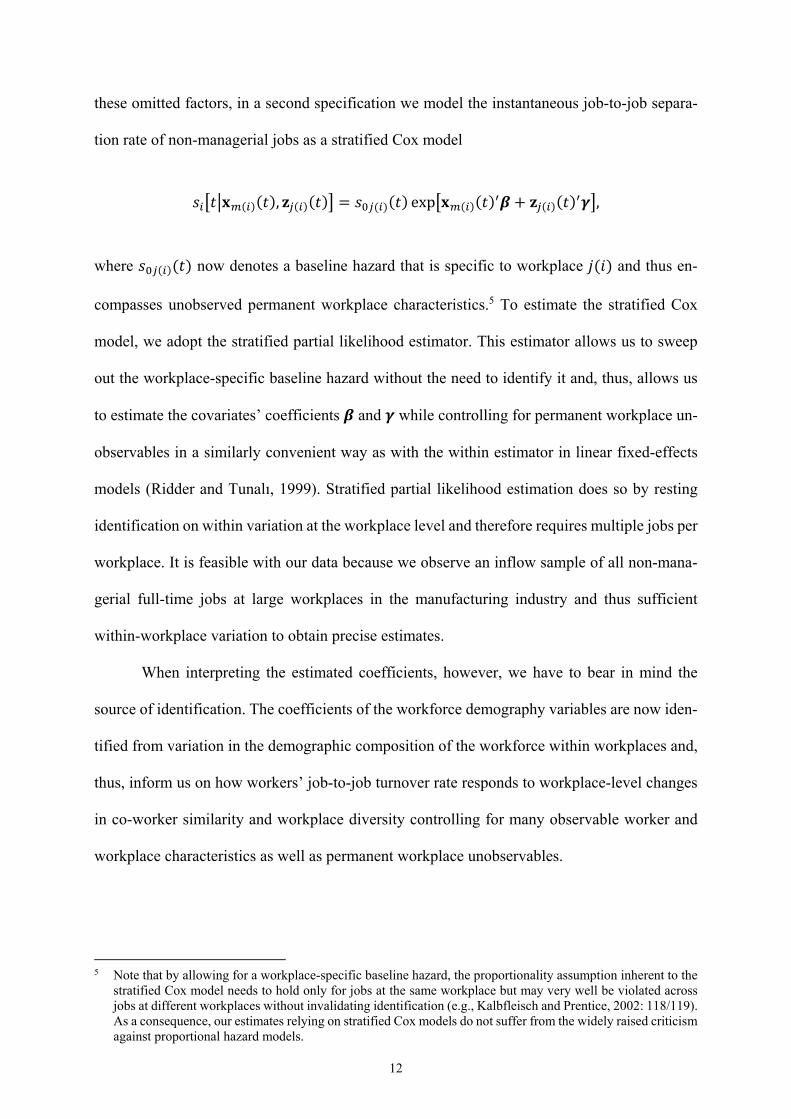
these omitted factors, in a second specification we model the instantaneous job-to-job separa-
tion rate of non-managerial jobs as a stratified Cox model
𝑠 𝑡 𝐱 𝑡 , 𝐳 𝑡 𝑠 𝑡 exp 𝐱 𝑡 𝜷 𝐳 𝑡 𝜸 ,
where 𝑠 𝑡 now denotes a baseline hazard that is specific to workplace 𝑗 𝑖 and thus en-
compasses unobserved permanent workplace characteristics.5 To estimate the stratified Cox
model, we adopt the stratified partial likelihood estimator. This estimator allows us to sweep
out the workplace-specific baseline hazard without the need to identify it and, thus, allows us
to estimate the covariates’ coefficients 𝜷 and 𝜸 while controlling for permanent workplace un-
observables in a similarly convenient way as with the within estimator in linear fixed-effects
models (Ridder and Tunalı, 1999). Stratified partial likelihood estimation does so by resting
identification on within variation at the workplace level and therefore requires multiple jobs per
workplace. It is feasible with our data because we observe an inflow sample of all non-mana-
gerial full-time jobs at large workplaces in the manufacturing industry and thus sufficient
within-workplace variation to obtain precise estimates.
When interpreting the estimated coefficients, however, we have to bear in mind the
source of identification. The coefficients of the workforce demography variables are now iden-
tified from variation in the demographic composition of the workforce within workplaces and,
thus, inform us on how workers’ job-to-job turnover rate responds to workplace-level changes
in co-worker similarity and workplace diversity controlling for many observable worker and
workplace characteristics as well as permanent workplace unobservables.
5 Note that by allowing for a workplace-specific baseline hazard, the proportionality assumption inherent to the
stratified Cox model needs to hold only for jobs at the same workplace but may very well be violated across jobs at different workplaces without invalidating identification (e.g., Kalbfleisch and Prentice, 2002: 118/119). As a consequence, our estimates relying on stratified Cox models do not suffer from the widely raised criticism against proportional hazard models.
13
3.4 Threats to identification
Yet, one may still wonder whether it is legitimate to consider the responses in workers’ job-to-
job turnover to varying workforce demography as causal effects. In other words, one may doubt
the exogeneity of the co-worker similarity and workforce diversity variables in the stratified
Cox regression because we lack credible quasi-experimental variation in these.
Clearly, within-workplace changes in workforce demography could be regarded as ex-
ogenous if employers hired workers without giving thought on how these workers’ demo-
graphic characteristics feedback into workplace demography and voluntary turnover and if
workers entered jobs without caring for workforce demography, either. Turning to employers,
they may simply neglect such side effects of recruiting because in adjusting their employment
they mainly react to the current labour market situation or the (expected) demand for their goods
(as argued by Pfeffer, 1985). Furthermore, the identifying transient fluctuations of workforce
demography (around the permanent levels controlled for by the fixed workplace effects) may
stem from sources outside the employer’s control, such as labour market imperfections origi-
nating in information asymmetries and mobility costs or worker voice institutions like works
councils.
Crucially, though, even if they wanted to, employers could not simply change single
components of workforce demography in isolation. As a case in point, increasing co-worker
similarity for one type of worker, e.g. for high-skilled workers, inevitably decreases co-worker
similarity for other types of workers, viz. for low-skilled and medium-skilled workers. Simi-
larly, changing workplace diversity necessarily involves raising co-worker similarity for some
types of workers and lowering co-worker similarity for other types. Hence, any employment
adjustment will imminently induce temporary fluctuations in workforce demography that affect
workers’ voluntary turnover. And we suspect employers not to care much – nor to be able to do
so – about such transient fluctuations in workforce demography since these yield (unintended)
14
temporary costs that are likely to be small (permanent differences are taken care of by the work-
place fixed effects).
That said, the last decades have seen increased interest in the “business case for diver-
sity” from managers and scientists alike (see Kochan et al., 2003, for a detailed discussion) and
more engagement in diversity-management practices. Employers’ attempts to manage diversity
may thus render workplace diversity in part endogenous, although controlling for time and
workplace fixed effects takes care of general economy-wide trends towards more workforce
diversity as well as permanent differences in diversity across workplaces. Yet, we cannot rule
out that our estimated effects of workplace diversity still suffer from some bias (though, some-
what reassuringly, we observe little trending in average workplace diversity over time, see be-
low). At a minimum, we argue that workplace diversity measures serve as suitable control var-
iables when turning to the effects of co-worker similarity from the individual worker’s perspec-
tive that cannot be managed by employers but is closely intertwined with workplace-level
changes in diversity.
Turning to workers, one may wonder whether workers who, as we hypothesised, prefer
demographically similar co-workers may select into jobs based on workforce demography. This
self-selection of workers, however, hinges on workforce demography being observable to
workers before starting the job, and workforce demography is arguably hard to assess from the
outside. What is more, workers applying for a job are unlikely to select themselves into jobs
based on transient fluctuations in workforce demography, with permanent differences across
workplaces controlled for in the stratified Cox regression.
In summary, we feel confident that given the non-experimental nature of our data the
stratified Cox regression comes as close as possible to credibly identify the causal effect of co-
worker similarity and, perhaps to a somewhat lesser degree, the causal effect of workplace di-
versity on workers’ job-to-job turnover rate. Hence, we think that our estimates permit us to
shed light on workers’ preferences about workforce demography, in particular about co-worker

15
similarity.
4 Results
4.1 Descriptive analysis
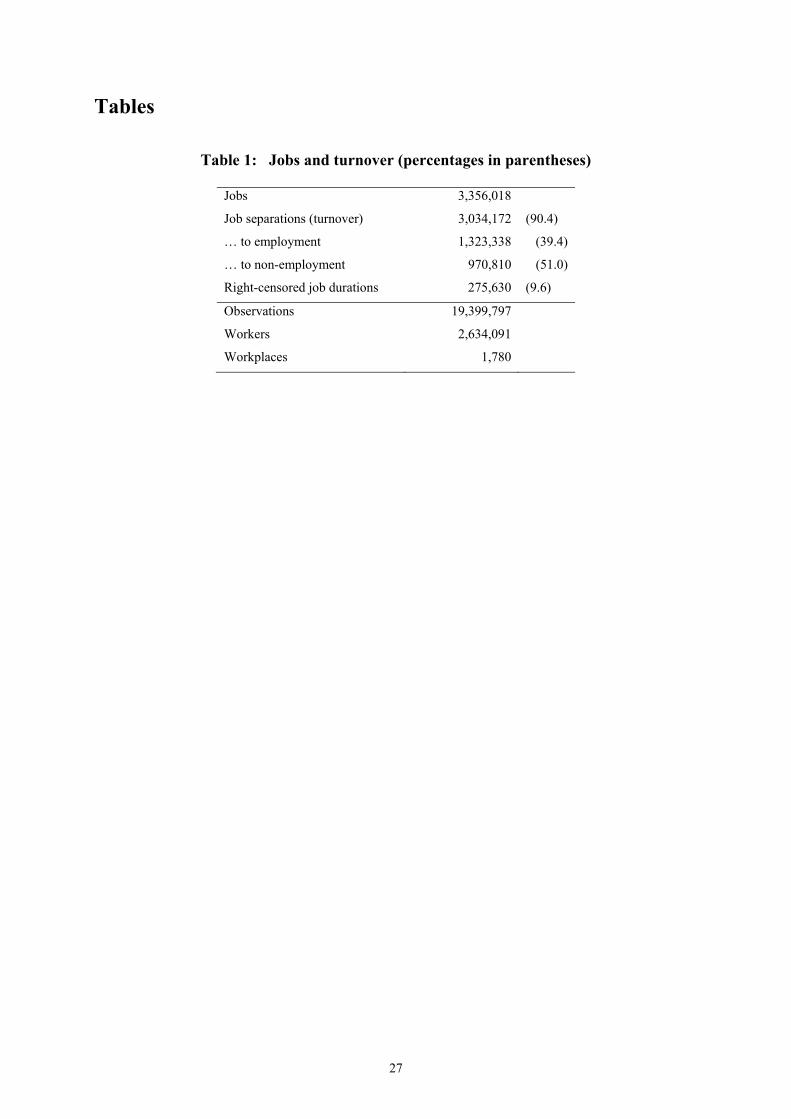
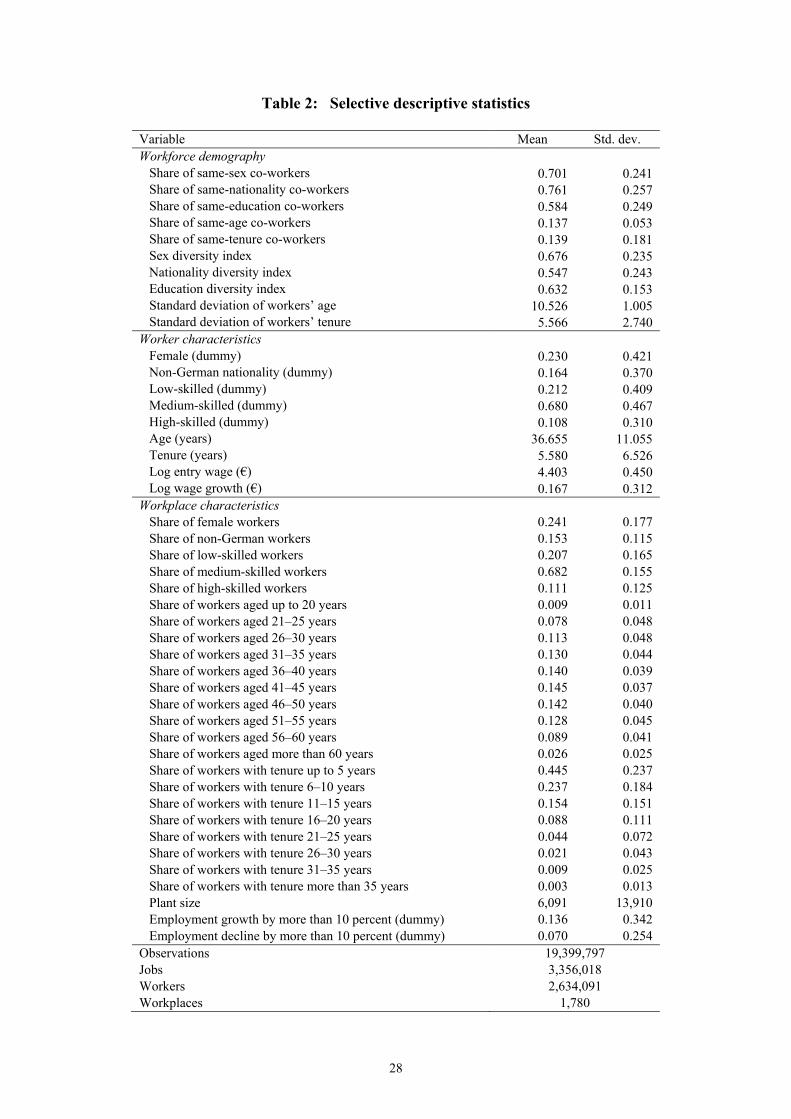
Before turning to the Cox regressions, we present some descriptive evidence based on the in-
flow sample of all the 3,356,018 non-managerial jobs held by 2,634,091 workers during the
period 1975–2016 in our representative sample of 1,780 large manufacturing workplaces in
West Germany. As is seen from Table 1, about 40 percent of jobs end with a separation to
employment, our proxy for workers’ voluntary turnover rate, roughly 50 percent involve a sep-
aration to non-employment, and 10 percent are right-censored in that they did not end before
31st December 2016 (for further descriptive statistics, see Table 2).
Remarkably and in contrast to recent contributions claiming that workplace diversity
shows a secular upward trend (e.g. Kochan et al., 2003; Parrotta et al., 2014), we do not observe
such a secular rise in our workplace-level data. Based on yearly medians of our workplace
diversity measures along the sex, nationality, education, age, and tenure dimension reported in
Table 3, we see little trending at all. For the typical worker, workplace diversity did not change
much over our four decades of data. The sole exception is the tenure dimension, but the apparent
upward trend here simply reflects a data artefact borne out of the fact that workers’ tenure is
left-censored at 1st January 1975 (i.e. the starting date of the IEB data records). Our inflow
sample results in overstated tenure similarity and understated tenure diversity in early years and
thus contaminates descriptive analyses. In our Cox regressions, this problem is taken care of by
the year fixed effects, and we also checked whether confining our analysis to the later part of
our observational window, where the censoring loses bite, altered our findings, which it did not.
Notably, the absence of clear trending in our diversity measures is at odds with the notion that
employers’ diversity-management practices led to a rise in workplace diversity and alleviates
16
concerns to some extent that active diversity management poses a major threat to identification,
as discussed in the previous section.
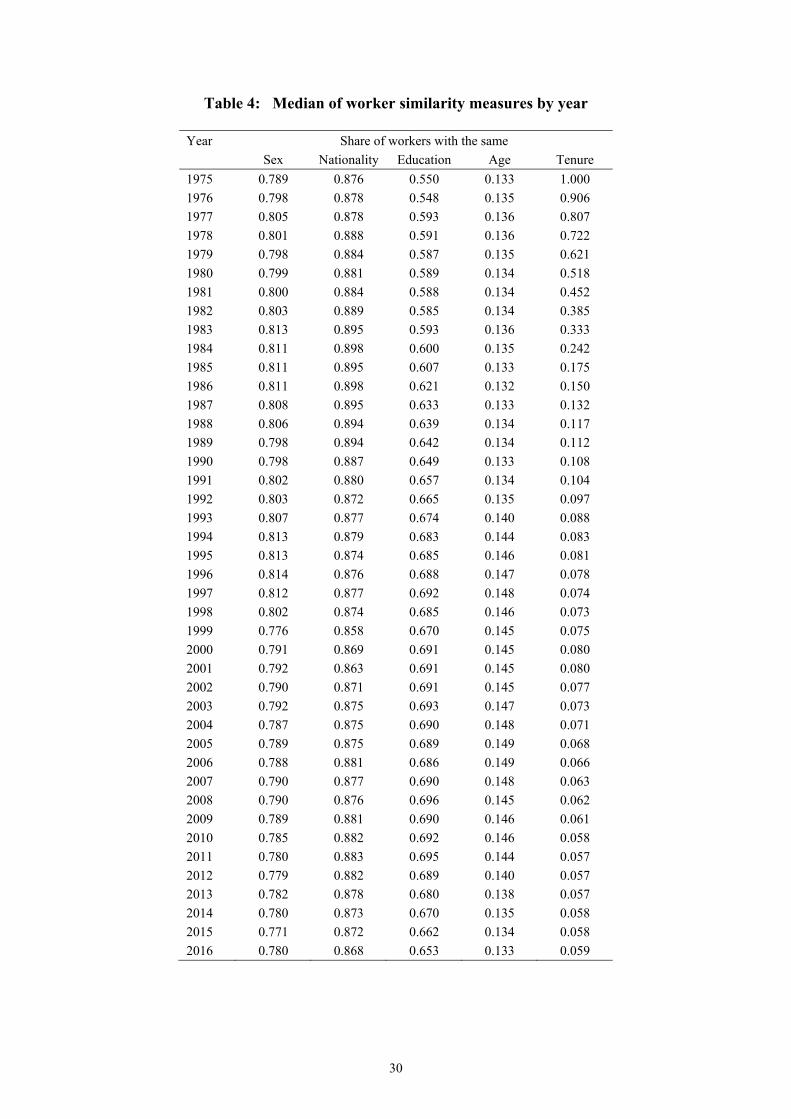
Turning to co-worker similarity (see Table 4), we do not see much trending either, with
the exception of the education (and, again, by construction the tenure) dimension. The median
share of same-education co-workers rises from about 55 percent to 65 percent in the first one
and a half decades of our observational window and then oscillates between 65 percent and 70
percent. The initial rise is likely to mirror the impact of education expansion in Germany during
the 1960s and 1970s on the inflow of workers starting new jobs in our sample of workplaces.
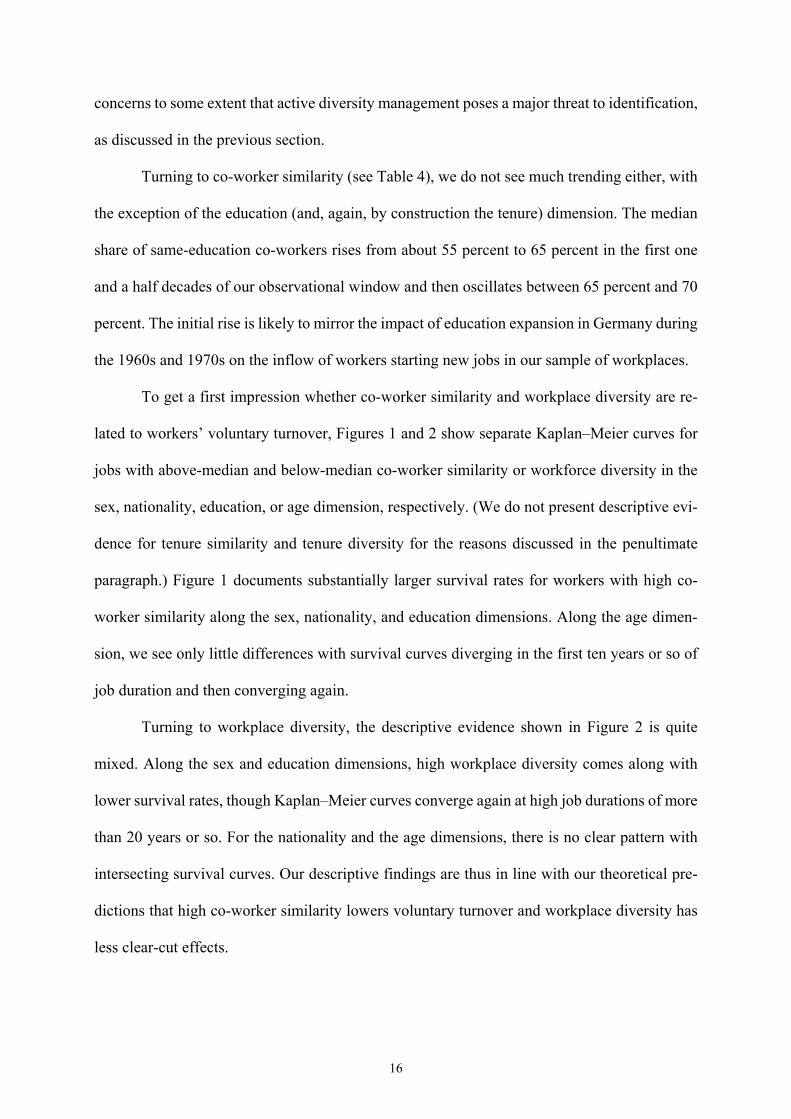
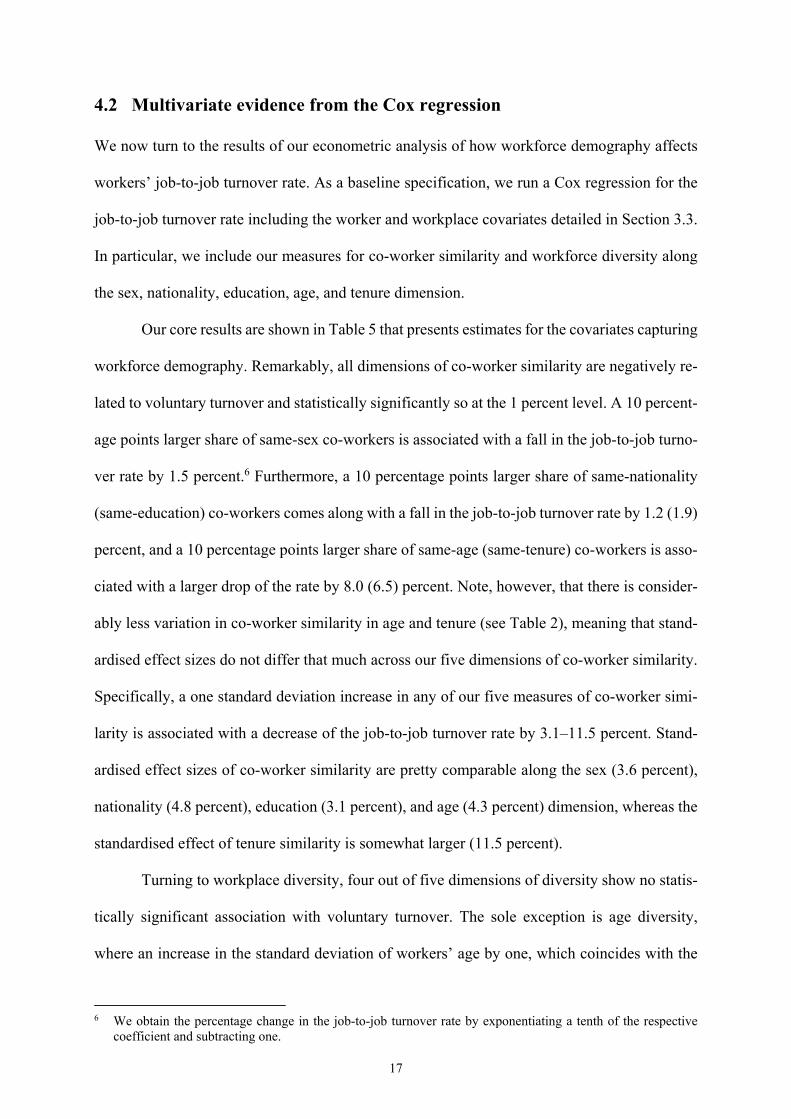
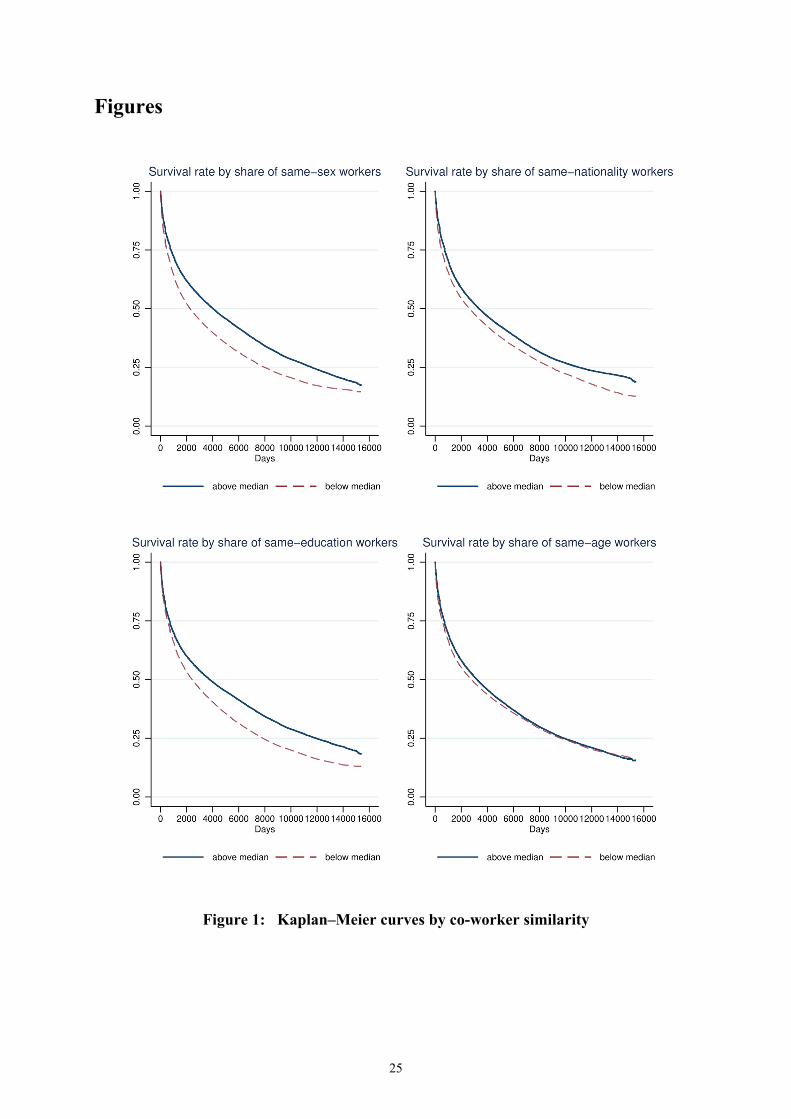
To get a first impression whether co-worker similarity and workplace diversity are re-
lated to workers’ voluntary turnover, Figures 1 and 2 show separate Kaplan–Meier curves for
jobs with above-median and below-median co-worker similarity or workforce diversity in the
sex, nationality, education, or age dimension, respectively. (We do not present descriptive evi-
dence for tenure similarity and tenure diversity for the reasons discussed in the penultimate
paragraph.) Figure 1 documents substantially larger survival rates for workers with high co-
worker similarity along the sex, nationality, and education dimensions. Along the age dimen-
sion, we see only little differences with survival curves diverging in the first ten years or so of
job duration and then converging again.
Turning to workplace diversity, the descriptive evidence shown in Figure 2 is quite
mixed. Along the sex and education dimensions, high workplace diversity comes along with
lower survival rates, though Kaplan–Meier curves converge again at high job durations of more
than 20 years or so. For the nationality and the age dimensions, there is no clear pattern with
intersecting survival curves. Our descriptive findings are thus in line with our theoretical pre-
dictions that high co-worker similarity lowers voluntary turnover and workplace diversity has
less clear-cut effects.
17
4.2 Multivariate evidence from the Cox regression
We now turn to the results of our econometric analysis of how workforce demography affects
workers’ job-to-job turnover rate. As a baseline specification, we run a Cox regression for the
job-to-job turnover rate including the worker and workplace covariates detailed in Section 3.3.
In particular, we include our measures for co-worker similarity and workforce diversity along
the sex, nationality, education, age, and tenure dimension.
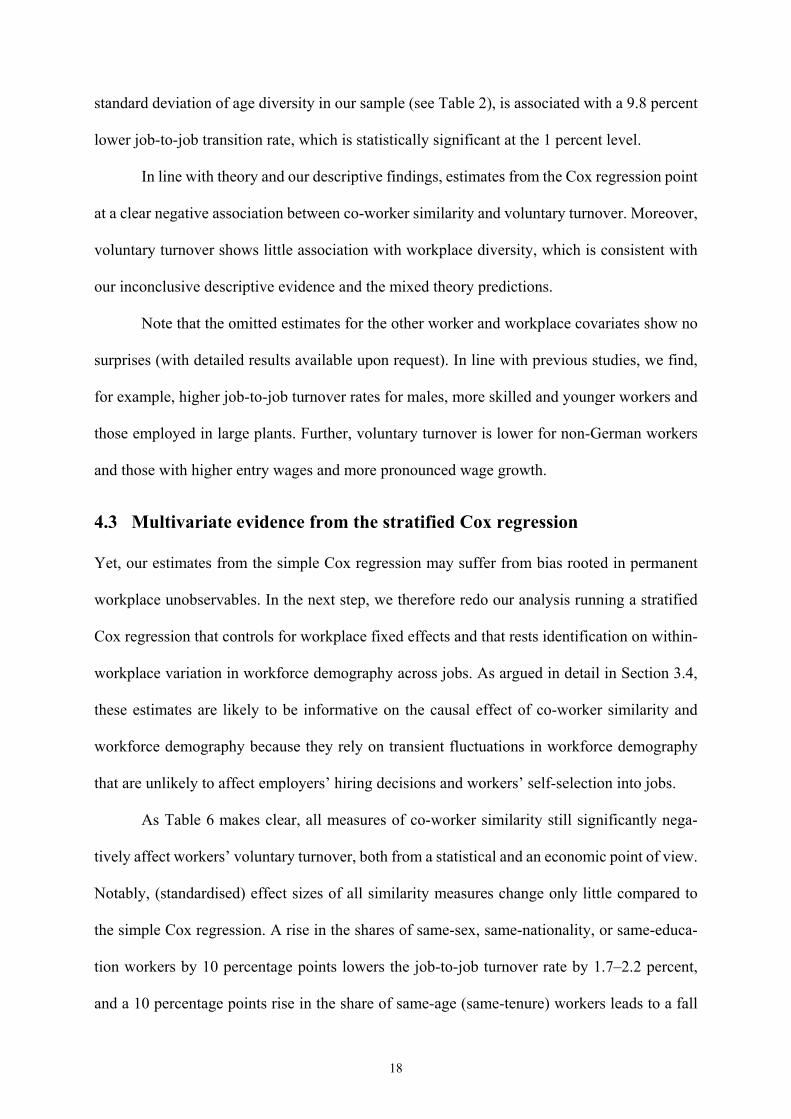
Our core results are shown in Table 5 that presents estimates for the covariates capturing
workforce demography. Remarkably, all dimensions of co-worker similarity are negatively re-
lated to voluntary turnover and statistically significantly so at the 1 percent level. A 10 percent-
age points larger share of same-sex co-workers is associated with a fall in the job-to-job turno-
ver rate by 1.5 percent.6 Furthermore, a 10 percentage points larger share of same-nationality
(same-education) co-workers comes along with a fall in the job-to-job turnover rate by 1.2 (1.9)
percent, and a 10 percentage points larger share of same-age (same-tenure) co-workers is asso-
ciated with a larger drop of the rate by 8.0 (6.5) percent. Note, however, that there is consider-
ably less variation in co-worker similarity in age and tenure (see Table 2), meaning that stand-
ardised effect sizes do not differ that much across our five dimensions of co-worker similarity.
Specifically, a one standard deviation increase in any of our five measures of co-worker simi-
larity is associated with a decrease of the job-to-job turnover rate by 3.1–11.5 percent. Stand-
ardised effect sizes of co-worker similarity are pretty comparable along the sex (3.6 percent),
nationality (4.8 percent), education (3.1 percent), and age (4.3 percent) dimension, whereas the
standardised effect of tenure similarity is somewhat larger (11.5 percent).
Turning to workplace diversity, four out of five dimensions of diversity show no statis-
tically significant association with voluntary turnover. The sole exception is age diversity,
where an increase in the standard deviation of workers’ age by one, which coincides with the
6 We obtain the percentage change in the job-to-job turnover rate by exponentiating a tenth of the respective
coefficient and subtracting one.
18
standard deviation of age diversity in our sample (see Table 2), is associated with a 9.8 percent
lower job-to-job transition rate, which is statistically significant at the 1 percent level.
In line with theory and our descriptive findings, estimates from the Cox regression point
at a clear negative association between co-worker similarity and voluntary turnover. Moreover,
voluntary turnover shows little association with workplace diversity, which is consistent with
our inconclusive descriptive evidence and the mixed theory predictions.
Note that the omitted estimates for the other worker and workplace covariates show no
surprises (with detailed results available upon request). In line with previous studies, we find,
for example, higher job-to-job turnover rates for males, more skilled and younger workers and
those employed in large plants. Further, voluntary turnover is lower for non-German workers
and those with higher entry wages and more pronounced wage growth.
4.3 Multivariate evidence from the stratified Cox regression
Yet, our estimates from the simple Cox regression may suffer from bias rooted in permanent
workplace unobservables. In the next step, we therefore redo our analysis running a stratified
Cox regression that controls for workplace fixed effects and that rests identification on within-
workplace variation in workforce demography across jobs. As argued in detail in Section 3.4,
these estimates are likely to be informative on the causal effect of co-worker similarity and
workforce demography because they rely on transient fluctuations in workforce demography
that are unlikely to affect employers’ hiring decisions and workers’ self-selection into jobs.
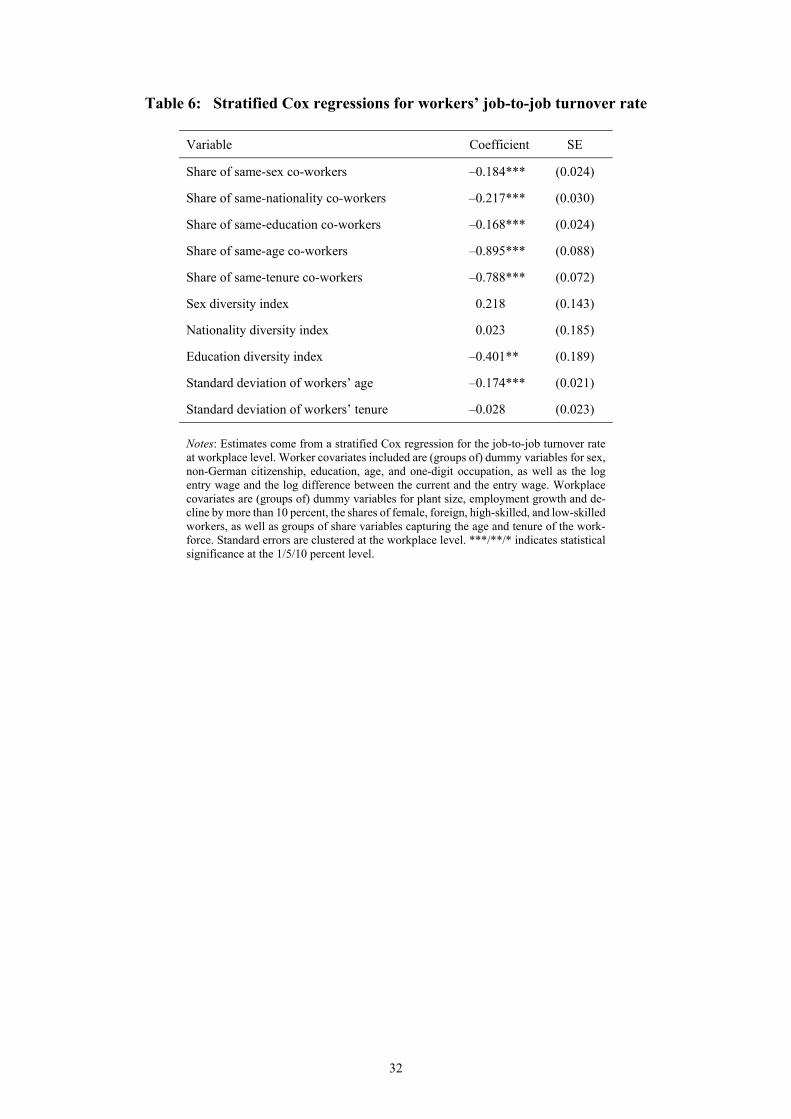
As Table 6 makes clear, all measures of co-worker similarity still significantly nega-
tively affect workers’ voluntary turnover, both from a statistical and an economic point of view.
Notably, (standardised) effect sizes of all similarity measures change only little compared to
the simple Cox regression. A rise in the shares of same-sex, same-nationality, or same-educa-
tion workers by 10 percentage points lowers the job-to-job turnover rate by 1.7–2.2 percent,
and a 10 percentage points rise in the share of same-age (same-tenure) workers leads to a fall
19
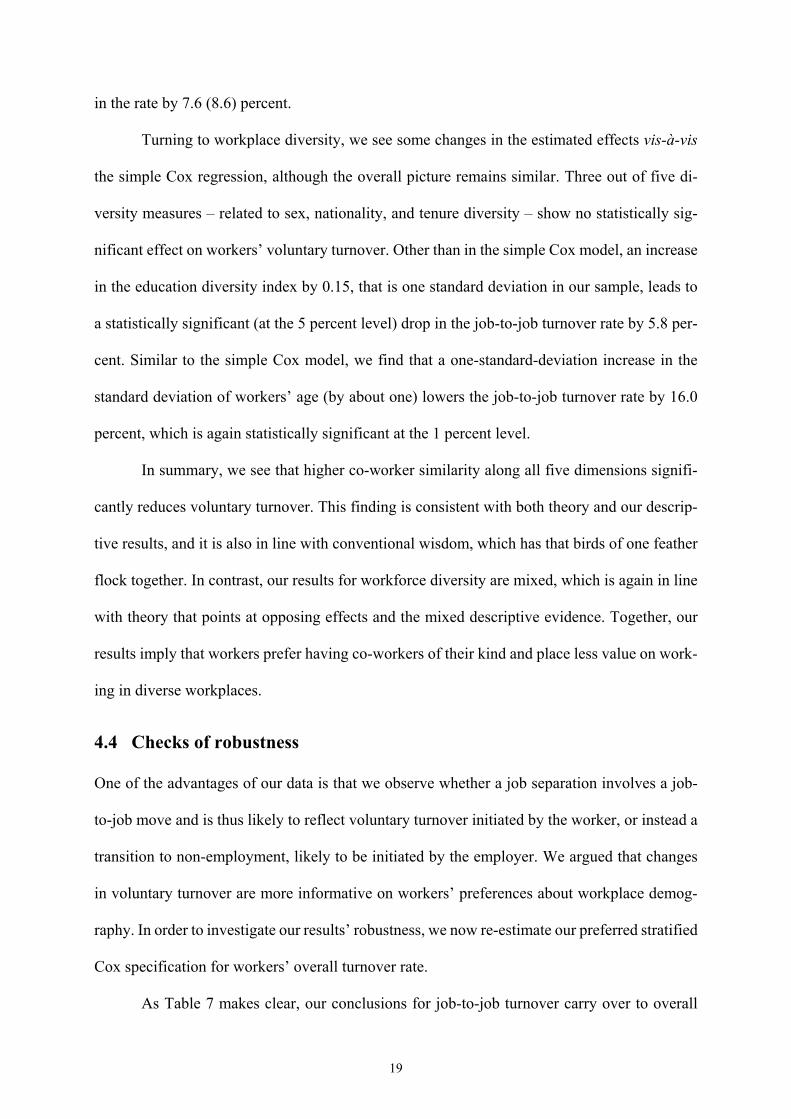
in the rate by 7.6 (8.6) percent.
Turning to workplace diversity, we see some changes in the estimated effects vis-à-vis
the simple Cox regression, although the overall picture remains similar. Three out of five di-
versity measures – related to sex, nationality, and tenure diversity – show no statistically sig-
nificant effect on workers’ voluntary turnover. Other than in the simple Cox model, an increase
in the education diversity index by 0.15, that is one standard deviation in our sample, leads to
a statistically significant (at the 5 percent level) drop in the job-to-job turnover rate by 5.8 per-
cent. Similar to the simple Cox model, we find that a one-standard-deviation increase in the
standard deviation of workers’ age (by about one) lowers the job-to-job turnover rate by 16.0
percent, which is again statistically significant at the 1 percent level.
In summary, we see that higher co-worker similarity along all five dimensions signifi-
cantly reduces voluntary turnover. This finding is consistent with both theory and our descrip-
tive results, and it is also in line with conventional wisdom, which has that birds of one feather
flock together. In contrast, our results for workforce diversity are mixed, which is again in line
with theory that points at opposing effects and the mixed descriptive evidence. Together, our
results imply that workers prefer having co-workers of their kind and place less value on work-
ing in diverse workplaces.
4.4 Checks of robustness
One of the advantages of our data is that we observe whether a job separation involves a job-
to-job move and is thus likely to reflect voluntary turnover initiated by the worker, or instead a
transition to non-employment, likely to be initiated by the employer. We argued that changes
in voluntary turnover are more informative on workers’ preferences about workplace demog-
raphy. In order to investigate our results’ robustness, we now re-estimate our preferred stratified
Cox specification for workers’ overall turnover rate.
As Table 7 makes clear, our conclusions for job-to-job turnover carry over to overall

20
turnover. Still, all five dimensions of co-worker similarity affect turnover in a statistically sig-
nificant way, with very similar effect sizes. Only the effect of education similarity becomes
markedly smaller. This result is borne out of the fact that (except for education similarity) co-
worker similarity also affects turnover into non-employment negatively (results available on
request). Our finding does make sense against the background of our theoretical considerations
in Section 2, where we argued that co-worker similarity improves communication and conflict
resolution. More cooperation and less conflict are likely to reduce workers’ intention to quit,
but they are also likely to reduce employer-initiated layoffs and thus should also depress the
separation rate to non-employment. What is more, our results for the effects of workforce di-
versity do not change much in that most dimensions remain unrelated to turnover.
To scrutinise our results further and to tie them closer to theory, we examine in a further
check of robustness whether co-worker similarity matters more for workers in a strong minority
position where they have just very few co-workers of their kind. If in-group bias and/or ho-
mophily are important, we might hypothesise that an increase in co-worker similarity increases
workers’ inclination to stay in a more pronounced way when they are “isolated” with only few
similar co-workers around than in a situation where at least some modest level of co-worker
similarity is achieved (Leonard and Levine, 2006). To capture this latter possibility, we re-
estimate our stratified Cox specification including our co-worker similarity measures and inter-
actions of these with dummy variables that indicate jobs in the first decile of the respective co-
worker similarity distribution across all jobs in the respective year.
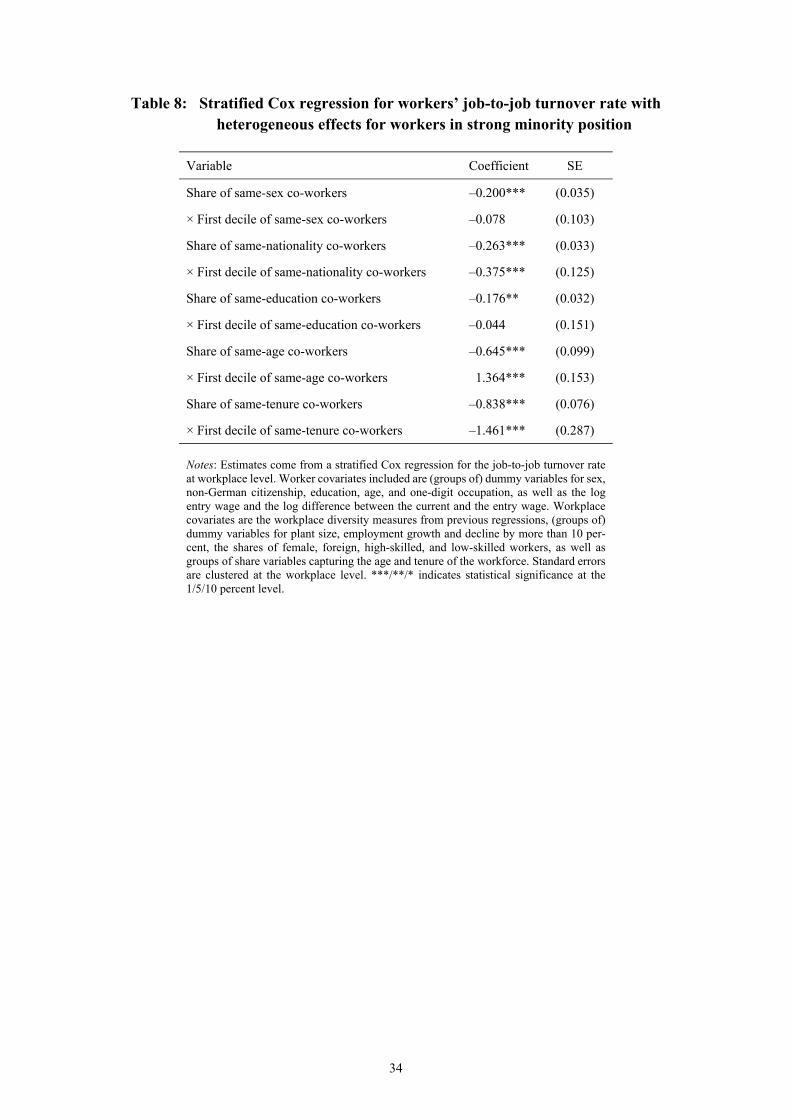
In line with expectations, all but one of the interaction effects are negative, and two of
them are also statistically significant at the 1 percent level. For “isolated” workers in the na-
tionality dimension, an increase in the share of same-nationality co-workers by 10 percentage
points leads to a fall in the job-to-job turnover rate by 6.2 percent whereas the fall accounts to
just 2.6 percent for “non-isolated” workers. Further, for “isolated” workers in the tenure dimen-
sion, an increase in the share of same-tenure co-workers by 10 percent leads to a marked drop

21
in the job-to-job turnover rate by 20.5 percent whereas the fall in the rate for “non-isolated”
workers is 8.0 percent.
The exception to this pattern is co-worker age similarity where the interaction effect is
statistically significantly positive at the 1 percent level and such large in magnitude that it even
reverses the effect of co-worker age similarity for “isolated” workers. Specifically, for “non-
isolated” workers, a rise in the share of same-age co-workers by 10 percentage points leads to
a fall in the job-to-job turnover rate by 6.2 percent. In contrast, for “isolated” workers an even
smaller share of same-age co-workers is followed by a fall rather than a rise in job-to-job turn-
over. Although these results seems puzzling at first sight, one explanation, which we unfortu-
nately cannot substantiate in our data, may be rooted in the observation that for given tenure
(controlled for by the baseline hazard) being part of a very small age cohort disproportionately
raises the probability of being promoted in internal labour markets (as put forward by Keyfitz,
1973, and Stewman and Konda, 1983). Despite in-group bias, age isolation may thus be bene-
ficial to workers in terms of career progress and this side effect may decrease their intention to
quit.
5 Conclusions
This paper has investigated how workforce demography along the sex, nationality, education,
age, and tenure dimension affects voluntary turnover. To that end, we fitted duration models
for workers’ job-to-job turnover rate on a unique rich administrative data set for the years 1975–
2016 that comprises all the full-time jobs in a stratified 15 percent random sample of large
single production sites or workplaces in the West German manufacturing industry. In the dura-
tion models, we included the shares of similar co-workers in the five demography dimensions
to capture co-worker similarity from the individual worker’s perspective as well as Shannon
diversity indices (for nominal variables) or standard deviations (for metric variables) as
22
measures for overall workplace diversity.
In a stratified Cox regression that controls for permanent workplace unobservables, we
documented that all five dimensions of co-worker similarity significantly depress workers’ job-
to-job turnover rate, and tend to exert a larger effect for “isolated” workers in a strong minority
position with only very few similar co-workers around. In contrast to co-worker similarity, re-
sults for workplace diversity are mixed with only two dimensions affecting job-to-job turnover
in a significant way. In a check of robustness, we further saw that effects are very similar for
the overall turnover rate, which lumps together worker-initiated and employer-initiated turno-
ver.
Although we lack credible quasi-experimental variation in workforce demography, we
argue that our estimates are likely to be informative on the causal effect of co-worker similarity
and workplace diversity on voluntary turnover because they rely on transient fluctuations in
workforce demography that are unlikely to affect employers’ hiring decisions and workers’
self-selection into jobs. Our findings suggest that workers prefer having co-workers of their
kind, yet place less value on working in diverse workplaces. They are in line with conventional
wisdom, which has that birds of one feather flock together, and underscore the relevance of in-
group bias (Becker, 1971) and homophily (McPherson et al., 2001) in employment relation-
ships.
23
References
Anderson, P. M., and Meyer, B. D. (1994), “The extent and consequences of job turnover”, Brooking Papers on Economic Activity: Microeconomics, 1994: 177–248.
Barrington, L., and Troske, K. (2001), Workforce Diversity and Productivity: An Analysis of Employer-Employee Matched Data, Economics Program Working Papers 01-02, New York: The Conference Board.
Becker, G. (1971), The Economics of Discrimination, 2nd ed., Chicago, IL: University of Chi-cago Press.
Berliant, M., and Fujita, M. (2008). “Knowledge creation as a square dance on the Hilbert cube”, International Economic Review, 49(4): 1251–1295.
Boockmann, B., and Steffes, S. (2010), “Workers, firms, or institutions: What determines job duration for male employees in Germany?”, Industrial and Labor Relations Review, 64(1): 109–127.
Breit, W., and Horowitz, J. B. (1995), “Discrimination and diversity: Market and non-market settings”, Public Choice, 84(1): 63–75.
Bronars, S. G., and Famulari, M. (1997), “Wage, tenure, and wage growth variation within and across establishments”, Journal of Labor Economics, 15(2): 285–317.
Büttner, T., and Rässler, S. (2008), Multiple imputation of right-censored wages in the German IAB Employment Sample considering heteroscedasticity, IAB Discussion Paper No. 44/2008, Nuremberg: Institute for Employment Research.
Cornelissen, T., Dustmann, C., and Schönberg, U. (2017), “Peer effects in the workplace”, American Economic Review, 107(2): 425–456.
Fitzenberger, B., Osikominu, A., and Völter, R. (2008), “Imputation rules to improve the edu-cation variable in the IAB employment subsample”, Schmollers Jahrbuch, 126(3): 405–436.
Frederiksen, A. (2008), “Gender differences in job separation rates and employment stability: New evidence from employer-employee data”, Labour Economics, 15(5): 915–937.
Garnero, A., Kampelmann, S., and Rycx, F. (2014), “The heterogeneous effects of workforce diversity on productivity, wages, and profits”, Industrial Relations, 53(3): 430–477.
Giuliano, L., Levine, D. I., and Leonard, J. S. (2011), “Racial bias in the manager-employee relationship: An analysis of quits, dismissals, and promotions at a large retails firm”, Journal of Human Resources, 46(1): 26–52.
Griffeth, R. W., Hom, P. W., and Gaertner, S. (2000), “A meta-analysis of antecedents and correlates of employee turnover: Update, moderator tests, and research implications for the next millennium”, Journal of Management, 26(3): 463–488.
Hirsch, B. (2016), “Dual labor markets at work: The impact of employers’ use of temporary agency work on regular workers’ job stability”, Industrial and Labor Relations Review, 69(5): 1191–1215.
Hirsch, B., Jahn, E. J., and Schnabel, C. (2018), “Do employers have more monopsony power in slack labor markets?”, Industrial and Labor Relations Review, 71(3): 676–704.
Hirsch, B., Schank, T., and Schnabel, C. (2010), “Works councils and separations: Voice, mo-nopoly, and insurance effects”, Industrial Relations, 49(4): 566–592.
Ilmakunnas, P., and Ilmakunnas, S.(2011), “Diversity at the workplace: Whom does it benefit?”, De Economist 159(2): 223–255.
Jacobebbinghaus, P., and Seth, S. (2007), “The German Integrated Employment Biographies Sample IEBS”, Schmollers Jahrbuch, 127(2): 335–342.
Joshi, A., Liao, H., and Roh, H. (2011), “Bridging domains in workplace demography research: A review and reconceptualization”, Journal of Management, 37(2): 521–552.
24
Kalbfleisch, J. D., and Prentice, R. L. (2002), The Statistical Analysis of Failure Time Data, 2nd ed., Hoboken, NJ: John Wiley & Sons.
Keyfitz, N. (1973), “Individual mobility in a stationary population”, Population Studies, 27(2): 335–352.
Kochan, T., Bezrukova, K., Ely, R., Jackson, S., Joshi, A., Jehn, K., Leonard, J., Levine, D., and Thomas, D. (2003), “The effects of diversity on business performance: Report of the Diversity Research Network”, Human Resource Management, 42(1): 3–21.
Lang, K. (1986), “A language theory of discrimination”, Quarterly Journal of Economics, 101(2): 362–382.
Lazear, E. P. (1979), “Why is there mandatory retirement?”, Journal of Political Economy, 87(6): 1261–1284.
Lazear, E. P. (1999), “Globalisation and the market for team-mates”, Economic Journal, 109(454): C15–C40.
Leonard, J. S., and Levine, D. I. (2006), “The effect of diversity on turnover: A large case study”, Industrial and Labor Relations Review, 59(4): 547–572.
McPherson, M., Smith-Lovin, L., and Cook, J. M. (2001), “Birds of a feather: Homophily in social networks”, Annual Review of Sociology, 27: 415–444.
Osborne, E. (2000), “The deceptively simple economics of workplace diversity”, Journal of Labor Research, 21(3): 463–475.
Ozgen, C., and De Graff, T. (2013), Sorting out the impact of cultural diversity on innovative firms: An empirical analysis of Dutch micro-data, Norface Migration Discussion Paper No. 2013-12: London: Norface.
Park, T.-Y., and Shaw, J. D. (2013), “Turnover rates and organizational performance: A meta-analysis”, Journal of Applied Psychology, 98(2): 268–309.
Parrotta, P., Pozzoli D. and Pytlikova, M. (2014), “Labor diversity and firm productivity”, Eu-ropean Economic Review, 66: 144–179.
Pfeffer, J. (1985), “Organizational demography: Implications for management”, California Management Review, 28(1): 67–81.
Ridder, G., and Tunalı, İ (1999), “Stratified partial likelihood estimation”, Journal of Econo-metrics, 92(2): 193–232.
Royalty, A. B. (1998), “Job-to-job and job-to-nonemployment turnover by gender and educa-tion level”, Journal of Labor Economics, 16(2): 392–443.
Schaffner, S. (2011), “Heterogeneity in the cyclical sensitivity of job-to-job flows”, Journal for Labour Market Research, 43(4): 263–275.
Stewman, S., and Konda, S. L. (1983), “Careers and organizational labor markets: Demo-graphic models of organizational behavior”, American Journal of Sociology, 88(4): 637–685.
Trax, M., Brunow, S., and Südekum, J. (2015), “Cultural diversity and plant-level productiv-ity”, Regional Science and Urban Economics, 53: 85–96.
Varejão, J., and Portugal, P. (2007), “Employment dynamics and the structure of labor adjust-ment costs”, Journal of Labor Economics, 25(1): 137–165.
Williams, K. Y., and O’Reilly, C. A. (1998), “Demography and diversity in organizations: A review of 40 years of research”, Research in Organizational Behavior, 40: 77–144.
Zwick, T. (2012), “Consequences of seniority wages on the employment structure”, Industrial and Labor Relations Review, 65(6): 108–125.
25
Figures
Figure 1: Kaplan–Meier curves by co-worker similarity

26
Figure 2: Kaplan–Meier curves by workplace diversity
27
Tables
Table 1: Jobs and turnover (percentages in parentheses)
Jobs 3,356,018
Job separations (turnover) 3,034,172 (90.4)
… to employment 1,323,338 (39.4)
… to non-employment 970,810 (51.0)
Right-censored job durations 275,630 (9.6)
Observations 19,399,797
Workers 2,634,091
Workplaces 1,780
28
Table 2: Selective descriptive statistics
Variable Mean Std. dev. Workforce demography Share of same-sex co-workers 0.701 0.241 Share of same-nationality co-workers 0.761 0.257 Share of same-education co-workers 0.584 0.249 Share of same-age co-workers 0.137 0.053 Share of same-tenure co-workers 0.139 0.181 Sex diversity index 0.676 0.235 Nationality diversity index 0.547 0.243 Education diversity index 0.632 0.153 Standard deviation of workers’ age 10.526 1.005 Standard deviation of workers’ tenure 5.566 2.740 Worker characteristics Female (dummy) 0.230 0.421 Non-German nationality (dummy) 0.164 0.370 Low-skilled (dummy) 0.212 0.409 Medium-skilled (dummy) 0.680 0.467 High-skilled (dummy) 0.108 0.310 Age (years) 36.655 11.055 Tenure (years) 5.580 6.526 Log entry wage (€) 4.403 0.450 Log wage growth (€) 0.167 0.312 Workplace characteristics Share of female workers 0.241 0.177 Share of non-German workers 0.153 0.115 Share of low-skilled workers 0.207 0.165 Share of medium-skilled workers 0.682 0.155 Share of high-skilled workers 0.111 0.125 Share of workers aged up to 20 years 0.009 0.011 Share of workers aged 21–25 years 0.078 0.048 Share of workers aged 26–30 years 0.113 0.048 Share of workers aged 31–35 years 0.130 0.044 Share of workers aged 36–40 years 0.140 0.039 Share of workers aged 41–45 years 0.145 0.037 Share of workers aged 46–50 years 0.142 0.040 Share of workers aged 51–55 years 0.128 0.045 Share of workers aged 56–60 years 0.089 0.041 Share of workers aged more than 60 years 0.026 0.025 Share of workers with tenure up to 5 years 0.445 0.237 Share of workers with tenure 6–10 years 0.237 0.184 Share of workers with tenure 11–15 years 0.154 0.151 Share of workers with tenure 16–20 years 0.088 0.111 Share of workers with tenure 21–25 years 0.044 0.072 Share of workers with tenure 26–30 years 0.021 0.043 Share of workers with tenure 31–35 years 0.009 0.025 Share of workers with tenure more than 35 years 0.003 0.013 Plant size 6,091 13,910 Employment growth by more than 10 percent (dummy) 0.136 0.342 Employment decline by more than 10 percent (dummy) 0.070 0.254 Observations 19,399,797 Jobs 3,356,018 Workers 2,634,091 Workplaces 1,780

29
Table 3: Median of workplace diversity measures by year
Year Shannon diversity index Standard deviation
Sex Nationality Education Age Tenure
1975 0.668 0.516 0.668 11.027 0.032
1976 0.657 0.511 0.669 10.712 0.284
1977 0.647 0.504 0.662 10.581 0.629
1978 0.650 0.496 0.665 10.672 0.991
1979 0.644 0.496 0.666 10.703 1.396
1980 0.645 0.511 0.665 10.832 1.831
1981 0.651 0.509 0.667 10.696 2.141
1982 0.647 0.502 0.667 10.813 2.480
1983 0.631 0.476 0.665 10.640 2.696
1984 0.639 0.475 0.666 10.660 3.094
1985 0.642 0.474 0.664 10.784 3.591
1986 0.640 0.463 0.664 11.130 4.131
1987 0.639 0.465 0.663 11.122 4.484
1988 0.643 0.458 0.664 10.959 4.783
1989 0.652 0.464 0.667 10.938 5.116
1990 0.652 0.503 0.662 11.057 5.508
1991 0.651 0.514 0.657 11.012 5.854
1992 0.653 0.514 0.650 10.862 6.053
1993 0.644 0.515 0.649 10.517 6.213
1994 0.639 0.499 0.645 10.277 6.334
1995 0.624 0.528 0.641 10.145 6.584
1996 0.623 0.526 0.641 10.057 6.724
1997 0.629 0.517 0.636 9.997 6.909
1998 0.657 0.512 0.630 10.075 7.094
1999 0.705 0.549 0.647 10.155 7.288
2000 0.669 0.518 0.633 10.074 7.457
2001 0.675 0.536 0.629 10.060 7.571
2002 0.667 0.519 0.630 10.004 7.613
2003 0.673 0.515 0.627 9.920 7.738
2004 0.684 0.513 0.636 9.851 7.631
2005 0.661 0.512 0.649 9.877 7.527
2006 0.680 0.499 0.633 9.881 7.477
2007 0.674 0.509 0.630 9.971 7.510
2008 0.673 0.506 0.628 10.137 7.699
2009 0.669 0.491 0.632 10.031 7.783
2010 0.677 0.485 0.634 10.073 7.805
2011 0.683 0.492 0.634 10.260 8.013
2012 0.677 0.510 0.641 10.489 8.159
2013 0.684 0.503 0.642 10.597 8.336
2014 0.694 0.507 0.658 10.844 8.515
2015 0.708 0.508 0.672 10.959 8.612
2016 0.713 0.511 0.677 11.069 8.660
30
Table 4: Median of worker similarity measures by year
Year Share of workers with the same
Sex Nationality Education Age Tenure
1975 0.789 0.876 0.550 0.133 1.000
1976 0.798 0.878 0.548 0.135 0.906
1977 0.805 0.878 0.593 0.136 0.807
1978 0.801 0.888 0.591 0.136 0.722
1979 0.798 0.884 0.587 0.135 0.621
1980 0.799 0.881 0.589 0.134 0.518
1981 0.800 0.884 0.588 0.134 0.452
1982 0.803 0.889 0.585 0.134 0.385
1983 0.813 0.895 0.593 0.136 0.333
1984 0.811 0.898 0.600 0.135 0.242
1985 0.811 0.895 0.607 0.133 0.175
1986 0.811 0.898 0.621 0.132 0.150
1987 0.808 0.895 0.633 0.133 0.132
1988 0.806 0.894 0.639 0.134 0.117
1989 0.798 0.894 0.642 0.134 0.112
1990 0.798 0.887 0.649 0.133 0.108
1991 0.802 0.880 0.657 0.134 0.104
1992 0.803 0.872 0.665 0.135 0.097
1993 0.807 0.877 0.674 0.140 0.088
1994 0.813 0.879 0.683 0.144 0.083
1995 0.813 0.874 0.685 0.146 0.081
1996 0.814 0.876 0.688 0.147 0.078
1997 0.812 0.877 0.692 0.148 0.074
1998 0.802 0.874 0.685 0.146 0.073
1999 0.776 0.858 0.670 0.145 0.075
2000 0.791 0.869 0.691 0.145 0.080
2001 0.792 0.863 0.691 0.145 0.080
2002 0.790 0.871 0.691 0.145 0.077
2003 0.792 0.875 0.693 0.147 0.073
2004 0.787 0.875 0.690 0.148 0.071
2005 0.789 0.875 0.689 0.149 0.068
2006 0.788 0.881 0.686 0.149 0.066
2007 0.790 0.877 0.690 0.148 0.063
2008 0.790 0.876 0.696 0.145 0.062
2009 0.789 0.881 0.690 0.146 0.061
2010 0.785 0.882 0.692 0.146 0.058
2011 0.780 0.883 0.695 0.144 0.057
2012 0.779 0.882 0.689 0.140 0.057
2013 0.782 0.878 0.680 0.138 0.057
2014 0.780 0.873 0.670 0.135 0.058
2015 0.771 0.872 0.662 0.134 0.058
2016 0.780 0.868 0.653 0.133 0.059

31
Table 5: Cox regression for workers’ job-to-job turnover rate
Variable Coefficient SE
Share of same-sex co-workers –0.152*** (0.024)
Share of same-nationality co-workers –0.191*** (0.025)
Share of same-education co-workers –0.125*** (0.026)
Share of same-age co-workers –0.836*** (0.121)
Share of same-tenure co-workers –0.673*** (0.088)
Sex diversity index –0.031 (0.098)
Nationality diversity index 0.212 (0.133)
Education diversity index –0.037 (0.150)
Standard deviation of workers’ age –0.103*** (0.022)
Standard deviation of workers’ tenure –0.019 (0.021)
Notes: Estimates come from a Cox regression for the job-to-job turnover rate. Worker covariates included are (groups of) dummy variables for sex, non-German citizenship, education, age, and one-digit occupation, as well as the log entry wage and the log dif-ference between the current and the entry wage. Workplace covariates are (groups of) dummy variables for plant size, two-digit industry, employment growth and decline by more than 10 percent, the shares of female, foreign, high-skilled, and low-skilled work-ers, as well as groups of share variables capturing the age and tenure of the workforce. Standard errors are clustered at the workplace level. ***/**/* indicates statistical signif-icance at the 1/5/10 percent level.
32
Table 6: Stratified Cox regressions for workers’ job-to-job turnover rate
Variable Coefficient SE
Share of same-sex co-workers –0.184*** (0.024)
Share of same-nationality co-workers –0.217*** (0.030)
Share of same-education co-workers –0.168*** (0.024)
Share of same-age co-workers –0.895*** (0.088)
Share of same-tenure co-workers –0.788*** (0.072)
Sex diversity index 0.218 (0.143)
Nationality diversity index 0.023 (0.185)
Education diversity index –0.401** (0.189)
Standard deviation of workers’ age –0.174*** (0.021)
Standard deviation of workers’ tenure –0.028 (0.023)
Notes: Estimates come from a stratified Cox regression for the job-to-job turnover rate at workplace level. Worker covariates included are (groups of) dummy variables for sex, non-German citizenship, education, age, and one-digit occupation, as well as the log entry wage and the log difference between the current and the entry wage. Workplace covariates are (groups of) dummy variables for plant size, employment growth and de-cline by more than 10 percent, the shares of female, foreign, high-skilled, and low-skilled workers, as well as groups of share variables capturing the age and tenure of the work-force. Standard errors are clustered at the workplace level. ***/**/* indicates statistical significance at the 1/5/10 percent level.

33
Table 7: Stratified Cox regressions for workers’ overall turnover rate
Variable Coefficient SE
Share of same-sex co-workers –0.189*** (0.021)
Share of same-nationality co-workers –0.204*** (0.027)
Share of same-education co-workers –0.052** (0.025)
Share of same-age co-workers –1.123*** (0.077)
Share of same-tenure co-workers –0.839*** (0.048)
Sex diversity index 0.050 (0.089)
Nationality diversity index –0.074 (0.120)
Education diversity index –0.147 (0.112)
Standard deviation of workers’ age –0.100*** (0.019)
Standard deviation of workers’ tenure –0.046*** (0.016)
Notes: Estimates come from a stratified Cox regression for the overall turnover rate at workplace level. Worker covariates included are (groups of) dummy variables for sex, non-German citizenship, education, age, and one-digit occupation, as well as the log entry wage and the log difference between the current and the entry wage. Workplace covariates are (groups of) dummy variables for plant size, employment growth and de-cline by more than 10 percent, the shares of female, foreign, high-skilled, and low-skilled workers, as well as groups of share variables capturing the age and tenure of the work-force. Standard errors are clustered at the workplace level. ***/**/* indicates statistical significance at the 1/5/10 percent level.
34
Table 8: Stratified Cox regression for workers’ job-to-job turnover rate with heterogeneous effects for workers in strong minority position
Variable Coefficient SE
Share of same-sex co-workers –0.200*** (0.035)
× First decile of same-sex co-workers –0.078 (0.103)
Share of same-nationality co-workers –0.263*** (0.033)
× First decile of same-nationality co-workers –0.375*** (0.125)
Share of same-education co-workers –0.176** (0.032)
× First decile of same-education co-workers –0.044 (0.151)
Share of same-age co-workers –0.645*** (0.099)
× First decile of same-age co-workers 1.364*** (0.153)
Share of same-tenure co-workers –0.838*** (0.076)
× First decile of same-tenure co-workers –1.461*** (0.287)
Notes: Estimates come from a stratified Cox regression for the job-to-job turnover rate at workplace level. Worker covariates included are (groups of) dummy variables for sex, non-German citizenship, education, age, and one-digit occupation, as well as the log entry wage and the log difference between the current and the entry wage. Workplace covariates are the workplace diversity measures from previous regressions, (groups of) dummy variables for plant size, employment growth and decline by more than 10 per-cent, the shares of female, foreign, high-skilled, and low-skilled workers, as well as groups of share variables capturing the age and tenure of the workforce. Standard errors are clustered at the workplace level. ***/**/* indicates statistical significance at the 1/5/10 percent level.