Bird Species Identification and Population Estimation by Computerized Sound Analysis
120
Caltrans CFS Number 2045DRI, XB05 Bird Species Identification and Population Estimation by Computerized Sound Analysis i STATE OF CALIFORNIA DEPARTMENT OF TRANSPORTATION TECHNICAL REPORT DOCUMENTATION PAGE TR0003 (REV. 10/98) 1. REPORT NUMBER CA04-0661 2. GOVERNMENT ASSOCIATION NUMBER 3. RECIPIENT’S CATALOG NUMBER 4. TITLE AND SUBTITLE Bird Species Identification and Population Estimation by Computerized Sound Analysis 5. REPORT DATE December 6, 2010 6. PERFORMING ORGANIZATION CODE 7. AUTHOR(S) Joseph M. Szewczak, Ph.D. & Michael L. Morrison, Ph.D. 8. PERFORMING ORGANIZATION REPORT NO. 9. PERFORMING ORGANIZATION NAME AND ADDRESS Humboldt State University 1 Harpst St Arcata, CA 95521 10. WORK UNIT NUMBER 11. CONTRACT OR GRANT NUMBER Contract 65a0184 12. SPONSORING AGENCY AND ADDRESS California Department of Transportation Division of Research and Innovation Office of Materials and Infrastructure Research 1101 R Street Sacramento, CA 95811 13. TYPE OF REPORT AND PERIOD COVERED Final 14. SPONSORING AGENCY CODE 15. SUPPLEMENTAL NOTES 16. ABSTRACT This project developed hardware and software to automate the monitoring of birds. We present results that demonstrate automated monitoring can provide comparable or superior species detection to current point count survey methods for species that vocalize, and can acquire more comprehensive and reliable data than current methods, particularly for rare and infrequent species. Reliable, indisputable biological survey data in the form of recordings can also avoid legal challenges and disputes that can delay projects. This project developed and refined hardware that can be deployed by any field biologist or competent technician and acquire field data for weeks or months at a time for later retrieval and processing. Processing long duration recordings by manual listening to find focal species vocalizations would present a daunting task, and require at least as much time as the duration of the recordings. The signal processing software developed by this project can automatically analyze this data burden to rapidly scan and identify target species. Unlike intermittent personnel-based surveys, the automated bioacoustic monitoring system developed by this project can operate continuously and thereby sample more intensively (and economically) than that possible with human observers and thus enable more confident species evaluation, and allow a more thorough assessment of species movements, abundance, and presence or absence. Continuous monitoring can also provide more consistent data from survey to survey to better reveal long-term population trends of species. 17. KEY WORDS bird, song, recording, signal search, biological monitoring 18. DISTRIBUTION STATEMENT No restrictions. This document is available to the public through the National Technical Information Service, Springfield, VA 22161 19. SECURITY CLASSIFICATION (of this report) Unclassified 20. NUMBER OF PAGES 120 21. PRICE
Transcript of Bird Species Identification and Population Estimation by Computerized Sound Analysis
Caltrans CFS Number 2045DRI, XB05 Bird Species Identification and Population Estimation by Computerized Sound Analysis
i
STATE OF CALIFORNIA DEPARTMENT OF TRANSPORTATION TECHNICAL REPORT DOCUMENTATION PAGE TR0003 (REV. 10/98)
1. REPORT NUMBER
CA04-0661 2. GOVERNMENT ASSOCIATION NUMBER
3. RECIPIENT’S CATALOG NUMBER
4. TITLE AND SUBTITLE
Bird Species Identification and Population Estimation by Computerized Sound Analysis
5. REPORT DATE
December 6, 2010
6. PERFORMING ORGANIZATION CODE
7. AUTHOR(S)
Joseph M. Szewczak, Ph.D. & Michael L. Morrison, Ph.D.
8. PERFORMING ORGANIZATION REPORT NO.
9. PERFORMING ORGANIZATION NAME AND ADDRESS
Humboldt State University 1 Harpst St Arcata, CA 95521
10. WORK UNIT NUMBER
11. CONTRACT OR GRANT NUMBER
Contract 65a0184
12. SPONSORING AGENCY AND ADDRESS
California Department of Transportation Division of Research and Innovation Office of Materials and Infrastructure Research 1101 R Street Sacramento, CA 95811
13. TYPE OF REPORT AND PERIOD COVERED
Final
14. SPONSORING AGENCY CODE
15. SUPPLEMENTAL NOTES
16. ABSTRACT
This project developed hardware and software to automate the monitoring of birds. We present results that demonstrate
automated monitoring can provide comparable or superior species detection to current point count survey methods for
species that vocalize, and can acquire more comprehensive and reliable data than current methods, particularly for rare and
infrequent species. Reliable, indisputable biological survey data in the form of recordings can also avoid legal challenges and
disputes that can delay projects. This project developed and refined hardware that can be deployed by any field biologist or
competent technician and acquire field data for weeks or months at a time for later retrieval and processing. Processing long
duration recordings by manual listening to find focal species vocalizations would present a daunting task, and require at least
as much time as the duration of the recordings. The signal processing software developed by this project can automatically
analyze this data burden to rapidly scan and identify target species. Unlike intermittent personnel-based surveys, the
automated bioacoustic monitoring system developed by this project can operate continuously and thereby sample more
intensively (and economically) than that possible with human observers and thus enable more confident species evaluation,
and allow a more thorough assessment of species movements, abundance, and presence or absence. Continuous
monitoring can also provide more consistent data from survey to survey to better reveal long-term population trends of
species.
17. KEY WORDS
bird, song, recording, signal search, biological monitoring
18. DISTRIBUTION STATEMENT
No restrictions. This document is available to the public through the National Technical Information Service, Springfield, VA 22161
19. SECURITY CLASSIFICATION (of this report)
Unclassified
20. NUMBER OF PAGES
120
21. PRICE

Caltrans CFS Number 2045DRI, XB05 Bird Species Identification and Population Estimation by Computerized Sound Analysis
ii
DISCLAIMER STATEMENT This document is disseminated in the interest of information exchange. The contents of this report reflect the views of the authors who are responsible for the facts and accuracy of the data presented herein. The contents do not necessarily reflect the official views or policies of the State of California or the Federal Highway Administration. This publication does not constitute a standard, specification or regulation. This report does not constitute an endorsement by the Department of any product described herein. For individuals with sensory disabilities, this document is available in Braille, large print, audiocassette, or compact disk. To obtain a copy of this document in one of these alternate formats, please contact: the Division of Research and Innovation, MS-83, California Department of Transportation, P.O. Box 942873, Sacramento, CA 94273- 0001.

Caltrans CFS Number 2045DRI, XB05 Bird Species Identification and Population Estimation by Computerized Sound Analysis
iii
Bird Species Identification and Population Estimation by Computerized Sound Analysis
Final Report CA04-661
December 6, 2010
Joseph M. Szewczak Ph. D. Humboldt State University
Arcata, CA 95521
Michael L. Morrison Ph. D. Texas A&M University
College Station, TX 77843
Signal search progress panel shown recognizing a willow flycatcher call found within a multi-hour recording. The upper left sonogram displays the exemplar
search term used to seek matches in the recording.

Caltrans CFS Number 2045DRI, XB05 Bird Species Identification and Population Estimation by Computerized Sound Analysis
iv
Bird Species Identification and Population Estimation by Computerized Sound Analysis
Final Report
CA04-661
Joseph M. Szewczak Ph. D. Humboldt State University
Arcata, CA 95521
Michael L. Morrison Ph. D. Texas A&M University
College Station, TX 77843
Prepared for: State of California
Department of Transportation Division of Research and Innovation
Office of Materials and Infrastructure Research 1101 R Street
Sacramento, CA 95811 December 6, 2010

Caltrans CFS Number 2045DRI, XB05 Bird Species Identification and Population Estimation by Computerized Sound Analysis
v
Contents Summary ......................................................................................................................... 1
Summary of project deliverables .............................................................................. 1 Introduction ..................................................................................................................... 2
Background ................................................................................................................. 2 Methods .......................................................................................................................... 4
Fieldwork ..................................................................................................................... 5 Reference recordings ............................................................................................... 5 Field testing .............................................................................................................. 6
Laboratory work ........................................................................................................... 6 Long duration recording hardware ........................................................................... 6 Software development ............................................................................................. 7
Results .......................................................................................................................... 12 Reference recordings ................................................................................................ 12 Recording hardware .................................................................................................. 17 Analysis software ....................................................................................................... 19
Literature cited .............................................................................................................. 21 Validation and application ............................................................................................. 23
Assessing the use of automated audio recorders to survey avian species ................ 24 Summary ................................................................................................................ 24 Introduction ............................................................................................................ 24 Methods ................................................................................................................. 26 Results ................................................................................................................... 30 Discussion .............................................................................................................. 32 Literature cited ....................................................................................................... 38
Autonomous recording of great gray owls in the Sierra Nevada ................................ 40 Summary ................................................................................................................ 40 Introduction ............................................................................................................ 40 Methods ................................................................................................................. 41 Results ................................................................................................................... 42 Discussion .............................................................................................................. 44 Literature cited ....................................................................................................... 45
Vocal individuality of great gray owls in the Sierra Nevada ....................................... 47 Summary ................................................................................................................ 47 Introduction ............................................................................................................ 47 Study area .............................................................................................................. 48 Methods ................................................................................................................. 49 Results ................................................................................................................... 52 Discussion .............................................................................................................. 52 Literature cited ....................................................................................................... 54
Appendix A California append reference collection for use with SonoBird ................... A-1 Appendix B Basic operations with SonoBird ................................................................ B-1 Appendix C Using SonoBird to search for target signals ............................................. C-1 Appendix D SonoBird signal searching tutorial ........................................................... D-1 Appendix E Set up and recording with the Binary Acoustic Technology FR125 ........... E-1

Caltrans CFS Number 2045DRI, XB05 Bird Species Identification and Population Estimation by Computerized Sound Analysis
1
Summary This project developed hardware and software to automate the monitoring of birds. We present results that demonstrate automated monitoring can provide comparable or superior species detection to current point count survey methods for species that vocalize, and can acquire more comprehensive and reliable data than current methods, particularly for rare and infrequent species. Reliable, indisputable biological survey data in the form of recordings can also avoid legal challenges and disputes that can delay projects. This project developed and refined hardware that can be deployed by any field biologist or competent technician and acquire field data for weeks or months at a time for later retrieval and processing. Processing long duration recordings by manual listening to find focal species vocalizations would present a daunting task, and require at least as much time as the duration of the recordings. The signal processing software developed by this project can automatically analyze this data burden to rapidly scan and identify target species. Unlike intermittent personnel-based surveys, the automated bioacoustic monitoring system developed by this project can operate continuously and thereby sample more intensively (and economically) than that possible with human observers and thus enable more confident species evaluation, and allow a more thorough assessment of species movements, abundance, and presence or absence. Continuous monitoring can also provide more consistent data from survey to survey to better reveal long-term population trends of species.
Summary of project deliverables
Reference recording data. To support the recognition of focal species, this project acquired 9,662 reference recordings from 1,714 individual birds from 118 locations throughout California. These recordings cover 180 species, with coverage or surrogate coverage1 for 52 of the 74 birds listed by the California Department of Fish and Game as sensitive species. The delivered library of recordings covers mostly inland species (i.e., rather than shorebirds) that would more likely be encountered and of concern for Caltrans projects.
Hardware. This project developed a prototype programmable recording unit that can store data on any USB memory device and when implemented as a self-powered (e.g., by photovoltaic panels) system will enable long duration recording for weeks or months, limited only by memory configuration. Eight prototype autonomous field recording units developed and tested during this project were delivered to Caltrans. The programmable recording units were developed in collaboration with Binary Acoustic Technology (Tucson, AZ) who will continue to provide them under the product designation “FR125.” Another domestic maker of recording equipment, Wildlife Acoustics, has begun supplying similar programmable long duration recording hardware, and cooperating to keep the data acquired by their gear compatible with the software developed by this project.
1 Surrogate coverage means that the recorded vocalizations from, for example an inland spotted towhee, will adequately represent and provide surrogates for searching and identifying the listed sensitive taxon the San Clemente spotted towhee.

Caltrans CFS Number 2045DRI, XB05 Bird Species Identification and Population Estimation by Computerized Sound Analysis
2
Software. This project also developed automated processing software to rapidly scan long duration recordings and identify target species from the field-collected data to assess presence/absence, activity, temporal movements, activity patterns, and acoustically-gleaned demographic information. The user interface and program foundation of the software is based on the intuitive graphic interface of SonoBat and SonoBird software developed by PI Szewczak. The software goal of this project was to develop an end product that can be readily used by any Caltrans biologist or proficient technician.
Validation of methodology. This project also performed field testing of field recording methods to optimize field recording protocols, and evaluate their performance against traditional survey methods (point count surveys), and to demonstrate and validate the performance of project hardware and software.
Introduction The Federal Endangered Species Act and California law require Caltrans to manage threatened and endangered species on lands under its jurisdiction, and to evaluate potential environmental impacts of new projects on these and other sensitive species. Decreasing the cost and time to perform this work can benefit Caltrans’ mission of providing safe and effective transportation systems to the people of California. The inventory and monitoring of birds and other species necessary for this management accrues high costs because of the substantial effort and specialized personnel required to perform the work. Furthermore, rare and uncommon species require greater survey effort than more common species to acquire indisputable data. Even when funds are available, the supply of individuals having the skills to identify birds often falls short of the demand. Fortunately, birds and many other species of interest leak considerable information to the environment in the form of acoustic signals that may be exploited for non-contact, automated monitoring. Decreasing the cost and time to perform biological surveys can benefit Caltrans’ mission of providing safe and effective transportation systems to the people of California. In addition, the comprehensive coverage of automated monitoring can increase the confidence in biological survey data to reduce legal challenges and disputes that can delay projects.
Background
Automated monitoring and identification of birds and other animals can reduce costs and operate tirelessly in conditions intolerable, unsafe, or inaccessible to personnel. Compared to current personnel-based surveys, in many instances automated systems can provide more reliable, consistent, and comprehensive data from survey to survey. In addition, unlike traditional intermittent personnel-based surveys, automated monitoring proceeds continuously and can therefore sample more intensively than that possible with human observers. This can more confidently assess the presence or absence of rare and uncommon species that require greater survey efforts than more common species (Green and Young 1993; Queheillalt et al. 2002). Even when funds are available for a comprehensive survey effort, the supply of individuals with the skills to identify birds often falls short of the demand (Hobson et al. 2002). The objective repeatability of automated monitoring can also improve the evaluation of long-

Caltrans CFS Number 2045DRI, XB05 Bird Species Identification and Population Estimation by Computerized Sound Analysis
3
term trends of species. Finally, recordings provide voucher data that may be subjected to third party confirmation.
By deploying multiple units, automated monitoring can facilitate simultaneous coverage over large landscapes, a feat that otherwise requires multiple personnel at high cost. In addition to identifying targeted species or multiple species for presence or absence, simultaneous multiple signal acquisition can also provide information regarding population levels and trends. Contemporaneous monitoring is particularly relevant for birds that can readily move between monitoring sites and be potentially counted twice by asynchronous intermittent monitoring protocols. In addition to basic identifying songs, automated analysis has the potential to be programmed to interpret particular call types such as, whisper songs, alarm calls, and scolds that can provide additional demographic data.
The songs and calls of bird species, while complex, have routinely been identified and characterized using sonograms, i.e., spectrograms of audio signals that plot the time-frequency and time-amplitude content of signals. As evidence, sonograms are used to identify the complexity and to distinguish different geographic races (Peters et al. 2000; Cicero and Benowitz-Fredericks 2000; Chilton et al. 2002). Despite the complexity of bird vocalizations, only small fragments are often sufficient to enable species identification. An individual bird will rapidly progress through a series of songs and calls, and only a few of these may be needed for species identification. Some birds will change their call structure seasonally; thus the reference call collection used for recognition should be narrowed by the season in question. For example, breeding passerines usually use their secondary song intensively, and only later in the season do they revert back to the more typical primary song (and variations thereof). Often the variation that we perceive by ear results from the bird singing only part of the primary or secondary song. Such a behavior becomes readily identifiable on a sonogram, and facilitates such analyses. Where there are geographic variants, these may require geographic-relevant reference recordings to customize the identification processing to recognize these local variants.
Identification of birds to species level (i.e., not individual) has largely been carried out by subjective qualitative listening surveys such as the North American Breeding Bird Survey (Robbins et al. 1986). Bird surveys often make use of volunteers who walk a set route stopping to listen for bird calls at discrete time or distance intervals (point count surveys). Identification of species from their song uses subjective classification by the listener based on previous experience. Classification based on experience has the obvious disadvantage of inter- and intra-individual variation that complicates the interpretation of results (McLaren and Cadman 1999). Comparison of results between surveys may be also difficult if different techniques are used to survey the birds (Zimmerling and Ankney 2000).
Research into quantitative acoustic identification in birds has focused on social and communication functions of calling within species. Examples include identification of call parameters used for parent-chick recognition in nesting penguins (Jouventin and Aubin 2002), the vocal repertoire and social role of vocalizations in African parrots (Venuto et al. 2001), and the development and maintenance of dialects (O'Loghlen and Rothstein 2003, Slabbekoorn and Smith 2002). Previous work has demonstrated the potential for computational extraction and identification of bird species from their vocalizations (e.g., McIlraith and Card 1995, Kogan and

Caltrans CFS Number 2045DRI, XB05 Bird Species Identification and Population Estimation by Computerized Sound Analysis
4
Margolish 1998, Harma 2003), and other work has demonstrated that these signals can be effectively acquired in the field with electronic recording technology (Telfer and Farr 1993, Hobson et al. 2002). But the potential of uniting these processes remains unfulfilled without effective tools to augment manual processing by personnel.
Acoustic identification systems have only recently been applied to biological signals with the majority of work focusing on identifying individuals and species assemblages in bats (e.g., Parsons and Jones 2000, Parsons 2001, Szewczak 2004, Szewczak and Arnett 2008, Redgewell et al 2009), cetaceans (e.g., Deecke et al. 1999, Oswald et al. 2003), pinepeds (e.g., Campbell et al. 2002), and prairie dogs (e.g., Placer and Slobodchikoff 2000). Techniques used to identify species and individuals include subjective classification by experienced listeners, multivariate statistics, synergetic pattern recognition, fuzzy logic, and machine learning techniques such as artificial neural networks (ANNs).
However, to learn to recognize signals, artificial neural networks and other machine learning methods require an extensive set of training data of all signals likely to be encountered as they can only be trained to recognize the known signal types on which they are trained. These methods can typically only output a decision based on what they know, and as a result novel or other unanticipated signals can yield misclassifications. Acquiring a sufficient training set of reference recordings to cover all 634 California bird species, their vocal repertoires, and regional variations, and confounding signal variations (and distortions) exceeded the resources available for this project. We therefore addressed this project’s goal of an automated recognition system for sensitive species by developing a system capable of seeking and recognizing selected signals from focal species, and making it adaptable for signals from any species of interest at any study site.
The methodologies and technologies developed by this project will provide an efficient and cost-effective solution to meeting survey and monitoring requirements of target species, including other animals that emit vocalizations or other sounds such as frogs, and also to non-biological signals, such as target motor vehicles making these techniques adaptable for addressing a wide range of data collection needs. This will support timely progress of transportation projects.
Methods This project entailed both fieldwork and laboratory components. Fieldwork throughout California collected a library of bird species reference recordings for constructing search terms and comparative identification of unknown signals. We performed additional fieldwork to test and direct development of acoustic monitoring hardware and software, and to test and validate the acoustic monitoring methodology developed by this project. The laboratory research and development components addressed long duration recording solutions and software for processing, identifying, and efficiently searching long duration recording data for target signals.

Caltrans CFS Number 2045DRI, XB05 Bird Species Identification and Population Estimation by Computerized Sound Analysis
5
Fieldwork
Reference recordings
We manually recorded bird vocalizations in the field from known, i.e., species confirmed birds. Experienced biologists confirmed the species identifications. In most cases we relied on visual observations to confirm species, and this was facilitated by the close proximity required to obtain the high quality recordings essential for acceptable reference recordings. In instances where we could not acquire visual confirmation, we only accepted recordings having unambiguous vocal signatures. We recorded directly to digital recorders using Sennheiser ME66 shotgun microphones with a K6 power module or ME62 microphones with K6 power module (Sennheiser, Wennebostel, Germany) and a SME PR-1000 parabolic reflector (Saul Mineroff, Elmont, NY). We recorded directly to laptops using SonoBird software (Arcata, CA) or with iriver H320 units (ReignCom, Seoul, South Korea) running Rockbox firmware (Rockbox Version 5, 2007) on each H320 to facilitate manual selection of recordings with a prerecord function. The prerecord function provided one or two seconds of record time just prior to pushing the record button and this facilitated readily acquiring a complete recording upon hearing a selected vocalization. We saved all recordings as wave files with a sampling frequency of 44.1 kHz and16-bit resolution.
In assembling the reference collection we assessed recording quality based on signal-to-noise ratio (i.e., signal strength relative to ambient noise level), clarity of desired signal, and whether the recordings had other signal distorting effects or confounding additional signals or other confusing bird vocalizations. We endeavored to include recordings with unambiguous representations of the listed species. We excluded calls not meeting these quality criteria. We designated each recording with a filename including the standard species code (e.g., BEKI for belted kingfisher) and recording location, and we included field notes describing the recording location, habitat elements, and environmental conditions in the note field that displays when opened and processed with SonoBird. (SonoBird embeds these notes in the metadata header of the wave files.)
Acquiring recordings from all of the 619 California bird species exceeded the scope of this project. Instead, we targeted sensitive species that would be of most concern for environmental assessment of projects (e.g., to meet CEQA provisions). The California Department of Fish and Game lists 74 bird species of special concern (Shuford and Gardali 2008). We used this and other agency and organization listings of sensitive species as a guide to select target species for recording. We also focused on target species that could be effectively surveyed by acoustic monitoring, and gave priority to species we deemed more relevant to potential Caltrans projects and this excluded most shorebirds, for example. In addition to focal species, we also acquired recordings from other acoustically similar species to evaluate the ability and confidence of search algorithms to correctly discriminate species. In some cases with rare or localized sensitive populations we selected surrogate species with similar vocalizations (often of the same species or a subspecies). Finally, we recorded additional non-targeted species as we encountered them to provide some sampling across taxonomic Families to test the generality of the system’s performance to many species, and to make them available for comparative identification of unknown species recordings.

Caltrans CFS Number 2045DRI, XB05 Bird Species Identification and Population Estimation by Computerized Sound Analysis
6
We selected field sites to cover the range of habitat types used by the different target species encountered in Caltrans projects. In addition to natural, undisturbed habitats we also sampled along highways and potential right-of-ways to evaluate and refine system performance under conditions that Caltrans would likely apply this technology.
Field testing
We tested prototype long duration recorders in a variety of field conditions in both summer and winter seasons. Detailed descriptions of the field testing methods follow in the Validation and application section of this report.
Laboratory work
Long duration recording hardware
Recording hardware development for this project accelerated along a moving trajectory from changes in available audio recording technology and recording format licensing requirements. The project’s ultimate goal of a high-capacity, high audio quality recorder with a programmable recording schedule to optimize data storage and analysis required a longer research and development cycle than the testing window of this project. To enable field testing and development of long duration recording methodology and application, we developed and deployed prototype recording units that also provided a testing platform to direct specifications of final production recording equipment to be produced by collaborating suppliers.
We based the initial audio data storage prototype units on DMC Xclef HD-500 digital mp3 player/recorders (Digital Mind, Corp., Carlsbad, CA). The DMC mp3 units had 100 GB of storage, sufficient to store approximately 700 hours of data. We collected mono audio data at 320 kbps with a sampling frequency of 44.1 kHz. This audio format setting provided sufficient quality for species identification using sonograms to supplement and confirm aural identification. While mp3 compression can distort signal quality, the 320 kps “high quality” format provided ample signal integrity for species detection and analysis while extending recording time by a factor of three compared to 44.1 kHz wave format having no data compression, i.e., lossless. As “dumb” units, these DMC-based units could only record continuously once activated, as opposed to “smart” units that with programmable scheduling. With continuous recording these dumb units recorded many hours of unnecessary recording discarded during processing, and ultimately limited their unattended duration of field deployment.
Although they did enable us to acquire long duration recordings to advance this project during its initial stage, we did ultimately supersede this recording approach with a second generation prototype. Despite their rated 700 hour capacity, in practice the DMC-based units often stopped recording after less than 100 hours. Additionally, after we began with these units, the mp3 licensing regulations changed such that they required paying royalties for software that decoded mp3 files, and the availability of alternative recording options convinced us to abandon this approach. Although we had a programmable digital recording option under development in cooperation with Binary Acoustic Technology (Tucson, AZ) and had begun cooperation with Wildlife Acoustics (Cambridge, MA), before they became available we continued field recording

Caltrans CFS Number 2045DRI, XB05 Bird Species Identification and Population Estimation by Computerized Sound Analysis
7
by replacing the DMC Xclef digital recorders with iriver H320 units (ReignCom, Seoul, South Korea) with Rockbox firmware (Rockbox Version 5, 2007) on each H320 to enhance recording functions, including programming a recording schedule. These recorders had internal 20-GB hard drives that we programmed to record in lossless 16-bit WavPack format at a sampling frequency of 44.1 kHz. Each recorder had an integral real time clock that conveniently labeled the recordings with a date and time stamp.
With both units we captured audio data using PA3 mini microphones (MG Electronics, Hauppauge, NY) with built in preamplifier that provided line level output that facilitated recording with any recording equipment. The microphones provided a nearly flat frequency response from 20 to 16000 Hz and had a signal to noise ratio of more than 58 dB. We fitted the microphones into a custom four-horn2 arrangement that increased omni-directional gain in the ground plane of the meadows (Figure 1 in Assessing the use of automated audio recorders to survey avian species, p. 31) with the microphone element positioned at the top of the intersection of the horns to protect it from moisture. The geometry of the horns provides some rejection of low frequency noise to optimize the recording sensitivity to higher frequency songbird vocalizations. The audio recording units were powered by two 12 volt, 12 Amp-hour batteries (24 Amp-hour total capacity) maintained with a 20-watt solar panel connected by a charge controller. We housed the power and recording equipment in a waterproof NEMA 3R enclosure (12” H X 10” W X 6” D, McMaster-Carr part number 7649K12). The microphones combined with the audio recording units successfully collected data in weather below freezing, above 90 degrees Fahrenheit, and also during inclement wind, rain, and snow conditions.
We provided collaborator Binary Acoustic Technology with our prototype recording unit and specifications of recording formats and scheduling logic to develop a recording unit that integrated the prototype concept and components into a final deployable unit. We also cooperated with Wildlife Acoustics to provide feedback with their parallel field recording equipment development and they worked with us to ensure compatibility with our needs and analysis software. We directed these efforts toward a final end product that would meet the recording needs of this project and be a readily available sustainable commercial device that would not require custom assembly or specialized work by Caltrans personnel.
Software development
We built upon the user interface, processing, parameter extraction, and analysis software kernel of a beta version of SonoBird software, in turn built from SonoBat acoustic software coded by lead researcher Szewczak. We adapted search routines originally coded to interpret the challenging subtle differences in the time-frequency and time-amplitude domains of bat echolocation calls to interpret lower frequency bird vocalizations. We also co-opted the user interface and automated batch processing functions of SonoBat and incorporated them into SonoBird to automatically process batches of recording files.
2 The horns follow from a recommendation from Dr. Kurt Fristrup (then at Cornell Laboratory of Ornithology, currently with the National Park Service). He calculated the ideal acoustic horn geometry for songbird reception and found that the cone geometry of commercially available funnels (McMaster-Carr part number 4005T5) closely approximate the calculated ideal shape. We adapted his original single horn configuration into a four horn arrangement with 360° coverage.

Caltrans CFS Number 2045DRI, XB05 Bird Species Identification and Population Estimation by Computerized Sound Analysis
8
We coded and tested signal processing and analyis algorithms using MATLAB (Mathworks, Natick, MA) and LabVIEW (National Instruments, Austin, TX). All final algorithms were ported to LabVIEW for integration with the user interface. We implemented the final product of this project in LabVIEW to ensure and facilitate its sustainability and adaptability beyond the duration of this project, and because it readily enables compiling standalone executable software for both Windows and Macintosh operating systems.
Collaborating researcher Parsons experimented with the reference recordings to develop and test a variety of machine learning approaches for species signal recognition including discriminant function analysis, artificial neural networks, ensembles of neural networks, and support vector machines. However, although these methods performed well on discriminating the limited data sets of proof of concept trials, these methods could not practically scale up to classify actual field data with extensive species and signal variations. Training machine learning systems to classify species depends upon a suitable library of representative reference signals encompassing everything likely to be encountered, and these methods also depend upon extracting quantitative descriptive parameters from those signals to feed into the training system. The quantitative parameters we considered included contextual characteristics such as time-frequency and time-amplitude measures and patterns, pulse interval, diagnostic signal patterns, harmonics, and amplitude modulations. Although these methods have demonstrated successful classification performance when applied to other acoustic signals such as bat echolocation calls (Redgwell et al. 2009), classifying bird songs presented a different and more complex problem. Machine learning methods for signal classification also depend upon quantitative descriptors for every type of signal likely to be encountered or else the uncharacterized signals will likely get classified as one of the characterized known signals in the absence of discriminating data for the unknown signal. With just two dozen or less sympatric bat species in a given geographic region such a data set can be achieved, but with hundreds of sympatric birds species in any given location, and the variety of vocalizations they produce, and the considerable confounding noise at audible frequencies, assembling a sufficient data set for a machine learning approach to succeed exceeded the resources available for this project.
As an alternative approach to meet this project’s goal of providing a system to recognize target signals from select species, we redirected our approach to develop a more flexible system that could efficiently and effectively search long duration recordings for similar signals to those provided as templates, or search terms. That is, instead of attempting to classify each and every signal encountered in a recording, this approach seeks only signals of a specified type. This provided a more computationally efficient and exacting approach. In practice more than one signal may be sought with each pass through recorded data, and ultimately this approach can form the basis of a multi-species classifier.
Searching for target signals in large files from long duration recordings generated conflicting demands of search accuracy and search speed. The more accurate the search, the more computational overhead required and that slows the search process. We addressed this conflict by implementing a two-step search procedure: a coarse resolution search to first seek candidate signals, and then a fine-scale, more discerning signal classification only applied to the candidate signals. By first parsing out candidate signals, this method applies the more processor-intensive

Caltrans CFS Number 2045DRI, XB05 Bird Species Identification and Population Estimation by Computerized Sound Analysis
9
but accurate signal discrimination algorithms to only a subset of the entire recording and this increases processing throughput.
High-resolution, detailed interpretation of signal frequency and amplitude information content typically employs CPU-intensive Fast Fourier Transform (FFT) processing of recorded signals to generate sonograms (Figure 1). Searching through hundreds or thousands of hours of field recordings for the acoustic signatures of species of interest using high resolution sonogram-processed signals requires substantial dedicated computer time (or high-speed computers). As an alternative, we implemented an initial low resolution search that rapidly extracts just the basic time-frequency content of the signal with a less processor-intensive approach, and enhanced with frequency bandpass filtering to emphasize the frequency band of the signal of interest. Bandpass filtering removes extraneous signal content to improve signal detection. This provides particular advantage for revealing target signals in situations with a high ambient noise level, such as that typical of transportation corridors, signals of interest, e.g., bird songs. can be literally masked by the ambient noise and lost (Figure 2).
Initial low resolution post-processing of full-spectrum recordings (i.e., data having all simultaneous frequency content) combined with bandpass frequency filtering (only possible with full-spectrum recording data), provides a methodology for rapidly scanning large data streams for signals of interest and extracting the basic time-frequency signal content to seek candidate signals. The candidate signals can then be subjected to secondary high-resolution processing for confident species identification and confirmation. We implemented this as an initial coarse search procedure with the facility to direct searches for any species (or signal) of interest to seek sections of the data stream, for example a custom template for southwest willow flycatcher (Figure 3). We also implemented the coarse search to seek species-specific templates for multiple species or multiple song types of the same species as combinations to more efficiently search large data streams.

Caltrans CFS Number 2045DRI, XB05 Bird Species Identification and Population Estimation by Computerized Sound Analysis
10
Figure 1. (Top panel) example wren song recorded in the presence of high amplitude low frequency noise, typical of that encountered near transportation corridors. This song was recorded using CD quality recording characteristics, i.e., 44.10 kHz sampling frequency and 16 bit resolution to fully capture the acoustic information with the full-spectrum sonogram processed using overlapping windows of frequency spectra analyzed from Fast Fourier Transforms. (Lower panel) the same example wren song after processing with a frequency bandpass filter to eliminate the low frequency noise. This is possible because the two signal components occupy different frequency regimes. The wren song becomes clearly rendered after filtering, even though the noise amplitude in the original signal exceeded that of the wren signal.

Caltrans CFS Number 2045DRI, XB05 Bird Species Identification and Population Estimation by Computerized Sound Analysis
11
Figure 2. (Upper panel) the same example wren song in the previous figure with rapid low resolution processing without initial bandpass frequency filtering. Much of the wren was not revealed because the higher amplitude signal content of the lower frequency noise overwhelmed and masked the lower amplitude wren signal. The same example wren song after first processing with a frequency bandpass filter to eliminate the low frequency noise, and then processed processed with rapid low resolution processing (Lower panel). Although this method yields a low-resolution rendering of the wren song, it reveals sufficient detail to enable recognition and selection of candidate signals for higher resolution full-spectrum processing as that shown in Figure 1. This enables rapid searching of candidate signals, but still depends on having a high-resolution recording with all frequency content intact.
Figure 3. Likelihood of southwest willow flycatcher calls detected in a recording using low resolution processing and detection after frequency bandpass filtering. High points in the plot indicate sections of the recording to secondarily process with high-resolution FFT-based sonograms for final species identification and confirmation.

Caltrans CFS Number 2045DRI, XB05 Bird Species Identification and Population Estimation by Computerized Sound Analysis
12
Results
Reference recordings
This project acquired 9,662 reference recordings from 1,714 individual birds (Table 1) from 118 locations throughout California (Figure 4) representing 180 species. The recordings include, or provide surrogate coverage for, 52 of the 74 birds listed by the California Department of Fish and Game as sensitive species. Surrogate coverage means that the recorded vocalizations from, for example an inland spotted towhee, will adequately represent and provide surrogates for searching and identifying the listed sensitive taxon the San Clemente spotted towhee. The delivered library of recordings covers mostly inland species (i.e., rather than shorebirds) that would more likely be encountered and of concern for Caltrans projects.
Figure 4. Location of sites visited by this project to acquire reference recordings. Each drop pin indicates a geographic base of multiple local field sites with different habitat elements used to acquire the 9,992 reference recordings from 118 total sites. To optimize reference recording fieldwork, the selection of these sites optimized locating project target species rather than Caltrans project sites.
Caltrans CFS Number 2045DRI, XB05 Bird Species Identification and Population Estimation by Computerized Sound Analysis
13
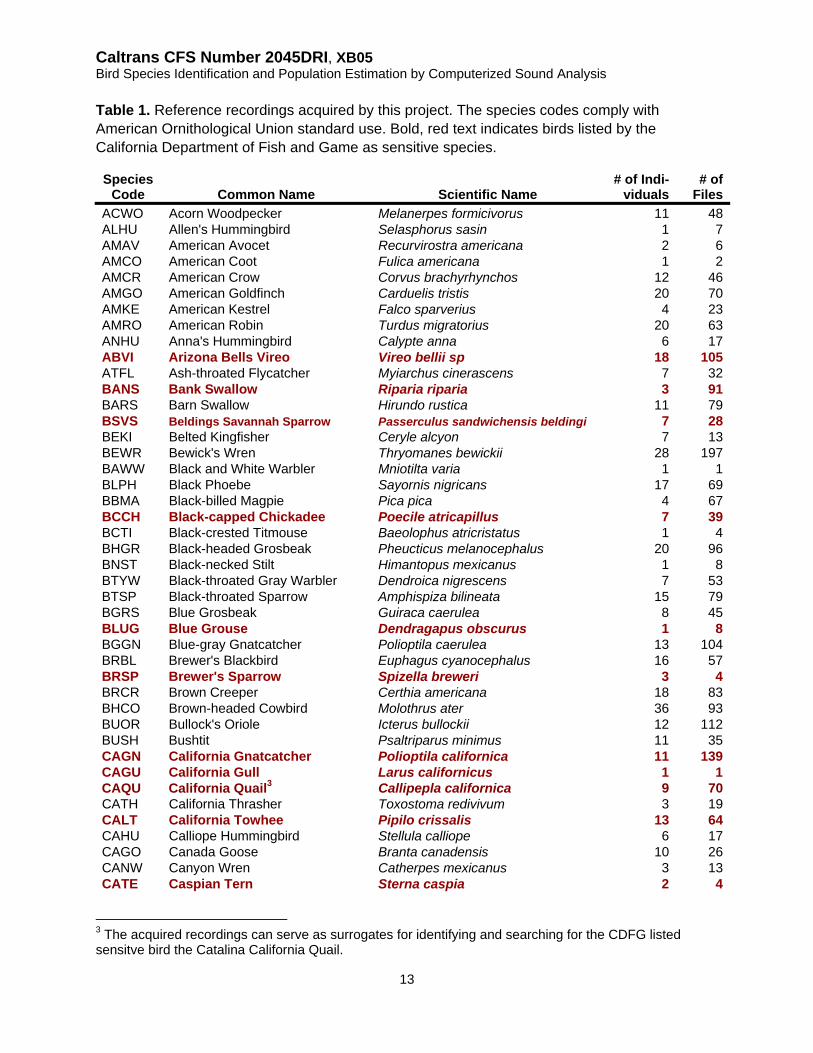
Table 1. Reference recordings acquired by this project. The species codes comply with American Ornithological Union standard use. Bold, red text indicates birds listed by the California Department of Fish and Game as sensitive species.
Species Code Common Name Scientific Name
# of Indi-viduals
# of Files
ACWO Acorn Woodpecker Melanerpes formicivorus 11 48ALHU Allen's Hummingbird Selasphorus sasin 1 7AMAV American Avocet Recurvirostra americana 2 6AMCO American Coot Fulica americana 1 2AMCR American Crow Corvus brachyrhynchos 12 46AMGO American Goldfinch Carduelis tristis 20 70AMKE American Kestrel Falco sparverius 4 23AMRO American Robin Turdus migratorius 20 63ANHU Anna's Hummingbird Calypte anna 6 17ABVI Arizona Bells Vireo Vireo bellii sp 18 105ATFL Ash-throated Flycatcher Myiarchus cinerascens 7 32BANS Bank Swallow Riparia riparia 3 91BARS Barn Swallow Hirundo rustica 11 79BSVS Beldings Savannah Sparrow Passerculus sandwichensis beldingi 7 28BEKI Belted Kingfisher Ceryle alcyon 7 13BEWR Bewick's Wren Thryomanes bewickii 28 197BAWW Black and White Warbler Mniotilta varia 1 1BLPH Black Phoebe Sayornis nigricans 17 69BBMA Black-billed Magpie Pica pica 4 67BCCH Black-capped Chickadee Poecile atricapillus 7 39BCTI Black-crested Titmouse Baeolophus atricristatus 1 4BHGR Black-headed Grosbeak Pheucticus melanocephalus 20 96BNST Black-necked Stilt Himantopus mexicanus 1 8BTYW Black-throated Gray Warbler Dendroica nigrescens 7 53BTSP Black-throated Sparrow Amphispiza bilineata 15 79BGRS Blue Grosbeak Guiraca caerulea 8 45BLUG Blue Grouse Dendragapus obscurus 1 8BGGN Blue-gray Gnatcatcher Polioptila caerulea 13 104BRBL Brewer's Blackbird Euphagus cyanocephalus 16 57BRSP Brewer's Sparrow Spizella breweri 3 4BRCR Brown Creeper Certhia americana 18 83BHCO Brown-headed Cowbird Molothrus ater 36 93BUOR Bullock's Oriole Icterus bullockii 12 112BUSH Bushtit Psaltriparus minimus 11 35CAGN California Gnatcatcher Polioptila californica 11 139CAGU California Gull Larus californicus 1 1CAQU California Quail3 Callipepla californica 9 70CATH California Thrasher Toxostoma redivivum 3 19CALT California Towhee Pipilo crissalis 13 64CAHU Calliope Hummingbird Stellula calliope 6 17CAGO Canada Goose Branta canadensis 10 26CANW Canyon Wren Catherpes mexicanus 3 13CATE Caspian Tern Sterna caspia 2 4
3 The acquired recordings can serve as surrogates for identifying and searching for the CDFG listed sensitve bird the Catalina California Quail.

Caltrans CFS Number 2045DRI, XB05 Bird Species Identification and Population Estimation by Computerized Sound Analysis
14
Species Code Common Name Scientific Name
# of Indi-viduals
# of Files
CAFI Cassin's Finch Carpodacus cassinii 13 51CAVI Cassin's Vireo Vireo cassinii* 16 68CEDW Cedar Waxwing Bombycilla cedrorum 5 14CBCH Chestnut-backed Chickadee Poecile rufescens 10 49CHSP Chipping Sparrow Spizella passerina 6 27CLNU Clark's Nutcracker Nucifraga columbiana 4 29CLSW Cliff Swallow Petrochelidon pyrrhonota 8 46CONI Common Nighthawk Chordeiles minor 4 8CORA Common Raven Corvus corax 9 39COYE Common Yellowthroat Geothlypis trichas 27 118COHA Cooper's Hawk Accipiter cooperii 1 7DEJU Dark-eyed Junco Junco hyemalis 25 103DOWO Downy Woodpecker Picoides pubescens 3 12DUFL Dusky Flycatcher Empidonax oberholseri 38 219EATO Eastern Towhee Pipilo erythrophthalmus 1 12ELOW Elf Owl Micrathene whitneyi 6 37EUST European Starling Sturnus vulgaris 6 12EVGR Evening Grosbeak Coccothraustes vespertinus 3 6FISP Field Sparrow Spizella pusilla 1 1FLOW Flammulated Owl Otus flammeolus 2 7FOSP Fox Sparrow Passerella iliaca 9 62GAQU Gambel's Quail Callipepla gambelii 4 24GIWO Gila Woodpecker4 Melanerpes uropygialis 14 76GCKI Golden-crowned Kinglet Regulus satrapa 6 29GCSP Golden-crowned Sparrow Zonotrichia atricapilla 1 7GBHE Great Blue Heron5 Ardea herodias 2 3GGOW Great Gray Owl Strix nebulosa 30 500GHOW Great Horned Owl Bubo virginianus 14 60GRYE Greater Yellowlegs Tringa melanoleuca 3 8GTGR Great-tailed Grackle Quiscalus mexicanus 3 9GTTO Green-tailed Towhee Pipilo chlorurus 5 60HAWO Hairy Woodpecker Picoides villosus 6 24HETH Hermit Thrush Catharus guttatus 3 34HEWA Hermit Warbler Dendroica occidentalis 11 57HOLA Horned Lark Eremophila alpestris 1 4HOFI House Finch Carpodacus mexicanus 21 51HOSP House Sparrow Passer domesticus 3 15HOWR House Wren Troglodytes aedon 14 100HUVI Hutton's Vireo6 Vireo huttoni 1 1INTO Inyo Towhee Pipilio crissalis eremophilus 8 92KILL Killdeer Charadrius vociferus 7 47LAZB Lazuli Bunting Passerina amoena 9 77LCTH Le Conte's Thrasher Toxostoma lecontei 1 3LBVI Least Bell's Vireo Vireo bellii pusillus 22 186LESA Least Sandpiper Calidris minutilla 1 6LETH LeContes Thrasher Toxostoma lecontei 1 3
4 Listed as a bird of conservation concern by the US Fish and Wildlife Service. 5 Listed as sensitive species by the California Department of Forestry & Fire Protection. 6 The acquired recordings can serve as surrogates for identifying and searching for the CDFG listed sensitve bird the Catalina Hutton’s vireo.

Caltrans CFS Number 2045DRI, XB05 Bird Species Identification and Population Estimation by Computerized Sound Analysis
15
Species Code Common Name Scientific Name
# of Indi-viduals
# of Files
LEGO Lesser Goldfinch Carduelis psaltria 8 18LEYE Lesser Yellowlegs Tringa flavipes 1 1LISP Lincoln's Sparrow Melospiza lincolnii 25 186LOSH Loggerhead Shrike Lanius ludovicianus 1 4LBCU Long-billed Curlew Numenius americanus 2 6MGWA MacGillivray's Warbler Oporornis tolmiei 17 98MALL Mallard Anas platyrhynchos 7 12MAGO Marbled Godwit Limosa fedoa 1 1MAWR Marsh Wren7 Cistothorus palustris 28 157MOBL Mountain Bluebird Sialia currucoides 2 8MOCH Mountain Chickadee Poecile gambeli 30 107MOQU Mountain Quail Oreortyx pictus 4 23MODO Mourning Dove Zenaida macroura 6 13NAWA Nashville Warbler Vermivora ruficapilla 9 81NOCA Northern Cardinal Cardinalis cardinalis 1 1NOFL Northern Flicker Colaptes auratus 20 73NOMO Northern Mockingbird Mimus polyglottos 3 11NOPO Northern Pygmy-Owl Glaucidium gnoma 5 32NRWS Northern Rough-winged Swallow Stelgidopteryx serripennis 1 27NSWO Northern Saw-whet Owl Aegolius acadicus 3 19NUWO Nuttall's Woodpecker Picoides nuttallii 11 15OATI Oak Titmouse Baeolophus inornatus* 6 27OSFL Olive-sided Flycatcher Contopus cooperi 8 74OCWA Orange-crowned Warbler Vermivora celata 15 93OSPR Osprey Pandion haliaetus 4 5PSFL Pacific-slope Flycatcher Empidonax difficilis 12 85PABU Painted Bunting Passerina ciris 1 4PAWA Palm Warbler Dendroica palmarum 2 12PHAI Phainopepla Phainopepla nitens 4 15PBGR Pied-billed Grebe Podilymbus podiceps 1 1PIWO Pileated Woodpecker Dryocopus pileatus 3 8PIGR Pine Grosbeak Pinicola enucleator 1 4PUFI Purple Finch Carpodacus purpureus 18 67PUMA Purple Martin Progne subis 3 116PYNU Pygmy Nuthatch Sitta pygmaea 5 36RBNU Red-breasted Nuthatch Sitta canadensis 5 15RBSA Red-breasted Sapsucker Sphyrapicus ruber 4 15RSHA Red-shouldered Hawk Buteo lineatus 7 55RTHA Red-tailed Hawk Buteo jamaicensis 9 42
7 The acquired recordings can serve as surrogates for identifying and searching for the CDFG listed sensitve bird the Clark’s Marsh Wren.

Caltrans CFS Number 2045DRI, XB05 Bird Species Identification and Population Estimation by Computerized Sound Analysis
16
Species
Code Common Name Scientific Name # of Indi-
viduals# of
Files
RWBL Red-winged Blackbird8 Agelaius phoeniceus 27 123RITD Ringed Turtle-Dove Streptopelia risoria* 1 11ROWR Rock Wren Salpinctes obsoletus 7 66RCKI Ruby-crowned Kinglet Regulus calendula 5 17RUHU Rufous Hummingbird9 Selasphorus rufus 2 4SAGS Sage Sparrow Amphispiza belli 4 19SACR Sandhill Crane Grus canadensis 2 18SAVS Savannah Sparrow10 Passerculus sandwichensis 11 112SAPH Say's Phoebe Sayornis saya 1 3SSHA Sharp-shinned Hawk Accipiter striatus 1 27SNEG Snowy Egret Egretta thula 1 1SOSP Song Sparrow11 Melospiza melodia 64 287SORA Sora Porzana carolina 2 5SWFL Southwestern Willow Flycatcher Empidonax traili extimus 16 160SPOW Spotted Owl Strix occidentalis 3 78SPSA Spotted Sandpiper Actitis macularia 8 30SPTO Spotted Towhee12 Pipilo maculatus 22 130STJA Steller's Jay Cyanocitta stelleri 23 94SUTA Summer Tanager Piranga rubra 6 36SWTH Swainson's Thrush Catharus ustulatus 10 79TRES Tree Swallow Tachycineta bicolor 9 40VATH Varied Thrush Ixoreus naevius 8 94VASW Vaux's Swift Chaetura vauxi 1 1VGSW Violet-green Swallow Tachycineta thalassina 3 38VIRA Virginia Rail Rallus limicola 3 5WAVI Warbling Vireo Vireo gilvus 25 123WEBL Western Bluebird Sialia mexicana 2 16WEKI Western Kingbird Tyrannus verticalis 5 16WEME Western Meadowlark Sturnella neglecta 13 47WESO Western Screech-Owl Otus kennicottii 9 50WESJ Western Scrub-Jay Aphelocoma californica 6 23WETA Western Tanager Piranga ludoviciana 11 105WEWP Western Wood-Pewee Contopus sordidulus 29 97WBNU White-breasted Nuthatch Sitta carolinensis 7 52WCSP White-crowned Sparrow Zonotrichia leucophrys 16 98WEVI White-eyed Vireo Vireo griseus 1 1WHWO White-headed Woodpecker Picoides albolarvatus 2 9WTKI White-tailed Kite Elanus leucurus 3 4WITU Wild Turkey Meleagris gallopavo 1 1WILL Willet Catoptrophorus semipalmatus 2 3WISA Williamson's Sapsucker Sphyrapicus thyroideus 1 1
8 The acquired recordings can serve as surrogates for identifying and searching for the CDFG listed sensitve bird the Kern Red-winged Blackbird. 9 Listed as a bird of conservation concern by the US Fish and Wildlife Service. 10 The acquired recordings can also serve as surrogates for identifying and searching for the CDFG listed sensitve birds the Bryant’s Savannah Sparrow and the large-billed Savannah Sparrow. 11 The acquired recordings can serve as surrogates for identifying and searching for the CDFG listed sensitve bird the Modesto, Suisan, Samuels, Alameda, and Channel Island Song Sparrow populations. 12 The acquired recordings can serve as surrogates for identifying and searching for the CDFG listed sensitve bird the San Clemente Spotted Towhee.

Caltrans CFS Number 2045DRI, XB05 Bird Species Identification and Population Estimation by Computerized Sound Analysis
17
Species Code Common Name Scientific Name
# of Indi-viduals
# of Files
WIFL Willow Flycatcher Empidonax traillii 67 500WISN Wilson's Snipe Gallinago gallinago 3 13WIWA Wilson's Warbler Wilsonia pusilla 37 199WIWR Winter Wren Troglodytes troglodytes 19 90WREN Wrentit Chamaea fasciata 23 56YWAR Yellow Warbler13 Dendroica petechia 60 187YBCU Yellow-billed Cuckoo Coccyzus americanus 3 173YBMA Yellow-billed Magpie Pica nuttalli 11 25YBCH Yellow-breasted Chat Icteria virens 10 58YHBL Yellow-headed Blackbird Xanthocephalus xanthocephalus 5 31YRWA Yellow-rumped Warbler Dendroica coronata 15 99
Totals: 180 1714 9662
Recording hardware Hardware. The prototype recording units developed by this project supported initial field studies for validation of long term acoustic monitoring methodology and directed the development of programmable recording units were developed in collaboration with Binary Acoustic Technology. Binary Acoustic Technology will continue to provide them under the product designation “FR125” (Figure 5.) Eight sample autonomous field recording units using FR125 recorders were delivered to Caltrans. These programmable recording units store audio data on any USB memory device and when implemented with a power connection or a self-powered (e.g., by photovoltaic panels) system enable long duration recording for weeks or months, limited only by memory configuration. The FR125 also has capability to remotely relay data.
The other domestic maker of recording equipment with whom we cooperated, Wildlife Acoustics, has begun supplying a similar programmable long duration recording hardware under the trade name Song Meter SM2 (Figure 6). These units provide an all-in-one recording solution with a built in controller panel and batteries (with capability for external power input for longer duration recording). The current SM2 cannot remotely telemeter data as can the FR125.
13 The acquired recordings can serve as surrogates for identifying and searching for the CDFG listed sensitve bird the Sonora Yellow Warbler.

Caltrans CFS Number 2045DRI, XB05 Bird Species Identification and Population Estimation by Computerized Sound Analysis
18
Figure 5. Binary Acoustic Technology FR125-III field recorder. The FR125 has a line in audio jack for connecting to a microphone and has two high-speed USB 2.0 ports for connecting to external USB hard-drives, Compact Flash devices, or USB thumb-drives. This unit can also control and operate an AR125 ultrasonic receiver to record bat echolocation calls. When writing to solid state memory the FR125 consumes only 6.5 Watts of power.
CrystalFontz USB controller for FR125.
Figure 6. Wildlife Acoustics Song Meter SM2 recorder. The SM2 can be programmed to record on simple time-of-day schedules or more complex monitoring protocols such as recording relative to local sunrise, sunset and twilight.

Caltrans CFS Number 2045DRI, XB05 Bird Species Identification and Population Estimation by Computerized Sound Analysis
19
Figure 7. Zoomed song selection from a recorded file (left) displayed next to an appended reference file (right) invoked from a library of a species-known recording samples. SonoBird automatically normalizes the amplitude and adjusts the time and frequency scales to enable an equal comparison.
Analysis software SonoBird acoustic analysis software provides a tool to rapidly view, assess, and qualitatively or quantitatively analyze bird vocalizations. SonoBird presents visual displays of acoustic data as sonograms with color mapping of amplitude. An intuitive graphic interface provides full control of display characteristics such as frequency scale, time scale, and filtering. To facilitate recognition and identification of signals, SonoBird automatically reprocesses zoomed signal selections to optimize display resolution and then enables comparative side by side viewing of reference signals (Figure 7). A moving cursor tracks the position on the display when playing sounds for recognition and comparison by ear. This project acquired and prepared 686 reference songs
and calls from California birds for appended comparisons and organized them by species and commonly used designations, e.g., brown creeper "trees-trees-pretty-little-trees" or California quail “cu-CA-cow.” See Appendix A for a listing of all California reference files for appended comparisons. Appendix B describes the basic features and operations of SonoBird and serves as a primer for using it.
The batch processing and signal searching capability of SonoBird provide automated processing of long duration recordings to seek and locate target signals of interest (Figure 8) from specified search terms and criteria (Figure 9). SonoBird extracts these and compiles them as separately saved hit file snippets or pointers to sections in the search file to then confirm by inspection, listening, or comparison with reference files. By default, SonoBird presents hit files sorted by correlation ranking with the search term. This sorts them by quality of match with the search term for inspection and facilitates presence/absence surveys by minimizing the potential results to inspect for confirmation. Alternately, hit files may be sorted by name, which because of the naming convention sorts them by order occurrence in the search file. This enables an evaluation of the time course of the vocalizations. The reference recordings and references for appended comparisons acquired by this project provide an extensive resource from which to

Caltrans CFS Number 2045DRI, XB05 Bird Species Identification and Population Estimation by Computerized Sound Analysis
20
generate search terms for most of California’s sensitive bird species. To search for signals not included in the reference collection, SonoBird facilitates generating new search terms from any recording to seek any particular bird or signal of interest. Appendix C provides a full description and guide for searching files, and Appendix D presents a tutorial to use with SonoBird to become familiar with preparing and performing searches.
Figure 8. SonoBird search panel. SonoBird seeks for signals similar to a known species search term (upper left sonogram) by first running a coarse search to select file segments having basic similarity, then performs a more discriminating comparison with the candidate signal (lower left sonogram) using user-defined criteria. SonoBird saves search criteria in the search term file to facilitate repeated searches. See Appendix C for a full description and guide for use.
In practice, depending upon search term and criteria, a moderately fast desktop computer can search one hour of recorded data in about one minute. The ability of the searches to correctly find specific signals varies according to signal characteristics, search sensitivity settings, competing and overlapping signals, and recording quality. Generally, search terms with more distinctive and consistent time-frequency characteristics perform better. Indistinctive signals such as single note owl calls with substantial competing low frequency noise will generate many false hits, but for example with prudent selection of time-power characteristics as the primary search criteria can still reduce long term recordings down to a much smaller subset to manually inspect and recognize target calls, if present.
A one hour example recording from a Sierra meadow searched to find willow flycatchers and Lincoln’s sparrows found 76.1% of the signals recognized by a careful manual listening and visual inspection of sonograms through the recording. The search process missed signals having variation in pattern or when overwhelmed by competing signals. Additional new search

Caltrans CFS Number 2045DRI, XB05 Bird Species Identification and Population Estimation by Computerized Sound Analysis
21
terms could be used to find all types in such an example. Reducing the tolerance settings for acceptance can boost the acceptance of signals with competing noise, but generate more false hits to inspect. Presence/absence surveys require the recognition of only a single confident signal, and if present and if only a small percentage of signals are recognized the probability of signal recognition (detection) will be very high with long duration recording.
Figure 9. SonoBird search settings panel. Dropping individual files or directories of files onto the search file listing field (upper left) loads files for a batch run. Dropping search terms onto the path display fields (light blue) loads up to three search terms. Settings control search criteria to optimize for each signal type. SonoBird provides manual oversight of search progress to initially determine settings, and then saves the selected settings within the search term files for subsequent searches. See Appendix C for a full description and guide for use.
Literature cited Campbell, G. S., R. C. Gisiner, D. A. Helweg, and L. L. Milette (2002) Acoustic identification of female Steller sea lions (Eumetopias jubatus) Journal of the Acoustical Society of America 111(6): 2920-2928.
Chilton, G., M.O. Wiebe, and P. Handford (2002) Large-scale geographic variation in songs of Gambel’s white-crowned sparrow. Condor 104:378-386.
Cicero, C., and M. Benowitz-Fredericks (2000) Song types and variation in insular populations of Lincoln’s sparrow (Melospiza lincolonii), and comparisons with other Melospiza. Auk 117:52-64.

Caltrans CFS Number 2045DRI, XB05 Bird Species Identification and Population Estimation by Computerized Sound Analysis
22
Deeck, V. B., J. K. B. Ford, and P. Spong. (1999) Quantifying complex patterns of bioacoustic variation: Use of a neural network to compare killer whale (Orcinus orca) dialects. Journal of the Acoustical Society of America, 105:2499-2507.
Green, R.H., and R.C. Young. (1993) Sampling to detect rare species. Ecological Applications 3:351-356.
Harma, A. (2003) Automatic identification of bird species based on sinusoidal modeling of syllables. 2003 IEEE International Conference on Acoustics, Speech, and Signal Processing (Cat. No.03CH37404). IEEE. Part vol.5, 2003, pp.V-545-8 vol.5.
Hobson, K. A., R. S. Rempel, H. Greenwood, B. Turnbull, and S. L. Van Wilgenburg, (2002) Acoustic surveys of birds using electronic recordings: New potential from an omnidirectional microphone system. Wildlife Society Bulletin, 30 (3): 709-720.
Kogan, J. A., and D. Margoliash (1998) Automated recognition of bird song elements from continuous recordings using dynamic time warping and hidden Markov models: A comparative study The Journal of the Acoustical Society of America. 103(4):2185-2196.
McIlraith, A.L., and H. C. Card (1995) Birdsong recognition with DSP and neural networks. IEEE WESCANEX ’95 Conference Proceeedings, IEEE Cat. No. 95CH3581-6/0-7803-2741. pp. 409-414.
McLaren, A. A. and M. D. Cadman (1999) Can novice volunteers provide credible data for bird surveys requiring song identification? Journal of Field Ornithology 70(4): 481-490.
Morrison, M.L., W.M. Block, M.D. Strickland, and W.L. Kendall. (2001) Wildlife study design. Springer-Verlag, New York, N.Y.
O'Loghlen, A. L. and S. I. Rothstein (2003) Female preference for the songs of older males and the maintenance of dialects in brown-headed cowbirds (Molothrus ater) Behavioral Ecology and Sociobiology 53(2): 102-109.
Oswald, J. N., J. Barlow, and T.F. Norris (2003) Acoustic identification of nine delphinid species in the eastern tropical Pacific Ocean. Marine Mammal Science 19(1): 20-37.
Parsons, S., and G. Jones (2000) Acoustic identification of twelve species of echolocating bat by discriminant function analysis and artificial neural networks. Journal of Experimental Biology, 203: 2641–2656.
Parsons, S. (2001) Identification of New Zealand bats in flight from analysis of echolocation calls by artificial neural networks. Journal of Zoology (London) 253: 447-456.
Peters, S., W.A. Searcy, M.D. Beecher, and S. Nowicki (2000) Geographic variation in the organization of song sparrow repertoires. Auk 117:936-942.
Placer, J. and C. N. Slobodchikoff (2000) A fuzzy-neural system for identification of species-specific alarm calls of Gunnison's prairie dogs. Behavioural Processes 52(1): 1-9.
Queheillalt, D.M., J.W. Cain III, D.E. Taylor, M.L. Morrison, S.L. Hoover, N. Tuatoo-Bartley, L. Rugge, K. Christopherson, M.D. Hulst, M.R. Harris, and H.L. Keough. (2002) The exclusion of rare species from community-level analyses. Wildlife Society Bulletin 30:756-759.
Redgwell, R.D., J.M. Szewczak, G. Jones, and S. Parsons. (2009) Classification of echolocation calls from 14 species of bat by support vector machines and ensembles of neural networks. Algorithms 2009, 2, 907-924.
Robbins, C. S., D. Bystrak, and P. H. Geissler. (1986) The breeding bird survey: its first fifteen years, 1965-1979. United States Fish and Wildlife Service, Resource Publication 157, Washington, D.C., USA.
Shuford, W. D., and Gardali, T., editors. 2008. California Bird Species of Special Concern: A ranked assessment of species, subspecies, and distinct populations of birds of immediate conservation concern in California. Studies of Western Birds 1. Western Field Ornithologists, Camarillo, California, and California Department of Fish and Game, Sacramento.

Caltrans CFS Number 2045DRI, XB05 Bird Species Identification and Population Estimation by Computerized Sound Analysis
23
Slabbekoorn, H. and T. B. Smith (2002) Bird song, ecology and speciation. Philosophical Transactions of the Royal Society of London Series B-Biological Sciences 357(1420): 493-503.
Telfer, E.S., and D.R. Farr (1993) The potential of acoustic recordings as a means of monitoring breeding birds. Canadian Wildlife Service, Progress Note No. 203.
Venuto, V., R. Massa, and L. Bottoni (2001) African parrot vocalizations and their functional significance. Ostrich: 224-228.
Zimmerling, J. R. and C. D. Ankney (2000) A technique that increases detectability of passerine species during point counts. Journal of Field Ornithology 71(4): 638-649.
Validation and application Validation of methodology. This project tested and evaluated field recording methods to optimize field recording protocols, and evaluate the performance of acoustic recording surveys against traditional survey methods (point count surveys), and to demonstrate and validate the performance of project hardware and software. The following three sections present the results of these investigations.

Caltrans CFS Number 2045DRI, XB05 24 Bird Species Identification and Population Estimation by Computerized Sound Analysis
Assessing the use of automated audio recorders to survey avian species14
Summary
Point count surveys are widely used to infer avian presence, abundance, and species richness. However, advancements in bioacoustic technology now enable automated survey alternatives that can supplement human-based point count surveys with expanded temporal and spatial coverage. We surveyed birds in 13 northern Sierra Nevada and southern Cascade Range montane meadows from May to August 2006 using both point count surveys and automated audio recorders. We compared point count and automated recording unit surveys by placing audio recorders at 48 point count stations and recording avian vocalizations. The analysis of audio recorder data revealed 14 species per meadow (57 species total) while point counts detected 16 species per meadow (69 species total) when evaluated with equivalent sampling time for each method. Each method detected species not detected by the other method within the same meadow. Audio recorders provided over 1100 more hours of data than point count surveys with the same amount of personnel effort. Analyzing audio recording data beyond the equivalent time of point count surveys resulted in the detection of 13 additional species. Species accumulation curves using audio recorder data reached an asymptote in species richness for every meadow, but the relatively limited amount of point count data prevented reaching a species accumulation asymptote in 11 of the 13 meadows. We conclude that audio recorders provide a survey method that can increase the accuracy of avian surveys over larger temporal and spatial scales compared with equivalent personnel effort performing point count surveys.
Introduction
Point count surveys are widely used to assess avian abundance, presence, and species richness. However, accurate population estimates are often hindered by inconsistent data from survey to survey. Field observers have variable visual and auditory abilities (Cyr 1981, Kepler and Scott 1981, Bart 1985). Even within a field season an observers’ ability to detect and identify individual’s changes due to learning, and changes in their physical and mental state (Sauer et al. 1994, Kendall et al. 1996). In addition, some avian species can be attracted or repulsed by an observers’ presence causing biases in detectability (Bye et al. 2001). Temporal bias is also frequently present in point count data because of the small number of observers, limiting the number of locations that can be sampled simultaneously (Anderson et al. 1981, Best 1981).
Advancements in bioacoustic recording and processing technology make automated audio recording surveys a practical alternative or supplement to standard survey methods. Audio
14 Peer reviewed and accepted for publication as: Tegeler-Amones, A.K., M.L. Morrison, J.M. Szewczak, and C. Stermer (2010) Assessing point count sampling in montane meadows. California Fish and Game 96(3): 201-212.

Caltrans CFS Number 2045DRI, XB05 25 Bird Species Identification and Population Estimation by Computerized Sound Analysis
25
recorders reduce several types of bias associated with point count surveys (Hobson et al. 2002). Data collection does not depend upon highly skilled observers, which practically eliminates observer bias. Audio recorders also facilitate simultaneous monitoring at multiple sites, thus eliminating temporal bias. Both of these qualities facilitate consistent data from survey to survey, which can aid in estimating long-term population trends. Audio recorders can also collect data in conditions that are too intolerable or in areas that are too inaccessible for personnel to visit frequently. Permanent records of the survey period are also provided that can be played repeatedly or independently verified by third parties, increasing confidence in the species identified (Hobson et al. 2002). Audio recorders are also more cost effective long-term than human-based surveys by reducing personnel required in the field to collect data (Hobson et al. 2002). At the end of the field season, one or a few experts can process the recordings as time allows. Automated signal detection software can augment this process and leverage human resources. Audio recorders also have the potential to unleash time and personnel resources that could then be used to accomplish other project goals (Haselmayer and Quinn 2000) and expand landscape coverage with equivalent personnel.
Although audio recorders have shown promising results (Haselmayer and Quinn 2000, Hobson et al. 2002, Celis-Murillo et al. 2009), the full potential of audio recorders to detect avian species and support routine avian monitoring has yet to be realized. Previous studies have shown that short-term audio recorders have the potential to estimate avian species presence and probable absence (Hayselmayer and Quinn 2000, Hobson et al. 2002, Celis-Murillo et al. 2009). Short-term audio recordings were preferred to point counts when species richness was high, although point counts were more effective at detecting rarely heard species (Hayselmayer and Quinn 2000, Hutto and Stutzman 2009). Low rates of acoustic detection for a species may occur either because it sings infrequently or because it is uncommon (Haselmayer and Quinn 2000). Multiple site visits are often necessary to detect those species with human observers (Queheillalt et al. 2002). Advancements in audio recording technology now enable recording units to operate continuously for entire field seasons and therefore sample more intensively than that possible with human observers and short-term recordings. Long-term recording have the potential to increase the chance of assessing the presence or absence of uncommon and rarely heard species which require greater survey efforts to detect than more common species (Green and Young 1993), rending multiple site visits unnecessary to detect those species.
Further evaluation of different recording systems in different ecosystems, and testing the effectiveness of acoustic software to detect species from large audio files is needed to fully evaluate audio recorders as a research tool. Furthermore, no studies have evaluated the effectiveness of long-term audio recording to estimate species richness. We first evaluated the use of audio recorders to determine avian species richness compared to standard point count surveys by comparing species richness between the two methods when each method monitored for the same duration. We then determined the additional sampling effort needed to reach an asymptote in species richness from the audio recorder data. We also evaluated the

Caltrans CFS Number 2045DRI, XB05 26 Bird Species Identification and Population Estimation by Computerized Sound Analysis
26
effectiveness of SonoBirdTM (DNDesign 2007), software with a semi-automated acoustic search algorithm, to detect species from our audio recordings.
Methods
We conducted our study in wet montane meadows from the north-central Sierra Nevada to the southern Cascade Range including portions of Plumas, Sierra, Alpine, and Siskiyou counties, a linear distance of about 370 km. Willow (Salix spp.) and alder (Alnus spp.) dominated the riparian shrub communities in these montane meadows. The meadows were surrounded by lodgepole pine (Pinus contorta) and quaking aspen (Populus tremuloides) forests. Riparian shrubs in the meadows often followed streams but were also scattered throughout the meadow, interspersed with open herbaceous areas of grasses and sedges (Carex spp.) (Bombay et al. 2003, King and King 2003). All meadows were on California Department of Fish and Game (CDFG) or National Forest Service (USFS) land.
We selected 13 meadows as study sites under the criteria that they were located within the Sierra Nevada and southern Cascade Range, and maintained a significant amount of water from spring through early summer (bordering lakes not included). We selected meadows of varying sizes (12 to 209 ha) as avian species composition and abundance have been shown to change due to habitat patch size (Davis 2004). We identified all meadows fulfilling the criteria using aerial photographs and GIS software, followed by field observations.
Point count surveys. We placed point count stations systematically throughout each meadow, 250 to 400 m apart (112 total points). In small meadows where only 2 to 5 points could fit within the study area, the first point count station location was selected by determining all possible locations where the most points could fit into the meadow. We stratified the points by the vegetation cover types: riparian deciduous shrub, herbaceous, forest patches within the meadow, and meadow edge. We located point count locations in the field using GPS and they were marked with PVC pipe and flagging.
Twelve experienced field technicians conducted the point count surveys. We trained all field technicians to identify birds by sight and sound in montane meadows for at least 2 weeks before they conducted point counts. We recorded unlimited radius point count observations for 15-min at each station. Technicians tallied all individuals of every species identified during the 15-min period. The distance each individual was detected was recorded as < 50 m, 50 to 100 m, or > 100 m. We also documented if each individual was detected visually, audibly, or both. Individuals detected flying overhead were not included in the analysis. We conducted surveys at each point count station every 7 to 10 days from 6 June to 3 August 2006, resulting in each point being sampled eight times during the breeding season. We visited points eight times to increase the probability of detecting rare species. To make observer effects equal across sites, we randomized observers by having a different field crewmember conduct each point count station during each visit. Point counts were conducted from first light until 10:00 on days without

Caltrans CFS Number 2045DRI, XB05 27 Bird Species Identification and Population Estimation by Computerized Sound Analysis
27
strong winds (> 30 kph) or heavy precipitation. We sampled every meadow before re-sampling any meadow during the next round of surveys.
Automated audio recorder surveys. We sampled 48 point count locations with an automated audio recorder. We randomly selected the order of points sampled within each meadow and sampled multiple meadows simultaneously to reduce temporal bias. The number of locations in each meadow was proportional to meadow size. We left recorders at point count locations for approximately 7 days, then moved them to other not yet sampled point count locations for the next 7 days. The automated recording units recorded continuously at each point count location from 05:00 to 10:00 even when adverse weather caused point counts to be cancelled. We collected audio recorder data from 8 June to 3 August 2006. At least one point count survey was conducted concurrently with most audio recordings.
We designed our audio recording units to optimize bird detection while maintaining cost effectiveness. We stored data on DMC xclef HD-500 digital mp3 players (Digital Mind, Corp., Carlsbad, CA). The DMC mp3 players had 100 GB of storage, sufficient to store approximately 700 hours of data. We collected mono audio data at 320 kbps with a sampling frequency of 44.1 kHz. We recorded at this audio quality setting to enable species identification using sonograms to supplement and confirm aural identification. We recorded the audio data using PA3 mini microphones (MG Electronics, Hauppauge, NY). The microphones included a built in preamplifier with line level output that facilitated recording by the DMC units. The microphones detected frequencies 20 to 16000 Hz and had a signal to noise ratio of more than 58 dB. We fitted the microphones into a custom four-horn arrangement that increased gain omni directionally in the ground plane of the meadows15 (Tegeler-Amones 2008). The geometry of the horns provides some low frequency noise rejection to optimize the recording sensitivity to higher frequency songbird vocalizations (Fig. 1). The audio recording units were powered by two 12 volt, 12 Amp-hour batteries (24 Amp-hour total capacity) maintained with a 20-watt solar panel connected by a charge controller. We housed the power and recording equipment in a waterproof NEMA 3R enclosure (12” H X 10” W X 6” D). The
15 The horns follow from a recommendation from Dr. Kurt Fristrup (then at Cornell Laboratory of Ornithology, currently with the National Park Service). He calculated the ideal acoustic horn geometry for songbird reception and found that the cone geometry of commercially available funnels (McMaster-Carr part number 4005T5) closely approximate the calculated ideal shape. We adapted his original single horn configuration into a four horn arrangement with 360° coverage.
Figure 1. Acoustic horn configuration used for field recording of bird vocalizations. The PA3 microphone element is positioned at the junction of all four horns, at the top of the junction to prevent damage from moisture.

Caltrans CFS Number 2045DRI, XB05 28 Bird Species Identification and Population Estimation by Computerized Sound Analysis
28
audio recording units successfully collected data in weather below freezing, above 90 degrees Fahrenheit, and also during heavy wind, rain, sleet, and snow.
Distance estimation using automated audio recorders. We tested the recording sensitivity of five audio recorders while at point count locations in study meadows using pre-recorded vocalizations. We broadcast territorial vocalizations of Willow Flycatcher (Empidonax traillii), Lincoln’s Sparrow (Melospiza lincolnii), and Wilson’s Warbler (Wilsonia pusilla) at a sound level equivalent to natural singing volume as judged by two experienced birders. We broadcast the vocalizations starting 50 m from a recording unit and repeated the process moving further from the audio recorder in 10 m increments and then determined when none of the species could be detected from the audio recordings. We conducted trials in willow clumps and open areas in the study meadows. Vegetation density at chest height was recorded along a transect between the audio recorder and the person playing the broadcast. We classified vegetation by percent cover as sparse (0% to 30%), moderate (31% to 60%), or dense (61% to 100%) to determine whether vegetation density affected the distance bird species could be identified from the audio recordings. The process was also repeated at 0 and 45 degrees from a speaker horn to assess any difference in directionality of detection sensitivity.
To establish the distance limitations of audio recordings to identify species we ran an ANOVA (Zar 1999:177) to test if the maximum distance each species could be detected differed between species. We then ran a Type III Factorial ANOVA (Zar 1999:231) to see if distances differed between varying vegetation densities and orientations. For the analysis, the distance a species could be detected was the dependent variable and vegetation density and orientation were fixed factors. All analyses in the study were run using SPSSTM 13.0 for Mac OS X (SPSS 2006) unless otherwise noted.
Comparison of automated audio recorders and point count surveys. We directly compared species richness estimates between point count and audio recorder surveys. We randomly selected four 15-min segments of audio recorder data from each day between first light and 10:00 and identified all the species detected in the recordings. Two field technicians that had conducted the point count surveys and also had previous experience working with avian species in Sierra Nevada montane meadows (3 and 5 years) identified species from audio recorders manually with audible recognition, and from sonograms generated using SonoBird acoustic analysis software that readily enabled comparison of unknown audio recordings with reference recordings of known species. The technicians replayed the audio files as many times as needed to identify all the species and were able to get verification from 3rd parties when needed. The audio files were randomly assigned to each technician to avoid observer bias between meadows.
Because point count surveys were conducted every 7 to 10 days and recorders remained at point count stations for 7 consecutive days, two point count surveys were conducted on approximately the same dates as the recorders were collecting data at each point. To avoid

Caltrans CFS Number 2045DRI, XB05 29 Bird Species Identification and Population Estimation by Computerized Sound Analysis
29
temporal bias, we only included data from the two point count surveys conducted while the audio recorder collected data in the analysis. We randomly chose two 15-min recording segments to compare to the two 15-min point count surveys. Whenever possible, we selected the two audio recording segments from different days; however recorder data and point count data were not always from the same day. There were typically less than 3 days between the day of the point count and the day of the recorder data. We calculated the total number of species detected at each point count location for each method.
We used a type III factorial ANOVA (Zar 1999:231) to compare the total number of species detected between the point count surveys and automated audio recording units. Meadow was a random factor, and the two treatments--point count survey and audio recorder--were a fixed factor, and the dependent variable was the number of species detected at each point by each treatment. We made meadow the sampling unit while point count stations within a meadow where audio recorders collected data were the replicates. We only included meadows that had reached at least 95% of an asymptote using species accumulation curves for each method in the analysis (see next section). Since audio recorders only collect audio data, we then reran the analysis including only species detected audibly from the point count surveys, while excluding species detected visually.
Species accumulation curves. We generated species accumulation curves to determine the duration audio recorders needed to collect data for each meadow to reach an asymptote in species richness. We used a custom software program developed by one of us (Szewczak) to generate the accumulation curves based on methods described in Moreno and Halffter (2000). Data from 15-min recording segments were added systematically by point location to the analysis until reaching an asymptote in species richness. We generated accumulation curves using both the exponential and Clench models. We used the models to account for uncertainties in the observational data and to calculate quantitative estimates of species richness and anticipated total species. The exponential model assumes that the number of species detected decreases linearly as sampling effort increases (Moreno and Halffter 2000) and is preferred for populations of well-known species or when the study area is relatively small and could theoretically reach an asymptote over a finite period of time (Soberon and Llorente 1993). The Clench model assumes that the probability of adding species increases over time, but decreases as more species are recorded (Moreno and Halffter 2000). Soberon and Llorente (1993) suggested the Clench model be applied to larger areas than when the exponential model would be used, or for taxa where the probability of adding new species would increase as time in the field increases, until an upper limit is reached. The results from the exponential model and Clench model can be considered the lower and upper limit, respectively, of sampling effort needed for specific species richness goals (Moreno and Halffter 2000). We smoothed each curve by using the regression of 1024 randomizations of the 15-min audio segments. We also created species accumulation curves using the exponential model for the point count data to determine what percent of an asymptote in species richness was reached for each meadow as a comparison to the audio recorder data.

Caltrans CFS Number 2045DRI, XB05 30 Bird Species Identification and Population Estimation by Computerized Sound Analysis
30
Affects of study design. We also tested whether our study design affected the duration required for audio recorders to collect data to reach an asymptote in species richness. Since each meadow had a different number of locations where audio recorders collected data, we ran a linear regression (Zar 1999:324) to determine if the number of recording locations within a meadow affected the recording duration required for each meadow to reach an asymptote in species richness. We also moved the audio recorders throughout the field season so not all locations were sampled simultaneously. We used a linear regression to assess any relationship between species richness and the dates each recording unit started collecting data in each meadow (Zar 1999:324). We also ran a one-way ANOVA to see if there was a difference in the dates recorders were collecting data between meadows (Zar 1999:177).
Automated species detection using SonoBird software. We tested whether species not detected in the abbreviated recordings used in the audio recorder and point count survey comparison analysis were present in the complete audio data set. We randomly selected five study meadows and used SonoBird to search for nine species not detected manually from the audio recording samples used in the comparison but were detected by the point count surveys. SonoBird searched using representative example vocalizations from each species and autonomously scanned all the audio files from the five meadows to find similar candidate signals that matched the examples. SonoBat then presented the candidate signals ordered by quality of the match (measured by correlation coefficient) that we could scroll through and confirm or reject species presence.. We selected representative vocalizations from recordings in Szewczak’s bird recording library. The library contains high quality (high signal-to-noise ratio) distortion–free vocalizations from several individuals of the selected species. SonoBird labeled each audio selection with a correlation value that indicated how similar it was to the template, reducing the time needed to scroll through misclassifications. Then, beginning with the audio selections most highly correlated with the template, we manually scrolled through the selections until we identified a vocalization of the focal species.
Results
We sampled 48 point count locations with automated audio recording units. The number of points per meadow was proportional to the meadows size (mean = 3, range = 1 to 10 points). Even though we placed the automated audio recording units at each location for 7 days, because of equipment failure, not all units recorded for the full 7 days. The average duration recorded at each location was 5 days (range 1 to 8 days). The number of days recording units collected data in each meadow ranged from 3 to 35 days (mean = 16 days).
Distance at which automated audio recorders could detect species. The distance at which Willow Flycatcher, Wilson’s Warbler, and Lincoln’s Sparrow could no longer be identified from the audio recordings was unaffected by vegetation density, or orientation to the microphone horns. The average distance at which we detected Lincoln’s Sparrow was 117 m (SD = 45.986), Willow Flycatcher was 116 m (SD = 45.747), and Wilson’s Warbler was 115 m (SD = 48.217);

Caltrans CFS Number 2045DRI, XB05 31 Bird Species Identification and Population Estimation by Computerized Sound Analysis
31
these distances were not significantly different (F = 0.003, DF = 2, P = 0.997). Since the distances were not different between the species, we combined the species for the rest of the analysis. The mean distance the species could be identified increased as vegetation density decreased but the differences were not significant (F = 2.546, DF = 2, P = 0.089). In sparse vegetation the average distance we could detect the species was 136 m (SD = 62.117). Although not statistically significant, the average distance we could detect species in moderate vegetation dropped to 109 m (SD = 23.440), and in dense vegetation 104 m (SD = 38.827). Whether the broadcast vocalization was played into a horn or between two horns did not affect the distance the species could be detected (F = 0.065, DF = 2, P = 0.800). The average distance we could detect the species when broadcast into a horn was 118 m (SD = 49.036) and when broadcast between two horns was 114 m (SD = 43.153). Most detections of the three species were < 100 m from the point count station (Wilson’s Warbler = 90 %, Lincoln’s Sparrow = 80 %, Willow Flycatcher = 56 %) so we included point count survey data from all distances in our methods comparison.
Comparison of automated audio recorders and point count surveys. We included eight study meadows in our analysis because they had reached at least 95% of an asymptote in species richness using both the audio recorder and point count methods. When we compared species richness between the two methods using recordings of equal duration to the point count observation time, point counts detected two more species per meadow than audio recorders. Although the difference in species richness estimates was small it was statistically significant (F = 7.321, DF = 1, P = 0.023). Audio recorders detected an average of 14.2 (SD = 3.273) species per meadow while point counts detected 15.8 (SD = 2.303) species. When we compared audio recorder data to only point count data collected audibly, there was no significant difference in species richness between the two methods (F = 0.718, DF = 1, P = 0.416). Audio recorders detected an average of 14.2 (SD = 3.273) species per meadow and point counts detected an average of 14.5 (SD = 2.063) species per meadow.
When we combined data from all the meadows, audio recorders and point counts detected a similar number of species. Audio recorders detected 57 species while point counts detected 69. We detected six species with the audio recorders that were not detected by point counts. We also detected 18 species during point counts that were not detected by the recorders, five of which were only detected visually. Most of the species detected by only one method were detected at four or less point locations, indicating they were relatively rare or difficult to detect (Table 1).
Species accumulation curves. An asymptote in species richness was reached using the audio recorder data for each study meadow using the exponential model (Table 2). When we analyzed the additional 15-min audio recording segments required for each meadow to reach an asymptote in species richness (0.25 hr to 3.25 hrs of recordings per meadow), recorders detected seven additional species, five of which had been detected by point counts (Table 1). We reached 69% to 100% of an asymptote in species richness using the point count data for

Caltrans CFS Number 2045DRI, XB05 32 Bird Species Identification and Population Estimation by Computerized Sound Analysis
32
each study meadow with the exponential model (Table 3). We did not reach the asymptote for each meadow because there were only 24 hours of point count data (all of which were included in the analysis). The total recording time required in each meadow to reach an asymptote using audio recorder data ranged from 1 to 4.5 hrs (Table 2). The recording time at point locations within each meadow required for the meadow to reach an asymptote ranged from 15 to 127 minutes (Table 2). We reached 78% to 86% of an asymptote in species richness for the audio recorder data using the Clench model (Table 2), however there were 1100 hours of audio data that were not analyzed.
Affects of study design. Our study design did not affect the recording duration needed to reach an asymptote in species richness. There was only a slight indication that the number of recording locations within a meadow was related to the amount of time each recorder had to collect data for the meadow to reach the asymptote (R2 = 0.220, F = 3.382, P = 0.091). We were also able to eliminate temporal bias between the study meadows. At the meadow scale, species richness was not affected by the date individual recording units were collecting data (R2 = 0.004, F = 0.049, P = 0.829), and there was not a difference in the dates recording units were placed in the meadows (F = 0.637, DF = 13, P = 0.806)
Species detection using SonoBird software. We used SonoBird to search a total of 620 hours of audio recordings (all audio files from five randomly selected meadows) for nine species that were not detected by manual listening and inspection of the audio data in previous analysis. SonoBird detected six of the nine species (bringing the total number of species detected using audio recorders to 70) suggesting that additional species may yet be detected as additional hours of audio data are analyzed. Each of the species detected were detected four or less timeduring point count surveys suggesting that audio recorders can detect relatively rare and difficult to detect species.
SonoBird was able to search the 620 hours of audio data for the nine species in approximately 10.5 hours. The additional time needed to identify vocalizations of the species of interest from the audio segments SonoBirdT selected varied by species but ranged from 1 min to 2 hours. The three species not detected by SonoBird in the recordings required the largest time commitment.
Discussion
Our results indicate that recording units offer a viable supplement and a potential alternative to standard point count surveys. Our study provided an example of the application of audio recorders to conduct large-scale avian species richness surveys. The audio recorders could monitor all of the regions simultaneously, and provided over 1200 hours of data, at least 1000 hours more than the typical point count survey with the equivalent personnel effort.

Caltrans CFS Number 2045DRI, XB05 33 Bird Species Identification and Population Estimation by Computerized Sound Analysis
33
In contrast to standard observer survey methods, automated audio recorders can monitor continuously and thereby sample more intensively than that possible with human observers. Our automated audio recorders collected data for 7 consecutive days, although currently available equipment can acquire data for 24 hours a day for a month or more depending upon memory storage capacity. More comprehensive surveys increase the confidence of detecting rare and difficult to detect species (Haselmayer and Quinn 2000). Although we only included two of the eight point count surveys conducted at each point location in our analysis. When data from all eight surveys conducted at points with audio recorders were combined 96 species were detected, compared to the 69 from only the two point count surveys. While our data suggests there is an asymptote at approximately 70 species, those species are probably just the most

34
Table 1. Species detected only by one survey method, either point count survey or audio recorders in Sierra Nevada and Cascade Range montane meadows from May to August 2006 (N signifies the total number of point location where each species was detected). Species detected by both methods are not included.
Point count Audio recorder Audio recorder species Species Scientific name detections (N) detections (N) accumulation curve detections (N)
American Crow Corvus brachyrhynchos 2 1 American Dipper Cinclus mexicanus 1 Bald Eagle Haliaeetus leucocephalus 1 Band-tailed Pigeon Columba fasciata 1 1 Black-headed Grosbeak Pheucticus melanocephalus 3 California Quail Callipepla californica 2 Cliff Swallow Petrochelidon pyrrhonota 1 Cooper’s Hawk Accipiter cooperii 1 Common Merganser Mergus merganser 1 Golden-crowned Kinglet Regulus satrapa 1 Green-tailed Towhee Pipilo chlorurus 2 Hammond’s Flycatcher Empidonax hammondii 4 Hermit Thrush Catharus guttatus 2 Hermit Warbler Dendroica occidentalis 1 Killdeer Charadrius vociferous 2 Mallard Anas platyrhynchos 6 1 Nashville Warbler Vermivora ruficapilla 2 1 Osprey Pandion haliaetus 1 Pine Grosbeak Pinicola enucleator 1 Pygmy Nuthatch Sitta pygmaea 1 Rufous Hummingbird Selasphorus rufus 1 Townsend’s Solitaire Myadestes townsendi 1 1 Violet-green Swallow Tachycineta thalassina 2 White-breasted Nuthatch Sitta carolinensis 1 Winter Wren Troglodytes troglodytes 1 Yellow-breasted Chat Icteria virens 1

35
Table 2. Species accumulation curve results created using audio recorder data from Sierra Nevada and Cascade Range montane meadows from May to August 2006. sometimes less than point count data.
Exponential model Clench model Recorders Time Estimated % Asymptote Estimated % Asymptote Total species per per Meadow total species (N) reached total species (N) reached observed (N) meadow recorder (min)
Bigelow 21 100.04 27 77.59 21 3 35
Curtis 19 101.66 23 83.90 19 1 60
East corral 29 101.10 37 78.81 29 3 40
Forestdale 36 100.99 46 79.11 36 2 127
Little truckee 22 101.37 26 84.21 22 4 30
LT west 25 100.12 32 79.20 25 3 40
McCloud 34 100.40 43 78.56 34 4 67
North meadow 28 100.89 35 79.33 28 3 45
Perazzo 29 100.53 37 78.34 29 6 18
Red lake 37 100.53 46 80.07 37 3 70
Red lake peak 25 100.58 32 78.44 25 4 23
Southeast corral 20 101.94 23 85.88 20 2 37
West corral 30 101.15 37 80.77 30 10 15

Caltrans CFS Number 2045DRI, XB05 36 Bird Species Identification and Population Estimation by Computerized Sound Analysis
36
Table 3. Comparison of percent asymptote reached, number of species observed, and total sampling time for audio recorders and point counts in Sierra Nevada and Cascade Range montane meadows from May to August 2006. Thirty hours and fifteen minutes out of 1200 hours of audio recorder data were analyzed while all 24 hours point count data were analyzed.
% Asymptote Species Total sampling reached observed (N) time (min) / meadow Meadow Recordera / Point countb Recorder / Point count Recorder / Point count
Bigelow 100.0 / 99.7 21 / 17 105 / 90
Curtis 101.7 / 81.5 19 / 15 60 / 30
East corral 101.1 / 96.6 29 / 34 120 / 90
Forestdale 101.0 / 68.8 36 / 32 255 / 60
Little truckee 101.4 / 94.4 22 / 35 120 / 120
LT west 100.1 / 97.6 25 / 26 120 / 90
McCloud 100.4 / 89.5 34 / 28 270 / 120
North meadow 100.9 / 91.6 28 / 23 135 / 90
Perazzo 100.5 / 100.9 29 / 35 105 / 180
Red lake 100.5 / 97.0 37 / 25 210 / 90
Red lake peak 100.6 / 94.4 25 / 35 90 / 120
Southeast corral 101.9 / 86.7 20 / 23 75 / 60
West corral 101.2 / 100.4 30 / 36 150 / 300
All meadows 103.4 / 106.8 64 / 69 30.25 / 24 (hrs)
aThe audio recorder data include the time needed to reach an asymptote in species richness, so in most cases, include more minutes than the point count data. bThe point count data include data from the two point count surveys that were conducted while the audio recorders were collecting data.

Caltrans CFS Number 2045DRI, XB05 37 Bird Species Identification and Population Estimation by Computerized Sound Analysis
37
common and easy to detect. Long-term recording provides an opportunity to collect enough data to detect many of the additional rare and difficult to detect species.
The advent of automated species search and identification software will further facilitate and enhance the practicality and application of automated recording surveys, e.g., XBAT (Cornell Laboratory of Ornithology, Song Scope™ (Wildlife Acoustics 2007), and other programs under development (e.g., SonoBird. We successfully used SonoBird to search and identify species from our audio files. SonoBird reduced the time necessary to find species in our 1200 hours of audio files compared to manual identification. Manually searching through the audio files took 15 to 30 min for every 15-min file. With SonoBird we were able to search over 600 hours of audio data in less than 20 hours. However, not all species from the files were identified, just selected focal species. With the current state of software development a combination of interactive manual identification and automated search software provides the most efficient method for estimating species richness from audio recordings. In our study, an effective method of determining species richness from long-term recordings was manual identification of individuals until reaching an asymptote in species richness, after which it became more efficient to use automated software to search for species with suspected presence or were of particular interest. Our results indicate that the longer our audio units recorded data, the more rarely heard species were detected, providing more accurate species richness data than that possible with short-term point count surveys.
However, automated audio recording surveys do present some limitations. Recorded audio data cannot readily estimate species abundances because current systems have only limited ability to estimate distances and number of individuals (but see Celis-Murillo et al. 2009). Equipment can also fail, so despite their capacity for long duration recording, field-deployed audio recorders should be monitored periodically to ensure their operational status. In addition, periodic site visits by field personnel can provide some general information about the condition of the sites could be missed. However, such site assessment could be addressed in a study plan as part of the routine visitation to maintain the recording equipment.
Audio recorders also have the potential to collect other types of data. For example, it is possible to glean some demographic information from particular call types such as whisper songs, alarm calls, and scolding. They also have the potential to collect data 24 hours a day, providing information about nocturnal species that are not typically included in point count surveys. Audio recorders also provide an alternative or a supplement to standard species-specific surveys. For example, in our study audio recorders detected Willow Flycatchers in all the meadows where they were detected during standard surveys. But with the greater sampling effort available using audio recorders, a Willow Flycatcher was also detected in a meadow where none were detected during the standard USFS surveys, providing another example of how long-term audio recordings can effectively detect rare species (Tegler-Amones 2008). Recording units like the ones in our study were also used to supplement USFS Great Gray Owl (Strix nebulosa) survey data (Rognan et al. 2009) and demonstrate recognition of individuals. Audio recorders have also been used to simultaneously record bird vocalization, ambient noise, and noise generated from road construction activities at varying distances from the road right-of-way (Lackey and Morrison, unpubl. data).

Caltrans CFS Number 2045DRI, XB05 38 Bird Species Identification and Population Estimation by Computerized Sound Analysis
38
Acknowledgements
We thank Heather Mathewson, Bret Collier, and Helen Bombay-Loffland for their analytical and practical advice and to the many research technicians that provided valuable field support. Funding was provided by the California Department of Transportation and the California Department of Fish and Game through a cooperative agreement with the University of California, Riverside subcontracted to Texas A&M University. The project was approved by the Animal Care and Use Committee (IACUC) protocol No. 05/06.B.97.A.
Literature cited Anderson, B. W., R. D. Ohmart, and R. Rice. 1981. Seasonal changes in avian densities and diversities. Studies in Avian Biology 6:262-264.
Bart, J. 1985. Causes of recording errors in singing bird surveys. Wilson Bulletin 97:161-172. Best, L. B. 1981. Seasonal changes in detection of individual bird species. Studies in Avian Biology 6:252-261.
Bombay, H. L., M. L. Morrison, and L. S. Hall. 2003. Scale perspectives in habitat selection and animal performance for Willow Flycatchers (Empidonax traillii) in the central Sierra Nevada, CA. Studies in Avian Biology 26:60-72.
Bye, S. L., R. J. Robel, and K. E. Kemp. 2001. Effects of human presence on vocalizations of grassland birds in Kansas. Prairie Naturalist 33:249-256.
Celis-Murillo, A., J. L. Depp, and M. F. Allen. 2009. Using soundscape recordings to estimate bird species abundance, richness, and composition. Journal of Field Ornithology 80:64-78. Cyr, A. 1981. Limitations and variability in hearing ability in censusing birds. Studies in Avian Biology 6:327-333.
Davis, S. K. 2004. Area sensitivity in grassland passerines: effects of patch size, patch shape, and vegetation structure on bird abundance and occurrence in southern Saskatchewan. Auk 121:1130-1145.
DNDesign. 2007. SonoBirdTM Version beta 1.5.8. Arcata, CA. Green, R. H. and R. C. Young. 1993. Sampling to detect rare species. Ecological Applications 3:351-356.
Haselmayer, J., and J. S. Quinn. 2000. A comparison of point counts and sound recording as bird survey methods in Amazonian southeast Peru. Condor 102:887-893. Hobson, K. A., R. S. Rempel, H. Greenwood, B. Turnbull, and S. L. VanWilgenburg.
Acoustic surveys of birds using electronic recordings: new potential from an omnidirectional microphone system. Wildlife Society Bulletin 30:709-720.
Hutto, R. L. and R. J. Stutzman. 2009. Humans versus autonomous recording units: a comparison of point-count results. Journal of Field Ornithology 80:387:398.
Kendall, W. L., B. G. Peterjohn, and J. R. Sauer. 1996. First-time observer effects in the North American Breeding Bird Survey. Auk 113:823-829.
Kepler, C. B. and J. M. Scott. 1981. Reducing bird count variability by training observers. Studies in Avian Biology 6:366-371.
King, A. M. and J. R. King. 2003. Willow Flycatchers in Warner Valley, Plumas County, California. Studies in Avian Biology 26:56-59.
Moreno, C. E. and G. Halffter. 2000. Assessing the completeness of bat biodiversity inventories using species accumulation curves. Journal of Applied Ecology 37:149-158.
Queheillalt, D. M., J. W. Cain III, D. E. Taylor, M. L. Morrison, S. L. Hoover, N.
Tuatoo-Bartley, L. Rugge, K. Christopherson, M. D. Hulst, M. R. Harris, and H. L. Keough. 2002. The exclusion of rare species from community-level analyses. Wildlife Society Bulletin 30:756-759.

Caltrans CFS Number 2045DRI, XB05 39 Bird Species Identification and Population Estimation by Computerized Sound Analysis
39
Rognan, C. B., J. M. Szewczak, and M. L. Morrison. 2009. Vocal individuality of Great Gray Owls in the Sierra Nevada. Journal of Wildlife Management 73:755-760.
Sauer, J. R., B. G. Peterjohn, and W. A. Link. 1994. Observer differences in the North American breeding bird survey. Auk 111:50-62.
Soberon, J. and J. Llorente. 1993. The use of species accumulation functions for the prediction of species richness. Conservation Biology 7:480-488.
SPSS. 2006. SPSS for Mac OS X, Version 13.0. SPSS Inc., Chicago, IL. Tegeler-Amones, A. K. 2008. Assessing monitoring techniques of avian species in Sierra Nevada montane meadows. MA thesis, Humboldt State University, Arcata, CA.
Wildlife Acoustics. 2007. SongScopeTM Version 1.10. Concord, MA.
Zar, J. H. 1999. Biostatistical analysis. 4th ed. Prentice Hall, Upper Saddle River, NJ.

Caltrans CFS Number 2045DRI, XB05 40 Bird Species Identification and Population Estimation by Computerized Sound Analysis
40
Autonomous recording of great gray owls in the Sierra Nevada
Summary
The Great Gray Owl’s (Strix nebulosa) nocturnal behavior and secretive nature make a difficult species to detect and survey. We investigated whether autonomous recording units (ARUs) could be used as a detection method to aid in presence - absence surveys and to monitor Great Gray Owl activity. We deployed ARUs in 15 potential Great Gray Owl territories from March - July 2006 and 2007 in the Sierra Nevada, California. Each unit recorded 12 hours per night (18:00 – 06:00). Great Gray Owl vocalizations were successfully recorded at 10/15 sites. In locations where owls were detected, audible calls were recorded during 49.5% of the nights sampled. Juvenile begging calls were the most easily recorded vocalization and may be the most useful indicator for owl presence and nest success. We concluded that a combination of ARUs and other bioacoustic techniques can provide an effective and non-invasive approach to detect and monitor Great Gray Owls as well as other secretive and nocturnal species.
Introduction
Bioacoustic techniques are increasingly being used as a conservation tool to aid in presence -absence surveys and to monitor rare or endangered species (Calupca et al. 2000, Hobson et al. 2002, Gaunt and McCallam 2004). Bioacoustic tools can particularly benefit owl research since most owl species occur in low densities, are secretive, and their cryptic coloration makes them difficult to detect (Johnsgard 2002). The southernmost population of the transboreal Great Gray Owl (Strix nebulosa) occurs in just a few areas of the California Sierra Nevada, with the largest population near Yosemite National Park and the Stanislaus and Sierra National Forests (Winter 1986, Green 1995). Surveys often use playback to increase the probability of detection; however many owls may still go undetected due to their secretive nature. Great Gray Owls typically limit their vocal activity to short calling bouts peaking between 01:00 and 04:00 (Beck and Winter 2000). However, researchers usually perform surveys in the evening hours after sunset. In areas supporting just a single pair of birds, male Great Gray Owls are less territorial and often do not respond to playback at all (Beck and Winter 2000). As with other species of owls, unpaired individuals, or floaters, may remain quiet during playback to avoid territorial conflict with other males (Rohner 1997). These elusive behaviors exacerbate the difficulty in studying and detecting Great Gray Owls.
Autonomous recording units (ARUs) can automatically collect and store animal digital recordings of animal vocalizations in the field following a specified schedule. When equipped with sufficient memory and batteries, these recording units can be deployed in remote locations and continuously record acoustic data for weeks at a time (Calupca et al. 2000). Although ARUs can collect overwhelming quantities of acoustic data, advances in software have greatly improved the speed and accuracy for locating target sounds of interest. Acoustic analysis software such as SonoBird (DNDesign, Arcata, CA) or XBAT (Cornell Lab of Ornithology, Ithaca, NY) can automatically scan through waveforms, sonograms, and power spectrums of acoustic data. Frequency filters can also be applied to eliminate background noises and other signals outside the frequency range of the species being monitored. These programs highlight all sounds matching pre-determined temporal frequency and amplitude characteristics of the

Caltrans CFS Number 2045DRI, XB05 41 Bird Species Identification and Population Estimation by Computerized Sound Analysis
41
target sound(s) of interest, thus enabling rapid identification when the species of interest has been recorded (Clark and Fristrup 1999).
The nature of owl vocalizations and their nocturnal behavior make them ideal subjects for ARU monitoring. Given that most of their calling activity occurs during the night, they avoid acoustic competition with other birds and ambient noises such as higher daytime winds. Furthermore, owls produce very low frequency vocalizations that carry long distances. These low frequency sounds more capably penetrate acoustical obstructions such as trees, brush, and thick vegetation (Catchpole and Slater 1995). In optimal conditions, calls of Great Gray Owls can be heard from a distance of up to 800 m, although they are usually heard at a distance of 300-500 m (Johnsgard 2002). We investigated whether the use of autonomous recording units (ARUs) could be used as a viable detection method to aid in presence - absence surveys and to monitor Great Gray Owl activity.
Methods
Study Area. We installed ARUs on the western slope of the Sierra Nevada in Yosemite National Park, Stanislaus, and Sierra National Forests in Madera, Mariposa, and Tuolumne counties. All recording stations were located at or adjacent to montane meadows ranging in elevation from 830 m to 1,800 m above sea level. The dominant vegetation was mixed evergreen forests consisting mostly of sugar pine (Pinus lambertiana), ponderosa pine (P. ponderosa), lodgepole pine (P. contorta), Jeffrey pine (P. jeffreyi), incense cedar (Calocedrus decurrens), white fir (Abies concolor), and red fir (A. magnifica). At lower elevations, oak (Quercus spp.) and manzanita (Arctostaphylos spp.) were also common components of habitats.
The weather for this area varied considerably over the range of elevations, but summers were generally warm and dry, whereas winters were wet and cold. During our study from January to May 2006, precipitation was 89% above average with daily high temperatures 19% cooler than average (California Department of Water Resources [CDWR] 2006). From January to May 2007, precipitation was 28% below average with daily high temperatures 4% warmer than average (CDWR 2007). Biologists from California Department of Fish and Game (CDFG) and the United States Forest Service (USFS) found several nests in both seasons of our study, indicating that breeding occurred regularly despite these differences in weather conditions.
Field Application of Autonomous Recording Units. In 2006 we placed ARUs within 100 m of 4 nests with chicks present. We also placed ARUs at 2 recently used nests (< 2 weeks old) that did not produce young. Each ARU contained a DMC Xclef digital recorder (Digital Mind Corporation, Carlsbad, CA) with a 100-gigabyte (GB) hard drive. We collected acoustic data at 320 kbps with a sampling frequency of 44.1 kHz. We made stereo recordings using 2 PA3 omni mini-microphones with built in preamps (Supercircuits, Austin, TX). Digital recorders and microphones received power from two 12-volt, 12 amp-hour batteries, and we recharged batteries with a 20-watt solar panel connected via a charge controller. We attached microphones to tree limbs with all remaining equipment housed in a weatherproof enclosure covered with leaves and bark for camouflage. We recorded data for 111 nights, with a mean of 18.5 nights per territory. The ARUs collected data at each site from 1–4 weeks between 5 June

Caltrans CFS Number 2045DRI, XB05 42 Bird Species Identification and Population Estimation by Computerized Sound Analysis
42
and 14 July 2006. This sampling period coincided with the Great Gray Owl breeding and fledging stage.
In 2007 we increased our sampling effort and attempted to collect vocalizations during the pre-breeding and early nesting period between 2 March and 15 April. We also improved the hardware used in ARUs by replacing the DMC Xclef digital recorders with iRiver H320 units (ReignCom, Seoul, South Korea) running Rockbox firmware (Rockbox Version 5, 2007) on each H320 to enhance recording functions. These recorders had internal 20-GB hard drives and we programmed them to save recordings as lossless 16-bit WavPack files at a sampling frequency of 44.1 kHz. Each recorder had an integral real time clock that labeled the recordings with a date and time stamp. Using a countdown timer function, we set each unit to record 12 hours every night from 18:00 to 06:00.
During 2007 we installed ARUs in 15 potential owl territories, 6 of which were in the same locations as 2006 where nests were located. Two ARUs were set up in other locations of known Great Gray Owl occupancy, and 7 were set up in areas of possible occupancy. In areas of possible occupancy, we moved ARUs to multiple locations along the meadow edge to sample a larger area and to increase the likelihood of detection. We rotated ARUs after 5 or more nights passed without recording a Great Gray Owl. We covered a total of 28 locations within the 15 potential owl territories. We checked ARUs on a weekly or bi-weekly basis and moved them to new locations when Great Gray Owls were successfully recorded. ARUs recorded at each territory for a minimum of 8 nights and a maximum of 42. The ARUs collected acoustic data for a total of 274 nights with a mean of 18.3 nights per territory.
Data Analysis Methods. We analyzed ARU recordings collected between 18:00-06:00 on a Macintosh™ OS X computer using audio-editing software Audacity™ (Audacity, beta Version 1.32, 2007). During analysis, all mp3 and WavPack audio files were converted to 44.1 kHz 16 bit wave files. We applied a band pass filter to isolate sounds within the frequency range of the Great Gray Owl. Then we reviewed each 12-hour recording by manually scrolling through the waveform and highlighting all patterns that looked like possible Great Gray Owl vocalizations. Lastly, we listened to all the candidate sounds amplified by 10-25 decibels and inspected its sonogram to confirm if it was produced by a Great Gray Owl. During our analysis we compiled detailed notes of Great Gray Owl vocalizations to calculate the times when owls were vocalizing, and to quantify calls of males, females, fledglings, interactions, and any other unusual vocalization or behavior.
Results
Autonomous Recording From 5 June to 14 July 2006
During the fledging stage, we successfully recorded Great Gray Owls with ARUs at all six territories. We detected owls on 74 of 111 (66.7%) nights sampled. The probability of recording an owl on a given night ranged from 16.7% to 100%. Male and female vocalizations were recorded in all territories, and fledglings were recorded at all 4 territories where they were present. Female vocalizations were detected a total of 165 times, males 39 times, and chicks 205 times.

Caltrans CFS Number 2045DRI, XB05 43 Bird Species Identification and Population Estimation by Computerized Sound Analysis
43
Begging calls of Great Gray Owl fledglings were the loudest and most easily recorded vocalization by ARUs. We detected fledglings on 52 of 90 (57.8%) nights sampled. Although begging calls were recorded throughout all hours of the night, the loudest and most frequent calling bouts were recorded just after sunset, with 20.5% of the calls being recorded between 20:00-22:00.
The most commonly recorded vocalization by females was the “whoop” call. In total, we detected whoop calls on 49 of 111 (44.1%) nights. Females at two locations also produced 2-4 note contact hoots or barks after chicks had fledged. We detected female territorial calls at 3 sites on just 8 occasions. Female vocalizations occurred the most frequently in the morning, including all territorial calls, which were recorded between 04:00-06:00.
Male territorial calls were recorded on 25 of 111 (22.5%) nights. Calls were most frequently detected in the early morning, with 41.6 % of the calls recorded between 0200-0600 hours. Calling was usually limited to just one or two calls, with 73.3% (33/45) of the calling events consisting of fewer than three territorial calls. Extended calling activity was detected at only two locations. An increase in calls at one territory seemed to be triggered by a nest failure when the female stopped incubating. This male called for several consecutive nights with bouts starting as early as 18:30 and lasting until 05:00 hours. Another event associated with increased territorial calling was a long-distance movement. In early July a radio-tagged owl had moved approximately eight miles away from its breeding territory for at least two days before returning. The night when it returned calling bouts began around 24:00 and continued until approximately 04:30. Prior to this event, a male territorial call was only detected once at this site, despite the male frequently roosting near the ARU.
Autonomous Recording From 2 March to 15 April 2007
During the early breeding and nesting stage of 2007, we recorded Great Gray Owls at 10/15 territories sampled. In these locations, they were recorded by ARUs during 79 of 198 (39.9%) nights. Female owls were recorded in all active territories, whereas males were recorded in 7/10 active territories. Female owls were also detected on more nights (n = 65) than males (n = 53). Although female owls were detected more frequently, male territorial calls (n = 318) were recorded more often than females (n = 274).
The reliability at which ARUs recorded owls varied greatly based on location. For example, in all of the previously known nesting sites (n = 8), ARUs recorded owls consistently. In meadows where their presence was unknown (n = 7), ARUs recorded Great Gray Owls at only 2 locations. In the 5 meadows where Great Gray Owls were not recorded by ARUs only 1 was known to have them present during our sampling period from additional observations and surveys.
Although recordings of Great Gray Owls were collected at all times of the night, the most frequent time of detection was between 02:00-06:00, which accounted for 48.2% of the nightly vocal activity. Females were especially active during this time period, with over 80% of the territorial calls recorded in the few hours before sunrise. Calling activity of both males and females also showed a small increase during the evening hours from 20:00-24:00, which accounted for 28.7% of the nightly detections.

Caltrans CFS Number 2045DRI, XB05 44 Bird Species Identification and Population Estimation by Computerized Sound Analysis
44
We experienced various battery and recorder malfunctions in 2006 and to a lesser extent in 2007. ARUs sometimes stopped if there was insufficient light to recharge the batteries. At other times the digital recorder simply stopped recording, locked up, or turned off unexpectedly. A black bear (Ursus americanus) or other large animal likely turned over one ARU and broke the microphones. A rodent also chewed through a pair of microphones at another location. Although these problems certainly influenced the success at which ARUs recorded owls, we nevertheless accumulated extensive acoustic data sufficient to adequately survey each territory during both field seasons (Table 1).
Discussion
Our results suggest that ARUs provide a suitable method to detect Great Gray Owls and to monitor vocal behavior and activity. The non-invasive nature of acoustic monitoring could be especially valuable to reduce disturbances to owls. Additionally, ARUs can be particulalry advantageous in situations where access is limited such as steep terrain or remote areas that are difficult to visit regularly. Data collected by ARUs can also help control observer bias. Observations collected by different field technicians can vary based on skill, age, and hearing acuity (Sauer et al. 1994, Hobson et al. 2002). Audio files can be retrieved at any time and examined by trained individuals, ensuring that all data is analyzed consistently and accurately. These data can also be archived, subjected to third party verification, and re-used for future research purposes.
Our results indicated that Great Gray Owl territorial calls were collected more frequently and easily in March and April. This calling behavior is consistent with Great Gray Owls in Oregon where the best response from playback occurred from late February through the end of April (Bryan and Forsman 1987). A disadvantage of placing ARUs this early in the season is that the weather is often very cold and wet. Rain and snow can increase ambient noise, thereby degrading the recording quality and making it more difficult to detect owl vocalizations. An additional problem is that solar panels receive less light, and the colder temperatures can increase the likelihood of battery or hardware failures in ARUs. Due to the battery failures and recorder malfunctions we experienced, we recommend that researchers planning to use ARUs thoroughly test all equipment before deploying units for any long-term recording.
During June to August juvenile owls produce begging calls that are much louder and used more frequently than the adult territorial calls. After fledging, juveniles usually remain close to the nest in dense stands of tress (Bull and Henjum 1990). Placing ARUs at this time period would allow managers to reduce disturbances during the nesting stage and still provide a good indication of Great Gray Owls presence and if they successfully nested during the season. However, placing ARUs only late in the breeding season would underestimate territory occupancy because of nests that failed earlier, and because Great Gray Owls do not breed every season (Duncan 1992).
Although we successfully verified Great Gray Owl presence at 2 locations where their presence was previously unconfirmed, we failed to record a Great Gray Owl at 1 location where visual observations confirmed their presence. While setting up an ARU at this meadow, we observed a Great Gray Owl foraging within 50 m. This meadow is only about 3 km from another meadow

Caltrans CFS Number 2045DRI, XB05 45 Bird Species Identification and Population Estimation by Computerized Sound Analysis
45
that supported a nesting pair of Great Gray Owls. It is possible that the nesting pair from 3 km away foraged in this meadow, and did not defend the area through territorial calling. ARUs at this location regularly recorded Great Horned Owls (Bubo virginianus), which may have inhibited calling activity of Great Gray Owls. Although ARUs can be an effective tool to aid in detection efforts, surveyors should rely on a combination of aural, visual, and other methods to maximize the probability of detection.
Another potential drawback of relying on ARUs is that it is difficult to identify the precise location from where the sound originated. One way to overcome this limitation is through the use of multiple recording stations in the same area (Mennill et al. 2006). This approach could help researchers locate nests and calling roosts of owls via triangulation. Acoustic monitoring would also require an additional expense upfront, and it may take some time to acquire the skills to successfully operate the hardware and analysis software. Despite the limitations and added expenses of ARU equipment, the overall costs could easily be offset from the savings of time and money required by additional field technicians.
Future attempts to monitor Great Gray Owls using ARUs will increase our understanding of this elusive species and potentially reduce the effort and disturbance needed to determine presence - absence status. Additionally, high quality recordings collected by ARUs could be used for other analyses such as vocal individuality (Rognan et al. 2009). A combination of these bioacoustic methods and others could be a cost effective means to highlight behavioral traits, confirm breeding status, and improve the accuracy of Great Gray Owl surveys and census estimates.
Acknowledgements
We thank T.L. George, M.R. Mesler, and B.S. Arbogast for their remarks and contributions to the manuscript. We received assistance in locating owls and collecting recordings from E. Jepson, J. Keane, J. Medely, M. Rognan, T. Stansbery, C. Stermer, and L. Tierney. We also thank E. Berlow, R. Bridgeman, J. Maurer, and S. Thompson for providing access to several sites. The California Department of Transportation contributed funds through Bird Species Identification and Population Estimation by Computerized Sound Analysis, CFS 2045DRI, XB05 (JMS).
Literature cited Beck, T.W., and J. Winter. 2000. Survey protocol for the Great Gray Owl in the Sierra Nevada of California.
Bryan, T., and E.D. Forsman. 1987. Distribution, abundance and habitat of Great Gray Owls in South-central Oregon. The Murrelet 68:45-49.
Bull, E.L., and M.G. Henjum. 1990. Ecology of the Great Gray Owl. General Technical Report, PNW-GTR-265. United States Department of Agriculture Forest Service, Pacific Northwest Research Station, Portland, Oregon, USA.
California Department of Water Resources [CDWR]. 2006 & 2007. Monthly weather at Yosemite Valley, Yosemite, CA. Weather Station YYV. <http://cdec.water.ca.gov/cgi-progs/queryMonthly?s=YYV&d=today> Accessed 25 Jun 2007.
Calupca, T.A., K.M. Fristrup, and C.W. Clark. 2000. A compact digital recording system for autonomous bioacoustic monitoring. The Journal of the Acoustical Society of America 108(5): 2582.

Caltrans CFS Number 2045DRI, XB05 46 Bird Species Identification and Population Estimation by Computerized Sound Analysis
46
Catchpole, C.K., and P.J.B. Slater. 1995. Bird Song: biological themes and variations. Cambridge University Press, Cambridge, United Kingdom.
Clark, C.W., and Fristrup, K.M. 1999. Signal processing techniques for passive acoustic location and tracking of animals. The Journal of the Acoustical Society of America 106(4): 2188.
Duncan, J.R. 1992. Influence of prey abundance and snow cover on Great Gray Owl breeding dispersal. Dissertation. University of Manitoba, Winnipeg, Manitoba, Canada.
Gaunt, S. L. L., and D. A. McCallum. 2004. Birdsong and conservation. Pages 341–362 in P. Marler, H. Slabbekorn, editors. Nature's Music: The Science of Birdsong. Elsevier Academic Press, London, United Kingdom.
Green, C. 1995. Habitat requirements of Great Gray Owls in the central Sierra Nevada. Thesis. University of Michigan, Ann Arbor, USA.
Hobson, K.A., R.S. Rempel, H. Greenwood, B. Turnbull, and S.L.Van Wilgenburg. 2002. Acoustic surveys of birds using electronic recordings: new potential from an omnidirectional microphone system. Wildlife Society Bulletin 30: 709-720.
Johnsgard, P. A. 2002. North American owls: biology and natural history. Second Edition. Smithsonian Institution, Washington D.C., USA.
Mennill, D.J., Burt J.M., Fristrup K.M., Vehrencamp S.L. 2006. Accuracy of an acoustic location system for monitoring the position of duetting tropical songbirds. Journal of the Acoustical Society of America 119:2832-2839.
Rockbox Firmware 2007. Version 5. Rockbox home page. <http://www.rockbox.org/>. Accessed 10 Feb 2007.
Rognan, C.R, Szewczak J.M, Morrison M.L. 2009. Vocal individuality of Great Gray Owls in the Sierra Nevada. Journal of Wildlife Management 73(5): 755-760.
Rohner, C. 1997. Non-territorial floaters in great-horned owls (Bubo virginianus). Pages 347-362 in J.R. Duncan, D.H. Johnson, and T.H. Nicholls editors. Biology and conservation of owls of the northern hemisphere. Second International Symposium, Winnepeg, Manitoba, Canada.
Sauer, J.R., B.G. Peterjohn, and W.A. Link. 1994. Observer differences in the North American breeding bird survey. Auk 111: 50-62.
Winter, J. 1986. Status, distribution and ecology of the Great Gray Owl (Stix nebulosa) in California. Thesis. San Francisco State University. San Francisco, California, USA

Caltrans CFS Number 2045DRI, XB05 47 Bird Species Identification and Population Estimation by Computerized Sound Analysis
47
Vocal individuality of great gray owls in the Sierra Nevada16
Summary
The cryptic plumage and nocturnal nature of the great gray owl (Strix nebulosa) makes it difficult to study in its densely forested habitat. We investigated whether the vocalizations of individual great gray owls could be distinguished and used as a tool for population survey and monitoring. We recorded 312 territorial calls produced by 14 male and 11 female great gray owls between March and July 2006 and 2007 in the Sierra Nevada range of California. We recorded 19 owls on multiple occasions within a season and 8 owls between seasons. We extracted 17 frequency and 15 temporal variables from the sonograms of each call. Discriminant analysis selected 9 variables and classified 92.8% of calls to the correct individual within a season; 71.4% of calls were classified to the correct individual between seasons. Our results indicate that territorial calls could be used to monitor individual great gray owls for both short and long-term studies. Vocal individuality could be useful as a non-invasive method to improve census estimates and yield information on site fidelity, turnover rates, seasonal movements, and behavioral traits of great gray owls.
Introduction
The great gray owl (Strix nebulosa) is an uncommon bird throughout most of its Holarctic range. The occurrence of this species in California is especially unique because it represents their most southern distribution in the world. Resident great gray owls occur in just a few areas of the Sierra Nevada, with the largest population near Yosemite National Park and the Stanislaus and Sierra National Forests (Winter 1986, Green 1995). The entire Sierra Nevada population of great gray owls does not likely exceed 200-300 individuals (California Department of Fish and Game [CDFG] 2006). Due to their limited range and declining population, the CDFG has listed the great gray owl as Endangered (CDFG 1987). In addition to their sparse distribution, efforts to monitor great gray owls in California are further complicated by their secretive nature, cryptic coloration, and nocturnal activity within dense forests (Johnsgard 2002). The current United States Forest Service (USFS) survey protocol for great gray owls in the Sierra Nevada requires surveyors to broadcast great gray owl vocalizations at multiple calling stations within suitable habitat to increase probability of detection (Beck and Winter 2000). Playback is useful for presence - absence surveys (Takats et al. 2001); additionally, territorial calls can also be easily recorded when owls respond to playback. Analysis of this acoustic data could potentially be used to identify individuals within the population and increase our overall understanding of this elusive species.
Computer hardware and software have advanced sufficiently in recent years to enable complex quantitative analyses of bioacoustic signals. Such innovations in technology have also made bioacoustic equipment more affordable and readily accessible by personal computers. A basic and important function of bioacoustic software is to generate visual portrayals of the time,
16 Peer reviewed and accepted for publication as: Rognan, C.B., J.M. Szewczak, and M.L. Morrison (2009) Vocal individuality of great gray owls in the Sierra Nevada. Journal of Wildlife Management. 73(5):755–760.

Caltrans CFS Number 2045DRI, XB05 48 Bird Species Identification and Population Estimation by Computerized Sound Analysis
48
frequency, and amplitude information in sounds. These spectrograms, or sonograms, support species identification and individual call analysis by enabling the user to quantitatively discern nuances in the structure, timing, and frequency of vocalizations that would otherwise be nearly impossible to distinguish with only the human ear (Gaunt and McCallam 2004). In many instances, individuals of the same species can be discriminated from others by unique features in their calls (Eakle et al. 1989, Farquahar 1993, Galeotii et al. 1993, Gilbert et al. 1994, Tripp 2004).
Identifying individuals within a population can be used to improve census estimates and provide important information on demographics, life history, and behavioral traits that frequently influence management decisions (Terry et al. 2005). Traditional marking techniques used to monitor bird populations often include capture and marking individuals with external devices such as colored or numbered leg bands, pit-tags, or radiotransmitters (Bibby et al. 2000, McGregor et al. 2000). Although often successful, techniques that involve the capture and handling of individuals can have detrimental effects such as stress and injury (Leberman and Stern 1977, Sockman and Schwabl 2001). External marking devices can also affect reproductive success of marked individuals, increase predation rates, reduce survivorship, and cause behavioral changes that may produce biased data (Erikstad 1979, Massey et al. 1988, Foster et al. 1992, Alisauskas and Lindberg 2002). Distinguishing individuals by a non-invasive means, such as vocal traits, could be preferable when the species of concern is rare, sensitive to handling, difficult to catch, or when other techniques are too expensive or labor-intensive (Terry et al. 2005). Great gray owls fit many of these criteria, making them ideal candidates to potentially monitor through vocal individuality.
Vocal individuality has been confirmed and used as a management tool for several genera of owls, including the tawny owl (Strix aluco; Appleby and Redpath 1997), Scops owl (Otus scops; Galeotti and Sacchi 2001), pygmy owl (Glaucidium passerinum; Galeotti et al. 1993), Christmas Island hawk owl (Ninox natalis; Hill and Lill 1998), eagle owl (Bubo bubo; Lengagne 2001), northern saw-whet owl (Aegolius acadicus; Otter 1996), and western screech owl (Megascops kennicottii; Tripp 2004). Calls of the tawny owl and African wood owl (Strix woodfordii) were stable over successive years, making their vocal identities useful for re-identification in long-term studies (Appleby and Redpath 1997, Delport et al. 2002). Additionally, gender could be determined from individual African wood owl vocalizations (Delport et al. 2002). In our study we investigated whether the vocalizations of individual great gray owls could be distinguished and used for population monitoring.
Study area
We collected owl recordings on the western slopes of the Sierra Nevada in Yosemite National Park, Stanislaus, and Sierra National Forests in Madera, Mariposa, and Tuolumne counties. All recording sites were located at or adjacent to montane meadows ranging in elevation from 830 m to 2,400 m above sea level. The dominant vegetation was mixed evergreen forests consisting mostly of sugar pine (Pinus lambertiana), ponderosa pine (P. ponderosa), lodgepole pine (P. contorta), Jeffrey pine (P. jeffreyi), incense cedar (Calocedrus decurrens), white fir (Abies concolor), and red fir (A. magnifica). At lower elevations, oak (Quercus spp.) and manzanita (Arctostaphylos spp.) were also common components of habitats.

Caltrans CFS Number 2045DRI, XB05 49 Bird Species Identification and Population Estimation by Computerized Sound Analysis
49
The weather for this area varied considerably over the range of elevations, but summers were generally warm and dry, whereas winters were wet and cold. During our study from January to May 2006, precipitation was 89% above average with daily high temperatures 19% cooler than average (California Department of Water Resources [CDWR] 2006). From January to May 2007, precipitation was 28% below average with daily high temperatures 4% warmer than average (CDWR 2007). Biologists from CDFG and USFS found several nests in both seasons of our study, indicating that breeding occurred regularly despite these differences in weather conditions.
Methods
Locating and Recording Owls. We located great gray owls in cooperation with CDFG and USFS biologists. We visited several locations with previous observations or historic nesting records (Winter 1986, Green 1995, Riper and Wagtendonk 2006). To maximize chances of finding owls, we followed guidelines outlined by Beck and Winter (2000), which consisted of several visits to each site during which surveyors broadcast great gray owl vocalizations and performed meadow searches. We collected recordings of great gray owls both with and without use of playback to ensure that vocalizations of owls that were prompted to call did not differ from vocalizations not initiated by playback.
Active recording methods consisted of recording territorial calls from individuals that responded to broadcast surveys conducted by USFS personnel. We recorded these owls with an iRiver H120 digital recorder (ReignCom, Seoul, South Korea) and a Sennheiser ME66 shotgun microphone with a K6 power module (Sennheiser, Wennebostel, Germany) at a sampling frequency of 44.1 kHz and stored as 16-bit wave files. We made all recordings within approximately 50 m of the owl during calm nights (Beaufort scale 0 - 1) with no precipitation. We also recorded 4 radiotagged owls that were being monitored in a separate study conducted by CDFG.
We used 2 passive techniques to record great gray owls. Our first technique was to place a microphone and recorder near a nest or roost site set to record overnight. The second technique used autonomous recording units (ARUs) within known great gray owl territories. In 2006 we placed ARUs within 100 m of 6 occupied or recently abandoned great gray owl nests. Each ARU contained a DMC Xclef digital recorder (Digital Mind Corporation, Carlsbad, CA) with a 100-gigabyte (GB) hard drive. We collected acoustic data at 320 kbps with a sampling frequency of 44.1 kHz. We made recordings in stereo using 2 PA3 omni mini-microphones with built in preamps (Supercircuits, Austin, TX). Digital recorders and microphones received power from 2 12-volt, 12 amp-hour batteries, and we recharged batteries with a 20-watt solar panel connected via a charge controller. We attached microphones to tree limbs with all remaining equipment housed in a weatherproof enclosure covered with leaves and bark for camouflage. We recorded data for 111 nights, with a mean of 18.5 nights per territory. The ARUs collected data at each site from 1–4 weeks between 5 June and 14 July 2006.
In 2007 we improved the hardware used in ARUs by replacing the DMC Xclef digital recorders with iRiver H320 units (ReignCom, Seoul, South Korea). We installed Rockbox firmware (Rockbox Version 5, 2007) on each H320 to enhance recording functions. These recorders had

Caltrans CFS Number 2045DRI, XB05 50 Bird Species Identification and Population Estimation by Computerized Sound Analysis
50
internal 20-GB hard drives and we programmed them to save recordings as lossless 16-bit WavPack files at a sampling frequency of 44.1 kHz. Each recorder had an integral real time clock that labeled the recordings with a date and time stamp. Using a countdown timer function, we set each unit to record 12 hours every night from 1800 hours to 0600 hours. In total, we installed ARUs in 15 potential owl territories between 2 March and 15 April 2007. We set up 6 of these ARUs in the same locations as 2006 where we found nests. We collected acoustic data for 274 nights with a mean of 18.3 nights per territory.
We recorded 25 individual owls, 19 of which we recorded on separate occasions within a season to determine within-season variation of territorial calls. Additionally, to determine between-season variation of calls, we revisited in 2007 all territories visited in 2006. We used radiotelemetry data from the CDFG study to verify the correct identity of 4 owls (2 M and 2 F) recorded within a season and 2 owls between seasons (1 M and 1 F). We also used leg-bands to confirm identity of 2 owls (1 M and 1 F) between seasons. We assumed that owls without distinctive radiotags or leg-bands for identification were distinct individuals if we collected recordings at a different nest or territory. Average home range size of great gray owls in the Sierra Nevada is <20 ha during the breeding season for males and approximately 60 ha for females (Riper and Wagtendonk 2006). We collected most of our recordings in isolated areas where the nearest neighboring great gray owl territory was >3 km away. Although it is possible a non-breeding floater could have entered our study population, great gray owls normally only perform territorial calling near their immediate nest site (Bull and Henjum 1990). We feel confident that the 25 owls we recorded were different individuals.
Sonogram Analysis. We generated sonograms of 312 territorial calls from 25 individual owls and analyzed them on a Macintosh OS X computer (Apple Inc., Cupertino, CA) using acoustic analysis software SonoBird beta Version 2.5.8 (DNDesign 2007). We plotted each sonogram with an upper frequency scale of 1 kHz and selected 5–12 second segments depending on duration of the call. Quality of sonograms was influenced by several factors such as ambient noise levels, distance to the owl, and overall intensity of owl calling. To minimize measurement errors, we only analyzed high quality sonograms that were free from substantial distortions. As an additional precaution, we did not analyze the introductory note of the calls because it was often of lower amplitude than subsequent notes and thus difficult to obtain accurate measurements.
We extracted 12 frequency and 10 temporal variables from each territorial call (Fig. 1). The first temporal variables that we measured were the total number of notes and total call duration. We then took measurements from the second, third, and fourth notes of each call. We did not include territorial calls consisting of <4 notes in the analysis. We extracted the note duration for notes 2–4 and the internote duration between notes 2–3 and 3–4. We also measured time from the beginning of each note to the amplitude of the respective note. Lastly, we collected 4 frequency variables for notes 2–4. For each of these notes we measured the frequency at the start and end of the note and then measured the dominant frequency and the highest frequency.

Caltrans CFS Number 2045DRI, XB05 51 Bird Species Identification and Population Estimation by Computerized Sound Analysis
51
From the extracted variables we calculated an additional 5 temporal and 5 frequency variables. First, we calculated calling rate in notes per second by dividing total number of notes by total call duration. Second, we calculated tail duration of each note or time from maximum amplitude to end of the note; we repeated this step for notes 2–4 and then averaged the result to produce mean tail duration. We also averaged note duration, time to amplitude, internote duration, and frequency measurements taken from notes 2–4, to produce mean temporal and frequency values for a typical note in the territorial call. The averaged variables were more robust, reducing the influence of potential errors caused by variability in sonogram measurements. Nonetheless we included both the averaged and original variables in the analysis to ensure that no individual variation was lost. Lastly, we calculated the mean frequency range for each call by subtracting the lowest mean frequency of the call from the highest.
Discriminant Analysis. We performed discriminant analysis (DA) with forward stepwise inclusion of variables to investigate vocal individuality of the territorial call using Statistical Package for the Social Sciences (SPSS Version 15.0, 2006). We entered the most significant call variables into the model (P < 0.05) sequentially or until extra variables no longer improved discrimination.
We analyzed 277 calls from 14 male and 11 female great gray owls for within-season vocal individuality. Depending on quality and quantity of recordings, we analyzed 6 to 12 calls for each individual ( x = 11.1; SD = 1.85). We cross-validated within-season classifications with the leave-one-out method, which randomly removed each observation and re-classified it using the remaining observations.
We also used DA to determine between-season vocal individuality using the same variables selected for the within-season analysis. We analyzed 127 calls from 4 male and 4 female owls, of which 35 of the calls were collected in 2006 and 92 were collected in 2007. We analyzed 13 to 24 calls for each individual ( x = 15.9; SD = 3.39). We treated the 35 calls collected in 2006 as unknowns and cross-validated them against the 92 calls produced by presumably the same owls in 2007. We pooled these calls with the remaining data set, which consisted of 185 calls representing 17 individual owls.
Figure 1. Sonogram of male great gray owl territorial call collected in June 2006, Tuolumne County, California. Temporal variables measured and analyzed from the entire call included total number of notes (TN) and total call duration (TCD). From notes 2-4, frequency and temporal variables analyzed included start frequency (SF), dominant frequency (DF), high frequency (HF), end frequency (EF), note duration (ND), time to amplitude (TA), tail duration (TD), and internote duration (INT).

Caltrans CFS Number 2045DRI, XB05 52 Bird Species Identification and Population Estimation by Computerized Sound Analysis
52
Results
Discriminant analysis classified 92.8% of calls within a season to the correct individual. Among males, 92.3% of calls were correctly classified, whereas among females 93.6% of calls were correctly classified. Successful classifications ranged from 83.3–100% among males and 62.5–100% among females. Misclassified calls were distributed among 11 individuals with ≤2 per individual. Misclassified calls were also evenly distributed among owls that we prompted to call versus those that we recorded passively and among individuals that we recorded on different nights within a season.
Stepwise discrimination selected just 9 of the original 32 variables for the analysis. Variables that contributed the most to the discrimination (F value) were selected in this order: mean note duration (F = 407.18), mean internote duration (F = 380.51), mean end frequency (F = 232.52), mean dominant frequency (F = 143.25), mean tail duration (F = 103.66), calling rate (F = 80.02), mean start frequency (F = 64.64), total call notes (F = 54.21), and total call duration (F = 45.93).
Discriminant analysis for data collected between-seasons classified 71.4% of calls from 2006 to its respective territory in 2007. Among males 90.9% of calls were correctly classified, whereas 38.5% of female calls were correctly classified. With the exception of one female, ≥1 call for each owl was classified to the correct individual.
The same variables used in the within-season analysis were also selected by stepwise discrimination for the between-seasons analysis. These variables were selected as follows: mean note duration (F = 403.28), mean internote duration (F = 383.76), mean end frequency (F = 232.73), mean dominant frequency (F = 142.82), mean tail duration (F = 101.98), calling rate (F = 78.22), mean start frequency (F = 63.41), total call notes (F = 53.20), and total call duration (F = 44.96).
Discussion
Our results indicate that territorial calls of great gray owls can be used to distinguish individuals within a season, and to a lesser extent, between seasons. Analysis of unique vocal traits could be used as an alternative or supplemental technique to monitor individual owls or for scientific study. Male owls in particular could be reliably identified by this method considering their low within-individual variation and high between-individual variation. Additionally, male great gray owls produce the territorial call much more frequently than females (Johnsgard 2002), facilitating potential monitoring efforts.
Female great gray owls also demonstrated high between-individual variation; however, individuals were more difficult to consistently distinguish because some demonstrated high within-individual variation, especially between seasons. Our results, however, may have been slightly skewed by the small sample size and an unusual circumstance. In one location, a female great gray owl’s vocalizations changed dramatically between seasons. Although leg bands confirmed it was the same owl between seasons, sonograms from 2007 were markedly dissimilar to those from 2006. We acquired recordings of this owl by ARUs just 3 weeks after her mate died. All calls sounded noticeably atypical, and temporal observations from the ARU

Caltrans CFS Number 2045DRI, XB05 53 Bird Species Identification and Population Estimation by Computerized Sound Analysis
53
data indicated that she called extremely frequently. Stress and sickness may have contributed to irregular calling behaviors, as she died a few weeks later.
The lower classification rates for females in our study may have also been influenced by the seasonality of when we recorded calls. In 2006 we collected recordings later in the breeding season when owls were incubating or feeding chicks. In 2007 we recorded owls during prenesting and early nesting stages. Great gray owls, especially females, reduce their calling activity when nesting begins (Johnsgard 2002) and experience weight declines during the breeding season (J.R. Duncan, Manitoba Conservation, personal communication). Additionally, we only analyzed 57 calls from 4 female owls between seasons, increasing the influence of any unusual calls or behaviors related to seasonality. For vocal individuality to be useful as a monitoring tool for female owls, emphasis should be placed on consistently recording early in the season and in collecting a larger sample of calls for each individual.
Classification rates for individual great gray owls in our study are comparable to what has been found in other species of owls using similar techniques and analysis methods. Within the genus Strix, calls of individuals were correctly classified 84.5% in barred owls (Strix varia; Freeman 2000) and 98.6% in tawny owls (Appleby and Redpath 1997) using DAs. During a l2-year study on African wood owls (Delport et al. 2002), 80.9% of male and 96.3% of female individuals were correctly identified using a combination of principal components analysis, multiple analysis of variance, and discriminant function analysis. Delport et al. (2002) also determined residency and turnover rates through analysis of unique vocal signatures. Other studies on owls have demonstrated additional benefits of vocal individuality to monitor habitat quality, site fidelity, and population demographics (Holschuh 2004, Tripp 2004).
Our original design for testing vocal individuality included a larger sample of radiotagged birds. We recorded just 4 radiotelemetered owls, and unfortunately 2 of these birds died between seasons. As a precaution, CDFG temporarily ceased trapping and tagging activity until the cause of death could be determined. Future investigators of vocal individuality may want to ensure that a larger portion of their sample can be reliably identified by other means such as radiotelemetry, pit tags, or colored leg bands.
One of the limitations of vocal individuality is that identification of individual birds cannot be readily determined in the field, as it requires statistical analysis of sonograms to achieve accurate identifications. Moreover, vocal data cannot provide age and condition of individuals. Despite these limitations, monitoring individuals through unique vocal signatures is growing as a supplemental, non-invasive research tool in conservation biology, and our results demonstrate that it can be used for studies on great gray owls.
Because great gray owls in montane habitats frequently occupy the same territory and often use the same nests each year (Bull and Henjum 1990), long-term demographic data such as reproductive success, site fidelity, turnover, and mortality rates could be estimated using vocal individuality. Monitoring individual great gray owls using this method and other bioacoustic techniques such as ARUs could be advantageous for their non-invasive nature compared to conventional techniques requiring capture and handling. These approaches may be especially advantageous in California considering that human activity and disturbances have been

Caltrans CFS Number 2045DRI, XB05 54 Bird Species Identification and Population Estimation by Computerized Sound Analysis
54
attributed to declines in great gray owls at several historic breeding sites (Wildman 1992, Maurer 1999). Furthermore, recent deaths of radiotagged great gray owls in the Sierra Nevada have initiated investigations to determine if poor-fitting radiotransmitters or other factors contributed to the birds’ deaths (Woods 2008). As a supplemental monitoring technique, vocal data can be acquired automatically and over much longer sampling periods than conventional survey protocols. This provides a much greater opportunity to detect and study these rare and secretive birds.
Acknowledgements
We thank T.L. George, M.R. Mesler, and B.S. Arbogast for their remarks and contributions to the manuscript. We received assistance in locating owls and collecting recordings from E. Jepson, J. Keane, J. Medely, M. Rognan, T. Stansbery, C. Stermer, and L. Tierney. We also thank E. Berlow, R. Bridgeman, J. Maurer, and S. Thompson for providing access to several sites. The California Department of Transportation contributed funds through Bird Species Identification and Population Estimation by Computerized Sound Analysis, CFS 2045DRI, XB05 (JMS).
Literature cited Alisauskas, R.T., and M.S. Lindberg. 2002. Effects of neckbands on survival and fidelity of white-fronted and Canada geese captured as non-breeding adults. Journal of Applied Statistics 29:521-537.
Appleby, B.M., and S.M. Redpath. 1997. Variation in the male territorial hoot of the tawny owl (Strix aluco) in three English populations. Ibis 139:152-158.
Beck, T.W., and J. Winter. 2000. Survey protocol for the great gray owl in the Sierra Nevada of California. United States Department of Agriculture Forest Service, Pacific Southwest Region, Vallejo, California, USA.
Bibby, C.J., N.D. Burgess, and D.A. Hill. 2000. Bird census techniques. Second edition. Academic Press, London, United Kingdom.
Bull, E.L., and M.G. Henjum. 1990. Ecology of the great gray owl. General Technical Report, PNW-GTR-265. United States Department of Agriculture Forest Service, Pacific Northwest Research Station, Portland, Oregon, USA.
California Department of Fish and Game [CDFG]. 1987. Five year status report of the great gray owl (Strix nebulosa). Nongame bird and mammal section, Wildlife Management Division, Sacramento, California, USA.
California Department of Fish and Game [CDFG]. 2006. Pre-harvest Inspection Report for Timber Harvesting Plan 4-06-09/FRE-4, Old Pine Ridge, San Joaquin Valley and Southern Sierra Region, Fresno, California, USA.
California Department of Water Resources [CDWR]. 2006 & 2007. Monthly weather at Yosemite Valley, Yosemite, CA. Weather Station YYV. <http://cdec.water.ca.gov/cgi-progs/queryMonthly?s=YYV&d=today> Accessed 25 Jun 2007.
Delport, W., A.C. Kemp, and J.W.H. Ferguson. 2002. Vocal identification of individual African wood owl (Strix woodfordii): a technique to monitor long-term adult turnover and residency. Ibis 144:30-39.
Eakle, W.L., R.W. Mannan, and T.G. Grubb. 1989. Identification of individual breeding bald eagles (Haliaeetus leucocephalus) by voice analysis. Journal of Wildlife Management 53:450-455.

Caltrans CFS Number 2045DRI, XB05 55 Bird Species Identification and Population Estimation by Computerized Sound Analysis
55
Erikstad, K. E. 1979. Effects of radio packages on reproductive success of willow grouse. Journal of Wildlife Management 43:170-175.
Farquahar, C. 1993. Individual and intersexual variation in alarm calls of the white-tailed hawk. The Condor 95:234-239.
Foster, C. D., E. D. Forsman, E. C. Meslow, G. S. Miller, J. A. Reid, F. F. Wagner, A. B. Carey, and J. B. Lint. 1992. Survival and reproduction of radio-marked adult spotted owls. Journal of Wildlife Management 56:91-95.
Freeman, P.L. 2000. Identification of individual barred owls using spectrogram analysis and auditory cues. Journal of Raptor Research 34:85-92.
Galeotti, P., M. Paliadin, and G. Pavan. 1993. Individually distinct hooting in male pymgy owls (Glaucidium passerinum): a multivariate approach. Ornis Scandinavica 24:15-20.
Galeotti, P., and R. Sacchi. 2001. Turnover of territorial scops owls (Otus scops) as estimated by spectrographic analyses of male hoots. Journal of Avian Biology 32:256-262.
Gaunt, S. L. L., and D. A. McCallum. 2004. Birdsong and conservation. Pages 341–362 in P. Marler, H. Slabbekorn, editors. Nature's Music: The Science of Birdsong. Elsevier Academic Press, London, United Kingdom.
Gilbert, G., P.K. McGregor, and G. Tyler. 1994. Vocal individuality as a census tool: practical considerations illustrated by a study of two rare species. Journal of Field Ornithology 65:335-348.
Green, C. 1995. Habitat requirements of great gray owls in the central Sierra Nevada. Thesis. University of Michigan, Ann Arbor, USA.
Hill, R. F.A., and A. Lill. 1998. Vocalisations of the Christmas island hawk-owl (Ninox natalis): individual variation in advertisement calls. Emu 98:221-226.
Holschuh, C.I. 2004. Monitoring habitat quality and condition of Queen Charlotte saw-whet owls (Aegolius acadicus brooksi) using vocal individuality. Thesis. University of Northern British Columbia, Prince George, Canada.
Johnsgard, P. A. 2002. North American owls: biology and natural history. Second Edition. Smithsonian Institution, Washington D.C., USA.
Leberman, R. C., and M. A. Stern. 1977. Handling induced shock in migrant songbirds. North American Bird Bander 2:50-54.
Lengagne, T. 2001. Temporal stability in the individual features in the calls of eagle owls (Bubo bubo). Behavior 138:1407-1419.
Massey, B. W., K. Keane, and C. Bordman. 1988. Adverse effects of radio-transmitters on the behavior of nesting least terns. Condor 90:945-947.
Maurer, J. 1999. Great gray owl impact assessment for the Tuolumne Grove parking lot development proposal. Report to the National Park Service, Yosemite National Park, El Portal, California, USA.
McGregor, P. K., T. M. Peake, and G. Gilbert. 2000. Communication behaviour and conservation. Pages 261-280 in M. Gosling, and W.J. Sutherland, editors. Behaviour and conservation. Cambridge University Press, Cambridge, United Kingdom.
Otter, K. 1996. Individual variation in the advertising call of male northern saw-whet owls. Journal of Field Ornithology 67:398-405.
Riper, C.V, and J.V Wagtendonk. 2006. Home range characteristics of great gray owls in Yosemite National Park, California. Journal of Raptor Research 40:130-141.
Rockbox Firmware 2007. Version 5. Rockbox home page. <http://www.rockbox.org/>. Accessed 10 Feb 2007.

Caltrans CFS Number 2045DRI, XB05 56 Bird Species Identification and Population Estimation by Computerized Sound Analysis
56
Sockman, K.W., and H. Schwabl. 2001. Plasma corticosterone in nestling American kestrels: Effects of age, handling stress, yolk androgens, and body condition. General and Comparative Endocrinology 122:205-212.
Takats, L.D., C.M. Francis, G.L. Holroyd, J.R. Duncan, K.M. Mazur, R.J. Cannings, W. Harris, and D. Holt. 2001. Guidelines for nocturnal owl monitoring in North America. Beaverhill Bird Observatory and Bird Studies Canada, Edmonton Alberta, Canada.
Tripp, T.M. 2004. Use of bioacoustics for population monitoring in the western screech owl (Megascops kennicottii). Thesis. University of Northern British Colombia, Prince George, British Columbia. Canada.
Terry, A.M.R., T.M. Peak, and P.K. McGregor. 2005. The role of vocal individuality in conservation. Frontiers in Zoology 2:10.
Wildman, A.M. 1992. The effect of human activity on great gray owl hunting behavior in Yosemite National Park, California. National Park Service, Western Region, Technical Report NPS/WRUC/NRTR-92/49. University of California, Davis, USA.
Winter, J. 1986. Status, distribution and ecology of the great gray owl (Stix nebulosa) in California. Thesis. San Francisco State University. San Francisco, California, USA.
Woods, L. 2008. Summary and interpretation of recent great gray owl pathology reports from the Sierra Nevada. Proceedings of Great Gray Owl Management Workshop, February 27-28 2008, Yosemite National Park, California, USA.

Caltrans CFS Number 2045DRI, XB05 A-1 Bird Species Identification and Population Estimation by Computerized Sound Analysis
A-1
Appendix A California append reference collection for use with SonoBird List of species’ song types, parts, and calls included as project deliverables.To facilitate comparison, SonoBird enables appending reference files to a displayed sonogram and adjusts the display to have the identical time and frequency scale to facilitate comparison (see Appendix B, Basic operations with SonoBird). This reference collection also serves as a convenient starting point for selecting target species search terms (see Appendix C, Using SonoBird to search for target signals).
ABVI_secondary_endnotes ABVI_song2 ABVI_trimmed_song ACWO_call_"Karrit-cut" ACWO_call_"Urrk" ACWO_call_"Waka" ALHU_buzz ALHU_series ALHU_series2 ALHU_short AMAV_call AMAV_series AMAV_twonote AMCO_ascending_call AMCO_call-3 AMCO_lower_series AMCO_onenote AMCR_double AMCR_fournote AMCR_longnotes AMCR_series AMGO_ascend-descend_short AMGO_ascending_series AMGO_call-1 AMGO_call-2 AMGO_call-4 AMGO_call-5 AMGO_call-6 AMGO_call-7 AMGO_call-8 AMGO_call-9 AMGO_call-10 AMGO_call-11 AMGO_call-12 AMGO_flight_call AMKE_kek_call AMKE_kek_call2 AMKE_trill AMKE_trill2
AMRO_alarm AMRO_alarm2 AMRO_buzz_note AMRO_chirp_serries AMRO_desending_chirp AMRO_fournote AMRO_song AMRO_song2 AMRO_song3 AMRO_threenote AMRO_threenote2 AMRO_trill ANHU_alarm ANHU_buzz ANHU_song ANHU_song2 ANHU_song3 ANHU_song4 ATFL_"do-hick"_ascend ATFL_"do-hick"_trill ATFL_"do-hick" ATFL_4notes ATFL_song ATFL_trill ATFL_two_note BANS_"chi-chi"_two_note BANS_"chi-chi"_two_note2 BANS_chorus_song_"chi-chi-chi" BANS_contact BANS_descending_3notes BANS_descending BARS_"chirp-chirp"_call2 BARS_"chirp-chirp" BARS_chorus BARS_threenote_"chip" BARS_twitter-warble BARS_warble_call BAWW_song_"weesee" BBMA_beg
BBMA_begging BBMA_mouse_"squeaks" BBMA_mouse2_"squeaks" BBMA_staccato_chatter BBMA_staccato_double BCCH_"cheeseburger "_variation BCCH_"chick-ka-dedede"_descending BCCH_"chick-ka-dedede"_variation BCCH_"chick-ka-dedede" BCCH_"scolding" BCCH_"teet-teet"_descending BCCH_"teet-teet" BCCH_song_"ch_dl_i-ch_dl_u" BCCH_song2_"ch_dl_i-ch_dl_u" BCCH_song3_"ch'dl'dee-ch'dl'dee" BCTI_"peew-peew-peew-peew" BCTI_"peew-peew-peew" BEKI_rattle BEKI_rattle2 BEWR_buzz-uz-uz-uz BEWR_chips BEWR_scold BEWR_song_"buzz-kutkutkut" BEWR_song_"swee" BEWR_song_"sweet-sweet" BEWR_song_"swit-swit" BEWR_song_"tee-ee-ee-ee" BEWR_song_"terrrr" BEWR_song_"tewtewtew" BEWR_song_"twetwetwe" BEWR_song BEWR_song2_"terrr" BEWR_song3_"terrrr" BEWR_song4_"terrr" BEWR_song5_"terrrr" BEWR_song6_"terrrr" BGGN_"mew-mew" BGGN_"mew"_variation

Caltrans CFS Number 2045DRI, XB05 A-2 Bird Species Identification and Population Estimation by Computerized Sound Analysis
A-2
BGGN_"mew"_variation2 BGGN_scold_variation BGGN_scold BGGN_song1 BGGN_song2 BGGN_song3 BGGN_song4 BGGN_song5 BHCO_call_"ch_ch_ch_ch_ch" BHCO_call_"rattle" BHCO_flight_whistles BHCO_song_"bublowcomseeee "_variation_2 BHCO_song_"bublowcomseeee "_variation_3 BHCO_song_"bublowcomseeee "_variation BHCO_song_"bublowcomseeee " BHCO_song_"glug glug glee" BHCO_whistle-call BHGR_"tweedle-de"_variation BHGR_"tweedle-de"_variation2 BHGR_"tweedle-de" BHGR_"tweet-bubble-tweet" BHGR_long_serries BLGR_full_song BLGR_song_"buzzy-ending" BLGR_song_"buzzy" BLGR_song BLPH_song_"Tee-hee Tee-hoo" BLPH_song_"Tsipz" BLPH_song2_"Tee-hee Tee-hoo" BLPH_song2_"Tsip" BNST_"pleek-pleek" BRBL_call_"Tchup" BRBL_song_"Dzzzzzzz " BRBL_song_"Tsee-eur"_2 BRBL_song_"Tsee-eur" BRCR_call__zi-i-i-it __variation BRCR_call__zi-i-i-it _ BRCR_call_"tseet-tseet" BRCR_song__ tsee-tuti-sedu-wee _ BRCR_song_"trees-trees-pretty-little-trees"_2 BRCR_song_"trees-trees-pretty-little-trees" BRSP_long_song BSSP_song BSSP_trimmedsong BTGW_"zeea-zeea-zeea"_variation BTGW_"zeea-zeea-zeea" BTGW_"zidza-zidza-zidza" BTGW_chipnote BTSP_"budie-swik-swik-ererer" BTSP_"swik-swik sweee-te-
errrrr"_variation BTSP_"swik-swik sweee-te-errrrr"_variation2 BTSP_"swik-swik sweee-te-errrrr"_variation3 BTSP_"swik-swik sweee-te-errrrr"_variation4 BTSP_"swik-swik sweee-te-errrrr"_variation5 BTSP_"swik-swik sweee-te-errrrr" BTSP_"teeee-errrrr"_variation BTSP_"teeee-errrrr"_variation2 BTSP_"teeee-errrrr" BUOR_cal_"cha-cha-cha-cha" BUOR_call_"cha-cha-cha-cha"_variation BUOR_call_"kleek" BUOR_song_"cut-cut-cudut-whee-up-chooup"_variation
BUOR_song_"cut-cut-cudut-whee-up-chooup" BUOR_song_"kip-hoy-hoy-ty-kip" BUOR_song_"kip-kit-tick-kit-tick-whew-wheet" BUOR_song_"kip-y-ty-hoy-hoy" BUSH_contact_call_"long-distance" BUSH_contact_call_"tsit" BUSH_contact_call BUSH_twittering_calls CAFI_song_variation_2 CAFI_song_variation_3 CAFI_song_variation_4 CAFI_song_variation CAFI_song CAGN_"mew"_female CAGN_"mew"_male CAGN_call_"mew"_variation CAGN_call_"mew" CAGN_call_single_"mew" CAGN_scold CAGN_single_"mew"_male CAGO_"honk" CAGO_call_"honk-snore" CAGO_call_cackle CAGU_call_"kyow" CAGU_call_"waaaaaaah" CAHU_call_"teet" CAHU_mating_beats CAQU_call_"pit-pit"_variation CAQU_call_"pit-pit" CAQU_call_double_"pit-pit" CAQU_song_"cu-CA-cow" CAQU_song_"cu-CA" CAQU_song_single_"cu-CA-cow" CATE_call_"rrau"
CATH_call_"churrip, churreep, hreek"_variation CATH_call_"churrip, churreep, hreek" CATH_song_"_ kick_-it-now, kick_-it-now, shut_-up, shut_-up, dor_-o-thy, dor_-othy, whoa_-now __variation_2 CATH_song_"_ kick_-it-now, kick_-it-now, shut_-up, shut_-up, dor_-o-thy, dor_-othy, whoa_-now __variation
CATH_song_"_ kick_-it-now, kick_-it-now, shut_-up, shut_-up, dor_-o-thy, dor_-othy, whoa_-now _ CATO_alarm_call CATO_call_"chip" CATO_call_accelerating_"chip" CATO_call_descending_"chip" CATO_call_double_"chip" CAVI_song_"ch_ree ch-ri_chi-roo"_variation CAVI_song_"ch_ree ch-ri_chi-roo" CAVI_song_"ch-ree ree-e-eu ree-u-yuh" CAVI_song_"chreu ch_ree choo_reet" CAWR_call_"tsee-tsee" CAWR_call_threenote_variation CAWR_call_threenote CAWR_song_descending_"tsee-i-tsee-i" CBCH_call_"chicka-dee"_variation_2 CBCH_call_"chicka-dee"_variation_3 CBCH_call_"chicka-dee"_variation CBCH_call_"chicka-dee" CBCH_call_"gargle-seet" CBCH_call_"tsee-dee" CEWA_call_"bzeee" CEWA_call_"trill" CHSP_call_"see-see-see-see" CHSP_call_"zeeeee" CLNU_call_"kraaks" CLNU_call_contact? CLNU_call_descending_"kraaks" CLSW_call_"chur"_variation CLSW_call_"chur" COHA_call_"kek-kek"_variation COHA_call_"kek-kek" CONI_call_"peent" CONI_call_4notes_"peent" CORA_call_"Cr-r-ruck"_variation CORA_call_"Cr-r-ruck" CORA_call_series_"Cr-r-ruck" COYE_scold

Caltrans CFS Number 2045DRI, XB05 A-3 Bird Species Identification and Population Estimation by Computerized Sound Analysis
A-3
COYE_song_"wich-i-ty, wich-i-ty, wich-i-ty"_variation_2
COYE_song_"wich-i-ty, wich-i-ty, wich-i-ty"_variation_3
COYE_song_"wich-i-ty, wich-i-ty, wich-i-ty"_variation_4
COYE_song_"wich-i-ty, wich-i-ty, wich-i-ty"_variation_5
COYE_song_"wich-i-ty, wich-i-ty, wich-i-ty"_variation
COYE_song_"wich-i-ty, wich-i-ty, wich-i-ty" DEJU_long_range_song_"teet"_variation DEJU_long_range_song_descending_variation DEJU_long_range_song_descending DEJU_long_range_song_variation_2 DEJU_long_range_song_variation_3 DEJU_long_range_song_variation DEJU_long_range_song DEJU_note_"chip" DEJU_twittering_call DOWO_call_"pik" DOWO_call_"whinny" DOWO_call_descending_"whinny" DUFL_note_"du-hick" DUFL_note_"hick" DUFL_song_"prll-it-prrdrrt" DUFL_song_"prll-it"_variation DUFL_song_"prll-it" EATO_song_"drink-your-tea" ELOW_call_alarm ELOW_call_series_variation ELOW_series_variation_2 ELOW_series_variation_3 ELOW_series EUST_call_"buzzy" EUST_song_"warbled" EUST_song_"whistled"_variation EUST_song_"whistled" EVGR_call_"feer" EVGR_soft_call FISP_song FLOW_series FOSP_song_"twit-twit" FOSP_song_2 FOSP_song_3 FOSP_song_alfa-ending FOSP_song_alpha-middle FOSP_song_consistent-frequency-ending_variation
FOSP_song_consistent-frequency-ending
FOSP_song_double-alpha-middle FOSP_song_fast-middle-notes FOSP_song_high-ending FOSP_song_slight-descending-end_variation FOSP_song_slight-descending-end FOSP_song_slower-middle FOSP_song GAQU_call_"errr"_note GAQU_call_agitated GAQU_song_"ka-KAA-ka-ka" GBHE_call_"squawk" GBHE_four_note_"squawk" GCKI_contact_call_"tsee" GCKI_song_2 GCKI_song GCSP_song__Oh, dear me_ GGOW_female_"whoop" GGOW_series_female GGOW_series_male GHOW_female_series GHOW_juvi_begging GHOW_male_series GHOW_series_2 GHOW_series GHOW_singing_pair GIWO_call_"pip"_notes GIWO_call_"sociable" GRYE_call_"dew-dew-dew"_alarm GRYE_call_"dew-dew-dew"_variation GRYE_call_"dew-dew-dew" GTGR_"squeaky"_chatter GTGR_"whistle" GTGR_chatter_call GTGR_high_"whistle" GTTO_call_"Mew"_plus_"tseee" GTTO_call_"mew" GTTO_song_"tseee"_variation GTTO_song_"Tseeeeee"_ending GTTO_song_1_variation GTTO_song_1 GTTO_song_2_variation GTTO_song_2 GTTO_song_3_variation GTTO_song_3 GTTO_song_double_buzz HAWO_"drumming" HAWO_call_"peek" HAWO_call_"Queek" HAWO_call_"rattle" HETH_song_4_notes HETH_song HEWA_call_"zee-o-seet"
HEWA_song_"che-zeegle"_ending HEWA_song_"zeegle zeegle zeegle"_variation HEWA_song_"zeegle zeegle zeegle" HOFI_call_social HOFI_song_"full-song" HOFI_song_"variable-notes"_variation HOFI_song_"variable-notes" HOFI_song_descending_ending HOFI_song_long_"buzy-ending"_variation HOFI_song_long_"buzy-ending" HOFI_song HOLA_song_clear HOLA_song HOSP_song__cheep__variation HOSP_song__cheep_ HOSP_song_"cheerup, chee-up, chillip" HOWR_call_"chitter" HOWR_song_"chippy-ending" HOWR_song_"chirpy-beginning"_short HOWR_song_"chirpy-beginning" HOWR_song_"Nasally-chips" HOWR_song_"te-do-te-do"_beginning HOWR_song HUVI_song_"zu-wee" INTO_call_"chip-chip"_two-notes INTO_call_"chip-chip" KILL_call_"Dee-dit"_variation_2 KILL_call_"Dee-dit"_variation KILL_call_"Dee-dit" Kill_call_"trill" KILL_flight-call LABU_chip-note LABU_song_"alpha-note" LABU_song_"du-zzee"_ending LABU_song_"twee-twee" LABU_song_"zee-twe-twe-zee"_ending LABU_song_two-swoop-middle_variation LABU_song_two-swoop-middle LABU_song_variation_2 LABU_song_variation LABU_song LBCU_call_"Ki-keck" LBCU_call_"purt-bur-bur-bur-e-e" LBVI_primary-song LBVI_song_alfa-down-ending LBVI_song_alfa-up-ending LBVI_song

Caltrans CFS Number 2045DRI, XB05 A-4 Bird Species Identification and Population Estimation by Computerized Sound Analysis
A-4
LEGO_call_"chit" LEGO_call_"pee-ee" LEGO_call_"tee-yer" LEGO_flight-call LEGO_song LESA_chorus LETH_song_variation LETH_song LEYE_call LISP_song_"zeet-zeet-zeet" LISP_song_"zrrr-zrrr-zrrr"_variation LISP_song_"zrrr-zrrr-zrrr" LISP_song_variation_fast-beginning LISP_song LOSH_call_"bzeek" LOSH_call_display MAGO_call_"Cor-ack" MALL_famale_"quack" MAWR_song_"de-do-zeee"_buzzy-beginning MAWR_song_"de-do-zeee"_buzzy-ending MAWR_song_"de-do-zeee"_ending-variation MAWR_song_"de-do-zeee" MAWR_song_slow-ending MGWA_chip-note MGWA_song_"chitter-beginning" MGWA_song_"churry churry cheery cheery"_variation
MGWA_song_"churry churry churry cheery cheery" MGWA_song_"U-shaped-churry" MOBL_call_"tew"_series MOBL_call_"tew" MOCH_call_"cheese-burger" MOCH_call_"chick-a-de-de"_four-note MOCH_call_"chick-a-de-de"_variation MOCH_call_"chick-a-de-de" MOCH_call_"chick-de-de" MOCH_call_buzzy_"chick-a-de" MOCH_call_gargle_variation MOCH_call_gargle MODO_song_"perch-cooo" MODO_wing-beats MOQU_call__plu-ark_ MOQU_call__queerk_ NAWA_song_"see-bit" NAWA_song_"tee-to-tee-to" NAWA_song_fast_"tee-to-tee-to" NOCA_song_"cheer-cheer-cheer" NOFL_call_"kick-kick" NOFL_call_"Peah"
NOFL_call_"wick-a-wick-a-wick" NOMO_call_"hew-hew"_variation NOMO_call_"hew-hew" NOMO_long-song NOMO_song_"te-del-do" NOPO_call_"toot"_2 NOPO_call_"toot" NRWS_call_"brzzzzzt"_descending NRWS_call_"brzzzzzt"_two-notes NRWS_call_"brzzzzzt"_variation NRWS_call_"brzzzzzt" NSWO_call_"toot" NUWO_call_"rattle"_variation NUWO_call_"rattle" NWSO_call_"too"_2 OATI_call_"tick-dee-dee" OATI_call_"tsicka dee dee" OCWA_song_"chee chee chee chew chew"_variation_2
OCWA_song_"chee chee chee chew chew"_variation
OCWA_song_"chee chee chee chew chew" OSFL_call_"pip, pip, pip" OSFL_song_"quick-THREE-BEERS!" OSPR_call_"tiooop"_variation OSPR_call_"tiooop" PABU_song PAWA_song_"peacie peacie peacie" PBGR_call_"chicks-begging" PHAI_call_"wurp"_two-note PHAI_call_"wurp" PIGR_territorial-song_variation PIGR_territorial-song PIWO_"drumming" PIWO_call_"kuk-kuk-kuk-kuk" PSFL_call_"Chrrip" PSFL_call_"ps-SEET" PSFL_song PUFI_long-song PUFI_song_"chirp-chirp" PUFI_song_"twitter-twee" PUFI_song_variation_"robin-mimic" PUFI_song_variation PUMA_call_"Zwrack" PUMA_double-note PUMA_song_variation PUMA_song PYNU_call_"Piping" PYNU_call_"Titters"_variation PYNU_call_"Titters" RBNU_call_"yank-yank"_2 RBNU_call_"yank-yank"
RBSA_call_"Waa" RBSA_call_interaction RCKI_song_variation RCKI_song RITD_song_2 RITD_song ROWR_call_buzzy ROWR_song__Tick-Ear_ ROWR_song_"tear-tear" ROWR_song_A ROWR_song_B ROWR_song_C ROWR_song_D ROWR_song_E RSHA_call_"Kee-aah" RSHA_series RTHA_call_"chwirk" RTHA_call_"kee-eeee-arrr" RUHU_call_variation_2 RUHU_call_variation RUHU_call RWBL_call_"teewww" RWBL_call_"tews-and-clicks" RWBL_call_"tip-tip" RWBL_song_variation RWBL_song SACR_call_"Rattle"_variation SACR_call_"Rattle" SAPH_song_"pit-tsee-eur" SASP_song_variation_2 SASP_song_variation SASP_song SAVS_"chip-note" SAVS_song_variation_2 SAVS_song_variation SAVS_song SNEG_call_"Aargaarg" SOGR_female_calling_to_chicks_2 SOGR_female_calling_to_chicks SORA_call_"ker-wee" SORA_call_"kuk-kuk" SOSP_2-songs SOSP_alarm-call SOSP_call_"chip" SOSP_song_2 SOSP_song_3 SOSP_song_4 SOSP_song_5 SOSP_song_6 SOSP_song_7 SOSP_song_8 SOSP_song SPOW_contact-whistle

Caltrans CFS Number 2045DRI, XB05 A-5 Bird Species Identification and Population Estimation by Computerized Sound Analysis
A-5
SPOW_long-series SPOW_series_4-note SPOW_series_7-note SPOW_series-and-whistle SPSA_call_"spink" SPSA_call_"tweet-weet" SPTO_call_"mew" SPTO_call_"twk-twk" SPTO_song_"buzzy-trill" SPTO_song_"slow-trill" SPTO_song_"trill" SPTO_song_"twee-trill" SPTO_song_"twee-twee" SSHA_call_"kek-kek-kek" STJA_call_"Ow" STJA_call_"Rattle" STJA_call_"Wah" STJA_call_"Wek" SUTA_call_"chew" SUTA_call_"chippy-chuck" SUTA_call_"prritt-i-tuk" SUTA_song_"hee para vee-er chewit terwee hee para vee-er" SUTA_song_variation SWFL_call_"creet" SWFL_call_"pew" SWFL_call_"twit" SWFL_song_"fitz-bew"_variation SWFL_song_"fitz-bew" SWFL_song_"fizz-bew" SWTH_song_"whip-poor-will-a-will-e-zee-zee-zee" SWTH_song_three-series-song SWTH_song_variation TRES_call_"chet-chet" TRES_call_"sheet" TRES_call_"tsip-prrup-prrup" TRES_song_"Dawn-song" TRES_song_"Day-song" VASW_chip-and-social_call VATH_call_"churrr" VATH_call_"vreee" VATH_call_variation VGSW_call_"Chee-chee"_variation VGSW_call_"Chee-chee" VGSW_call_"Twitter" VIRA_call_"Grunt-Call" WAVI_song_"Iggley, pigelly, wigelly, pig" WAVI_song_variation_2 WAVI_song_variation WBNU_call_"Chrr" WBNU_call_"double-note" WBNU_call_"quank quank"
WCSP_call_"chip" WCSP_song_variation_2 WCSP_song_variation WCSP_song WEBL_alarm-call WEBL_call_"kew" WEBL_song_"pa-wee few few" WEKI_call_"buzzy" WEKI_call_"kip" WEKI_call_"pwuh-T" WEKI_call_"rattle" WEKI_song_"Locomotory Hesitance Vocalizations" WEME_call_"chupp" WEME_call_"Roll" WEME_song_variation_2 WEME_song_variation_3 WEME_song_variation_4 WEME_song_variation WEME_song WESJ_call_"Screlch" WESJ_call_"Weep" WESO_call_"Bouncing-Ball" WESO_call_"Double-Trill" WETA_call_"pit-er-ik" WETA_call_"pit-ick" WETA_call_"trill" WETA_song_"pir-ri pir-ri pee-wi pir-ri pee-wi" WEVI_song WEWP_"Dawn-Song" WEWP_song_"pee-er"_variation WEWP_song_"pee-er" WHWO_call_"chick-it-up" WHWO_call_"pee-dink" WIFL_call_"Whit" WIFL_call_"Whup" WIFL_call_"Writ-tu" WIFL_call_"Zeet" WIFL_song_"Fitz-bew" WIFL_song_"Fizz-bew" WIFL_song_"Zwee-oo"_variation WIFL_song_"Zwee-oo" WILL_call__phwee-hoo__2 WILL_call__phwee-hoo_ WISA_call_"Churr" WISN_call_"Chip" WISN_call_"cut-a-cut-a" WISN_call_"display-call" WISN_call_"jick" WITU_call_"gobble" WIWA_song_"chee-chee-chee"_variation_2 WIWA_song_"chee-chee-
chee"_variation
WIWA_song_"chee-chee-chee" WIWR_chip-note WIWR_full-song_variation WIWR_full-song WIWR_short-song WREN_call_"click-click" WREN_song_"bouncing-trill"_two-note WREN_song_"bouncing-trill" WTKI_call_"kewt"_variation WTKI_call_"kewt" YBCH_call_"cheow" YBCH_call_"chew-ch-ch-ch-ch" YBCH_call_"chough" YBCH_call_"cuk" YBCH_call_"trill" YBCH_call_"two-two" YBCU_call_"kuu-doo" YBCU_call_"tck-tuck" YBCU_call_"trill" YBMA_call_"gargle" YBMA_staccato_chatter YBMA_staccato YEWA_song_"Type-1"_variation YEWA_song_"Type-1" YEWA_song_"Type-2"_variation_2 YEWA_song_"Type-2"_variation YEWA_song_"Type-2" YHBL_call_"chatter" YHBL_call_"Growl" YHBL_call_"trill" YHBL_song_"kuk _ koh-koh-koh __ waaaaaaaa"_variation
YHBL_song_"kuk _ koh-koh-koh __ waaaaaaaa" YRWA_song_"tuwee-tuwee-tuwee" YRWA_song_"tuwee-tuwee"_variation_2 YRWA_song_"tuwee-tuwee"_variation YRWA_song_variation
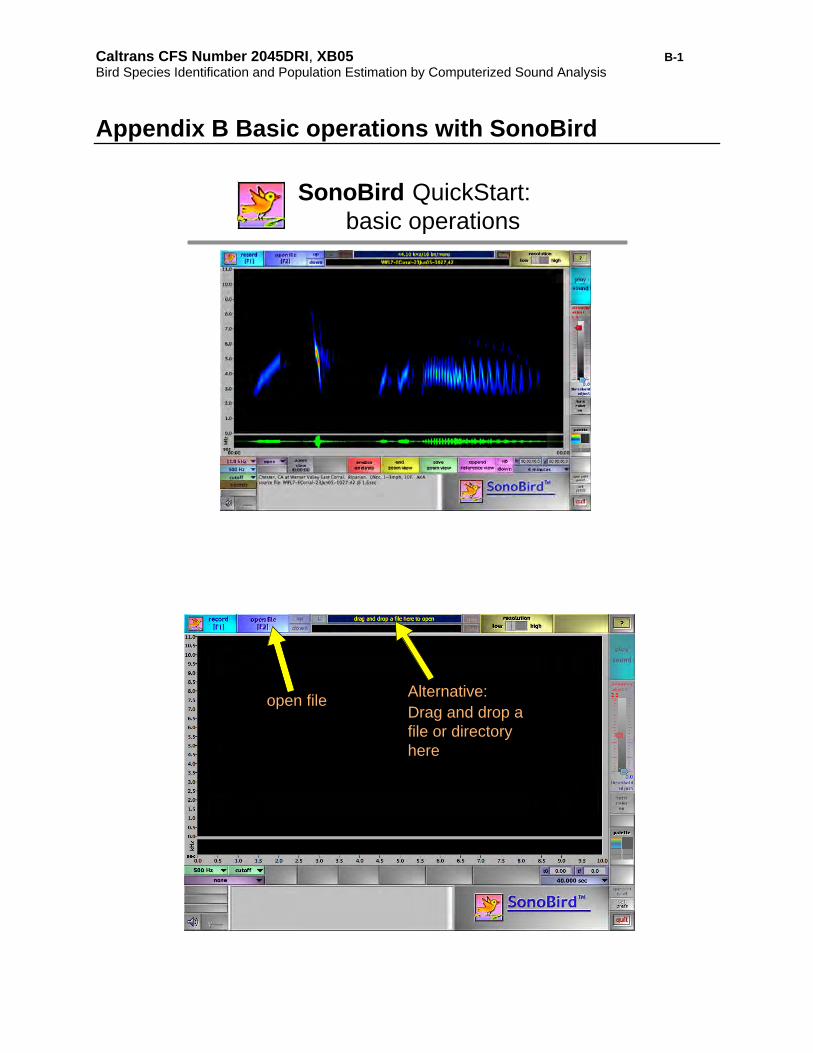
Caltrans CFS Number 2045DRI, XB05 B-1 Bird Species Identification and Population Estimation by Computerized Sound Analysis
Appendix B Basic operations with SonoBird
SonoBird QuickStart: basic operations
open fileAlternative:Drag and drop afile or directoryhere

Caltrans CFS Number 2045DRI, XB05 B-2 Bird Species Identification and Population Estimation by Computerized Sound Analysis
B-2
select filewith one
click
drag to scroll
click to jump
pull down tonavigate up
directoryhierarchy
Previously viewedfile highlighted

Caltrans CFS Number 2045DRI, XB05 B-3 Bird Species Identification and Population Estimation by Computerized Sound Analysis
B-3
notes embedded with file
play sound
moving cursor tracks playback

Caltrans CFS Number 2045DRI, XB05 B-4 Bird Species Identification and Population Estimation by Computerized Sound Analysis
B-4
Contextual Help- Cntl-H (Windows); Cmd-Shift-H (Mac)
zoom selection (only time gets zoomed)
(sonogram reprocesses to optimize display)
� multiple zooms supported

Caltrans CFS Number 2045DRI, XB05 B-5 Bird Species Identification and Population Estimation by Computerized Sound Analysis
B-5
adjust sonogram color mapping
appendedreference view

Caltrans CFS Number 2045DRI, XB05 B-6 Bird Species Identification and Population Estimation by Computerized Sound Analysis
B-6
lowfrequencynoise maybe filtered
filter applied

Caltrans CFS Number 2045DRI, XB05 B-7 Bird Species Identification and Population Estimation by Computerized Sound Analysis
B-7
Careful: filters can miss low freq signals
clicking on upper frequency scale invokespopup scale selector
(sonogram reprocesses to optimize display)

Caltrans CFS Number 2045DRI, XB05 B-8 Bird Species Identification and Population Estimation by Computerized Sound Analysis
B-8
Same file with 100 kHz filter and 0.5 kHz scale range
zoom selections may be saved to the reference library

Caltrans CFS Number 2045DRI, XB05 B-9 Bird Species Identification and Population Estimation by Computerized Sound Analysis
B-9
quantitative analysis
default panel size
stretched panel size

Caltrans CFS Number 2045DRI, XB05 C-1 Bird Species Identification and Population Estimation by Computerized Sound Analysis
C-1
Appendix C Using SonoBird to search for target signals
SonoBird signal searching

Caltrans CFS Number 2045DRI, XB05 C-2 Bird Species Identification and Population Estimation by Computerized Sound Analysis
C-2
Examples of search performance for a
Golden-cheeked warbler call in a four
hour recording made in central Texas.
The search revealed 211 accepted hits
(matching signals). The strong signal in
the top panel displays an obvious
match. However note that the search
algorithm also found the matching
Golden-cheeked warbler calls amid
noise from other birds (center panel)
and at very low signal levels (bottom
panel). Even with high pass filtering
this signal is nearly indiscernible from
background noise, yet was not missed
by the search algorithm.
Search performance
�However, the specificity of the time-frequency
search routine means that searches will
reject similar, but different signals. For
example, to find all fitzbews from Willow
flycatchers would require separate searches
for each type shown here.
�Use the save zoom view function in SonoBird
to save search components to open and use
in searches. WIFL fitzbews
SonoBird searches
�SonoBird searches for matches (hits) with specific search components
that you provide.
�Select representative sections or notes for search components.
�Search success increases with the distinctiveness (and consistency) of
the time-frequency domain of the signal.

Caltrans CFS Number 2045DRI, XB05 C-3 Bird Species Identification and Population Estimation by Computerized Sound Analysis
C-3
SonoBird searches
�Search components may be acquired from library reference recordings.However, some species have local song variants that will deviate fromrecordings made in different geographic areas.
�In such cases, a reference recording may help to find initial matchesfrom which you can make custom search components to optimize yoursearches.
�To create a searchcomponent, begin byopening a recording, andeither by initial searchingwith reference recordingsor by manual listeningfind representativesignals of the type youwish to search.
Open recording section withLincolnÕs sparrow songs.
After zooming and trimming to isolate component,select save zoom view
Find signal portions of interest by listening and zooming intosections. Species confirmations may be supported by appendingreference views. (See SonoBird Basic Operations PPT.)

Caltrans CFS Number 2045DRI, XB05 C-4 Bird Species Identification and Population Estimation by Computerized Sound Analysis
C-4
Notes may be added that SonoBird embeds in themetadata of the wav file. When complete, click save.
(SonoBird will automatically add the sourcefile name and time in the file to the note.)
Click here to open the search settings panel to initiate a search

Caltrans CFS Number 2045DRI, XB05 C-5 Bird Species Identification and Population Estimation by Computerized Sound Analysis
C-5
Search settings panel drag and drop files to search (will batch process)
or browse to select a file
Individual files or folders of files may bedropped to build a batch for a search.
parent directoryfile name
file duration
Search settings panel with dropped files
no. of files in batch

Caltrans CFS Number 2045DRI, XB05 C-6 Bird Species Identification and Population Estimation by Computerized Sound Analysis
C-6
�SonoBird will search as many as
three different search components
at a time.
�Search components, or terms, can
be combined with logical AND,
OR, and NOT operations.
Configuring a search
�For example, to search for a species having A or B song types, you
might use the A song type as the primary search component and the B
song type as the secondary search component. With the OR logic
enabled for the secondary search component the search will look for
both songs in the file(s) selected.
�AND logic requires the presence of a secondary signal component within
the specified distance of the primary search component. This provides a
way to search for songs having consistent notes, but variably placed
within a song.
�For example, with AND logic you might search for a species with a song
that has distinctive A and B notes. Specifying AND logic will require the
presence of both notes within the time duration you specify to have that
section of the file accepted as a hit.
�Specifying NOT logic for a component will reject a primary search hit
upon finding a matching hit for the NOT signal component within the
Configuring a search
�Specifying NOT logic can
help eliminate false hits
from a signal type similar to
the primary desired search
component.
specified distance of the
primary search component.

Caltrans CFS Number 2045DRI, XB05 C-7 Bird Species Identification and Population Estimation by Computerized Sound Analysis
C-7
Specifying search components
drag and drop a primary search componentor browse to select
Search settings panel with dropped search component
dropped search component
thumbnail sonogram of component
click to play

Caltrans CFS Number 2045DRI, XB05 C-8 Bird Species Identification and Population Estimation by Computerized Sound Analysis
C-8
SonoBird saves search settings by embedding them as metadata in
search component wav files.
Search settings panel with dropped search component
This dropped
search
component had
previously
embedded search
settings that can
be reused,
eliminating the
need to reset
them each time
the component is
used for a search.
Bandwidthfiltering
Option: selectsecondary search
component forAND or OR
inclusion in thesearch
Option: selecttertiary searchcomponent for
NOT or ORinclusion in the
search
Select a bandwidththat encompassesthe search term(indicated by redand green cursors).
In general, limiting the search to the frequency bandwidth covered bythe search component will enhance detection and search performance *,particularly in the presence of other species that may vocalize louderand at different frequencies than the species of interest.
* Bandwidth filtering will enhance search performancein terms of sensitivity, but not speed.

Caltrans CFS Number 2045DRI, XB05 C-9 Bird Species Identification and Population Estimation by Computerized Sound Analysis
C-9
Secondarysearch
componentselected
Tertiarysearch
componentselected
Because the search file only gets filtered once per search, whenusing multiple search components make sure that they all fall withinthe selected bandwidth filter (if used). To optimize searchperformance, run separate searches with different bandwidth filteringfor search components with non-overlapping frequency bandwidths.
Shown: two Willow flycatcher and one LincolnÕs sparrow songs.
BandwidthfilteringSelect a bandwidththat encompassesthe search term(indicated by redand green cursors).
Option to save hits as .hit files or asseparate audio files. When enabled,SonoBird saves hits as .hit text files thatpoint to sections of searched file.
.hit files use miniscule disk space butrequire access to the search file in thesame directory as that used during thesearch. Save hits as separate audio filesif you need to transport them forsubsequent inspection or use.
SonoBird saves search results into adefault folder in the same directory asthe search term, named for the searchfile.
SonoBird saves audio file sections (as.wav files) or .hit files with the followingnaming convention:
SearchedFilename-N-XhYmZs,where N represents the searchcomponent number and X, Y, and Zrepresent the relative time position inthe searched file in hours, minutes,seconds, respectively.
Search hits may be viewed immediatelyfollowing search or later by opening thesearch results directory with eithersaved .wav or .hit files.
Search settings and results

Caltrans CFS Number 2045DRI, XB05 C-10 Bird Species Identification and Population Estimation by Computerized Sound Analysis
C-10
Search settings
Time-frequency domain parameters.Effective for most searches,
particularly with distinctive time-frequency patterns.
Frequency-power and time-powerdomain parameters. More sensitive to
noise, so best to disable for mostsearches. Use for higher quality
recordings or when needed toseparate signals having similar time-
frequency patterns.
These settings specify criteria foraccepting candidate signals fromthe initial coarse search.
Minimum acceptable sonogramcomparison correlationcoefficient calculated from acomparison of amplitude-thresholded sonograms of thesearch term compared with thecandidate signal. Basically, aranking coefficient sensitive to thetime-frequency and amplitudepattern of the signals.
Minimum acceptable %difference in time-frequency callpoints, normalized per trend-accepted points in searchcomponent. Basically, it measuresthe sum difference of the time-frequency points of the unknownsignal from the search term signal,expressed as a percentage of themean frequency value of thesearch term.
(For noisy recordings andrecordings with low signal-to-noiseration (SNR), disable these terms.This will force the candidate signal
logic to depend upon the just thetime-frequency only.)
Search settings
For noisy recordings and recordingswith low signal-to-noise ration (SNR),use a low setting (~0.20 or 0.10 orless) to reduce its impact, or just fullydisable. This will force the candidatesignal logic to depend upon thetrend-accepted points only, i.e.,those measured by the Minimumacceptable sonogram comparisoncorrelation coefficient (MinCompCoeff) and the Minimumacceptable % difference (MinPctDiff),both of which provide more robustdiscrimination of signals withdistinctive time-frequency patterns.
Minimum acceptablecorrelation
coefficient of thefrequency versus
power distribution ofthe search term and
candidate signal. Thismeasure is sensitive
to the power of thefrequency distributed
through the signal, butinsensitive to its order,
i.e., the time ofoccurrence in the
signal.

Caltrans CFS Number 2045DRI, XB05 C-11 Bird Species Identification and Population Estimation by Computerized Sound Analysis
C-11
Search settingsThe default value will select highquality signals. Decrease this termfor signals having noise and othersignals contributing power. For noisyrecordings and recordings with lowsignal-to-noise ration (SNR), use alow setting (~0.20 or 0.10 or less) toreduce its impact, or just fullydisable. This will force the candidatesignal logic to depend upon thetrend-accepted points only, i.e.,those measured by the Minimumacceptable sonogram comparisoncorrelation coefficient (MinCompCoeff) and the Minimumacceptable % difference (MinPctDiff),both of which provide more robustdiscrimination of signals withdistinctive time-frequency patterns.
Minimumacceptablecorrelation
coefficient of thetime versus powerdistribution of the
search term andcandidate signal.This measure is
sensitive to the timedistribution of power
through the signal,but insensitive to its
frequency.
Search settings
A lower value will acceptmore candidate signals forfor the secondary fine scaleacceptance/rejectionprocessing. This may bedesired for census surveywork, but will also potentiallygenerate more false hits tosort through with manualinspection to confirmacceptance or rejection.
Initial search sensitivityadjusts the sensitivity of
candidate signal selection frominitial coarse search. Decreaseto lower selectivity and accept
more candidate signals.Increase to raise sensitivity and
accept only high qualitysignals.
Use value of 1.5 as a defaultsensitivity, then adjust higher(~2) to select only the highest
quality fitting signals. Forrecordings having lower signal
quality and noise, a lower value(~1) will select more candidate
signals and prevent missingany signals of interest.

Caltrans CFS Number 2045DRI, XB05 C-12 Bird Species Identification and Population Estimation by Computerized Sound Analysis
C-12
Search settings
The extraction lengthspecifies the timeduration of the file
segment to save for hits(or designate for hit
files). The segment iscentered around thecenter of the searchterm. The extraction
length defaults to thenext full second of the
length of the searchterm. Adjust to a highervalue if the search termis just a part of a larger
call you wish to inspect.
Returns all searchparameter settings todefault values andclears the searchcomponent.
Note: when using a searchcomponent that represents just anote or phrase a song that you wishto match, you will likely want toincrease the extraction length abovethat automatically set relative to thesearch component. This will enableviewing the entire song of interestwhen reviewing the hits.
After loading all files to search and setting allsearch parameters, click the start search
button to launch the search
Running a search

Caltrans CFS Number 2045DRI, XB05 C-13 Bird Species Identification and Population Estimation by Computerized Sound Analysis
C-13
Running a search
Panel for processing and selecting candidate signalssearch term Current search file
SonoBird first scansthe search file to
extract signalcharacteristics.
Enable animate plot option to inspect acceptanceperformance. Disable to speed search.
Pause/resume control to facilitateinspection of search settings performance
time-frequencycomparison plot
Following initial coarse selection ofcandidate signals, SonoBird evaluates themmore thoroughly for acceptance or rejection.
frequency-powercomparison plot
time-powercomparison plot
search component
candidate signal
Running a search

Caltrans CFS Number 2045DRI, XB05 C-14 Bird Species Identification and Population Estimation by Computerized Sound Analysis
C-14
Running a search
Minimumacceptablesonogram
comparisoncorrelationcoefficient
(CompCorr)
% Search Difference iscalculated using onlydisplayed points (see above).
time-frequencycomparison plot
The time-frequency comparison plot displays phase-matched clouds of pointsdelineating the basic frequency content of the search component (yellow) and thecandidate signal (red). SonoBird only considers points above a minimumthreshold and rejects points recognizable as noise.
CalculatedCompCorr
for thiscandidate
signal
Green background indicatesacceptance of this parameter value.
% All Difference considers allpoints, and helps distinguish thecandidate signal from backgroundsignals and noise. The acceptancelevel is automatically set at twicethe acceptable % SearchDifference .
Running a search
The frequency-power comparison plot displays the comparative distribution offrequency and power between the search component (yellow) and the candidatesignal (magenta). The difference between the two displays in blue.
The correlation coefficient of the frequencyversus power distribution provides aquantitative measure of the match betweenthe two signals in this domain.
This signal measure will prove more usefulfor discriminating search components havingbroader frequency bandwidth. For signalswith a narrow frequency range, as in thisexample, it will generally just serve as aredundant signal check to eliminate
frequency-powercomparison plot
substantially different signals, and using a lower setting will suffice.
Note: the discriminating power of this measure increases when there is nobandwidth filter applied to the search file. However, running a search without afilter can reduce the hits from lower amplitude (more distant) signals in thepresence of stronger signals outside of the search componentÕs bandwidth.
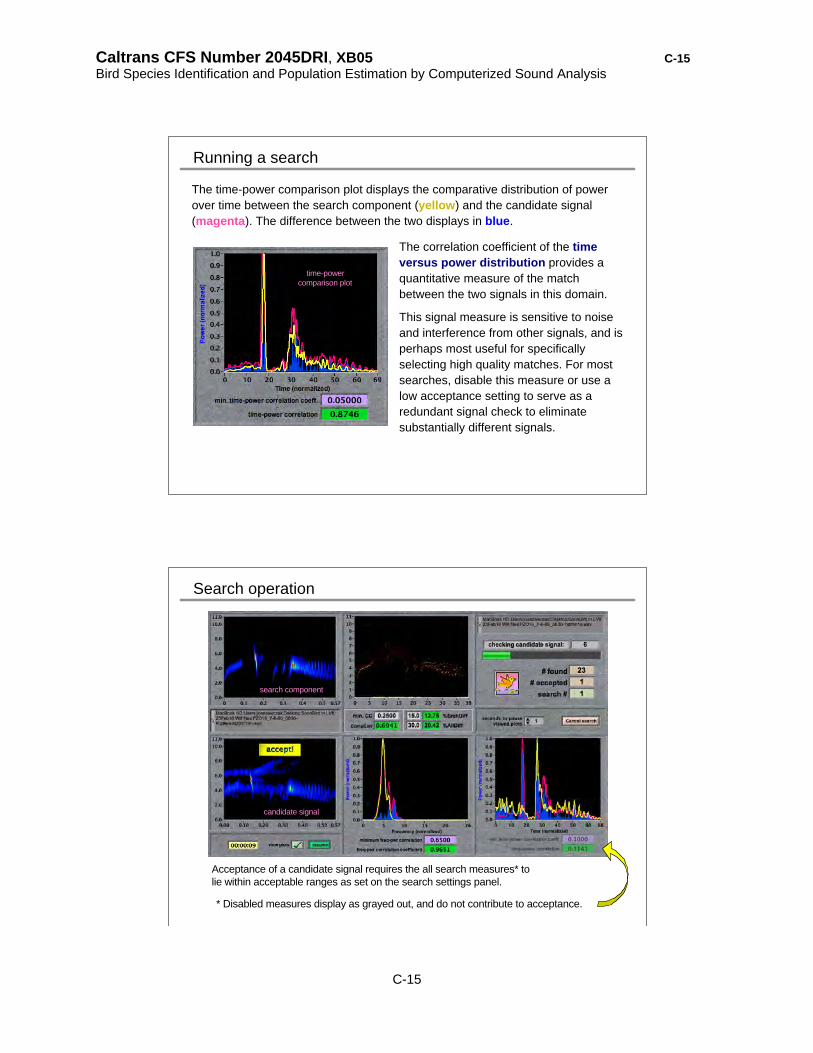
Caltrans CFS Number 2045DRI, XB05 C-15 Bird Species Identification and Population Estimation by Computerized Sound Analysis
C-15
Running a search
The time-power comparison plot displays the comparative distribution of powerover time between the search component (yellow) and the candidate signal(magenta). The difference between the two displays in blue.
The correlation coefficient of the timeversus power distribution provides aquantitative measure of the matchbetween the two signals in this domain.
This signal measure is sensitive to noiseand interference from other signals, and isperhaps most useful for specificallyselecting high quality matches. For mostsearches, disable this measure or use alow acceptance setting to serve as aredundant signal check to eliminatesubstantially different signals.
time-powercomparison plot
* Disabled measures display as grayed out, and do not contribute to acceptance.
Search operation
search component
candidate signal
Acceptance of a candidate signal requires the all search measures* tolie within acceptable ranges as set on the search settings panel.

Caltrans CFS Number 2045DRI, XB05 C-16 Bird Species Identification and Population Estimation by Computerized Sound Analysis
C-16
Enable view plots when processing candidate signals to observe how yoursearches perform with the criteria you set, and adjust to suit your needs. Youcan pause during the the candidate signal processing to view or make notes.
Optimizing searches
search component
candidate signal
This example shows a candidate signal preferred to be accepted but was rejected.Adjusting the settings that rejected the signal (in red) will accept such a signal in arepeat of this search and in subsequent searches with other files, e.g., adjust themin. CompCorr to 0.200 and the max. %SrchDiff to 15.0.
Optimizing searches
search component
candidate signal

Caltrans CFS Number 2045DRI, XB05 C-17 Bird Species Identification and Population Estimation by Computerized Sound Analysis
C-17
Upon completion of a search, you may either view the results, exit, or search again.
Search completion
By default, .hit files open sorted by correlationranking with search component.
This sorts by quality of match with the search term forinspection and facilitates presence/absence surveys byminimizing the potential results to inspect for confirmation.

Caltrans CFS Number 2045DRI, XB05 C-18 Bird Species Identification and Population Estimation by Computerized Sound Analysis
C-18
Alternately, .hit files may be sorted by name, which because of thenaming convention sorts them by order occurrence in the search file.
This enables an evaluation of the timecourse of the vocalizations.
With either sorting scheme, you can start at the top or bottomof the list and easily scroll through the hit files to inspect.
Key shortcuts: Ctrl-down arrow or F4 to move down the list; Ctrl-up arrow orF3 to move up the list. (Command-arrows on Mac)

Caltrans CFS Number 2045DRI, XB05 C-19 Bird Species Identification and Population Estimation by Computerized Sound Analysis
C-19
* .hit files will only work on the computer that performed the search as they donot contain audio data, but point to file sections within the searched file.
Previous .hit or .wav hit filesor hit folders can be draggedonto the dropbox to open*.

Caltrans CFS Number 2045DRI, XB05 D-1 Bird Species Identification and Population Estimation by Computerized Sound Analysis
D-1
Appendix D SonoBird signal searching tutorial
SonoBird signal searching tutorial
To search for a target bird vocalization
in file recordings requires search
components optimized to match the
target signals in the recorded files.
Signal searching presents a
compromise between high specificity
that reduces false hits and reduced
specificity (i.e, more tolerance) that will
find more variations in a target signal,
but will also likely yield more false hits
to sort through.
Because bird vocalizations vary
regionally, search components created
from recordings as near the study site
as possible will typically perform the
best.
Search basics
However, in the absence of local
reference recordings, begin with
search components created from
known recordings in the SonoBird
reference library or from other sources.
Perform an initial search with reduced
specificity, i.e., reduce the tolerance of
the SonoBird search settings, and use
a mix of representative song types.
Because species also vary in their
song variability, some species will
require more or less adjustments and
different search components to confirm
occurrence. An example follows.

Caltrans CFS Number 2045DRI, XB05 D-2 Bird Species Identification and Population Estimation by Computerized Sound Analysis
D-2
The SonoBird documents and supporting files provide a set a
sample recordings and search components to use as practice
examples.
As a tutorial example, open the search settings panel, and drop (or
navigate to) the Savannah sparrow (SAVS) recording sample
SAVS Test Track.wav onto the file to search box. It will show as a 4
min, 6 sec file.
Search example
The SonoBird Example bird refs set 1 includes three examples of SAVS songs.
We will start with those here, but for other searchs if you can not find such
convenient starting examples there, or if you need more examples, you could
extract search components from the additional recordings in the reference
Search example
library or from
elsewhere. Drop
the three reference
files into the
search component
path boxes in the
search settings
panel, selecting
ŅORÓ logic for the
second and third
components.

Caltrans CFS Number 2045DRI, XB05 D-3 Bird Species Identification and Population Estimation by Computerized Sound Analysis
D-3
Note similarity, but differences in the components. To increase the tolerance of the
search above the default settings, Adjust the Minimum Comparison Coefficient downward
to 0.150 and the Maximum % Difference upward to 30.00. That will increase the chances
of finding any similar, but slightly different signals in the search file.
Search example
Adjust the bandwidth
filter to encompass
all components (drag
cursors on primary
component), adjust
the extraction lengths
to fit (2.0 sec), and
enable saving the
hits as .hit files
(because you are
using files on the
same system).
Click start search .
The search initiates, with the initial coarse search finding 25 candidate signals
matching the primary component, and 18 each for the secondary and tertiary
components.
Search example

Caltrans CFS Number 2045DRI, XB05 D-4 Bird Species Identification and Population Estimation by Computerized Sound Analysis
D-4
Enable view plots to observe the inspection of candidate signals. Note how the
search does not accept some similar signals. This panel shows that further
increasing the Max%Diff would have accepted the signal shown.
Search example
But even without further adjustments, the search accepted five signals. Select
view hits to inspect.
Search example

Caltrans CFS Number 2045DRI, XB05 D-5 Bird Species Identification and Population Estimation by Computerized Sound Analysis
D-5
Start at the top (best match) to inspect the hits.
Search example
Scroll through the files (down button, or Ctrl-down arrow *) and note the similarities and
differences . A good search component will share commonality among all the variations.
Search example
* Command-down arrow on Mac.

Caltrans CFS Number 2045DRI, XB05 D-6 Bird Species Identification and Population Estimation by Computerized Sound Analysis
D-6
This zoomed selection provides a distinctive pattern shared among the other hits.
Search example
Once zoom-selected, you can add a note if desired, and save the selection to use as a
search component.
Search example

Caltrans CFS Number 2045DRI, XB05 D-7 Bird Species Identification and Population Estimation by Computerized Sound Analysis
D-7
Initiate a new search of the SAVS Test Track.wav file. First,
reset all settings to default .
Search example
Next, select the newly saved search component and start the search.
Search example

Caltrans CFS Number 2045DRI, XB05 D-8 Bird Species Identification and Population Estimation by Computerized Sound Analysis
D-8
Using the custom search component with the more specific defaultsearch settings, this search found a dozen hits, all off which youcan inspect and confirm as SAVS hits.
Search example
Note: even within a region you can expect to find intraspecific call
variation. Providing some latitude in search tolerance will help find other
similar intraspecific vocalizations. Some manual inspection of files, and
scanning through hits with tolerant search settings will help to find all
potential target signals and build a set of search components that work
for the vocal variants of a target species in a target region.
Search example

Caltrans CFS Number 2045DRI, XB05 E-1 Bird Species Identification and Population Estimation by Computerized Sound Analysis
E-1
Appendix E Set up and recording with the Binary Acoustic Technology FR125

Caltrans CFS Number 2045DRI, XB05 E-2 Bird Species Identification and Population Estimation by Computerized Sound Analysis
E-2

Caltrans CFS Number 2045DRI, XB05 E-3 Bird Species Identification and Population Estimation by Computerized Sound Analysis
E-3

Caltrans CFS Number 2045DRI, XB05 E-4 Bird Species Identification and Population Estimation by Computerized Sound Analysis
E-4

Caltrans CFS Number 2045DRI, XB05 E-5 Bird Species Identification and Population Estimation by Computerized Sound Analysis
E-5

Caltrans CFS Number 2045DRI, XB05 E-6 Bird Species Identification and Population Estimation by Computerized Sound Analysis
E-6

Caltrans CFS Number 2045DRI, XB05 E-7 Bird Species Identification and Population Estimation by Computerized Sound Analysis
E-7

Caltrans CFS Number 2045DRI, XB05 E-8 Bird Species Identification and Population Estimation by Computerized Sound Analysis
E-8

Caltrans CFS Number 2045DRI, XB05 E-9 Bird Species Identification and Population Estimation by Computerized Sound Analysis
E-9

Caltrans CFS Number 2045DRI, XB05 E-10 Bird Species Identification and Population Estimation by Computerized Sound Analysis
E-10

Caltrans CFS Number 2045DRI, XB05 E-11 Bird Species Identification and Population Estimation by Computerized Sound Analysis
E-11

Caltrans CFS Number 2045DRI, XB05 E-12 Bird Species Identification and Population Estimation by Computerized Sound Analysis
E-12

Caltrans CFS Number 2045DRI, XB05 E-13 Bird Species Identification and Population Estimation by Computerized Sound Analysis
E-13

Caltrans CFS Number 2045DRI, XB05 E-14 Bird Species Identification and Population Estimation by Computerized Sound Analysis
E-14

Caltrans CFS Number 2045DRI, XB05 E-15 Bird Species Identification and Population Estimation by Computerized Sound Analysis
E-15

Caltrans CFS Number 2045DRI, XB05 E-16 Bird Species Identification and Population Estimation by Computerized Sound Analysis
E-16

Caltrans CFS Number 2045DRI, XB05 E-17 Bird Species Identification and Population Estimation by Computerized Sound Analysis
E-17

Caltrans CFS Number 2045DRI, XB05 E-18 Bird Species Identification and Population Estimation by Computerized Sound Analysis
E-18