From pioneering to industrializing offshore wind: Lessons learned from Horns Rev II

National Environmental Research InstituteMinistry of the Environment . Denmark
Bird numbers and distri-butions in the Horns Revoffshore wind farm areaAnnual status report 2004
NERI ReportCommisioned by Elsam Engineering A/S2005

[Blank page]
National Environmental Research InstituteMinistry of the Environment . Denmark
Bird numbers and distri-butions in the Horns Revoffshore wind farm areaAnnual status report 2004
NERI ReportCommisioned by Elsam Engineering A/S2005
Ib Krag Petersen

Data Sheet
Title: Bird numbers and distributions in the Horns Rev offshore wind farm areaSubtitle: Annual status report 2004
Author: Ib Krag Petersen
Department: Department of Wildlife Ecology and Biodiversity
Publisher: National Environmental Research InstituteMinistry of Environment
Year of publication 2005
Editor: Karsten LaursenReferees: Karsten LaursenProofreading: Henning NoerLayout: Helle KlareskovCover page photo: Daníel Bergmann. Male Common Scoter, Mývatn, Iceland
Elsam Engineering A/S
3
Contents
Synopsis .......................................................................................................................... 5
Dansk resumé.................................................................................................................. 7
1 Introduction ........................................................................................................ 9
1.1 Background ............................................................................................................... 9
1.2 The Horns Rev Project ............................................................................................. 9
2 Methods ............................................................................................................. 11
2.1 Study area ................................................................................................................ 11
2.2 Study period ........................................................................................................... 11
2.3 Aerial surveys of birds .......................................................................................... 11
2.3.1 Aerial surveys between wind turbines ..................................................... 13
2.4 Data analyses .......................................................................................................... 13
2.5 Quality control ........................................................................................................ 14
3 Results................................................................................................................ 15
3.1 Bird numbers and distributions in the Horns Rev area ................................... 15
3.1.1 Red- and Black-throated Diver Gavia stellata/arctica ........................... 163.1.2 Gannet Sula bassana ................................................................................... 173.1.3 Eider Somateria mollissima ....................................................................... 173.1.4 Common Scoter Melanitta nigra ............................................................... 183.1.5 Herring Gull Larus argentatus .................................................................. 193.1.6 Little Gull Larus minutus ........................................................................... 203.1.7 Arctic/Common Tern Sterna paradisaea/hirundo ................................ 213.1.8 Guillemot Uria aalge/ Razorbill Alca torda ............................................ 22
3.2 Utilisation of the Horns Rev wind farm area and surroundings bybirds, pre- and post erection of wind turbines................................................... 23
3.2.1 Red- and Black-throated Diver Gavia stellata/arctica ........................... 243.2.2 Gannet Sula bassana ................................................................................... 253.2.3 Eider Somateria mollissima ....................................................................... 253.2.4 Common Scoter Melanitta nigra ............................................................... 253.2.5 Herring Gull Larus argentatus .................................................................. 283.2.6 Little Gull Larus minutus ........................................................................... 283.2.7 Arctic/Common Tern Sterna paradisaea/hirundo ................................ 283.2.8 Guillemot Uria aalge / Razorbill Alca torda ........................................... 28

4
4 Discussion and conclusions............................................................................ 29
4.1 Existing knowledge on habitat loss or gain caused by wind turbines. .......... 29
4.2 Change in distribution of Common Scoter......................................................... 29
4.3 Conclusions ............................................................................................................. 29
5 References ......................................................................................................... 31
Appendix I ..................................................................................................................... 33
National Environmental Research Institute

5
This report presents data from four aerial surveysof birds in the Horns Rev wind farm area in 2004.Three surveys from the winter and spring of 2004are thoroughly reported here. The fourth surveyof 9 September 2004 is reported in general terms,but not included in presentations of distributionand effect analyses of the wind farm. Data fromthis survey will be thoroughly dealt with in a fu-ture report. Including the four surveys of 2004, atotal of 29 surveys have been performed in thatarea since August 1999.
The four surveys in 2004 were performed on 29February, 26 March, 10 May and 9 September.
The operational phase of the wind farm com-menced in 2002. Hence nine surveys from 2003and 2004 have been conducted during the post-construction period. In order to achieve maxi-mal compatibility between pre- and post-con-struction data sets, most analyses were compar-ing surveys done in February through May of2000 and 2001 (seven surveys) and 2003 and 2004(six surveys).
Common Scoter was by far the most numerousbird species in the study area in 2004 as well asduring the previous years of investigations. Morethan 95,000 individuals were observed in 2004.Herring Gull was the second most numerous spe-cies in 2004, with more than 4,400 birds observed.Divers, Gannet, Eiders, Little Gull, Arctic/Com-mon Tern and Guillemot/Razorbill were rela-tively regular in the study area, and are treatedin detail in this report.
Divers, Common Scoter and Guillemots/Razor-bills showed an increased avoidance of the windfarm area (and zones within 2 and 4 km of it) af-ter the erection of the wind turbines. In contrast,Herring Gulls, Little Gulls and Arctic/CommonTerns showed a decreased avoidance of the windfarm area.
Common Scoter showed a difference in the spa-tial distribution within the study area in 2004 com-pared to previous years. Shallow offshore areaswest of the wind farm became important to thespecies, with occurrence of birds in the western-most parts of the survey area. Furthermore, theseasonal shift in offshore appearance of CommonScoter described in previous reports seems to havechanged into a more permanent presence duringwinter. This leads to the hypothesis that a food re-source has formed in these areas, which was notpresent during the pre-construction period.
Given the apparent general changes in CommonScoter distribution in the study area comparisonof pre- and post-construction distribution analy-ses for this species must be interpreted with cau-tion. Despite this the data strongly indicate thatcommon scoters respond to the presence of thewind turbines by avoidance of that area. The areasoutheast of the wind farm, previously used byCommon Scoter and particularly in Februarythrough April, became less attractive to the spe-cies. Simultaneously areas west and north of thewind farm, with previously very few CommonScoters, supported greater numbers of this spe-cies, while only very few birds were recordedwithin the wind farm.
The reason for the change in avoidance of thewind farm area for divers, Common Scoter andGuillemot/Razorbill is unknown. Disturbanceeffects from the wind turbines is one possible rea-son. Disturbance from increased human activityassociated with maintenance of the wind turbinescould be another. But changes in the distributionof food resources in the study area could poten-tially play a role too.
The change in gull and tern preference for thewind farm area is likely to have been caused bythe presence of the wind turbines and the associ-ated boat activity in the area.
Synopsis


7
Denne rapport præsenterer resultater fra fire op-tællinger af fugle fra fly i undersøgelsesområdetfor Horns Rev havvindmøllepark i 2004. Resul-taterne fra disse optællinger bearbejdes, hvor detre optællinger fra vinteren og foråret 2004 ind-går i en løbende, grundigere analyse af møller-nes effekt på områdets fugleforekomster, mensen fjerde optælling foretaget den 9. september2004 blev indarbejdet på et mere summarisk ni-veau. Denne optælling vil blive grundigere afrap-porteret i en kommende rapport. Hermed er deri perioden august 1999 - september 2004 i alt fore-taget 29 optællinger af fugle i undersøgelses-området på Horns Rev.
De fire optællinger i 2004 blev foretaget på føl-gende datoer: 29. februar, 26. marts, 10. maj og 9.september.
Havvindmølleparkens driftsfase startede i 2002.Optællingerne foretaget i 2003 og 2004 dækkersåledes alle driftsfasen. For at opnå bedst sam-menlignelighed imellem data fra forundersøgel-serne er de analyser af effekten af vindmøllernesmulige indflydelse på fuglenes fordeling i områ-det foretaget på baggrund af optællinger fra fe-bruar til maj i henholdsvis 2000 og 2001 (syv op-tællinger foretaget under forundersøgelser) og2003 og 2004 (seks optællinger foretaget underdriftsfasen).
Sortand var langt den hyppigst forekommendeart i undersøgelsesområdet i 2004, ligesom det harværet tilfældet de foregående undersøgelsesår.Godt 95.000 sortænder blev optalt i 2004. Sølv-måge var den næsthyppigste art i 2004 med mereend 4.400 observerede individer. Lommer, sule,skarv, ederfugl, dværgmåge, hav-/fjordterne ogalk/lomvie forekom relativt hyppigt i undersø-gelsesområdet, og behandles i denne rapport.
Lommer, sortand og alk/lomvie viste underdriftsfasen en mindre præference for selve mølle-
parken, samt zoner på 2 og 4 km omkring dennei forhold til perioden før vindmølleparkens op-førelse. Omvendt viste sølvmåge, dværgmåge oghav-/fjordterne en større præference for mølle-parken og de to zoner omkring denne.
Sortand fortsatte med at udvise ændringer i de-res geografiske fordeling i undersøgelsesområdeti 2004. Lavvandede områder langt fra kysten blevudnyttet af fuglene, og sortænder blev observe-ret i den vestligste del af undersøgelsesområdet.Det sæsonbetonede fordelingsmønster, som erbeskrevet i tidligere rapporter, ser ud til at haveændret sig til en mere permanent vinterudnyttelseaf områder langt fra kysten. Årsagen hertil skøn-nes at være dannelse af en mere permanent føde-ressource for sortænder i disse områder.
Som følge af disse generelle geografiske ændrin-ger i sortændernes fordeling i undersøgelses-området må analyserne af forskelle i fuglenesfordeling før og efter oprettelsen af vindmølle-parken vurderes med forsigtighed. Resultaternegiver dog klare indikationer på at sortænder rea-gerer på vindmøllernes tilstedeværelse. Et om-råde sydøst for mølleparken og tæt på denne vari 2003 og 2004 mindre attraktivt for arten endtidligere, specielt i marts-april. Derimod var om-råder vest og nord for mølleparken mere attrak-tive i 2003 og 2004 end tidligere, hvor disse kunblev udnyttet i meget ringe grad, mens kun me-get få sortænder blev registreret inde i selve mølle-parken.
Årsagen til den mindre præference for området iog omkring mølleparken i driftsfasen er for lom-mer, sortand og alk/lomvie ukendt. Forstyrrelsefra vindmøllerne kan være en mulighed. Detgælder også en forøget menneskelig aktivitet iforbindelse med driften af mølleparken, ligesomændringer i forekomst og fordeling af arternesføderessourcer muligvis også kan påvirke fugle-nes fordeling.
Dansk resumé


9
1.1 Background
In February 1998, the Ministry of the Environmentgave Elsam A/S and Eltra A.m.b.a. approval inprincipal to assess the feasibility of erecting awind farm, capable of producing 160 MW of elec-tric power, at Horns Rev, west of Blåvands Hukat the west coast of Jutland. The conditions im-posed an environmental impact assessment (EIA)on the project and explicitly required that before,during and after-construction comparisons of birddistributions be carried out to investigate anddemonstrate potential impacts resulting from theconstruction of the wind farm.
With regard to the potential impacts on birds fromthe wind farm, Elsam Engineering A/S (theformer Elsam Projekt A/S and Tech-Wise A/S)in 1999 contracted the National EnvironmentalResearch Institute (NERI), Department of Wild-life Ecology and Biodiversity to perform studiesto assess the impact. These studies were financedfrom PSO (Public Service Obligation) resources.
The southeastern part of the North Sea constitutesmajor staging and wintering grounds for hugenumbers of water- and seabirds (Tasker et al. 1987,Laursen & Frikke 1987, Laursen et al. 1997). Inaddition, Blåvands Huk, situated east of the windfarm area, acts as an important site for migratingwaterfowl as well as for migratory terrestrial birdspecies, especially during autumn (Jacobsen inprep.).
The Horns Rev wind farm is situated outside anyareas protected for their bird conservation inter-est. The Wadden Sea and neighbouring land ar-eas constitute Ramsar area no. 27, and are alsodesignated as Special Protection Areas under theEU Birds Directive (nos. 49, 50, 51, 52, 53, 55, 57,60, 65 and 67) and as Special Areas for Conserva-tion under the EU Habitats Directive (nos. 73, 78and 90). Furthermore, the Wadden Sea also hasthe status of a Game Reserve (no. 48) with regu-lations relating to nature conservation and pub-lic access. For a more detailed description of thedifferent protective measures and affected areas,see Noer et al. (2000).
1.2 The Horns Rev Project
The wind farm area is located in the southeast-ern part of the Horns Rev, c. 14 km west-south-west of Blåvands Huk in the Danish part of theNorth Sea (Fig. 1). Geomorphologically, the HornsRev formation is described as a terminal moraineridge, consisting of relatively well sorted sedi-ments of gravel and sand (Danish Hydraulic In-stitute 1999). The water depth within the windfarm area varies from 6.5 m to 13.5 m.
Construction activities at Horns Rev started inSeptember 2001. The first activities were associ-ated with pile ramming supports for the trans-former station in September-October 2001 and tovarious tests of equipment and positioning. Theestablishment of turbine foundations was startedin March 2002, and turbine erection in April. In-stallation of the transformer station was com-pleted in April 2002. The wind farm started tooperate in the last quarter of 2002.
1 Introduction
1 2 3 4 5 6 7 8 9 10 14 15 16 17 18 19
20 21 22 23 24 25 26 27 2829 30
1112 13
N
0 10 20 km
Study areaSurvey way pointsSurvey transect linesMilitary danger and restriction areasHorns RevWind parkWind park + 2 kmWind park + 4 km
Fanø
Esbjerg
Skallingen
Blåvands Huk
EK D73
EK R34
EK R35
EK
R33
EK D80
EK D81
EK
R32
Figure 1. The study area, showing the total survey area(outlined in red) and survey transect net (blue lines).The wind farm area and the 2 and 4 km zones aroundit, are shown. Also shown are military restriction ar-eas.

10
The wind farm has a capacity of 160 MW andcomprises 80 turbines. Each turbine tower reaches70 m above sea level. The rotor diameter is 80 mresulting in a maximum height to the upper wingtip of 110 m. The minimum free height from sealevel to lower wing tip is 30 m. The distance be-tween adjacent turbines and the turbine rows is560 m giving an open space of nearly 500 m be-tween turbines. The turbines are equipped witha white strobe light about 10 m above sea levelfor ship traffic and a red strobe light at the top ofthe turbines for air traffic. The wind farm coversan area of c. 20 km².
The turbine foundation is a monopole rammedinto the substrate. The total area occupied physi-cally by the 80 wind turbines will constitute amaximum of 0.3% of the total wind farm area.
Cables between the turbines and from the windfarm to land have been bedded down c. 1 m intothe seabed.
A transformer station of 20 x 28 m mounted onthree legs and 14 m above sea level is located 560m north of the northeasternmost wind turbine.
During the fully operational phase, service andmaintenance of the turbines are expected in thefuture to constitute 150 days per year and will becarried out partly from ship and partly from heli-copter. In 2003 and 2004 the maintenance activi-ties have been more intensive than this due tonecessary technical adjustments. Thus the levelof maintenance traffic in 2003 and 2004 was simi-lar to that of the construction phase in 2002 (El-sam Engineering pers. com.).
11
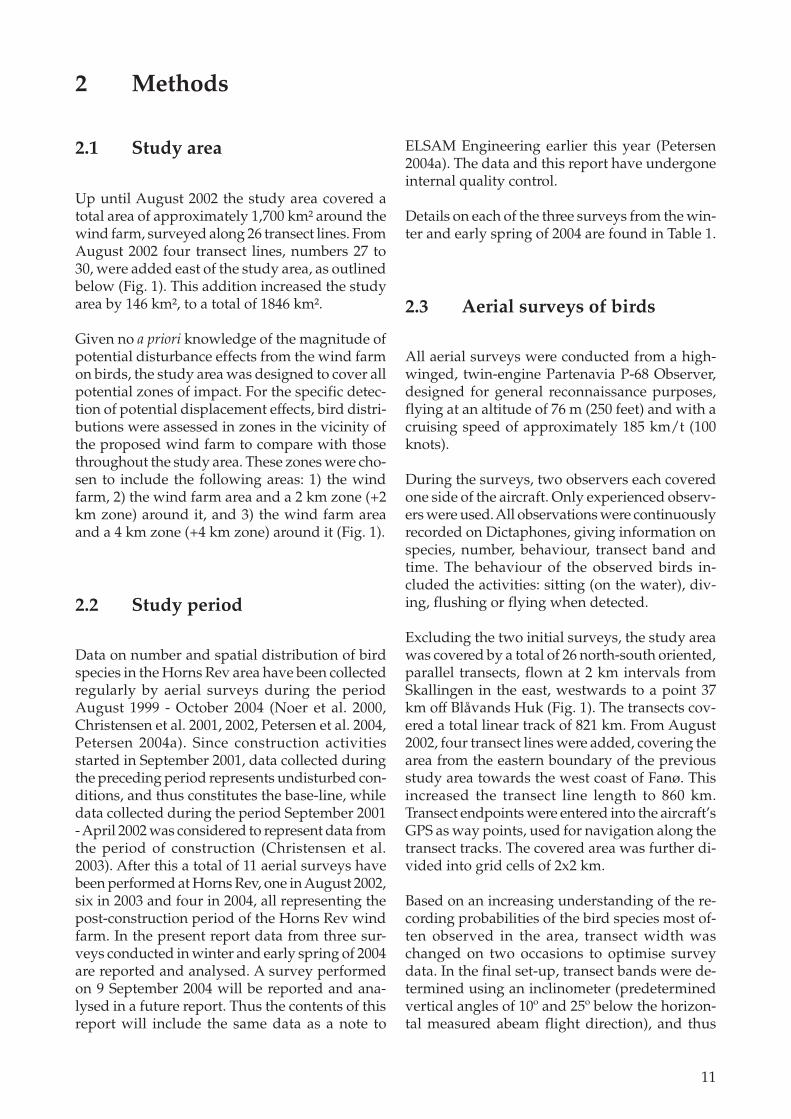
2.1 Study area
Up until August 2002 the study area covered atotal area of approximately 1,700 km² around thewind farm, surveyed along 26 transect lines. FromAugust 2002 four transect lines, numbers 27 to30, were added east of the study area, as outlinedbelow (Fig. 1). This addition increased the studyarea by 146 km², to a total of 1846 km².
Given no a priori knowledge of the magnitude ofpotential disturbance effects from the wind farmon birds, the study area was designed to cover allpotential zones of impact. For the specific detec-tion of potential displacement effects, bird distri-butions were assessed in zones in the vicinity ofthe proposed wind farm to compare with thosethroughout the study area. These zones were cho-sen to include the following areas: 1) the windfarm, 2) the wind farm area and a 2 km zone (+2km zone) around it, and 3) the wind farm areaand a 4 km zone (+4 km zone) around it (Fig. 1).
2.2 Study period
Data on number and spatial distribution of birdspecies in the Horns Rev area have been collectedregularly by aerial surveys during the periodAugust 1999 - October 2004 (Noer et al. 2000,Christensen et al. 2001, 2002, Petersen et al. 2004,Petersen 2004a). Since construction activitiesstarted in September 2001, data collected duringthe preceding period represents undisturbed con-ditions, and thus constitutes the base-line, whiledata collected during the period September 2001- April 2002 was considered to represent data fromthe period of construction (Christensen et al.2003). After this a total of 11 aerial surveys havebeen performed at Horns Rev, one in August 2002,six in 2003 and four in 2004, all representing thepost-construction period of the Horns Rev windfarm. In the present report data from three sur-veys conducted in winter and early spring of 2004are reported and analysed. A survey performedon 9 September 2004 will be reported and ana-lysed in a future report. Thus the contents of thisreport will include the same data as a note to
ELSAM Engineering earlier this year (Petersen2004a). The data and this report have undergoneinternal quality control.
Details on each of the three surveys from the win-ter and early spring of 2004 are found in Table 1.
2.3 Aerial surveys of birds
All aerial surveys were conducted from a high-winged, twin-engine Partenavia P-68 Observer,designed for general reconnaissance purposes,flying at an altitude of 76 m (250 feet) and with acruising speed of approximately 185 km/t (100knots).
During the surveys, two observers each coveredone side of the aircraft. Only experienced observ-ers were used. All observations were continuouslyrecorded on Dictaphones, giving information onspecies, number, behaviour, transect band andtime. The behaviour of the observed birds in-cluded the activities: sitting (on the water), div-ing, flushing or flying when detected.
Excluding the two initial surveys, the study areawas covered by a total of 26 north-south oriented,parallel transects, flown at 2 km intervals fromSkallingen in the east, westwards to a point 37km off Blåvands Huk (Fig. 1). The transects cov-ered a total linear track of 821 km. From August2002, four transect lines were added, covering thearea from the eastern boundary of the previousstudy area towards the west coast of Fanø. Thisincreased the transect line length to 860 km.Transect endpoints were entered into the aircraft’sGPS as way points, used for navigation along thetransect tracks. The covered area was further di-vided into grid cells of 2x2 km.
Based on an increasing understanding of the re-cording probabilities of the bird species most of-ten observed in the area, transect width waschanged on two occasions to optimise surveydata. In the final set-up, transect bands were de-termined using an inclinometer (predeterminedvertical angles of 10º and 25º below the horizon-tal measured abeam flight direction), and thus
2 Methods

12
included three bands on each side of the aircraft.Beneath the aircraft, a band of 44 m on each sideof the flight track could not be observed. Transectwidths for the individual surveys are shown inTable 1.
During the aerial surveys a computer loggedflight track data from a differential GPS at fivesecond intervals. Each record contained longi-tude, latitude and time. Accuracy of GPS longi-tude and latitude was normally considered to bewithin 2 m.
In situations where the GPS failed during track-
logging, positions of each bird observation werecalculated by interpolation. In these cases the spa-tial accuracy of the observation data is slightlyreduced. In 2003 there was GPS coverage through-out during all surveys but on 23 April, where cov-erage failed along 240 km of the easternmosttransect lines.
The majority of records were considered to havea temporal accuracy to within four seconds. Witha flight speed of 185 km/h the positional accu-racy on the longitudinal axis was within 206 m.In the few situations where observers encoun-tered high bird densities, grouping of observa-
SurveyNumber Date Band A Band B Band C
Km TransectCovered
1 19990803 44-250 m >250 m 1,492
2 19990903 44-163 m 163-432 m 432-1,000 m 1,417
3 19991112 44-163 m 163-432 m 432-1,000 m 1,488
4 20000217 44-163 m 163-432 m 432-1,000 m 1,653
5 20000221 44-163 m 163-432 m 432-1,000 m 1,148
6 20000319 44-163 m 163-432 m 432-1,000 m 1,611
7 20000427 44-163 m 163-432 m 432-1,000 m 1,476
8 20000821 44-163 m 163-432 m 432-1,000 m 1,475
9 20001006 44-163 m 163-432 m 432-1,000 m 1,411
10 20001222 44-163 m 163-432 m 432-1,000 m 1,224
11 20010209 44-163 m 163-432 m 432-1,000 m 1,509
12 20010320 44-163 m 163-432 m 432-1,000 m 1,636
13 20010421 44-163 m 163-432 m 432-1,000 m 1,473
14 20010822 44-163 m 163-432 m 432-1,000 m 1,637
15 20010926 44-163 m 163-432 m 432-1,000 m 1,523
16 20020107 44-163 m 163-432 m 432-1,000 m 1,370
17 20020312 44-163 m 163-432 m 432-1,000 m 1,456
18 20020409 44-163 m 163-432 m 432-1,000 m 1,355
19 20020808 44-163 m 163-432 m 432-1,000 m 1,370
20 20030213 44-163 m 163-432 m 432-1,000 m 1,291
21 20030316 44-163 m 163-432 m 432-1,000 m 1,696
22 20030423 44-163 m 163-432 m 432-1,000 m 1,716
23 20030905 44-163 m 163-432 m 432-1,000 m 1,573
24 20031204 44-163 m 163-432 m 432-1,000 m 1,392
25 20031230 44-163 m 163-432 m 432-1,000 m 1,269
26 20040229 44-163 m 163-432 m 432-1,000 m 1,741
27 20040326 44-163 m 163-432 m 432-1,000 m 1,735
28 20040510 44-163 m 163-432 m 432-1,000 m 1,730
29 20040909 44-163 m 163-432 m 432-1,000 m 1,582
Table 1. Summary details of the 28 aerial surveys carried out in the study area, August 1999-May 2004. Tableshows the dates when the surveys were carried out, the different transect widths used on different aerialsurvey dates, and the total distance of transect surveyed (including counts from both sides of the aircraft).

13
tions in periods of up to 10 seconds have occurred,leading to an accuracy of observation position-ing of up to 515 m.
As the detection probability of birds are highlysensitive to weather conditions, surveys were notinitiated when wind speed exceeded 6 m/s. Lowvisibility or glare also reduced detectability. Incases of severe glare, observations from one sideof the aircraft were temporarily discontinued.Military activity prevented full coverage of thenortheastern part of the study area on some sur-veys. The survey coverage of the study area in2004 is shown in Fig. 2.
2.3.1 Aerial surveys between wind turbines
At the time of the aerial survey in August 2002,all turbines in the wind farm had been erected.This necessitated a slight modification of the sur-vey transect lines, in order to avoid turbines. Thesurvey altitude was 76 m, while height to highestturbine wing tip is 110 m.
Because of engineering activities in the wind farmarea, the aircraft was not allowed to fly betweenthe turbines during the survey of August 2002. Insubsequent surveys of the wind farm area, sur-veys were undertaken at 76 m, along the modi-fied transect lines (Fig. 1).
2.4 Data analyses
After transcription of observation data and flighttrack data into spreadsheet tables, a combinationof ArcView GIS and TurboPascal software wasused to geo-reference each observation and toassign observations to transect band and side offlight track.
For each survey, distribution maps were producedfor each of the relevant bird species showing lo-cation and size of observed flocks. Total bird num-bers in each survey were obtained from simpleaddition of all observations and in comparisonbetween different surveys, bird numbers werecorrected for survey effort.
For all relevant species, distribution maps basedon pooled data from all 28 surveys conductedduring the baseline and construction periods arepresented for the study area summarised at a reso-lution of 2x2 km. The maps are corrected for vari-ation in survey coverage.
Presentation of bird densities is coupled withmethodological problems related to varying cov-erage of transects, varying transect length, as wellas from a decreasing probability of detecting abird with increasing distance to the aircraft (seeNoer et al. 2000 for a more detailed discussion)that have not been corrected for. Therefore, theanalyses are based on the observed numbers anddescribe relative densities.
To assess the number of birds of the different spe-cies that would be susceptible to potential dis-turbance effects from the wind turbines, and toassess the importance of the wind farm area andthe adjacent waters, we describe bird preferencefor the wind farm area and different adjacentzones of potential impact relative to their prefer-ence for the whole study area. This was done forthe 7 pre-construction surveys performed be-tween February and May, and similarly for 6 post-construction surveys performed during the sametime of year. For these zones the preference of themost numerously occurring species was calcu-lated using Jacobs selectivity index (Jacobs 1974).
Jacobs selectivity index (D) varies between -1 (allbirds present outside the area of interest) and +1(all birds inside the area of interest), and is calcu-lated as:
Wind turbines
Survey coverage(km/gridcell)
0.314 - 1.132 1.132 - 4.778 4.778 - 7.152 7.152 - 9.862 9.862 - 12.124
Horns Rev 10 m depth contourN
0 5 10 km
Figure 2. Transect length survey effort (in km) per 2 x 2km grid squares in the study area, summed for threesurveys performed in 2004. See text for details.

14
( )( )rppr
prD2−+
−=
where r = the proportion of birds in the area ofinterest compared to the birds in the whole studyarea, and p = the proportion of the transect lengthin the area of interest compared to the totaltransect length in the whole study area.
The difference between the two proportions istested as the difference between the observednumber of birds in the area of interest and thenumber expected in this area, estimated from theproportion of the length of transect in relation totransect length in the total area (one-sample χ2-test). In this report, tests were made on the basisof numbers of observed clusters. For some spe-cies a cluster can hold a wide range of number ofindividual birds, from 1 to 26,000 in the case ofCommon Scoter. Results from tests based onnumber of clusters are used for comparison of pre-construction and post-construction in this report.Results based on tests on number of individualsare was also made and presented, regardless ofthe fact that birds observed as groups (clusters)does not meet the criteria of being independent.Results from these latter tests are only used when
explicitly stating that they are based on numberof observed birds.
A comparison of pre- and post-construction D-values and preference for these zones was usedto describe changes in the bird utilisation of thezones.
2.5 Quality control
All observations of birds during the aerial sur-veys were recorded on a Dictaphone. During sub-sequent transcription unusual data were under-lined or commented to make a later exclusion oferroneous data possible. After being computer-ised into databases, all records were checked onceagain to identify errors during this procedure.
The present report is subject to the following qual-ity control:
• internal scientific review by a senior researcher• internal editorial and linguistic revision• internal proof-reading and spell check• layout followed by proof-reading• approval by project managers.

15
3.1 Bird numbers anddistributions in the HornsRev area
A total of four aerial surveys were conducted inthe Horns Rev study area in 2004. Three of these,carried out on 29 February, 26 March and 10 May,are reported and analysed in this report, whileone survey of 9 September will be reported in afuture report.
Bird species and numbers recorded during thethree aerial surveys in the Horns Rev study areain the winter/spring of 2004 are presented in Ta-ble 2. Species recorded in low numbers or withlittle relevance in a conservation context are ex-cluded from the table. The total number of birdsthat were recorded during the 28 aerial surveysduring August 1999 - May 2004 is shown in Ap-pendix I, although a few observations oftersrestrial species are omitted.
3 Results
Species Total29 Feb2004
26 Mar2004
10 May2004
9 Sept2004
Diver sp. 320 225 74 21
Red-throated Diver 373 63 293 17
Black-throated Diver 11 8 3
Grebe sp. 1 1
Fulmar 43 16 4 23
Gannet 408 1 15 392
Cormorant 1 1
Long-tailed Duck 2 1 1
Eider 913 566 292 55
Common Scoter 95270 42260 42312 10698
Velvet Scoter 233 139 30 64
Red-breasted Merganser 1 1
Skua sp. 3 3
Herring Gull 4423 3644 566 213
Lesser Black-backed Gull 2 1 1
Great Black-backed Gull 187 14 11 162
Black-headed Gull 1 1
Little Gull 131 60 71
Kittiwake 350 50 280 20
Gull sp. 572 131 269 172
Common Tern 2 2
Arctic/Common Tern 344 344
Sandwich Tern 34 34
Tern sp. 47 47
Razorbill 27 27
Razorbill/Guillemot 169 89 79 1
8
1
7
41
7
2715
40
2
2438
5
34
7
1
24
44
5
8
7
32
Guillemot 27 27
Table 2. Listing of the total number of birds recorded during three aerial surveys of the study area carried outin the winter/spring of 2004. Only those species of particular significance are provided in the table, num-bers of less common species can be found in Appendix I.

16
Some closely related species occurring within thestudy area are very similar in plumage and diffi-
cult to identify to species level during the aerialsurveys. These include:
- Red- and Black-throated Diver,- Arctic and Common Tern,- Guillemot and Razorbill.
It is supposed that the species within these groupsare impacted to the same degree and thereforelumped into groups in the following analyses.
In 2004 the most numerously recorded bird spe-cies in the study area was Common Scoter, with95,270 observed individuals. The second mostnumerous species was Herring Gull, with 4,423observed individuals (Table 2).
3.1.1 Red- and Black-throated Diver Gaviastellata/arctica
A total of 3,338 divers were observed during the28 surveys (Appendix I).
During the three winter/spring surveys of 2004a total of 704 divers were recorded (Table 2). Ofthese 666 were counted during the February andMarch surveys. Of the 704 divers recorded in 200445% were unidentified diver sp., while 53% werered-throated diver and 2% were black-throateddiver.
Concentrations were observed in the southwest-ern and western parts of the study area on 29 Feb-ruary 2004, while on 26 March most birds wererecorded in the northwestern and southwesternparts of the study area (Fig. 3a-b). The generaldistribution pattern was similar to that observedduring the surveys performed before 2004, al-
N 1 2 3 - 5 6 - 10 11 - 17
Single sideBoth sidesWind turbinesStudy area10 m depth contour
Observations
Survey track lines
0 5 10 kmA
B
Figure 3. Distribution map of diver observations in thestudy area on A) 29 February 2004 and B) 26 March2004. Turbine positions are shown. Thin blue linesidentify track lines flown with coverage on both sidesof the aircraft, yellow lines those with observationsfrom only one side of the aircraft.
Figure 4. Cumulative distribution map of diver obser-vations in the study area, based on 25 aerial surveysbetween August 1999 and December 2003. Data areexpressed as relative density measured as observationsper kilometre of flown transect coverage for each sur-vey in each 2 x 2 km grid square.
Wind turbines
Relative density(No.km-1 survey track)
0.01 - 0.0570.057 - 0.1330.133 - 0.2610.261 - 0.470.47 - 0.798
10 m depth contour
0 5 10 km
N

17
though no concentration of divers was observedclose to Blåvands Rev this year (Fig. 4).
3.1.2 Gannet Sula bassana
A total of 1,075 Gannets has been recorded dur-ing the 28 surveys. Of these 408 were recorded inwinter/spring of 2004, of which 392 were re-corded on 10 May (Table 2 and Appendix I).
The Gannet is an offshore species, feeding on pel-agic fish. In winter/spring of 2004 most birdswere observed in the eastern part of the studyarea, particularly at Blåvands Rev, close to thecoast of Jutland (Fig. 5a-b). This distribution pat-tern was strikingly different from the general pat-tern, as observed for the previous 25 surveys (Fig.6). 96% of the gannets recorded in 2004 were ob-served on 10 May, when many birds were gath-ered close to land.
3.1.3 Eider Somateria mollissima
A total of 19,057 Eiders has been recorded duringthe 28 surveys at Horns Rev. Of these 913 birdswere recorded in winter/spring of 2004 (Table 2and Appendix I).
Eider is an inshore diving duck, mainly feedingon epifauna molluscs. In 2004 Eiders were re-corded in all three surveys, being most numer-ous in February 2004 with 566 individuals. Theirdistribution was mainly confined to the coastalareas off Skallingen and Fanø (Fig. 7a-b), withonly very few observations further offshore,southeast and west of the wind farm. Thus, thegeneral distribution pattern observed in 2004closely resembles the overall distribution patternof the species, based on data from 25 surveys con-ducted between 1999 and 2004 (Fig. 8).
N 1 - 3 4 - 8 9 - 15 16 - 40 41 - 120
Single sideBoth sidesWind turbinesStudy area10 m depth contour
Observations
Survey track lines
0 5 10 kmA
B
Figure 5. Distribution map of Gannet observations inthe study area on A) 26 March 2004 and B) 10 May2004. Turbine positions are shown. Thin blue linesidentify track lines flown with coverage on both sidesof the aircraft, yellow lines those with observationsfrom only one side of the aircraft.
Figure 6. Cumulative distribution map of Gannet ob-servations in the study area, based on 25 aerial sur-veys between August 1999 and December 2003. Dataare expressed as relative density measured as obser-vations per kilometre of flown transect coverage foreach survey in each 2 x 2 km grid square.
Wind turbines
Relative density(No.km-1 survey track)
0.01 - 0.0270.027 - 0.0760.076 - 0.1730.173 - 0.3810.381 - 0.799
10 m depth contour
0 5 10 km
N

18
3.1.4 Common Scoter Melanitta nigra
A total of 814,715 Common Scoters has been re-corded during the 28 surveys, making this spe-cies far the most numerous in the study area. Ofthese 95,270 individuals were recorded in win-ter/spring of 2004 (Table 2 and Appendix I).
Common Scoter is a diving duck, mainly feedingon infauna molluscs in soft substrates. On the twosurveys of 29 February and 26 March the major-ity of common scoters were observed along thecoast of Skallingen and Fanø. On both surveys aconcentration of common scoters was observednorthwest of Blåvands Huk, on the northern slopeof Blåvands Rev (Fig. 9a-b). In the southeasternarea of Horns Rev, immediately southeast of thewind farm, where a concentration of commonscoters was found prior to construction of thewind farm, almost no birds were recorded. Onboth surveys common scoters were observed inthe westernmost parts of Horns Rev, and particu-larly on 26 March with high numbers of birds allalong the extension of the reef. On 29 February aconcentration was seen close to the northwest-ern corner of the wind farm. The number of com-mon scoters was reduced at the time of the sur-vey on 10 May (Fig 9c). This time of year the birdsleave for the breeding grounds. On this surveyconcentrations were seen north of Blåvands Huk,close to the northwestern corner of the wind farmand smaller numbers along the northern parts ofSkallingen.
Thus the distribution pattern of common scoterduring the winter and spring of 2004 was mark-edly different from that observed during previ-ous years of investigation (Fig. 10). The core arearemain coastal parts off Skallingen and Fanø, but
N 1 - 3 4 - 8 9 - 25 26 - 50 51 - 100
Single sideBoth sidesWind turbinesStudy area10 m depth contour
Observations
Survey track lines
0 5 10 kmA
B
Figure 7. Distribution map of Eider observations in thestudy area on A) 29 February 2004 and B) 26 March2004. Turbine positions are shown. Thin blue linesidentify track lines flown with coverage on both sidesof the aircraft, yellow lines those with observationsfrom only one side of the aircraft.
Figure 8. Cumulative distribution map of Eider obser-vations in the study area, based on 25 aerial surveysbetween August 1999 and December 2003. Data areexpressed as relative density measured as observationsper kilometre of flown transect coverage for each sur-vey in each 2 x 2 km grid square.
Wind turbines
Relative density(No.km-1 survey track)
0.01 - 0.893 0.893 - 3.389 3.389 - 8.995 8.995 - 17.051 17.051 - 24.358
10 m depth contour
0 5 10 km
N

19
Horns Rev has become much more importantthan previously observed for this species. This is
also the case for an area on the northern slopes ofBlåvands Rev. Despite the fact that Horns Rev hasbecome more important to common scoters thesoutheastern area of the reef, that previously heldhigh numbers of birds in early spring, seems tohave lost its importance. This is most likely causedby the intense boat traffic associated with thewind farm in this area and the fact that the im-mediate areas east and south of there had wa-ter depth greater than the optimal depth for thisspecies. Common scoters hardly utilise the windfarm area at all, but had a permanent concentra-tion close to the northwestern corner of the windfarm. In this area birds were recorded closer tothe wind turbines than was the case during theconstruction phase and the first year of the op-erational phase.
3.1.5 Herring Gull Larus argentatus
A total of 37,838 Herring Gulls has been recordedduring the 28 surveys. Of these 4,423 were re-corded during the three winter/spring surveysof 2004, of which far most birds (3,644) were re-corded on 29 February (Table 2 and Appendix I).
In 2004, Herring Gulls were observed in mostparts of the survey area. On 29 February, whenmost birds were present, concentrations were seenin the southwestern and northwestern areas, andmoderate numbers in the coastal parts (Fig. 11a).
N 1 - 25 26 - 120 121 - 300 301 - 800 800 - 2500
Single sideBoth sidesWind turbinesStudy area10 m depth contour
Observations
Survey track lines
0 5 10 kmA
B
C
Figure 9. Distribution map of Common Scoter obser-vations in the study area on A) 29 February 2004, B)26 March 2004 and C) 10 may 2004. Turbine positionsare shown. Thin blue lines identify track lines flownwith coverage on both sides of the aircraft, yellow linesthose with observations from only one side of the air-craft
Wind turbines
Relative density(No.km-1 survey track)
0.01 - 20.161 20.161 - 70.447 70.447 - 140.251 140.251 - 200.708 200.708 - 1660.754
10 m depth contour
0 5 10 km
N
Figure 10. Cumulative distribution map of CommonScoter observations in the study area, based on 25aerial surveys between August 1999 and December2003. Data are expressed as relative density measuredas observations per kilometre of flown transect cover-age for each survey in each 2 x 2 km grid square.
20
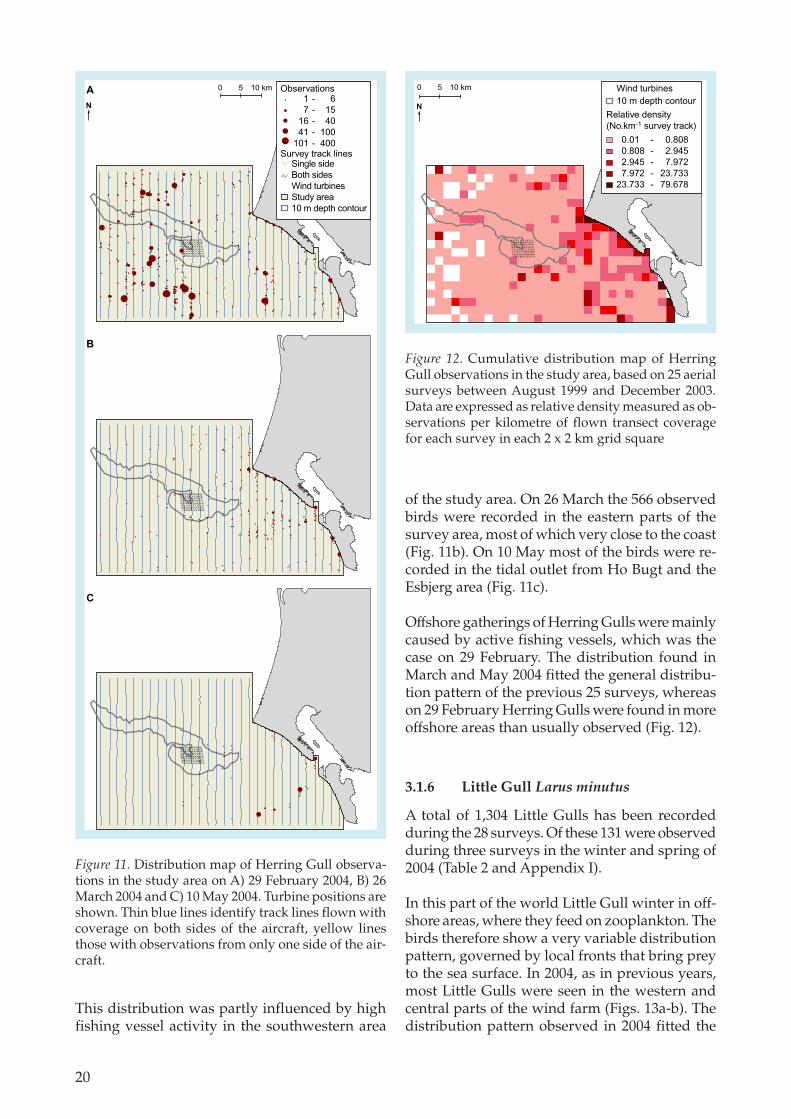
This distribution was partly influenced by highfishing vessel activity in the southwestern area
of the study area. On 26 March the 566 observedbirds were recorded in the eastern parts of thesurvey area, most of which very close to the coast(Fig. 11b). On 10 May most of the birds were re-corded in the tidal outlet from Ho Bugt and theEsbjerg area (Fig. 11c).
Offshore gatherings of Herring Gulls were mainlycaused by active fishing vessels, which was thecase on 29 February. The distribution found inMarch and May 2004 fitted the general distribu-tion pattern of the previous 25 surveys, whereason 29 February Herring Gulls were found in moreoffshore areas than usually observed (Fig. 12).
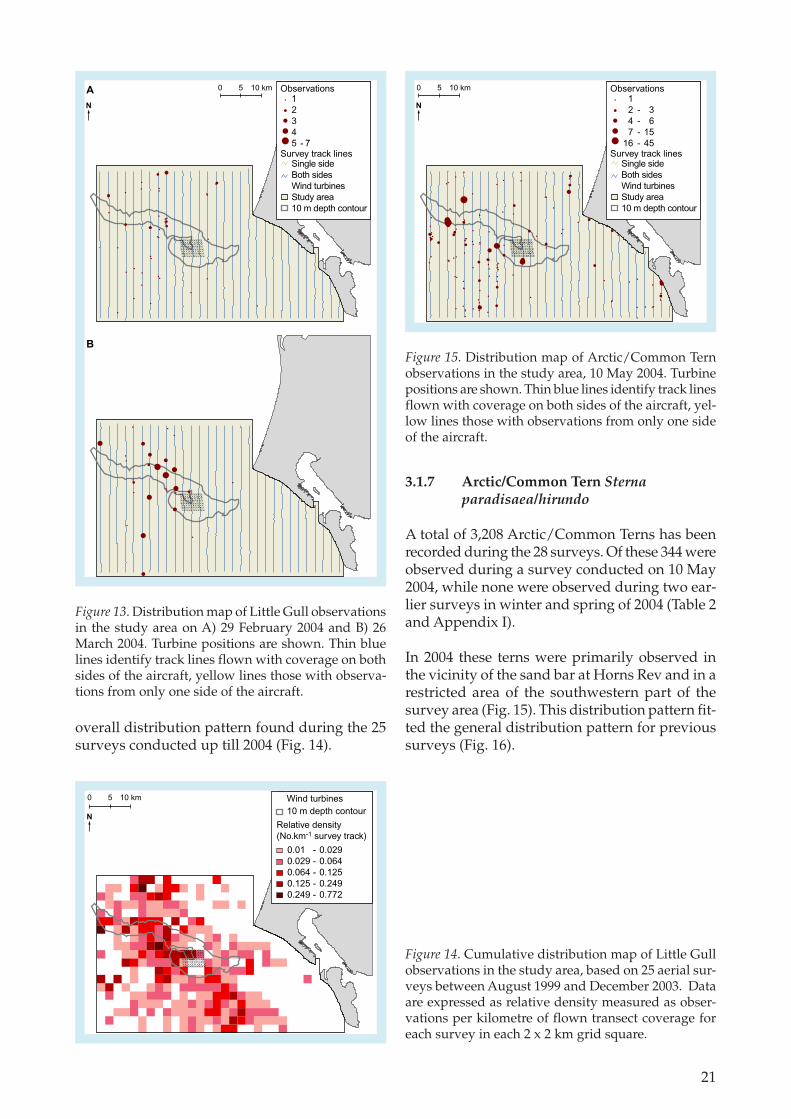
3.1.6 Little Gull Larus minutus
A total of 1,304 Little Gulls has been recordedduring the 28 surveys. Of these 131 were observedduring three surveys in the winter and spring of2004 (Table 2 and Appendix I).
In this part of the world Little Gull winter in off-shore areas, where they feed on zooplankton. Thebirds therefore show a very variable distributionpattern, governed by local fronts that bring preyto the sea surface. In 2004, as in previous years,most Little Gulls were seen in the western andcentral parts of the wind farm (Figs. 13a-b). Thedistribution pattern observed in 2004 fitted the
N 1 - 6 7 - 15 16 - 40 41 - 100 101 - 400
Single sideBoth sidesWind turbinesStudy area10 m depth contour
Observations
Survey track lines
0 5 10 kmA
B
C
Figure 11. Distribution map of Herring Gull observa-tions in the study area on A) 29 February 2004, B) 26March 2004 and C) 10 May 2004. Turbine positions areshown. Thin blue lines identify track lines flown withcoverage on both sides of the aircraft, yellow linesthose with observations from only one side of the air-craft.
Wind turbines
Relative density(No.km-1 survey track)
0.01 - 0.808 0.808 - 2.945 2.945 - 7.972 7.972 - 23.733 23.733 - 79.678
10 m depth contour
0 5 10 km
N
Figure 12. Cumulative distribution map of HerringGull observations in the study area, based on 25 aerialsurveys between August 1999 and December 2003.Data are expressed as relative density measured as ob-servations per kilometre of flown transect coveragefor each survey in each 2 x 2 km grid square
21
overall distribution pattern found during the 25surveys conducted up till 2004 (Fig. 14).
3.1.7 Arctic/Common Tern Sternaparadisaea/hirundo
A total of 3,208 Arctic/Common Terns has beenrecorded during the 28 surveys. Of these 344 wereobserved during a survey conducted on 10 May2004, while none were observed during two ear-lier surveys in winter and spring of 2004 (Table 2and Appendix I).
In 2004 these terns were primarily observed inthe vicinity of the sand bar at Horns Rev and in arestricted area of the southwestern part of thesurvey area (Fig. 15). This distribution pattern fit-ted the general distribution pattern for previoussurveys (Fig. 16).
N12345 - 7
Single sideBoth sidesWind turbinesStudy area10 m depth contour
Observations
Survey track lines
0 5 10 kmA
B
Figure 13. Distribution map of Little Gull observationsin the study area on A) 29 February 2004 and B) 26March 2004. Turbine positions are shown. Thin bluelines identify track lines flown with coverage on bothsides of the aircraft, yellow lines those with observa-tions from only one side of the aircraft.
Figure 14. Cumulative distribution map of Little Gullobservations in the study area, based on 25 aerial sur-veys between August 1999 and December 2003. Dataare expressed as relative density measured as obser-vations per kilometre of flown transect coverage foreach survey in each 2 x 2 km grid square.
Wind turbines
Relative density(No.km-1 survey track)
0.01 - 0.029 0.029 - 0.064 0.064 - 0.125 0.125 - 0.249 0.249 - 0.772
10 m depth contour
0 5 10 km
N
N 1 2 - 3 4 - 6 7 - 15 16 - 45
Single sideBoth sidesWind turbinesStudy area10 m depth contour
Observations
Survey track lines
0 5 10 km
Figure 15. Distribution map of Arctic/Common Ternobservations in the study area, 10 May 2004. Turbinepositions are shown. Thin blue lines identify track linesflown with coverage on both sides of the aircraft, yel-low lines those with observations from only one sideof the aircraft.

22
3.1.8 Guillemot Uria aalge/ Razorbill Alcatorda
A total of 1,824 Guillemots/Razorbills was re-corded during the 28 surveys. Of these 223 wererecorded in 2004 (Table 2 and Appendix I).
These alcid species mainly feed on pelagic fish.This means that they distribute according to con-centrations of suitable prey, which in turn is de-termined by hydrographic features of the sea.Therefore large variations in numbers as well asdistributions have been observed between sur-veys. Generally the study area does only coverthe fringe of the wider distribution of Guillemotsand Razorbills in the Danish part of the North
N1234 - 56 - 7
Single sideBoth sidesWind turbinesStudy area10 m depth contour
Observations
Survey track lines
0 5 10 kmA
B
Figure 17. Distribution map of Guillemot/Razorbillobservations in the study area on A) 29 February 2004and B) 26 march 2004. Turbine positions are shown.Thin blue lines identify track lines flown with cover-age on both sides of the aircraft, yellow lines thosewith observations from only one side of the aircraft.
Figure 16. Cumulative distribution map of Arctic/Common Tern observations in the study area, basedon 25 aerial surveys between August 1999 and Decem-ber 2003. Data are expressed as relative density meas-ured as observations per kilometre of flown transectcoverage for each survey in each 2 x 2 km grid square.
Wind turbines
Relative density(No.km-1 survey track)
0.01 - 0.092 0.092 - 0.242 0.242 - 0.597 0.597 - 1.158 1.158 - 2.851
10 m depth contour
0 5 10 km
N
Wind turbines
Relative density(No.km-1 survey track)
0.01 - 0.040.04 - 0.0940.094 - 0.1840.184 - 0.3930.393 - 0.794
10 m depth contour
0 5 10 km
N
Figure 18. Cumulative distribution map of Guillemot/Razorbill observations in the study area, based on 25aerial surveys between August 1999 and December2003. Data are expressed as relative density measuredas observations per kilometre of flown transect cover-age for each survey in each 2 x 2 km grid square.
23
Sea. In 2004, the birds were mainly found in thesouthwestern and southern parts of the studyarea, with concentrations also seen in the north-western parts of the area (Fig. 17a-b), which issimilar to the overall distribution pattern of theprevious 25 surveys (Fig. 18).
3.2 Utilisation of the Horns Revwind farm area andsurroundings by birds, pre-and post erection of windturbines
A total of 28 surveys of birds has been carried outin the Horns Rev area between August 1999 andMay 2004. The wind farm construction phase wasinitiated in September 2001, but no constructionactivities took place between October 2001 andMarch 2002. Thus a total of 16 aerial surveys wereperformed during the pre-construction period.The operation (post-construction) phase startedin late autumn of 2002, and thus the first aerialsurvey data obtained during wind farm opera-tion was in February 2003. A total of 9 surveys
from 2003 and 2004, the operational phase of thewind farm, are available. In order to optimisecomparison between the pre- and post-con-struction data set analyses below have been car-ried out on the basis of 7 pre-construction sur-veys and 6 post-construction surveys, all per-formed between February and May (see Table1).
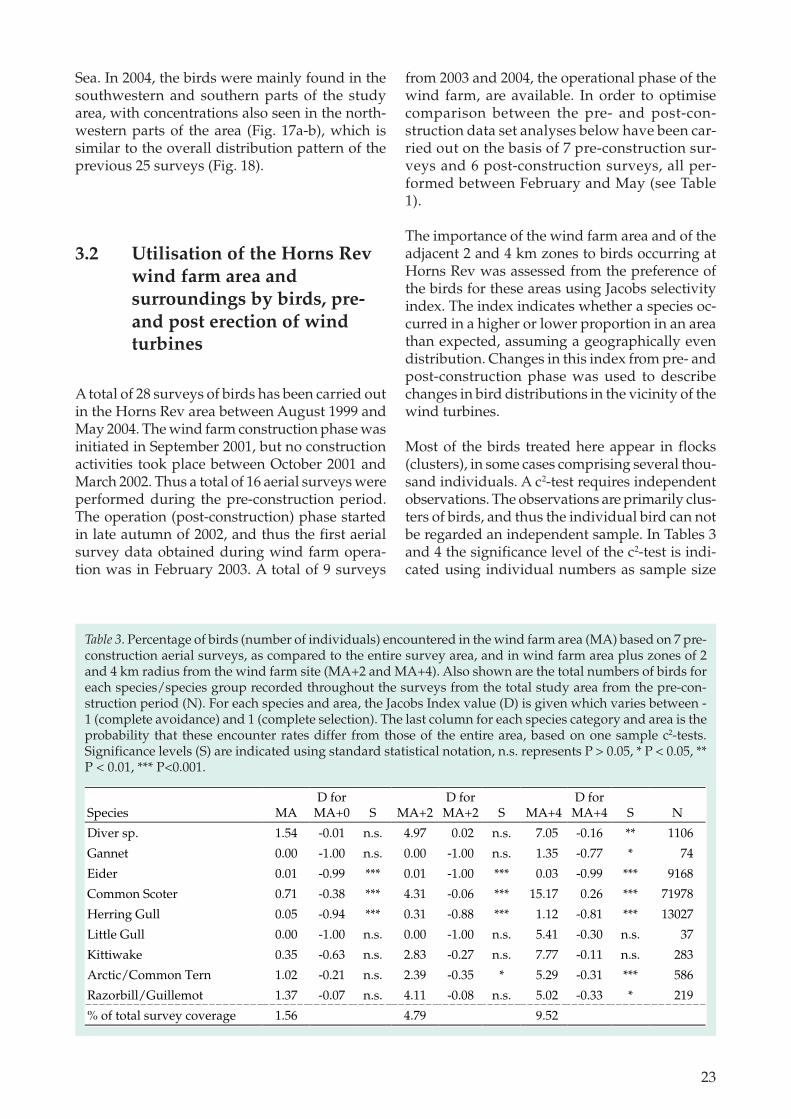
The importance of the wind farm area and of theadjacent 2 and 4 km zones to birds occurring atHorns Rev was assessed from the preference ofthe birds for these areas using Jacobs selectivityindex. The index indicates whether a species oc-curred in a higher or lower proportion in an areathan expected, assuming a geographically evendistribution. Changes in this index from pre- andpost-construction phase was used to describechanges in bird distributions in the vicinity of thewind turbines.
Most of the birds treated here appear in flocks(clusters), in some cases comprising several thou-sand individuals. A c2-test requires independentobservations. The observations are primarily clus-ters of birds, and thus the individual bird can notbe regarded an independent sample. In Tables 3and 4 the significance level of the c2-test is indi-cated using individual numbers as sample size
Table 3. Percentage of birds (number of individuals) encountered in the wind farm area (MA) based on 7 pre-construction aerial surveys, as compared to the entire survey area, and in wind farm area plus zones of 2and 4 km radius from the wind farm site (MA+2 and MA+4). Also shown are the total numbers of birds foreach species/species group recorded throughout the surveys from the total study area from the pre-con-struction period (N). For each species and area, the Jacobs Index value (D) is given which varies between -1 (complete avoidance) and 1 (complete selection). The last column for each species category and area is theprobability that these encounter rates differ from those of the entire area, based on one sample c2-tests.Significance levels (S) are indicated using standard statistical notation, n.s. represents P > 0.05, * P < 0.05, **P < 0.01, *** P<0.001.
Species MAD for
MA+0 S MA+2D for
MA+2 S MA+4D for
MA+4 S N
Diver sp. 1.54 -0.01 n.s. 4.97 0.02 n.s. 7.05 -0.16 ** 1106
Gannet 0.00 -1.00 n.s. 0.00 -1.00 n.s. 1.35 -0.77 * 74
Eider 0.01 -0.99 *** 0.01 -1.00 *** 0.03 -0.99 *** 9168
Common Scoter 0.71 -0.38 *** 4.31 -0.06 *** 15.17 0.26 *** 71978
Herring Gull 0.05 -0.94 *** 0.31 -0.88 *** 1.12 -0.81 *** 13027
Little Gull 0.00 -1.00 n.s. 0.00 -1.00 n.s. 5.41 -0.30 n.s. 37
Kittiwake 0.35 -0.63 n.s. 2.83 -0.27 n.s. 7.77 -0.11 n.s. 283
Arctic/Common Tern 1.02 -0.21 n.s. 2.39 -0.35 * 5.29 -0.31 *** 586
Razorbill/Guillemot 1.37 -0.07 n.s. 4.11 -0.08 n.s. 5.02 -0.33 * 219
% of total survey coverage 1.56 4.79 9.52

24
anyway, because weighting an observation of asingle Common Scoter equally with an observa-tion of, say, 10,000 Common Scoters seems un-wise. Parallel calculations, using clusters as thesample unit, are also presented (Tables 5 and 6).
3.2.1 Red- and Black-throated Diver Gaviastellata/arctica
During the pre-construction period divers wereencountered in the wind farm area and the two
Species MAD for
MA+0 S MA+2D for
MA+2 S MA+4D for
MA+4 S N
Diver sp. 0.00 -1.00 *** 0.12 -0.95 *** 0.99 -0.81 *** 1611
Gannet 0.00 -1.00 * 0.00 -1.00 *** 0.67 -0.87 *** 450
Eider 0.00 -1.00 *** 0.11 -0.96 *** 0.27 -0.94 *** 4730
Common Scoter 0.05 -0.93 *** 1.29 -0.56 *** 2.50 -0.58 *** 578233
Herring Gull 0.22 -0.74 *** 1.11 -0.61 *** 2.45 -0.59 *** 13298
Little Gull 0.24 -0.71 ** 7.02 0.24 *** 14.29 0.27 *** 826
Kittiwake 0.00 -1.00 * 4.92 0.06 n.s. 5.46 -0.25 * 366
Arctic/Common Tern 0.00 -1.00 ** 5.74 0.14 n.s. 11.83 0.16 * 575
Razorbill/Guillemot 0.00 -1.00 n.s. 0.97 -0.65 ** 1.94 -0.66 *** 309
% of total survey coverage 1.42 4.41 8.81
Table 4. Percentage of birds (number of individuals) encountered in the wind farm area (MA) based on 6post-construction aerial surveys, as compared to the entire survey area, and in wind farm area plus zones of2 and 4 km radius from the wind farm site (MA+2 and MA+4). Also shown are the total numbers of birds foreach species/species group recorded throughout the surveys from the total study area from the post-con-struction period (N). For each species and area, the Jacobs Index value (D) is given which varies between -1 (complete avoidance) and 1 (complete selection). The last column for each species category and area is theprobability that these encounter rates differ from those of the entire area, based on one sample χ2-tests.Significance levels (S) are indicated using standard statistical notation, n.s. represents P > 0.05, * P < 0.05, **P < 0.01, *** P < 0.001.
Species MAD for
MA+0 S MA+2D for
MA+2 S MA+4D for
MA+4 S N
Diver sp. 1.91 0.10 n.s. 5.18 0.04 n.s. 7.49 -0.13 n.s. 734
Gannet 0.00 -1.00 n.s. 0.00 -1.00 n.s. 2.63 -0.59 n.s. 38
Eider 0.29 -0.69 n.s. 0.29 -0.89 *** 0.58 -0.89 *** 345
Common Scoter 0.60 -0.45 ** 3.54 -0.16 * 10.55 0.06 n.s. 1327
Herring Gull 0.33 -0.66 *** 1.11 -0.63 *** 4.19 -0.41 *** 1529
Little Gull 0.00 -1.00 n.s. 0.00 -1.00 n.s. 10.53 0.06 n.s. 19
Kittiwake 0.71 -0.38 n.s. 3.55 -0.16 n.s. 9.93 0.02 n.s. 141
Arctic/Common Tern 1.53 -0.01 n.s. 3.45 -0.17 n.s. 8.43 -0.07 n.s. 261
Razorbill/Guillemot 1.22 -0.12 n.s. 3.66 -0.14 n.s. 4.88 -0.34 n.s. 164
% of total survey coverage 1.56 4.79 9.52
Table 5. Percentage of bird flocks (clusters) encountered in the wind farm area (MA) based on 7 pre-construc-tion aerial surveys, as compared to the entire survey area, and in wind farm area plus zones of 2 and 4 kmradius from the wind farm site (MA+2 and MA+4). Also shown are the total numbers of clusters for eachspecies/species group recorded throughout the surveys from the total study area from the pre-constructionperiod (N). For each species and area, the Jacobs Index value (D) is given which varies between -1 (completeavoidance) and 1 (complete selection). The last column for each species category and area is the probabilitythat these encounter rates differ from those of the entire area, based on one sample χ2-tests. Significancelevels (S) are indicated using standard statistical notation, n.s. represents P > 0.05, * P < 0.05, ** P < 0.01, ***P < 0.001.

25
zones around the farm at frequencies that did notdiffer significantly from the average in the entirestudy area. 7.5% of the observed diver groupswere recorded within 9.5% of the survey effort,giving rise to D-values of 0.10, 0.04 and –0.13 forthe three zones (Table 5). For the post-construc-tion period a marked avoidance of the wind farmarea, including also the 2 and 4 km zones aroundit, was noticed, with D values of –1.00, -0.91 and–0.69 for the windfarm area, the 2 and 4 km zones,respectively (Table 6). These results indicate anincreased avoidance of the wind farm area afterthe erection of the turbines. The overall numberof divers in the study area during the post-con-struction phase was high, compared to pre-con-struction surveys (Fig. 4a-b, Table 2 and Appen-dix I).
3.2.2 Gannet Sula bassana
Gannets were observed in the wind farm area andthe two zones around it in less than expectednumbers, assuming a geographically even distri-bution, both during pre- and post-constructionof the wind farm. There were no observations ofGannets in the wind farm area and the 2 km zonearound it pre- or post-construction. D-values forthe 4 km zone indicated a slightly increasedavoidance of the wind farm after erection of theturbines, with values going from -0.77 to -0.87 forthe four km zone (Tables 3 and 4). When testing
on cluster size (on number of flocks rather thannumber of individuals) this avoidance was notsignificant for any of the distance zones in the pre-construction period, and only significant for thefour km zone in the post-construction situation.Before drawing firm conclusions on the changesin selectivity for the wind farm and its surround-ings more data is needed for this species.
3.2.3 Eider Somateria mollissima
Eider showed a clear avoidance of the area of thewind farm and the two zones around it, both pre-and post-construction and calculated on numberof individuals as well as number of clusters. TheD-values differed very little between the pre- andpost-construction situation (Tables 3 to 6).
3.2.4 Common Scoter Melanitta nigra
The number of Common Scoters increased in thesurvey area from the 7 pre-construction surveysto the 6 post-construction surveys, with muchhigher numbers observed during the post-con-struction phase. Common Scoter were encoun-tered within the wind farm area, as well as the 2and 4 km zones around it, significantly less thanexpected, assuming a geographically even distri-bution, both prior to and following the erectionof the wind turbines.
Table 6. Percentage of bird flocks (clusters) encountered in the wind farm area (MA) based on 6 post-con-struction aerial surveys, as compared to the entire survey area, and in wind farm area plus zones of 2 and 4km radius from the wind farm site (MA+2 and MA+4). Also shown are the total numbers of clusters for eachspecies/species group recorded throughout the surveys from the total study area from the post-construc-tion period (N). For each species and area, the Jacobs Index value (D) is given which varies between -1(complete avoidance) and 1 (complete selection). The last column for each species category and area is theprobability that these encounter rates differ from those of the entire area, based on one sample χ2-tests.Significance levels (S) are indicated using standard statistical notation, n.s. represents P > 0.05, * P < 0.05, **P < 0.01, *** P < 0.001.
Species MAD for
MA+0 S MA+2D for
MA+2 S MA+4D for
MA+4 S NDiver sp. 0.00 -1.00 *** 0.22 -0.91 *** 1.73 -0.69 *** 924Gannet 0.00 -1.00 n.s. 0.00 -1.00 * 1.49 -0.73 ** 134Eider 0.00 -1.00 * 0.90 -0.67 ** 1.80 -0.68 *** 334Common Scoter 0.39 -0.57 *** 4.20 -0.03 n.s. 6.65 -0.15 *** 4885Herring Gull 1.55 0.04 n.s. 4.11 -0.04 n.s. 8.75 0.00 n.s. 1680Little Gull 0.51 -0.48 n.s. 7.11 0.25 * 16.75 0.35 *** 394Kittiwake 0.00 -1.00 n.s. 2.70 -0.25 n.s. 4.05 -0.39 n.s. 148Arctic/Common Tern 0.00 -1.00 n.s. 4.07 -0.04 n.s. 7.80 -0.07 n.s. 295Razorbill/Guillemot 0.00 -1.00 n.s. 1.10 -0.61 * 2.20 -0.62 ** 182% of total survey coverage 1.42 4.41 8.81

26
When calculating on the basis of clusters the de-gree of avoidance increased from the pre- to post-construction situation, going from a D value of-0.45 to -0.57 in the wind farm area itself. Whenincluding the two km zone around the wind farman increased selectivity was seen, with D-valuesfrom -0.16 to -0.03. For the four km zone the avoid-ance increased from 0.06 to -0.15. When calculat-ing on number of individuals the correspondingD value decreased from -0.38 to -0.93 in the windfarm area itself, from -0.06 to -0.56 when includ-ing the two km zone and from 0.26 to -0.58 whenincluding the four km zone.
In earlier reports a seasonal pattern has been de-scribed, with birds being concentrated close toland from September through until January/Feb-ruary, but showing a gradual movement towardsthe southeastern parts of Horns Rev from Marchthrough April (Christensen et al. 2003, Petersenet al. 2004). In March and April 2003 this generalmovement was again observed. However, therewas a general shift in distribution away from thearea southeast of the wind farm to areas west andparticularly north of the wind farm, into areaswhere very few Common Scoters had previouslybeen observed (Petersen et al. 2004). During thesurveys performed in 2004 this general patternwas maintained, with only few birds in the area
southeast of the wind farm and with a concentra-tion of birds around the northwestern corner ofthe wind farm. Thus a general shift in CommonScoter in the near vicinity of the wind farm wasobserved. During the pre-construction phase sur-veys from February to May most Common Scot-ers were observed southeast (120-140°) of thewind farm, with 46% of the birds recorded closerthan 4 km to the wind farm in the interval be-tween 120 and 130°. 90% of the birds were re-corded between 100 and 160° off the wind farm(Fig. 19). During the comparable post-construc-tion surveys a clear shift was noticed, with only11% of the birds in the interval 100-160°, while73% were recorded in the direction interval 280-330° (Figure 19).
At the same time Common Scoters did appear onHorns Rev, west of the wind farm, in the westernparts of the study area during surveys in Febru-ary and March 2004. Utilisation of these areas byCommon Scoter has not been noticed earlier.
A comparison of the pre- and post-constructionfrequency distribution of Common Scoter at in-creasing distances from the wind turbines wasmade, based on data from 7 pre-construction and6 post-construction surveys, all from the periodbetween February and May. Based on cumulativepercentages of bird numbers in each 500 m dis-tance interval away from the wind turbines, amarked reduction in post-construction utilisationof areas at distances of 2-8 km was noticed. Theimmediate surroundings of the wind farm, outto approximately 2 km showed less pronouncedchanges (Fig. 20). When performing the equiva-lent analysis on birds observed within 4 km ofthe turbines the result showed that the distanceinterval between 0 and 500 m from any turbinewas used by a slightly higher percentage of thebirds during pre-construction as compared to thepost-construction phase. In the increasing dis-tance intervals from 500 m to 4 km a higher per-centage of the birds were recorded during thepost-construction phase than during the pre-con-struction phase (Fig. 21).
A direct disturbance effect out to a distance of 8km from the turbines is regarded highly unlikely.An explanation for the above results (see Fig. 20)involves the patchiness of the habitat exploitedby Common Scoter. The species is also highly gre-garious, so birds tend to aggregate in local con-centrations in response to rich feeding patches,and probably react as groups to changes in local
20
40
6015
2535
45
55
65
75
85
95
105
115
125
135
145155
165175
5
185195205
215
225
235
245
255
265
275
285
295
305
315
325335
345355
Pre-construction Post-construction
Figure 19. Pre- and post-construction comparison ofCommon Scoter numbers in 10° direction bins aroundthe wind farm. Data were weighted by numbers andbased on birds observed within 4 km of the wind tur-bines in the months of February till May of 2000 and2001 (pre-construction and 2003 and 2004 (post-con-struction).

27
foraging success. Since substantial distances mayseparate these patches, responses to decliningfeeding success (including, for example, increasesin human disturbance) at one site may result inlocal abandonment of one area in favour of a dis-tant feeding area. These feeding areas may be lesssuitable than the original ones because food in-take rates are decreased as a result of increasedbird densities and hence competition, deeperwater or lower food quality (Nehls & Ketzenberg2002). The difference between the curves repre-senting pre- and post-construction distance inter-vals from the wind turbines at distances greaterthan 27 km is caused by the fact that the four ad-ditional transects situated close to Fanø, which
were surveyed in 2003 and 2004, contribute ob-servations in the distance classes between 27 to32 km from the wind farm (Fig. 20). These fourtransects were not covered during the pre-con-struction surveys, and no other part of the studyarea was further away than 27 km during thisperiod.
During observations of flight trajectories of birdsaround the Horns Rev wind farm in the spring of2003 and 2004 Common Scoters were observedto avoid flying between the wind turbines (Chris-tensen et al. 2004, Christensen & Hounisen 2004).When flying birds avoid the wind farm area, thiswill influence where birds settle to feet or rest.
0
25
50
75
100
% o
f tot
al
Pre-Construction Post-Construction
Distance Interval (m)
0-500 500-1000 1000-1500 1500-2000 2000-2500 2500-3000 3000-3500 3500-4000
Figure 21. Cumulated frequency distribution of distance to nearest wind turbine in 500 m intervals from obser-vations of Common Scoter, pre- and post-construction. Data were weighted by numbers and based on birdsobserved within 4 km of the wind turbines in the months of February till May of 2000 and 2001 (pre-construc-tion, red) and 2003 and 2004 (post-construction, blue).
0
25
50
75
100
0-50
0
1000
-150
0
2000
-250
0
3000
-350
0
4000
-450
0
5000
-550
0
6000
-650
0
7000
-750
0
8000
-850
0
9000
-950
0
1000
0-10
500
1100
0-11
500
1200
0-12
500
1300
0-13
500
1400
0-14
500
1500
0-15
500
1600
0-16
500
1700
0-17
500
1800
0-18
500
1900
0-19
500
2000
0-20
500
2100
0-21
500
2200
0-22
500
2300
0-23
500
2400
0-24
500
2500
0-25
500
2600
0-26
500
2700
0-27
500
2800
0-28
500
2900
0-29
500
3000
0-30
500
Distance Interval (m)
% o
f tot
alPre-Construction Post-Construction
Figure 20. Cumulated frequency distribution of distance to nearest wind turbine in 500 m intervals from obser-vations of Common Scoter, pre- and post-construction. Data were weighted by numbers and based on all birdsobserved within the study area in the months of February till May of 2000 and 2001 (pre-construction, red) and2003 and 2004 (post-construction, blue).

28
Thus the avoidance patterns shown by flyingbirds, are likely to contribute to the overall avoid-ance distance shown by the species when countedduring aerial survey.
The significant post-construction changes in dis-tribution of Common Scoter in the vicinity of thewind farm may be caused by several factors. Thephysical presence of the turbines is one majorpotential factor, but the increased boat traffic as-sociated with the maintenance of the wind farmespecially at enhanced levels immediately follow-ing construction could be another. However, anapparent general change in the distribution ofCommon Scoter across the study area, and par-ticularly the increased use of the western and cen-tral parts of Horns Rev, indicates that other fac-tors influence the observed changes. Such factorscould be the distribution of food resources in thestudy area. This seems especially likely given thatthe area north and west of the turbines had notbeen seen to be exploited in pre-construction sea-sons.
3.2.5 Herring Gull Larus argentatus
Herring Gulls showed an increased preference forthe wind farm area after erection of the turbines.Pre-construction D-values of -0.66, -0.63 and -0.41for the 0, 2 and 4 km zones around the farm werefound, with corresponding post-construction D-values of 0.04, -0.04 and 0.00 (Tables 5 and 6).When calculated on number of individuals thetendency for reduced avoidance of the wind farmarea was also found (Tables 3 and 4).
Herring Gulls, like other gull species, are attractedto human activities at sea. The increased post-construction preference for the wind farm areamay be caused by the presence of the wind tur-bines, but increased boat activity associated withthe maintenance of the turbines could be an ad-ditional factor. The observed post-constructionincreased preference for the wind farm area bythis species is consistent with similar analyses of
the period of the construction phase (Christen-sen et al. 2003).
3.2.6 Little Gull Larus minutus
Little Gull showed a shift from avoidance to pref-erence for the wind farm area. Due to the lownumber of records during the pre-constructionperiod the avoidance of the wind farm area failedto reach levels that were statistically significant.The result from post-construction surveys showeda significant preference for the 2 and 4 km zonesaround the wind farm. D-values based on clus-ters for the windfarm area increased from -1.00to 0.48, and similarly increased from -1.00 to 0.25when including the 2 km zone and from 0.06 to0.35 when including the 4 km zone. A similar ten-dency was observed when calculated on the ba-sis of individuals (Tables 3 to 6).
3.2.7 Arctic/Common Tern Sternaparadisaea/hirundo
Arctic/Common Tern showed a general avoid-ance of the wind farm area, both pre- and post-construction. Due to a low number of clustersduring the post-construction period the distribu-tion did not differ from the expected, assuming ageographically even distribution of these terns(Tables 3 to 6).
3.2.8 Guillemot Uria aalge / Razorbill Alcatorda
Guillemots/Razorbills showed an increasedavoidance of the wind farm area and the adja-cent zones, with pre-construction D-values, basedon clusters, of -0.12, -0.14 and -0.34 for the threedistance zones, as compared to post-constructionD-values of -1.00, -0.61 and -0.62 for the threezones (Tables 5 and 6). Similar increased post-con-struction avoidance was found when calculatingon the basis of individual birds (Tables 3 and 4).

29
4.1 Existing knowledge onhabitat loss or gain caused bywind turbines.
Until now the only study dealing with water-fowl/seabird habitat loss or gain resulting fromthe construction of marine wind farms was astudy concerning wintering Eiders at Tunø Knob,Denmark, where impacts out to a distance of 100-300 m were found. However, that study concen-trated upon only one less vulnerable species, Ei-der, considered relatively robust to disturbance,although they still show reactions to human andother activity (e.g. Christensen & Noer 2001).Furthermore that study involved an inshore windfarm consisting of only 10 small turbines in tworows (Guillemette et al. 1999).
At Horns Rev Divers, Common Scoter and Guil-lemot/Razorbill showed an increased avoidanceof the wind farm area after the erection of thewind turbines, including also zones of 2 and 4km around the wind farm. In contrast HerringGull, Little Gull and Arctic/Common Tern showedan increased preference for the wind farm area,while Great Black-backed Gull, Little Gull andArctic/Common Tern showed a general shiftfrom pre-construction avoidance to post-construc-tion preference for the wind farm area (Petersenet al. 2004). At the Nysted wind farm site southof Lolland initial comparisons of pre- and post-construction distribution of Long-tailed Duck andEider indicated a reduced preference for the windfarm site and its close vicinity during the post-construction phase, while Herring Gull showedincreased preference for the windfarm (Kahlertet al. 2004, Petersen 2004b).
4.2 Change in distribution ofCommon Scoter
Gradual changes in the general distribution ofCommon Scoter within the study area have pre-viously been described (Petersen et al. 2004). Thedata collected in winter and spring of 2004 con-firm a continued change in distribution. The
coastal areas west of Skallingen and Fanø stillcomprised the core area for the species, but shal-low offshore areas that were not previously uti-lised by Common Scoter held considerable num-bers in winter and spring of 2004. This was truefor Horns Rev, west of the wind farm as well asslightly deeper areas in the northern parts of thestudy area. Initially this change in distributionwas believed to be of a seasonal character, withbirds starting in coastal areas in autumn and earlywinter, gradually moving further offshore dur-ing February to April. It was speculated that thischange could be caused by local temporal abun-dance of favoured food resources, maybe the eggof Sandeel.
Results from aerial surveys in December 2003 tillMay 2004 indicate that this seasonal change wasnot apparent during this winter and spring, asbirds are found in the shallow offshore areasthroughout the winter season. The mechanismbehind this change is unknown. A sudden avail-ability of new food resources in these areas is theobvious explanation, most likely mollusc species,but the precise character of this is not clear.
In general the gross changes in Common Scoterdistribution are not believed to be caused by thepresence of the wind farm. Nevertheless there arestrong indications that common scoter did re-spond to the presence of the wind turbines andprobably also to the human activities associatedwith the wind farm. A reduced post-constructionpreference for the wind farm area gives an indi-cation. Secondly, the fact that the birds to a greatextent deserted the area southeast of the windfarm after the erection of the turbines, and a newconcentration appeared around the northwesterncorner of the wind farm, supports the conclusion.
4.3 Conclusions
During three aerial surveys of birds in the HornsRev study area Common Scoter and Herring Gullwere the most numerous species.
Divers, Common Scoter and Guillemot/Razorbillshowed an increased avoidance of the wind farm
4 Discussion and conclusions

30
area after erection of the wind turbines, includ-ing also zones of 2 and 4 km around the windfarm. In contrast Herring Gull, Little Gull andArctic/Common Tern showed an increased pref-erence for the wind farm area.
Changes in general distributions of CommonScoter as compared to previous years were ob-served. The species was found in shallow offshoreparts of the study area. This general shift in dis-tribution was not believed to be caused by thepresence of the wind turbines. There are, on theother hand, clear indications that Common Scot-er responded to the presence of the wind farm bygenerally avoiding the area. An area southeast ofthe wind farm, previously used by Common Scot-er, particularly in February through April, wasused less by this species. Simultaneously, areas
west and north of the wind farm with previouslyvery few Common Scoters supported greaternumbers of the species in 2003 and 2004.
The reason for the change in avoidance of thewind farm area for divers, Common Scoter andGuillemot/Razorbill is unknown. Disturbanceeffects from the wind turbines are one possiblereason. Disturbance from increased human activ-ity associated with maintenance of the wind tur-bines could be another. However, changes in thedistribution of food resources in the study areacould potentially play a role too.
The change in gull and tern preference for thewind farm area is likely to have been caused bythe presence of the wind turbines and the associ-ated boat activity in the area.

31
Christensen, T.K, Clausager, I. & Petersen, I.K. 2001.Base-line investigations of birds in relation toan offshore wind farm at Horns Rev: results andconclusions 2000/2001. Commissioned byTech-wise A/S. - NERI report 2001. 21 pp.
Christensen, T.K. & Noer, H. (2001) Monitoring ofbreeding eiders at Saltholm, 2000. NERI Reportto Øresundsbro Konsortiet. 48 pp.
Christensen, T.K, Clausager, I. & Petersen, I.K. 2002.Status report of seabird surveys at Horns Rev,2001-2002. Commissioned by Tech-wise A/S.–NERI report 2001. 21 pp.
Christensen, T.K., Clausager, I. & Petersen, I.K. (2003):Base-line investigations of birds in relation to anoffshore wind farm at Horns Rev, and resultsfrom the year of construction. Report request.Commissioned by Tech-wise A/S. National En-vironmental Research Institute. 65 pp.
Christensen, T.K., Hounisen, J.P., Clausager, I. &Petersen, I.K. 2004: Visual and radar observa-tions of birds in relation to collision risk at theoffshore wind farm at Horns Rev, 2003. Reportrequest. Commissioned by Elsam EngeneeringA/S. xx pp.
Christensen, T.K. & Hounisen, J.P. 2004. Investiga-tions of migratory birds during operation ofHorns Rev offshore wind farm: Preliminarynote of analysis of data from spring 2004. NERInote, xx p.
Danish Hydraulic Institute 1999. Horns Rev windpower plant: Environmental impact assess-ment of hydrograpfy. - Report to Elsampro-jekt A/S.
Guillemette, M., Larsen, J.K. & Clausager, I. 1999:Assessing the impact of the Tunø Knob windfarm on sea ducks: the influence of food re-sources. – NERI Technical Report nr. 263. 21 pp.
Jacobs, J. (1974): Quantitative measurements of foodselection. – Oecologia 14: 413-417.
Jacobsen. B. (in prep.): Fuglene ved Blåvand 1963-1992. – Report from Danish Ornithological So-ciety.
Kahlert, J., Petersen, I.K., Fox, A.D., Desholm, M. &Clausager, I. 2004: Investigations of birds dur-ing construction and operation of Nysted Off-shore Wind Farm at Rødsand. Annual StatusReport 2003. NERI Report, 82 pp.
Laursen, K. & Frikke, J. 1987. Vinterforekomst afdykænder, lommer og alkefugle i densydøstlige del af Vesterhavet. – Dansk Orn.Foren. Tidskr. 81: 167-169.
Laursen, K., Pihl, S., Durinck, J., Hansen, M., Skov,H., Frikke, J. & Danielsen, F. 1997. Numbers andDistribution of Waterfowl in Denmark 1987-1989. – Danish Review of Game Biology 15 (1):1-184.
Nehls, G. & Ketzenberg, C. 2002: Do common eiderSomateria mollissima exhaust their food re-sources? A study of natural mussel Mytilusedulis beds in the Wadden Sea. – Danish Re-view of Game Biology 16:47-61.
Noer, H., Christensen, T.K., Clausager, I. & Petersen,I.K. (2000): Effects on Birds of an Offshore WindPark at Horns Rev : Environmental Impact As-sessment. Commissioned by Elsamprojekt A/S 2000. National Environmental Research In-stitute. 112 pp.
Petersen, I.K. 2004a: Investigation of birds duringthe operational phase of the Horns Rev WindFarm. Preliminary notes on the issue of poten-tial habitat loss. NERI Note to ELSAM Engi-neering A/S. xx pp.
Petersen, I.K. 2004b: Investigation of birds duringthe operational phase of the Nysted Wind Farm.Preliminary notes on the issue of habitat loss.NERI Note to Energi E2.
Petersen, I.K., Clausager, I. & Christensen, T.K. 2004:Bird numbers and distribution in the Horns Revoffshore wind farm area. Annual status report2003. NERI Report to Elsam Engineering A/S.39 pp.
Stoltze, M. (1998): Gulliste over planter og dyr iDanmark. - Miljø- og Energiministeriet,Danmarks Miljøundersøgelser og Skov- ogNaturstyrelsen, 48 pp.
Stoltze, M. & Pihl, S. (red.) (1998): Rødliste 1997 overplanter og dyr i Danmark. - Miljø- og Energi-ministeriet, Danmarks Miljøundersøgelser ogSkov- og Naturstyrelsen, 219 pp.
Tasker, M.L, Webb, A., Hall, A.J., Pienkowski, M.W.& Langslow, D.R. 1987. Seabirds in the NorthSea. -port from Nature Conservancy Council.336 pp.
5 References


33
Ap
pen
dix
I
Spec
ies
Tot
al
1999
2000
2001
2002
2003
2004
0308
0309
1211
1702
2102
1903
2704
2108
0610
2212
0902
2003
2104
2208
2609
0701
1203
0904
0808
1302
1603
2304
0509
0412
3012
2902
2603
1005
Div
er s
p.24
8723
556
314
106
129
113
623
3818
714
987
23
5412
513
83
168
5628
42
1680
225
7421
Red
-thr
oate
d D
iver
832
1512
919
819
61
1810
6329
317
Bla
ck-t
hroa
ted
Div
er19
12
32
83
Big
Div
er s
p.2
11
Red
-nec
ked
Gre
be9
15
21
Cre
sted
Gre
be1
1
Gre
be s
p.6
41
1
Fulm
ar12
23
161
381
13
115
164
23
Gan
net
1075
2526
62
67
3342
160
6310
11
13
3910
52
115
392
Cor
mor
ant
248
32
12
801
202
2532
61
721
Gre
y H
eron
11
Ans
erid
ae31
31
Who
oper
Sw
an13
13
Gre
ylag
Goo
se45
441
Pink
-foo
ted
Goo
se25
25
Bre
nt G
oose
249
15
Can
ada
Goo
se2
2
Shel
duc
k1
1
Mal
lard
472
24
633
Tea
l22
418
Wig
eon
3731
6
Poch
ard
11
Gol
den
-eye
91
62
Lon
g-ta
iled
Duc
k20
51
66
11
Eid
er19
057
545
821
1418
147
697
3742
2062
5438
763
992
382
344
875
330
1372
084
3281
835
156
629
255
Com
mon
Sco
ter
8147
1568
119
1023
171
9038
6110
459
9230
283
2208
8436
1104
113
295
1690
231
946
6130
483
1087
738
0299
275
992
3810
4225
929
3397
5196
536
663
4226
042
312
1069
8
Vel
vet S
cote
r12
7728
161
1958
148
343
22
45
528
245
7510
1342
139
3064
Red
-bre
aste
d M
erga
nser
233
12
212
11
1
Oys
terc
atch
er30
41
392
164
211
31
Lap
win
g1
1
Gre
y Pl
over
175
84
Gol
den
Plo
ver
572
55
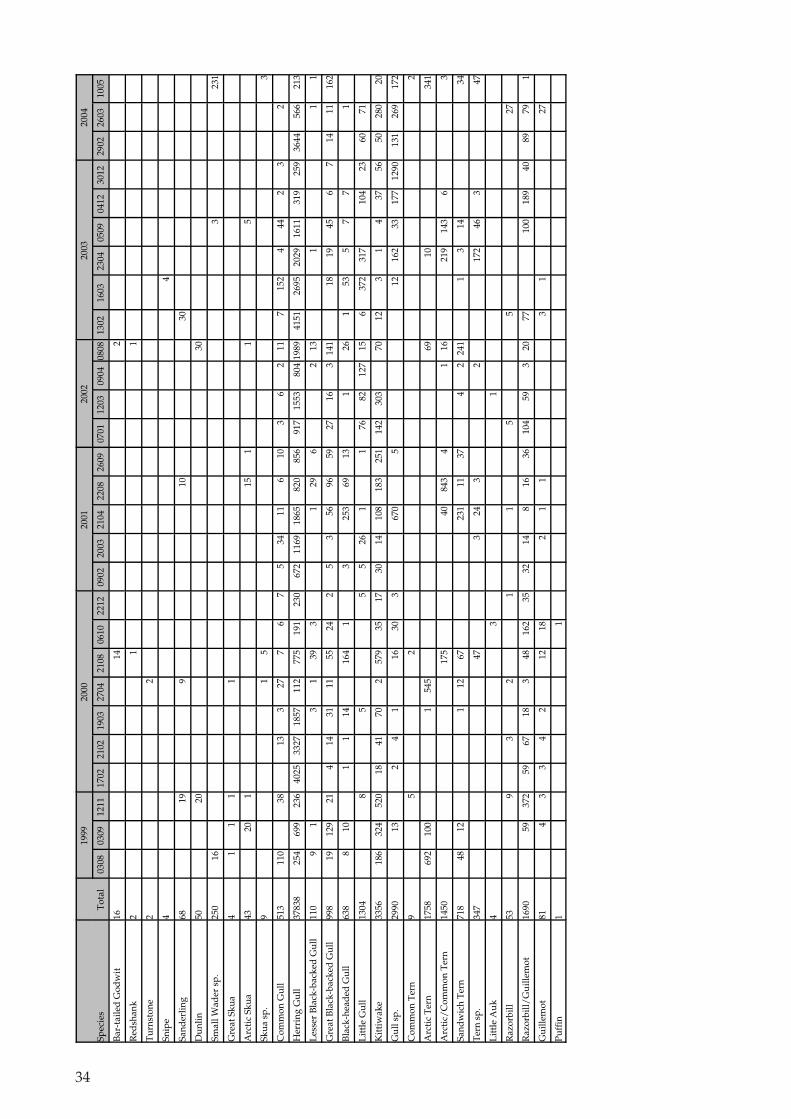
34
Spec
ies
Tot
al
1999
2000
2001
2002
2003
2004
0308
0309
1211
1702
2102
1903
2704
2108
0610
2212
0902
2003
2104
2208
2609
0701
1203
0904
0808
1302
1603
2304
0509
0412
3012
2902
2603
1005
Bar
-tai
led
God
wit
1614
2
Red
shan
k2
11
Tur
nsto
ne2
2
Snip
e4
4
Sand
erlin
g68
199
1030
Dun
lin50
2030
Smal
l Wad
er s
p.25
016
323
1
Gre
at S
kua
41
11
1
Arc
tic
Skua
4320
115
11
5
Skua
sp.
91
53
Com
mon
Gul
l51
311
038
133
277
67
534
116
103
62
117
152
444
23
2
Her
ring
Gul
l37
838
254
699
236
4025
3327
1857
112
775
191
230
672
1169
1865
820
856
917
1553
804
1989
4151
2695
2029
1611
319
259
3644
566
213
Les
ser
Bla
ck-b
acke
d G
ull
110
91
31
393
129
62
131
11
Gre
at B
lack
-bac
ked
Gul
l99
819
129
214
1431
1155
242
53
5696
5927
163
141
1819
456
714
1116
2
Bla
ck-h
ead
ed G
ull
638
810
11
1416
41
325
369
131
261
535
77
1
Lit
tle
Gul
l13
048
55
526
11
7682
127
156
372
317
104
2360
71
Kit
tiw
ake
3356
186
324
520
1841
702
579
3517
3014
108
183
251
142
303
7012
31
437
5650
280
20
Gul
l sp.
2990
132
41
1630
367
05
1216
233
177
1290
131
269
172
Com
mon
Ter
n9
52
2
Arc
tic
Ter
n17
5869
210
01
545
6910
341
Arc
tic/
Com
mon
Ter
n14
5017
540
843
41
1621
914
36
3
Sand
wic
h T
ern
718
4812
112
6723
111
374
224
11
314
34
Ter
n sp
.34
747
324
32
172
463
47
Lit
tle
Auk
43
1
Raz
orbi
ll53
93
21
15
527
Raz
orbi
ll/G
uille
mot
1690
5937
259
6718
348
162
3532
148
1636
104
593
2077
100
189
4089
791
Gui
llem
ot81
43
34
212
182
11
31
27
Puff
in1
1

National Environmental Research Institute The National Environmental Research Institute, NERI, is a research institute of the Ministry of the Environment. In Danish, NERI is called Danmarks Miljøundersøgelser (DMU). NERI's tasks are primarily to conduct research, collect data, and give advice on problems related to the environment and nature. Addresses: URL: http://www.dmu.dk National Environmental Research Institute Frederiksborgvej 399 PO Box 358 DK-4000 Roskilde Denmark Tel: +45 46 30 12 00 Fax: +45 46 30 11 14
Management Personnel and Economy Secretariat Research and Development Section Department of Policy Analysis Department of Atmospheric Environment Department of Marine Ecology Department of Environmental Chemistry and Microbiology Department of Arctic Environment
National Environmental Research Institute Vejlsøvej 25 PO Box 314 DK-8600 Silkeborg Denmark Tel: +45 89 20 14 00 Fax: +45 89 20 14 14
Environmental Monitoring Co-ordination Section Department of Terrestrial Ecology Department of Freshwater Ecology Project Manager for Surface Waters
National Environmental Research Institute Grenåvej 12-14, Kalø DK-8410 Rønde Denmark Tel: +45 89 20 17 00 Fax: +45 89 20 15 15
Department of Wildlife Biology and Biodiversity
Publications: NERI publishes professional reports, technical instructions, and an annual report (in Danish). Databases containing reference to all publications and current projects are available on the World Wide Web.

Bird numbers and distributions in the H
orns Rev offshore w
ind farm area
National Environmental Research InstituteMinistry of the Environment