BIRD IN HAND GOLD PROJECT - Terramin Australia Limited · Based on the logic shown in Figure 1 and...
14
BIRD IN HAND GOLD PROJECT MINING LEASE PROPOSAL MC 4473 ABN | 66 122 765 708 Unit 7 / 202-208 Glen Osmond Road | Fullarton SA 5063 APPENDIX K1 WATER BALANCE
Transcript of BIRD IN HAND GOLD PROJECT - Terramin Australia Limited · Based on the logic shown in Figure 1 and...
BIRD IN HAND GOLD PROJECT MINING LEASE PROPOSAL MC 4473
ABN | 66 122 765 708 Unit 7 / 202-208 Glen Osmond Road | Fullarton SA 5063
APPENDIX K1
WATER BALANCE

1 SITE WATER BALANCE Based on the logic shown in Figure 1 and Figure 2 an Excel spreadsheet has been developed by Terramin for the site to estimate the various inflows and
outflows associated with the Project.
Mine Schedule
Water treatment inputs and outputs (appendix H1 of the MLP)
Estimated ground water inflows from the Groundwater modelling undertaken (Figure 1-4)
Evaporation rates and rainfall data taken from the Bureau of Meteorology
Catchment and evaporation areas as modelled in Vulcan Design software ( Figure 3)
Commercial Water Calculator for estimations for daily use per person for ablutions, kitchen, laundry etc.
Estimations for mine use based on equipment specifications and applied utilisation factors
1.1.1.1 WATER INPUTS Figure 6 and Figure 5 show the estimated water inflows for the site for both the 70% grouting efficiency inflow volumes and the 90% grouting efficiency
inflow volumes over the life of the mine. The main sources for water inputs into the water balance include:
SA Water Mains
Rain Water
Groundwater from mine workings
Goldwyn bore allocation
Water will be required on site for the following purposes:
Underground:
Backfilling – cement water content
Grouting – cement water content
Equipment use – drilling, wash downs
Dust control – watering down headings and stockpiles
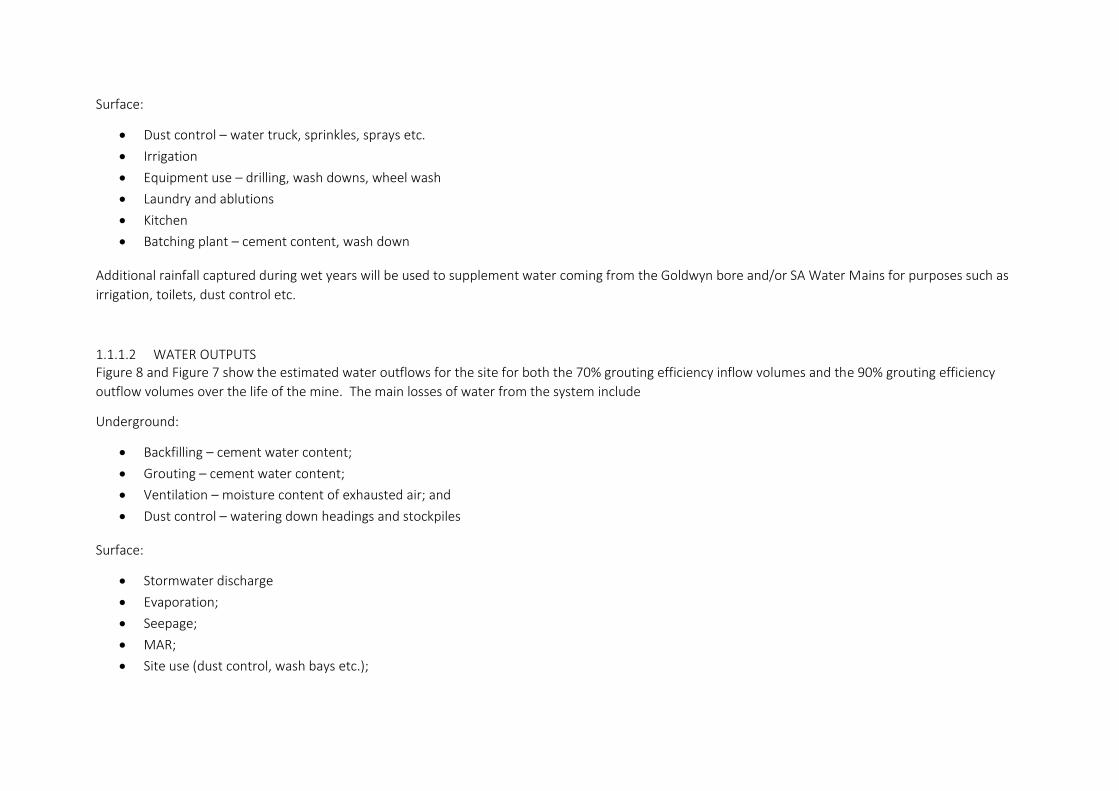
Surface:
Dust control – water truck, sprinkles, sprays etc.
Irrigation
Equipment use – drilling, wash downs, wheel wash
Laundry and ablutions
Kitchen
Batching plant – cement content, wash down
Additional rainfall captured during wet years will be used to supplement water coming from the Goldwyn bore and/or SA Water Mains for purposes such as
irrigation, toilets, dust control etc.
1.1.1.2 WATER OUTPUTS Figure 8 and Figure 7 show the estimated water outflows for the site for both the 70% grouting efficiency inflow volumes and the 90% grouting efficiency
outflow volumes over the life of the mine. The main losses of water from the system include
Underground:
Backfilling – cement water content;
Grouting – cement water content;
Ventilation – moisture content of exhausted air; and
Dust control – watering down headings and stockpiles
Surface:
Stormwater discharge
Evaporation;
Seepage;
MAR;
Site use (dust control, wash bays etc.);

Sewage; and
Moisture content of ore/mullock.
1.1.1.3 INFLOWS AND MANAGED AQUIFER RECHARGE BY YEAR
Groundwater inflow volumes have been obtained from groundwater modelling reported in Golder 2019 Bird-in-Hand Gold Project - Investigation into
Managed Aquifer Recharge: Stage 2 Injection tests and Stage 3 Groundwater model validation – Appendix H9 and are shown below.
All water will be extracted from the mine workings though the mine’s pumping system (chapter 3: section 3.4.6.3) will report to the mine water storage dam
and to the water treatment plant prior to reinjection. Water will be spread throughout the proposed MAR bores. While depressurisation of the hanging wall
aquifer directly above the mine workings was investigated during AGT 2017 (Appendix H1), it has not been relied upon as a mitigation strategy.
Currently, water allocations have been sourced for the project under confidential agreements from within the Onkaparinga River catchment.
The water treatment process is detailed in section 3.7.9.5 (chapter 3) and Appendix J1.
TABLE 1-1 | INFLOW VALUES OBTAINED FROM GOLDER 2019 BIRD-IN-HAND GOLD PROJECT - INVESTIGATION INTO MANAGED AQUIFER RECHARGE: STAGE 2 INJECTION TESTS AND STAGE 3
GROUNDWATER MODEL VALIDATION – APPENDIX H9
Year 90% Grout with MAR 70% Grout with MAR
ML/y ML/d L/s ML/y ML/d L/s
1 44 0.1 1.4 131 0.4 4.1
2 81 0.2 2.6 242 0.7 7.7
3 113 0.3 3.6 339 0.9 10.8
4 141 0.4 4.5 423 1.2 13.4
5 141 0.4 4.5 422 1.2 13.4

FIGURE 1 | CONCEPTUAL SITE WATER FLOWSHEET FOR THE PROJECT ILLUSTRATING THE INPUTS AND OUTPUTS TO THE SYSTEM

FIGURE 2 | CONCEPTUAL FLOWSHEET FOR UNDERGROUND MINE DEWATERING SYSTEM
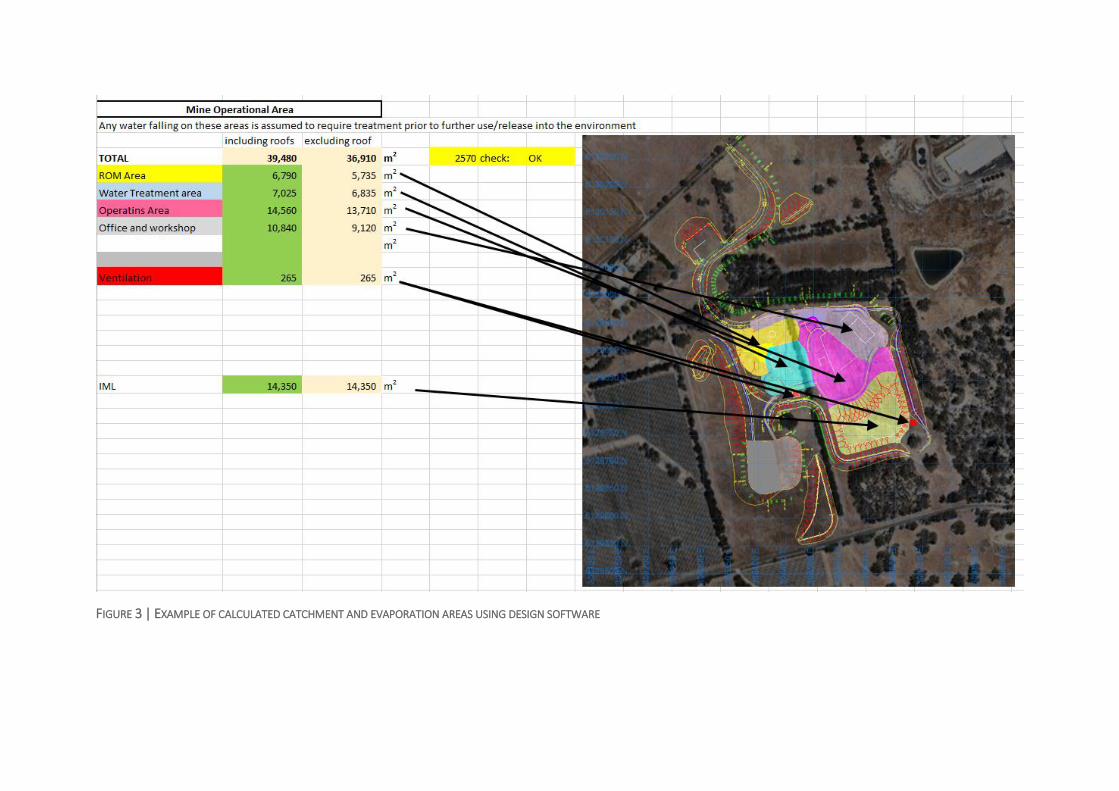
FIGURE 3 | EXAMPLE OF CALCULATED CATCHMENT AND EVAPORATION AREAS USING DESIGN SOFTWARE
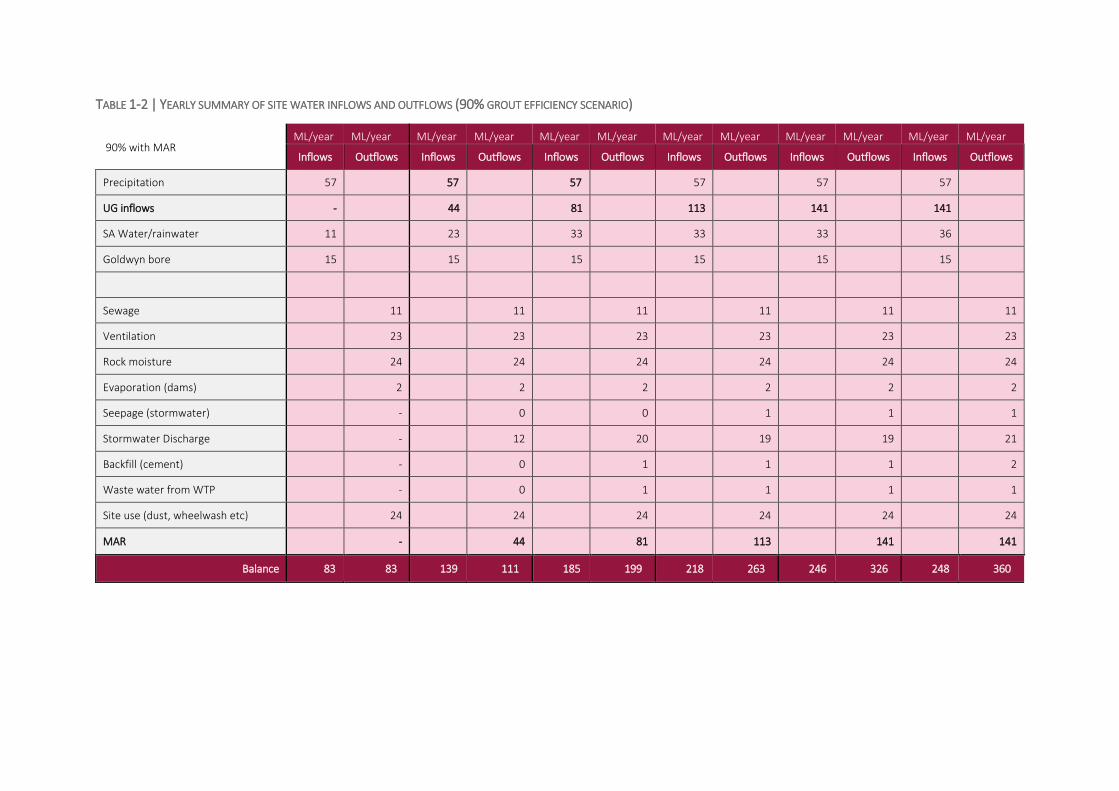
TABLE 1-2 | YEARLY SUMMARY OF SITE WATER INFLOWS AND OUTFLOWS (90% GROUT EFFICIENCY SCENARIO)
90% with MAR
ML/year ML/year ML/year ML/year ML/year ML/year ML/year ML/year ML/year ML/year ML/year ML/year
Inflows Outflows Inflows Outflows Inflows Outflows Inflows Outflows Inflows Outflows Inflows Outflows
Precipitation 57 57 57 57 57 57
UG inflows - 44 81 113 141 141
SA Water/rainwater 11 23 33 33 33 36
Goldwyn bore 15 15 15 15 15 15
Sewage 11 11 11 11 11 11
Ventilation 23 23 23 23 23 23
Rock moisture 24 24 24 24 24 24
Evaporation (dams) 2 2 2 2 2 2
Seepage (stormwater) - 0 0 1 1 1
Stormwater Discharge - 12 20 19 19 21
Backfill (cement) - 0 1 1 1 2
Waste water from WTP - 0 1 1 1 1
Site use (dust, wheelwash etc) 24 24 24 24 24 24
MAR - 44 81 113 141 141
Balance 83 83 139 111 185 199 218 263 246 326 248 360

TABLE 1-3 | YEARLY SUMMARY OF SITE WATER INFLOWS AND OUTFLOWS (70% GROUT EFFICIENCY SCENARIO)
70% with MAR
Year 0 Year 0 Year 1 Year 1 Year 2 Year 2 Year 3 Year 3 Year 4 Year 4 Year 5 Year 5
ML/year ML/year ML/year ML/year ML/year ML/year ML/year ML/year ML/year ML/year ML/year ML/year
Inflows Outflows Inflows Outflows Inflows Outflows Inflows Outflows Inflows Outflows Inflows Outflows
Precipitation 57 57 57 57 57 57
UG inflows - 131 242 339 423 422
SA Water/rainwater 11 25 36 37 38 42
Goldwyn bore 15 15 15 15 15 15
Sewage 11 11 11 11 11 11
Ventilation 23 23 23 23 23 23
Rock moisture 24 24 24 24 24 24
Evaporation (dams) 2 2 2 2 2 2
Seepage (stormwater) - 1 1 1 2 2
Stormwater Discharge - 12 20 19 19 21
Backfill (cement) - 1 2 3 4 5
Waste water from WTP - 1 2 3 4 4
Site use (dust, wheelwash etc) 24 24 24 24 24 24
MAR - 131 242 339 423 422
Balance 83 83 228 228 349 350 448 449 533 534 536 537
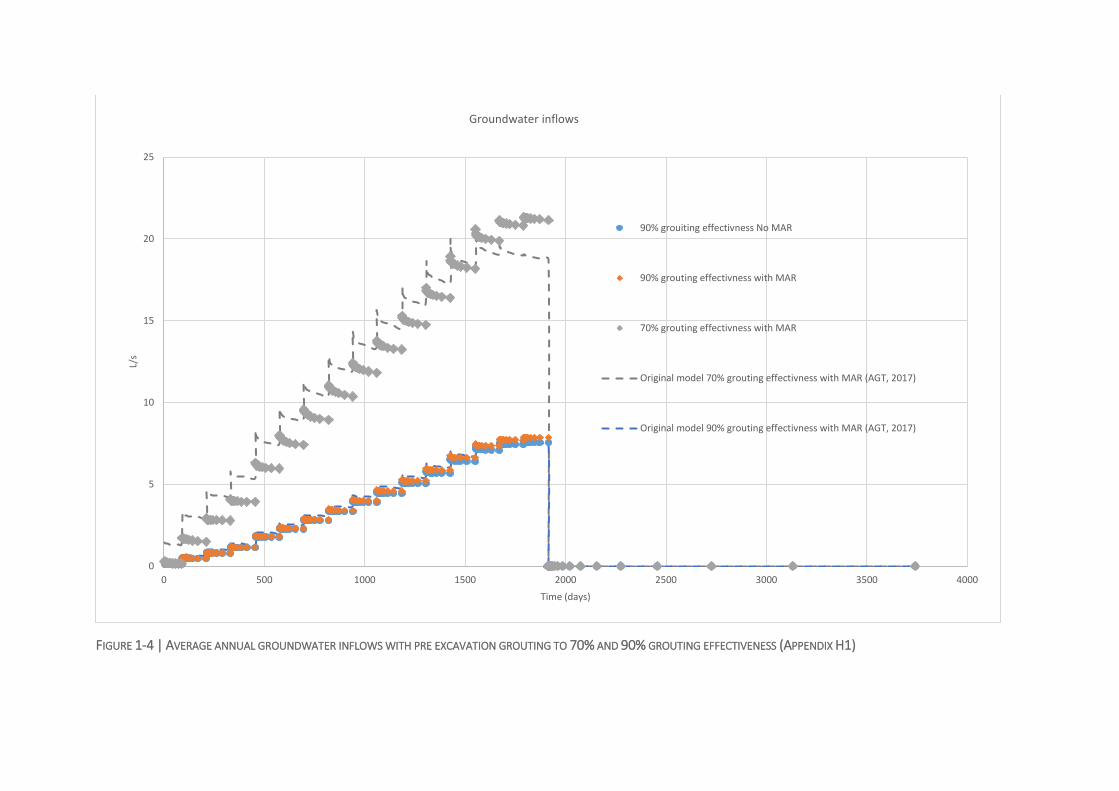
FIGURE 1-4 | AVERAGE ANNUAL GROUNDWATER INFLOWS WITH PRE EXCAVATION GROUTING TO 70% AND 90% GROUTING EFFECTIVENESS (APPENDIX H1)
0
5
10
15
20
25
0 500 1000 1500 2000 2500 3000 3500 4000
L/s
Time (days)
Groundwater inflows
90% grouiting effectivness No MAR
90% grouting effectivness with MAR
70% grouting effectivness with MAR
Original model 70% grouting effectivness with MAR (AGT, 2017)
Original model 90% grouting effectivness with MAR (AGT, 2017)
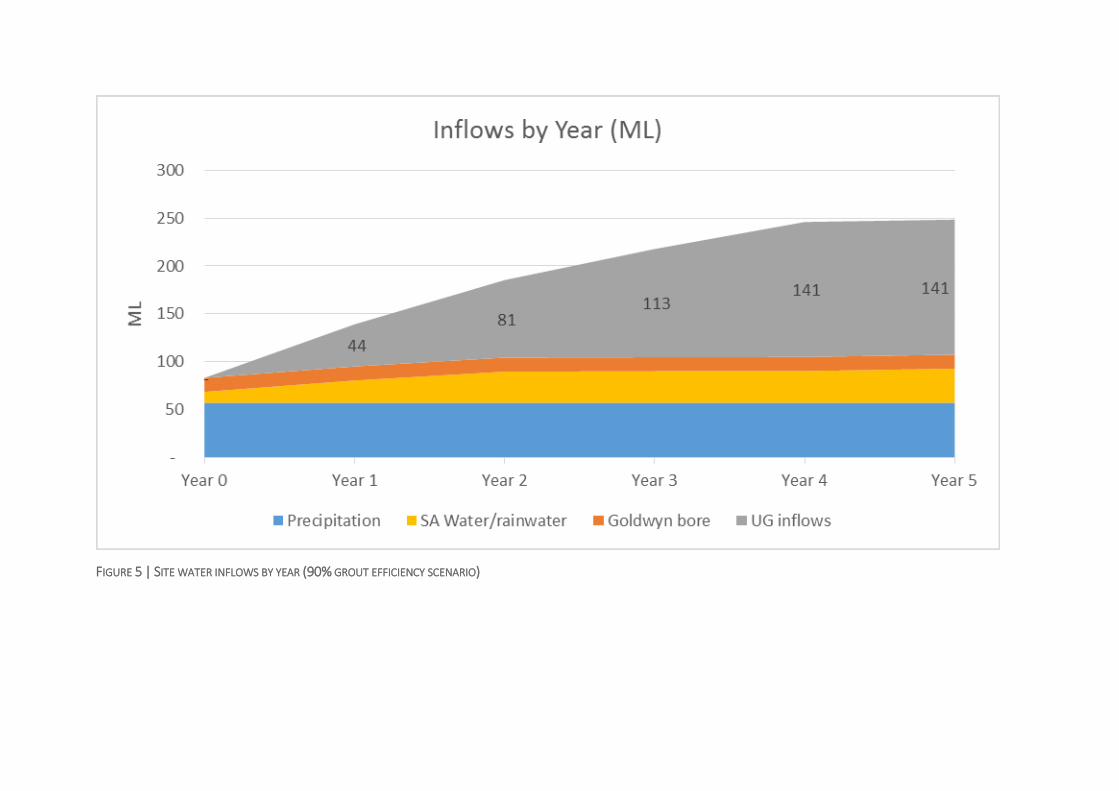
FIGURE 5 | SITE WATER INFLOWS BY YEAR (90% GROUT EFFICIENCY SCENARIO)
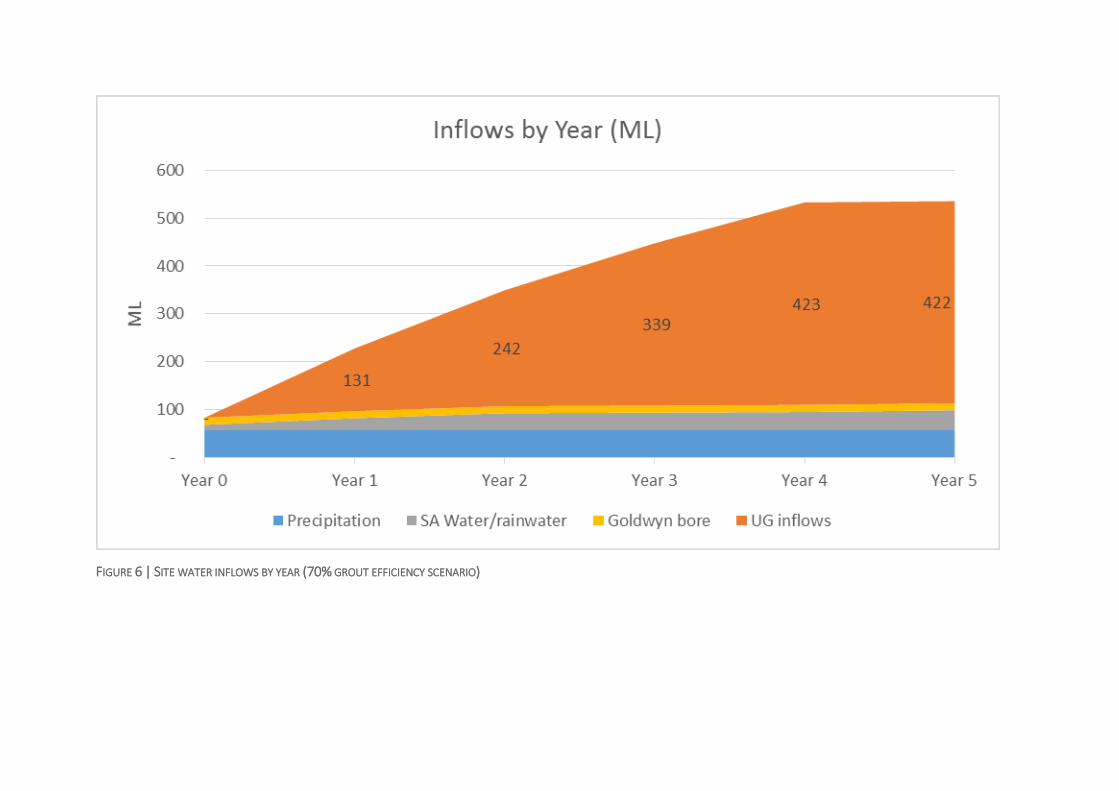
FIGURE 6 | SITE WATER INFLOWS BY YEAR (70% GROUT EFFICIENCY SCENARIO)
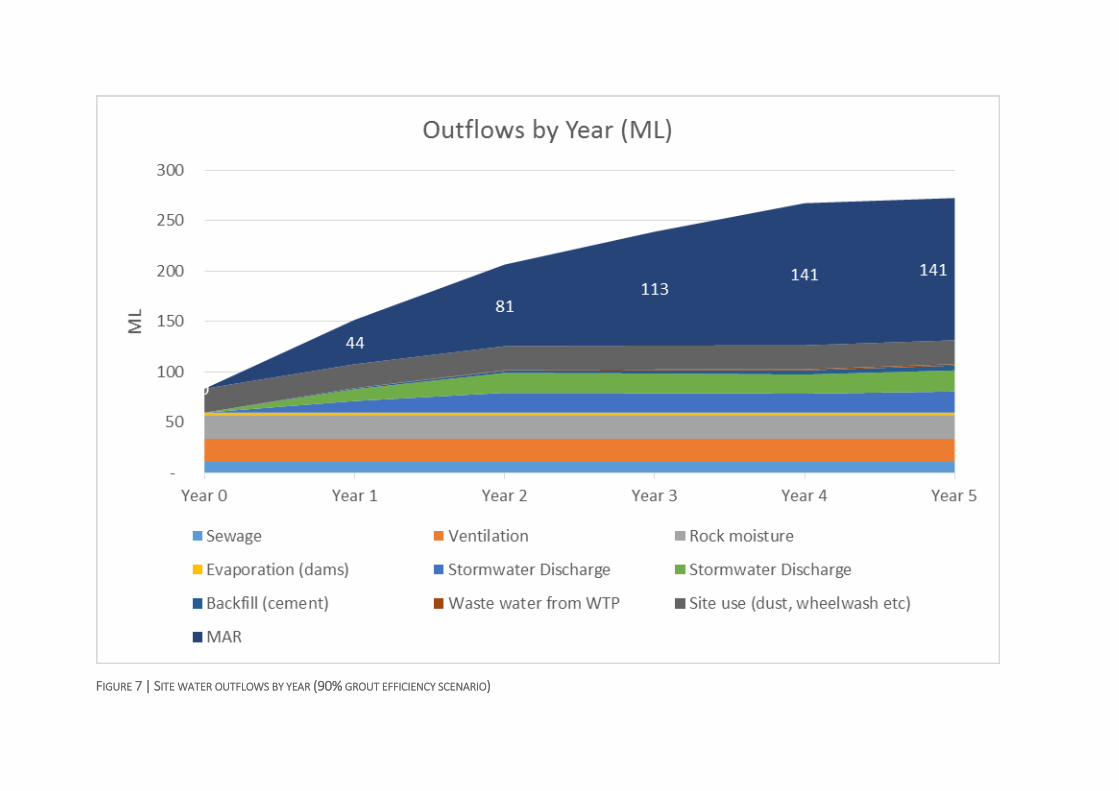
FIGURE 7 | SITE WATER OUTFLOWS BY YEAR (90% GROUT EFFICIENCY SCENARIO)
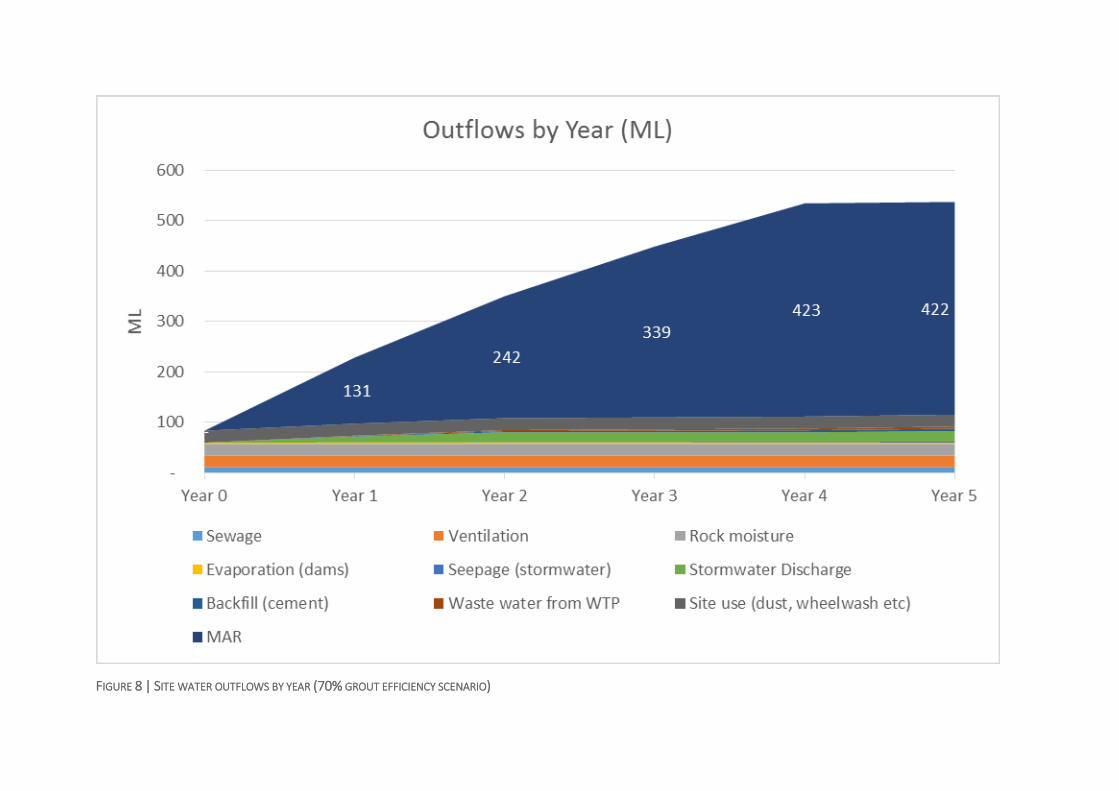
FIGURE 8 | SITE WATER OUTFLOWS BY YEAR (70% GROUT EFFICIENCY SCENARIO)