
HITACHI Inspire the Next RZ-AFI OE4M/AF18E4M RZ-AFI OE4M ...

Biotest AG
Q3 2010 Nine-month Report
Position maintained
Key figures*
Change
Biotest Group Q1-3 2010 Q1-3 2009 %
Revenue € million 342.3 330.6 3.5
thereof: Germany € million 86.0 80.9 6.3
Rest of World € million 256.3 249.7 2.6
thereof: Plasma Proteins € million 302.4 294.3 2.8
Microbiological Monitoring € million 39.9 36.3 9.9
EBITDA € million 56.2 66.4 – 15.4
EBIT € million 35.2 47.3 – 25.6
EBIT in % of revenue % 10.3 14.3
Earnings before tax € million 23.2 38.4 – 39.6
Earnings after tax € million 15.4 26.9 – 42.8
Earnings per share € 1.15 2.12 – 45.8
Cash fl ow** € million 15.8 10.7 47.7
Depreciation and amortisation € million 21.0 19.1 9.9
30 Sept. 2010 31 Dec. 2009
Equity € million 300.7 269.9 11.4
Equity ratio % 46.9 42.6
Employees (full-time equivalents) 1,854.4 1,811.6 2.4
* Continuing Operations ** From operating activities

Content
Interim management reportas of 30 September 2010 3
At a glance 3
Segmentation 3
Market environment 3
Business and earnings performance 4
Financial and asset position 5
Human resources 6
Business and earnings performance by segment 6
Opportunities and risks report 7
Outlook 8
Events after 30 September 2010 8
Financial statements as of 30 September 2010 9
Statement of income 9
Statement of comprehensive income 10
Statement of financial position 11
Detail information 12
Other information, Financial calendar 15
3| Interim management report of the Biotest Group as of 30 Sept. 2010 | Interim fi nancial statements of the Biotest Group as of 30 Sept. 2010 |
AT A GLANCE
In the first nine months of 2010, sales in the amount of €342.3 million were recorded in the Continuing Opera-tions, representing a 3.5% increase over the same period in 2009. Earnings before interest and taxes (EBIT) totalled €35.2 million (– 25.6%).
The continued difficult environment for sales of plasma proteins has had a major impact on performance. Pres-sure on prices of polyvalent immunoglobulins continued in Europe, with an equally difficult market for clotting fac-tors. The hyperimmunoglobulin situation appeared more favourable.
The expansion of plasma protein production in the US con-tinued, as did major research and development projects. The drafting of the approval dossier for the immunoglobu-lin BivigamTM was completed during the third quarter of 2010. The dossier was submitted to the US Food and Drug Administration (FDA) on 3 November 2010.
In light of business performance thus far, the Board of Management confirms the sales and profit expectations published in July 2010.
In Greece, Biotest exercised its legal option to exchange prior-year receivables from hospitals for still unissued in-terest-free government bonds with staggered maturities. This had a significant negative impact on financial results.
SEGMENTATION
Biotest reports its business and earnings performance in accordance with the segmentation scheme described in the Quarterly Report dated 31 March 2010. Unless other-wise noted, all statements refer to Continuing Operations. The structure and strategy of the company did not change during the course of the reporting year.
MARKET ENVIRONMENT
Macroeconomic situation Although the German economy was surprisingly robust, the financial situation of the public sector in most coun-tries remained extremely tense. In the current fiscal year, major changes in the regulatory environment took place.
Interim management report as of 30 September 2010
In Germany, the Act to Amend Provisions of Healthcare Insurance Law and Other Provisions (GKV-Änderungsgesetz), took effect as planned on 1 August 2010. The provisions of the law, which include a price moratorium and mandatory discounts, affect all providers whose products are sold un-der the public healthcare system.
Plasma ProteinsThe volume of blood plasma preparations sold on the world market increased slightly in the third quarter versus the same period last year, indicating that the long-term growth trend in the demand for blood plasma products remains intact.
The high supply of finished products continued to nega-tively impact price developments. Prices for polyvalent immunoglobulins and clotting products in Europe were under particular pressure, the latter especially in the countriesof Eastern Europe. The decision by the responsible author-ities to withdraw the approval of a competitor’s immu-noglobulin preparation in the European Union for the time being as well as the manufacturer’s recall of all batches of this preparation from the US market have not yet impacted prices for immunoglobulins in the third quarter. However, an effect on merchandise availability in the next several weeks and thus on medium-term prices is expected.
In the US, sales volumes for polyvalent immunoglobulins in the first nine months of 2010 grew by about 8% over the same period last year. Prices here were higher and overall more stable than in Europe. The volume of collected blood plasma in the US in the first half of 2010 (most current available data), at 7.7 million litres, was well below that of the first six months of 2009 (8.9 million litres).
Microbiological Monitoring Demand in the pharmaceutical industry for hygiene moni-toring products remained largely stable in the third quar-ter of 2010. Increasingly extensive and strict regulations are increasing the requirements of this customer group with regard to hygiene monitoring products. This benefits quality providers like Biotest in particular.
Demand for products from the Medical Microbiology came under pressure due to the continuing laboratory concentration process.

| Interim management report of the Biotest Group as of 30 Sept. 2010 | Interim fi nancial statements of the Biotest Group as of 30 Sept. 2010 |4
BUSINESS AND EARNINGS PERFORMANCE
SalesIn the first nine months of 2010, Biotest posted sales in the amount of €342.3 million in its Continuing Operations, representing a 3.5% increase over the same period in 2009 (€330.6 million). Sales volumes increased in both seg-ments, although the growth rate in the Microbiological Monitoring segment was much higher than in the Plasma Proteins segment.
Sales by segment
€ million Q1-3 2010
Q1-3 2009
Changein %
Plasma Proteins 302.4 294.3 2.8
MicrobiologicalMonitoring 39.9 36.3 9.9
Biotest Group* 342.3 330.6 3.5
* Continuing Operations
Sales revenue of €115.2 million was recorded in the third quarter of 2010, representing just under a 3% increase over both the previous quarter (€112.1 million) and the third quarter of 2009 (€112.2 million).
The distribution of revenue between domestic and inter-national sales changed only marginally in the first nine months of 2010 versus the same period in 2009. Biotest continues to generate around three quarters of its revenue from international sales.
IncomeBiotest’s earnings before interest and taxes (EBIT) in its Continuing Operations after nine months in 2010 were considerably below those of the same period in 2009. This development is primarily the result of significantly lower profits in the Plasma Proteins segment. In the Microbio-logical Monitoring segment, Biotest successfully increased EBIT.
Key financial performance figures of the Biotest Group*
€ millionQ1-3 2010
Q1-3 2009
Changein %
EBIT 35.2 47.3 – 25.6
EBT 23.2 38.4 – 39.6
EAT 15.4 26.9 – 42.8
Earnings per share in € 1.15 2.12 – 45.8
* Continuing Operations
The calculated profit-turnover ratio based on EBIT was 10.3% (2009: 14.3%). As of 30 September 2010, an annual-ised return on capital employed (RoCE) of 8.0% was calcu-lated (30 September 2009: 10.8 %).
Financial results of – €12.0 million (2009: – €8.9 million) were negatively impacted by the valuation of interest-free Greek bonds at €4.8 million. This led to a sharper drop in earnings before taxes (EBT) than in earnings before inter-est and taxes (EBIT).
Earnings after taxes, at €15.4 million, were 42.8% lower than in the previous year (2009: €29.6 million). The in-creased tax rate was largely due to the effects of audits and shifts in the structure of income, as well as the fact that no deferred taxes on startup losses incurred could be capitalised.
Including the contribution of the Discontinued Operation, EBIT for the Biotest Group totalled €53.5 million (2009: €45.7 million). The contribution to profits of the Discontin-ued Operation consists primarily of profits from the sale of transfusion and transplantation diagnostic activities.
Notes on major expense itemsThe significant increase in cost of sales and the resulting unfavourable change in the cost of sales ratio are largely due to developments in the price of plasma proteins and changes in the product mix. Another factor was the vacancy and infrastructure costs incurred in connection with the expansion and adjustment of production at Biotest Pharmaceuticals Corp. (BPC).
Sales by region in %
25.1%
35.1%
2.9%
24.9% Germany
Europe (excluding Germany)
Asia
Rest of World
North undSouth America
12.0%

5| Interim management report of the Biotest Group as of 30 Sept. 2010 | Interim fi nancial statements of the Biotest Group as of 30 Sept. 2010 |
Marketing and distribution expenses were below those of 2009, primarily due to lower commission payments. Research and development costs increased significantly as planned due to the continuation of R&D projects in the Plasma Proteins segment (IgM concentrate, BivigamTM, Cytotect ®CP during pregnancy) as well as in the Biothera-peutics segment.
Other operating income in the first nine months of the current year increased significantly to €10.5 million (2009: €4.4 million). The most important reasons for this were the reversal of provisions and insurance reimbursements. Earnings were offset by other operating expenses total-ling €1.1 million (2009: €6.4 million).
FINANCIAL AND ASSET POSITION
The financing strategy of the Biotest Group is unchanged in its basic principles from the 2009 Annual Report. Ad-vance and interim financing of sales is ensured via short-term lines of credit.
Capital expenditures and depreciation and amortisationBiotest reported €19.3 million in capital expenditures in the first nine months of 2010 (2009: €30.6 million). Of this total, €18.9 million (2009: €29.7 million) related to prop-erty, plant and equipment. Major items included the expansion of plasma protein production for the BPC as well as renovation and expansion work in Dreieich. Biotest invested €0.4 million in intangible assets during the cur-rent year up to the end of September (2009: €0.9 million). Depreciation and amortisation after nine months totalled €21.0 million (2009: €19.1 million).
Notes to the balance sheetOn 30 September 2010, the balance sheet for the Biotest Group totalled €640.5 million, up from €633.5 million at the end of 2009. With regard to non-current assets, leased property, plant and equipment was acquired after the end of the lease term, thus resulting in a reallocation.
In addition, as part of the transaction involving Greek receivables, the still unissued bonds were reported as a deferred asset under financial assets, leading to an increase of €19.9 million.
With regard to current assets, increased sales volumes in September led to a decline in inventories. Adjusting for the effects of the write-off of prior-year Greek receivables, the volume of receivables increased. This resulted from higher September sales and the reduction in factoring, for which portions of the proceeds from the sale of transfusion and transplantation diagnostic activities were used.
The change in equity (€300.7 million as of 30 September 2010, up from €269.9 million at the end of 2009) is attrib-utable to high earnings after taxes, including capital gains, as well as currency effects recognised directly in equity. The decrease in current financial liabilities results from the lower utilisation of the available lines of credit, which was a consequence of the inflow of funds from the sale of the transfusion and transplantation diagnostic activities.
Cash flow statementCash flow from operating activities in Continuing Operations after the first nine months of the current year totalled €15.8 million (2009: €10.7 million). This develop-ment was primarily influenced by the slight increase in working capital.
€ million Q1-3 2010 % of sales Q1-3 2009 % of sales
Production costs – 201.0 58.7 – 171.5 51.9
Distribution expenses – 51.1 14.9 – 52.2 15.8
Administrative expenses – 25.1 7.3 – 24.6 7.4
Research and development expenses – 39.3 11.5 – 33.0 10.0
Other operating income and expenses 9.4 2.7 – 2.0 0.6
Financial result – 12.0 3.5 – 8.9 2.7
*) Continuing Operations
**) Expenses are marked with a negative prefi x
Key cost positions of the Biotest Group*)**)

| Interim management report of the Biotest Group as of 30 Sept. 2010 | Interim fi nancial statements of the Biotest Group as of 30 Sept. 2010 |6
The cash outflow for investment activities amounted to €19.3 million (2009: €29.5 million), with cash inflows from financing activities totalling €6.2 million (2009: €16.4 mil-lion). As of 30 September 2010, Biotest held cash and cash equivalents amounting to €9.5 million, compared with €6.7 million at the start of the year.
Including the contribution from the Discontinued Opera-tion of €15.4 million, cash flow from operating activities for the Biotest Group in the first nine months of 2010 totalled €31.2 million (2009: €8.2 million).
HUMAN RESOURCES
On 30 September 2010, the number of full-time equiva-lents in the Biotest Group’s Continuing Operations was 1,854.4. This equalled 42.8 more full-time equivalents than at the end of 2009 (1,811.6). Most of the new positions were the result of the expansion of the sales department.
BUSINESS AND EARNINGS PERFORMANCE BY SEGMENT
Plasma ProteinsSales growth in the Plasma Proteins segment of 2.8% to €302.4 million was largely attributable to higher sales volumes. Due to continued high supply in the market, the lower sales prices achieved had a diminishing effect on revenue.
In sales of the polyvalent immunoglobulin Intratect®, vol-ume and price in the first nine months of 2010 fell well below 2009 values.
In the case of hyperimmunoglobulin, the company was able to increase sales volumes slightly over the 2009 comparison period; prices also dropped less than for polyspecific immunoglobulins. Sales of the factor VIII preparation Haemoctin® remained stable in terms of vol-ume. However, significant price concessions were required in some cases, such as for supplying the Russian market.
The continued difficult pricing situation, as well as vacancy costs incurred as planned in connection with production renovations at BPC, impacted the performance of the segment. EBIT, at €53.6 million, was 15.9% lower than in 2009 (€63.7 million), while the EBIT margin was 17.7% (2009: 21.6%).
The clinical trial for Intratect® in a 10% concentration solu-tion was launched in September upon receipt of approval from the authorities.
Also in September, a German-based clinical study was launched, in which the hepatitis B hyperimmunoglobulin Zutectra®, already available on the market, was tested for practicability and safety when used as prescribed (PASS). As part of the Europe-wide approval of Zutectra® in 2009, this process had already been cleared with the responsible agency, the European Medicines Agency (EMA). With the recent, successfully completed 70-patient study in Italy, practicability and safety data regarding Zutectra® are now more broadly substantiated, a key factor in its continued safe application and marketing.
The drafting of an approval dossier for the immunoglobulin BivigamTM was completed during the third quarter. To cur-rent events (incident involving the preparation of a com-petitor), additional tests were conducted for coagulation-activating substances. The results obtained therefrom showed that the concentration of coagulation-activating substances was markedly below the normal range.
For the immunoglobulins Cytotect ®CP and Varitect ®CP, Biotest has begun to switch production to the filter aid procedure. The filter aid procedure is already used for the production of Intratect® and Hepatect ®CP. It leads to higher yields and in addition, as a result of the switching of Cytotect ®CP and Varitect ®CP, there is a uniform produc-tion process for all immunoglobulins. In the case of Cyto-tect ®CP and Varitect ®CP too, Biotest will add nanofiltra-tion to the production process and thus further improve the already very high safety standards.
As part of the 40th Annual Meeting of the European Soci-ety for Dermatological Research (ESDR), Biotest organised a symposium on the topic of the potential use of intrave-nous immunoglobulins (IVIG) in dermatology. The event provided an overview of the current use of IVIG and pre-sented new data.
Microbiological MonitoringSales growth in the segment was due especially to the suc-cessful performance of products from heipha Dr. Müller GmbH. Sales generated by the Biotest HYCON product line also increased favourably.
EBIT totalled €4.9 million, representing a 25.6% increase over the first three quarters of 2009 (€3.9 million). The EBIT margin increased by 1.6 percentage points to 12.3% (2009: 10.7%).
7| Interim management report of the Biotest Group as of 30 Sept. 2010 | Interim fi nancial statements of the Biotest Group as of 30 Sept. 2010 |
Sales of air samplers (RCS devices) were particularly posi-tive, as were those of test strips for surface germ indication (surface germ indication test strips) from Biotest HYCON. The newly introduced monocyte activation test that replac-es previously unavoidable testing on rabbits for examining pharmaceutical products for contamination by fever-induc-ing pyrogens was met with great interest from pharmaceu-tical firms.
BiotherapeuticsThe development of the monoclonal antibodies in the lead indications of rheumatoid arthritis and psoriasis (BT-061), multiple myeloma (BT-062) and systemic lupus erythema-tosus (BT-063) has progressed.
The phase IIa clinical trial of BT-061 in the indication rheu-matoid arthritis with multiple doses of BT-061 (trial no. 962) was concluded in the reporting period with good results regarding efficacy and tolerability. Biotest had already provided information about this in the outlook section of the Half-year Report 2010. The data mark the transition to a later phase of the clinical development of BT-061.
The documentation for a further phase IIb clinical trial (trial no. 979) with 176 patients was submitted for ap-proval in August in a first European country; further sub-missions took place after the reporting period. The aim of the multinational trial is to create the statistical basis for pivotal trials.
In the indication psoriasis, a phase II clinical trial with mul-tiple doses of BT-061 (trial no. 973) showed in a blinded interim analysis that a marked improvement of the dis-ease symptoms was observed after intravenous adminis-tration in the relevant dosage ranges and comparatively short treatment period of eight weeks. Individual patients had an improvement of approximately 90% in the PASI score (PASI = Psoriasis Area and Severity Index). There are currently no results yet for the subcutaneous dose ranges of this trial.
In September, the German Federal Ministry of Education and Research (BMBF) approved an application filed by Biotest for financial support of studies to extend the use of BT-061 to the indication multiple sclerosis. Biotest plans to undertake these studies as part of a consortium, together with partners from academic research institutions. Negoti-ations for a potential development and marketing collabo-ration with international global pharmaceutical firms for BT-061 were intensified after further clinical data became available.
In the case of the phase I/IIa clinical trial of BT-062 initiated in July 2010, patient recruitment has started. Within its framework, BT-062 will be investigated as planned in a more intensive dose regimen.
In the phase I clinical trial of BT-062 (trial no. 969), patient recruitment was successfully concluded in the third quarter.
In the reporting period, Biotest presented the pre-clinical and clinical results obtained so far in the development of the monoclonal antibodies in the course of various scien-tific conferences and is preparing further corresponding publications. This also applies to BT-063, development of which was also continued in the third quarter, as planned.
Further work on the production plant for monoclonal anti-bodies at the BPC site in Boca Raton was concluded in the third quarter of 2010 and production of BT-061 for further clinical trials was also continued as planned.
At – €16.3 million (2009: – €13.2 million), EBIT for the seg-ment after nine months was as expected.
OPPORTUNITIES AND RISKS REPORT
OpportunitiesThe Biotest Group’s opportunity situation has not changed significantly from the situation described in the 2009 Annual Report (pages 81 and 82). The opportunities listed in the Annual Report resulting from developments in the regulatory framework, the business strategy and perform-ance-based opportunities continue to exist.
In Biotest’s view, the decision by the authorities to with-draw the approval of a competitor-produced polyvalent immunoglobulin will not significantly impact the market environment in the current year due to the continued high level of supply. A price effect is expected only if approval continues to be suspended for an extended period of time.
RisksThe Biotest Group’s risk situation has not changed signifi-cantly since the 2009 Annual Report (pages 68 to 76) sup-plemented by the 2010 Half-year Report (page 7).
Money-saving measures in the public healthcare system in Germany and other countries could have a negative im-pact on sales and profits.
| Interim management report of the Biotest Group as of 30 Sept. 2010 | Interim fi nancial statements of the Biotest Group as of 30 Sept. 2010 |8
OUTLOOK
The statements made in the 2009 Annual Report (pages 77 to 81) regarding the strategy and its implementation as well as sales performance are confirmed based on the per-formance of the Biotest Group thus far.
Changes in expectations regarding changes in earnings and the market environment were published by Biotest in July 2010 and are described in this report under the sub-heading “Expected performance of the Biotest Group”. These expectations continue to hold true.
Expected economic environment A major change in the market for plasma proteins is not expected during the remainder of the year. A slight increase in the demand for end products as part of a long-term trend is countered by a continued high level of supply. Pressure on prices will therefore continue, especially in the case of polyspecific immunoglobulins.
We estimate that the supply of blood plasma on the mar-ket will continue to decrease slightly during the remainder of the year. This effect and the exit of the competing firm will restore the balance between supply and demand more quickly. This will not yet have a significant effect on the price situation in Europe during the course of the year. Prices in the US are expected to remain stable.
The Microbiological Monitoring segment continues to operate in a stable market environment; in our estimation, this situation will remain in place until the end of 2010.
Expected performance of the Biotest Group
Sales and profitsThe Board of Management confirms the sales and profits goals last adjusted in July 2010 for the entire year 2010. For its Continuing Operations, Biotest aims at sales growth in the low single-digit percentage range and EBIT in the amount of €45 million (+/– 10%).
In its Discontinued Operation, Biotest will report positive EBIT of approximately €18 million due to profits from the sale of its transfusion and transplantation diagnostic activities.
EBIT for the Group in 2010, including Discontinued Opera-tion, is thus expected to exceed EBIT in 2009 (€58.5 million).
Financial situationBiotest plans to finance capital expenditures budgeted for the current year using only cash flow from operating activi-ties before changes in working capital. The available work-ing capital lines of credit are sufficient to cover a possible increase in working capital.
Expected segment developmentIn 2010, Biotest will report a slight increase in sales of plasma proteins over 2009. Realised sales volumes in the Microbiological Monitoring segment in 2010 will be significantly higher than the previous year.
Plasma ProteinsExpected sales growth in the segment will primarily be the result of increased sales volumes, while pricing will continue to have a diminishing effect on sales. Biotest will continue its work on development projects in the segment. BiotherapeuticsA decision regarding the possible development of BT-061 for additional indications is expected as part of a potential development and marketing partnership with a global pharmaceutical firm. Biotest will continue ongoing discus-sions regarding such a partnership in the reporting year. MicrobiologyIn the fourth quarter, Biotest plans to launch the particu-larly user-friendly “APC Smart Touch” particle counter on the market. The new “RCS Touch” air sampler will also be released during the current year.
EVENTS AFTER 30 SEPTEMBER 2010
On 18 October 2010, the consortium banks approved the extension of the €40 million short-term working capital line of credit by 364 days to 4 November 2011.
On 3 November 2010, Biotest submitted approval docu-mentation for BivigamTM to the US Food and Drug Admi-nistration.

9| Interim management report of the Biotest Group as of 30 Sept. 2010 | Interim fi nancial statements of the Biotest Group as of 30 Sept. 2010 |
Statement of incomeof the Biotest Group
€ million Q3 2010 Q3 2009 Q1- 3 2010 Q1- 3 2009
Revenue 115.2 112.2 342.3 330.6
Production costs – 72.0 – 61.5 – 201.0 – 171.5
Gross profit 43.2 50.7 141.3 159.1
Other operating income 6.6 1.5 10.5 4.4
Distribution expenses – 17.5 – 15.8 – 51.1 – 52.2
Administrative expenses – 8.3 – 8.1 – 25.1 – 24.6
Research and development expenses – 13.3 – 11.1 – 39.3 – 33.0
Other operating expenses 0.8 – 1.1 – 1.1 – 6.4
Operating profit 11.5 16.1 35.2 47.3
Financial result – 8.7 – 3.0 – 12.0 – 8.9
Profit before tax 2.8 13.1 23.2 38.4
Income tax – 1.7 – 3.7 – 7.8 – 11.5
Profit after tax from Continuing Operations 1.1 9.4 15.4 26.9
Profit after tax from the Discontinued Operation 0.1 – 0.3 15.5 – 1.8
Profit after tax 1.2 9.1 30.9 25.1
thereof:
Retained earnings attributable to equityholders of the parent company 0.5 8.4 29.0 23.1
thereof from Continuing Operations 0.4 8.7 13.5 24.9
thereof from Discontinued Operation 0.1 – 0.3 15.5 – 1.8
thereof:
Minority interest 0.7 0.7 1.9 2.0
thereof from Continuing Operations 0.7 0.7 1.9 2.0
thereof from Discontinued Operation 0.0 0.0 0.0 0.0
Earnings per share in € (Continuing Operations) 0.04 0.74 1.15 2.12
Earnings per share in € (Discontinued Operation) 0.00 – 0.02 1.32 – 0.15
Earnings per share in € (Biotest Group) 0.04 0.72 2.47 1.97

10 | Interim management report of the Biotest Group as of 30 Sept. 2010 | Interim fi nancial statements of the Biotest Group as of 30 Sept. 2010 |
Statement of comprehensive income of the Biotest Group
€ thousand Q1-3 2010 Q1-3 2009
Profi t of the period 30.9 25.1
Currency translation effects of international subsidiaries 4.2 – 3.8
Total deferred taxes on income and expenses recognised in equity 0.0 0.0
Income and expenses recognised in equity 4.2 – 3.8
Comprehensive income 35.1 21.3
Income and expenses recognised in equity 4.2 – 3.8
thereof from Continuing Operations 4.2 – 3.8
thereof from the Discontinued Operation 0.0 0.0
Profi t of the period 30.9 25.1
thereof from Continuing Operations 15.4 26.9
thereof from the Discontinued Operation 15.5 – 1.8
Comprehensive income 35.1 21.3
thereof from Continuing Operations 19.6 23.1
thereof from the Discontinued Operation 15.5 – 1.8
thereof:
Retained earnings attributable to equity holders of the parent company 33.2 19.3
thereof from Continuing Operations 17.7 20.8
thereof from the Discontinued Operation 15.5 – 1.5
Minority interest 1.9 2.0
thereof from Continuing Operations 1.9 2.0
thereof from the Discontinued Operation 0.0 0.0
Comprehensive income 35.1 21.3
thereof from Continuing Operations 19.6 22.8
thereof from the Discontinued Operation 15.5 – 1.5

11| Interim management report of the Biotest Group as of 30 Sept. 2010 | Interim fi nancial statements of the Biotest Group as of 30 Sept. 2010 |
Statement of financial positionof the Biotest Group
€ million 30 September 2010 31 December 2009
ASSETS
Intangible assets 64.7 66.7
Property, plant and equipment 235.8 214.2
Financial lease assets 2.3 17.8
Investments in affiliates 0.1 0.1
Investments in associates 0.8 0.8
Other financial investments 20.1 0.2
Other assets 1.6 2.2
Deferred tax assets 5.3 6.2
Non-current assets 330.7 308.2
Inventories 167.9 170.3
Trade receivables 111.8 96.0
Current income tax assets 5.2 3.7
Other assets 13.3 17.1
Cash and cash equivalents 9.5 6.7
Discontinued Operation 2.1 31.5
Current assets 309.8 325.3
TOTAL ASSETS 640.5 633.5
EQUITY AND LIABILITIES
Subscribed capital 30.0 30.0
Share premium 153.3 153.3
Reserves 81.4 55.8
Retained earnings attributableto equity holders of the parent company 29.0 25.7
Shareholders’ equity 293.7 264.8
Minority interests 7.0 5.1
Total equity 300.7 269.9
Provisions for pensions and similar obligations 49.0 48.3
Other provisions 3.6 3.6
Financial liabilities 156.5 153.7
Other liabilities 0.3 0.4
Deferred tax liabilities 9.7 8.8
Non-current liabilities 219.1 214.8
Other provisions 12.5 19.6
Current income tax liabilities 6.8 7.8
Financial liabilities 24.3 50.8
Trades payables 46.9 40.6
Other liabilities 29.6 21.0
Discontinued Operation 0.6 9.0
Current liabilities 120.7 148.8
Total liabilities 339.8 363.6
TOTAL EQUITY AND LIABILITIES 640.5 633.5

12 | Interim management report of the Biotest Group as of 30 Sept. 2010 | Interim fi nancial statements of the Biotest Group as of 30 Sept. 2010 |
Statement of changes in equity
€ million 2010 2009
Equity as of 1 January 269.9 253.4
Dividend payments to shareholders – 4.3 – 3.8
Earnings after tax 30.9 25.1
Differences from currency translation 4.2 – 3.8
Dividend to minority interest 0.0 – 1.7
Equity as of 30 September 300.7 269.2
Cash flow statement
ContinuingOperations
DiscontinuedOperations
Biotest Group
€ million 2010 2009 2010 2009 2010 2009
Cash fl ow
Cash flow from operating activities 15.8 10.7 15.4 – 2.5 31.2 8.2
Cash flow from investing activities – 19.3 – 29.5 22.3 – 1.0 3.0 – 30.5
Cash flow from financing activities 6.2 16.4 – 37.7 3.5 – 31.5 19.9
Cash changes in cash and cash equivalents 2.7 – 2.4 0.0 0.0 2.7 – 2.4
Exchange rate-related changes 0.1 0.0 0.0 0.0 0.1 0.0
Cash and cash equivalents as of 1 January 6.7 8.1 0.0 0.0 6.7 8.1
Cash and cash equivalents as of 30 September 9.5 5.7 0.0 0.0 9.5 5.7
Schedule of assets – net presentation
€ million
Book valueas of
1 January 2010
Capitalexpenditure Net disposals Depreciation
Currency translationdifferences
Book valueas of
30 September2010
Intangible assets 66.7 0.4 0.0 – 5.2 2.8 64.7
Tangible assets 232.0 18.9 – 1.3 – 15.8 4.3 238.1
Total 298.7 19.3 – 1.3 – 21.0 7.1 302.8

13| Interim management report of the Biotest Group as of 30 Sept. 2010 | Interim fi nancial statements of the Biotest Group as of 30 Sept. 2010 |
Segment reportingby business segment
Segment reportingby region (Continuing Operations only)
€ million Q1-3 2010 Q1-3 2009 Change in %
Revenue
Plasma Proteins 302.4 294.3 2.8
Microbiological Monitoring 39.9 36.3 9.9
Continuing Operations 342.3 330.6 3.5
Discontinued Operation 1.7 31.3 – 94.6
Biotest Group 344.0 361.9 – 4.9
EBIT
Plasma Proteins 53.6 63.7 – 15.9
Microbiological Monitoring 4.9 3.9 25.6
Corporate/Reconciliation – 7.0 – 7.1 1.4
Biotherapeutics – 16.3 – 13.2 – 23.5
Continuing Operations 35.2 47.3 – 25.6
Discontinued Operation 18.3 – 1.6 –
Biotest Group 53.5 45.7 17.1
€ million Q1-3 2010 Q1-3 2009 Change in %
Revenue
Germany 86.0 80.9 6.3
Europe (excluding Germany) 120.3 127.7 – 5.8
North and South America 41.1 40.4 1.7
Asia 85.1 72.1 18.0
Rest of World 9.8 9.5 3.2
Continuing Operations 342.3 330.6 3.5
14 | Interim management report of the Biotest Group as of 30 Sept. 2010 | Interim fi nancial statements of the Biotest Group as of 30 Sept. 2010 |
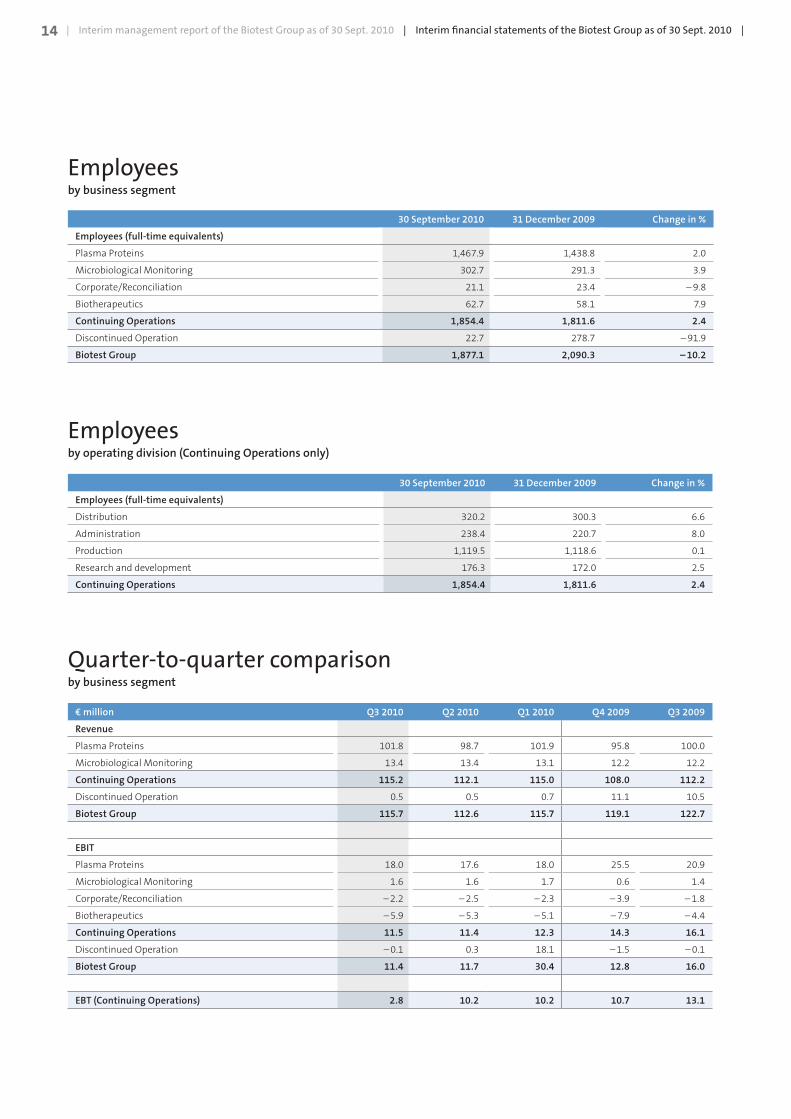
Employeesby business segment
30 September 2010 31 December 2009 Change in %
Employees (full-time equivalents)
Plasma Proteins 1,467.9 1,438.8 2.0
Microbiological Monitoring 302.7 291.3 3.9
Corporate/Reconciliation 21.1 23.4 – 9.8
Biotherapeutics 62.7 58.1 7.9
Continuing Operations 1,854.4 1,811.6 2.4
Discontinued Operation 22.7 278.7 – 91.9
Biotest Group 1,877.1 2,090.3 – 10.2
Employeesby operating division (Continuing Operations only)
30 September 2010 31 December 2009 Change in %
Employees (full-time equivalents)
Distribution 320.2 300.3 6.6
Administration 238.4 220.7 8.0
Production 1,119.5 1,118.6 0.1
Research and development 176.3 172.0 2.5
Continuing Operations 1,854.4 1,811.6 2.4
Quarter-to-quarter comparisonby business segment
€ million Q3 2010 Q2 2010 Q1 2010 Q4 2009 Q3 2009
Revenue
Plasma Proteins 101.8 98.7 101.9 95.8 100.0
Microbiological Monitoring 13.4 13.4 13.1 12.2 12.2
Continuing Operations 115.2 112.1 115.0 108.0 112.2
Discontinued Operation 0.5 0.5 0.7 11.1 10.5
Biotest Group 115.7 112.6 115.7 119.1 122.7
EBIT
Plasma Proteins 18.0 17.6 18.0 25.5 20.9
Microbiological Monitoring 1.6 1.6 1.7 0.6 1.4
Corporate/Reconciliation – 2.2 – 2.5 – 2.3 – 3.9 – 1.8
Biotherapeutics – 5.9 – 5.3 – 5.1 – 7.9 – 4.4
Continuing Operations 11.5 11.4 12.3 14.3 16.1
Discontinued Operation – 0.1 0.3 18.1 – 1.5 – 0.1
Biotest Group 11.4 11.7 30.4 12.8 16.0
EBT (Continuing Operations) 2.8 10.2 10.2 10.7 13.1

15| Interim management report of the Biotest Group as of 30 Sept. 2010 | Interim fi nancial statements of the Biotest Group as of 30 Sept. 2010 |
Financial calendar
22 March 2011 Annual Press Conference10 May 2011 I. Quarterly Report 201112 May 2011 Annual General Meeting11 August 2011 II. Quarterly Report 201110 November 2011 Autumn conference for analysts and journalists10 November 2011 III. Quarterly Report 2011
OTHER INFORMATION
Accounting principles The interim report as of 30 September 2010 has been pre-pared in accordance with the International Financial Re-porting Standards of the International Accounting Stand-ards Board (IASB). There have been no changes with regard to the accounting and valuation methods used compared with those used in the consolidated financial statements for 2009. The interim management report and interim financial statements are neither audited nor are they sub-ject to review by an auditor.
No major transactions were concluded with related par-ties in the period under review.
Dreieich, 8 November 2010Biotest Aktiengesellschaft
The Management Board
Prof. Dr. Gregor Schulz Dr. Michael RamrothChairman of the Chief Financial Officer Management Board

Biotest AG, Landsteinerstr. 5, D-63303 Dreieich, Germany, P.O. Box 10 20 40, D-63266 Dreieich, GermanyTel. +49 (0) 6103 801-4406, Telefax +49 (0) 6103 801-347e-mail: [email protected], www.biotest.de
This quarterly report contains forward-looking statements on overall economic development as well as on the business earnings, fi nancial and asset
situation of Biotest AG and its subsidiaries. These statements are based on current plans, estimates, forecasts and expectations of the company and thus
are subject to risks and elements of uncertainty that could result in deviation of actual developments from expected developments. The forward-looking
statements are only valid at the time of publication of this quarterly report. Biotest does not intend to update the forward-looking statements and assumes
no obligation to do so.


![BioTest 1 Review[1]](https://static.fdocuments.us/doc/165x107/577d24ed1a28ab4e1e9db988/biotest-1-review1.jpg)

