BIOS 5445: Human Ecology - Western Michigan University
22
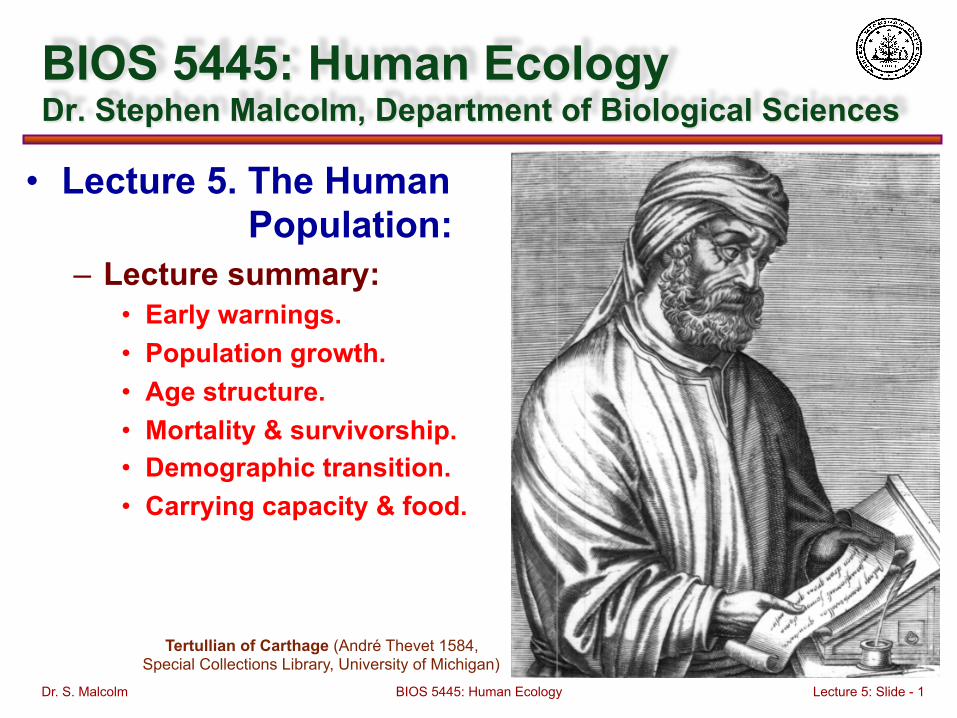
BIOS 5445: Human Ecology Dr. S. Malcolm Lecture 5: Slide - 1 • Lecture 5. The Human Population: – Lecture summary: • Early warnings. • Population growth. • Age structure. • Mortality & survivorship. • Demographic transition. • Carrying capacity & food. BIOS 5445: Human Ecology Dr. Stephen Malcolm, Department of Biological Sciences Tertullian of Carthage (André Thevet 1584, Special Collections Library, University of Michigan)
Transcript of BIOS 5445: Human Ecology - Western Michigan University
BIOS 5445: Human Ecology Dr. S. Malcolm Lecture 5: Slide - 1
• Lecture 5. The Human Population:
– Lecture summary: • Early warnings. • Population growth. • Age structure. • Mortality & survivorship. • Demographic transition. • Carrying capacity & food.
BIOS 5445: Human Ecology Dr. Stephen Malcolm, Department of Biological Sciences
Tertullian of Carthage (André Thevet 1584, Special Collections Library, University of Michigan)
BIOS 5445: Human Ecology Dr. S. Malcolm Lecture 5: Slide - 2
2. Early warnings:
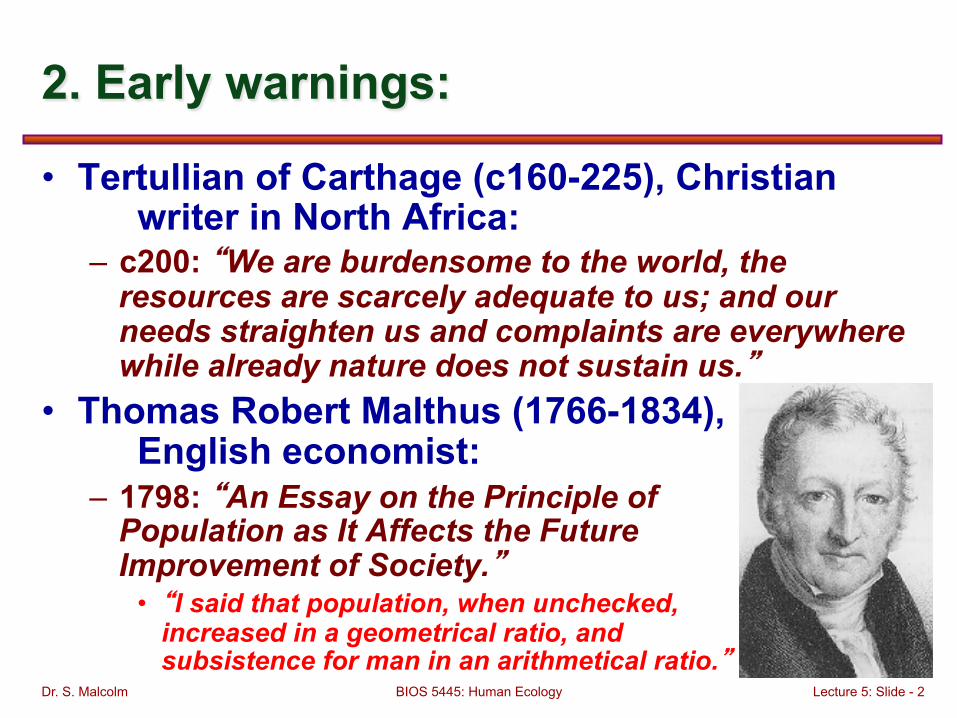
• Tertullian of Carthage (c160-225), Christian writer in North Africa:
– c200: “We are burdensome to the world, the resources are scarcely adequate to us; and our needs straighten us and complaints are everywhere while already nature does not sustain us.”
• Thomas Robert Malthus (1766-1834), English economist:
– 1798: “An Essay on the Principle of Population as It Affects the Future Improvement of Society.”
• “I said that population, when unchecked, increased in a geometrical ratio, and subsistence for man in an arithmetical ratio.”
BIOS 5445: Human Ecology Dr. S. Malcolm Lecture 5: Slide - 3
3. Population growth curve:
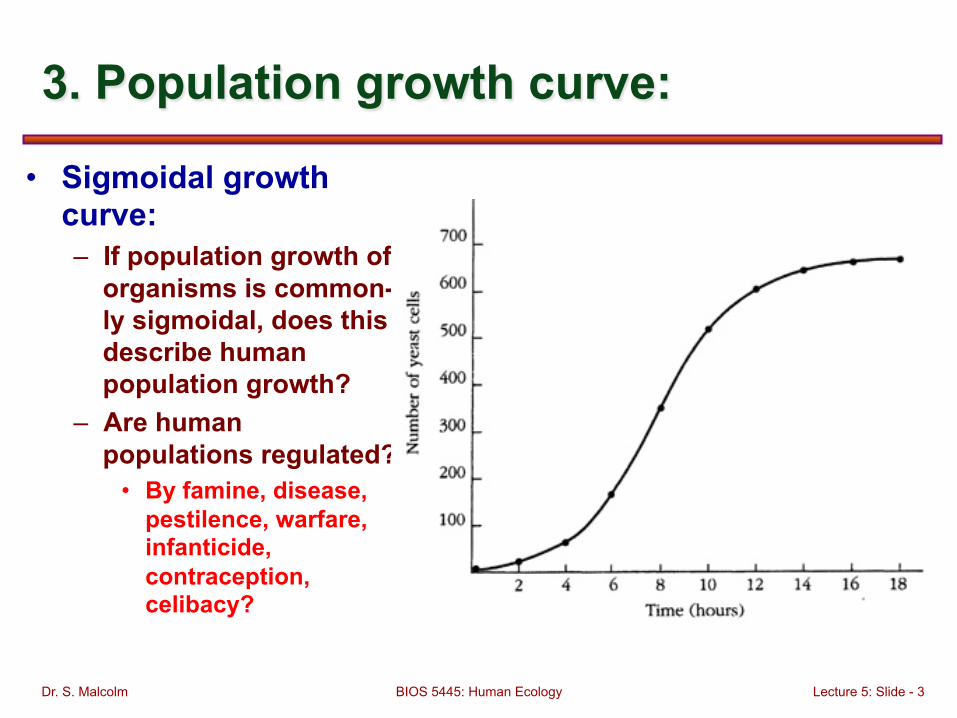
• Sigmoidal growth curve: – If population growth of
organisms is common-ly sigmoidal, does this describe human population growth?
– Are human populations regulated?
• By famine, disease, pestilence, warfare, infanticide, contraception, celibacy?
BIOS 5445: Human Ecology Dr. S. Malcolm Lecture 5: Slide - 4
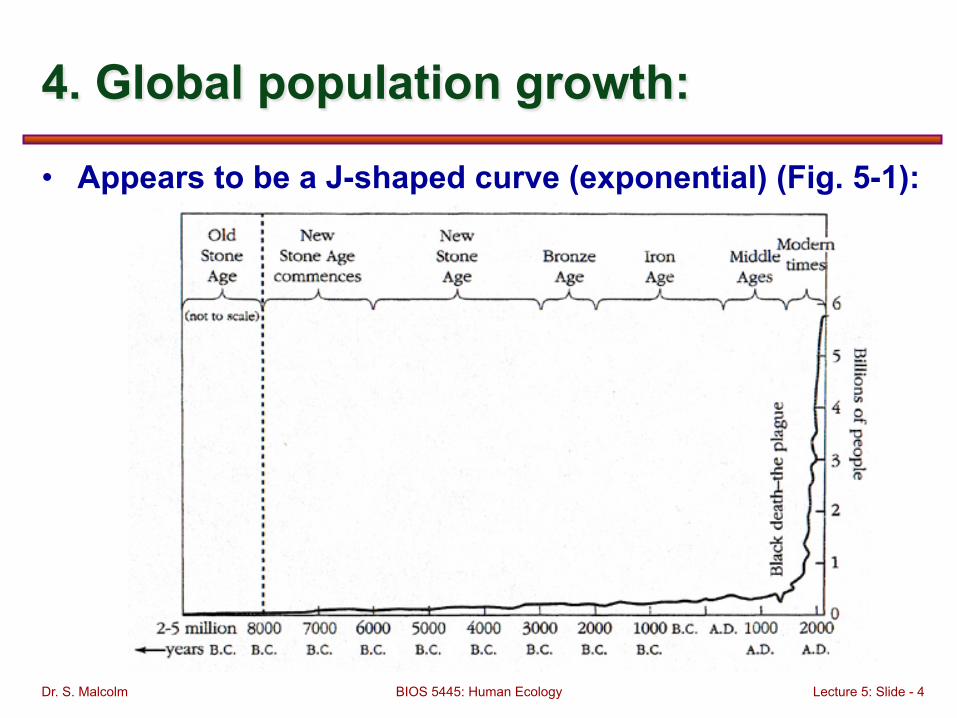
4. Global population growth:
• Appears to be a J-shaped curve (exponential) (Fig. 5-1):
BIOS 5445: Human Ecology Dr. S. Malcolm Lecture 5: Slide - 5
5. Global population growth:
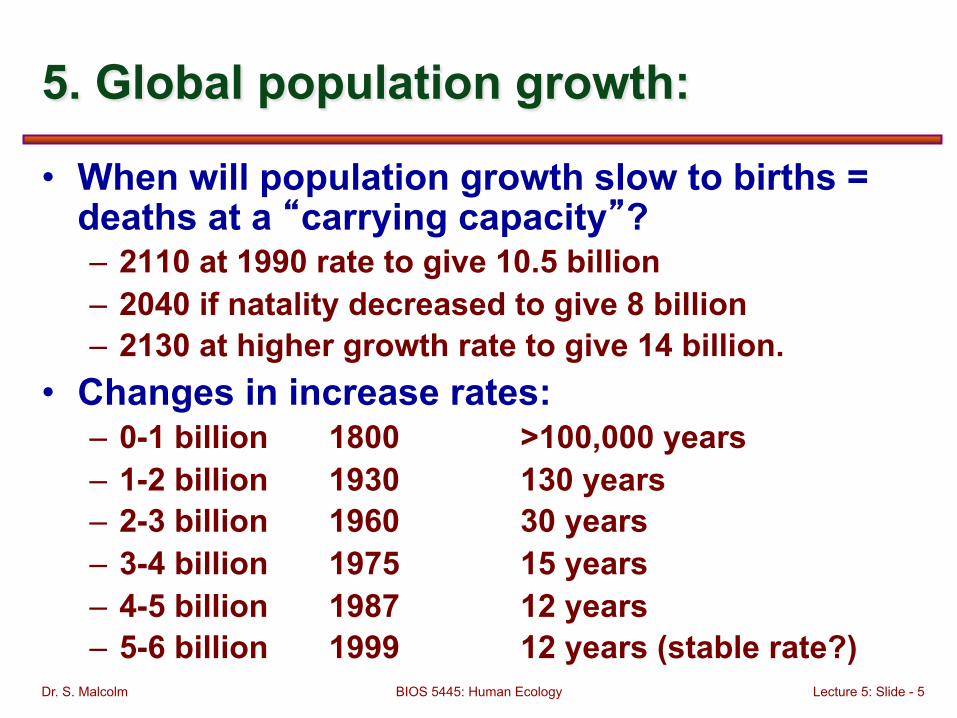
• When will population growth slow to births = deaths at a “carrying capacity”? – 2110 at 1990 rate to give 10.5 billion – 2040 if natality decreased to give 8 billion – 2130 at higher growth rate to give 14 billion.
• Changes in increase rates: – 0-1 billion 1800 >100,000 years – 1-2 billion 1930 130 years – 2-3 billion 1960 30 years – 3-4 billion 1975 15 years – 4-5 billion 1987 12 years – 5-6 billion 1999 12 years (stable rate?)
BIOS 5445: Human Ecology Dr. S. Malcolm Lecture 5: Slide - 6
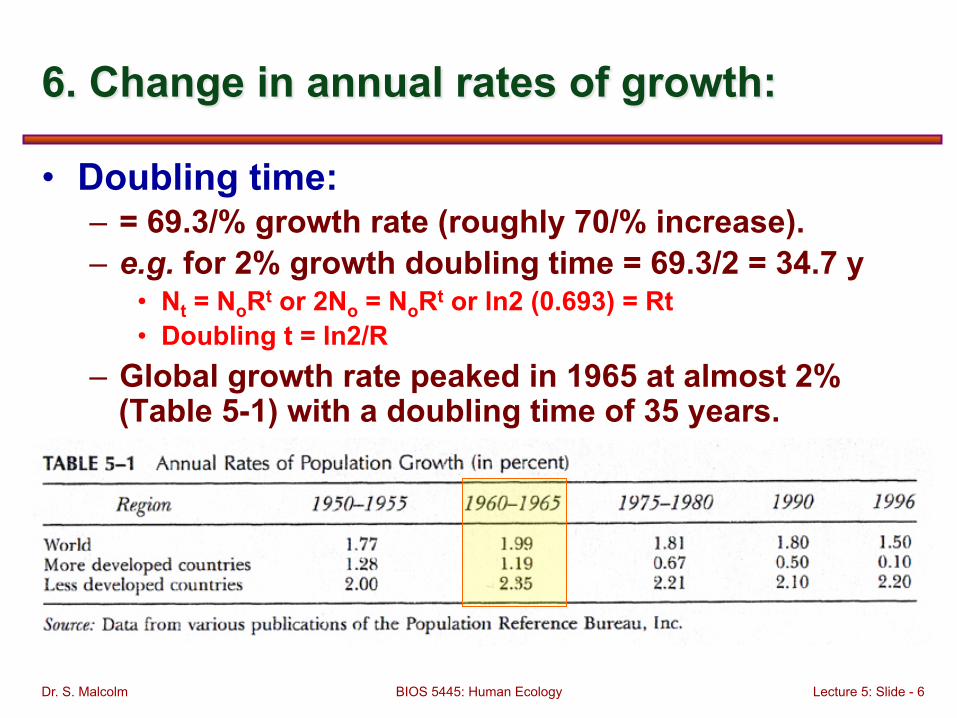
6. Change in annual rates of growth:
• Doubling time: – = 69.3/% growth rate (roughly 70/% increase). – e.g. for 2% growth doubling time = 69.3/2 = 34.7 y
• Nt = NoRt or 2No = NoRt or ln2 (0.693) = Rt • Doubling t = ln2/R
– Global growth rate peaked in 1965 at almost 2% (Table 5-1) with a doubling time of 35 years.
BIOS 5445: Human Ecology Dr. S. Malcolm Lecture 5: Slide - 7
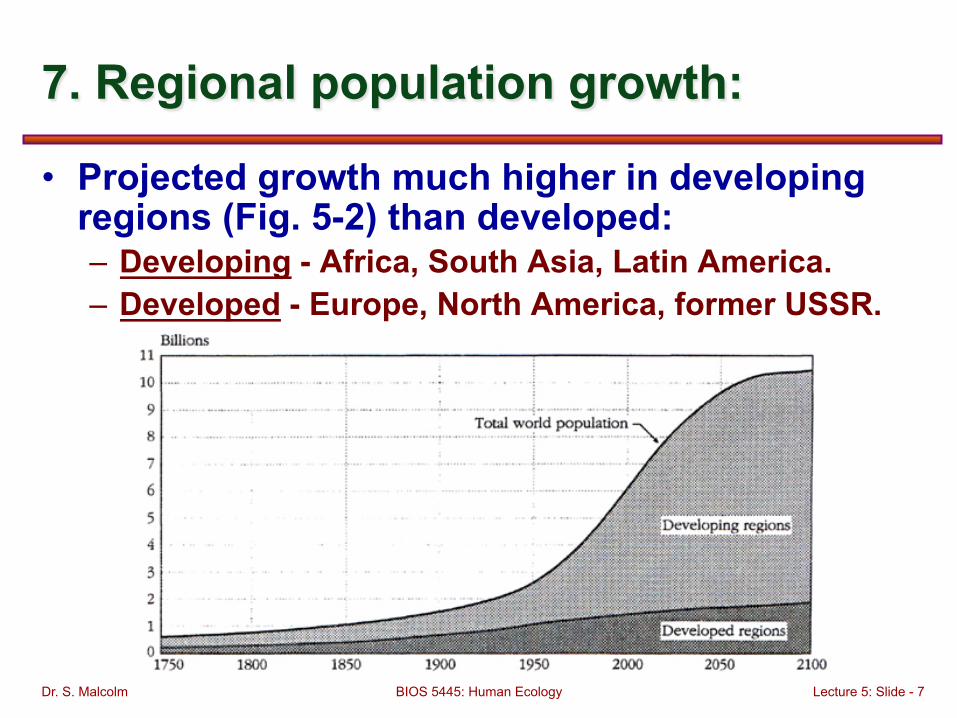
7. Regional population growth:
• Projected growth much higher in developing regions (Fig. 5-2) than developed: – Developing - Africa, South Asia, Latin America. – Developed - Europe, North America, former USSR.
BIOS 5445: Human Ecology Dr. S. Malcolm Lecture 5: Slide - 8
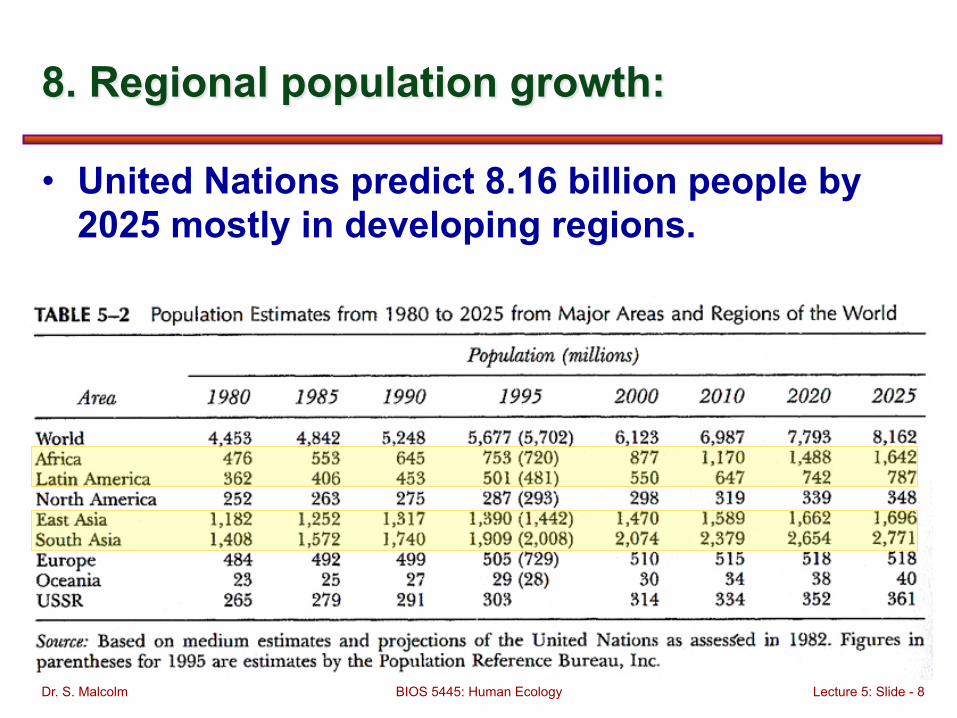
8. Regional population growth:
• United Nations predict 8.16 billion people by 2025 mostly in developing regions.
BIOS 5445: Human Ecology Dr. S. Malcolm Lecture 5: Slide - 9
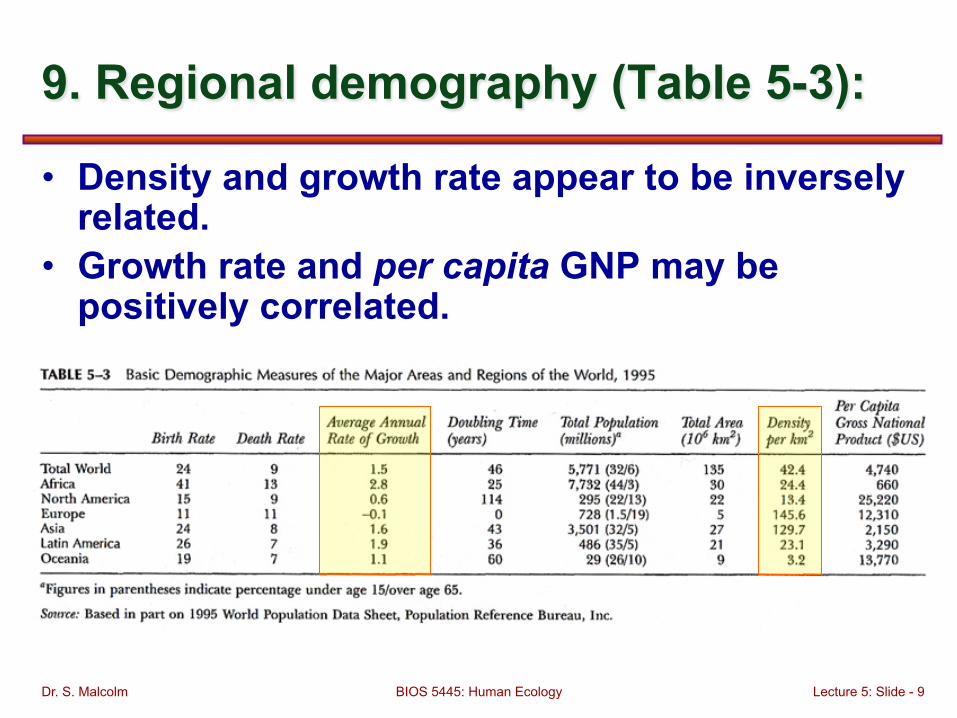
9. Regional demography (Table 5-3):
• Density and growth rate appear to be inversely related.
• Growth rate and per capita GNP may be positively correlated.
BIOS 5445: Human Ecology Dr. S. Malcolm Lecture 5: Slide - 10
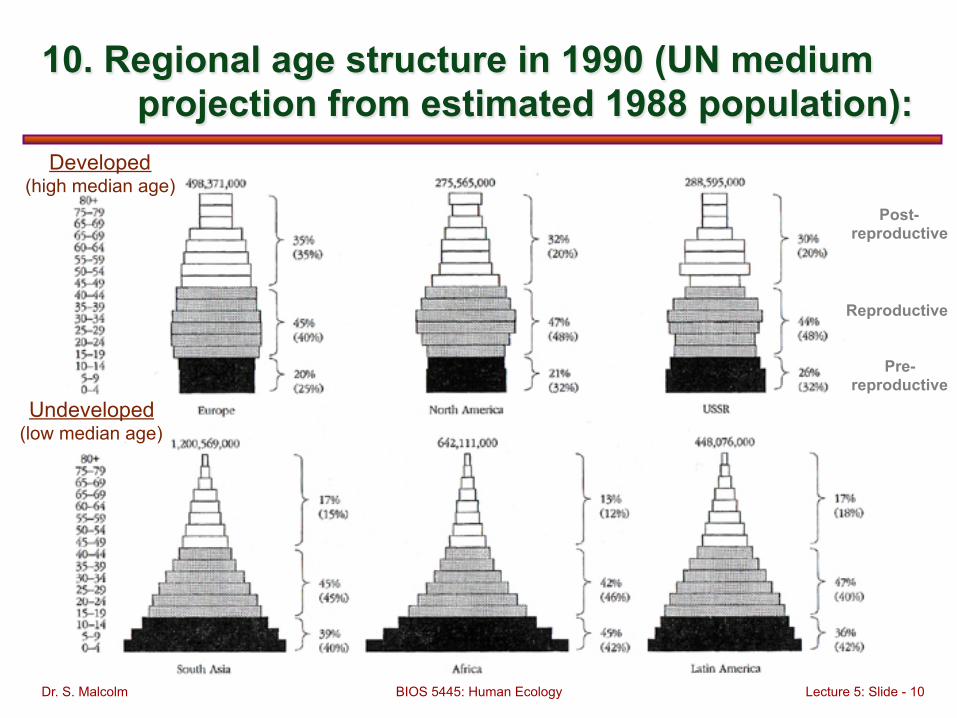
10. Regional age structure in 1990 (UN medium projection from estimated 1988 population):
Developed (high median age)
Undeveloped (low median age)
Pre- reproductive
Reproductive
Post- reproductive
BIOS 5445: Human Ecology Dr. S. Malcolm Lecture 5: Slide - 11
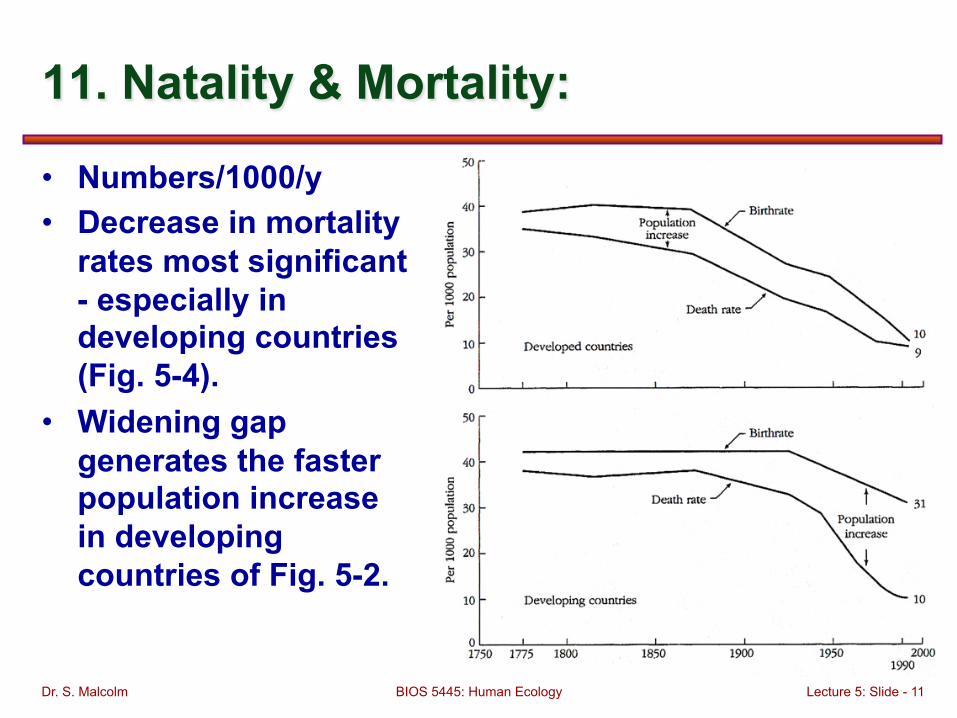
11. Natality & Mortality:
• Numbers/1000/y • Decrease in mortality
rates most significant - especially in developing countries (Fig. 5-4).
• Widening gap generates the faster population increase in developing countries of Fig. 5-2.
BIOS 5445: Human Ecology Dr. S. Malcolm Lecture 5: Slide - 12
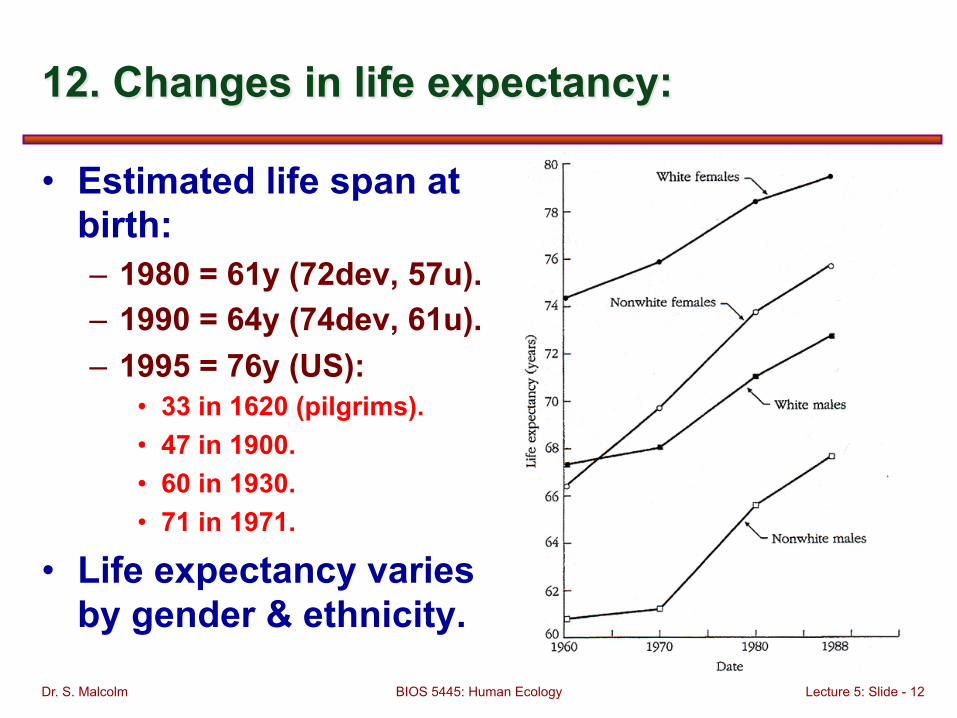
12. Changes in life expectancy:
• Estimated life span at birth: – 1980 = 61y (72dev, 57u). – 1990 = 64y (74dev, 61u). – 1995 = 76y (US):
• 33 in 1620 (pilgrims). • 47 in 1900. • 60 in 1930. • 71 in 1971.
• Life expectancy varies by gender & ethnicity.
BIOS 5445: Human Ecology Dr. S. Malcolm Lecture 5: Slide - 13
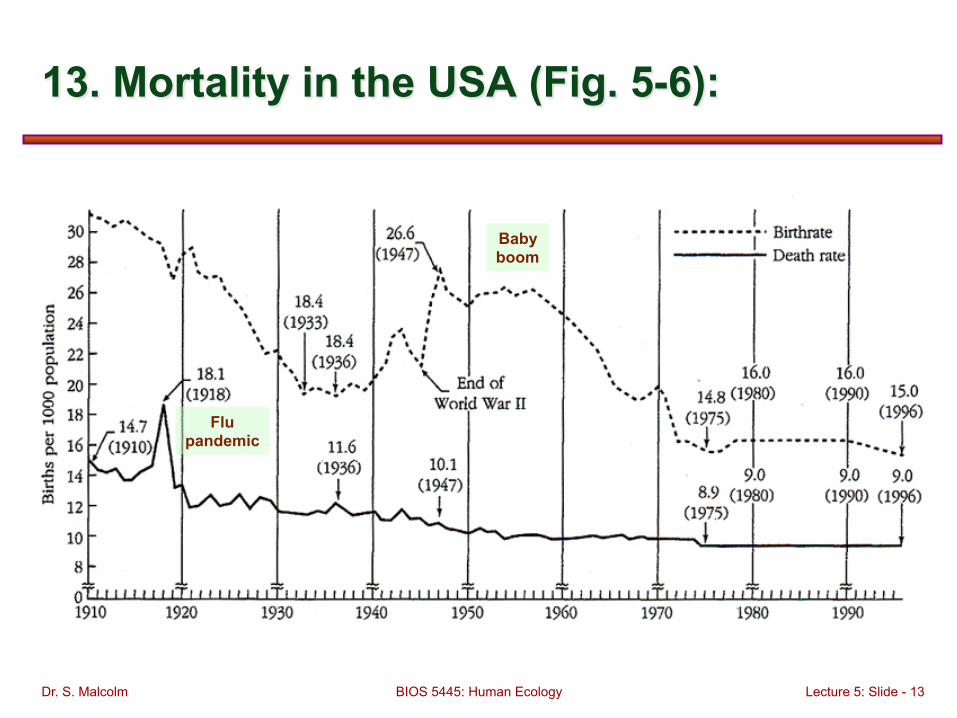
13. Mortality in the USA (Fig. 5-6):
Flu pandemic
Baby boom
BIOS 5445: Human Ecology Dr. S. Malcolm Lecture 5: Slide - 14
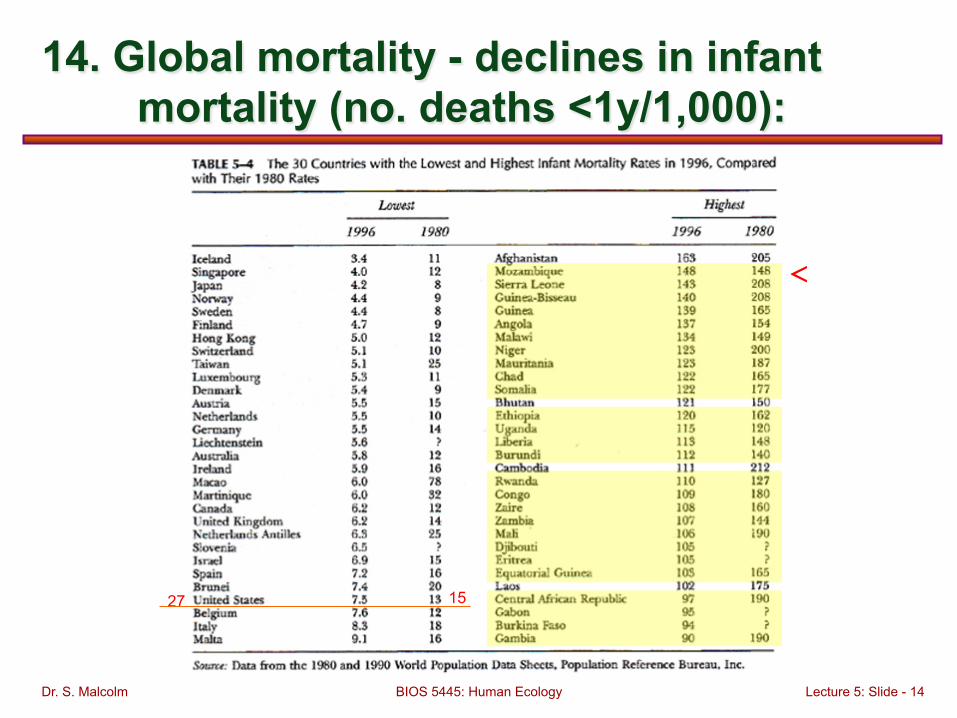
14. Global mortality - declines in infant mortality (no. deaths <1y/1,000):
<
27 15
BIOS 5445: Human Ecology Dr. S. Malcolm Lecture 5: Slide - 15
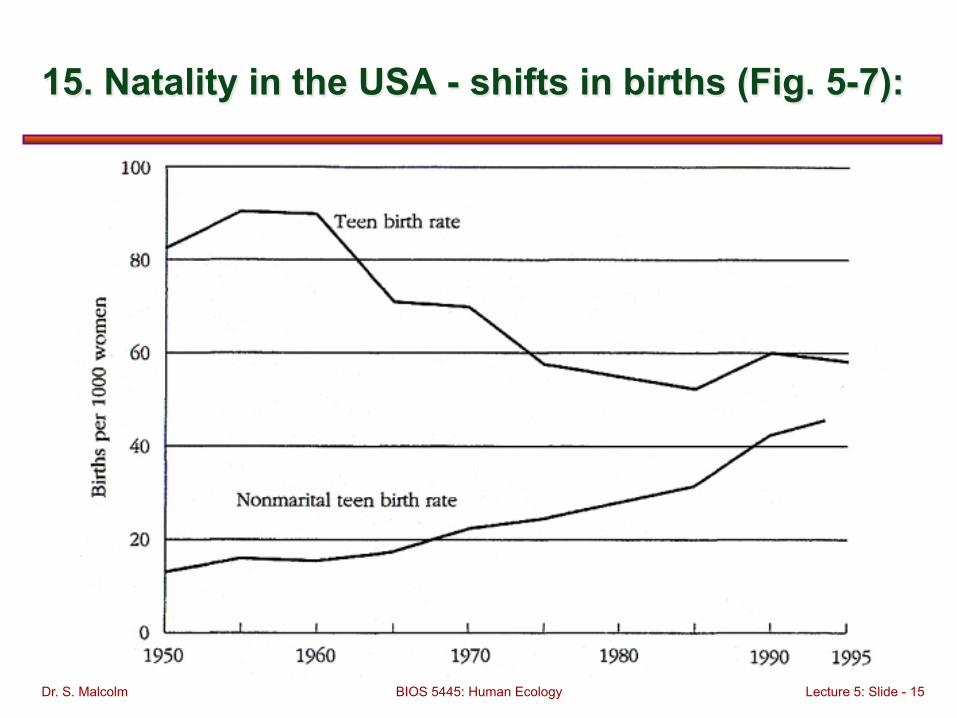
15. Natality in the USA - shifts in births (Fig. 5-7):
BIOS 5445: Human Ecology Dr. S. Malcolm Lecture 5: Slide - 16
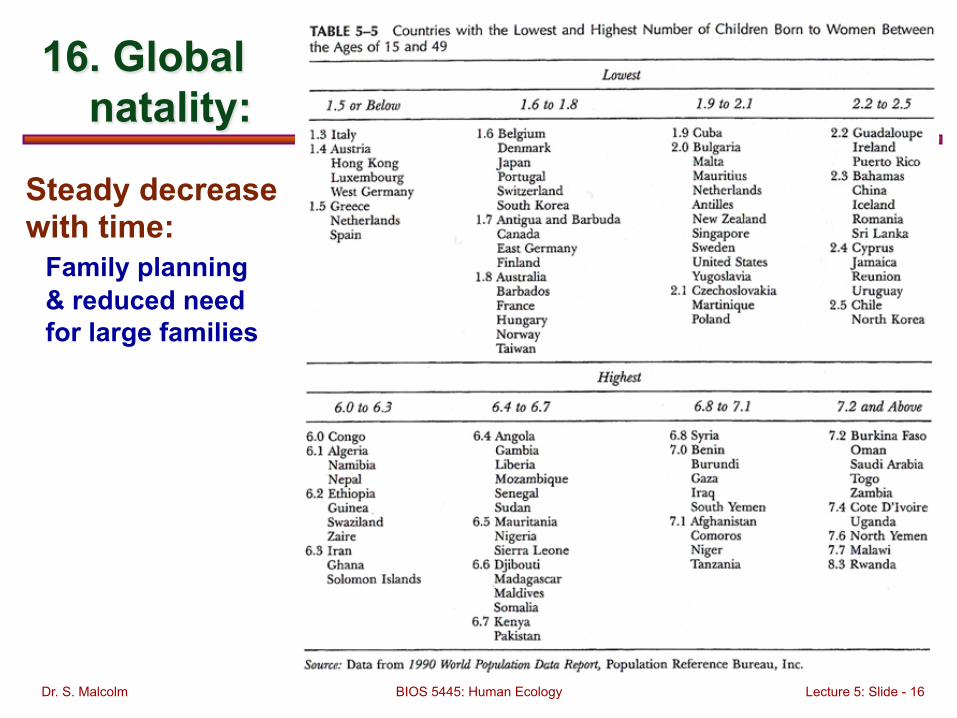
16. Global natality:
Steady decrease with time: Family planning & reduced need for large families
BIOS 5445: Human Ecology Dr. S. Malcolm Lecture 5: Slide - 17
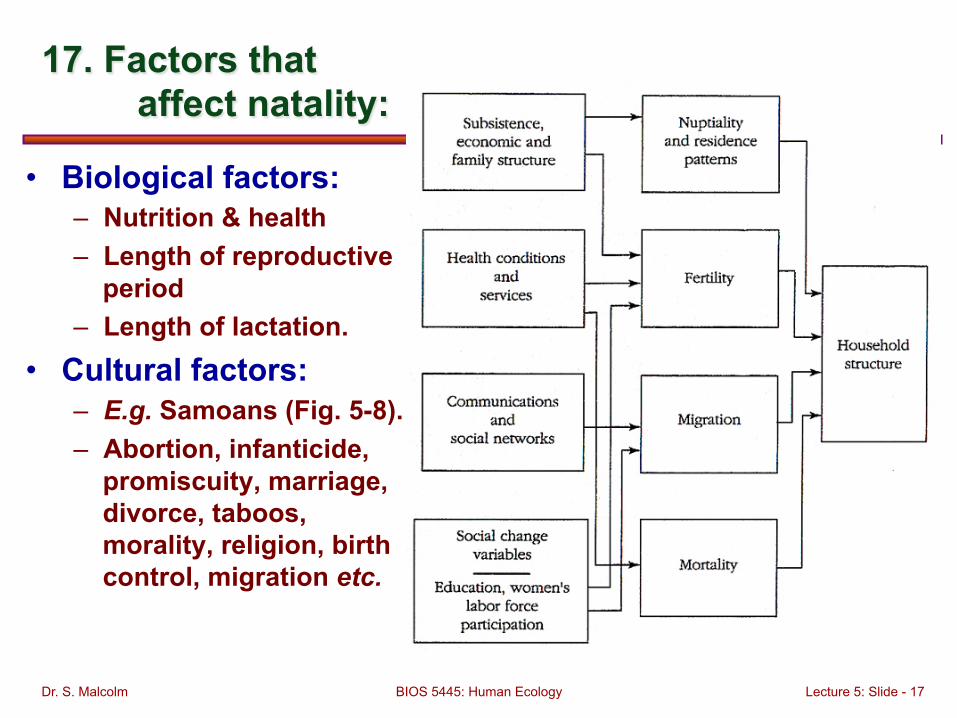
17. Factors that affect natality:
• Biological factors: – Nutrition & health – Length of reproductive
period – Length of lactation.
• Cultural factors: – E.g. Samoans (Fig. 5-8). – Abortion, infanticide,
promiscuity, marriage, divorce, taboos, morality, religion, birth control, migration etc.
BIOS 5445: Human Ecology Dr. S. Malcolm Lecture 5: Slide - 18
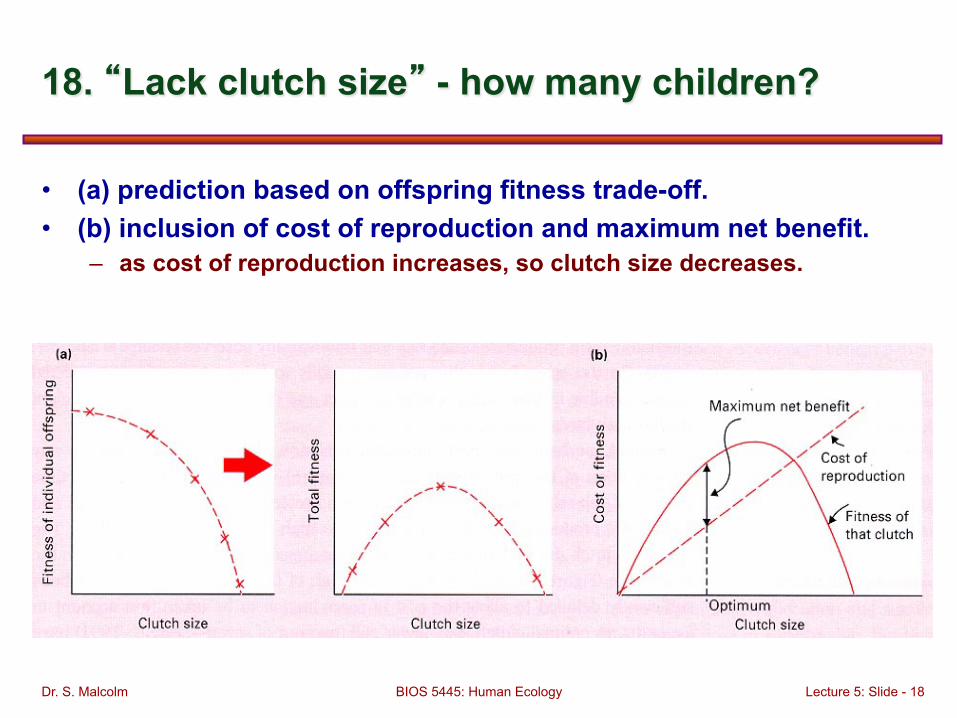
18. “Lack clutch size” - how many children?
• (a) prediction based on offspring fitness trade-off. • (b) inclusion of cost of reproduction and maximum net benefit.
– as cost of reproduction increases, so clutch size decreases.
BIOS 5445: Human Ecology Dr. S. Malcolm Lecture 5: Slide - 19
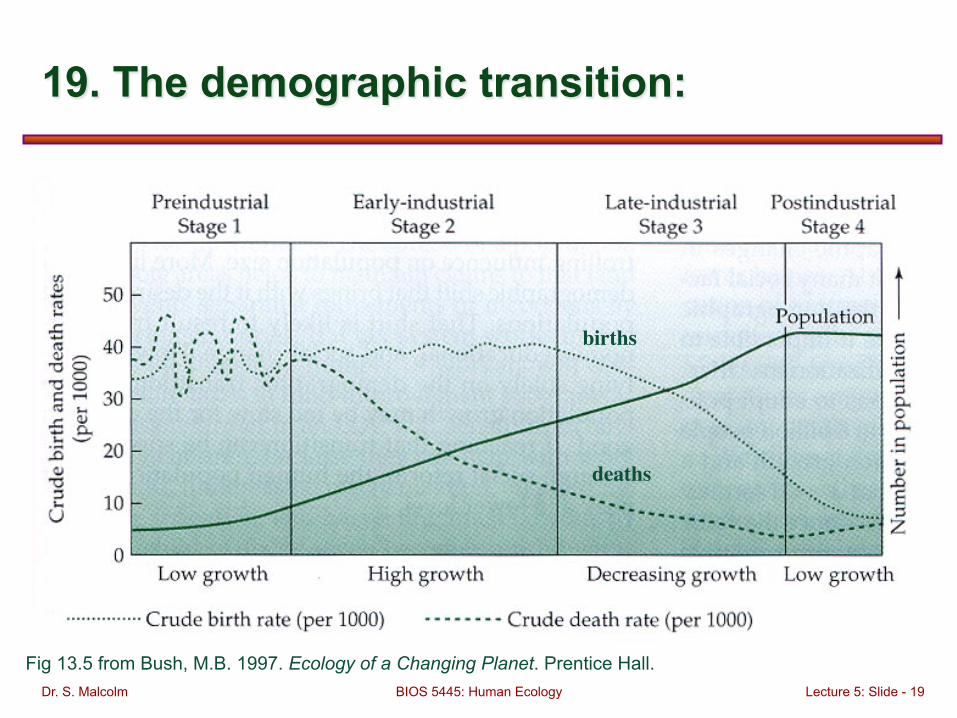
19. The demographic transition:
births
deaths
Fig 13.5 from Bush, M.B. 1997. Ecology of a Changing Planet. Prentice Hall.
BIOS 5445: Human Ecology Dr. S. Malcolm Lecture 5: Slide - 20
20. Implications of population growth:
• Age-structure shift to more older people: – China:
• 4.9% elderly (over 65) in 1982 = 50 million • 5.9% in 1990 = 66 million • 7.0% in 2000 • 13.0% in 2025
• Feeding people: – Starvation and malnutrition:
• World Bank estimated >700 million people in 1986 or 13% of the world lacked enough food for an active healthy life.
• In 1990s 950 million people were chronically malnourished. – Food production.
• Agricultural output increases at about 2% per year - not enough to feed everyone.
BIOS 5445: Human Ecology Dr. S. Malcolm Lecture 5: Slide - 21
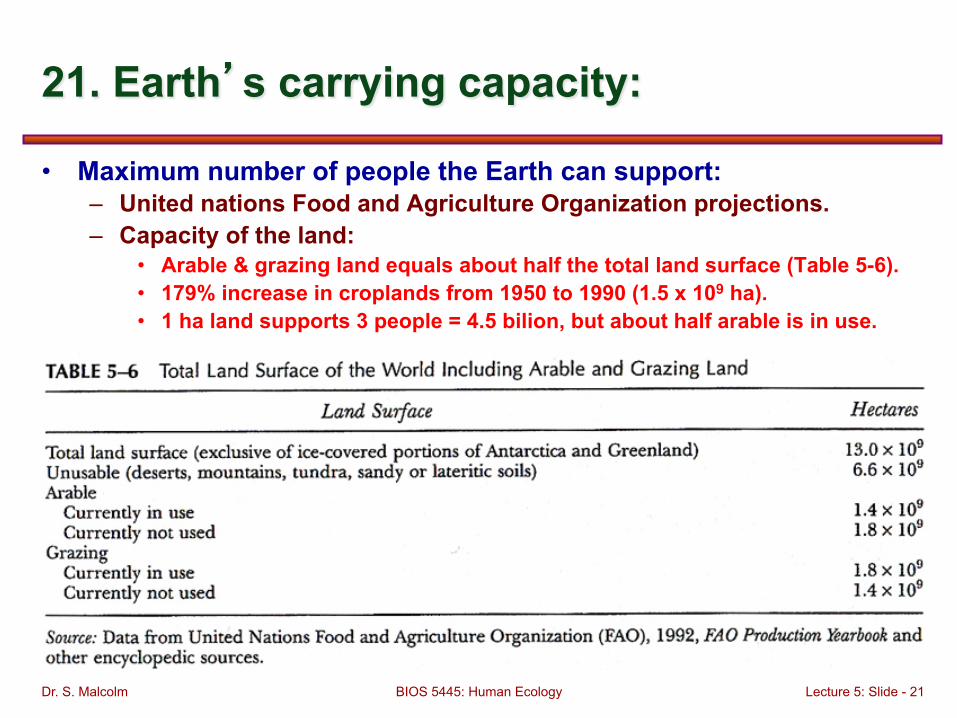
21. Earth’s carrying capacity:
• Maximum number of people the Earth can support: – United nations Food and Agriculture Organization projections. – Capacity of the land:
• Arable & grazing land equals about half the total land surface (Table 5-6). • 179% increase in croplands from 1950 to 1990 (1.5 x 10⁹ ha). • 1 ha land supports 3 people = 4.5 bilion, but about half arable is in use.
BIOS 5445: Human Ecology Dr. S. Malcolm Lecture 6: Slide - 22
22. References: • Begon, M., J.L. Harper & C.R. Townsend. 1996. Ecology. 3rd edition.
Blackwell Science, Oxford, 1068 pp. • Bush, M.B. 1997. Ecology of a Changing Planet. Prentice Hall. • Kormondy, E.J., & D.E. Brown. 1998. Fundamentals of human
ecology. Prentice Hall. 503 pp. • Malthus, T. 1798. An essay on the principle of population. London. • Stiling, P. 2002. Ecology. Theories and applications. 4th edition.
Prentice Hall, Upper Saddle River, NJ, 403 pp.