Bionature, Lisbon, March 2013 Keynote Presentation ... BROMEX over Barrow, AK ... clear sky,...
24
Implications of Arctic sea ice reduction on bromine explosion, ozone depletion, and mercury deposition Keynote Presentation Bionature, Lisbon, March 2013 S. V. Nghiem 1 , P. B. Shepson 2 , W. Simpson 3 , D. K. Perovich 4 , M. Sturm 5 , T. Douglas 5 , I. G. Rigor 6 , P. Clemente- Colón 7 , J. P. Burrows 8,9 , A. Richter 8 , A. Steffen 10 , R. Staebler 10 , D. Obrist 11 , C. Moore 11 , J. Bottenheim 10, retired , U. Platt 12 , D. Pöhler 12 , S. General 12 , J. Zielcke 12 , J. D. Fuentes 13 , D. K. Hall 14 , L. Kaleschke 15 , J. Woods 16 , C. Hager 16 , J. Smith 16 , C. R. Sweet 16 , K. Pratt 2 , K. Custard 2 , P. Peterson 3 , S. Walsh 3 , E. Gleason 3 , E. Saiet 3 , M. Webster 6 , R. Lieb-Lappen 17 , C. Linder 6 , G. Neumann 1 1 Jet Propulsion Laboratory, California Institute of Technology, Pasadena, California, U.S.A. 2 Departments of Chemistry and Earth and Atmospheric Sciences, Purdue University, Lafayette, Indiana, U.S.A. 3 Department of Chemistry, University of Alaska Fairbanks, Fairbanks, Alaska, U.S.A. 4 U.S. Army Cold Regions Research and Engineering Laboratory, Hanover, New Hampshire, U.S.A. 5 U.S. Army Cold Regions Research and Engineering Laboratory, Fairbanks, Alaska, U.S.A. 6 Polar Science Center, Applied Physics Laboratory, University of Washington, Seattle, Washington, U.S.A. 7 National Oceanic and Atmospheric Administration, National Ice Center, Washington, District of Colombia, U.S.A. 8 Institute of Environmental Physics, University of Bremen, Bremen, Germany. 9 Biogeochemistry Programme, NERC Centre for Ecology and Hydrology, Wallingtonford, Oxfordshire, U.K. 10 Science and Technology Branch, Environment Canada, Toronto, ON, Canada. 11 Division of Atmospheric Sciences, Desert Research Institute, Reno, Nevada, U.S.A. 12 Institute for Environmental Physics, University of Heidelberg, Heidelberg, Germany. 13 Department of Meteorology, Penn State, University Park, Pennsylvania, U.S.A. 14 NASA Goddard Space Flight Center, Greenbelt, Maryland, U.S.A. 15 Institute of Oceanography, University of Hamburg, Hamburg, Germany. 16 U.S. Naval Academy, Annapolis, Maryland, U.S.A. 17 Dartmouth College, Hanover, New Hampshire, U.S.A. © 2013. All rights reserved.
Transcript of Bionature, Lisbon, March 2013 Keynote Presentation ... BROMEX over Barrow, AK ... clear sky,...

Implications of Arctic sea ice reduction on bromine explosion, ozone
depletion, and mercury deposition
Keynote Presentation Bionature, Lisbon, March 2013
S. V. Nghiem1, P. B. Shepson2, W. Simpson3, D. K. Perovich4, M. Sturm5, T. Douglas5, I. G. Rigor6, P. Clemente-Colón7, J. P. Burrows8,9, A. Richter8, A. Steffen10, R. Staebler10, D. Obrist11, C. Moore11, J. Bottenheim10, retired, U.
Platt12, D. Pöhler12, S. General12, J. Zielcke12, J. D. Fuentes13, D. K. Hall14, L. Kaleschke15, J. Woods16, C. Hager16, J. Smith16, C. R. Sweet16, K. Pratt2, K. Custard2, P. Peterson3, S. Walsh3, E. Gleason3, E. Saiet3, M.
Webster6, R. Lieb-Lappen17, C. Linder6, G. Neumann1 1Jet Propulsion Laboratory, California Institute of Technology, Pasadena, California, U.S.A. 2Departments of
Chemistry and Earth and Atmospheric Sciences, Purdue University, Lafayette, Indiana, U.S.A. 3Department of Chemistry, University of Alaska Fairbanks, Fairbanks, Alaska, U.S.A. 4U.S. Army Cold Regions Research and
Engineering Laboratory, Hanover, New Hampshire, U.S.A. 5U.S. Army Cold Regions Research and Engineering Laboratory, Fairbanks, Alaska, U.S.A. 6Polar Science Center, Applied Physics Laboratory, University of
Washington, Seattle, Washington, U.S.A. 7National Oceanic and Atmospheric Administration, National Ice Center, Washington, District of Colombia, U.S.A. 8Institute of Environmental Physics, University of Bremen, Bremen,
Germany. 9Biogeochemistry Programme, NERC Centre for Ecology and Hydrology, Wallingtonford, Oxfordshire, U.K. 10Science and Technology Branch, Environment Canada, Toronto, ON, Canada. 11Division of Atmospheric Sciences, Desert Research Institute, Reno, Nevada, U.S.A. 12Institute for Environmental Physics, University of Heidelberg, Heidelberg, Germany. 13Department of Meteorology, Penn State, University Park, Pennsylvania,
U.S.A. 14NASA Goddard Space Flight Center, Greenbelt, Maryland, U.S.A. 15Institute of Oceanography, University of Hamburg, Hamburg, Germany. 16U.S. Naval Academy, Annapolis, Maryland, U.S.A. 17Dartmouth College,
Hanover, New Hampshire, U.S.A.
© 2013. All rights reserved.
Outline
• Arctic sea ice reduction
• Impacts on tropospheric chemical processes

Sea Ice Composition: Two Major Ice Classes • Perennial sea ice: Surviving at
least a summer melt, multi-year age, thick ice, important to ice mass and ice pack stability.
• Seasonal sea ice: Thinner ice, forming and melting away seasonally.

Comparison of: • Satellite results (left column).
• Drift-age model from buoys data(right column).
Red line represents the bound- ary of perennial ice from the the Drift-Age Model (>1 year)
Nghiem, Rigor, Perovich, Clemete-Colón, Weatherly, and Neumann, GRL, 2007.
Sea Ice Composition
5 Nghiem/
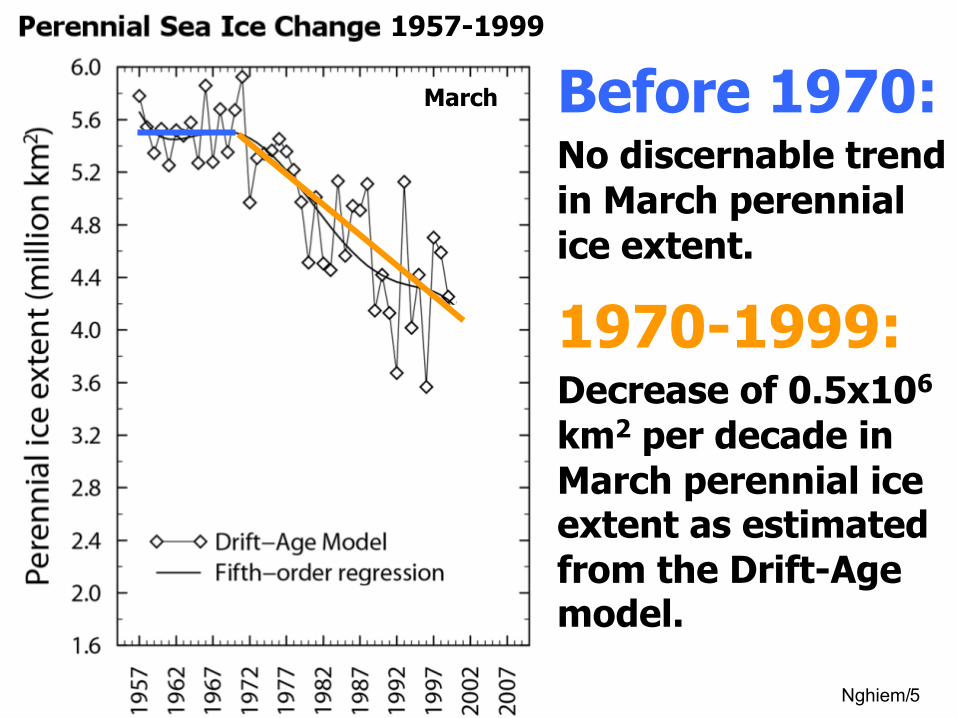
March
1957-1999
` 1970-1999: Decrease of 0.5x10⁶ km2 per decade in March perennial ice extent as estimated from the Drift-Age model.
Before 1970: No discernable trend in March perennial ice extent.

6 Nghiem/
2008
March
TRIPLE THE LOSS RATE in the previous three
decades
2000-2008: Decrease of 1.5x10⁶ km2 per decade in March perennial ice extent as measured from QuikSCAT data and estimated from the Drift-Age model.

Ice compression from East to West Arctic
Ice compression into Transpolar Drift (TD)
Acceleration of TD1 carrying ice out of Arctic via Fram Strait
Warm Atlantic water effectively melted ice in Greenland Sea
‘The Polar Express’ Ice loss mechanism in any season (not just summer)
Nghiem, Rigor, Perovich, Clemete-Colón, Weatherly, Neumann, GRL, 2007

The Polar Express in 2005 Barents-Sea low and Canadian-Basin high anomalies set up
anomalous winds over Fram Basin and Greenland Sea
Dipole anomaly

The Polar Express in 2007
Dipole anomaly

SEA ICE CLASSES
Mixed ice
Perennial
Melt
Seasonal
Animation of sea ice 20 frames per second 9/2008 to 5/2009
ICE LOSS IN WINTER AND SPRING

11 Nghiem/

Warm water from Mackenzie river discharge
sea ice
open water
5 July 2012
sea ice
Map by D. Hall et al.

!
Trend of annual solar heat input to ocean in % (1979-2005). Per- ovich, Light, Eicken, Jones, Ruci-man, and Nghiem (GRL, 2007).
Impacts of Rapid Decrease of Arctic Perennial Sea Ice
• Regime shift: Arctic is dominated by seasonal sea ice.
• Seasonal ice: Younger, thinner, weaker, unstable.
• Lower albedo and more solar heat: Equivalent to ice thin- ning capacity of 1 m. (Perovich and Polashenski, GRL, 2012).

Perennial sea ice reduction
Arctic dominated by seasonal ice
Saltier ice surface over vast region with more: FY, leads,
polynyas, frost flowers
More sources for bromine explosion causing more ozone depletion/mercury deposition
Implications

Photochemical Processes
Cycle 1: destroys O3 and is autocatalytic in that it releases one additional Br atom to the gas phase
Br2 + hν → Br + Br (1) 2(Br + O3 → BrO + O2) (2) 2[BrO + HO2 → HOBr(g) + O2] (3) 2[HOBr(g) → HOBr(l)] (4) 2[HOBr(l) + HBr(l) → H2O(l) + Br2(g)] (5)
Net: 2HO2 + 2HBr + 2O3 + hν → 2H2O + Br2 + 4O2

Photochemical Processes Cycle 2:
BrCl + hν → Cl + Br (6) Br + O3 → BrO + O2 (2) Cl + O3 → ClO + O2 (7) BrO + HO2 → HOBr(g) + O2 (3) ClO + HO2 → HOCl(g) + O2 (8) HOBr(g) → HOBr(l) (4) HOBr(l) + HCl(l) → H2O(l) + BrCl(g) (9)
Net: 2HO2 + HCl(l) + 2O3 + hν → H2O + HOCl(g) + 4O2
Photochemical Processes
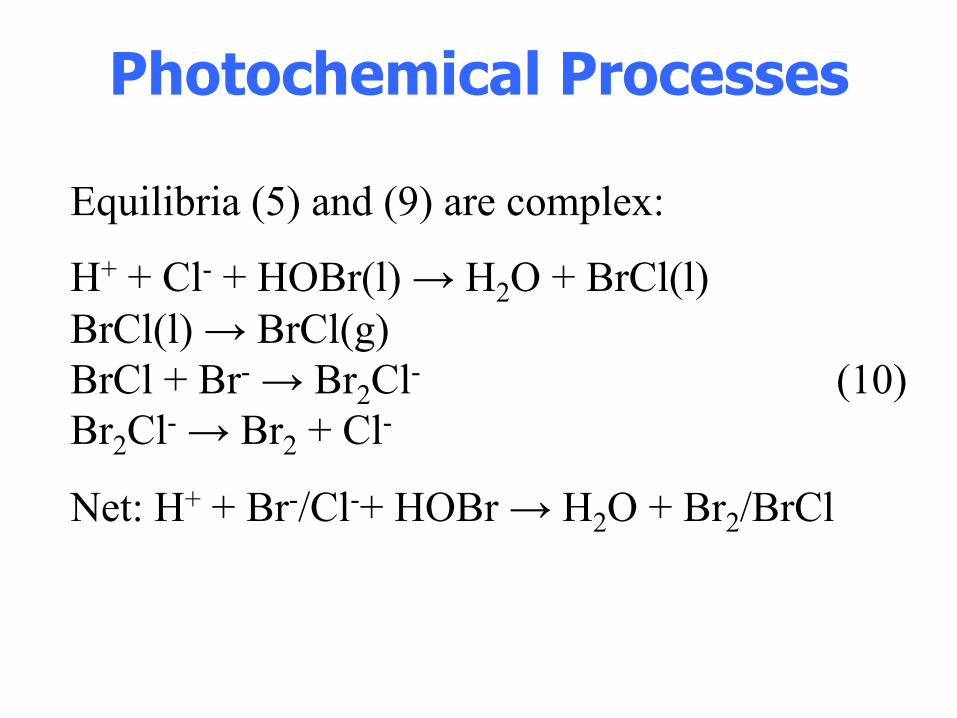
Equilibria (5) and (9) are complex:
H+ + Cl- + HOBr(l) → H2O + BrCl(l) BrCl(l) → BrCl(g) BrCl + Br- → Br2Cl- (10) Br2Cl- → Br2 + Cl-
Net: H+ + Br-/Cl-+ HOBr → H2O + Br2/BrCl

Comparison of pattern of vertical-column BrO observed by GOME-2 satellite (upper panel) with pattern of rising air pattern from model overlaid on topography (lower panel). Results show:
(1) BrO pattern is consistent with RAP in the lower troposphere, and
(2) high mountains limit BrO to the Alaskan North Slope and in the Canadian Shield to the east of Richardson and McKenzie mountains. Nghiem and 17 co-authors, JGR, 2012

Bromine, Ozone, and Mercury EXperiment (BROMEX) Chukchi Sea, Beaufort Sea, Alaskan Arctic, February-April 2012
Objective: Understand and assess the impact of Arctic sea ice reduction on bromine explosion, ozone depletion, and mercury deposition in the Arctic environment. • Satellites: OMI, GOME-2, SCIAMACHY, MODIS (Aqua/Terra), OLS,
Oceansat-2, SSMIS, SMOS, TanDEM-X, Envisat ASAR, RADARSAT-2. • Airborne Components:
² Purdue Airborne Laboratory for Atmospheric Research (ALAR) Aircraft: Bromine, ozone, aerosol, temperature, pressure, wind, vertical profiling.
² NASA P3 IceBridge – flight coordinated with IceBridge; data collected for BROMEX over Barrow, AK (BROMEX has > 5000 surface truths).
• Surface Components: ² IceLanders (chemistry buoys), SVPs/USNA (meteorological buoys) in
Chukchi/Beaufort Seas: Bromine, ozone, wind, temperature, radiation. ² Sea Ice Site: Full mercury speciation/fluxes, forced condensation, snow
tower/sampling, sea ice coring, seawater, meteorology, bio., acoustics. ² Tundra/Land Site: Full mercury speciation/fluxes, bromine/chloride/
ozone suite, radiation tower, weather station, and snow tower/sampling. • Events occurred during BROMEX for new science discoveries:
² Major lead formations (as wide as 50 km), frost flowers, multiple sea ice mixtures (frazil ice, nilas, first-year ice, multi-year ice, ridges).
² Wind change (0 to >20 knots), clear sky, extensive plumes from leads. ² Bromine explosions (like firework), ozone and mercury depletion events
• Publication: Nghiem and 17 coauthors, J. Geophys. Res., volume 117, D00S05, doi:10.1029/2011JD016268, 2012 (in press). • Outreach: NASA Press Release March 2012; outreach activities in Barrow
highest conc. above highest conc. at
flight altitude
Increasing altitude ! decreasing BrO
Purdue’s ALAR
NASA P3 IceBridge
Tundra weather station Tundra surface sensors
Icelanders on sea ice: Chukchi Sea and Beaufort Sea
Land station center
Chemistry instrument
Investigators: PI Son V. Nghiem - JPL; Co-Is from CRREL, Purdue, U. Alaska, U. Washington; Collaborators from > 15 institutions (U.S., Canada, Germany, U.K.)
Ice coring
Snow sampling
Bromine explosion
Barrow
Bromine explosion
11 March 2012 4 April 2012
Sea Ice Site: mercury, sea ice snow, seawater, meteorology biochemistry, acoustics, and optics
USNA buoy

!"#$%&'(')*+#,%#&(
!-""#.(
Satellite Observation of BrO Global Ozone Monitoring Experiment-2 (GOME-2)

Aircraft Observation of BrO
highest conc. above highest conc. at
flight altitude
Increasing altitude → decreasing BrO
(met
er)
P. Shepson of Purdue U., U. Heidelberg, and BROMEX Team

Halogen Activation in the Arctic Boundary Layer
William R. Simpson, Steven J. Walsh, Peter Peterson, and the BROMEX team
Department of Chemistry and Biochemistry and Geophysical Institute, University of Alaska Fairbanks
IceLander-2 on Sea Ice
IceLander-2 drift across lead
Vertical structures of BrO show high levels of BrO that are aloft at times
Polar Bear at IL2

Mercury Measurements • Investigate how sea ice affects deposition and
emission of Hg along the coast and over sea ice • Quantify Hg in the atmosphere and in surface
snow over sea ice and the tundra • Results
– Direct links between atmospheric Hg dynamics and open leads in sea ice
– Snow over sea ice retains more deposited Hg than over tundra
• Importance – Climate change is altering sea ice distribution
which will alter Hg deposition and retention in the Arctic
Sandy Steffen, Ralf Staebler, John Deary (Environment Canada) Daniel Obrist and Chris Moore (Desert Research Institute)
Tom Douglas (Cold Regions Research and Engineering Laboratory)