Biomedical Decision Support - MIT OpenCourseWare · PDF fileHST.951J: Medical Decision...
38
Harvard-MIT Division of Health Sciences and Technology HST.951J: Medical Decision Support, Fall 2005 Instructors: Professor Lucila Ohno-Machado and Professor Staal Vinterbo 6.873/HST.951 Medical Decision Support Fall 2005 Biomedical Decision Support Lucila Ohno-Machado Staal Vinterbo Pete Szolovits
-
Upload
nguyenhuong -
Category
Documents
-
view
215 -
download
0
Transcript of Biomedical Decision Support - MIT OpenCourseWare · PDF fileHST.951J: Medical Decision...

Harvard-MIT Division of Health Sciences and Technology HST.951J: Medical Decision Support, Fall 2005Instructors: Professor Lucila Ohno-Machado and Professor Staal Vinterbo
6.873/HST.951 Medical Decision SupportFall 2005
Biomedical Decision Support
Lucila Ohno-Machado Staal Vinterbo Pete Szolovits

Medical decisions
Maximize value: • Prolong life • Increase quality of life
• Minimize pain • Minimize cost • Match available
resources

HIS
SMART CENTRAL
SMART = Scalable Medical Alert Response Technology
Figures by MIT OCW.

Location
DSM
SDM 2
LSM -
- di
SpO2 ECG Location
Location ( )
Equipment
Cricket beacons
Caregiver PDA
Pattern
Recognition
- Data analysis
- SpO- ECG - Location
priorities rections
via RFID
Patient PDA Cricket listener Sensors
Defibrillator
Cricket listener
1 2 3
SMART Central

Decision Theory
• Game theory – Statistics – Operations research
• Maximize utility – In many domains, this
means maximize $$$

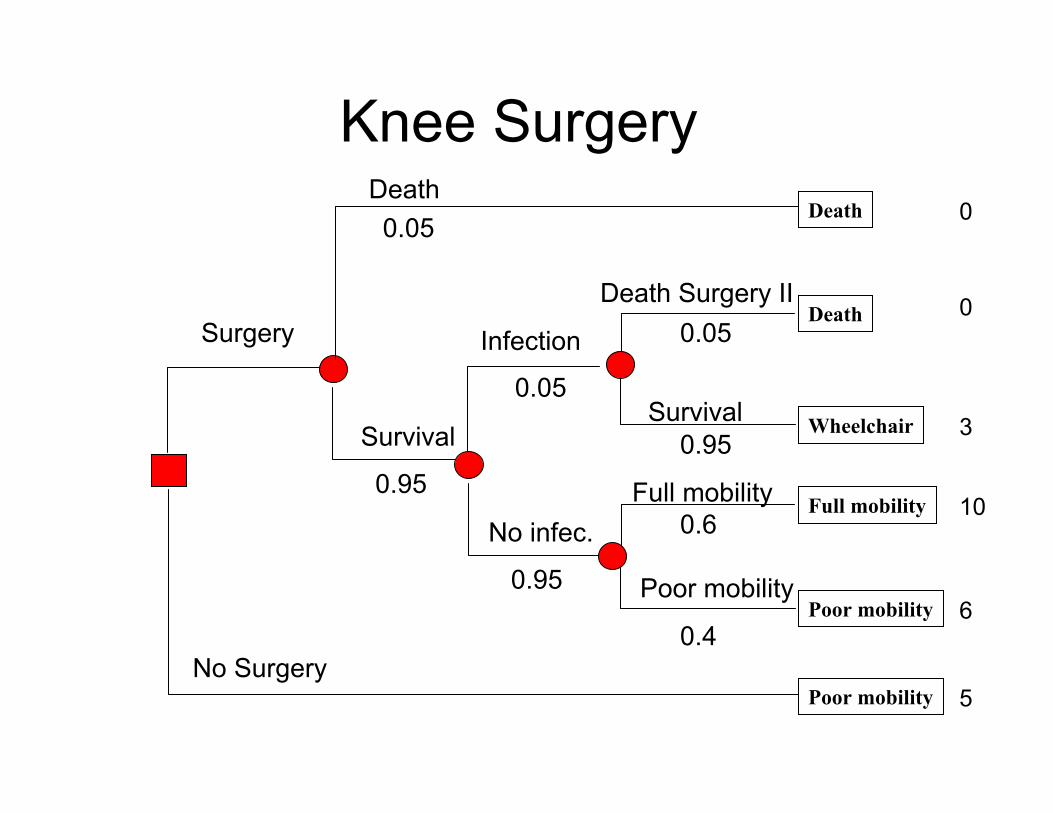
Example of a Decision Problem
• College athlete considering knee surgery
• Uncertainties: – success in recovering perfect mobility – infection in surgery (if so, needs another
surgery and may loose more mobility)– survive surgery

Knee SurgeryDeath
Surgery Death Surgery II
0.05
0.95 Survival
No Surgery
0.05
No infec.
Infection
0.95
0.6
0.4
Poor mobility
0.05
Survival
0.95
Poor mobility
Poor mobility
Full mobility
Wheelchair
Death
Death
Full mobility
0
0
3
10
6
6

Expected Value of Surgery
Surgery
No Surgery
0.05
Infection
0.4
0.05
Survival
Death
0.95
Poor mobility
No infec.
0.95
0.6
Poor mobility Poor mobility
Full mobility
Death
Death Surgery II 0.05
0.95 Survival Wheelchair
Death
7.7
Full mobility
0
0
3
10
6
6

Sensitivity Analysis
•
Surgery
No surgery
Effect of probabilities in the decision 10
Expected Values 6
0 P(Death)

Sensitivity Analysis
•
Surgery
No surgery
Effect of probabilities in the decision 10
Expected Values 6
0
P(Full Mobility)
Knee SurgeryDeath
Surgery Death Surgery II
0.05
0.95 Survival
No Surgery
0.05
No infec.
Infection
0.95
0.6
0.4
Poor mobility
0.05
Survival
0.95
Poor mobility
Poor mobility
Full mobility
Wheelchair
Death
Death
Full mobility
0
0
3
10
6
5

Data
Model Building
Pattern Discovery
SystemEvaluation
Experiment Hypothesis
Predictive Models
Data
Model Building
Pattern Discovery
System Evaluation
Experiment Hypothesis

Objectives• Build models from existing data
– Pattern recognition
• Apply model to new data to predict an unknown feature such as: – Diagnosis – Prognosis (outcome)
Figures removed due to copyright reasons.

G
GG
G
G
CC
CC
C T
TT
TT
T
A
A
A
A
AA
A
GenomeChromosomes
DNA
Proteins Proteins
Cell
Proteins act alone or in complexes to perform many cellular functions
Genes contain instructions for making proteins
Genes
Figure by MIT OCW.
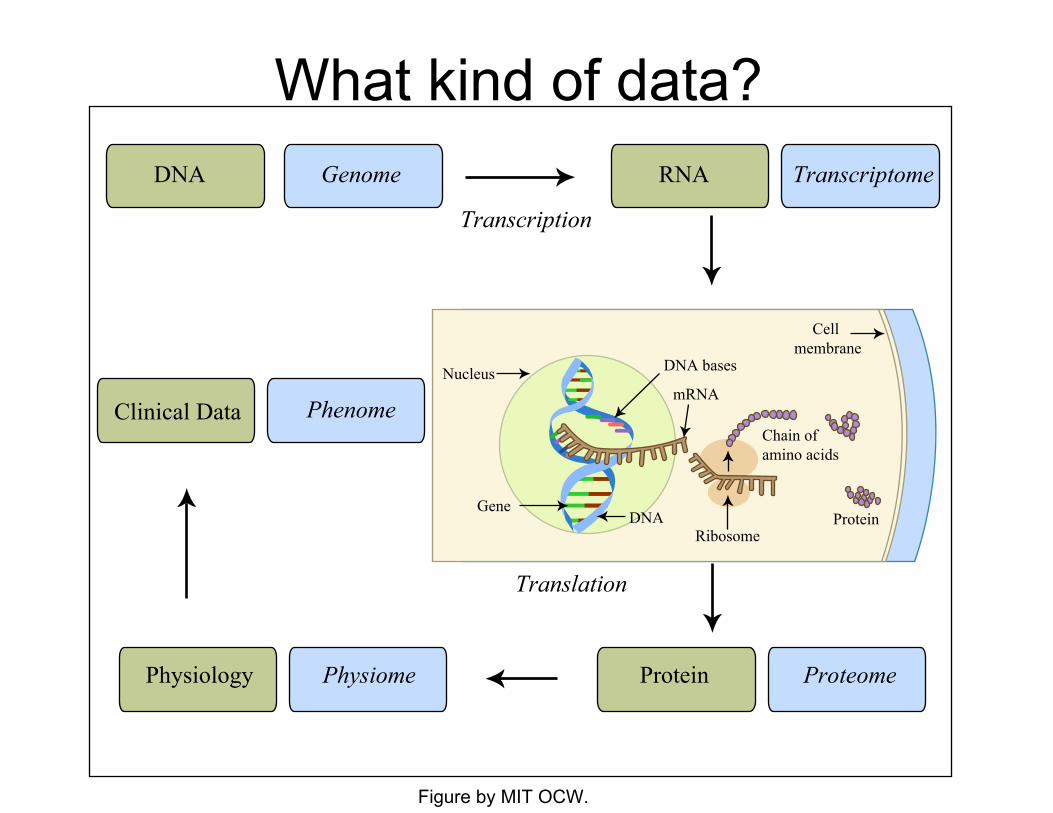
What kind of data?
Nucleus
GeneDNA
DNA bases
mRNA
Chain of amino acids
Cell membrane
ProteinRibosome
DNA Genome
Clinical Data Phenome
Physiology
RNA Transcriptome
Physiome Protein Proteome
Transcription
Translation
Figure by MIT OCW.

Coronary Disease

45
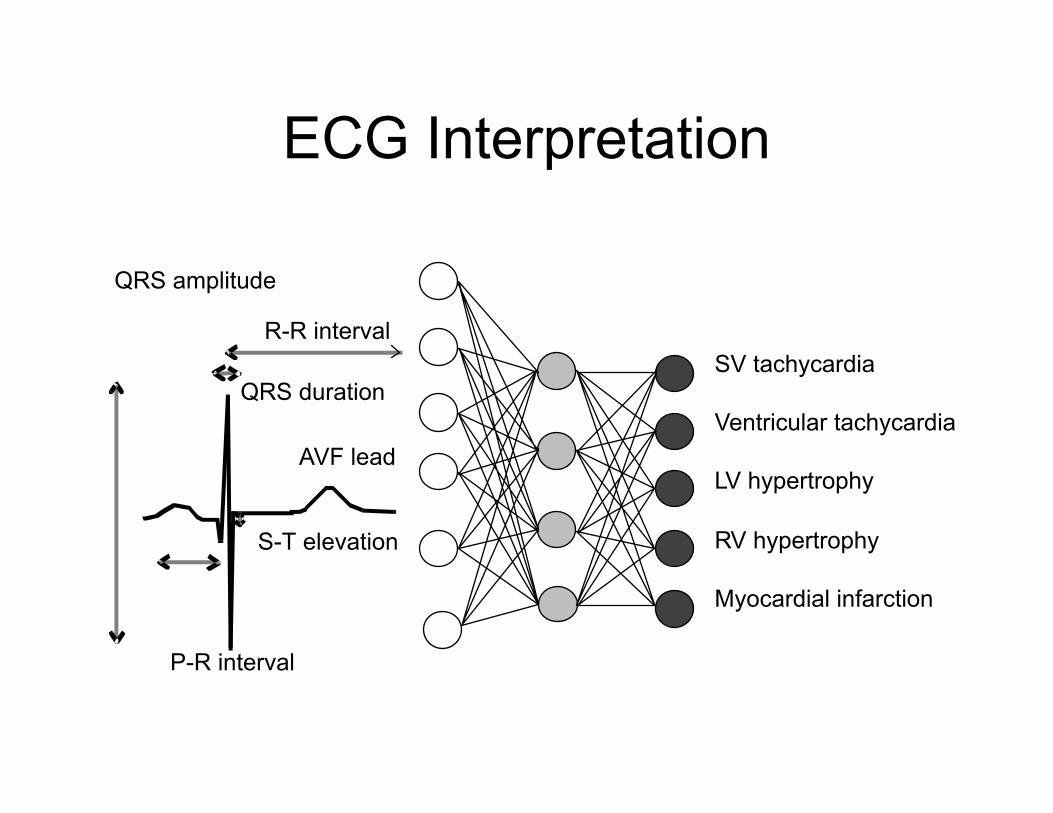
ECG Interpretation
R-R interval
S-T elevation
QRS duration
QRS amplitude
AVF lead
SV tachycardia
Ventricular tachycardia
LV hypertrophy
RV hypertrophy
Myocardial infarction
P-R interval

Risk Score of Death from AngioplastyUnadjusted Overall Mortality Rate = 2.1%
0
500
1000
1500
2000
2500
3000
0%
10%
20%
30%
40%
50%
60%
Risk
Number of Cases
0.4% 1.4%
53.6%
12.4%
21.5%
2.2%
0 to 2 3 to 4 5 to 6 7 to 8 9 to 10 >10
Risk Score Category
Num
ber o
f Cas
es
Mortality
62%
26%
7.6% 2.9% 1.6% 1.3%

Predicting Individual Outcomein Coronary Intervention
Logistic Prognostic Risk Regression Model Score Model
Age > 74yrs B2/C Lesion Acute MI Class 3/4 CHF Left main PCI IIb/IIIa Use Stent Use Cardiogenic Shock Unstable Angina Tachycardic Chronic Renal Insuf.
Odds Ratio p-value
2.51 0.02 2.12 0.05 2.06 0.13 8.41 0.00 5.93 0.03 0.57 0.20 0.53 0.12 7.53 0.00 1.70 0.17 2.78 0.04 2.58 0.06
beta Risk coefficient
0.921 2 0.752 1 0.724 1 2.129 4 1.779 3 -0.554 -1 -0.626 -1 2.019 4 0.531 1 1.022 2 0.948 2
Value

Informed consent
"Informed consent and good clinical practice require a discussion of these risks and benefits, but there is very little data on the degree to which patients comprehend the specifics of this information,"
The researchers found that, of the patients who received angioplasty 42 percent could not identify any risks, and 41 percent could not identify any benefits. For the surgery patients, 45 percent could not identify any risks and 22 percent could not identify any benefits. Furthermore, when asked to quantify the risks of the procedure, 78 percent of the angioplasty and 57 percent of the surgery patients could not.
Alexander et al, 52th ACC meeting

Overview of this Course
Individualized predictionfor decision support inmedical/biologicalproblems
•Theory -- how it works•Practicality -- when to apply •Implementation -- how to apply

Pre-Requisites
6034 -- Intro to AI (Machine Learning) basic statistics, including linear regression
If needed, we will consider optional refresherrecitations:
• basic linear algebra (mostly notation)• basic statistical tests • set theory

Course Structure
• Homeworks, individual (30%) • Midterm (30%) • Final Project • Presentation and write-up – 5 pages plus references,
figures, tables on the web(40%)
• No final exam
Slides available online.Office hours by arrangement. Password protection for posting articles: Username and
password.
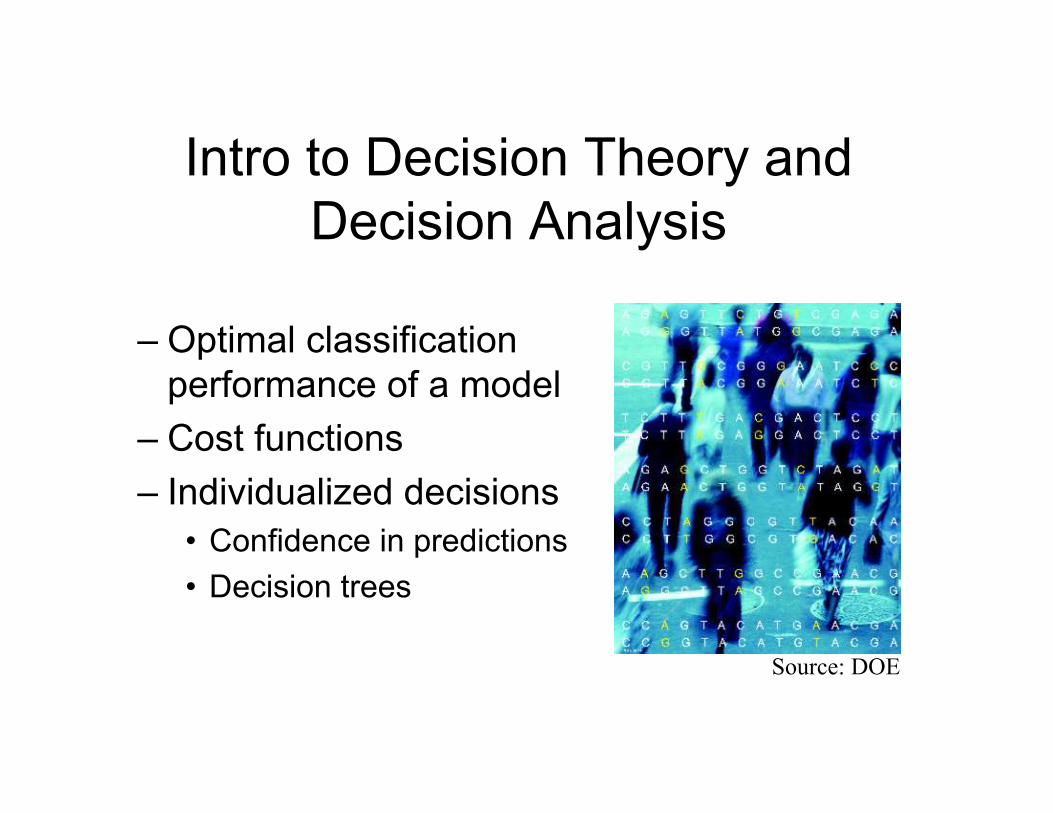
Intro to Decision Theory and Decision Analysis
– Optimal classification performance of a model
– Cost functions – Individualized decisions
• Confidence in predictions • Decision trees
Source: DOE

Simple Models
– Artificial Intelligence • Nearest neighbors • Association rules • Learning from experts
– Statistics • Linear regression • Linear discriminant analysis

Analysis of Failure Times
• Survival analysis • Cox model • Assumptions required for
models • Alternatives

asymmetry
border
detail
color
borderdetail
detail detail
Supervised Methods I• Logistic Regression
– interpretation of coefficients – limitations
• Classification Trees – splitting functions
– pruning – forests
asymmetry
border
detail
color
border detail
< 2
R
< 2
A
detail
Y
> 10
detail
<2
Y “benigh” “benigh” “malig” “malig”
“malig” “benign” “malig” “benign”

Supervised Methods II
• Neural networks – Regularization – Mixture of experts
• Support Vector
34
2
4
.6
.5
.8
.2
.1
.3 .7
.2
Σ
Σ
.4
.2
Σ
Weights Weights Machines
– VC dimension
– Soft margins

Supervised Methods III• Rule-based approaches
– Rough sets – Fuzzy sets
Figures removed due to copyright reasons.
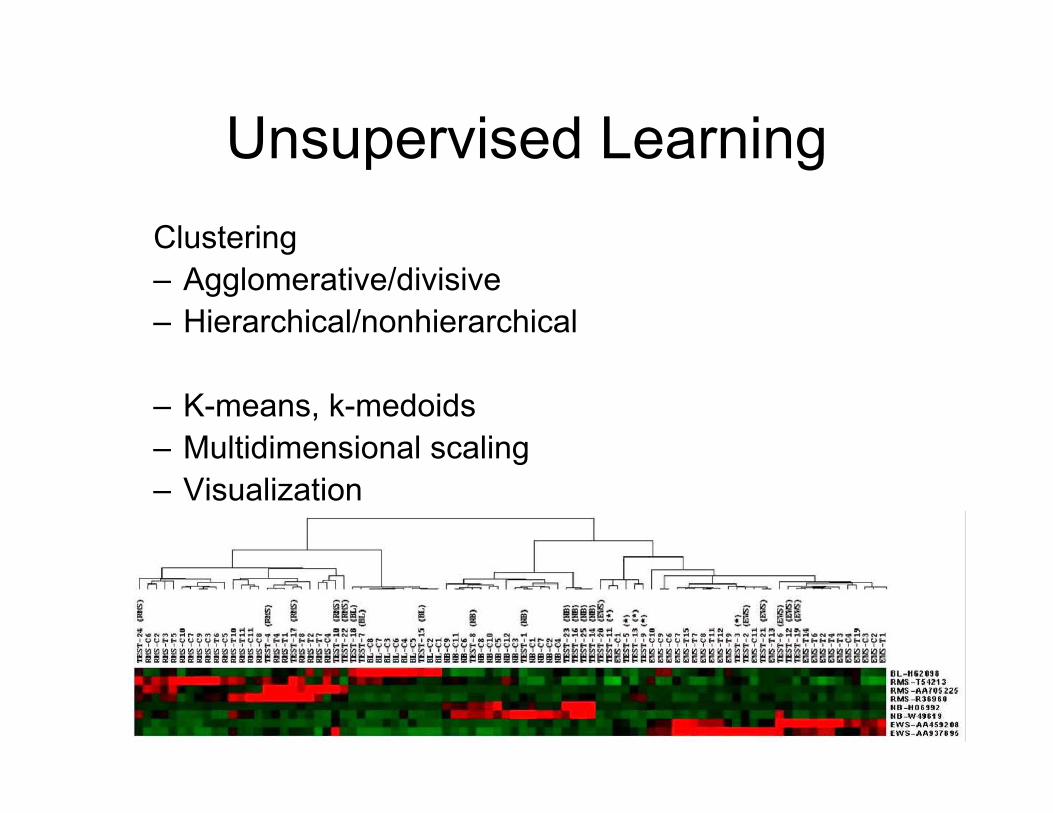
Unsupervised Learning
Clustering – Agglomerative/divisive – Hierarchical/nonhierarchical
– K-means, k-medoids – Multidimensional scaling – Visualization

Dimensionality Reduction
• Pre-processing – Discretization algorithms – Filtering, cleaning
• Compression – Principal components analysis – Partial least squares
• Variable/Model Selection – Multivariate strategies – Interpretation
Stochastic Search
• Approximate solution strategies –Greedy –Annealing –Genetic algorithms
– Ant colony optimization
– Other evolutionary approaches

Evaluation
• How good is the prediction? –Calibration –Discrimination –Bias and variance
• Strategies for evaluation when number of cases is small –Cross-validation–Jackknife –Bootstrap
LR
0.00
0.10
0.20
0.30
0.40
0.50
0.60
0.70
0.80
0.90
1.00
0.00 0.20 0.40 0.60 0.80 1.00
1 - Specificity
Sens
itivi
ty
Score aNN

Improving Performance
Combining Models/Ensembles
• Boosting • Bagging • Stacking

Bioinformatics• Phylogenetic trees • Haplotype tagging (SNP patterns)
Figures by MIT OCW.
ACTCCAA
CCTGCTT
ACGCTAG
ACTGCAT
GTTGCAA2
Sugested General Books
• Duda R, Hart P, Stork Duda, Richard O., Peter E. Hart, and David G. Stork.D. Pattern Classification. 2nd ed. New York, NY: Wiley, 2001.
Pattern Classification ISBN: 0471056693.
Wiley Interscience($103)
• Hastie T, Tibshirani Hastie, Trevor, Robert Tibshirani, and Jerome Friedman.
The Elements of R, Friedman J. The Elements of Statistical Learning: Data Mining,
Inference, and Prediction. New York, NY: Springer, 2001. ISBN: 0387952845.
Statistical LearningSpringer ($67)

Decision Analysis Module
• Chernoff and Moses
Elementary Decision Theory. Dover ($12)
• Hunink et al Decision Making in Health and Medicine: Integrating Evidence and Values. ($65)
Chernoff, Herman and Lincoln E. Moses.Elementary Decision Theory. New York, NY:Dover Publications, 1986, c1959. ISBN: 0486652181.��
Hunink, M.G. Myriam and et. al. Decision Making in Health and Medicine: Integrating Evidence and Values. Cambridge, UK: Cambridge University Press, 2001. ISBN: 0521770297.