Biomedical Application of Hyaluronic Acid Nanoparticles
154
Biomedical Application of Hyaluronic Acid Nanoparticles By Amir Fakhari Submitted to graduate degree program in Bioengineering and the Graduate Faculty of the University of Kansas in partial fulfillment of the requirements for the degree of Doctor of Philosophy Committee members: > ________________________________ Chairperson: Dr. Cory J. Berkland ________________________________ Dr. Michael Detamore ________________________________ Dr. Laird Forrest ________________________________ Dr. Stevin Gehrke ________________________________ Dr. Sarah Kieweg Date Defended: January 19, 2012>
Transcript of Biomedical Application of Hyaluronic Acid Nanoparticles

Biomedical Application of Hyaluronic Acid Nanoparticles
By
Amir Fakhari
Submitted to graduate degree program in Bioengineering
and the Graduate Faculty of the University of Kansas in
partial fulfillment of the requirements for the degree of
Doctor of Philosophy
Committee members: >
________________________________
Chairperson: Dr. Cory J. Berkland
________________________________
Dr. Michael Detamore
________________________________
Dr. Laird Forrest
________________________________
Dr. Stevin Gehrke
________________________________
Dr. Sarah Kieweg
Date Defended: January 19, 2012>

II
The Dissertation Committee for Amir Fakhari
certifies that this is the approved version of the following dissertation:
Biomedical Application of Hyaluronic Acid Nanoparticles
________________________________
Chairperson: Dr. Cory J. Berkland
Date approved: January 19, 2012
III
Abstract
Hyaluronic acid (HA) is a naturally occurring biodegradable polymer with a
variety of applications in medicine including tissue engineering, dermatological fillers,
and viscosupplementation for osteoarthritis treatment. The cytotoxicity of crosslinking
techniques for scaffold fabrication and the high viscosity of viscosupplements have been
issues impeding the development of products from HA. Thus, novel HA biomaterials for
tissue engineering and improved properties of viscosupplements are in demand.
Nanotechnology can be a useful tool to address these needs. The aim of this dissertation
was to synthesize HA nanoparticles and use the fabricated nanoparticles to develop
colloidal systems for these proposed biomedical applications. First, nanoparticles were
successfully synthesized using a technique free of an oil and surfactant. Nanoparticles
then were employed to develop colloidal gels and suspensions. Several methods were
used to characterize nanoparticles, colloidal gels, and colloidal suspensions including
dynamic light scattering, uniaxial compression testing, and rheometry. Factors such as
polymer type, concentration of polymer, and molecular weight of polymer (17, 741, and
1500 kDa) influenced nanoparticle properties. In addition, mixing nanoparticles
composed of 17 kDa HA in deionized water at different concentrations (15%, 30%, and
45% w/v) formed a stable 3-D colloidal gel as a result of physical entanglement of free
polymer chains on the surfaces of nanoparticles. Mechanical and rheological
investigation showed that Young’s modulus, shear modulus, viscosity, and viscoelasticity
of colloidal gels are concentration dependent. These investigations also indicated that the
colloidal gels had recoverable and dynamic properties. Viscous suspensions were also
formed via addition of nanoparticles (17kDa or 1500 kDa) to either deionized water or to
hyaluronic acid solution (1500 kDa). Rheological investigations showed that the viscosity

IV
and the viscoelasticity of the suspensions can be controlled via interactions between
polymer in solution and free polymer chains on the surfaces of nanoparticles. These
interactions were shown to be influenced by type of the nanoparticles (17 kDa or 1500
kDa). Overall, a variety of HA nanoparticle formulations were discovered that enable
new strategies in tissue scaffolding, dermatological filling, and viscosupplementation.

V
To the supreme God and my wonderful family
Without your help, kindness, and support I would never have arrived at this
destination
VI
Acknowledgments
I would like to sincerely and gratefully thank my advisor, Dr. Cory Berkland, for
all of his support, guidance, patience, understanding, and most importantly, his friendship
during my graduate studies at The University of Kansas. I have been fortunately blessed
to have an advisor who gave me a great opportunity to develop my own individuality by
being allowed to work with such independence and at the same time his guidance. He
encouraged me to not only grow as a researcher but as an independent thinker to use
scientific approaches to face the challenges in my future research carrier. For everything
you have done for me, Dr. Berkland, I sincerely appreciate.
I would also like to thank members of my dissertation committee: Dr. Michael
Detamore, Dr. Laird Forrest, Dr. Stevin Gehrke, and Dr. Sarah Kieweg for their
commitment to my dissertation and for their helpful suggestions at different stages of my
research. I would like to thank all faculty members in The Bioengineering Graduate
Program for numerous discussions and lectures that helped me to improve my knowledge
in this area.
I would also like to thank all of my colleagues and collaborators at The University
of Kansas especially, Dr. David Moore, Dr. Sheng-Xue Xie, Dr. Huili Guan, Dr. Nashwa
El Gendy, Dr. Kristin Aillon, Dr. Xiang Wang, Dr. Abdul Baoum, Dr. Supang Khondee,
Dr. Chuda Chittasupho, Dr. Qun Wang, Dr. Zahra Mohammadi, Dr. Joshua Sestak, Dr.
Ahmed Badawi, Dr. Parthiban Selvam, Heather Shinogle, Sarah Neuenswander, Justin
Douglas, Chris Kuehl, Sharadvi Thati, Adel Alghaith, Nabil Alhakamy, Connor Dennis,
Warangkana Pornputtapitak, for their friendship, valuable discussions in science and help
in the lab. I would like to acknowledge all staff in The Bioengineering Graduate Program
and department of Pharmaceutical Chemistry especially, Leigh Ann Fulkerson, Destiny
VII
Poole, Karen Hall, and Nicole Brooks for all of their assistance and support.
Additionally, the years spent in Lawrence would not have been as wonderful without my
friends. I greatly value their friendship and I deeply appreciate their belief in me.
To my past mentors, teachers, and colleagues, Dr. Ramazan Asmatulu at Wichita
State University, Dr. Vikas Sharma, and Dr. Tom Patapoff at Genentech Inc., who
encouraged, inspired, and helped facilitate my pursuit of a graduate science career.
Most importantly, none of this would have been possible without the wonderful
love and support of my family. My special thanks to the persons whom I owe everything
I am today, my parents, Mohammad Mahdi Fakhari and Nahid Tavassoli, for their
unlimited love, concern, support and strength all these years. I would also like to thank
my lovely sister, Shiva Fakhari for her great love and support. Their faith and confidence
in my abilities and in me is what has shaped me to be the person I am today.
Amir Fakhari
December 2011

VIII
Table of content:
Chapter 1: Introduction
1.1. Introduction to hyaluronic acid
1.1.1. History of hyaluronic acid
1.1.2. Properties of hyaluronic acid
1.1.2.1. Chemical properties of hyaluronic acid
1.1.2.2. Biological properties of hyaluronic acid
1.2. Synthesis of hyaluronic acid
1.3. Degradation of hyaluronic acid
1.4. Turnover and possible pathways for elimination of hyaluronic acid
1.5. Biomedical application of hyaluronic acid
1.5.1. Application of hyaluronic acid in tissue engineering
1.5.2. Application of hyaluronic acid as dermal filler
1.5.3. Application of hyaluronic acid in osteoarthritis treatment
1.6. Introduction to thesis
1.7. Design of the thesis
1.8. References
Chapter 2: Fabrication of hyaluronic acid nanoparticles
2.1. Introduction
2.2. Materials and Methods
2.2.1. Materials
2.2.2. Methods
2.2.2.1. Nanoparticle fabrication method
2.2.2.2. Particle size and zeta potential characterization
2.2.2.3. Characterization of bond formation via FTIR
2.2.2.4. Evaluation of crosslinker consumption
2.2.2.5. Statistical analysis
2.3. Results and Discussion
2.3.1. Nanoparticle fabrication and the effect of process parameters on size and charge of
the nanoparticles
2.3.2. Cryo-TEM imaging
2.3.3. Characterization of bond formation via FTIR
2.3.4. Evaluation of crosslinker consumption
2.4. Conclusion

IX
2.5. References
Chapter 3: Application of hyaluronic acid nanoparticles for colloidal gel fabrication
3.1. Introduction
3.2. Materials and Method
3.2.1. Materials
3.2.2. Methods
3.2.2.1. Fabrication of colloidal gel
3.2.2.2. Characterization of colloidal gels via FTIR
3.2.2.3. Swelling experiment
3.2.2.4. Compression testing and mechanical analysis
3.2.2.5. Effect of pH and ionic strength on mechanical properties of
HA colloidal gel
3.2.2.6. Viscoelasticity of HA colloidal gel after fabrication
3.2.2.7. Viscosity of HA colloidal gel
3.2.2.8. HA colloidal gel recovery
3.2.2.8.1. Mechanical dynamic and recovery
3.2.2.8.2. Rheological recovery
3.2.2.8.3. Physical recovery
3.2.2.9. Statistical analysis
3.3. Results
3.3.1. Fabrication of colloidal gel
3.3.2. Characterization of colloidal gels via FTIR
3.3.3. Swelling experiment
3.3.4. Compression testing and mechanical analysis
3.3.5. Effect of pH and ionic strength on mechanical properties of HA
colloidal gel
3.3.6. Viscoelasticity of HA colloidal gel after fabrication
3.3.7. Viscosity of HA colloidal gel
3.3.8. HA colloidal gel recovery
3.3.8.1. Mechanical dynamic and recovery
3.3.8.2. Rheological recovery
3.3.8.3. Physical recovery
3.4. Discussion
2.5. Conclusion
3.4. References
X
Chapter 4: Application of hyaluronic acid nanoparticles in colloidal suspensions as a
potential osteoarthritis treatment
4.1. Introduction
4.2. Materials and Methods
4.2.1. Application of HA nanoparticles simulated Orthovisc® formulation
4.2.1. Mixing HA nanoparticles with HA polymer to reach hyaluronic
acid concentration simulated Orthovisc® formulation
4.2.2. Using HA nanoparticles to reach hyaluronic acid concentration
in Orthovisc® formulation
4.2.1. Viscosity measurement
4.2.2. Viscoelasticity measurement
4.3. Results
4.3.1. Viscosity measurement
4.3.1.1. Mixing HA nanoparticles with HA polymer to reach hyaluronic acid
concentration in the Orthovisc® formulation
4.3.1.2. Using HA nanoparticle formulations at different concentrations
4.3.2. Viscoelasticity measurement
4.3.2.1. Mixing HA nanoparticles with HA polymer to reach hyaluronic acid
concentration in Orthovisc® formulation
4.3.2.2. Using HA nanoparticle formulations at different concentrations
4.4. Discussion
4.5. Conclusion
4.6. References
Chapter 5: Conclusion and future direction
Appendix

1
Chapter 1
Introduction
2
Chapter 1: Introduction
1.1. Introduction to hyaluronic acid
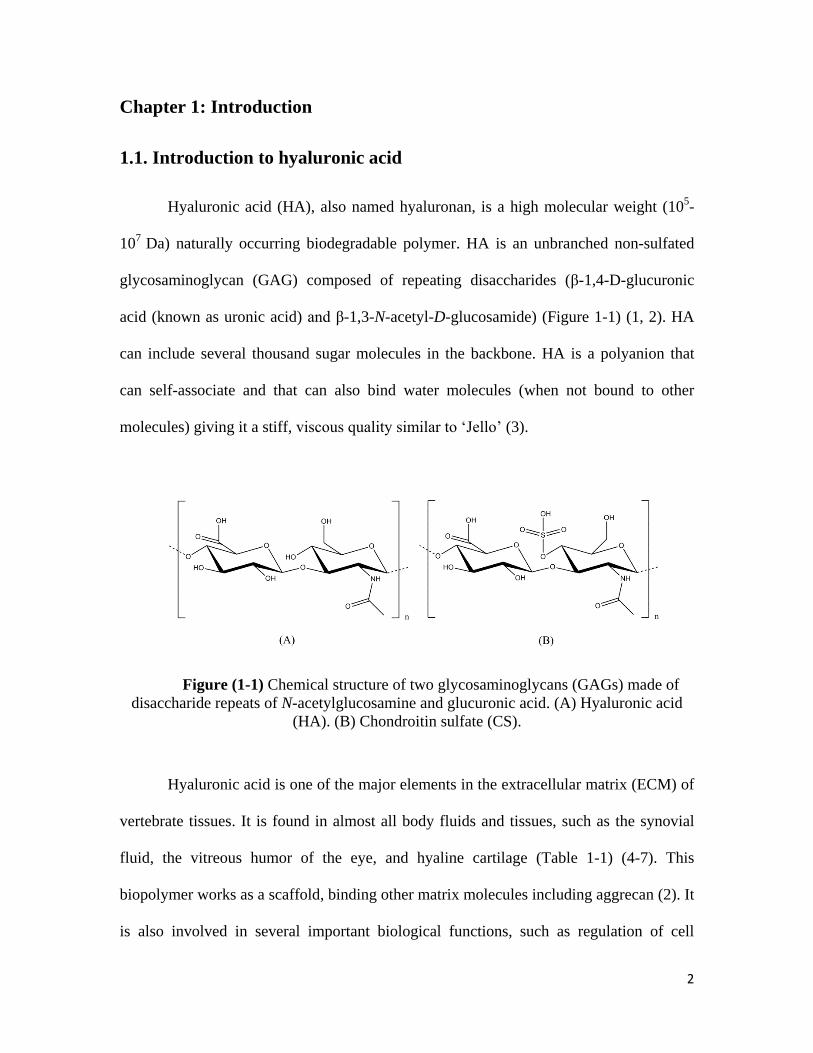
Hyaluronic acid (HA), also named hyaluronan, is a high molecular weight (105-
107
Da) naturally occurring biodegradable polymer. HA is an unbranched non-sulfated
glycosaminoglycan (GAG) composed of repeating disaccharides (β-1,4-D-glucuronic
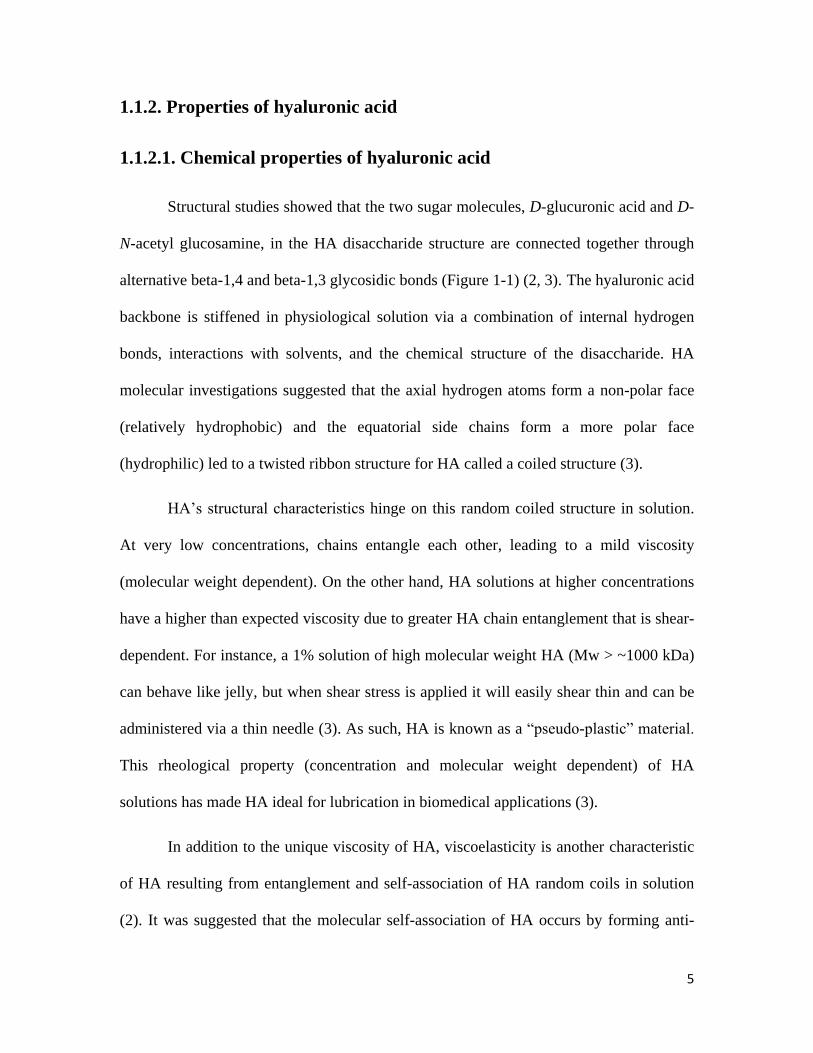
acid (known as uronic acid) and β-1,3-N-acetyl-D-glucosamide) (Figure 1-1) (1, 2). HA
can include several thousand sugar molecules in the backbone. HA is a polyanion that
can self-associate and that can also bind water molecules (when not bound to other
molecules) giving it a stiff, viscous quality similar to ‘Jello’ (3).
Figure (1-1) Chemical structure of two glycosaminoglycans (GAGs) made of
disaccharide repeats of N-acetylglucosamine and glucuronic acid. (A) Hyaluronic acid
(HA). (B) Chondroitin sulfate (CS).
Hyaluronic acid is one of the major elements in the extracellular matrix (ECM) of
vertebrate tissues. It is found in almost all body fluids and tissues, such as the synovial
fluid, the vitreous humor of the eye, and hyaline cartilage (Table 1-1) (4-7). This
biopolymer works as a scaffold, binding other matrix molecules including aggrecan (2). It
is also involved in several important biological functions, such as regulation of cell

3
adhesion and cell motility, manipulation of cell differentiation and proliferation, and
providing biomechanical properties of tissues (5). Several cell surface receptors such as
CD44, RHAMM, and ICAM-1 interact with HA influencing cellular processes including
morphogenesis, wound repair, inflammation, and metastasis (8-11). Moreover, HA is
responsible for supporting the viscoelasticity of biofluids (synovial fluid and vitreous
humor of the eye) and controlling tissue hydration and water transport (3). In addition,
HA has been found during embryonic development, suggesting materials composed of
HA may persuade favorable conditions for tissue regeneration and growth (Table 1-1)
(12-16).
Table (1-1) Examples of body tissues/fluids that contain HA. Table was regenerated with
permission (2, 17).
Tissue or body fluid Concentration
(µg/g; µg/ml) Remarks
Umbilical cord 4100 Primary high molecular weight HA.
Joint (synovial) fluid 1400-3600 Decreasing HA concentration occurs due to increasing the synovial fluid volume
under inflammatory conditions.
Vitreous body 140-500 During tissue maturation, HA concentration increases.
Cartilage - HA works as a scaffold for the binding of other matrix molecules such as aggrecan.
Dermis 200-500 HA is used as a “rejuvenating” agent in cosmetic dermatology.
Epidermis 100 High HA concentration was observed around the cells that synthesized dermis.
Thoracic lymph 0.2-50 HA molecular weight affects inflammatory response and cell binding.
HA’s characteristics including its consistency, biocompatibility, and
hydrophilicity have made it an excellent moisturizer in cosmetic dermatology and skin-
care products (3). Moreover, its unique viscoelasticity and limited immunogenicity have
led it to be used in several biomedical applications such as viscosupplementation in
osteoarthritis treatment, as a surgical aid in ophthalmology, and for surgical wound

4
regeneration in dermatology (3, 4). In addition, HA has currently been explored as a drug
delivery agent for different routes such as nasal, pulmonary, ophthalmic, topical and
parenteral (3, 18).
1.1.1. History of hyaluronic acid
In 1934, Karl Meyer and his colleague John Palmer were the first investigators
who discovered and isolated HA from the vitreous body of cows’ eyes (2, 3). In the
1950s, the chemical structure of HA was solved by this group. They found that HA is
composed of two sugar molecules (D-glucuronic acid (known as uronic acid) and D-N-
acetyl glucosamine) and called it hyaluronic acid (hyaluronan). This name is derived
from “hyalos” (the Greek word for glass + uric acid). Initially, they isolated HA as an
acid but it behaved like a salt in physiological conditions (sodium hyaluronate) (2-4). At
the time, they did not fully appreciate their discovery of one of the most interesting and
important biological macromolecules. Several years after them in 1942, Endore Balazs
patented the first application of HA as a substitute for egg white in bakery products (3).
The first biomedical application of HA took place in late 1950s when HA was
used for a vitreous substitution/replacement during eye surgery. For medical applications,
HA was initially isolated from umbilical cord and shortly afterward, from rooster combs
(3, 4). Later on, HA was isolated from other sources and the structural/biological
characteristics of this polysaccharide were investigated more deeply in several
laboratories (3).
5
1.1.2. Properties of hyaluronic acid
1.1.2.1. Chemical properties of hyaluronic acid
Structural studies showed that the two sugar molecules, D-glucuronic acid and D-
N-acetyl glucosamine, in the HA disaccharide structure are connected together through
alternative beta-1,4 and beta-1,3 glycosidic bonds (Figure 1-1) (2, 3). The hyaluronic acid
backbone is stiffened in physiological solution via a combination of internal hydrogen
bonds, interactions with solvents, and the chemical structure of the disaccharide. HA
molecular investigations suggested that the axial hydrogen atoms form a non-polar face
(relatively hydrophobic) and the equatorial side chains form a more polar face
(hydrophilic) led to a twisted ribbon structure for HA called a coiled structure (3).
HA’s structural characteristics hinge on this random coiled structure in solution.
At very low concentrations, chains entangle each other, leading to a mild viscosity
(molecular weight dependent). On the other hand, HA solutions at higher concentrations
have a higher than expected viscosity due to greater HA chain entanglement that is shear-
dependent. For instance, a 1% solution of high molecular weight HA (Mw > ~1000 kDa)
can behave like jelly, but when shear stress is applied it will easily shear thin and can be
administered via a thin needle (3). As such, HA is known as a “pseudo-plastic” material.
This rheological property (concentration and molecular weight dependent) of HA
solutions has made HA ideal for lubrication in biomedical applications (3).
In addition to the unique viscosity of HA, viscoelasticity is another characteristic
of HA resulting from entanglement and self-association of HA random coils in solution
(2). It was suggested that the molecular self-association of HA occurs by forming anti-
6
parallel double helices, bundles and ropes. Further experiments verified that HA chain–
chain association occured in solution. Moreover, studies proposed that hydrogen bonding
between adjacent saccharides occurred alongside mutual electrostatic repulsion between
carboxyl groups, thus stiffening HA (3, 6, 19). Viscoelasticity of HA can be tied to these
molecular interactions which are also dependent on concentration and molecular weight.
Electrostatic and ionic effects on HA were evaluated as a function of counter-ion
type and valency. Studies suggested that these greatly affect rheological and
hydrodynamic properties of HA. In one study, the effect of electrostatic and ionic
interactions was investigated by comparing HA solution properties in deionized water
(D.I.), 0.5 M NaCl, and 0.5 M NaOH. This study showed that solution properties affect
the hydrogen bonding and electrostatic interaction between the solution and HA resulting
in a change in HA chain stiffness (2, 20). Moreover, the hydrodynamic radius of HA was
found to be greater in D.I. water than in 0.5 M NaCl or 0.5 NaOH (D.I. water > 0.5M
NaCl > 0.5M NaOH) (2).
1.1.2.2. Biological properties of hyaluronic acid
As mentioned before, hyaluronic acid performs several structural tasks in the
extracellular matrix (ECM) as it binds with cells and other biological components
through specific and non-specific interactions. Several extracellular matrix proteins are
stabilized upon binding to HA. Specific molecules and receptors that interact with HA are
involved in cellular signal transduction; molecules such as aggrecan, versican, and
neurocan, and receptors including CD44, RHAMM, TSG6, GHAP, and LYVE-1 are
examples of cell components that bind to HA (3). Between these receptors, CD44 and

7
RHAMM seem to have received more attention since they are found to be involved in
cancer metastases (3, 21-23). CD44 is a structurally variable and multifunctional cell
surface glycoprotein on most cell types and is perhaps the best characterized
transmembrane HA receptor so far. Due to its wide distribution and based on current
knowledge, CD44 is considered to be the primary HA receptor on most cell types (3, 24).
Hyaluronic acid also stimulates gene expression in macrophages, endothelial
cells, eosinophils, and certain epithelial cells. High molecular weight HA does not seem
to be involved in gene expression and only low/intermediate molecular weight HA
(2×10⁴-4.5×10
5 Da) is known to promote gene expression (3, 25, 26). As an example, HA
is also known to have an important role in wound healing and scar formation. Products of
HA degradation (low molecular weight HA) are identified to contribute in the scar
formation process. Moreover, scar formation was minimized when high molecular weight
HA was found in wound fluid during fetal wound healing. These results suggested that
the molecular weight of HA plays a significant role in wound healing and scar formation.
The findings also suggested that high molecular weight HA favored cell quiescence and
supported tissue integrity, whereas production of HA fragments signaled injury and
initiated the inflammatory response (2, 3, 27).
8
1.2. Synthesis of hyaluronic acid
Hyaluronic acid is a natural polymer biologically synthesized by cells in the body
via an enzymatic process. HA production is a unique, highly controlled, and continuous
process in which HA is produced and secreted by fibroblasts, keratinocytes, or
chondrocytes. The Golgi network is the production site for most glycosaminoglycans. In
tissues such as skin and cartilage where HA comprises a large portion of the tissue mass,
the level of HA synthesis is very high. HA is naturally synthesized by hyaluronan
synthases (HAS1, HAS2, and HAS3), a class of integral membrane proteins (3, 28). In
HA production by hyaluronan synthase enzymes, large linear polymers of the repeating
disaccharide units are made. The mechanism of HA synthesis involves chain extension
by addition of a monosaccharide (alternating addition of glucuronic acid and N-acetyl
glucosamine) to the reducing end of the chain (2). The number of repeat disaccharides in
a completed HA molecule can reach as high as 10,000 or more and a molecular weight of
around 4 million Daltons (molecular weight of each disaccharide is about 400 Daltons).
Since the average length of a disaccharide is about 1 nm, a HA molecule of 10,000
repeats could extend 10 µm if stretched from end to end (approximately equal to the
diameter of a human erythrocyte) (3, 29).
1.3. Degradation of hyaluronic acid
Degradation of HA is a step-wise process that can occur via enzymatic or non-
enzymatic reactions. Three types of enzymes (hyaluronidase, β-D-glucuronidase, and β–
N-acetyl-hexosaminidase) are involved in enzymatic degradation of hyaluronic acid.
9
These enzymes are found in various forms, in the intercellular space and in serum.
Hyaluronidase cleaves high molecular weight HA into smaller fragments while the other
two enzymes degrade the fragments by removing non-reducing terminal sugars (3, 17,
30). It was observed that cleavage can occur in a single glycosidic bond on the HA
backbone causing fragmentation or the enzyme can remove a single monosaccharide unit
from the HA backbone (30). Enzymes not only help to degrade HA but also play an
important role defining HA. For instance, enzymes available in the cytosol of cells are
involved in basic biological processes including trimming of oligosaccharides (30).
Non-enzymatic mechanisms often degrade HA via thermal or shear stress. In
addition, chemical reactions such as acidic/alkaline hydrolysis and degradation by
oxidants are categorized as non-enzymatic degradation pathways for HA (17, 30, 31).
Ultrasonication degrades HA in a non-random fashion. Studies suggested that high
molecular weight HA chains degrade slower than low molecular weight HA chains
subjected to ultrasonication (2, 30). Heat is another type of stress leading to HA
degradation. Rheological studies on HA solutions showed that increasing temperature
resulted in degradation and decreased viscosity exponentially as a function of
temperature (30).
Similar to other polysaccharides, acid and alkaline conditions can hydrolyze HA.
This type of degradation occurs in a random fashion often resulting in disaccharide
fragment production. Acidic hydrolysis degrades the glucuronic acid moiety. On the
other hand, alkaline hydrolysis occurs on N-acetylglucosamine units (30). HA can also
degrade via oxidation. Reactive oxygen species (ROS) can be generated from cells as a
consequence of aerobic respiration. Superoxide anions, hydroxyl radicals, and

10
hypochloride are examples of these species that cause HA chain cleavage. ROS are
proposed to be involved in several inflammatory and biodegenerative processes such as
arthritis but their mechanism of action in the disease are myriad and still largely unknown
(2, 30).
1.4. Turnover and possible pathways for elimination of hyaluronic acid
Studies showed that the concentration of HA in the human body varies from a
high concentration of 4 g/kg in umbilical cord, 2-4 g/L in synovial fluid, 0.2 g/kg in
dermis, and about 10 mg/L in thoracic lymph, to a low concentration of 0.1-0.01 mg/L in
normal serum. In a normal human body (70 kg), the total HA body content is
approximately 15 g (2, 3). From this 15 g, the largest amount was found in the
extracellular matrix (ECM) of skin and musculoskeletal tissue. Depending on the location
of HA in the body, most of the HA is catabolized within days. Studies suggested that the
normal half-life of HA varies from 1-3 weeks in inert tissues such as cartilage, 1-2 days
in the epidermis of skin, to 2-5 minutes in blood circulation. Besides enzymatic
degradation and non-enzymatic degradation pathways described previously, two more
pathways are engaged in HA catabolism: turnover (internalization and degradation within
tissue) and release from the tissue matrix, drainage into the vasculature, and clearance via
lymph nodes, liver, and kidney (Figure 1-2) (2).
11
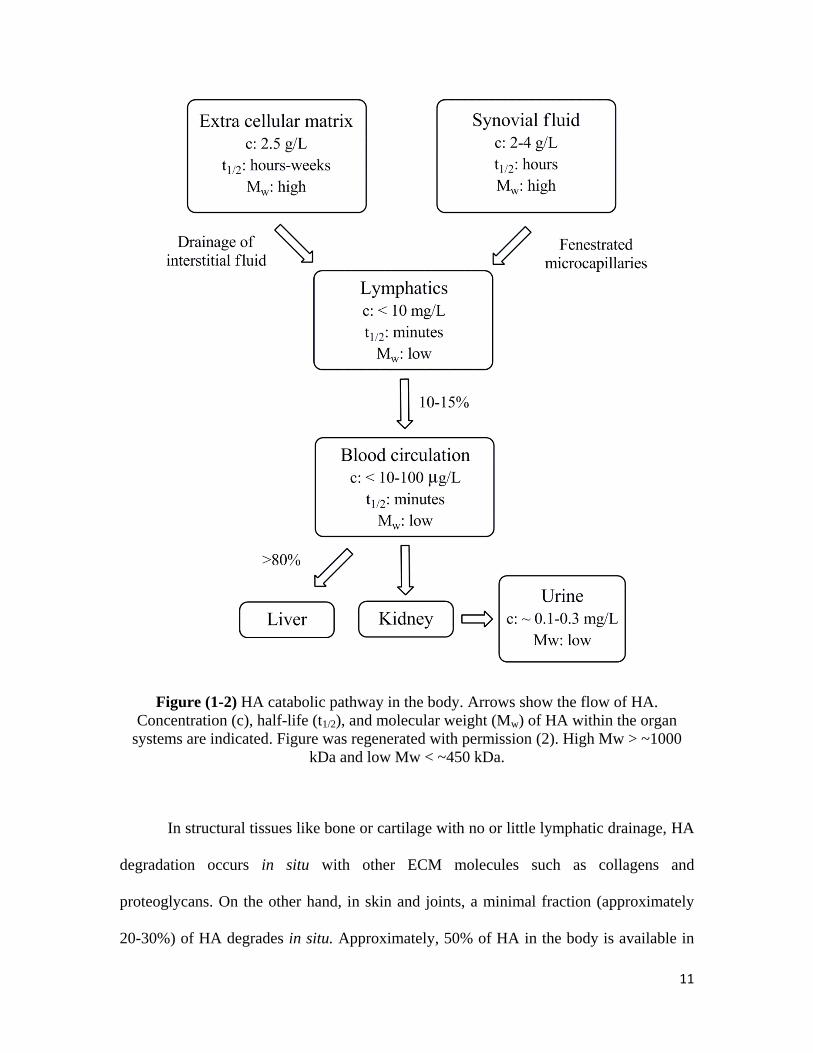
Figure (1-2) HA catabolic pathway in the body. Arrows show the flow of HA.
Concentration (c), half-life (t1/2), and molecular weight (Mw) of HA within the organ
systems are indicated. Figure was regenerated with permission (2). High Mw > ~1000
kDa and low Mw < ~450 kDa.
In structural tissues like bone or cartilage with no or little lymphatic drainage, HA
degradation occurs in situ with other ECM molecules such as collagens and
proteoglycans. On the other hand, in skin and joints, a minimal fraction (approximately
20-30%) of HA degrades in situ. Approximately, 50% of HA in the body is available in
12
skin tissue. Since HA is restricted to the small intracellular space of skin tissue, its half-
life is a bit longer at days and weeks (2, 17).
HA can also be eliminated through the lymphatic system draining the
extracellular space of relatively dense tissues. First, high molecular weight HA is
partially degraded before it releases from the tissue matrix. Upon release from the tissue
matrix, degraded HA enters the lymphatic system. HA metabolic degradation mostly
takes place in the lymphatic system as HA goes through peripheral tissues to the blood
circulation (2). One of the functions of the lymphatic system is to collect filtered plasma
and interstitial fluid and transport them back to the blood circulation. Studies showed that
most of the subcutaneously injected radio-labeled HA is picked up and degraded in
lymphatic tissue (2, 17). Remaining HA enters into the blood circulation and is rapidly
removed in the liver by sinusoidal endothelial cells or eliminated via kidneys. In the
blood circulation, the liver eliminates about 80% of HA and kidneys clear 10% of HA
from bloodstream (Figure 1-2). As mentioned before, the daily turnover of HA is on the
order of one-third (5 g) of the total HA body content (15 g) (2).
Synovial fluid is one of the body fluids containing high molecular weight HA.
Lubrication and viscoelasticity are properties of high molecular weight HA in synovial
fluid. In a healthy joint, high levels (2-4 g/L) of HA with high molecular weight
(approximately 6-7 MDa) are required for synovial fluid to function properly. In order to
have synovial fluid lubrication and viscoelasticity, macromolecules including HA are
secreted by synoviocytes continuously into the synovial fluid. Every time pressure is
increased, fluid is pushed out of the joint cavity into micro-capillaries embedded in the
synovium. Therefore, HA escapes through the interstitial drainage pores in the synovial

13
lining (diameter 30-90 nm). It is also suggested that high molecular weight HA can form
a layer at the tissue-fluid interface forming a “shell” that is not drained into micro-
capillaries. The normal intra-articular turnover time for HA is found to be less than 40
hours. Both HA molecular weight and concentration are decreased in patients with
arthritis resulting in a significant reduction in synovial fluid functionality. Moreover,
studies showed that production and secretion of ROS in arthritic joints degraded the HA
in synovial fluid and cartilage (2, 3, 32-34).
1.5. Biomedical application of hyaluronic acid
1.5.1. Application of hyaluronic acid in tissue engineering
Since hyaluronic acid is one of the main components of body tissues, its potential
for tissue engineering applications has been highly touted. HA is highly soluble at room
temperature and has a high rate of elimination and turnover depending on its molecular
weight and location in the body. Each of these properties could be a barrier for HA
scaffold fabrication and structural integrity. To overcome these limitations, crosslinking
of hyaluronic acid has been proposed (4, 35, 36). Currently, water-soluble carbodiimide
crosslinking (37), polyvalent hyadrazide crosslinking (38), divinyl sulfone crosslinking
(39), disulfide crosslinking (40), and photocrosslinking of hydrogels through glycidyl
methacrylate-HA conjugation (41) have been introduced for tissue engineering
applications of HA. Chemical crosslinking of HA provides the ability to combine the
desirable biological and mechanical properties, even for bone or cartilage tissue
engineering (4, 35). Moreover, crosslinking extends the HA degradation process in vivo
14
and provides long-term stability. Crosslinking HA at various densities has been used for
multiple applications including orthopedics, cardiovascular medicine, and dermatology
(35).
Studies have suggested positive results for cell growth on photocrosslinked HA
networks incorporated with chondrocytes. Chondrocytes within the HA hydrogel retained
viability and were able to generate cartilage within the porous network (35, 42). This type
of photopolymerization has also been used in heart valve applications to mimic cardiac
valve development (21). HA has also been combined with other polymers such as
polypyrrole to develop multifunctional copolymers. HA functionalized with polypyrrole
is electronically conductive and supports cell growth. This copolymerization could have
potential for tissue engineering applications (43, 44). Benzyl derivatives of HA is another
category of polymeric scaffolds used for tissue engineering of cartilage with predictable
degradation rates. Studies on these derivatives suggested the potential of benzyl esters of
HA as a delivery scaffold for chondrocytes in cartilage tissue engineering (35, 45). Since
HA is a biocompatible natural polymer, development of scaffolds based on HA appears
to be suitable for surfaces contacting blood. For example, HA crosslinked with divinyl
sulfone (DVS) in the presence of ultraviolet light has been suggested to develop “non-
activating” surfaces for cell adhesion in heart valve tissue engineering (35, 46, 47).
Auto-crosslinked and in situ crosslinked HA hydrogels are another category of
crosslinking used for tissue engineering. The requirement for surgical implantation is the
major limitation of most scaffolds used for tissue engineering. Application of HA that
crosslinks after injection has been introduced for three main reasons. First, the injectable
HA could be filled into any desirable shape and crosslinked in situ. Second, crosslinkable

15
HA may adhere to the native tissue resulting in mechanical or chemical interlocking and
a cohesive scaffold-tissue interface. Third, injection and laparoscopic methods can be
used to reduce the invasiveness of the surgical procedure (48). Studies showed that in situ
crosslinked HA hydrogel using adipic acid dihydrazide and aldehyde chemistry could
form a flexible hydrogel in situ upon mixing (49). In another study, poly(lactic-co-
glycolic acid) nanoparticles were mixed with HA of similar chemistry to develop an in
situ crosslinkable system with drug delivery potential. Although such in situ crosslinking
has been shown to form flexible hydrogels with reasonable mechanical properties,
potential toxicity of the reactions used in these techniques are still an important issue to
consider (50).
1.5.2. Application of hyaluronic acid as a dermal filler
The influence of sun exposure, gravity, and years of facial muscle movements
starts to appear as wrinkles on the skin. During the aging process, basic changes in the
skin, soft tissue, and skeletal support of the face occur resulting in a breakdown of the
tissues under the skin leaving lines or other facial defects (51, 52). Skin aging can be
divided in two categories: internal aging and external aging.
Internal aging of skin causes various histological changes in different skin layers
such as flattening of the epidermal-dermal interface, a decrease in the number of
melanocytes and Langerhans cells in the epidermis, a loss of dermal papillae, dermal
atrophy, a decrease in the number of mast cells, fibroblasts, and blood vessels, a loss of
elastic tissue in the fine subepidermal elaunin network, and abnormal thickening and

16
fragmentation of elastic tissue in the reticular dermis (52). Internal aging also reduces
several skin functions such as type I and type III collagen production, the epidermal
turnover rate, and melanocyte activity (52, 53).
External aging is influenced by sun exposure and UV radiation and also causes
histological changes which are different from other changes caused by internal aging.
External aging is typified by damage of elastic tissue and decrease in cellularity.
Photodamage induces elastosis, the overgrowth of abnormal elastic fibers, and an
increase in population of histiocytes, fibroblasts, and mast cells (52, 53). In both internal
and external aging, collagen content and melanocyte activity are decreased and wound
healing is abnormal (52).
To address age-related changes in skin quality and appearance, several treatments
have been proposed (Table 1-2). Development of soft-tissue fillers (dermal fillers) can
help lines and wrinkles to be filled temporarily (or permanently) (51). It seems an ideal
dermal filler should be temporary but long-lasting, having minimum side effects and no
allergenic effect, easy to administer, having minimum pain or no pain upon injection, and
a reasonable cost for both the physician and the patient (51).
17
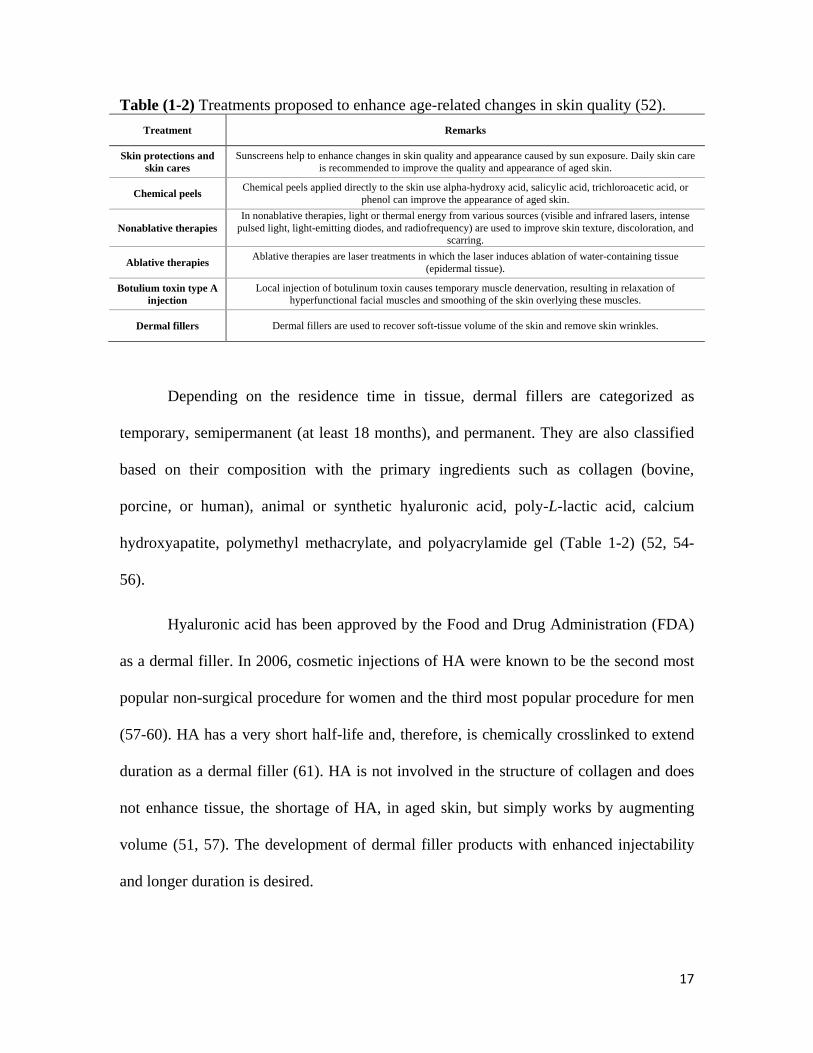
Table (1-2) Treatments proposed to enhance age-related changes in skin quality (52).
Treatment Remarks
Skin protections and
skin cares
Sunscreens help to enhance changes in skin quality and appearance caused by sun exposure. Daily skin care
is recommended to improve the quality and appearance of aged skin.
Chemical peels Chemical peels applied directly to the skin use alpha-hydroxy acid, salicylic acid, trichloroacetic acid, or
phenol can improve the appearance of aged skin.
Nonablative therapies
In nonablative therapies, light or thermal energy from various sources (visible and infrared lasers, intense
pulsed light, light-emitting diodes, and radiofrequency) are used to improve skin texture, discoloration, and
scarring.
Ablative therapies Ablative therapies are laser treatments in which the laser induces ablation of water-containing tissue
(epidermal tissue).
Botulium toxin type A
injection
Local injection of botulinum toxin causes temporary muscle denervation, resulting in relaxation of
hyperfunctional facial muscles and smoothing of the skin overlying these muscles.
Dermal fillers Dermal fillers are used to recover soft-tissue volume of the skin and remove skin wrinkles.
Depending on the residence time in tissue, dermal fillers are categorized as
temporary, semipermanent (at least 18 months), and permanent. They are also classified
based on their composition with the primary ingredients such as collagen (bovine,
porcine, or human), animal or synthetic hyaluronic acid, poly-L-lactic acid, calcium
hydroxyapatite, polymethyl methacrylate, and polyacrylamide gel (Table 1-2) (52, 54-
56).
Hyaluronic acid has been approved by the Food and Drug Administration (FDA)
as a dermal filler. In 2006, cosmetic injections of HA were known to be the second most
popular non-surgical procedure for women and the third most popular procedure for men
(57-60). HA has a very short half-life and, therefore, is chemically crosslinked to extend
duration as a dermal filler (61). HA is not involved in the structure of collagen and does
not enhance tissue, the shortage of HA, in aged skin, but simply works by augmenting
volume (51, 57). The development of dermal filler products with enhanced injectability
and longer duration is desired.

18
Table (1-3) Different types of dermal fillers and some of the commercially available
products (52, 54, 56, 59).
Material Brand name Description Duration Biodegradability
Autologous fat Viable Fat - Temporary Biodegradable
Hyaluronic acid
Restylene® Cross-linked HA (20 mg/mL) Temporary 6-12 months
Biodegradable
Prelane® Cross-linked HA (20 mg/mL) Temporary 6-12 months
Juvéderm® Cross-linked HA (24 mg/mL) Temporary up to 12 months
Elevess® Cross-linked HA (28 mg/mL) Temporary months
Hylaform® Cross-linked HA (5 mg/mL) Temporary 3-6 months
Collagen
Zyderm® 3.5% bovine collagen+0.3% lidocaine Temporary 3-4 months
Biodegradable
Zyplast® 3.5% crosslinked bovine collagen
+0.3% lidocaine Temporary 3-6 months
CosmoDerm® 3.5% human collagen+0.3% lidocaine Temporary 3-5 months
CosmoPlast® 3.5% crosslinked human
collagen+0.3% lidocaine Temporary 3-5 months
ArteFill® 20% PMMA microsphers+80% bovine
collagen (3.5%)+0.3% lidocaine Permanent Not biodegradable
Calcium
hydroxyapatite Radiessa®
Calcium hydroxyapatite microspheres
in aqueous gel Semipermanent 2-5 years Biodegradable
Poly-L-lactic acid Sculptra®
Injectable PLLA microspheres
suspended in sodium
carboxymethylcellulose gel
Semipermanent 18-24
months Biodegradable
β-tricalcium
phosphate with
hyaluronic acid
Atlean® - Semipermanent Biodegradable
Polyacrylamide gel Aquamid®
- Permanent Not biodegradable Bio-Alcamid®
Polymethyl
methacrylate
Arteplast®
- Semipermanent Not biodegradable
Artecoll®
Artefill®
Dermalive®
Dermadeep®
Dimenthylsiloxane
polymers Silicone - Permanent Not biodegradable

19
1.4.3. Application of hyaluronic acid in osteoarthritis treatment
Osteoarthritis (OA) is the most common disease associated with aging, affecting
approximately 33 million Americans with about 70% of these individuals aged 65 and
over. OA is characterized by the slow degradation of cartilage, pain, and increasing
disability. The disease can have an impact on several aspects of a patient’s life, including
functional and social activities (62, 63). Current pharmacological therapies target
palliation of pain and include analgesics (i.e. acetaminophen, cyclooxygenase-2-specific
inhibitors, non-steroidal anti-inflammatory drugs, tramadol, opioids), intra-articular
therapies (glucocorticoids and hyaluronan), and topical treatments (i.e. capsaicin,
methylsalicylate). If none of these therapies work, surgical joint replacement is the last
option, which is costly and highly invasive (63).
Synovial spaces are the cavities of the joints that facilitate movement of adjacent
bones. Synovial spaces are formed by a surface of cartilage, synovium, and synovial
fluid. The synovial fluid is a clear, colorless or sometimes yellowish liquid secreted into
the joint cavity by the synovioum. The synovial fluid volume is approximately 2 mL in
normal human knee joints and contains electrolytes, low molecular weight organic
molecules, and macromolecules such as glycosaminoglycans (GAGs). GAGs present in
the synovial fluid are chondrotin-4-sulfate (2%), with the remaining 98% made up of HA
(62).
The mechanical function of the synovial fluid can be attributed to its rheological
properties, more specifically its viscoelastic properties. Synovial fluid viscoelasticity may
be ascribed to the concentration, molecular weight, and molecular weight distribution,
and to the physical and non-covalent interactions within the HA molecule as well as with
20
other molecules such as proteins and ions (4). HA molecules overlap and interact though
physical entanglement or temporary crosslinking interactions with ions and proteins at
physiological conditions. These interactions, which are dependent on HA molecular
weight and concentration, determine the formation of the transient network structure that
is responsible for the viscoelasticity of synovial fluid (62, 63). In OA, HA loses these
functionalities as a result of reduced HA molecular weight and concentration; thus,
decreasing the viscoelastic properties of synovial fluid (32, 62, 64).
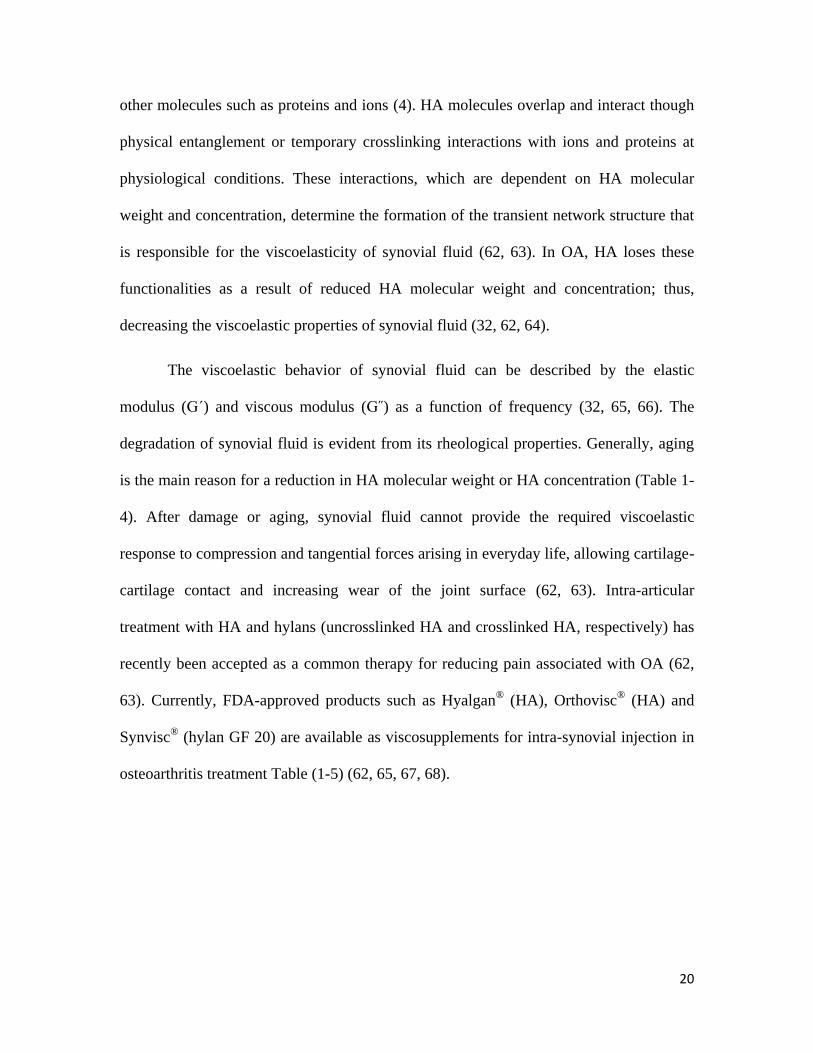
The viscoelastic behavior of synovial fluid can be described by the elastic
modulus (Gˊ) and viscous modulus (G˝) as a function of frequency (32, 65, 66). The
degradation of synovial fluid is evident from its rheological properties. Generally, aging
is the main reason for a reduction in HA molecular weight or HA concentration (Table 1-
4). After damage or aging, synovial fluid cannot provide the required viscoelastic
response to compression and tangential forces arising in everyday life, allowing cartilage-
cartilage contact and increasing wear of the joint surface (62, 63). Intra-articular
treatment with HA and hylans (uncrosslinked HA and crosslinked HA, respectively) has
recently been accepted as a common therapy for reducing pain associated with OA (62,
63). Currently, FDA-approved products such as Hyalgan®
(HA), Orthovisc®
(HA) and
Synvisc®
(hylan GF 20) are available as viscosupplements for intra-synovial injection in
osteoarthritis treatment Table (1-5) (62, 65, 67, 68).
21
Table (1-4) Properties of healthy synovial fluid and osteoarthritic synovial fluid (65, 67,
69, 70).
HA molecular
weight (MDa)
HA
concentration
(mg/mL)
Viscoelastic properties Zero shear viscosity
(Pa.s) Elastic modulus (G')
(Pa) at 2.5 Hz
Viscous modulus
(G'') (Pa) at 2.5 Hz
Healthy Young
Synovial Fluid 6.3-7.6 2.5-4 23 7 6-175
Osteoarthritic
Synovial Fluid 1.6-3.48 1-2 7 5 0.01-1
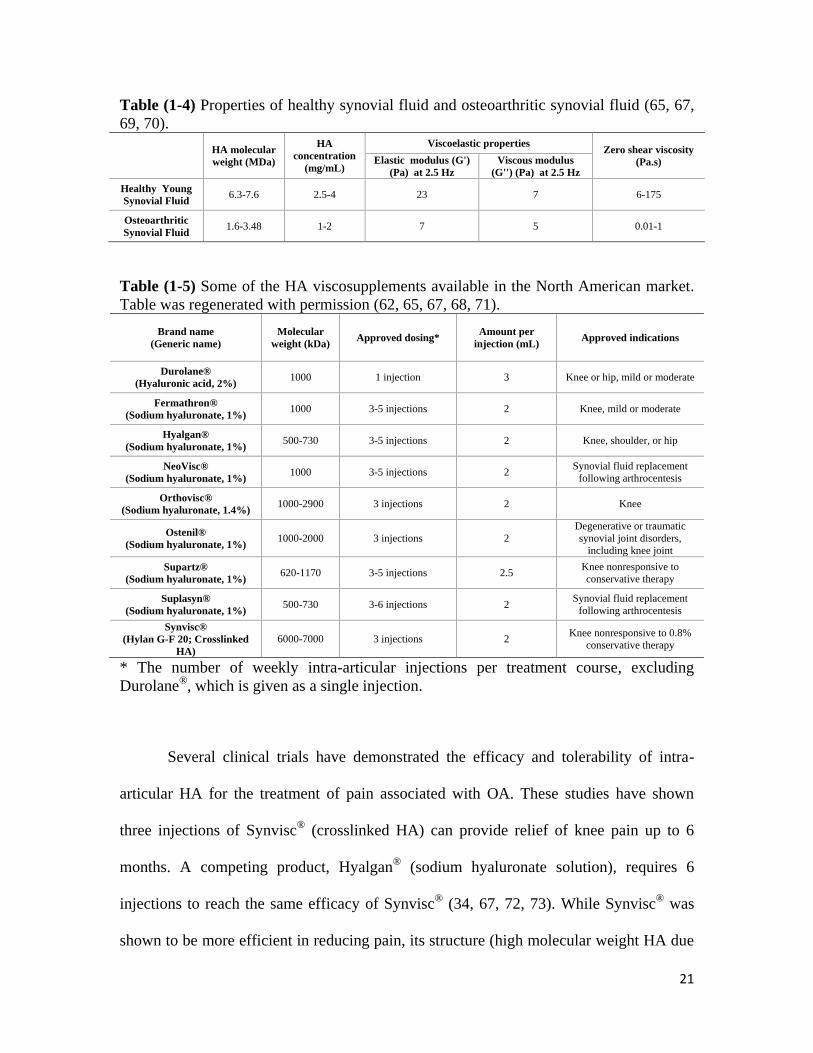
Table (1-5) Some of the HA viscosupplements available in the North American market.
Table was regenerated with permission (62, 65, 67, 68, 71).
Brand name
(Generic name)
Molecular
weight (kDa) Approved dosing*
Amount per
injection (mL) Approved indications
Durolane®
(Hyaluronic acid, 2%) 1000 1 injection 3 Knee or hip, mild or moderate
Fermathron®
(Sodium hyaluronate, 1%) 1000 3-5 injections 2 Knee, mild or moderate
Hyalgan®
(Sodium hyaluronate, 1%) 500-730 3-5 injections 2 Knee, shoulder, or hip
NeoVisc®
(Sodium hyaluronate, 1%) 1000 3-5 injections 2
Synovial fluid replacement
following arthrocentesis
Orthovisc®
(Sodium hyaluronate, 1.4%) 1000-2900 3 injections 2 Knee
Ostenil®
(Sodium hyaluronate, 1%) 1000-2000 3 injections 2
Degenerative or traumatic
synovial joint disorders,
including knee joint
Supartz®
(Sodium hyaluronate, 1%) 620-1170 3-5 injections 2.5
Knee nonresponsive to
conservative therapy
Suplasyn®
(Sodium hyaluronate, 1%) 500-730 3-6 injections 2
Synovial fluid replacement
following arthrocentesis
Synvisc®
(Hylan G-F 20; Crosslinked
HA)
6000-7000 3 injections 2 Knee nonresponsive to 0.8%
conservative therapy
* The number of weekly intra-articular injections per treatment course, excluding
Durolane®
, which is given as a single injection.
Several clinical trials have demonstrated the efficacy and tolerability of intra-
articular HA for the treatment of pain associated with OA. These studies have shown
three injections of Synvisc®
(crosslinked HA) can provide relief of knee pain up to 6
months. A competing product, Hyalgan®
(sodium hyaluronate solution), requires 6
injections to reach the same efficacy of Synvisc®
(34, 67, 72, 73). While Synvisc®
was
shown to be more efficient in reducing pain, its structure (high molecular weight HA due
22
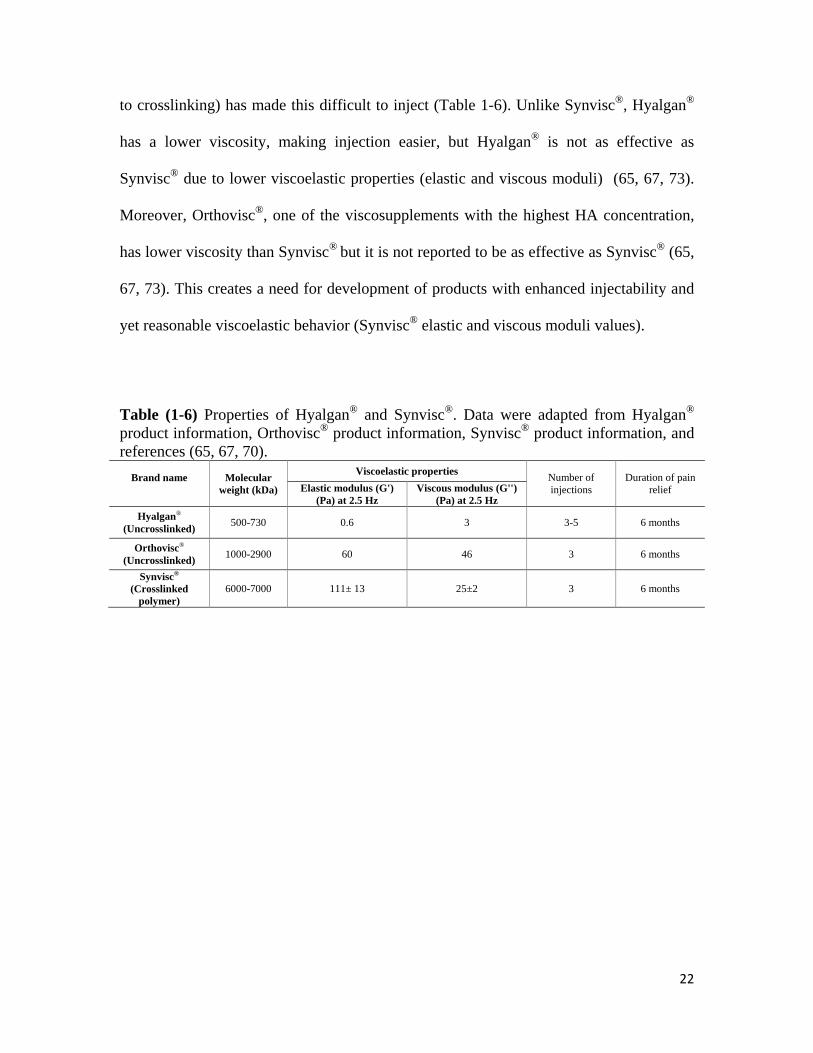
to crosslinking) has made this difficult to inject (Table 1-6). Unlike Synvisc®
, Hyalgan®
has a lower viscosity, making injection easier, but Hyalgan®
is not as effective as
Synvisc®
due to lower viscoelastic properties (elastic and viscous moduli) (65, 67, 73).
Moreover, Orthovisc®
, one of the viscosupplements with the highest HA concentration,
has lower viscosity than Synvisc®
but it is not reported to be as effective as Synvisc®
(65,
67, 73). This creates a need for development of products with enhanced injectability and
yet reasonable viscoelastic behavior (Synvisc®
elastic and viscous moduli values).
Table (1-6) Properties of Hyalgan®
and Synvisc®
. Data were adapted from Hyalgan®
product information, Orthovisc®
product information, Synvisc®
product information, and
references (65, 67, 70).
Brand name
Molecular
weight (kDa)
Viscoelastic properties Number of
injections
Duration of pain
relief Elastic modulus (G')
(Pa) at 2.5 Hz
Viscous modulus (G'')
(Pa) at 2.5 Hz
Hyalgan®
(Uncrosslinked) 500-730 0.6 3 3-5 6 months
Orthovisc®
(Uncrosslinked) 1000-2900 60 46 3 6 months
Synvisc®
(Crosslinked
polymer)
6000-7000 111± 13 25±2 3 6 months
23
1.6. Introduction of thesis
Due to the prevalence of hyaluronic acid in the body, HA has been deemed as a
suitable material for biomedical applications. Three applications of HA were introduced;
tissue engineering, dermal filling, and viscosupplementation. In each application,
difficulties such as potential toxicity of in situ crosslinking techniques, high viscosity of
HA solutions, and rapid elimination have been raised as limitations to develop
biomedical products from HA. Nanotechnology may provide an approach to resolve these
limitations. Studies suggested that fabrication of nanoparticles from polymers can effect
bulk properties (physical, mechanical, rheological, and etc.) of ensuing materials (74, 75).
In this work, a nanoparticle fabrication technique for HA has been introduced. Then, the
use of HA nanoparticles to modify viscosity and viscoelasticity of HA solutions or
suspensions was explored. This study is focused on the application of HA nanoparticles
to develop materials for tissue engineering, dermal filling, and viscosupplementation.
As mentioned, crosslinking is a common technique employed for HA scaffold
fabrication. Almost all of the crosslinking reactions used for this purpose are toxic to
cells; however, the desired mechanical properties can be achieved for tissue engineering
applications (18, 63). In addition to that, injectability of viscous HA is another desired
property that can help physicians to fill a defect site without invasive surgery (5, 49).
This thesis aimed to develop a new type of colloidal material based on HA nanoparticles,
which can be used as a self-assembled scaffold without utilizing chemical reactions. The
injectability of the colloidal material and its behavior under shear stress was evaluated to
determine applicability as an injectable scaffold for tissue engineering.
24
HA nanoparticles may also be used to enhance the properties of dermal fillers.
HA based dermal fillers are one of the most popular for temporary treatment within a
duration of up to 12 months (52, 54, 56). These crosslinked HA solutions are viscous and
difficult to administer with fine needles. Modifying these supplements with HA
nanoparticles may extend the residency of the HA in vivo and increase the treatment
duration to more than 12 months. Moreover, nanoparticles may also help to reduce the
viscosity of these solutions for easy injection via fine needles. In this thesis, HA
nanoparticles were used to modify HA polymer solutions and the effect on viscosity was
evaluated.
Modification of viscosupplements used for osteoarthritis treatment is another area
in which HA nanoparticles may be employed. High viscosity of viscosupplements such
as Synvisc®
has always been an issue (65, 67, 68). In this research, reducing the viscosity
of HA solutions by using HA nanoparticles was investigated. Viscoelastic behavior
(change in elastic and viscous moduli), another characteristic of HA solutions (and
suspensions), was evaluated to determine the effect of nanoparticles in HA solutions (and
suspensions). An outline of the design characteristics and rationale of this thesis are
shown in Table 1-7.
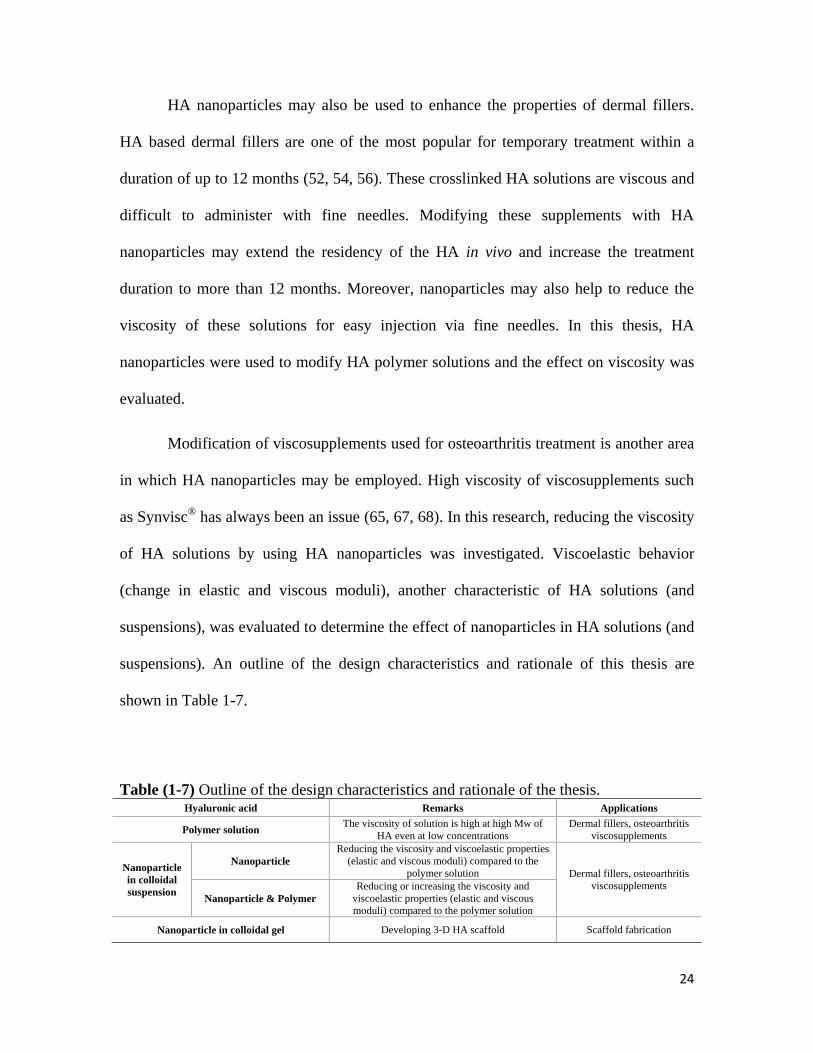
Table (1-7) Outline of the design characteristics and rationale of the thesis. Hyaluronic acid Remarks Applications
Polymer solution The viscosity of solution is high at high Mw of
HA even at low concentrations
Dermal fillers, osteoarthritis
viscosupplements
Nanoparticle
in colloidal
suspension
Nanoparticle
Reducing the viscosity and viscoelastic properties
(elastic and viscous moduli) compared to the
polymer solution Dermal fillers, osteoarthritis
viscosupplements
Nanoparticle & Polymer
Reducing or increasing the viscosity and
viscoelastic properties (elastic and viscous
moduli) compared to the polymer solution
Nanoparticle in colloidal gel Developing 3-D HA scaffold Scaffold fabrication
25
1.7. Design of the thesis
The studies outlined in this thesis include nanoparticle fabrication, nanoparticle
characterization, development of colloidal systems based on nanoparticles, and finally
characterization of these colloidal systems including physical, mechanical, and
rheological characterization.
Chapter 2: Fabrication of hyaluronic acid nanoparticles
Nanoparticles were synthesized using a technique free of oil and surfactant. In
this method, nanoparticles were fabricated by crosslinking HA polymer chains through
their carboxyl groups via carbodiimide chemistry (76). The crosslinking reaction was
validated via Fourier transform infrared spectroscopy (FTIR). The effect of polymer type
(hyaluronic acid or chondroitin sulfate), polymer concentration, HA molecular weight,
reaction time, and the ratio between polymer to crosslinker was evaluated. To understand
the morphology of the nanoparticles, cryo-transmission electron microscopy was used.
Chapter 3: Application of hyaluronic acid nanoparticles for colloidal gel
fabrication
HA nanoparticles (chapter 2) were used to form colloidal gels in this chapter.
Colloidal gels were made by mixing nanoparticles with deionized water at different
concentrations. First, the effect of the type of nanoparticles (hyaluronic acid or
chondroitin sulfate nanoparticles), concentration of nanoparticles, and the molecular
weight of HA used for nanoparticle fabrication was tested. Then, the swelling ratio of

26
colloidal gels was measured in deionized water and 0.1 M PBS to understand the
behavior of colloidal gels compared to a classic HA hydrogel. Uniaxial compression
testing was employed to evaluate mechanical properties of colloidal gels at different
conditions. Rheological properties (viscosity and viscoelastic properties (elastic and
viscous moduli)) of the colloidal gels were also determined. Finally, structural
recoverability and dynamic behavior of colloidal gels were examined using uniaxial
compression testing and rheometry.
Chapter 4: Application of hyaluronic acid nanoparticles in colloidal suspensions
as a potential osteoarthritis treatment
To evaluate the potential of HA nanoparticles for osteoarthritis treatment and the
effect of nanoparticles on rheological behavior (viscosity and viscoelasticity) of HA, two
experiments were designed. For both experiments, HA (HA Mw=1500 kDa) at 1.4% w/v
was prepared as a model of the Orthovisc®
viscosupplement for osteoarthritis treatment
(or dermal filler). The rheological effect of mixing HA polymer with HA nanoparticles at
different ratios (maintaining HA concentration of 1.4% w/v) was studied. The interaction
between nanoparticles and HA polymer was observed to affect the viscosity and
viscoelasticity of the HA suspension. The effect of nanoparticle concentration on the
rheological properties of HA nanoparticle suspensions was examined. Here, the effect of
nanoparticle fabrication to reduce the viscosity of HA suspensions was explored. All the
experiments aimed to determine the effect of nanoparticles on injectable
viscosupplements.

27
1.8. References
1. Kurisawa M, Chung J, Yang Y, Gao S, Uyama H., Injectable biodegradable hydrogels composed of hyaluronic acid–tyramine conjugates for drug delivery and tissue engineering, Chemical communications, 2005(34):4312-4. 2. Garg, H.G. and C.A. Hales, Chemistry and biology of hyaluronan, 2004, Elsevier Science. 3. Necas J, Bartosikova L, Brauner P, Kolar J., Hyaluronic acid (hyaluronan): a review, Veterinarni Medicina. 2008;53(8):397-411. 4. Falcone S, Palmeri D, Berg R, editors., Biomedical applications of hyaluronic acid, 2006, ACS Publications. 5. Zheng Shu X, Liu Y, Palumbo F, Luo Y, Prestwich G., In situ crosslinkable hyaluronan hydrogels for tissue engineering, Biomaterials, 2004;25(7-8):1339-48. 6. Vejlens L., Glycosaminoglycans of human bone tissue. Calcified Tissue International, 1971;7(1):175-90. 7. Dumitriu S., Polymeric biomaterials, 2002, New York, Marcel Dekker Inc.. 8. Segura T, Anderson B, Chung P, Webber R, Shull K, Shea L., Crosslinked hyaluronic acid hydrogels: a strategy to functionalize and pattern, Biomaterials, 2005;26(4):359-71. 9. Toole B., Hyaluronan: from extracellular glue to pericellular cue, Nature Reviews Cancer, 2004;4(7):528-39. 10. Cai S, Xie Y, Bagby T, Cohen M, Forrest M., Intralymphatic chemotherapy using a hyaluronan-cisplatin conjugate, The Journal of surgical research, 2008;147(2):247. 11. Underhill C., CD44: the hyaluronan receptor, Journal of Cell Science, 1992;103(2):293. 12. Eng, D., et al., Hyaluronan scaffolds: A balance between backbone functionalization and bioactivity, Acta Biomaterialia, 2010;6(7):2407-2414. 13. Kim J, Kim I, Cho T, Lee K, Hwang S, Tae G, et al, Bone regeneration using hyaluronic acid-based hydrogel with bone morphogenic protein-2 and human mesenchymal stem cells, Biomaterials, 2007;28(10):1830-7. 14. Luo Y, Kirker K, Prestwich G., Cross-linked hyaluronic acid hydrogel films: new biomaterials for drug delivery, Journal of controlled release, 2000;69(1):169-84. 15. Lee K, Mooney D., Hydrogels for tissue engineering, Chem Rev. 2001;101(7):1869-80. 16. Drury J, Mooney D., Hydrogels for tissue engineering: scaffold design variables and applications, Biomaterials, 2003;24(24):4337-51. 17. Volpi N, Schiller J, Stern R, Soltes L., Role, metabolism, chemical modifications and applications of hyaluronan, Current medicinal chemistry, 2009;16(14):1718-45. 18. Burdick JA, Prestwich GD, Hyaluronic Acid Hydrogels for Biomedical Applications, Advanced Materials, 2011(23):H41–H56. 19. Whelan J., The Biology of hyaluronan, 1989, John Wiley & Sons. 20. Sheehan J, Arundel C, Phelps C., Effect of the cations sodium, potassium and calcium on the interaction of hyaluronate chains: a light scattering and viscometric study, International Journal of Biological Macromolecules, 1983;5(4):222-8. 21. Toole BP, Hyaluronan in morphogenesis, 2001, Elsevier. 22. Toole BP, Wight TN, Tammi MI., Hyaluronan-cell interactions in cancer and vascular disease, Journal of Biological Chemistry, 2002;277(7):4593. 23. Noble PW., Hyaluronan and its catabolic products in tissue injury and repair, Matrix biology, 2002;21(1):25-9. 24. Toole B., Hyaluronan in morphogenesis, Journal of internal medicine, 1997;242(1):35-40.
28
25. McKee CM, Penno MB, Cowman M, Burdick MD, Strieter RM, Bao C, et al., Hyaluronan (HA) fragments induce chemokine gene expression in alveolar macrophages. The role of HA size and CD44, Journal of Clinical Investigation, 1996;98(10):2403. 26. Oertli B, Fan X, Wüthrich RP., Characterization of CD44-mediated hyaluronan binding by renal tubular epithelial cells, Nephrology Dialysis Transplantation, 1998;13(2):271. 27. Chen WYJ, Abatangelo G., Functions of hyaluronan in wound repair, Wound Repair and Regeneration, 1999;7(2):79-89. 28. Lee JY, Spicer AP., Hyaluronan: a multifunctional, megaDalton, stealth molecule, Current Opinion in Cell Biology, 2000;12(5):581-6. 29. Cowman MK, Matsuoka S., Experimental approaches to hyaluronan structure, Carbohydrate research, 2005;340(5):791-809. 30. Stern R, Kogan G, Jedrzejas MJ, Soltés L., The many ways to cleave hyaluronan, Biotechnology advances, 2007;25(6):537-57. 31. Šoltés L, Mendichi R, Kogan G, Schiller J, Stankovska M, Arnhold J., Degradative action of reactive oxygen species on hyaluronan, Biomacromolecules, 2006;7(3):659-68. 32. Arrich J, Piribauer F, Mad P, Schmid D, Klaushofer K, Müllner M., Intra-articular hyaluronic acid for the treatment of osteoarthritis of the knee: systematic review and meta-analysis, Canadian Medical Association Journal, 2005;172(8):1039. 33. Goldberg V, Buckwalter J., Hyaluronans in the treatment of osteoarthritis of the knee: evidence for disease-modifying activity, Osteoarthritis and cartilage, 2005;13(3):216-24. 34. Migliore A, Granata M., Intra-articular use of hyaluronic acid in the treatment of osteoarthritis, Clinical interventions in aging, 2008;3(2):365. 35. Allison DD, Grande-Allen KJ., Hyaluronan: a powerful tissue engineering tool, Tissue Engineering, 2006;12(8):2131-40. 36. Jiang D, Liang J, Noble PW., Hyaluronan in tissue injury and repair, Annu Rev Cell Dev Biol, 2007;23:435-61. 37. Tomihata K, Ikada Y., Crosslinking of hyaluronic acid with water soluble carbodiimide, Journal of biomedical materials research, 1997;37(2):243-51. 38. Vercruysse KP, Marecak DM, Marecek JF, Prestwich GD., Synthesis and in vitro degradation of new polyvalent hydrazide cross-linked hydrogels of hyaluronic acid, Bioconjugate chemistry, 1997;8(5):686-94. 39. Luo Y, Kirker KR, Prestwich GD., Cross-linked hyaluronic acid hydrogel films: new biomaterials for drug delivery, Journal of controlled release, 2000;69(1):169-84. 40. Liu Y, Zheng Shu X, Prestwich GD., Biocompatibility and stability of disulfide-crosslinked hyaluronan films, Biomaterials, 2005;26(23):4737-46. 41. Baier Leach J, Bivens KA, Patrick Jr CW, Schmidt CE., Photocrosslinked hyaluronic acid hydrogels: natural, biodegradable tissue engineering scaffolds, Biotechnology and bioengineering, 2003;82(5):578-89. 42. Burdick JA, Chung C, Jia X, Randolph MA, Langer R., Controlled degradation and mechanical behavior of photopolymerized hyaluronic acid networks, Biomacromolecules, 2005;6(1):386-91. 43. Cen L, Neoh K, Li Y, Kang E., Assessment of in vitro bioactivity of hyaluronic acid and sulfated hyaluronic acid functionalized electroactive polymer, Biomacromolecules, 2004;5(6):2238-46. 44. Collier JH, Camp JP, Hudson TW, Schmidt CE., Synthesis and characterization of polypyrrole–hyaluronic acid composite biomaterials for tissue engineering applications, Journal of biomedical materials research, 2000;50(4):574-84. 45. Aigner J, Tegeler J, Hutzler P, Campoccia D, Pavesio A, Hammer C, et al., Cartilage tissue engineering with novel nonwoven structured biomaterial based on hyaluronic acid benzyl ester, Journal of biomedical materials research, 1998;42(2):172-81.

29
46. Ramamurthi A, Vesely I., Evaluation of the matrix-synthesis potential of crosslinked hyaluronan gels for tissue engineering of aortic heart valves, Biomaterials, 2005;26(9):999-1010. 47. Ibrahim S, Kang QK, Ramamurthi A., The impact of hyaluronic acid oligomer content on physical, mechanical, and biologic properties of divinyl sulfone crosslinked hyaluronic acid hydrogels, Journal of Biomedical Materials Research Part A., 2010;94(2):355-70. 48. Zheng Shu X, Liu Y, Palumbo FS, Luo Y, Prestwich GD., In situ crosslinkable hyaluronan hydrogels for tissue engineering, Biomaterials, 2004;25(7-8):1339-48. 49. Yeo Y, Highley CB, Bellas E, Ito T, Marini R, Langer R, et al., In situ cross-linkable hyaluronic acid hydrogels prevent post-operative abdominal adhesions in a rabbit model, Biomaterials, 2006;27(27):4698-705. 50. Yeo Y, Ito T, Bellas E, Highley CB, Marini R, Kohane DS., In situ cross-linkable hyaluronan hydrogels containing polymeric nanoparticles for preventing postsurgical adhesions, Annals of surgery, 2007;245(5):819. 51. Tezel A, Fredrickson GH., The science of hyaluronic acid dermal fillers, Journal of Cosmetic and Laser Therapy, 2008;10(1):35-42. 52. Sadick NS, Karcher C, Palmisano L., Cosmetic dermatology of the aging face, Clinics in Dermatology, 2009;27(3):S3-S12. 53. Fisher GJ, Varani J, Voorhees JJ., Looking older: fibroblast collapse and therapeutic implications, Archives of dermatology, 2008;144(5):666. 54. Sánchez-Carpintero I, Candelas D, Ruiz-Rodríguez R., Dermal Fillers: Types, Indications, and Complications, Actas Dermo-Sifiliográficas (English Edition), 2010;101(5):381-93. 55. Christensen LH., Host tissue interaction, fate, and risks of degradable and nondegradable gel fillers, Dermatologic Surgery, 2009;35:1612-9. 56. Andre P., New trends in face rejuvenation by hyaluronic acid injections, Journal of Cosmetic Dermatology, 2008;7(4):251-8. 57. Brandt FS, Cazzaniga A., Hyaluronic acid gel fillers in the management of facial aging, Clinical interventions in aging, 2008;3(1):153. 58. Gold MH., Use of hyaluronic acid fillers for the treatment of the aging face, Clinical interventions in aging, 2007;2(3):369. 59. Buck I, Donald W, Alam M, Kim J., Injectable fillers for facial rejuvenation: a review, Journal of Plastic, Reconstructive & Aesthetic Surgery, 2009;62(1):11-8. 60. Monheit GD, Prather CL., Hyaluronic acid fillers for the male patient, Dermatologic therapy, 2007;20(6):394-406. 61. KABLIK J, MONHEIT GD, YU L, CHANG G, GERSHKOVICH J., Comparative physical properties of hyaluronic acid dermal fillers, Dermatologic Surgery, 2009;35:302-12. 62. Moreland LW., Intra-articular hyaluronan (hyaluronic acid) and hylans for the treatment of osteoarthritis: mechanisms of action, Arthritis Research and Therapy, 2003;5(2):54-67. 63. Yaszemski MJ., Tissue engineering and novel delivery systems,2003, CRC Press. 64. Conrad BP., The effects of glucosamine and chondroitin on the viscosity of synovial fluid in patients with osteoarthritis, 2001, Citeseer. 65. Altman R, Moskowitz R., Intraarticular sodium hyaluronate (Hyalgan) in the treatment of patients with osteoarthritis of the knee: a randomized clinical trial. Hyalgan Study Group, The Journal of rheumatology, 1998;25(11):2203. 66. Maheu E, Ayral X, Dougados M., A hyaluronan preparation (500-730 kDa) in the treatment of osteoarthritis: a review of clinical trials with Hyalgan, International journal of clinical practice, 2002;56(10):804.

30
67. Watterson JR, Esdaile JM., Viscosupplementation: therapeutic mechanisms and clinical potential in osteoarthritis of the knee, Journal of the American Academy of Orthopaedic Surgeons, 2000;8(5):277. 68. CARE FONP., Hyaluronic acid products for osteoarthritis of the knee, CPJ, 2007;140(3):195. 69. Fam H, Bryant J, Kontopoulou M., Rheological properties of synovial fluids, Biorheology, 2007;44(2):59-74. 70. Balazs EA, Denlinger JL., Viscosupplementation: A new concept in the treatment of osteoarthritis, The Journal of rheumatology Supplement, 1993;39:3. 71. Sun SF, Chou YJ, Hsu CW, Chen WL., Hyaluronic acid as a treatment for ankle osteoarthritis, Current reviews in musculoskeletal medicine, 2009;2(2):78-82. 72. Leopold SS, Warme WJ, Pettis PD, Shott S., Increased frequency of acute local reaction to intra-articular hylan GF-20 (synvisc) in patients receiving more than one course of treatment, The Journal of bone and joint surgery American volume, 2002;84(9):1619. 73. Kotevoglu N, Iy bozkurt PC, H z O, Toktas H, Kuran B., A prospective randomised controlled clinical trial comparing the efficacy of different molecular weight hyaluronan solutions in the treatment of knee osteoarthritis, Rheumatology international, 2006;26(4):325-30. 74. Cegnar M, KERC J., Self-assembled Polyelectrolyte Nanocomplexes of Alginate, Chitosan and Ovalbumin, Acta chimica slovenica, 2010;57(2):431-41. 75. Kamiya N, Klibanov AM., Controling the rate of protein release from polyelectrolyte complexes, Biotechnology and bioengineering, 2003;82(5):590-4. 76. Hu Z, Xia X, Tang L., Process for synthesizing oil and surfactant-free hyaluronic acid nanoparticles and microparticles, 2004, US Patent App. 20,060/040,892.

31
Chapter 2
Fabrication of hyaluronic acid
nanoparticles

32
Chapter 2: Fabrication of hyaluronic acid nanoparticles
2.1. Introduction
Polymer nanotechnology has emerged as an important tool to successfully
develop and modify biomaterials for drug delivery and tissue engineering. Methods have
been developed to modify surface features and core components of nanoparticles for
many applications (1). For instance, conjugation and optimization of targeting moieties to
the surface of nanoparticles has been introduced to enhance targeted delivery of
therapeutic agents to cells (2-6). Moreover, research studies have been developed to
modify the surface of nanoparticles and fabricate biocompatible scaffold constructs for
tissue engineering applications (7-9). In both cases, synthetic biopolymers such as
polylactic acid (PLA), Poly(lactic-co-glycolic acid) (PLGA), poly(ε-caprolactone) and
natural polymers such as chitosan, alginate, and hyaluronic acid have been explored (1).
Moreover, polymers including dextran, poloxamer (Pluronic®
) and poly(vinyl alcohol)
(PVA) have been used as colloid stabilizers (1). Due to discrete properties of polymers
and varied application of nanoparticles, multiple fabrication methods have been
developed. However, continuous development of novel nanoparticle fabrication methods
has always been required.
One of the natural polymers used for nanoparticle fabrication is hyaluronic acid
(HA). Several methods have been proposed to fabricate HA nanoparticles. Electrostatic
interactions with positively charged polymers such as chitosan or biological components
such as proteins have been shown to form nanoparticles. Changing suspension conditions
such as pH and ionic strength can dissociate the polyelectrolyte systems. Therefore, these

33
types of nanoparticles may only be stable under specific conditions in which the particles
are formed. Studies have utilized electrostatic interactions to synthesize nanoparticles via
complexation of HA with cationic polymers and therapeutic agents for delivery of anti-
tumor drugs, treatment of asthma, and active tumor targeting (10-14). Chemical
crosslinking has also been suggested to fabricate hydrophobic core-hydrophilic shell HA
nanoparticles (15). Unlike electrostatic interactions, structurally stable HA nanoparticles
can be synthesized via chemical crosslinking techniques. Not many reports are available
for HA nanoparticle fabrication using chemical crosslinking. Techniques including water-
in-oil-emulsion processes, spray drying, and solvent evaporation have also been reported
to make micron-scale HA particles (16); however, these studies showed that completely
removing oil and surfactant from the HA particles is difficult. Controlling the size
distribution of particles by spray drying can also be difficult (17). Therefore, the
development of HA nanoparticle fabrication methods which produce relatively uniform
and stable colloids without the use of oil and surfactant is desirable (17).
A technique free from oil and surfactant by Hu et al. was used to fabricate HA
nanoparticles (17). Chemical crosslinking based on carbodiimide chemistry was used to
synthesize nanoparticles from HA polymer. Besides hyaluronic acid, chondroitin sulfate
(CS), another naturally occurring glycosaminoglycan (GAG), was also selected to make
nanoparticles in this study. Dynamic light scattering was employed to evaluate the effect
of polymer type (hyaluronic acid and chondroitin sulfate), polymer concentration, HA
molecular weight, reaction time, and the ratio between polymer to crosslinker on the size
and charge of nanoparticles. Then, cryo-transmission electron microscopy was used to
understand the morphology of nanoparticles. Fourier transform infrared spectroscopy
34
(FTIR) was also employed to confirm the crosslinking reaction. Nanoparticles
synthesized in this chapter were used in chapters three and four to understand the
possibility of colloidal gel fabrication and the effect of nanoparticles on the properties of
HA suspensions.
2.2. Materials and Methods
2.2.1. Materials
Polymers of hyaluronic acid (HA) sodium salt manufactured using an extremely
efficient microbial fermentation process (HA with different molecular weights of 17 kDa,
741 kDa, and 1500 kDa) were purchased from Lifecore Biomedical (Chaska, Minnesota).
1-Ethyl-3-[3-dimethylaminopropyl]carbodiimide hydrochloride (EDC) was purchased
from Thermo Scientific (Rockford, Illinois). Acetone was obtained from Fisher Scientific
(Fair Lawn, New Jersey). Chondroitin sulfate sodium salt from bovine cartilage (Mw ~
30 kDa), adipic acid dihydrazide, and trinitrobenzene sulfonic acid (TNBS) (~1 M in
H2O) were purchased from Sigma-Aldrich (St. Louis, Missouri). Dialysis membrane
(Regenerated Cellulose (RC), MWCO 50,000) was obtained from Spectrum Laboratory
Products Inc. (Rancho Dominguez, CA, USA).

35
2.2.2. Methods
2.2.2.1. Nanoparticle fabrication method
Nanoparticles were fabricated by adapting a technique described by Hu et al. (17).
In this method, nanoparticles were synthesized based on crosslinking polymer chains
through their carboxyl groups via carbodiimide chemistry. Briefly, aqueous solution of
polymer (HA or CS) was prepared by mixing polymer in deionized water (2.5 mg/mL, 80
mL) in a 500 mL round flask. Then, 136 mL acetone was added to the flask and stirred
for 15 minutes (500 rpm) to make sure all the components in the solution were well
dissolved. To avoid acetone evaporation, the flask was sealed properly. EDC (80 mg) and
adipic acid dihydrazide (40 mg) were dissolved in 2 mL of deionized water and added to
the flask. After mixing the solution for 30 minutes, another 131 mL acetone was added to
the solution and stirring was continued for another 3 hours (Final HA concentration ~
0.57 mg/mL). Then, the reaction was stopped by dialysis of the solution against deionized
water using dialysis membrane (Regenerated Cellulose (RC), MWCO 50,000). Finally,
the nanoparticles were freeze dried and dry powder was stored at -20 °C (Figure 2-1)
(17).

36
Figure (2-1) (A) Particle fabrication steps. (B) Before dialyzing, light blue color of the
solution indicates formation of nanoparticles.
EDC activates carboxyl groups available on HA (or CS) and provides reactive
intermediates (O-acylisourea derivatives, extremely short-lived) which react with two
primary amines of adipic acid dihydrazide forming a peptide bond and resulting in the
neighboring HA (or CS) chains being chemically crosslinked (Figure 2-2). With the first
addition of acetone, there were no nanoparticles formed in a control experiment. After the
second addition of acetone, the volume ratio of acetone/water reached to approximately
269/80 (the ratio range to form HA (or CS) nanoparticles is between 200/80 to 300/80)
(17). This acetone/water ratio was reported to break the strong hydrogen bonding
between HA (or CS) chains and HA-water molecules (or CS-water molecules) to release
carboxyl groups for the crosslinking reaction. After the consumption of carboxyl groups
by adipic acid dihydrazide, the crosslinked HA (or CS) polymer chains become less

37
soluble (hydrophilic) and were suggested to transform from coils to globules the resulting
solution turns from clear to light blue, indicating nanoparticle formation (Figure 2-1)
(17).
Figure (2-2) Application of carbodiimide chemistry for HA (or CS) nanoparticle
fabrication. EDC activates carboxyl groups available on HA and provides reactive
intermediates which react with two primary amines of adipic acid dihydrazide forming
peptide bonds and resulting in the neighboring HA chains being chemically crosslinked.
2.2.2.2. Particle size and zeta potential characterization
Particle size and zeta potential were measured using a ZetaPALS dynamic light
scattering instrument (Brookhaven, USA) after dispersion of freeze dried nanoparticles in
deionized water (2 mg/mL). A cryo-transmission electron microscope (FEI field emission
transmission electron microscope, Tecnai™ G2 at 200 kV) was employed for
morphological characterization. Cryo-TEM samples were prepared using a Vitrobot™
(FEI), a PC-controlled robot for sample preparation. Substratek™ grids with 2-3 nm
platinum coating on 400 square mesh gold grids were used (Ted Pella Inc., California) for
sample preparation. First, nanoparticles were dispersed in deionized water at 2 mg/mL

38
concentration. Then, 3 μl of nanoparticle suspension was placed on the grid, blotted to
reduce film thickness (3 seconds blot time), and vitrified in liquid ethane. Finally, the
grid was transferred to liquid nitrogen for storage and imaging was performed after
placing the prepared grid into a cryo sample holder filled with liquid nitrogen.
2.2.2.3. Characterization of bond formation via FTIR
To confirm peptide bond formation between HA carboxyl groups and adipic acid
dihydrazide amine groups, a Spectrum 100 FTIR Spectrometer was used (PerkinElmer,
Inc., Massachusetts). The FTIR spectra for the starting polymer and fabricated
nanoparticles were compared. Adipic acid dihydrazide was also used to identify its
related peaks.
2.2.2.4. Evaluation of crosslinker consumption
Analysis of fabricated nanoparticles with trinitrobenzene sulfonic acid (TNBS)
allows quantification unreacted adipic acid dihydrazide. TNBS is known to react to
amines, hydrazines, and hydrazides creating a stable trinitrophenyl complex. The
trinitrophenyl complex of adipic dihydrazide has maximum absorbance at λ=334 nm,
which can be detected via spectrophotometry (18-20).
Briefly, nanoparticles made from 17 kDa HA were dispersed in deionized water at
5 mg/mL concentration. A 17 kDa HA polymer solution at the same concentration was
also prepared as a negative control sample. Adipic acid dihydrazide (0.833 mg/mL) was
also added to separate nanoparticle suspension and polymer solution (5 mg/mL) to make

39
positive controls. To one mL of nanoparticle suspension, negative control, or positive
controls, 5 µL TNBS solution was added. Then, the samples were incubated at 37 °C for
one hour to let TNBS react with primary amines of adipic acid dihyadrazide resulting in
trinitrophenyl complex formation. Finally, 100 µL of each sample was transferred into
three wells of a 96-well cell culture plate and the absorbance of trinitrophenyl complex of
adipic acid dihydrazide was measured at λ=334 nm using a microtiter plate reader
(SpectraMax, M25, Molecular Devices Corp., CA). HA nanoparticle suspension and
polymer solution (without TNBS) was also used to quantify the absorbance of
nanoparticles at a similar wavelength.
2.2.2.5. Statistical analysis
Statistical analysis was performed using one-way analysis of variance (ANOVA).
To evaluate the significance of differences, Newman–Keuls was used as a post-hoc test.
A value of p<0.05 was accepted as significant in all cases.
2.3. Results and Discussion
2.3.1. Nanoparticle fabrication and the effect of process parameters on
size and charge of the particles
Hyaluronic acid and chondroitin sulfate nanoparticles were successfully
fabricated. It appears the fabrication of chondroitin sulfate nanoparticles and
nanoparticles made from different molecular weights of HA has not been reported

40
previously. This technique could enable fabrication of nanoparticles from other polymers
if the carobodiimide chemistry is transferable.
The effect of polymer concentration (0.28 mg/mL, 0.57 mg/mL, and 2.28 mg/mL)
on the size and charge of HA (17 kDa) and CS nanoparticles was evaluated (Table 2-1).
Table (2-1) Effect of polymer concentration on size and charge of HA and CS
nanoparticles. Polydispersity values were less than 0.22. Data represent the mean ± SD
(n=3). Polymer concentration
(mg/mL) Hyaluronic acid (17 kDa) Chondroitin sulfate
Particle size
(nm)
Zeta potential
(mV)
Particle size
(nm)
Zeta potential
(mV)
0.28 167±15.5 -31±1.1 177±3.1* -50±0.3
0.57 188±23.9* -32±2.9 282±1.1 -52±1
2.28 564±27.2** -36±0.7 449±2.1** -49±0.1
* p<0.005 comparing 0.57 mg/mL to 0.28 mg/mL (HA data) and comparing 0.28 mg/mL
to 0.57 mg/mL (CS data).
** p<0.005 comparing 2.28 mg/mL to 0.28 mg/mL (HA data) and comparing 2.28
mg/mL to 0.57 mg/mL (CS data).
Increasing polymer concentration increased particle size for both hyaluronic acid
(HA Mw = 17 kDa) and chondroitin sulfate (CS Mw ~ 30 kDa). The size of HA
nanoparticles at 2.28 mg/mL polymer concentration was significantly greater than the
size of the nanoparticles at 0.28 mg/mL and 0.57 mg/mL polymer concentration. CS
nanoparticles at 0.57 mg/mL polymer concentration were significantly larger than CS
nanoparticles at 0.28 mg/mL polymer concentration. The data suggested that increasing
polymer concentration increases particle size. This increase was shown to be independent
of polymer type and might be due to more intermolecular crosslinking at higher
concentrations resulting in fabrication of larger particles. CS nanoparticles showed
greater negative charge values compared to HA nanoparticles. This is likely be due to the

41
presence of functional groups available on CS and ionization of these groups in
suspension resulting in more negative charge for CS nanoparticles. Finally, these results
indicated that the charge of the nanoparticles were not significantly different at different
polymer concentrations.
Molecular weight of HA used for nanoparticle fabrication influenced the size of
the nanoparticles. HA with three different molecular weights (17 kDa, 741 kDa, and 1500
kDa) was used to evaluate the effect of polymer molecular weight on particle size and
charge (Table 2-2).
Table (2-2) Effect of HA molecular weight on size and charge of HA nanoparticles.
Polydispersity values were less than 0.21. Data represent the mean ± SD (n=3).
HA molecular weight Particle size (nm) Zeta potential (mV)
17 kDa 188±23.9* -32±2.9
741 kDa 78±0.7** -21±0.5
1500 kDa 87±2.5 -26±0.9
* and ** p<0.005 comparing to 1500 kDa HA.
Nanoparticles made from 17 kDa HA were larger than nanoparticles made from
741 kDa HA. Nanoparticles made from 1500 kDa HA were larger than the nanoparticles
made from 741 kDa HA but they were significantly smaller than the nanoparticles made
from 17 kDa. The zeta potential of the nanoparticles was not dependent on the HA
molecular weight and negative charge was observed for all the HA nanoparticles (Table
2-2). Due to the short length of 17 kDa HA, the chance of intramolecular crosslinking
during the fabrication of nanoparticles may be less than the chance of intermolecular
crosslinking. On the other hand, the chance of intramolecular crosslinking of 1500 kDa
HA may be greater due to its long polymer chain length, more coiled structure, and
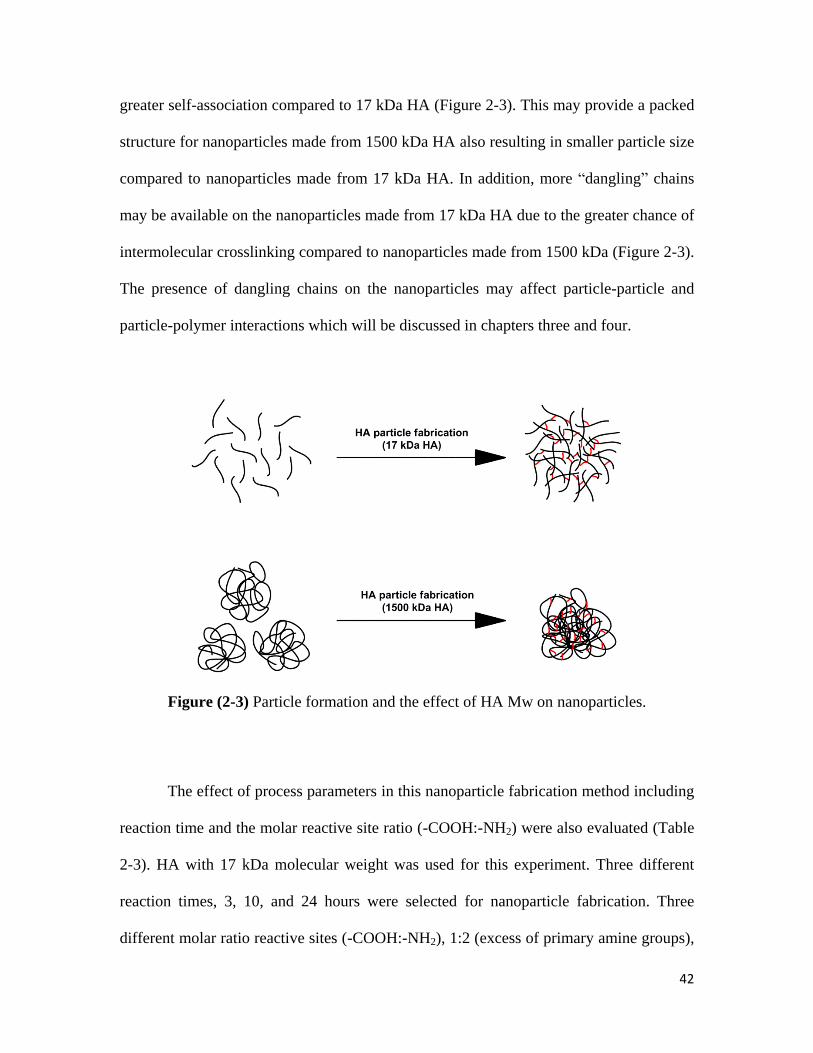
42
greater self-association compared to 17 kDa HA (Figure 2-3). This may provide a packed
structure for nanoparticles made from 1500 kDa HA also resulting in smaller particle size
compared to nanoparticles made from 17 kDa HA. In addition, more “dangling” chains
may be available on the nanoparticles made from 17 kDa HA due to the greater chance of
intermolecular crosslinking compared to nanoparticles made from 1500 kDa (Figure 2-3).
The presence of dangling chains on the nanoparticles may affect particle-particle and
particle-polymer interactions which will be discussed in chapters three and four.
Figure (2-3) Particle formation and the effect of HA Mw on nanoparticles.
The effect of process parameters in this nanoparticle fabrication method including
reaction time and the molar reactive site ratio (-COOH:-NH2) were also evaluated (Table
2-3). HA with 17 kDa molecular weight was used for this experiment. Three different
reaction times, 3, 10, and 24 hours were selected for nanoparticle fabrication. Three
different molar ratio reactive sites (-COOH:-NH2), 1:2 (excess of primary amine groups),
43
1:1 (equal molar of carboxyl and primary amine groups), and 2:1 (excess of carboxyl
groups) were theoretically calculated for the experiment (Table 2-3).
Increasing reaction time in the formulation with a 1:2 reactive site ratio increased
particle size. Normally, the carbodiimide reaction is near complete in two hours (21-23).
Therefore, the increase in particle size may not be the result of further crosslinking over
time. The presence of larger nanoparticles in this formulation at longer reaction times
may have been caused by aggregation of nanoparticles. Perhaps this is supported by the
lack of change of particle charge at different reaction times. Nanoparticles with a 1:2
reactive site ratio had the largest particle size at all reaction times. That might be due to
the molar excess of crosslinker resulting in a higher probability of polymer-nanoparticle
or nanoparticle-nanoparticle reaction (Table 2-3).
This study also suggested that the reactive site ratio influenced zeta potential in all
reaction times. Increasing the relative amount of primary amine groups in the formulation
decreased particle charge. The greater chance for crosslinking at higher molarities of
primary amine groups appeared to occupy carboxyl groups and decrease zeta potential
resulting in less negative charge for nanoparticles (Table 2-3).

44
Table (2-3) Effect of reaction time and molar reactive site ratio (-COOH:-NH2) on size
and charge of HA nanoparticles. Polydispersity values were less than 0.31. Data represent
the mean ± SD (n=3). Reaction time
(hours)
Molar reactive site ratio (-COOH:-NH2)
1:2 1:1 2:1
Particle
size (nm)
Zeta
potential
(mV)
Particle
size (nm)
Zeta
potential
(mV)
Particle
size (nm)
Zeta
potential
(mV)
3 298±7.2 -22.33±1.2 188±23.9 -32±2.9 239±10.1 -41±0.02
10 350±3.8* -27.41±1.1 209±1.3* -33.29±1.1 225±9.3* -38±1.3
24 501±1.9** -19.3±0.6l 341±0.3 -36.28±1.0 278±7.8 -41±0.2
* p<0.005 comparing 10 hours data to 3 hours data.
** p<0.005 comparing 24 hours data to 3 hours data.
2.3.2. Cryo-TEM imaging
Cryo-transmission electron microscopy was employed to investigate the
morphology of HA nanoparticles made from 17 kDa and 1500 kDa HA at 0.57 mg/mL
polymer concentration, 1:1 molar reactive site ratio, and three hours reaction time. The
images suggested spherical shape for HA nanoparticles made from both 17 kDa and 1500
kDa HA (Figure 4-2).

45
Figure (2-4) Cryo-transmission electron micrographs of hyaluronic acid nanoparticles.
Left: nanoparticles made from 17 kDa HA, right: nanoparticles made from 1500 kDa HA.
2.3.3. Characterization of bond formation via FTIR
To confirm peptide bond formation between HA carboxyl groups and adipic acid
dihydrazide primary amine groups, Fourier transform infrared spectroscopy (FTIR) was
employed. The FTIR spectra for the HA nanoparticles (Figure 2-5) showed the
appearance of a new peak corresponding to the presence of adipic acid dihydrazide (N-N
bond) (around 1635 cm-1
). This peak appearance was also observed in FTIR spectra of
CS nanoparticles (Figure 2-5). The presence of these peaks in the FTIR spectrum after
purification of nanoparticles confirmed the carbodiimide reaction and peptide bond
formation.

46
Figure (2-5) (A) FTIR spectra of 17 kDa HA polymer (HA-PO) and nanoparticles made
from 17 kDa HA (HA-NP). (B) FTIR spectra of CS polymer (CS-PO) and CS
nanoparticles (CS-NP).
(A)
(B)

47
2.3.4. Evaluation of crosslinker consumption
A TNBS assay was also used to determine the availability of unreacted primary
amine groups on the crosslinker after purifying nanoparticles. HA nanoparticles made
from 17 kDa HA at 0.57 mg/mL polymer concentration, 1:1 molar reactive site ratio, and
three hours reaction time were employed for this experiment. HA polymer was also used
as a negative control to compare with the nanoparticles. The TNBS assay revealed that
the unreacted primary amine groups on crosslinker were not available in the nanoparticle
suspension after purification due to similar optical density measured at 334 nm for
nanoparticle sample compared to negative control sample. Therefore, no subsequent side
reactions would occur in the application of HA nanoparticles in colloidal systems, due to
elimination of unreacted crosslinker from nanoparticles.
Figure (2-6) Using the TNBS assay as a probe to identify the availability of unreacted
primary amine groups on crosslinker (PO=Polymer, NP=Nanoparticles, and
XL=crosslinker). Data represent the mean ± SD (n=3).
0
0.5
1
1.5
2
2.5
3
3.5
4
OD
334

48
2.4. Conclusion
In this chapter, a technique adapted from Hu et al. was used to fabricate
nanoparticles. This method was able to successfully synthesize nanoparticles from both
hyaluronic acid and chondroitin sulfate using carbodiimide chemistry. Previously, this
method has not been employed to fabricate nanoparticles from chondroitin sulfate or
from different molecular weights of hyaluronic acid. It was also observed that
nanoparticles made from chondroitin sulfate had a more negative charge compared to
nanoparticles made from 17 kDa HA. The size and charge of nanoparticles was affected
by polymer concentration, polymer molecular weight, reaction time, and the polymer to
crosslinker ratio. Increasing polymer concentration increased the particle size; however,
HA with higher molecular weights led to smaller particles, presumably with less
“dangling” chains. Moreover, FTIR data also suggested the formation of peptide bonds
resulting in crosslinking of HA polymer chains via adipic acid dihydrazide. Nanoparticles
fabricated at 0.57 mg/mL polymer concentration, 1:1 molar reactive site ratio, and three
hours reaction time were used in chapters three and four to investigate the possibility of
colloidal gel fabrication and the effect of nanoparticles on the properties of HA
suspensions.
49
2.4. References
1. Vauthier C, Bouchemal K., Methods for the preparation and manufacture of polymeric nanoparticles, Pharmaceutical research, 2009;26(5):1025-58. 2. Fakhari A, Baoum A, Siahaan TJ, Le KB, Berkland C., Controlling ligand surface density optimizes nanoparticle binding to ICAM 1, Journal of pharmaceutical sciences. 2010. 3. Baoum A, Xie SX, Fakhari A, Berkland C., “Soft” Calcium Crosslinks Enable Highly Efficient Gene Transfection Using TAT Peptide, Pharmaceutical research, 2009;26(12):2619-29. 4. Chittasupho C, Manikwar P, Krise JP, Siahaan TJ, Berkland C., cIBR effectively targets nanoparticles to LFA-1 on acute lymphoblastic T cells, Molecular pharmaceutics, 2009;7(1):146-55. 5. Chittasupho C, Xie SX, Baoum A, Yakovleva T, Siahaan TJ, Berkland CJ., ICAM-1 targeting of doxorubicin-loaded PLGA nanoparticles to lung epithelial cells, European journal of pharmaceutical sciences, 2009;37(2):141-50. 6. Zhang N, Chittasupho C, Duangrat C, Siahaan TJ, Berkland C., PLGA Nanoparticle- Peptide Conjugate Effectively Targets Intercellular Cell-Adhesion Molecule-1, Bioconjugate chemistry, 2007;19(1):145-52. 7. Wang Q, Jamal S, Detamore MS, Berkland C., PLGA chitosan/PLGA alginate nanoparticle blends as biodegradable colloidal gels for seeding human umbilical cord mesenchymal stem cells, Journal of Biomedical Materials Research Part A., 2011. 8. Wang Q, Wang J, Lu Q, Detamore MS, Berkland C., Injectable PLGA based colloidal gels for zero-order dexamethasone release in cranial defects, Biomaterials, 2010;31(18):4980-6. 9. Wang Q, Wang L, Detamore MS, Berkland C., Biodegradable colloidal gels as moldable tissue engineering scaffolds, Advanced Materials, 2008;20(2):236-9. 10. Jeong YI, Kim ST, Jin SG, Ryu HH, Jin YH, Jung TY, et al., Cisplatin incorporated hyaluronic acid nanoparticles based on ion complex formation, Journal of pharmaceutical sciences, 2008;97(3):1268-76. 11. Han SY, Han HS, Lee SC, Kang YM, Kim IS, Park JH., Mineralized hyaluronic acid nanoparticles as a robust drug carrier, J Mater Chem, 2011;21(22):7996-8001. 12. Choi KY, Chung H, Min KH, Yoon HY, Kim K, Park JH, et al., Self-assembled hyaluronic acid nanoparticles for active tumor targeting, Biomaterials, 2010;31(1):106-14. 13. Liu Y, Sun J, Cao W, Yang J, Lian H, Li X, et al., Dual targeting folate-conjugated hyaluronic acid polymeric micelles for paclitaxel delivery, International journal of pharmaceutics, 2011. 14. Cho HJ, Yoon HY, Koo H, Ko SH, Shim JS, Lee JH, et al., Self-assembled nanoparticles based on hyaluronic acid-ceramide (HA-CE) and Pluronic® for tumor-targeted delivery of docetaxel, Biomaterials, 2011. 15. Yang X, Kootala S, Hilborn J, Ossipov DA., Preparation of hyaluronic acid nanoparticles via hydrophobic association assisted chemical cross-linking—an orthogonal modular approach, Soft Matter, 2011. 16. Kyyronen K, Hume L, Benedetti L, Urtti A, Topp E, Stella V., Methylprednisolone esters of hyaluronic acid in ophthalmic drug delivery: in vitro and in vivo release studies, International journal of pharmaceutics, 1992;80(1-3):161-9. 17. Hu Z, Xia X, Tang L., Process for synthesizing oil and surfactant-free hyaluronic acid nanoparticles and microparticles, 2004, US Patent App. 20,060/040,892. 18. Bouhadir KH, Hausman DS, Mooney DJ., Synthesis of cross-linked poly (aldehyde guluronate) hydrogels, Polymer, 1999;40(12):3575-84. 19. Lee KY, Bouhadir KH, Mooney DJ., Degradation behavior of covalently cross-linked poly (aldehyde guluronate) hydrogels, Macromolecules, 2000;33(1):97-101.

50
20. Yang TF, Chen CN, Chen MC, Lai CH, Liang HF, Sung HW., Shell-crosslinked Pluronic L121 micelles as a drug delivery vehicle, Biomaterials, 2007;28(4):725-34. 21. Izdebski J, Kunce D., Evaluation of carbodiimides using a competition method, Journal of Peptide Science, 1997;3(2):141-4. 22. Gauthier MA, Klok HA., Peptide/protein–polymer conjugates: synthetic strategies and design concepts, Chem Commun, 2008(23):2591-611. 23. Yang H, Lopina ST., Penicillin V-conjugated PEG-PAMAM star polymers, Journal of Biomaterials Science, Polymer Edition, 2003;14(10):1043-56.

51
Chapter 3
Application of hyaluronic acid
nanoparticles for colloidal gel fabrication

52
Chapter 3: Application of hyaluronic acid nanoparticles for colloidal gel
fabrication
3.1. Introduction
Colloidal gels are materials made from particles that interact to form three-
dimensional (3-D) networks. Such materials have been suggested as tissue engineering
scaffolds, drug delivery systems, and biosensors (1, 2). Interparticle interactions
including electrostatic interactions, van der Waals forces, and steric hindrance enable the
internal cohesion of colloidal gels. Applying shear force can disrupt these interactions
allowing the colloidal gels to flow (1-3). To stabilize the structure of colloid-containing
materials, chemical reactions such as in situ crosslinking have been reported, although the
application of these reactions are limited due to toxicity (4). Advanced techniques need to
be developed to stabilize the mechanical properties or to enhance dynamic properties of
colloidal gels while maintaining compatibility with tissues.
The fabrication of moldable colloidal gels has already been reported for tissue
engineering applications, but few reports utilize nanoparticles made from biomaterials
commonly used as tissue engineering scaffolds (2, 5, 6). Application of poly(D,L-lactic-
co-glycolic acid) (PLGA) nanoparticles for colloidal gel fabrication was proposed by
Wang et al. (2, 7). Oppositely charged PLGA nanoparticles formed a cohesive colloidal
gel through electrostatic interactions between nanoparticles resulting in a moldable 3-D
network. The colloidal gel could flow by applying shear force as a result of the disruption
of inter-particle electrostatic interactions. The cohesive property of the colloidal gels was

53
showed to be recoverable after removal of the external shear force. This reversible
property facilitates injection for drug delivery or tissue engineering (1, 2, 7, 8).
Here, a novel colloidal gel based on glycosaminoglycan (GAG) nanoparticles
(hyaluronic acid or chondroitin sulfate nanoparticles) was explored as a means to form
stable 3-D networks. As an alternative to inter-particle electrostatic interactions, other
properties of polymers such as physical entanglement may occur between ‘self-
associating’ polymeric nanoparticles. Several characterization methods were employed to
evaluate physical, mechanical, and rheological properties of colloidal gels composed of
high concentrations of HA nanoparticles.

54
3.2. Materials and Methods
3.2.1. Materials
Hyaluronic acid and chondroitin sulfate nanoparticles synthesized as in chapter
two (section 2.2.2.1) at 0.57 mg/mL polymer concentration, 1:1 molar reactive site ratio,
and three hours reaction time were used to make colloidal gel systems. Nanoparticles
made from 17 kDa HA, 1500 kDa HA, and ~ 30 kDa CS were selected to investigate the
effect of HA molecular weight and type of GAG on the potency of colloidal gel
formation. HA (17 kDa and 1500 kDa) manufactured using an extremely efficient
microbial fermentation process (Lifecore Biomedical, Chaska, Minnesota) and CS (~ 30
kDa) polymers from bovine cartilage (Sigma-Aldrich, St. Louis, Missouri) were used to
make controls. 1-Ethyl-3-[3-dimethylaminopropyl]carbodiimide hydrochloride (EDC)
was purchased from Thermo Scientific (Rockford, Illinois). Adipic acid dihydrazide was
purchased from Sigma-Aldrich (St. Louis, Missouri).
3.2.2. Methods
3.2.2.1. Fabrication of colloidal gel
Colloidal systems were formed by mixing nanoparticles with deionized water at
different concentrations. All experiments were performed in triplicate. First, dried
nanoparticles (HA or CS) were removed from a freezer and equilibrated at room
temperature. Nanoparticles were weighed and transferred to different microtubes at
concentrations from 1.4% w/v up to 60% w/v in deionized water. The mixture was
transferred to cylindrical molds (5 mm diameter and ~ 1.8 mm height) and left for at least

55
five hours. Polymers of HA (17 kDa and 1500 kDa) and CS (~ 30kDa) were used as
negative controls at similar concentrations to investigate the possible formation of
physically entangled gels in polymer solutions. Positive controls were also formed by
adding ECD and adipic acid dihydrazide (with similar molarity used in nanoparticle
fabrication) to 17 kDa HA polymer solutions at 15%, 30%, and 45% w/v. Positive
controls were also used to investigate the possibility of gel formation with carbodiimide
chemistry at similar colloidal gel concentrations.
3.2.2.2. Characterization of colloidal gels via FTIR
A Spectrum 100 FTIR Spectrometer (PerkinElmer, Inc., Massachusetts) was
employed to confirm that no chemical side reaction took place during colloidal gel
fabrication. The FTIR spectra of the starting polymer, nanoparticles, and colloidal gel
were compared.
3.2.2.3. Swelling experiment
To investigate the swelling behavior and stability of colloidal gels, a swelling
experiment was carried out as previously described (9-11). All experiments were
performed in triplicate. Briefly, colloidal gels at 15%, 30%, and, 45% w/v nanoparticle
concentrations made from 17 kDa HA nanoparticles were placed into an excess of water
or 0.1 M PBS for at least 6 hours. The equilibrated colloidal gel samples were weighed
and placed into a desiccator chamber. After 48 hours, the dried colloidal gels were
weighed again and the swelling ratio of colloidal gels was calculated according to

56
Equation (1) where WS (mg) is the swollen weight and WD (mg) is the dry weight of
colloidal gels (9-11):
( )
( )
3.2.2.4. Compression testing and mechanical analysis
Compression testing was performed to investigate the mechanical properties of
samples after fabrication, after swelling in water, and after swelling in 0.1 M PBS.
Colloidal gels made from 17 kDa HA nanoparticles at 15%, 30%, and 45% w/v were
used in this experiment. First, samples were placed on a glass slide and the dimensions of
the cylindrical colloidal gels were determined with calipers using a microscope (Nikon
TS100F). Since the dimensions of samples changed after swelling in water and 0.1 M
PBS, samples were initially punched to a diameter of approximately 5 mm. Then, a
uniaxial compression test using a RSA-III dynamic mechanical analyzer (TA
Instruments, Delaware) was performed. Sample height was directly measured from the
instrument. Mineral oil was used to lubricate both compression plates to reduce any
sample-plate adhesion and prevent sample drying during the test. Compression testing
was performed at a rate of 0.005 mm/s to obtain a stress-strain curve. The results were
then analyzed according to the neo-Hookean model for an ideal elastomer in which the
slope of the stress-strain fraction curve (λ-1/λ2, where λ=L/Lo) yields a straight line with a
slope equal to the shear modulus (9). Young’s modulus, the slope of the stress-strain
curve, was also estimated based on the linear portion of the stress-strain fraction curve. If
57
the initial region was not a straight line, that region was not considered in calculations.
Toughness of samples, the absorbed energy, was finally calculated by numerical
integration of the stress-strain curve (9). All experiments were performed in triplicate.
3.2.2.5. Effect of pH and ionic strength on mechanical properties of HA
colloidal gel
Studies have shown that pH and ionic strength are two important factors that must
be considered for injected formulation (12-14). Moreover, the influence of these factors
on HA structure and hydrodynamic radius was briefly discussed in chapter one (15). To
investigate the effect of pH and ionic strength on the formation of HA colloidal gels and
their mechanical properties, phosphate buffer (phosphate buffer concentration=10 mM)
was made at three different pH values (pH=6, 7.4, and 8). This range covers the reported
local pH tolerance for subcutanous injection (12-14). Sodium phosphate was chosen as
buffer at pH=6 since other buffers such as citrate are known to be painful for injection
(12). Usually, an isotonic solution containing 150 mM salt was reported for injection (12,
14). In order to explore an ionic strength range similar to isotonic solution, three different
ionic strengths (100 mM, 150mM, and 200 mM) were selected for the buffer
formulations. The buffers were prepared by mixing sodium phosphate salt and sodium
chloride salt in deionized water at the desired pH and ionic strength.

58
3.2.2.6. Viscoelasticity of HA colloidal gel after fabrication
In order to investigate the viscoelasticity of HA colloidal gels, dynamic
oscillatory rheological measurements were performed using an AR 2000 rheometer (TA
Instruments, Delaware) equipped with a 2°, 20 mm diameter cone-plate geometry at a
controlled temperature of 25 °C. HA colloidal gel samples were prepared by mixing
nanoparticles (made from 17 kDa HA) at different concentrations (5%, 15%, 30%, 45%
w/v) in deionized water. 17 kDa HA polymer was also dissolved in deionized water at
45% w/v concentration as negative control. First, strain sweep experiments were
performed to determine the linear viscoelastic regime, where the rheological properties
are not strain dependent. Then, the viscoelastic properties of colloidal gels were evaluated
using a frequency sweep from 0.1 to 10 Hz at 1% strain, which was in the linear
viscoelastic region. This range includes the physiological frequencies of the knee,
ranging from 0.5 Hz (walk) to 3 Hz (running) (16-19). All experiments were performed
in triplicate.
In the oscillatory experiment, a sinusoidal shear strain was applied to the samples
accordingly to:
( ) ( )
where is the shear strain amplitude, is the oscillation frequency and is the time.
The mechanical response, expressed as the shear stress ( ) of viscoelastic materials,
ranges from an ideal pure elastic solid (follows Hooke’s law) and an ideal pure viscous

59
fluid (follows Newton’s law) (16). If viscoelastic, the mechanical response is out of phase
by from Eq. (5) with respect to the imposed deformation as stated by:
( ) ( ) ( ) ( ) ( )
where ( ) is the shear elastic modulus giving information about elasticity or the
energy stored in the material during deformation and ( ) is the shear viscous modulus
which describes the viscous characteristic or the energy scattered as heat (16).
The combined viscous and elastic behavior is defined by the absolute value of
complex shear modulus (16):
( ) √ ( )
The ratio between the viscous modulus and the elastic modulus is defined by the
loss tangent (tan delta):
( )
The loss tangent is the ratio of the energy lost to the energy stored in the cyclic
deformation (16-18).
60
3.2.2.7. Viscosity of HA colloidal gel
The viscosity of the different formulations was determined using an AR 2000
rheometer (TA Instruments, Delaware) equipped with a 2°, 20 mm diameter cone-plate at
25 °C. HA nanoparticles (made from 17 kDa HA) were mixed with deionized water at
different concentrations (5%, 15%, 30%, 45% w/v). Shear stress and viscosity of the
samples were measured over a shear rate sweep of 0.01-100 s-1
. 17 kDa HA polymer was
also dissolved in deionized water at 45% w/v concentration as a negative control. All
experiments were performed in triplicate.
3.2.2.8. HA colloidal gel recovery
3.2.2.8.1. Mechanical dynamics and recovery
To characterize recovery and the dynamic behavior of HA colloidal gels,
compression testing was performed as described in section 3.2.2.4. Two sets of samples
(after fabrication and swollen in 0.1 M PBS) were prepared for this experiment. After
fabrication of colloidal gels at different nanoparticle concentrations (15%, 30%, and 45%
w/v), one set of samples was swollen in 0.1 M PBS solution for at least 24 hours. Each
sample was punched to a diameter of approximately 5 mm. After loading each sample,
five preconditioning compression cycles at 6% strain were applied to initiate the recovery
experiment. Then, a compression at 30% strain (0.005 mm/s) was applied. After
squeezing the sample, compression force was removed and the sample was allowed to
relax for five minutes. Meanwhile, the sample was hydrated with deionized water to
prevent dryness. Finally, another compression at 30% strain (0.001 mm/s) was applied.
61
The mechanical recovery and dynamic property of samples were identified by comparing
the recovered height of the samples after the second compression to the height of the
samples before the first compression. Normal stress-gap curves were generated and used
to identify the recovery. All experiments were performed in triplicate.
3.2.2.8.2. Rheological recovery
To evaluate the rheological recovery of colloidal gels, the viscosity was measured
as in section 3.2.2.7. Samples at 15% w/v nanoparticle concentration in deionized water
were prepared for this experiment. Then, the colloidal gel was loaded under the
rheometer and three cycles of shear rate sweeps (0.01-100 s-1
) with a one minute delay
between each cycle were applied to the samples. The changes in shear stress and
viscosity over shear rate sweep after each run was evaluated. All experiments were
performed in triplicate.
3.2.2.8.3. Physical recovery
To evaluate the physical recovery of the colloidal gel, samples at 30% w/v
nanoparticle concentration in deionized water were prepared. The samples were swollen
in water for at least 24 hours. Then, the swollen samples were completely crushed and
dried in a desiccator for at least 48 hours. Finally, dried samples were weighed and again
the colloidal gel samples at 30% w/v were remade. The physical recovery of the samples
was evaluated by visual observation. All experiments were performed in triplicate.

62
3.2.2.9. Statistical analysis
Statistical analysis was performed by one-way analysis of variance (ANOVA). To
evaluate the significance of differences, Newman–Keuls was used as a post-hoc test. A
value of p<0.05 was accepted as significant in all cases.
3.3. Results
3.3.1. Fabrication of colloidal gel
Colloidal gels were formed by mixing nanoparticles with deionized water at
different concentrations. Samples were made from 17 kDa and 1500 kDa HA (Figure 3-
1). These nanoparticles were assumed to have different structural properties. 17 kDa HA
nanoparticles were suspected to have a more ‘hairy’ structure with dangling chains
compared to 1500 kDa HA nanoparticles. Colloidal gels with a stable 3-D structure
formed at 15%, 30%, and 45% w/v when nanoparticles made from 17 kDa HA were
used. Colloidal gels could also hold their structure upon swelling in deionized water. At
5% w/v nanoparticle concentration, the mixture could not form a stable 3-D structure;
however, a viscous suspension of HA nanoparticles was obtained (Figure 3-1, B). That
might be because of the physical entanglement between dangling chains of nanoparticles.
On the other hand, 17 kDa HA polymer solutions at 5%, 15%, 30%, and 45% were liquid
and a 3-D network was not evident (Figure 3-1, A). Even positive controls using EDC
and adipic acid dihydrazide with hyaluronic acid resulted in no gel formation at similar
concentrations. Positive controls were made by activating carboxyl groups of 17 kDa HA
via EDC and trying to crosslink them via adipic acid dihydrazide in deionized water (but
63
without acetone in this case) at similar concentrations to colloidal gel formulations
(Figure 3-1, C).
Mixing nanoparticles fabricated from 1500 kDa HA at 1.4%, 5%, 10%, 15%,
30%, and 45% w/v concentrations did not form any stable colloidal gel network (Figure
3-1, E). At lower concentrations (1.4%, 5%, 10%, and 15% w/v), formation of a low
viscosity nanoparticle suspension was observed; however, at 30% and 45% w/v
nanoparticle concentrations, paste-like materials were obtained (Figure 3-1, E and F).
Mixing 1500 kDa HA polymer with deionized water at 1.4% w/v resulted in formation of
a viscous polymer solution however at 5%, 10%, and 15% w/v polymer concentrations,
3-D gels formed (Figure 3-1, D). These gels, however, could be dissolved while swelling
in deionized water.
Results showed that at 15%, 30%, and 45% w/v nanoparticle concentrations (17
kDa HA nanoparticles), colloidal gels with stable 3-D structure were formed. In contrast,
paste-like materials were formed in the samples made from 1500 kDa HA nanoparticles
at similar concentrations. Formation of stable colloidal gels in the samples made from 17
kDa HA nanoparticles may be due to physical entanglement of the dangling chains
available on the surface of 17 kDa HA nanoparticles. On the other hand, the absence of
these dangling chains on the nanoparticles made from 1500 kDa HA negated physical
entanglement and yielded weak paste-like materials (Figure 3-2).

64
Figure (3-1) (A) 17 kDa HA polymer solutions (HA-PO) at different concentrations (5%,
15%, 30%, and 45% w/v). (B) Colloidal gels (HA-NP) formed at different HA (17 kDa)
nanoparticles concentrations (15%, 30%, and 45% w/v). (C) Carbodiimide chemistry also
did not form stable gel at different HA (17 kDa) concentrations. (D) 1500 kDa polymer
solutions (HA-PO) at different concentrations (1.4%, 5%, 10, 15% w/v). (E) Nanoparticle
suspensions (HA-NP) formed at different HA (1500 kDa) nanoparticles concentrations
(1.4%, 5%, 10, 15% w/v). (F) Formation of paste-like materials was observed at 30% and
45% w/v HA (1500 kDa) nanoparticle concentrations.

65
Figure (3-2) (Top) Physical entanglement due to the presence of dangling chains on the
surface of 17 kDa HA nanoparticles may facilitate formation of stable colloidal gel
networks. (Bottom) Due to the absence of dangling chains on 1500 kDa HA
nanoparticles, physical entanglement and formation of stable colloidal gel networks did
not occur.
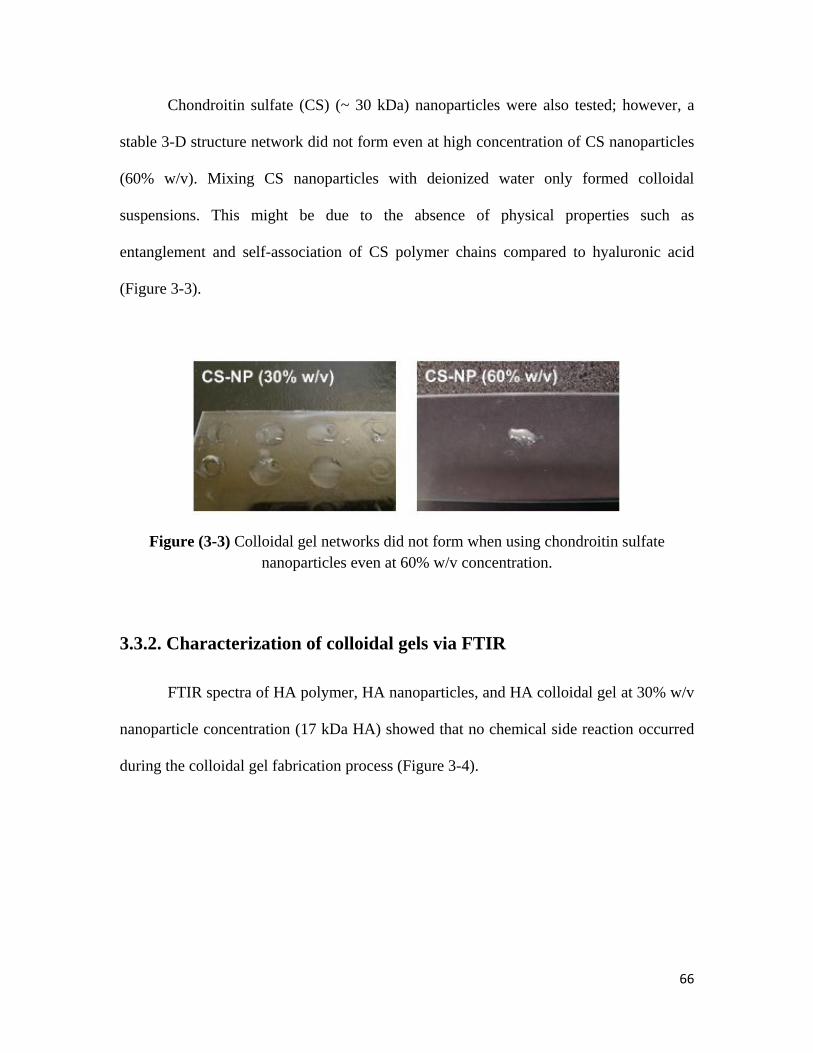
66
Chondroitin sulfate (CS) (~ 30 kDa) nanoparticles were also tested; however, a
stable 3-D structure network did not form even at high concentration of CS nanoparticles
(60% w/v). Mixing CS nanoparticles with deionized water only formed colloidal
suspensions. This might be due to the absence of physical properties such as
entanglement and self-association of CS polymer chains compared to hyaluronic acid
(Figure 3-3).
Figure (3-3) Colloidal gel networks did not form when using chondroitin sulfate
nanoparticles even at 60% w/v concentration.
3.3.2. Characterization of colloidal gels via FTIR
FTIR spectra of HA polymer, HA nanoparticles, and HA colloidal gel at 30% w/v
nanoparticle concentration (17 kDa HA) showed that no chemical side reaction occurred
during the colloidal gel fabrication process (Figure 3-4).

67
Figure (3-4) FTIR spectra of HA polymer (HA-PO), HA nanoparticles (HA-NP), and
HA colloidal gel (HA-Gel) at 30% w/v concentration. The results indicated that chemical
side reactions did not occur during colloidal gel formation (17 kDa HA).
3.3.3. Swelling experiment
The swelling ratio of HA colloidal gels at different nanoparticle (17 kDa HA)
concentrations (15%, 30%, and 45% w/v) were measured at 6 and 24 hours (Figure 3-5
and Figure 3-6). The swelling ratio of samples swollen in deionized water was greater
than the swelling ratio of samples swollen in 0.1 M PBS. The presence of salt in 0.1 M
PBS solution may keep the HA structure more coiled with a lower hydrodynamic radius
resulting in less swelling of nanoparticles (15). Increasing nanoparticle concentration
decreased the swelling ratio for the samples swollen in both water and 0.1 M PBS. More
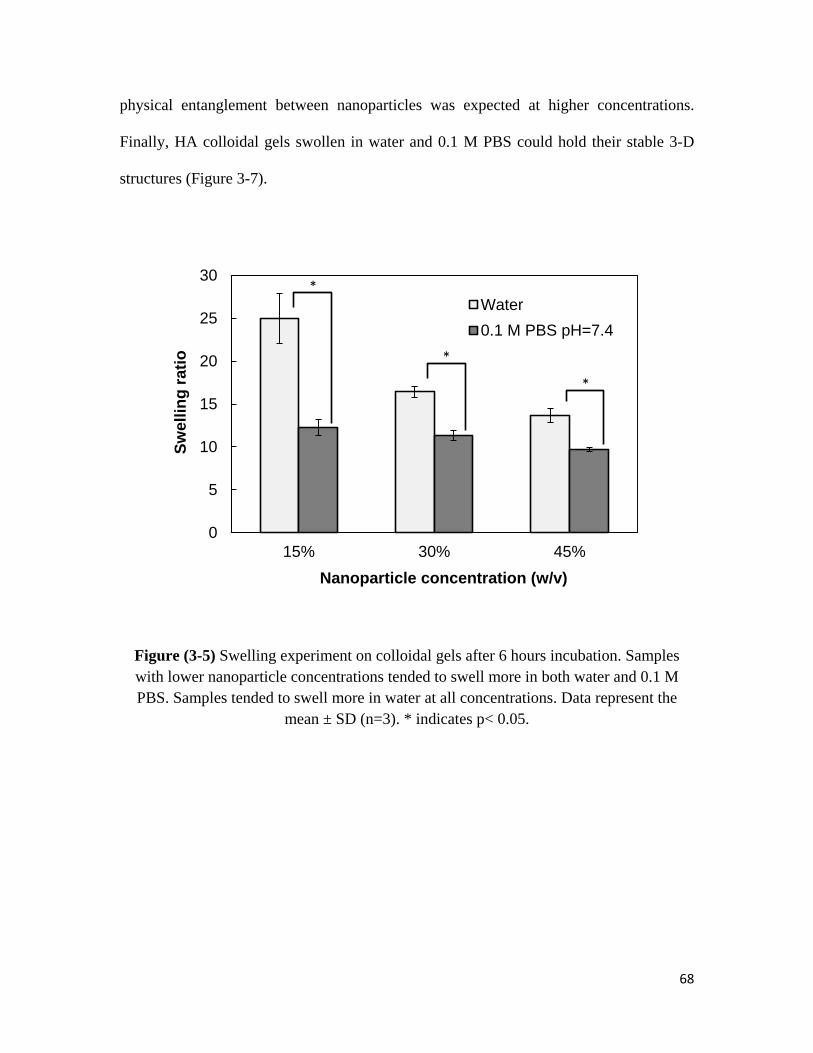
68
physical entanglement between nanoparticles was expected at higher concentrations.
Finally, HA colloidal gels swollen in water and 0.1 M PBS could hold their stable 3-D
structures (Figure 3-7).
Figure (3-5) Swelling experiment on colloidal gels after 6 hours incubation. Samples
with lower nanoparticle concentrations tended to swell more in both water and 0.1 M
PBS. Samples tended to swell more in water at all concentrations. Data represent the
mean ± SD (n=3). * indicates p< 0.05.
0
5
10
15
20
25
30
15% 30% 45%
Sw
ell
ing
ra
tio
Nanoparticle concentration (w/v)
Water
0.1 M PBS pH=7.4
*
*
*

69
Figure (3-6) Swelling experiment on colloidal gels after 24 hours incubation. Samples
with lower nanoparticle concentrations tended to swell more in both water and 0.1 M
PBS. Samples tended to swell more in water at all concentrations. Swelling ratios were
higher after 24 hours incubation than swelling ratios after 6 hours incubation. Data
represent the mean ± SD (n=3). * indicates p< 0.05.
0
5
10
15
20
25
30
35
15% 30% 45%
Sw
ell
ing
rati
o
Nanoparticle concentration (w/v)
Water
0.1 M PBS pH=7.4
*
*
*

70
Figure (3-7) Samples after fabrication, swollen in deionized water, and in 0.1 M PBS.

71
3.3.4. Compression testing and mechanical analysis
Uniaxial compression testing was performed on colloidal gels at 15%, 30%, and
45% w/v nanoparticle concentrations (17 kDa HA) after fabrication, and after swelling in
deionized water or 0.1 M PBS. Stress-strain curves collected for colloidal gels after
fabrication suggested that the colloidal gels behave as soft materials without a failure
point (Figures 3-8). Samples did not even break during compression testing up to 80%
strain. After removing the force, samples could recover their initial shape over time (~ 5
minutes) before and after compression testing up to 80% strain (Figure 3-9).
Figure (3-8) Compression testing up to 80% stain on colloidal gels after fabrication. A
failure point was not observed.
0
50
100
150
200
250
300
350
400
0 20 40 60 80 100
No
rmal str
ess (
kP
a)
Strain (%)
HA-NP-15% (w/v)HA-NP-30% (w/v)HA-NP-45% (w/v)
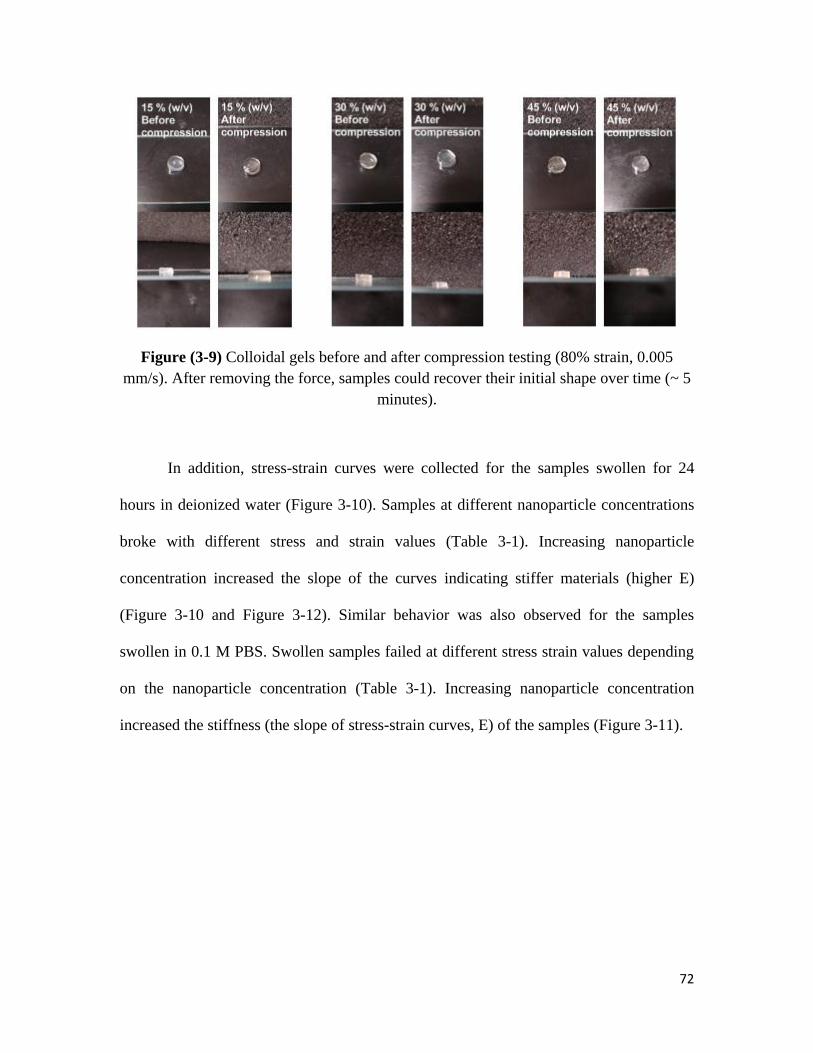
72
Figure (3-9) Colloidal gels before and after compression testing (80% strain, 0.005
mm/s). After removing the force, samples could recover their initial shape over time (~ 5
minutes).
In addition, stress-strain curves were collected for the samples swollen for 24
hours in deionized water (Figure 3-10). Samples at different nanoparticle concentrations
broke with different stress and strain values (Table 3-1). Increasing nanoparticle
concentration increased the slope of the curves indicating stiffer materials (higher E)
(Figure 3-10 and Figure 3-12). Similar behavior was also observed for the samples
swollen in 0.1 M PBS. Swollen samples failed at different stress strain values depending
on the nanoparticle concentration (Table 3-1). Increasing nanoparticle concentration
increased the stiffness (the slope of stress-strain curves, E) of the samples (Figure 3-11).

73
Figure (3-10) Uniaxial compression testing of colloidal gels after swelling in deionized
water.
Figure (3-11) Uniaxial compression testing of colloidal gels after swelling in 0.1 M PBS.
0
1
2
3
4
5
6
7
0 10 20 30 40
No
rmal str
ess (
kP
a)
Strain (%)
HA-NP-15% (w/v)
HA-NP-30% (w/v)
HA-NP-45% (w/v)
0
2
4
6
8
10
12
14
0 10 20 30 40 50 60
No
rmal
str
ess (
kP
a)
Strain (%)
HA-NP-15% (w/v)
HA-NP-30% (w/v)
HA-NP-45% (w/v)
74
Young’s modulus (E) is defined as the initial slope of stress-strain curves
indicating the stiffness of material. Young’s modulus of colloidal gels was determined at
different conditions (Figure 3-12). Increasing nanoparticle concentration increased
Young’s modulus. This increase was greater for the samples swollen in deionized water.
Moreover, samples swollen in deionized water had the highest Young’s modulus.
Perhaps due to the decrease in chain entanglement in 0.1 M PBS due to ionic strength
(15).
In addition, the Young’s modulus of colloidal gel samples at 15%, 30% and 45%
w/v were statistically different (Figure 3-12). Increasing nanoparticle concentration
significantly increased the Young’s modulus of the samples swollen in deionized water
and 0.1 M PBS. Based on these results, Young’s modulus is a concentration dependent
factor of HA colloidal gels and that may be influenced by the environment of the samples
(Figure 3-12).
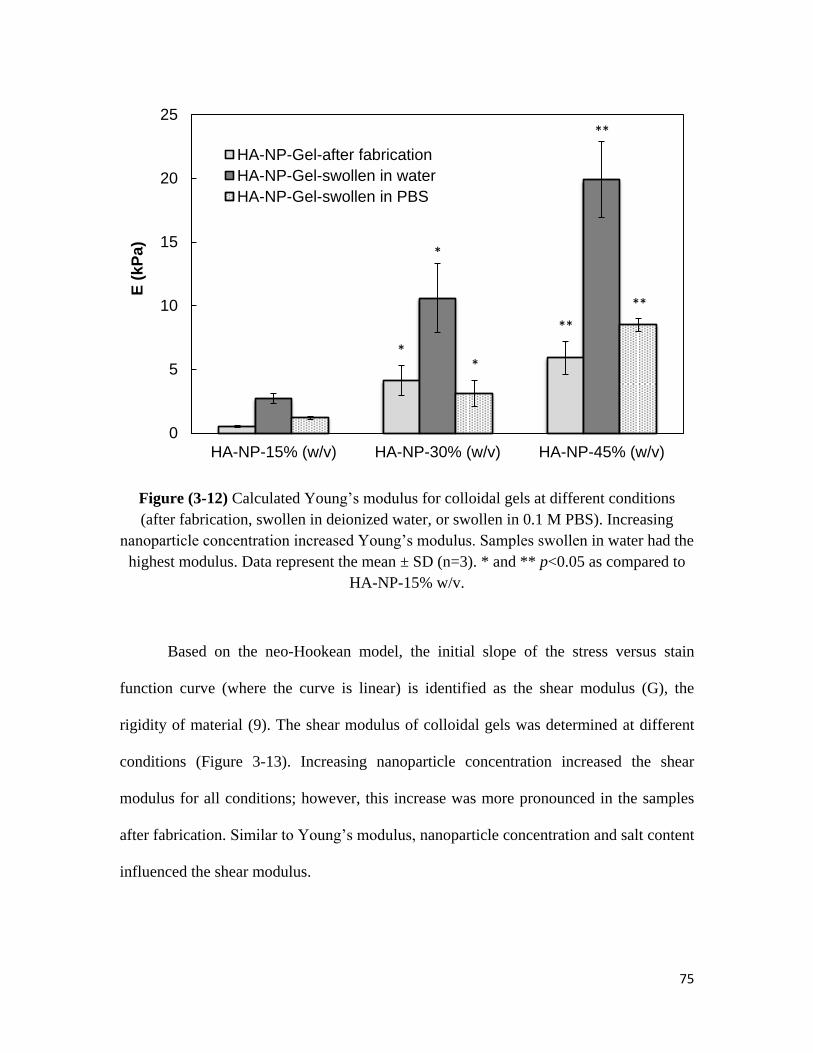
75
Figure (3-12) Calculated Young’s modulus for colloidal gels at different conditions
(after fabrication, swollen in deionized water, or swollen in 0.1 M PBS). Increasing
nanoparticle concentration increased Young’s modulus. Samples swollen in water had the
highest modulus. Data represent the mean ± SD (n=3). * and ** p<0.05 as compared to
HA-NP-15% w/v.
Based on the neo-Hookean model, the initial slope of the stress versus stain
function curve (where the curve is linear) is identified as the shear modulus (G), the
rigidity of material (9). The shear modulus of colloidal gels was determined at different
conditions (Figure 3-13). Increasing nanoparticle concentration increased the shear
modulus for all conditions; however, this increase was more pronounced in the samples
after fabrication. Similar to Young’s modulus, nanoparticle concentration and salt content
influenced the shear modulus.
0
5
10
15
20
25
HA-NP-15% (w/v) HA-NP-30% (w/v) HA-NP-45% (w/v)
E (
kP
a)
HA-NP-Gel-after fabrication
HA-NP-Gel-swollen in water
HA-NP-Gel-swollen in PBS
*
*
*
**
**
**

76
Figure (3-13) Calculated shear modulus for colloidal gels at different conditions (after
fabrication, swollen in deionized water, or swollen in 0.1 M PBS). Increasing
nanoparticle concentration increased shear modulus. Data represent the mean ± SD (n=3).
* and ** p<0.05 as compared to HA-NP-15% w/v.
For incompressible materials (ideal elastomers) such as hydrogels, E was reported
to be approximately equal to 3G ( ( ) , ~1/2) (9). E/G values identify the
relationship between the stiffness and rigidity of the material and E/G was calculated for
colloidal gels at different conditions (Figure 3-14). Obviously, colloidal gels were
elastomeric materials but did not behave as an ideal neo-Hookean elastomer. The data
suggested that Young’s modulus is less than 3G. Increasing nanoparticle concentration
from 15% to 30% w/v increased E/G for the samples swollen in deionized water. In
contrast, increasing nanoparticle concentration decreased E/G values for the samples
0
2
4
6
8
10
12
14
16
18
HA-NP-15% (w/v) HA-NP-30% (w/v) HA-NP-45% (w/v)
G (
kP
a)
HA-NP-Gel-after fabrication
HA-NP-Gel-swollen in water
HA-NP-Gel-swollen in PBS
*
**
*
**
*
**
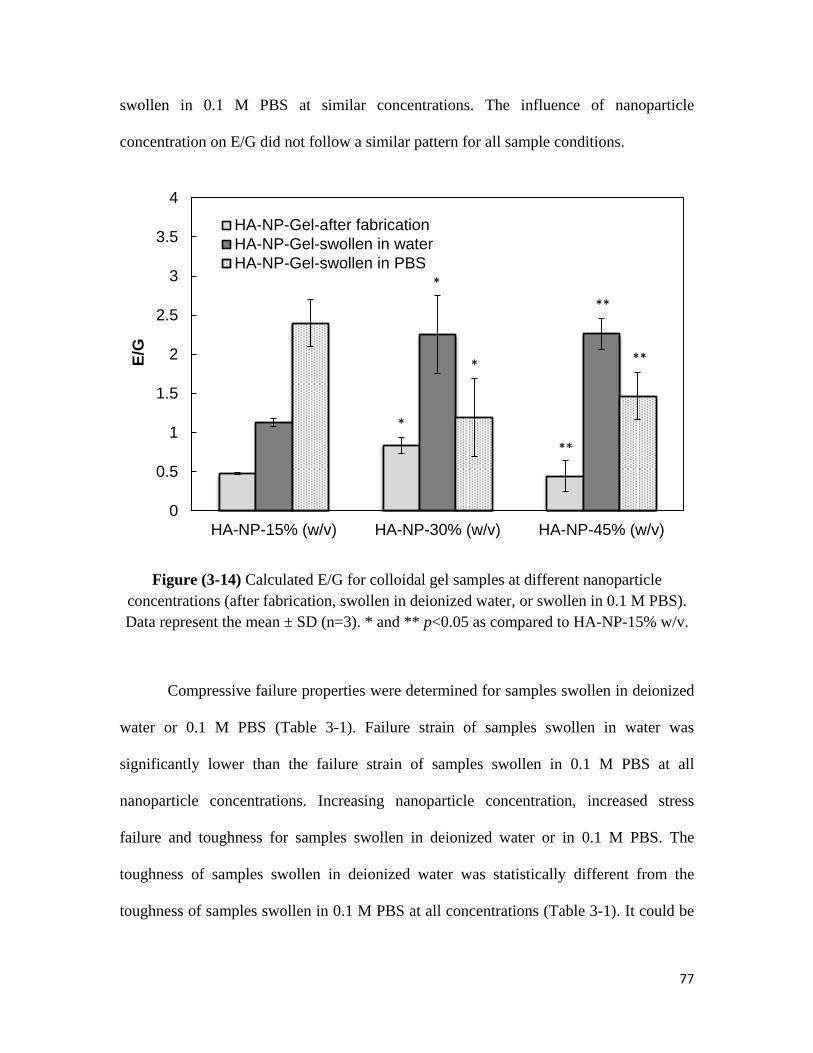
77
swollen in 0.1 M PBS at similar concentrations. The influence of nanoparticle
concentration on E/G did not follow a similar pattern for all sample conditions.
Figure (3-14) Calculated E/G for colloidal gel samples at different nanoparticle
concentrations (after fabrication, swollen in deionized water, or swollen in 0.1 M PBS).
Data represent the mean ± SD (n=3). * and ** p<0.05 as compared to HA-NP-15% w/v.
Compressive failure properties were determined for samples swollen in deionized
water or 0.1 M PBS (Table 3-1). Failure strain of samples swollen in water was
significantly lower than the failure strain of samples swollen in 0.1 M PBS at all
nanoparticle concentrations. Increasing nanoparticle concentration, increased stress
failure and toughness for samples swollen in deionized water or in 0.1 M PBS. The
toughness of samples swollen in deionized water was statistically different from the
toughness of samples swollen in 0.1 M PBS at all concentrations (Table 3-1). It could be
0
0.5
1
1.5
2
2.5
3
3.5
4
HA-NP-15% (w/v) HA-NP-30% (w/v) HA-NP-45% (w/v)
E/G
HA-NP-Gel-after fabrication
HA-NP-Gel-swollen in water
HA-NP-Gel-swollen in PBS
*
**
*
* **
**

78
concluded that the increase of failure stress and toughness might be due to greater
physical entanglement between nanoparticles at higher nanoparticle concentrations.
Table (3-1) Compressive failure properties of colloidal gels swollen in deionized water
or 0.1 M PBS. Data represent the mean ± SD (n=3). Gel formulation Compressive failure properties
Swollen in water Swollen in 0.1M PBS
Strain (%) Stress
(kPa)
Toughness
(kJ/m3)
Strain (%) Stress
(kPa)
Toughness
(kJ/m3)
HA-NP 15% (w/v) 30±2.1 3±0.16 0.3±0.032 53±3.4 1±0.7 0.5±0.082
HA-NP 30% (w/v) 26±3.4 5±1.6* 0.6±0.183 60±1.5 10±0.24 2.7±0.365*
HA-NP 45% (w/v) 21±1.4** 6±2.5** 0.6±0.234 48±2.6 16±4.6 3.3±0.667**
* and ** p<0.05 comparing to HA-NP 15% w/v.
3.3.5. Effect of pH and ionic strength on mechanical properties of HA
colloidal gel
The stress-strain curves were determined for samples at 15% w/v nanoparticle
concentration and different pH values (17 kDa HA) (Figure 3-15). Increasing pH
influenced the behavior of material as was observed from the calculated Young’s
modulus and shear modulus which showed that the material become softer at higher pH
values. Increasing pH at 150 mM salt concentration decreased both Young’s modulus and
shear modulus; however, this decrease was not significant for all the samples. Increasing
pH can reduce the hydrodynamic radius of HA (15). Therefore, the physical
entanglement between nanoparticles may decrease at higher pH values resulting in
formation of softer materials. The highest values for Young’s modulus and shear
modulus occurred at pH=6.0 (Figure 3-16).

79
Figure (3-15) Compression testing up to 70% stain on colloidal gels after fabrication in
phosphate buffer solutions at different pH values (6.0, 7.4, and 8) and constant ionic
strength (150 mM). A failure point was not observed for the samples.
-
0
5
10
15
20
25
30
0 20 40 60 80
No
rmal str
ess (
kP
a)
Strain (%)
HA-NP-15% (w/v)-pH 6.0-150 mM
HA-NP-15% (w/v)-pH 7.4-150 mM
HA-NP-15% (w/v)-pH 8-150 mM

80
Figure (3-16) Calculated Young’s modulus, shear modulus, and E/G for colloidal gels at
different pH values and constant ionic strength (150 mM). Increasing pH decreased
Young’s modulus and shear modulus. Data represent the mean ± SD (n=3).
Changing the salt concentration at a constant pH of 7.4 also affected the
mechanical properties of colloidal gels at 15% w/v nanoparticle concentration (17 kDa
HA). Increasing salt concentration made colloidal gels softer (Figure 3-17). Young’s
modulus and shear modulus appeared greater at lower salt concentrations; however, the
results were not statistically significant (Figure 3-18). The presence of salt in the
formulations can influence the structure and reduce HA hydrodynamic radius (15).
Therefore, this effect may also decrease physical entanglement between nanoparticles
leading to a softer material (Figure 3-18).
0
0.5
1
1.5
2
2.5
3
HA-NP-15% (w/v)-pH6-150 mM
HA-NP-15% (w/v)-pH7.4-150 mM
HA-NP-15% (w/v)-pH8-150 mM
E (kPa)
G (kPa)
E/G
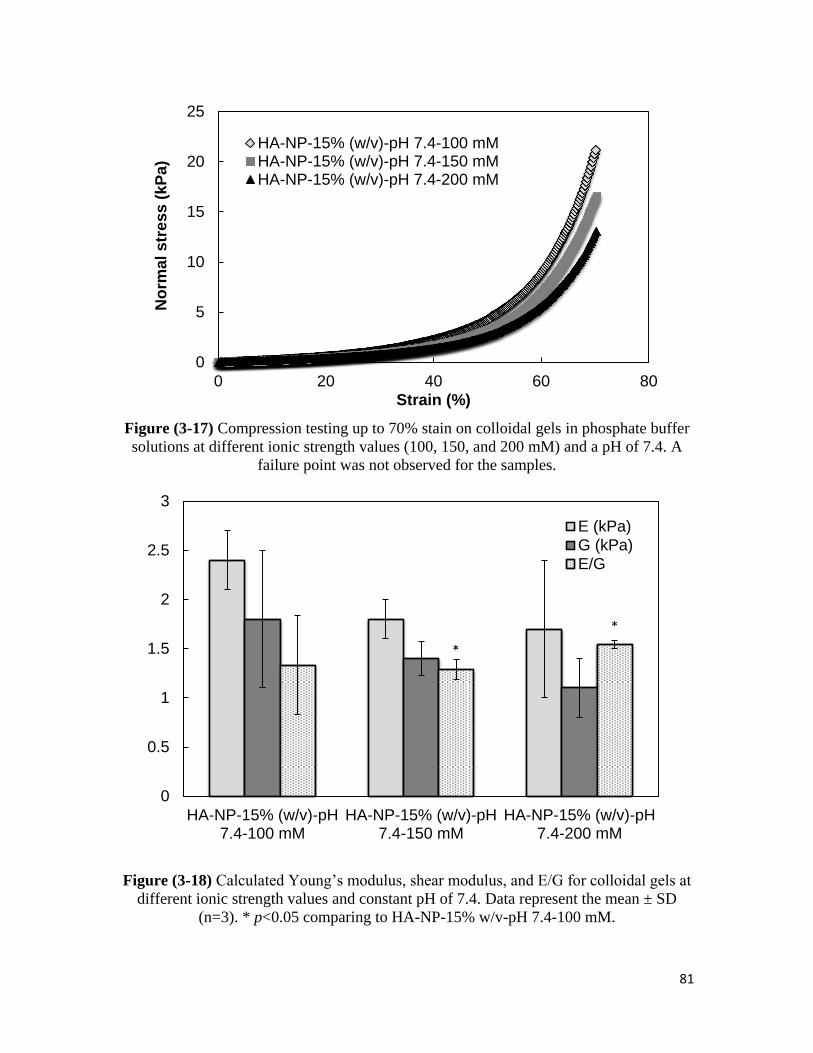
81
Figure (3-17) Compression testing up to 70% stain on colloidal gels in phosphate buffer
solutions at different ionic strength values (100, 150, and 200 mM) and a pH of 7.4. A
failure point was not observed for the samples.
Figure (3-18) Calculated Young’s modulus, shear modulus, and E/G for colloidal gels at
different ionic strength values and constant pH of 7.4. Data represent the mean ± SD
(n=3). * p<0.05 comparing to HA-NP-15% w/v-pH 7.4-100 mM.
0
5
10
15
20
25
0 20 40 60 80
No
rmal str
ess (
kP
a)
Strain (%)
HA-NP-15% (w/v)-pH 7.4-100 mMHA-NP-15% (w/v)-pH 7.4-150 mMHA-NP-15% (w/v)-pH 7.4-200 mM
0
0.5
1
1.5
2
2.5
3
HA-NP-15% (w/v)-pH7.4-100 mM
HA-NP-15% (w/v)-pH7.4-150 mM
HA-NP-15% (w/v)-pH7.4-200 mM
E (kPa)
G (kPa)
E/G
*
*

82
3.3.6. Viscoelasticity of HA colloidal gel after fabrication
Viscoelastic properties were evaluated for HA colloidal gels using different
nanoparticle concentrations. Nanoparticles made from 17 kDa HA were used to make
colloidal gels at 5%, 15%, 30%, and 45% w/v. 17 kDa HA polymer at 45% w/v in
deionized water was also used as a control. The changing elastic modulus (G’) of
colloidal gels was determined over a frequency range of 0.1-10 Hz (Figure 3-19).
Increasing nanoparticle concentration increased the elastic modulus of colloidal gels.
Samples at 5% w/v nanoparticle concentration had a similar elastic modulus compared to
the 45% polymer solution. The elastic modulus of other colloidal samples was greater
than the control.
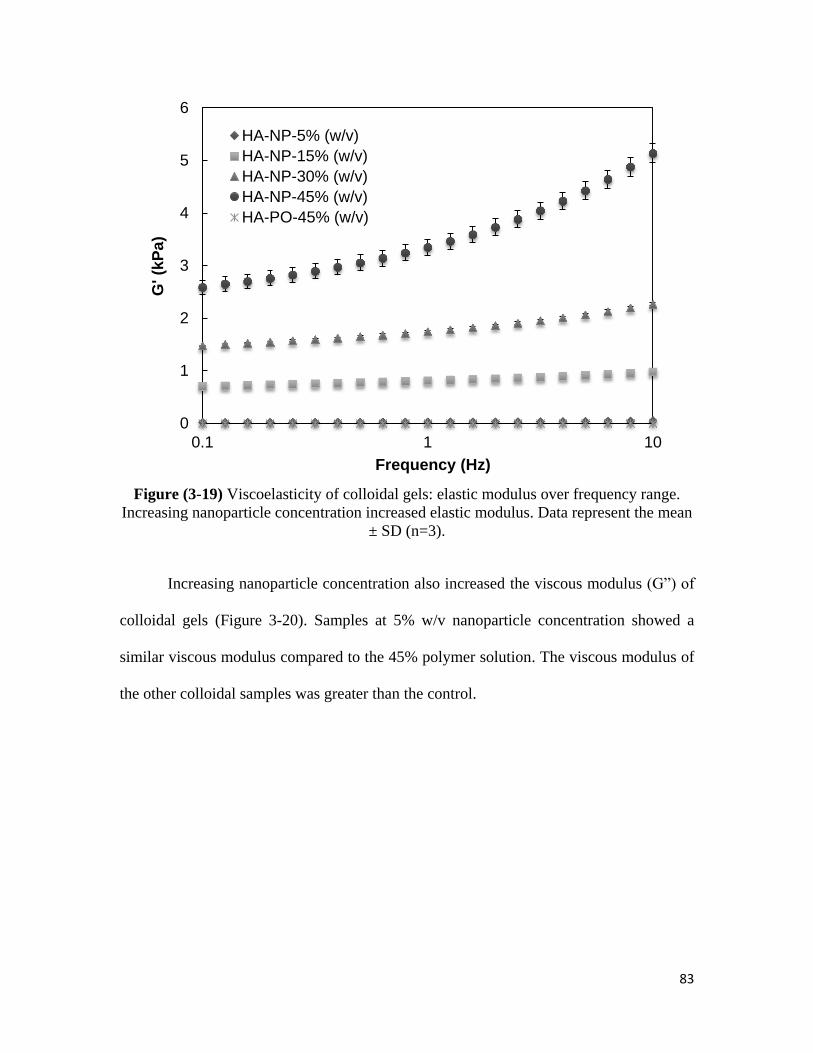
83
Figure (3-19) Viscoelasticity of colloidal gels: elastic modulus over frequency range.
Increasing nanoparticle concentration increased elastic modulus. Data represent the mean
± SD (n=3).
Increasing nanoparticle concentration also increased the viscous modulus (G”) of
colloidal gels (Figure 3-20). Samples at 5% w/v nanoparticle concentration showed a
similar viscous modulus compared to the 45% polymer solution. The viscous modulus of
the other colloidal samples was greater than the control.
0
1
2
3
4
5
6
0.1 1 10
G' (k
Pa)
Frequency (Hz)
HA-NP-5% (w/v)
HA-NP-15% (w/v)
HA-NP-30% (w/v)
HA-NP-45% (w/v)
HA-PO-45% (w/v)

84
Figure (3-20) Viscoelasticity of colloidal gels: viscous modulus over frequency range.
Increasing nanoparticle concentration increased viscous modulus. Data represent the
mean ± SD (n=3).
The calculated complex modulus (G*) showed behavior similar to the elastic and
loss moduli over frequency range (Figure 3-21). Samples at 5% w/v nanoparticle
concentration had a similar complex modulus compared to 45% polymer solution.
0
0.5
1
1.5
2
2.5
0.1 1 10
G" (
kP
a)
Frequency (Hz)
HA-NP-5% (w/v)
HA-NP-15% (w/v)
HA-NP-30% (w/v)
HA-NP-45% (w/v)
HA-PO-45% (w/v)

85
Figure (3-21) Viscoelasticity of colloidal gels: complex modulus over frequency range.
Increasing nanoparticle concentration increased complex modulus. Data represent the
mean ± SD (n=3).
Excluding data for the sample at 5% w/v concentration, tan delta was also
increased by increasing the concentration of nanoparticles (Figure 3-22). Since a stable 3-
D structure was not formed at 5% w/v, the calculated tan delta for this sample showed a
different behavior compared to the rest of the samples.
0
1
2
3
4
5
6
0.1 1 10
G*
(kP
a)
Frequency (Hz)
HA-NP-5% (w/v)
HA-NP-15% (w/v)
HA-NP-30% (w/v)
HA-NP-45% (w/v)
HA-PO-45% (w/v)

86
Figure (3-22) Viscoelasticity of colloidal gels: tan delta over frequency range. Data
represent the mean ± SD (n=3).
3.3.7. Viscosity of HA colloidal gel
The viscosity of colloidal gels was measured at different nanoparticle
concentrations in deionized water (Figure 3-23). Changes in viscosity over shear rate
sweep are also presented (Figure 3-24). The 17 kDa HA polymer solution at 45% w/v
concentration was used as a control to compare the behavior of colloidal gels with
polymer solution.
Results showed that samples at 5% w/v behaved similar to the control since a
colloidal gel network did not form at that concentration. By increasing nanoparticle
concentration up to 15% w/v and higher, the behavior of the samples changed. A yield
point was observed for the samples at 15%, 30%, and 45% w/v concentrations. In
0
0.1
0.2
0.3
0.4
0.5
0.6
0.1 1 10
tan
delt
a
Frequency (Hz)
HA-NP-5% (w/v)
HA-NP-15% (w/v)
HA-NP-30% (w/v)
HA-NP-45% (w/v)

87
addition to that, increasing nanoparticle concentration increased shear stress and viscosity
of the samples. At lower shear rates, the viscosity of samples increased to a maximum
(yield point) and then dropped by increasing shear rate. This yield point correlated to the
yield stress point on shear stress-shear rate curves. Increases in the viscosity and shear
stress up to the yield point might be due to the interlocking of dangling chains available
on the surface of nanoparticles (Figure 3-24). After the yield point, nanoparticles may
thus lower the shear stress and viscosity at higher shear rates. The colloidal gels shear
thinned after the yield point, which indicated a “pseudo-plastic” material (Figure 3-24).
Figure (3-23) Rheological evaluation of HA-NP (17 kDa) for nanoparticles in deionized
water. Increasing nanoparticle concentration increased shear stress.
0
500
1000
1500
2000
2500
3000
3500
0 20 40 60 80 100
Sh
ea
r str
es
s (
Pa
)
Shear Rate (s-1)
HA-NP-5% (w/v)
HA-NP-15% (w/v)
HA-NP-30% (w/v)
HA-NP-45% (w/v)
HA-PO-45% (w/v)
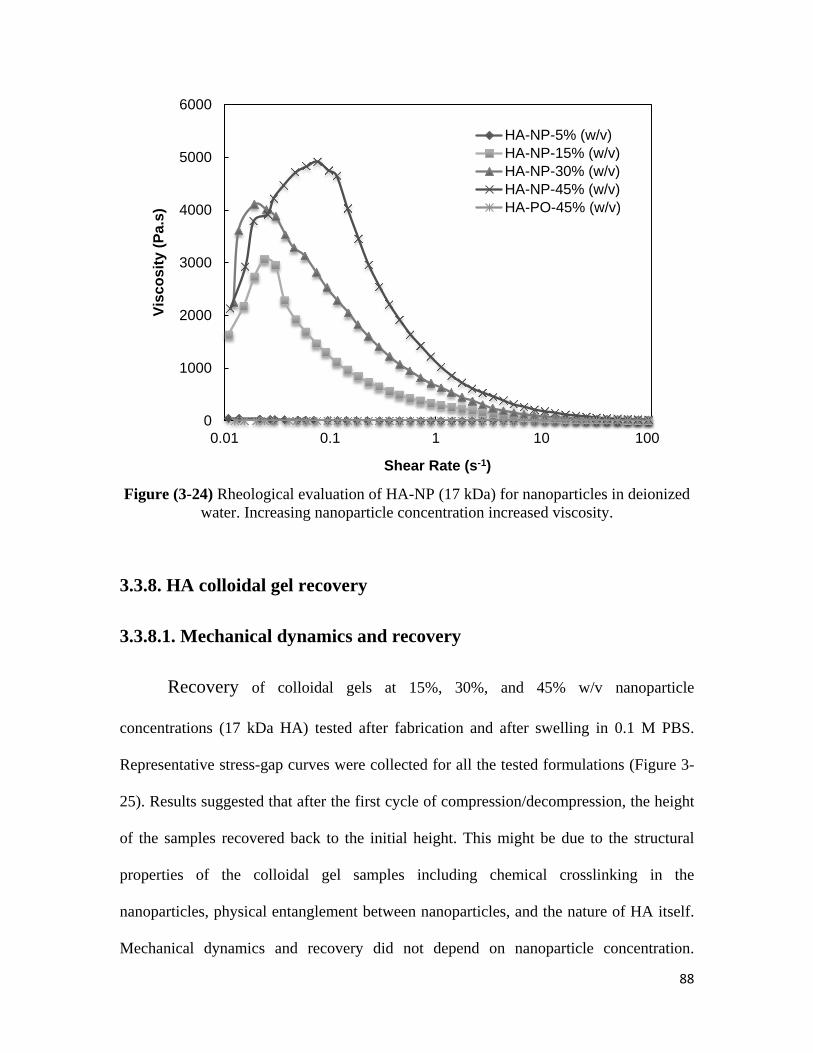
88
Figure (3-24) Rheological evaluation of HA-NP (17 kDa) for nanoparticles in deionized
water. Increasing nanoparticle concentration increased viscosity.
3.3.8. HA colloidal gel recovery
3.3.8.1. Mechanical dynamics and recovery
Recovery of colloidal gels at 15%, 30%, and 45% w/v nanoparticle
concentrations (17 kDa HA) tested after fabrication and after swelling in 0.1 M PBS.
Representative stress-gap curves were collected for all the tested formulations (Figure 3-
25). Results suggested that after the first cycle of compression/decompression, the height
of the samples recovered back to the initial height. This might be due to the structural
properties of the colloidal gel samples including chemical crosslinking in the
nanoparticles, physical entanglement between nanoparticles, and the nature of HA itself.
Mechanical dynamics and recovery did not depend on nanoparticle concentration.
0
1000
2000
3000
4000
5000
6000
0.01 0.1 1 10 100
Vis
co
sit
y (
Pa.s
)
Shear Rate (s-1)
HA-NP-5% (w/v)
HA-NP-15% (w/v)
HA-NP-30% (w/v)
HA-NP-45% (w/v)
HA-PO-45% (w/v)

89
Moreover, similar recovery behavior was observed for both conditions (after fabrication
and after swelling samples in 0.1 M PBS). Due to the failure of samples swollen in
deionized water at strains less than 30%, mechanical recovery experiments were not
performed on these samples.
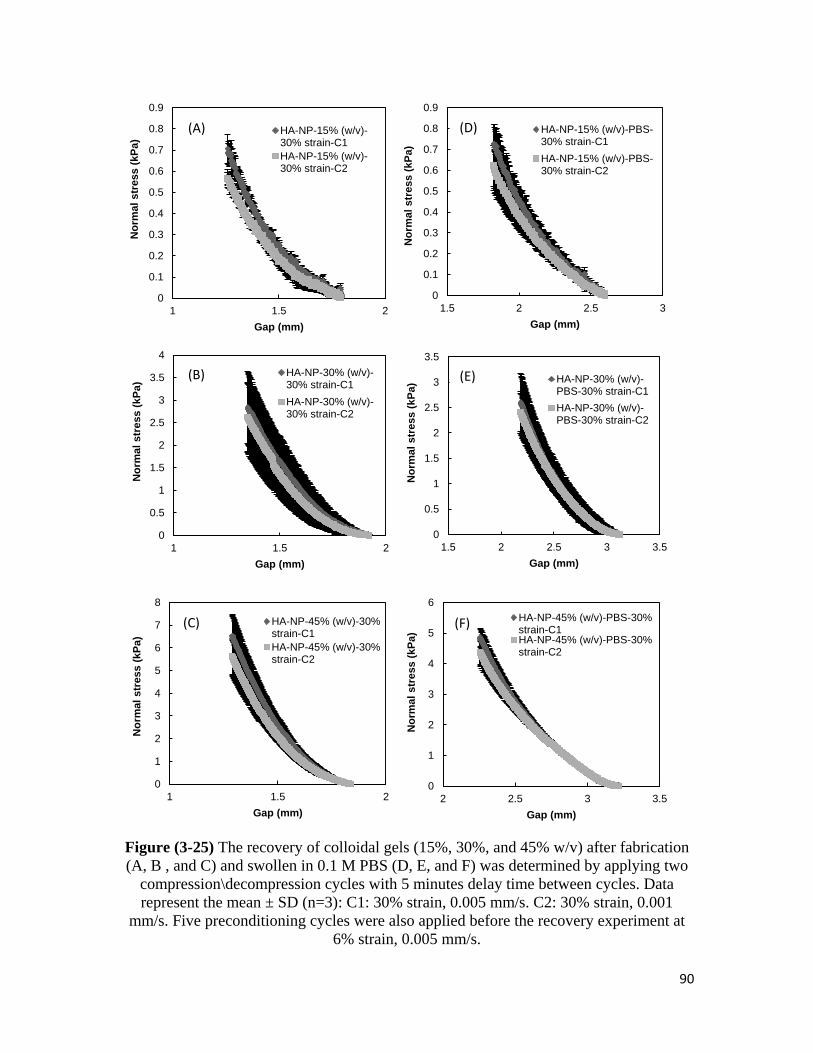
90
Figure (3-25) The recovery of colloidal gels (15%, 30%, and 45% w/v) after fabrication
(A, B , and C) and swollen in 0.1 M PBS (D, E, and F) was determined by applying two
compression\decompression cycles with 5 minutes delay time between cycles. Data
represent the mean ± SD (n=3): C1: 30% strain, 0.005 mm/s. C2: 30% strain, 0.001
mm/s. Five preconditioning cycles were also applied before the recovery experiment at
6% strain, 0.005 mm/s.
0
0.1
0.2
0.3
0.4
0.5
0.6
0.7
0.8
0.9
1 1.5 2
No
rmal
str
ess (
kP
a)
Gap (mm)
HA-NP-15% (w/v)-30% strain-C1
HA-NP-15% (w/v)-30% strain-C2
0
0.1
0.2
0.3
0.4
0.5
0.6
0.7
0.8
0.9
1.5 2 2.5 3
No
rmal
str
ess (
kP
a)
Gap (mm)
HA-NP-15% (w/v)-PBS-30% strain-C1
HA-NP-15% (w/v)-PBS-30% strain-C2
0
0.5
1
1.5
2
2.5
3
3.5
4
1 1.5 2
No
rmal
str
ess (
kP
a)
Gap (mm)
HA-NP-30% (w/v)-30% strain-C1
HA-NP-30% (w/v)-30% strain-C2
0
0.5
1
1.5
2
2.5
3
3.5
1.5 2 2.5 3 3.5
No
rmal
str
ess (
kP
a)
Gap (mm)
HA-NP-30% (w/v)-PBS-30% strain-C1
HA-NP-30% (w/v)-PBS-30% strain-C2
0
1
2
3
4
5
6
7
8
1 1.5 2
No
rmal
str
ess (
kP
a)
Gap (mm)
HA-NP-45% (w/v)-30%strain-C1
HA-NP-45% (w/v)-30%strain-C2
0
1
2
3
4
5
6
2 2.5 3 3.5
No
rmal
str
ess (
kP
a)
Gap (mm)
HA-NP-45% (w/v)-PBS-30%strain-C1HA-NP-45% (w/v)-PBS-30%strain-C2
(A)
(B)
(C)
(D)
(E)
(F)
91
3.3.8.2. Rheological recovery
The rheological recovery of samples at 15% w/v nanoparticle concentration was
also evaluated after colloidal gel fabrication (Figure 3-26 and Figure 3-27). The viscosity
of the colloidal gels was recoverable after applying shear stress to the samples. These
results suggested that surface chains could re-associate after disruption by shear force.
After applying shear force, samples still had similar rheological behavior compared to the
initial material which suggests recovery of the colloidal gel network after applying shear.
Studies have shown a reduction in the viscosity of HA solutions after applying shear
stress and HA has been found to degrade under shear (15, 20-22). The slight drop in
viscosity after the first sweep might be due to the degradation of HA or an insufficient
delay between each run. The drop in viscosity was less after the second run (Figure 3-27).

92
Figure (3-26) Colloidal gel recovery based on rheology. After applying shear stress to
the sample (15% w/v nanoparticle concentration), shear recovery was observed after a
one minute delay between cycles.
0
200
400
600
800
1000
1200
1400
0 20 40 60 80 100
Sh
ea
r str
es
s (
Pa
)
Shear rate (s-1)
HA-NP-15% (w/v)-first run
HA-NP-15% (w/v)-second run
HA-NP-15% (w/v)-third run

93
Figure (3-27) Colloidal gel recovery based on rheology. After applying shear stress to
the sample (15% w/v nanoparticle concentration), shear recovery was observed after a
one minute delay between cycles.
3.3.8.3. Physical recovery
Colloidal gels at 30% w/v nanoparticle concentration (17 kDa HA) formed a
network after fabrication and after swelling in deionized water. The steps for performing
this recovery experiment are shown in Figure 3-28. First, nanoparticles made from 17
kDa HA were used to make the colloidal gel at 30% w/v concentration. The colloidal gel
was then swollen and equilibrated in deionized water for at least 24 hours. After swelling
the sample, the colloidal gel was completely crushed. Then, the sample was transferred to
a desiccator chamber and left to dry for at least 48 hours. Finally, the dried sample was
again used to form a colloidal gel network at 30% w/v nanoparticle concentration in
deionized water. A colloidal gel was again formed from the dried sample. These data
0
500
1000
1500
2000
2500
3000
3500
4000
4500
0.01 0.1 1 10 100
Vis
co
sit
y (
Pa.s
)
Shear rate (s-1)
HA-NP-15% (w/v)-first run
HA-NP-15% (w/v)-second run
HA-NP-15% (w/v)-third run
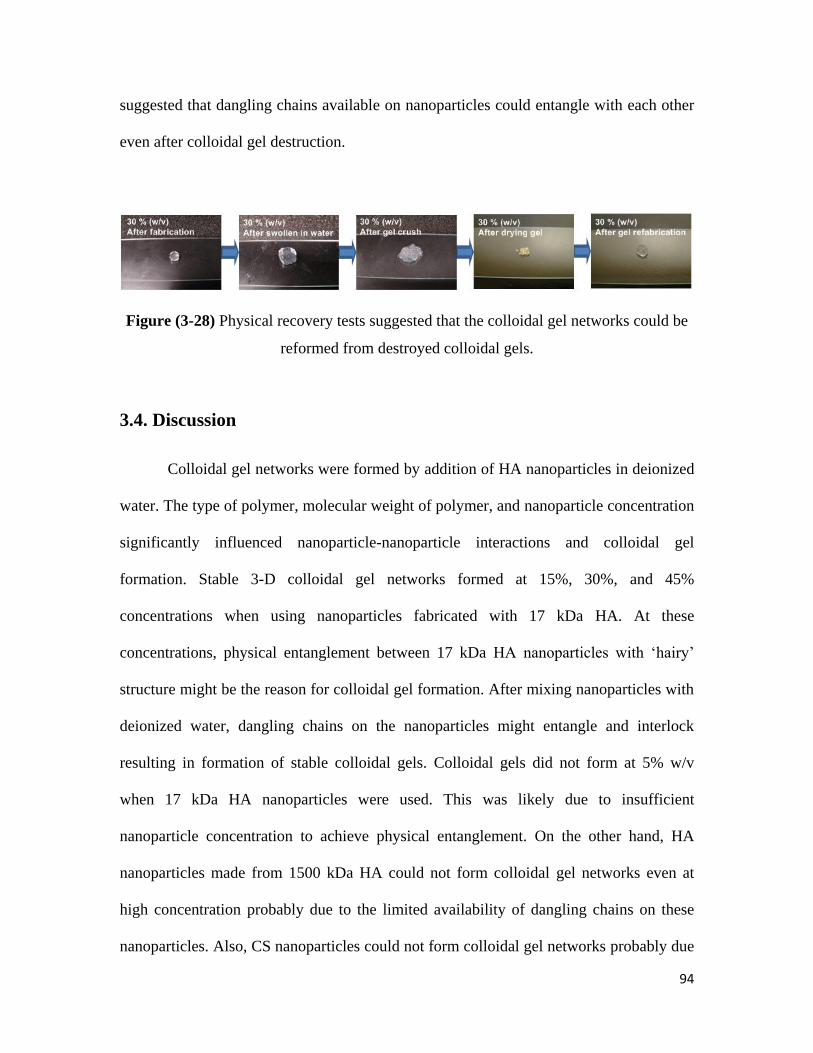
94
suggested that dangling chains available on nanoparticles could entangle with each other
even after colloidal gel destruction.
Figure (3-28) Physical recovery tests suggested that the colloidal gel networks could be
reformed from destroyed colloidal gels.
3.4. Discussion
Colloidal gel networks were formed by addition of HA nanoparticles in deionized
water. The type of polymer, molecular weight of polymer, and nanoparticle concentration
significantly influenced nanoparticle-nanoparticle interactions and colloidal gel
formation. Stable 3-D colloidal gel networks formed at 15%, 30%, and 45%
concentrations when using nanoparticles fabricated with 17 kDa HA. At these
concentrations, physical entanglement between 17 kDa HA nanoparticles with ‘hairy’
structure might be the reason for colloidal gel formation. After mixing nanoparticles with
deionized water, dangling chains on the nanoparticles might entangle and interlock
resulting in formation of stable colloidal gels. Colloidal gels did not form at 5% w/v
when 17 kDa HA nanoparticles were used. This was likely due to insufficient
nanoparticle concentration to achieve physical entanglement. On the other hand, HA
nanoparticles made from 1500 kDa HA could not form colloidal gel networks even at
high concentration probably due to the limited availability of dangling chains on these
nanoparticles. Also, CS nanoparticles could not form colloidal gel networks probably due

95
to the nature of CS and the absence of physical entanglement or ‘self-association’ in this
highly charged GAG.
Swelling experiments suggested that colloidal gel networks were stable upon
dilution in an excess of deionized water and in 0.1 M PBS. The results also indicated that
the swelling ratio was dependent on nanoparticle concentration and the nature of the
swelling solution. Increasing nanoparticle concentration may increase physical
entanglement between nanoparticles reducing the swelling ratio. Moreover, the presence
of salt in swelling solution is known to reduce hydrodynamic radius of HA and physical
entanglement. As a result, the swelling ratio of the samples in 0.1 M PBS was lower than
the swelling ratio of the samples in deionized water. A comparison of HA colloidal gels
and classic HA hydrogels including HA crosslinked via divinyl sulfone (DVS),
photocrosslinked methacrylated HA, dual-crosslinked HA (photo crosslinked and
chemically crosslinked), and HA via crosslinked disulfide bond formation, showed that
the swelling ratio of the colloidal gels was in the range of a maximum swelling ratio of
classic gels (i.e. a low degree of crosslinking) (10, 23-26).
In addition, compression testing also suggested that the mechanical properties of
colloidal gels (Young’s and shear moduli) were influenced by nanoparticle concentration
and sample condition. Increasing nanoparticle concentration made colloidal gels stiffer.
Moreover, samples swollen in deionized water had greater Young’s modulus compared to
the samples after fabrication or to samples swollen in 0.1 M PBS. These behaviors may
also hinge on the physical entanglement between nanoparticles which was influenced by
nanoparticle concentration and sample condition. In addition, compression testing
indicated that colloidal gels behaved as a softer material compared to classic HA
96
hydrogels. Maximum Young’s and shear moduli of the colloidal gels reached
approximately 20 kPa; however, normal Young’s and shear moduli values for HA
crosslinked with DVS were in the range of several thousand kPa (23, 26). Comparing the
shear modulus of colloidal gels with photocrosslinked methacrylated HA (20<G<60 kPa)
also showed that the colloidal gels had softer mechanical properties (24). Only the initial
portion of strain-stress curves, where the stress-strain function curves were linear, was
used to calculate the mechanical properties of colloidal gels, where was though the
colloidal gels have ideal elastic behavior. The compression testing data (E/G values)
showed that the colloidal gels were elastomeric materials but did not behave as an ideal
neo-Hookean elastomer.
In other studies, nanoparticle concentration had an important effect on rheological
behavior of colloidal gels. Increasing nanoparticle concentration increased elastic
modulus, viscous modulus, complex modulus, and tan delta of the samples after
fabrication. Moreover, viscosity of the samples upon mixing nanoparticles with deionized
water increased by increasing nanoparticle concentration. The shear stress and viscosity
of the colloidal gels increased up to a yield point by increasing the shear rate. After the
yield point, viscosity of the samples decreased by increasing the shear rate indicative of
shear thinning behavior for the colloidal gels. Viscoelasticity measurements also
indicated that colloidal gels had a similar elastic modulus, viscous modulus, and complex
modulus compared to a classic hydrogel. Previous viscoelasticity evaluation of HA
crosslinked via DVS showed that the elastic and loss moduli were in the range of several
hundred to several thousand Pa and the colloidal gels had similar viscoelasticity (23).

97
Finally, recovery experiments revealed the dynamic properties of colloidal gels.
Mechanical experiments suggested that the height of the samples was recoverable to the
original height after compressing/decompressing samples independent of nanoparticle
concentration. Rheological experiments also showed that the viscosity of the colloidal
gels was recoverable after applying shear stress to the samples. These results support the
notion that the interrupted physical entanglement between surface chains on nanoparticles
could re-associate after removing shear force. A physical recovery experiment showed
that destroyed, dried, and reconstituted colloidal gels can still form a colloidal gel
network.
3.5. Conclusion
In conclusion, colloidal gel networks were formed by mixing HA nanoparticles in
deionized water. The type of polymer, molecular weight of polymer, and nanoparticle
concentration significantly influenced nanoparticle-nanoparticle interactions and colloidal
gel formation. Stable 3-D colloidal gel networks formed at 15%, 30%, and 45%
concentrations when using nanoparticles fabricated with 17 kDa HA due to physical
entanglement between nanoparticles. CS nanoparticles and nanoparticles made from 1500
kDa HA could not form colloidal gel networks probably due to limited availability of
surface chains to mediate nanoparticle-nanoparticle interactions. Mechanical and
rheological experiments showed that Young’s modulus, shear modulus, viscosity, and
viscoelasticity of colloidal gels were influenced by nanoparticle concentration which
might increase the chance of physical entanglement between ‘hairy’ nanoparticles and
media type. These data also showed that the colloidal gels did not behave as an ideal neo-

98
Hookean elastomer. Finally, recovery experiments confirmed that colloidal gels had
dynamic properties. Formation of stable 3-D colloidal gels using HA nanoparticles
without any potentially toxic chemical reactions suggests a new approach for scaffold
fabrication and tissue regeneration.

99
3.6. References
1. Wang Q, Wang J, Lu Q, Detamore MS, Berkland C., Injectable PLGA based colloidal gels for zero-order dexamethasone release in cranial defects, Biomaterials, 2010;31(18):4980-6. 2. Wang Q, Wang L, Detamore MS, Berkland C., Biodegradable colloidal gels as moldable tissue engineering scaffolds, Advanced Materials, 2008;20(2):236-9. 3. Kretlow JD, Klouda L, Mikos AG., Injectable matrices and scaffolds for drug delivery in tissue engineering, Advanced drug delivery reviews, 2007;59(4-5):263-73. 4. Yeo Y, Ito T, Bellas E, Highley CB, Marini R, Kohane DS., In situ cross-linkable hyaluronan hydrogels containing polymeric nanoparticles for preventing postsurgical adhesions, Annals of surgery, 2007;245(5):819. 5. Tan H, Marra KG., Injectable, biodegradable hydrogels for tissue engineering applications, Materials, 2010;3(3):1746-67. 6. Gutowska A, Jeong B, Jasionowski M., Injectable gels for tissue engineering, The Anatomical Record, 2001;263(4):342-9. 7. Wang Q, Jamal S, Detamore MS, Berkland C., PLGA chitosan/PLGA alginate nanoparticle blends as biodegradable colloidal gels for seeding human umbilical cord mesenchymal stem cells, Journal of Biomedical Materials Research Part A, 2011. 8. Berkland C, Wang Q., Biodegradable Colloidal Gels as Moldable Tissue Engineering Scaffolds, Google Patents; 2008. 9. DeKosky BJ, Dormer NH, Ingavle GC, Roatch CH, Lomakin J, Detamore MS, et al., Hierarchically designed agarose and poly (ethylene glycol) interpenetrating network hydrogels for cartilage tissue engineering. Tissue Engineering Part C: Methods, 2010;16(6):1533-42. 10. Zawko SA, Suri S, Truong Q, Schmidt CE., Photopatterned anisotropic swelling of dual-crosslinked hyaluronic acid hydrogels, Acta Biomaterialia, 2009;5(1):14-22. 11. Segura T, Anderson BC, Chung PH, Webber RE, Shull KR, Shea LD., Crosslinked hyaluronic acid hydrogels: a strategy to functionalize and pattern, Biomaterials, 2005;26(4):359-71. 12. Fransson J, Espander Jansson A., Local tolerance of subcutaneous injections, Journal of pharmacy and pharmacology, 1996;48(10):1012-5. 13. Gatej I, Popa M, Rinaudo M., Role of the pH on hyaluronan behavior in aqueous solution, Biomacromolecules, 2005;6(1):61-7. 14. Dornhofer W, Embrechts E., Injection solution for intramuscular and subcutaneous administration to animals, Google Patents; 1998. 15. Garg HG, Hales CA., Chemistry and biology of hyaluronan, 2004, Elsevier Science. 16. Barbucci R, Lamponi S, Borzacchiello A, Ambrosio L, Fini M, Torricelli P, et al., Hyaluronic acid hydrogel in the treatment of osteoarthritis, Biomaterials, 2002;23(23):4503-13. 17. Ghosh K, Shu XZ, Mou R, Lombardi J, Prestwich GD, Rafailovich MH, et al., Rheological characterization of in situ cross-linkable hyaluronan hydrogels, Biomacromolecules, 2005;6(5):2857-65. 18. Fam H, Kontopoulou M, Bryant J., Effect of concentration and molecular weight on the rheology of hyaluronic acid/bovine calf serum solutions, Biorheology, 2009;46(1):31-43. 19. Zhao X. Synthesis and characterization of a novel hyaluronic acid hydrogel, Journal of Biomaterials Science, Polymer Edition, 2006;17(4):419-33. 20. Šoltés L, Mendichi R, Kogan G, Schiller J, Stankovska M, Arnhold J., Degradative action of reactive oxygen species on hyaluronan, Biomacromolecules, 2006;7(3):659-68. 21. Stern R, Kogan G, Jedrzejas MJ, Soltés L., The many ways to cleave hyaluronan, Biotechnology advances, 2007;25(6):537-57.

100
22. Volpi N, Schiller J, Stern R, Soltes L., Role, metabolism, chemical modifications and applications of hyaluronan, Current medicinal chemistry, 2009;16(14):1718-45. 23. Ibrahim S, Kang QK, Ramamurthi A., The impact of hyaluronic acid oligomer content on physical, mechanical, and biologic properties of divinyl sulfone‐crosslinked hyaluronic acid hydrogels, Journal of Biomedical Materials Research Part A, 2010;94(2):355-70. 24. Bencherif SA, Srinivasan A, Horkay F, Hollinger JO, Matyjaszewski K, Washburn NR., Influence of the degree of methacrylation on hyaluronic acid hydrogels properties, Biomaterials. 2008;29(12):1739-49. 25. Jha AK, Hule RA, Jiao T, Teller SS, Clifton RJ, Duncan RL, et al., Structural analysis and mechanical characterization of hyaluronic acid-based doubly cross-linked networks, Macromolecules, 2009;42(2):537-46. 26. Shu XZ, Liu Y, Luo Y, Roberts MC, Prestwich GD., Disulfide cross-linked hyaluronan hydrogels, Biomacromolecules, 2002;3(6):1304-11.

101
Chapter 4
Application of hyaluronic acid
nanoparticles in colloidal suspensions as a
potential osteoarthritis treatment
102
Chapter 4: Application of hyaluronic acid nanoparticles in colloidal
suspensions as a potential osteoarthritis treatment
4.1. Introduction
Currently, the quality of life for ~33 million Americans is affected by
osteoarthritis (OA) with about 70% of these individuals aged 65 and over (1-3). OA is a
disease in which the degradation of joints results in pain and loss of joint function. Intra-
articular treatments, such as hyaluronic acid (HA) injections into the synovial joint, are
normally recommended to reduce the pain and increase joint function. HA is a major
component of synovial fluid lubricating the joint and preventing joint erosion (4). HA
viscosupplements such as Synvisc®
, Orthovisc®
, and Hyalgan®
are available on the
market (5-7). While these products have shown positive effects, reducing pain and
increasing joint function, poor injectability or insufficient therapeutic effect remain a
need (5-7).
To enhance injectivity, multiple studies have been conducted and several low
viscosity products are available on the market. Using HA with lower molecular weights
has been the primary means to reduce viscosity of vicosupplements; however, low
molecular weight HA does not provide a sufficient therapeutic effect. Hyalgan®
is one of
these low molecular weight, uncrosslinked HA viscosupplements. More injections of
Hyalgan®
are required per treatment course to achieve a reasonable therapeutic effect
(Table 1-5). On the other hand, treatment with crosslinked HA viscosupplements such as
Synvisc®
requires fewer injections per treatment course but their high viscosity impedes
injection.

103
Here, HA nanoparticles were explored as a means to reduce the viscosity of
viscosupplements using high molecular weight HA. Orthovisc®
is made from
uncrosslinked 1500 kDa HA and has the highest concentration of HA among the
uncrosslinked viscosupplements (Table 1-5). In this study, HA nanoparticles were used to
reduce the viscosity of HA solutions with similar molecular weight and concentration to
Orthovisc®
. Two experiments were designed to investigate the effect of nanoparticles on
the rheological behavior (viscosity and viscoelasticity) of simulated Orthovisc®
. A
solution of 1500 kDa at 1.4% w/v was prepared as a model viscosupplement for
osteoarthritis treatment. The effect of including nanoparticles at different ratios and
changing the molecular weight of HA used for nanoparticle fabrication was evaluated
rheologically.

104
4.2. Materials and Methods
4.2.1. Materials
Nanoparticles fabricated in chapter two (section 2.2.2.1) at 1X polymer
concentration, 1:1 molar reactive site ratio, and three hours reaction time made from 17
kDa and 1500 kDa HA were used in this chapter for the experiments.
4.2.2. Methods
4.2.2.1. Application of HA nanoparticles simulated Orthovisc®
formulation
4.2.2.2.1. Mixing HA nanoparticles with HA polymer to reach
hyaluronic acid concentration simulated Orthovisc® formulation
To evaluate the effect of HA nanoparticles in a simulated Orthovisc®
formulation,
an overall HA concentration was set at 1.4 w/v which is the same concentration of
hyaluronic acid (1500 kDa) in Orthovisc®
. Two sets of samples were prepared by mixing
nanoparticles made from 17kDa HA or nanoparticles made from 1500 kDa HA with 1500
kDa HA polymer at different nanoparticle: polymer ratios to reach the final HA
concentration of 1.4% w/v in deionized water. Polymer to nanoparticle ratios were
selected as: 100:0, 75:25, 50:50, 25:75, and 0:100. After removing the dry polymer and
nanoparticles from the freezer and equilibrating them at room temperature, samples were
prepared using these ratios by mixing them in deionized water. Control samples were also
105
prepared by mixing 1500 kDa HA polymer in deionized water at different concentrations
(1.05%, 0.7%, and 0.35% w/v).
4.2.2.2.2. Using HA nanoparticle formulations at different
concentrations
To evaluate the effect of nanoparticle concentration on the viscosity and
viscoelasticity of HA nanoparticle suspensions, nanoparticles made of 1500 kDa HA
were mixed at 1.4%, 5%, 10%, and 15% w/v concentrations with deionized water. 1500
kDa HA polymer at 1.4% w/v was also selected as a control (simulated Orthovisc®
).
4.2.2.2. Viscosity measurement
To investigate the viscosity of samples made in sections 4.2.2.1.1. and 4.2.2.1.2.,
an AR 2000 rheometer (TA Instruments, Delaware) equipped with a 2°, 20 mm diameter
cone-plate at 25 °C was employed. Similar to section 3.2.2.7., after loading samples
under the rheometer, shear stress and viscosity of the samples were measured over a a
shear rate sweep of 0.01-1000 s-1
.
4.2.2.3. Viscoelasticity measurement
To evaluate the viscoelasticity of samples prepared in sections 4.2.2.1.1. and
4.2.2.1.2., dynamic oscillatory rheological measurements were performed using an AR
2000 rheometer (TA Instruments, Delaware) equipped with a 2°, 20 mm diameter cone-

106
plate at 25 °C. Similar to section 3.2.2.6., first, strain sweep experiments were performed
to determine the limit of viscoelasticity, where the rheological properties are strain
dependent. Then, the viscoelastic properties of colloidal suspensions were evaluated
using a frequency sweep from 0.1 to 10 Hz at 1% strain, which was in the linear
viscoelastic region. This range includes the physiological frequencies of the knee,
ranging from 0.5 Hz (walk) to 3 Hz (running) (1, 8-10). All experiments were performed
in triplicate.
4.3. Results
All formulations were prepared as described and tested to evaluate their viscosity
and viscoelasticity (Figure 4-1). A simulated Orthovisc®
using a HA polymer solution
(1500 kDa) at 1.4% w/v concentration was compared to a HA nanoparticle suspension
(1500 kDa) at similar concentration. It was observed that the polymer solution was highly
viscous; however, the nanoparticle suspension was more water-like. The nanoparticle
formation obviously reduced the viscosity and increased the fluidity of HA at 1.4% w/v.

107
Figure (4-1) (Left): HA polymer solution (HA-PO 1500 kDa) at 1.4% w/v concentration.
A viscous polymer solution was observed. (Right): HA nanoparticle suspension (HA-NP
1500 kDa) at 1.4% w/v concentration. Viscosity of the nanoparticle suspension was much
lower than the polymer solution.
4.3.1. Viscosity measurement
4.3.1.1. Mixing HA nanoparticles with HA polymer to reach hyaluronic
acid concentration in the Orthovisc® formulation
The rheological behavior of HA polymer/nanoparticle mixtures using 1500 kDa
polymer and nanoparticles made from 17 kDa or 1500 kDa HA was explored. Increasing
nanoparticle concentration reduced the shear stress and viscosity of the
polymer/nanoparticle mixtures independent of the HA molecular weight used for
nanoparticle fabrication. The highest shear rate and viscosity values were observed for
the sample with 100% HA polymer. On the other hand, the lowest shear rate and

108
viscosity values were for the samples with 100% HA nanoparticles made from either 17
kDa or 1500 kDa HA.
Figure (4-2) Rheological evaluation of HA polymer (1500 kDa) and HA nanoparticle (17
kDa) mixtures. Increasing nanoparticle content in the formulation decreased shear stress.
0
20
40
60
80
100
120
140
160
180
0 200 400 600 800 1000
Sh
ear
Str
es
s (
Pa)
Shear Rate (s-1)
HA 1.4% 1500 kDa-(PO:NP-100:0)-17 kDa NP
HA 1.4% 1500 kDa-(PO:NP-75:25)-17 kDa NP
HA 1.4% 1500 kDa-(PO:NP-50:50)-17 kDa NP
HA 1.4% 1500 kDa-(PO:NP-25:75)-17 kDa NP
HA 1.4% 1500 kDa-(PO:NP-0:100)-17 kDa NP

109
Figure (4-3) Rheological evaluation of HA polymer (1500 kDa) and HA nanoparticle (17
kDa) mixtures. Increasing nanoparticle content in the formulation decreased viscosity.
0
10
20
30
40
50
60
0.01 0.1 1 10 100 1000
Vis
co
sit
y (
Pa.s
)
Shear Rate (s-1)
HA 1.4% 1500 kDa-(PO:NP-100:0)-17 kDa NPHA 1.4% 1500 kDa-(PO:NP-75:25)-17 kDa NPHA 1.4% 1500 kDa-(PO:NP-50:50)-17 kDa NPHA 1.4% 1500 kDa-(PO:NP-25:75)-17 kDa NPHA 1.4% 1500 kDa-(PO:NP-0:100)-17 kDa NP
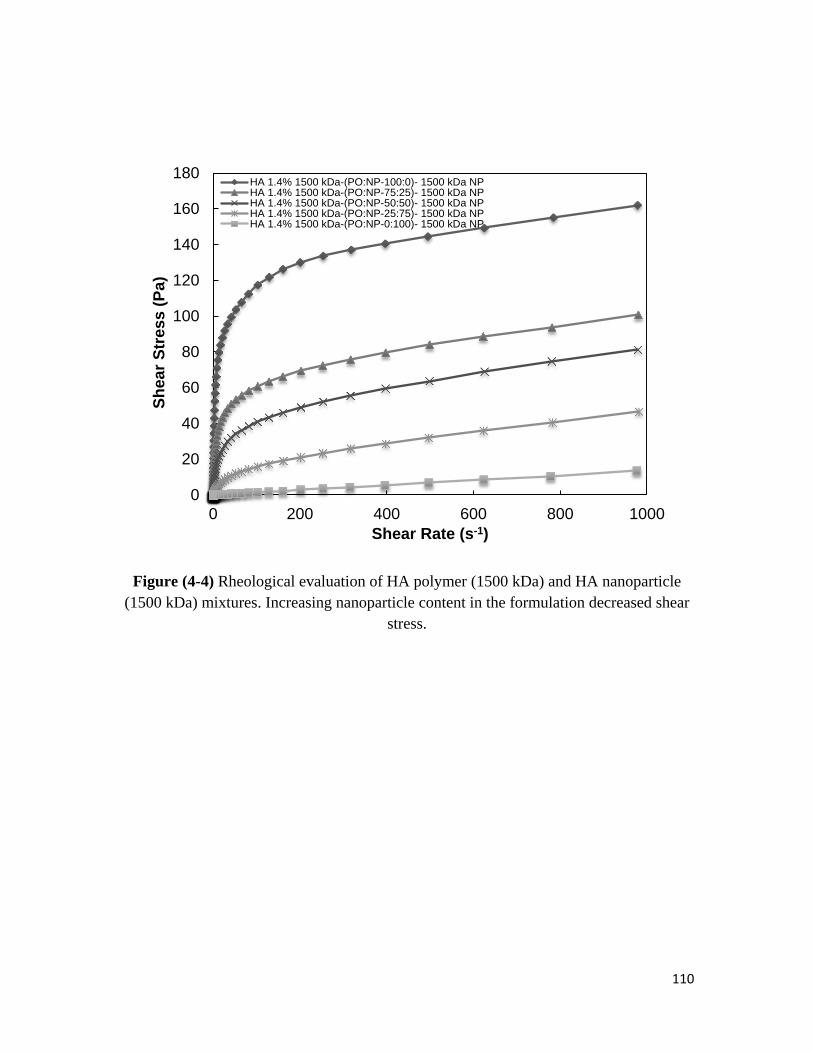
110
Figure (4-4) Rheological evaluation of HA polymer (1500 kDa) and HA nanoparticle
(1500 kDa) mixtures. Increasing nanoparticle content in the formulation decreased shear
stress.
0
20
40
60
80
100
120
140
160
180
0 200 400 600 800 1000
Sh
ear
Str
ess (
Pa)
Shear Rate (s-1)
HA 1.4% 1500 kDa-(PO:NP-100:0)- 1500 kDa NPHA 1.4% 1500 kDa-(PO:NP-75:25)- 1500 kDa NPHA 1.4% 1500 kDa-(PO:NP-50:50)- 1500 kDa NPHA 1.4% 1500 kDa-(PO:NP-25:75)- 1500 kDa NPHA 1.4% 1500 kDa-(PO:NP-0:100)- 1500 kDa NP

111
Figure (4-5) Rheological evaluation of HA polymer (1500 kDa) and HA nanoparticle
(1500 kDa) mixtures. Increasing nanoparticle content in the formulation decreased
viscosity.
Comparing polymer/nanoparticle mixtures made from either 17 kDa or 1500 kDa
HA nanoparticles showed that samples containing 17 kDa HA nanoparticles had higher
viscosity than samples made from 1500 kDa HA nanoparticles at all polymer:
nanoparticle ratios (Figure 4-6). These results suggested that nanoparticles made from 17
kDa HA might interact more with 1500 kDa polymer chains resulting in greater viscosity.
This interaction might be the result of dangling chains on the surface of 17 kDa
nanoparticles. This hairy structure might facilitate entanglement with polymer chains
resulting in greater viscosity values compared to the samples made from 1500 kDa HA
nanoparticles at similar polymer: nanoparticle ratios. Lower viscosity samples made from
0
10
20
30
40
50
60
0.01 0.1 1 10 100 1000
Vis
co
sit
y (
Pa.s
)
Shear Rate (s-1)
HA 1.4% 1500 kDa-(PO:NP-100:0)- 1500 kDa NP
HA 1.4% 1500 kDa-(PO:NP-75:25)- 1500 kDa NP
HA 1.4% 1500 kDa-(PO:NP-50:50)- 1500 kDa NP
HA 1.4% 1500 kDa-(PO:NP-25:75)- 1500 kDa NP
HA 1.4% 1500 kDa-(PO:NP-0:100)- 1500 kDa NP

112
1500 kDa HA nanoparticles might be due to inhibiting polymer chain entanglement
between HA molecules in solution. These data could also support the formation of
colloidal gels using 17 kDa HA nanoparticles and the formation of paste-like materials
using 1500 kDa HA nanoparticles observed in chapter three.
In addition, the difference in initial viscosity of samples using 17 kDa or 1500
kDa HA nanoparticles increased by increasing the concentration of HA polymer in the
samples. The samples at a 75:25 ratio had the greatest initial viscosity difference
comparing the two nanoparticle types (Figure 4-6). Increasing nanoparticle concentration
decreased this viscosity difference as well as the overall viscosity of the samples. This
might be due to more polymer-nanoparticle interaction and physical entanglement in the
samples with higher polymer concentrations. Therefore, the viscosity of
polymer/nanoparticle mixtures could be controlled using nanoparticles made from HA
with different molecular weights.
Formulations containing 1500 kDa HA nanoparticles had viscosity values closer
to the control samples at different polymer:nanoparticle ratios. Increasing the
concentration of nanoparticles showed that the difference between the initial viscosity of
the formulations and controls became lower. These results could suggest that the
entanglement of free surface chains on nanoparticles was more dependent on the
concentration of free polymer in the suspension. Moreover, the absence of sufficient
dangling chains on 1500 kDa HA nanoparticles led to low interaction with either polymer
chains or nanoparticles, thus reducing the viscosity the mixtures.
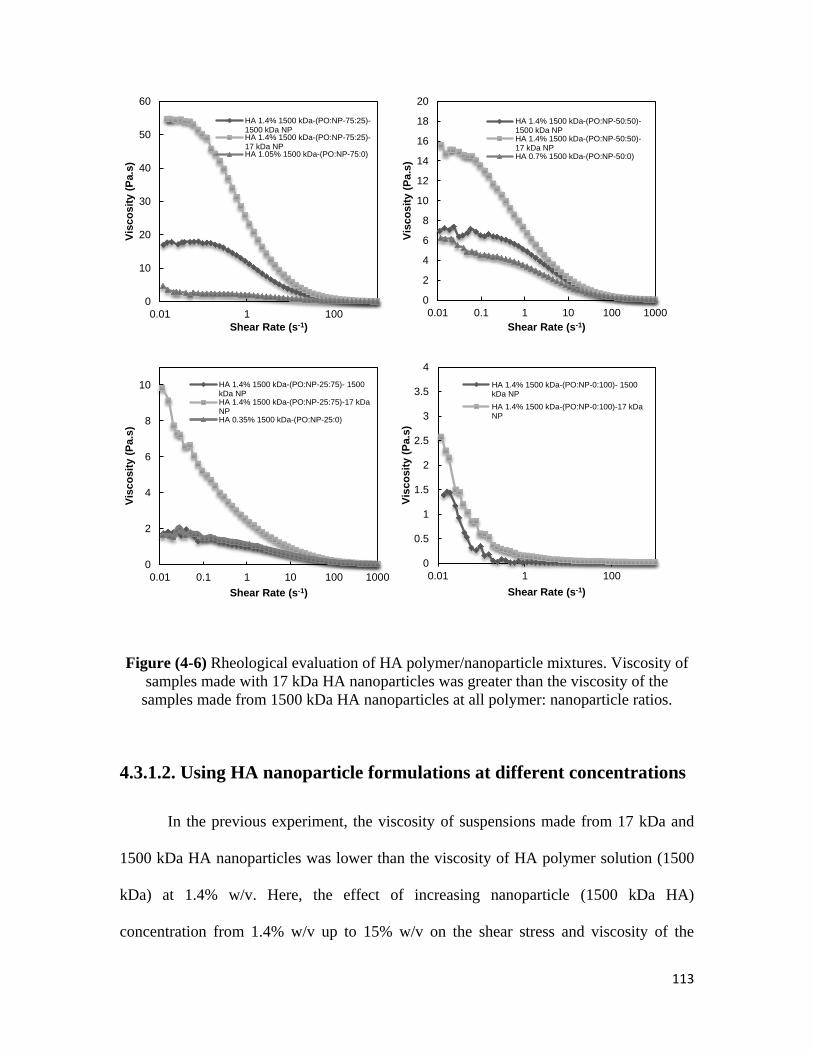
113
Figure (4-6) Rheological evaluation of HA polymer/nanoparticle mixtures. Viscosity of
samples made with 17 kDa HA nanoparticles was greater than the viscosity of the
samples made from 1500 kDa HA nanoparticles at all polymer: nanoparticle ratios.
4.3.1.2. Using HA nanoparticle formulations at different concentrations
In the previous experiment, the viscosity of suspensions made from 17 kDa and
1500 kDa HA nanoparticles was lower than the viscosity of HA polymer solution (1500
kDa) at 1.4% w/v. Here, the effect of increasing nanoparticle (1500 kDa HA)
concentration from 1.4% w/v up to 15% w/v on the shear stress and viscosity of the
0
10
20
30
40
50
60
0.01 1 100
Vis
co
sit
y (
Pa.s
)
Shear Rate (s-1)
HA 1.4% 1500 kDa-(PO:NP-75:25)-1500 kDa NPHA 1.4% 1500 kDa-(PO:NP-75:25)-17 kDa NPHA 1.05% 1500 kDa-(PO:NP-75:0)
0
2
4
6
8
10
12
14
16
18
20
0.01 0.1 1 10 100 1000
Vis
co
sit
y (
Pa.s
)
Shear Rate (s-1)
HA 1.4% 1500 kDa-(PO:NP-50:50)-1500 kDa NPHA 1.4% 1500 kDa-(PO:NP-50:50)-17 kDa NPHA 0.7% 1500 kDa-(PO:NP-50:0)
0
2
4
6
8
10
0.01 0.1 1 10 100 1000
Vis
co
sit
y (
Pa.s
)
Shear Rate (s-1)
HA 1.4% 1500 kDa-(PO:NP-25:75)- 1500kDa NPHA 1.4% 1500 kDa-(PO:NP-25:75)-17 kDaNPHA 0.35% 1500 kDa-(PO:NP-25:0)
0
0.5
1
1.5
2
2.5
3
3.5
4
0.01 1 100
Vis
co
sit
y (
Pa.s
)
Shear Rate (s-1)
HA 1.4% 1500 kDa-(PO:NP-0:100)- 1500kDa NP
HA 1.4% 1500 kDa-(PO:NP-0:100)-17 kDaNP

114
nanoparticle suspensions was investigated. The formation of colloidal systems from 1500
kDa HA nanoparticles (1.4% w/v up to 45% w/v) was presented in chapter three (Figure
3-1). Samples at 30% w/v and 45% w/v nanoparticle concentrations formed paste-like
materials and the rheological properties could not be measured due to high viscosity of
these samples. Therefore, nanoparticle concentrations up to 15% w/v were used for this
experiment (Figures 4-7 and 4-8). The rheological behavior of HA nanoparticle (1500
kDa) samples at 1.4%, 5%, 10%, and 15% w/v concentrations were compared to HA
polymer solution (1500 kDa) at 1.4% w/v.
Increasing nanoparticle concentration increased shear stress and viscosity as shear
rate increased. These results indicated that even at 15% w/v nanoparticle concentration,
shear stress and viscosity of the sample were still lower than the shear stress and viscosity
of 1.4% w/v HA in solution. Nanoparticle formation not only reduced the viscosity of
HA, but also it may also be used to increase the concentration of HA in formulations.
Therefore, higher HA concentrations can be injected into the body with only a small
increase in the formulation viscosity.

115
Figure (4-7) Rheological evaluation of HA nanoparticle (1500 kDa) suspensions at
different nanoparticle concentrations. Increasing nanoparticle concentration increased
shear stress.
0
20
40
60
80
100
120
140
160
180
0 200 400 600 800 1000
Sh
ear
str
ess (
Pa)
Shear rate (s-1)
HA-PO-1500 kDa- 1.4% (w/v)HA-NP-1500 kDa- 1.4% (w/v)HA-NP-1500 kDa- 5% (w/v)HA-NP-1500 kDa- 10% (w/v)HA-NP-1500 kDa- 15% (w/v)

116
Figure (4-8) Rheological evaluation of HA nanoparticle (1500 kDa) suspensions at
different nanoparticle concentrations. Increasing nanoparticle concentration increased
viscosity.
4.3.2. Viscoelasticity measurement
4.3.2.1. Mixing HA nanoparticles with HA polymer to reach hyaluronic
acid concentration in Orthovisc® formulation
The viscoelastic behavior of polymer/nanoparticle mixtures using 1500 kDa
polymer and nanoparticles made from 17 kDa and 1500 kDa HA was evaluated (Figures
4-9 to 4-14). Increasing nanoparticle concentration lowered storage, loss, and complex
moduli of the polymer/nanoparticle mixtures independent of the HA molecular weight
used for the nanoparticles. The highest viscoelastic values were observed for the samples
0
10
20
30
40
50
60
0.01 0.1 1 10 100 1000
Vis
co
sit
y (
Pa.s
)
Shear rate (s-1)
HA-PO-1500 kDa- 1.4% (w/v)
HA-NP-1500 kDa- 1.4% (w/v)
HA-NP-1500 kDa- 5% (w/v)
HA-NP-1500 kDa- 10% (w/v)
HA-NP-1500 kDa- 15% (w/v)
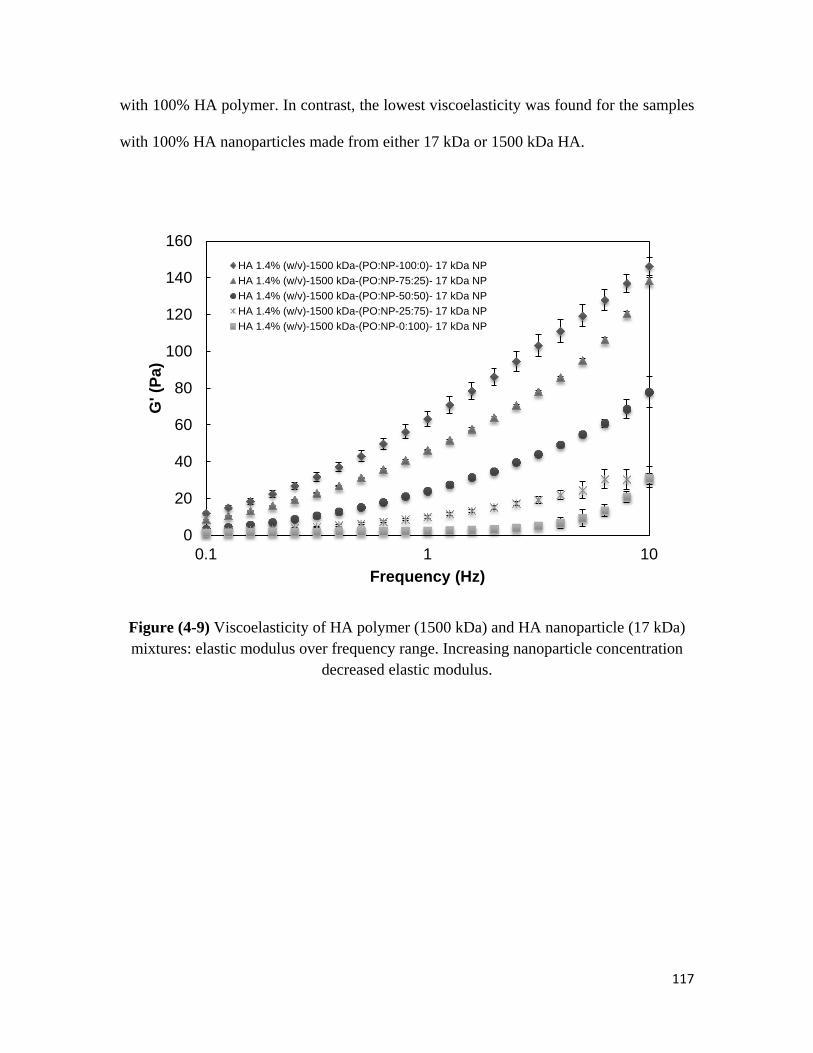
117
with 100% HA polymer. In contrast, the lowest viscoelasticity was found for the samples
with 100% HA nanoparticles made from either 17 kDa or 1500 kDa HA.
Figure (4-9) Viscoelasticity of HA polymer (1500 kDa) and HA nanoparticle (17 kDa)
mixtures: elastic modulus over frequency range. Increasing nanoparticle concentration
decreased elastic modulus.
0
20
40
60
80
100
120
140
160
0.1 1 10
G' (P
a)
Frequency (Hz)
HA 1.4% (w/v)-1500 kDa-(PO:NP-100:0)- 17 kDa NP
HA 1.4% (w/v)-1500 kDa-(PO:NP-75:25)- 17 kDa NP
HA 1.4% (w/v)-1500 kDa-(PO:NP-50:50)- 17 kDa NP
HA 1.4% (w/v)-1500 kDa-(PO:NP-25:75)- 17 kDa NP
HA 1.4% (w/v)-1500 kDa-(PO:NP-0:100)- 17 kDa NP

118
Figure (4-10) Viscoelasticity of HA polymer (1500 kDa) and HA nanoparticle (17 kDa)
mixtures: viscous modulus over frequency range. Increasing nanoparticle concentration
decreased viscous modulus.
0
10
20
30
40
50
60
70
0.1 1 10
G"(P
a)
Frequency (Hz)
HA 1.4% (w/v)-1500 kDa-(PO:NP-100:0)- 17 kDa NPHA 1.4% (w/v)-1500 kDa-(PO:NP-75:25)- 17 kDa NPHA 1.4% (w/v)-1500 kDa-(PO:NP-50:50)- 17 kDa NPHA 1.4% (w/v)-1500 kDa-(PO:NP-25:75)- 17 kDa NPHA 1.4% (w/v)-1500 kDa-(PO:NP-0:100)- 17 kDa NP

119
Figure (4-11) Viscoelasticity of HA polymer (1500 kDa) and HA nanoparticle (17 kDa)
mixtures: complex modulus over frequency range. Increasing nanoparticle concentration
decreased complex modulus.
0
20
40
60
80
100
120
140
160
180
0.1 1 10
G*
(Pa)
Frequency (Hz)
HA 1.4% (w/v)-1500 kDa-(PO:NP-100:0)- 17 kDa NP
HA 1.4% (w/v)-1500 kDa-(PO:NP-75:25)- 17 kDa NP
HA 1.4% (w/v)-1500 kDa-(PO:NP-50:50)- 17 kDa NP
HA 1.4% (w/v)-1500 kDa-(PO:NP-25:75)- 17 kDa NP
HA 1.4% (w/v)-1500 kDa-(PO:NP-0:100)- 17 kDa NP
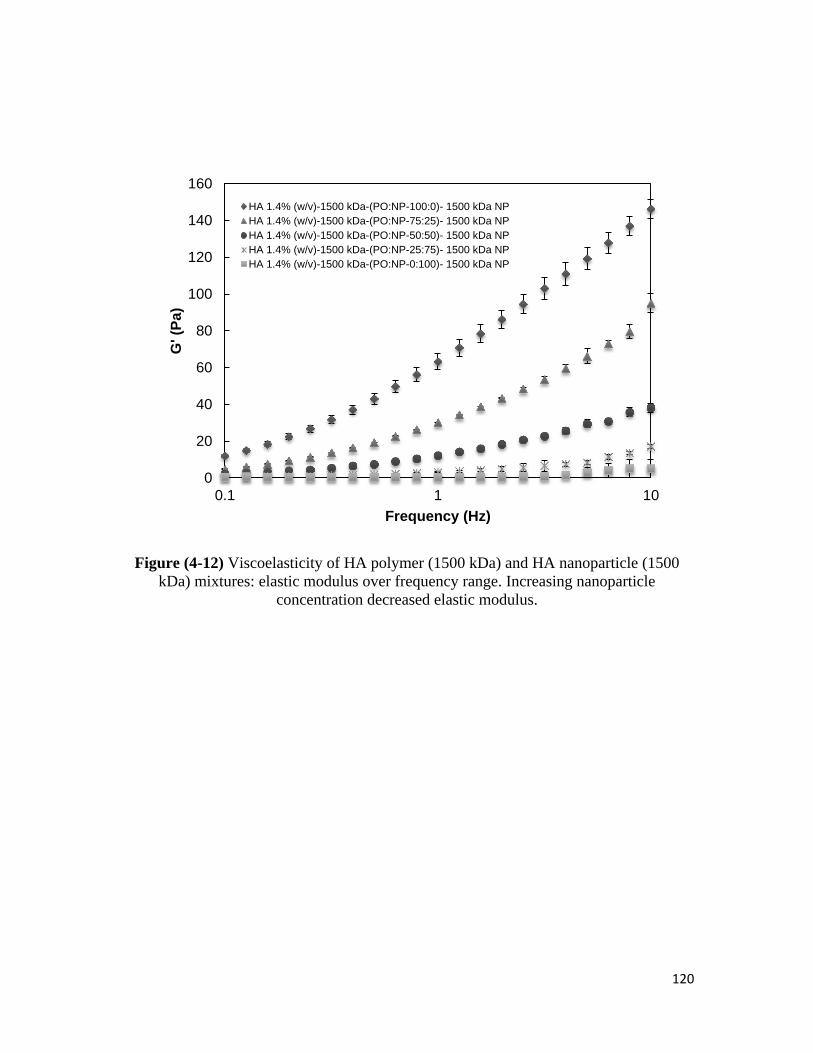
120
Figure (4-12) Viscoelasticity of HA polymer (1500 kDa) and HA nanoparticle (1500
kDa) mixtures: elastic modulus over frequency range. Increasing nanoparticle
concentration decreased elastic modulus.
0
20
40
60
80
100
120
140
160
0.1 1 10
G' (P
a)
Frequency (Hz)
HA 1.4% (w/v)-1500 kDa-(PO:NP-100:0)- 1500 kDa NP
HA 1.4% (w/v)-1500 kDa-(PO:NP-75:25)- 1500 kDa NP
HA 1.4% (w/v)-1500 kDa-(PO:NP-50:50)- 1500 kDa NP
HA 1.4% (w/v)-1500 kDa-(PO:NP-25:75)- 1500 kDa NP
HA 1.4% (w/v)-1500 kDa-(PO:NP-0:100)- 1500 kDa NP

121
Figure (4-13) Viscoelasticity of HA polymer (1500 kDa) and HA nanoparticle (1500
kDa) mixtures: viscous modulus over frequency range. Increasing nanoparticle
concentration decreased viscous modulus.
0
10
20
30
40
50
60
70
0.1 1 10
G"(P
a)
Frequency (Hz)
HA 1.4% (w/v)-1500 kDa-(PO:NP-100:0)- 1500 kDa NP
HA 1.4% (w/v)-1500 kDa-(PO:NP-75:25)- 1500 kDa NP
HA 1.4% (w/v)-1500 kDa-(PO:NP-50:50)- 1500 kDa NP
HA 1.4% (w/v)-1500 kDa-(PO:NP-25:75)- 1500 kDa NP
HA 1.4% (w/v)-1500 kDa-(PO:NP-0:100)- 1500 kDa NP

122
Figure (4-14) Viscoelasticity of HA polymer (1500 kDa) and HA nanoparticle (1500
kDa) mixtures: complex modulus over frequency range. Increasing nanoparticle
concentration decreased complex modulus.
Polymer/nanoparticle mixtures made using 17 kDa HA nanoparticles showed a
higher elastic, viscous, and complex moduli when compared to the samples made from
1500 kDa HA nanoparticles at all polymer: nanoparticle ratios (Figures 4-15, 4-16, and 4-
17). Similar to viscosity measurements, these results also suggested that nanoparticles
made from 17 kDa HA might interact more with HA polymer chains in solution resulting
in greater viscoelasticity for the samples made from 17 kDa HA nanoparticles. The hairy
structure of nanoparticles made from 17 kDa HA might physically entangle with HA
polymer chains resulting in greater viscoelasticity values compared to 1500 kDa HA
nanoparticles. On the other hand, nanoparticles made from 1500 kDa HA may behave
more like a hard sphere or may even inhibit HA polymer-polymer interaction in solution.
0
20
40
60
80
100
120
140
160
180
0.1 1 10
G*
(Pa)
Frequency (Hz)
HA 1.4% (w/v)-1500 kDa-(PO:NP-100:0)- 1500 kDa NP
HA 1.4% (w/v)-1500 kDa-(PO:NP-75:25)- 1500 kDa NP
HA 1.4% (w/v)-1500 kDa-(PO:NP-50:50)- 1500 kDa NP
HA 1.4% (w/v)-1500 kDa-(PO:NP-25:75)- 1500 kDa NP
HA 1.4% (w/v)-1500 kDa-(PO:NP-0:100)- 1500 kDa NP

123
Formulations containing 1500 kDa HA nanoparticles had the viscoelasticity values closer
to the control samples at different polymer:nanoparticle ratios. Increasing the
concentration of nanoparticles decreased the difference between the viscoelasticity of the
formulations and controls.
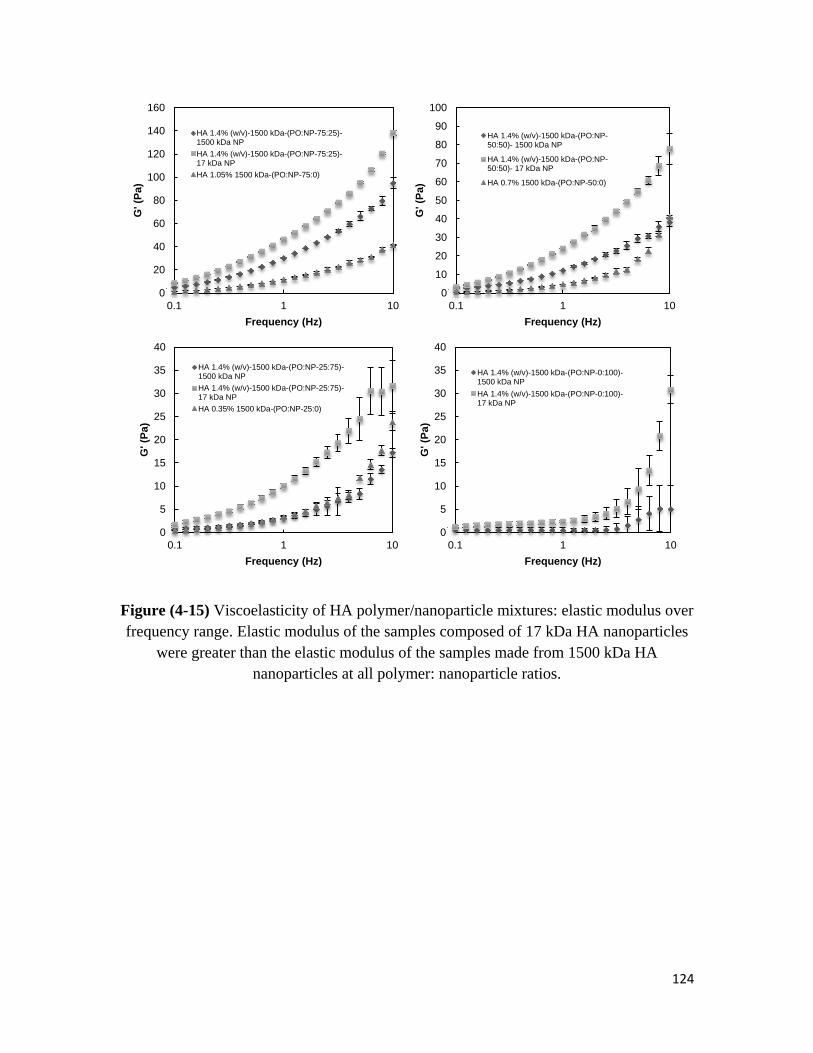
124
Figure (4-15) Viscoelasticity of HA polymer/nanoparticle mixtures: elastic modulus over
frequency range. Elastic modulus of the samples composed of 17 kDa HA nanoparticles
were greater than the elastic modulus of the samples made from 1500 kDa HA
nanoparticles at all polymer: nanoparticle ratios.
0
20
40
60
80
100
120
140
160
0.1 1 10
G' (P
a)
Frequency (Hz)
HA 1.4% (w/v)-1500 kDa-(PO:NP-75:25)-1500 kDa NP
HA 1.4% (w/v)-1500 kDa-(PO:NP-75:25)-17 kDa NP
HA 1.05% 1500 kDa-(PO:NP-75:0)
0
10
20
30
40
50
60
70
80
90
100
0.1 1 10
G' (P
a)
Frequency (Hz)
HA 1.4% (w/v)-1500 kDa-(PO:NP-50:50)- 1500 kDa NP
HA 1.4% (w/v)-1500 kDa-(PO:NP-50:50)- 17 kDa NP
HA 0.7% 1500 kDa-(PO:NP-50:0)
0
5
10
15
20
25
30
35
40
0.1 1 10
G' (P
a)
Frequency (Hz)
HA 1.4% (w/v)-1500 kDa-(PO:NP-25:75)-1500 kDa NP
HA 1.4% (w/v)-1500 kDa-(PO:NP-25:75)-17 kDa NP
HA 0.35% 1500 kDa-(PO:NP-25:0)
0
5
10
15
20
25
30
35
40
0.1 1 10
G' (P
a)
Frequency (Hz)
HA 1.4% (w/v)-1500 kDa-(PO:NP-0:100)-1500 kDa NP
HA 1.4% (w/v)-1500 kDa-(PO:NP-0:100)-17 kDa NP
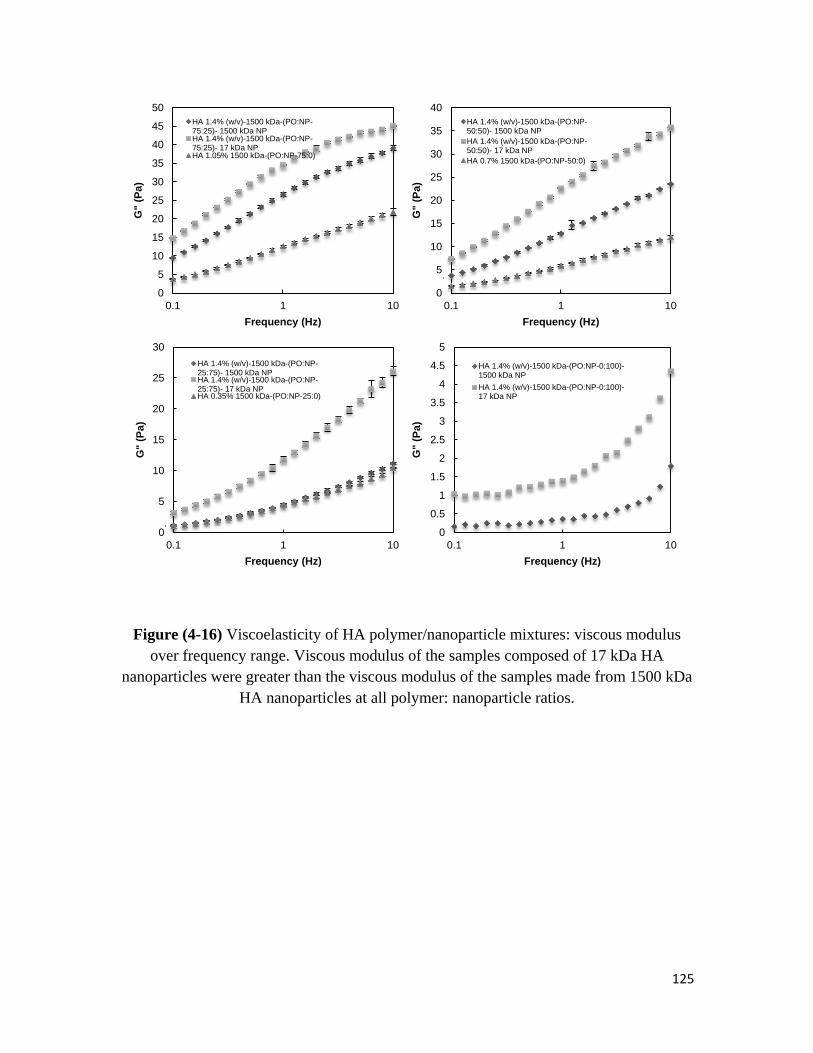
125
Figure (4-16) Viscoelasticity of HA polymer/nanoparticle mixtures: viscous modulus
over frequency range. Viscous modulus of the samples composed of 17 kDa HA
nanoparticles were greater than the viscous modulus of the samples made from 1500 kDa
HA nanoparticles at all polymer: nanoparticle ratios.
0
5
10
15
20
25
30
35
40
45
50
0.1 1 10
G" (
Pa)
Frequency (Hz)
HA 1.4% (w/v)-1500 kDa-(PO:NP-75:25)- 1500 kDa NPHA 1.4% (w/v)-1500 kDa-(PO:NP-75:25)- 17 kDa NPHA 1.05% 1500 kDa-(PO:NP-75:0)
0
5
10
15
20
25
30
35
40
0.1 1 10
G" (
Pa)
Frequency (Hz)
HA 1.4% (w/v)-1500 kDa-(PO:NP-50:50)- 1500 kDa NP
HA 1.4% (w/v)-1500 kDa-(PO:NP-50:50)- 17 kDa NP
HA 0.7% 1500 kDa-(PO:NP-50:0)
0
5
10
15
20
25
30
0.1 1 10
G" (
Pa)
Frequency (Hz)
HA 1.4% (w/v)-1500 kDa-(PO:NP-25:75)- 1500 kDa NPHA 1.4% (w/v)-1500 kDa-(PO:NP-25:75)- 17 kDa NPHA 0.35% 1500 kDa-(PO:NP-25:0)
0
0.5
1
1.5
2
2.5
3
3.5
4
4.5
5
0.1 1 10
G" (
Pa)
Frequency (Hz)
HA 1.4% (w/v)-1500 kDa-(PO:NP-0:100)-1500 kDa NP
HA 1.4% (w/v)-1500 kDa-(PO:NP-0:100)-17 kDa NP

126
Figure (4-17) Viscoelasticity of HA polymer/nanoparticle mixtures: complex modulus
over frequency range. Complex modulus of the samples composed of 17 kDa HA
nanoparticles were greater than the complex modulus of the samples made from 1500
kDa HA nanoparticles at all polymer: nanoparticle ratios.
4.3.2.2. Using HA nanoparticle formulations at different concentrations
The effect of increasing nanoparticle (1500 kDa HA) concentration from 1.4%
w/v up to 15% w/v on the viscoelasticity of the nanoparticle suspensions was also
evaluated (Figures 4-18, 4-19, and 4-20). Increasing nanoparticle concentration increased
storage, loss, and complex moduli of the colloidal suspensions. Therefore, viscoelastic
0
20
40
60
80
100
120
140
160
0.1 1 10
G*
(Pa)
Frequency (Hz)
HA 1.4% (w/v)-1500 kDa-(PO:NP-75:25)- 1500 kDa NP
HA 1.4% (w/v)-1500 kDa-(PO:NP-75:25)- 17 kDa NP
HA 1.05% 1500 kDa-(PO:NP-75:0)
0
10
20
30
40
50
60
70
80
90
100
0.1 1 10
G*
(Pa)
Frequency (Hz)
HA 1.4% (w/v)-1500 kDa-(PO:NP-50:50)- 1500 kDa NP
HA 1.4% (w/v)-1500 kDa-(PO:NP-50:50)- 17 kDa NP
HA 0.7% 1500 kDa-(PO:NP-50:0)
0
5
10
15
20
25
30
35
40
45
50
0.1 1 10
G*
(Pa)
Frequency (Hz)
HA 1.4% (w/v)-1500 kDa-(PO:NP-25:75)- 1500 kDa NP
HA 1.4% (w/v)-1500 kDa-(PO:NP-25:75)- 17 kDa NP
HA 0.35% 1500 kDa-(PO:NP-25:0)
0
5
10
15
20
25
30
35
40
0.1 1 10
G*
(Pa)
Frequency (Hz)
HA 1.4% (w/v)-1500 kDa-(PO:NP-0:100)-1500 kDa NP
HA 1.4% (w/v)-1500 kDa-(PO:NP-0:100)-17 kDa NP
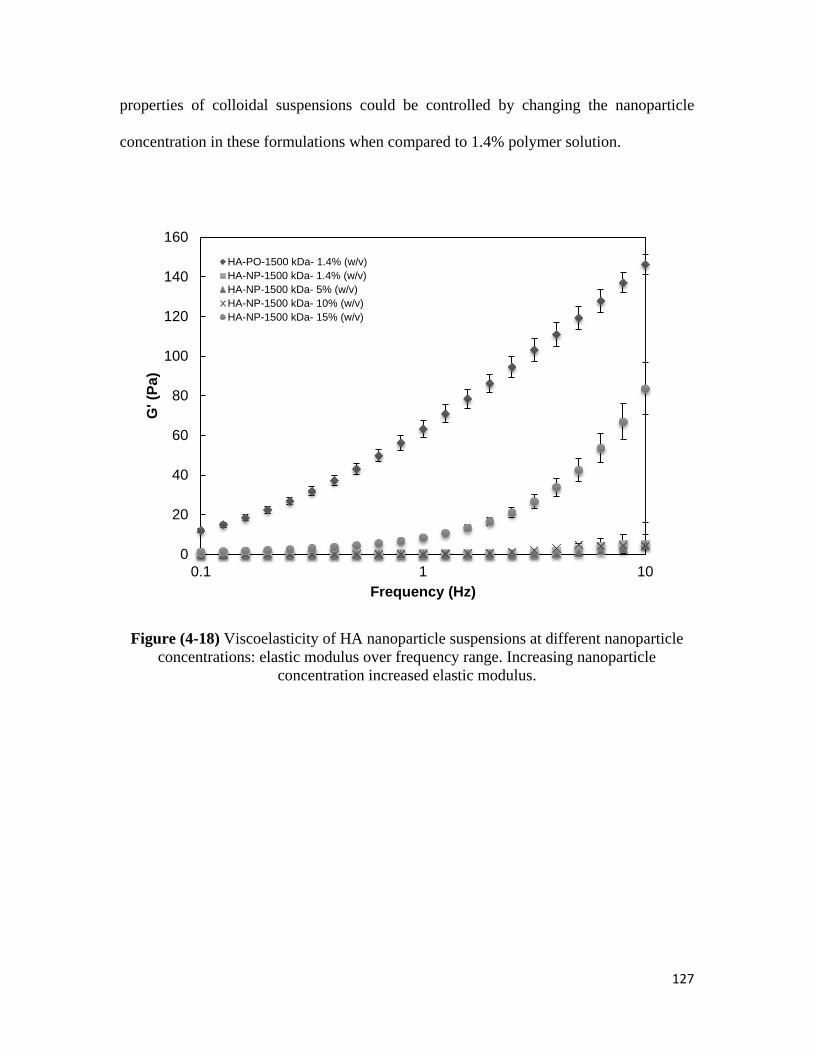
127
properties of colloidal suspensions could be controlled by changing the nanoparticle
concentration in these formulations when compared to 1.4% polymer solution.
Figure (4-18) Viscoelasticity of HA nanoparticle suspensions at different nanoparticle
concentrations: elastic modulus over frequency range. Increasing nanoparticle
concentration increased elastic modulus.
0
20
40
60
80
100
120
140
160
0.1 1 10
G' (P
a)
Frequency (Hz)
HA-PO-1500 kDa- 1.4% (w/v)
HA-NP-1500 kDa- 1.4% (w/v)
HA-NP-1500 kDa- 5% (w/v)
HA-NP-1500 kDa- 10% (w/v)
HA-NP-1500 kDa- 15% (w/v)

128
Figure (4-19) Viscoelasticity of HA nanoparticle suspensions at different nanoparticle
concentrations: viscous modulus over frequency range. Increasing nanoparticle
concentration increased viscous modulus.
0
20
40
60
80
100
120
140
160
0.1 1 10
G" (
Pa)
Frequency (Hz)
HA-PO-1500 kDa- 1.4% (w/v)
HA-NP-1500 kDa- 1.4% (w/v)
HA-NP-1500 kDa- 5% (w/v)
HA-NP-1500 kDa- 10% (w/v)
HA-NP-1500 kDa- 15% (w/v)
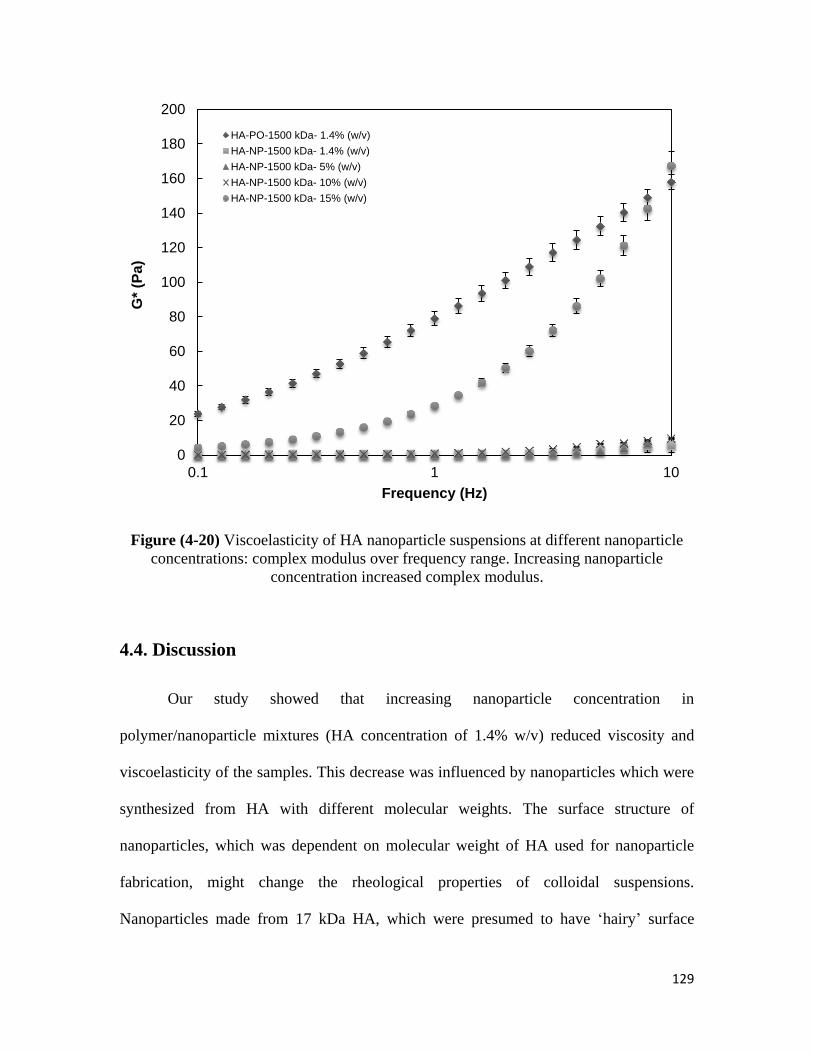
129
Figure (4-20) Viscoelasticity of HA nanoparticle suspensions at different nanoparticle
concentrations: complex modulus over frequency range. Increasing nanoparticle
concentration increased complex modulus.
4.4. Discussion
Our study showed that increasing nanoparticle concentration in
polymer/nanoparticle mixtures (HA concentration of 1.4% w/v) reduced viscosity and
viscoelasticity of the samples. This decrease was influenced by nanoparticles which were
synthesized from HA with different molecular weights. The surface structure of
nanoparticles, which was dependent on molecular weight of HA used for nanoparticle
fabrication, might change the rheological properties of colloidal suspensions.
Nanoparticles made from 17 kDa HA, which were presumed to have ‘hairy’ surface
0
20
40
60
80
100
120
140
160
180
200
0.1 1 10
G*
(Pa)
Frequency (Hz)
HA-PO-1500 kDa- 1.4% (w/v)
HA-NP-1500 kDa- 1.4% (w/v)
HA-NP-1500 kDa- 5% (w/v)
HA-NP-1500 kDa- 10% (w/v)
HA-NP-1500 kDa- 15% (w/v)

130
structure, seemed to have more polymer-nanoparticle interaction and physical
entanglement in polymer/nanoparticle mixtures compared to nanoparticles made from
1500 kDa HA. These interactions might be the reason for greater viscosity and
viscoelasticity in the mixtures made from 17 kDa HA nanoparticles compared to the
mixtures made from 1500 kDa HA nanoparticles at similar polymer/nanoparticle ratios.
Rheological studies also showed that even 1500 kDa HA nanoparticles interacted with
HA polymer influencing viscosity and viscoelasticity. This interaction depended on the
polymer/nanoparticle ratio. At higher polymer concentrations, more physical interactions
between nanoparticles (17 kDa or 1500 kDa) must have yielded a greater effect on
rheological properties of samples. By increasing nanoparticle concentration in the
formulations with 1500 kDa nanoparticles, the viscosity and viscoelasticity approached
the viscosity and the viscoelasticity of control samples containing only polymer.
Therefore, the rheological properties of the viscosupplements can be controlled via the
type and the concentration of nanoparticles mixed into the formulation.
Application of nanoparticles to enhance rheological properties of fluids and to
form formation of nanocomposites has been reported (11-13). One study suggested that
the presence of a small amount of nanoparticles with large aspect ratio improved the
fluidity of polymeric solutions under low shear rate. On the other hand, addition of a
large amount of nanoparticles reduced the aspect ratio by aggregation and constrained
polymer segment motion in solutions (11). Other studies also reported the application of
inorganic nanoparticles such as clay nanoparticles in ophthalmic and otic pharmaceutical
formulations to modify the rheological properties of the compositions to enhance the
viscosity, flow characteristics, or lubricity of the products. The studies showed that

131
nanoparticles could enhance shear thinning behavior and fluidity (13, 14). These reports
and others confirmed that nanoparticles can modify the rheological properties of
solutions but the effect of surface structure of nanoparticles to control rheological
properties of solutions has not been clearly reported. Here, the rheological properties of
viscosupplements could be controlled via nanoparticles. Different types of nanoparticles
(17 kDa or 1500 kDa HA) at different concentrations can be added to the
viscosupplements to control the viscosity and viscoelasticity.
Moreover, increasing HA nanoparticle (1500 kDa) concentration increased
viscosity and viscoelasticity properties (elastic and viscous moduli) of HA polymer
solutions. Even at relatively high (15% w/v) nanoparticle concentration, the viscosity of
the samples was lower than the control sample simulating Orthovisc®
(1.4% w/v HA
solution). At higher nanoparticle concentrations (30% and 45% w/v), formation of paste-
like material was observed. Rheological measurement at these nanoparticle
concentrations was difficult due to the high viscosity of these samples. Finally,
nanoparticle formation not only reduced the viscosity of HA suspensions but also could
be used to increase the total concentration of HA in the formulation. As a result, colloidal
suspensions can be used to increase the HA concentration with a small increase in the
viscosity of HA viscosupplements.
Particle fabrication is one of the techniques used to reduce the viscosity of a
solution. Currently, crystallization, phase separation, and complexation have also been
reported to enhance the viscosity and increase injectability of protein solutions,
specifically monoclonal antibodies at high doses (15-19). Such particle fabrication
approaches packed the proteins, reduced the concentration of free protein in solution, and

132
prevented interactions which typically caused an increase in viscosity. With nanoparticle
fabrication, the viscosity of HA viscosupplements can be reduced and the injectability
enhanced in addition to increasing the concentration of HA in formulation.
4.5. Conclusion
In conclusion, the ability of hyaluronic acid nanoparticles to modify the viscosity
and viscoelasticity of a simulated viscosupplement was evaluated. Increasing
nanoparticle concentration in polymer/nanoparticle mixtures (overall HA concentration
of 1.4% w/v) reduced viscosity and viscoelasticity of the samples. The type of
nanoparticles (17 kDa or 1500 kDa) influenced the nanoparticle-polymer interactions and
controlled the rheological properties of the suspensions. In addition, the viscosity of
suspensions that included 1500 kDa HA nanoparticles was lower when compared to
simulated viscosupplement. The viscosity of suspensions containing 15% w/v of
nanoparticles was also lower than the viscosity of simulated viscosupplement (1.4 w/v
HA). Therefore, nanoparticle formations not only reduced the viscosity of HA
suspensions but facilitated an increase in the HA concentration with minimal increase in
the viscosity of viscosupplements in an effort to enhance injectability.
133
4.6. References
1. Barbucci R, Lamponi S, Borzacchiello A, Ambrosio L, Fini M, Torricelli P, et al., Hyaluronic acid hydrogel in the treatment of osteoarthritis, Biomaterials, 2002;23(23):4503-13. 2. Conrad BP., The effects of glucosamine and chondroitin on the viscosity of synovial fluid in patients with osteoarthritis, 2001, University of Florida, 2001. 3. Singh G, Miller JD, Lee FH, Pettitt D, Russell MW., Prevalence of cardiovascular disease risk factors among US adults with self-reported osteoarthritis: data from the Third National Health and Nutrition Examination Survey. population.7:17. 4. Yaszemski MJ., Tissue engineering and novel delivery systems, 2003, CRC Press. 5. Watterson JR, Esdaile JM., Viscosupplementation: therapeutic mechanisms and clinical potential in osteoarthritis of the knee, Journal of the American Academy of Orthopaedic Surgeons, 2000;8(5):277. 6. Altman R, Moskowitz R., Intraarticular sodium hyaluronate (Hyalgan) in the treatment of patients with osteoarthritis of the knee: a randomized clinical trial. Hyalgan Study Group, The Journal of rheumatology, 1998;25(11):2203. 7. Maheu E, Ayral X, Dougados M., A hyaluronan preparation (500-730 kDa) in the treatment of osteoarthritis: a review of clinical trials with Hyalgan, International journal of clinical practice, 2002;56(10):804. 8. Ghosh K, Shu XZ, Mou R, Lombardi J, Prestwich GD, Rafailovich MH, et al., Rheological characterization of in situ cross-linkable hyaluronan hydrogels, Biomacromolecules, 2005;6(5):2857-65. 9. Fam H, Kontopoulou M, Bryant J., Effect of concentration and molecular weight on the rheology of hyaluronic acid/bovine calf serum solutions, Biorheology, 2009;46(1):31-43. 10. Zhao X., Synthesis and characterization of a novel hyaluronic acid hydrogel, Journal of Biomaterials Science, Polymer Edition, 2006;17(4):419-33. 11. Yin H, Mo D, Chen D., Orientation behavior of attapulgite nanoparticles in poly (acrylonitrile)/attapulgite solutions by rheological analysis, Journal of Polymer Science Part B: Polymer Physics, 2009;47(10):945-54. 12. Shchipunov Y, Ivanova N, Silant'ev V., Bionanocomposites formed by in situ charged chitosan with clay, Green Chem, 2009;11(11):1758-61. 13. Ketelson HA, Meadows DL., Use of synthetic inorganic nanoparticles as carriers for ophthalmic and otic drugs. 2002, US Patent App. 20,050/003,014. 14. Ketelson HA, Meadows DL., Inorganic nanopartices to modify the viscosity and physical properties of ophthalmic and otic compositions, 2002, Google Patents. 15. Yang MX, Shenoy B, Disttler M, Patel R, McGrath M, Pechenov S, et al., Crystalline monoclonal antibodies for subcutaneous delivery, Proceedings of the National Academy of Sciences of the United States of America, 2003;100(12):6934. 16. Shire SJ, Shahrokh Z, Liu J., Challenges in the development of high protein concentration formulations, Journal of pharmaceutical sciences, 2004;93(6):1390-402. 17. Salinas BA, Sathish HA, Bishop SM, Harn N, Carpenter JF, Randolph TW., Understanding and modulating opalescence and viscosity in a monoclonal antibody formulation, Journal of pharmaceutical sciences, 2010;99(1):82-93. 18. Nishi H, Miyajima M, Nakagami H, Noda M, Uchiyama S, Fukui K., Phase Separation of an IgG1 Antibody Solution under a Low Ionic Strength Condition, Pharmaceutical research, 2010;27(7):1348-60. 19. Cooper C, Dubin P, Kayitmazer A, Turksen S., Polyelectrolyte-protein complexes, Current Opinion in Colloid & Interface Science, 2005;10(1-2):52-78.

134
Chapter 5
Conclusion and future directions

135
Chapter 5: Conclusion and future direction
Hyaluronic acid (HA) is one of the major naturally occurring components of body
tissues. Many applications of HA have emerged in medicine including tissue engineering,
dermatological fillers, and viscosupplementation for osteoarthritis treatment. The
cytotoxicity of crosslinking techniques for scaffold fabrication and the high viscosity of
viscosupplements have been issues impeding the development of products from HA.
Thus, novel HA biomaterials for tissue engineering and improved properties of
viscosupplements are in demand. Nanotechnology can be a useful tool to achieve these
needs.
The aim of this study was to synthesize HA nanoparticles and use the fabricated
nanoparticles to develop colloidal systems for these proposed biomedical applications.
First, nanoparticles were successfully synthesized using a technique free of an oil and
surfactant. This technique was also used to synthesize nanoparticles from other
biomaterials such as chondroitin sulfate (CS). The size and charge of nanoparticles
polymer type (HA or CS) depended on polymer concentration, HA molecular weight,
reaction time, and the ratio of polymer to crosslinker. These factors may be optimized to
reach a desired nanoparticle size and charge.
In the future, this nanoparticle fabrication technique should be tested to make
nanoparticles from other polymers. This technique may be suitable to fabricate positively
charged nanoparticles from polycations such as chitosan and poly-L-lysine. To synthesize
nanoparticles, polycations primary amine groups can be crosslinked using a molecule
such as an adipic acid crosslinker activated via carbodiimide reagents. Such nanoparticles
136
can be used to develop colloidal gels via electrostatic interactions with negatively
charged nanoparticles.
HA and CS nanoparticles were also used to develop colloidal systems. The
concentration of nanoparticles, type of nanoparticles and molecular weight of HA used
for nanoparticle fabrication, effected the bulk properties of colloidal gels or colloidal
suspensions. Colloidal gels are stable 3-D networks made from nanoparticles; in contrast,
colloidal suspensions easily flow by applying shear force. Colloidal gels were formed by
mixing 17 kDa HA nanoparticles in deionized water at 15%, 30%, and 45% w/v
nanoparticle concentrations. On the other hand, mixing 17 kDa HA nanoparticles at 5%
w/v concentration or 1500 kDa HA nanoparticles at concentrations up to 15% w/v
concentration led to colloidal suspensions. Moreover, 1500 kDa nanoparticles at 30% and
45% w/v yielded of paste-like materials. CS nanoparticles could only formed colloidal
suspensions, even at high nanoparticle concentrations (60% w/v).
The formation of colloidal gels resulted from the physical entanglement of surface
chains between nanoparticles. Using 17 kDa HA seemed to yield dangling chains or
‘hairy’ nanoparticles. As a result, 17 kDa HA nanoparticles formed stable colloidal gel
networks in deionized water at 15%, 30%, and 45% w/v. Colloidal gels swelled in an
excess of deionized water or 0.1 M PBS, but did not dissociate. On the other hand,
colloidal gels did not form when using 1500 kDa nanoparticles probably due to the
absence of dangling chains on these nanoparticles.
Nanoparticle concentration influenced Young’s modulus, shear modulus,
viscoelasticity and viscosity of colloidal gels. Mechanical testing also suggested that the
pH and ionic strength of buffer used for colloidal gel fabrication affected Young’s

137
modulus and shear modulus of colloidal gels at different nanoparticle concentrations.
However colloidal gels were elastomeric materials, they did not behave as an ideal neo-
Hookean elastomer. Recoverably experiments showed that the samples could recover
their initial shape after removing external force. Recovery was observed in both
mechanical and rheological experiments performed to evaluate shape recoverability and
viscosity recoverability. Finally, colloidal gels could be reformed after destruction.
This novel colloidal gel should be tested for tissue engineering applications in the
future. HA colloidal gels self-assemble to form a stable 3-D biomaterial without any
chemical reaction. Testing these colloidal systems in the presence of live cells will help
to understand the potency of these biomaterials for scaffold fabrication. Different types of
cells including chondrocytes and fibroblasts should be used. Mechanical and rheological
characterizations in the presence of cells will also define the effect of biological
environment on the properties of colloidal gels. Moreover, in vivo studies will identify
the performance of these novel biomaterials as a means to generate specific tissues such
as cartilage and skin in the body. Injectability of colloidal gels as a function of
nanoparticle concentration, pH and ionic strength should be investigated in future to
enhance the viscosity of the colloidal gels for injection and develop injectable scaffolds.
Rheological characterization of colloidal suspensions showed that the viscosity
and viscoelasticity could be controlled. Generally, the viscosity and viscoelasticity of HA
formulations could be reduced by including nanoparticles in place of polymer HA. The
polymer: nanoparticle ratio and type of nanoparticles (17 kDa HA or 1500 kDa HA
nanoparticles) were used to control the viscosity and viscoelasticity of HA formulations
by influencing nanoparticle-polymer interactions. Moreover, higher concentration of HA

138
could be delivered with lower viscosity when using nanoparticles in place of HA
polymer, which makes colloidal suspensions more convenient for injection.
The application of colloidal suspensions to enhance the properties of
viscosupplements including dermal fillers and intra-synovial viscosupplements should be
explored. Polymer solutions at 1.4% w/v of 1500 kDa HA were used as a model
viscosupplement to evaluate the effect of nanoparticles on the viscosity and
viscoelasticity of HA formulations. In vivo studies will help us define performance of
modified viscosupplements containing HA nanoparticles to remove skin wrinkles and
increase treatment duration upon administration subcutaneously. Moreover, intra-
synovial injection of modified viscosupplements containing HA nanoparticles will
identify their ability to reduce pain and increase joint function for osteoarthritis treatment.

139
Appendix
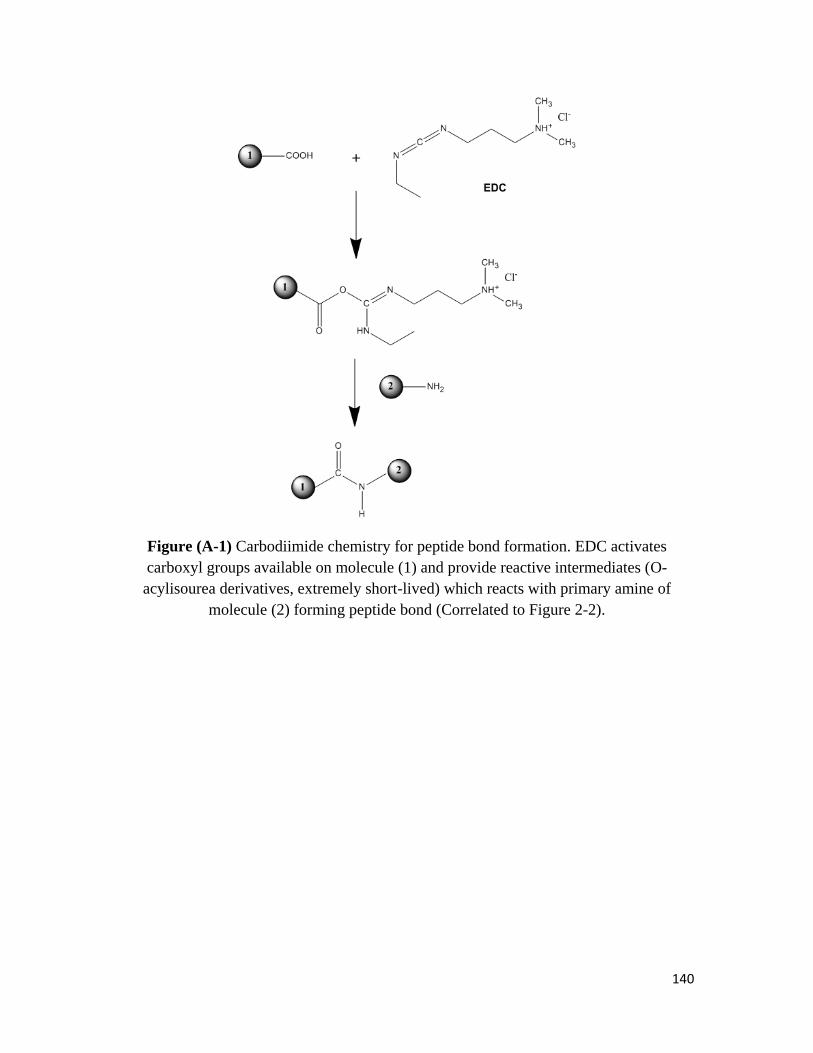
140
Figure (A-1) Carbodiimide chemistry for peptide bond formation. EDC activates
carboxyl groups available on molecule (1) and provide reactive intermediates (O-
acylisourea derivatives, extremely short-lived) which reacts with primary amine of
molecule (2) forming peptide bond (Correlated to Figure 2-2).

141
Figure (A-2) (A and B) Stress-strain function curves for 30% (w/v) colloidal gel samples
after fabrication (Correlated to Figure 3-8).
0
20
40
60
80
100
120
140
160
180
0 2 4 6 8 10 12
Str
ess (
kP
a)
Strain Function
HA-NP-1
HA-NP-2
HA-NP-3
y = 4.2071x R² = 0.9836
y = 3.5565x R² = 0.9828
y = 4.0703x R² = 0.9843
0
1
2
3
4
5
6
7
0 1 2
Str
ess (
kP
a)
Strain Function
HA-NP-1
HA-NP-2
HA-NP-3
Linear (HA-NP-1)
Linear (HA-NP-2)
Linear (HA-NP-3)
(A)
(B)

142
Figure (A-3) Viscoelasticity of HA polymer (1500 kDa) and HA nanoparticle (17 kDa)
mixtures: tan delta over frequency range (Correlated to Figures 4-9, 4-10, and 4-11).
0
0.5
1
1.5
2
2.5
3
0.1 1 10
tan
delt
a
Frequency (Hz)
HA 1.4% (w/v)-1500 kDa-(PO:NP-100:0)- 17 kDa NP
HA 1.4% (w/v)-1500 kDa-(PO:NP-75:25)- 17 kDa NP
HA 1.4% (w/v)-1500 kDa-(PO:NP-50:50)- 17 kDa NP
HA 1.4% (w/v)-1500 kDa-(PO:NP-25:75)- 17 kDa NP
HA 1.4% (w/v)-1500 kDa-(PO:NP-0:100)- 17 kDa NP

143
Figure (A-4) Viscoelasticity of HA polymer (1500 kDa) and HA nanoparticle (1500
kDa) mixtures: tan delta over frequency range (correlated to Figures 4-12, 4-13, and 4-
14).
0
0.5
1
1.5
2
2.5
3
0.1 1 10
tan
delt
a
Frequency (Hz)
HA 1.4% (w/v)-1500 kDa-(PO:NP-100:0)- 1500 kDa NP
HA 1.4% (w/v)-1500 kDa-(PO:NP-75:25)- 1500 kDa NP
HA 1.4% (w/v)-1500 kDa-(PO:NP-50:50)- 1500 kDa NP
HA 1.4% (w/v)-1500 kDa-(PO:NP-25:75)- 1500 kDa NP
HA 1.4% (w/v)-1500 kDa-(PO:NP-0:100)- 1500 kDa NP
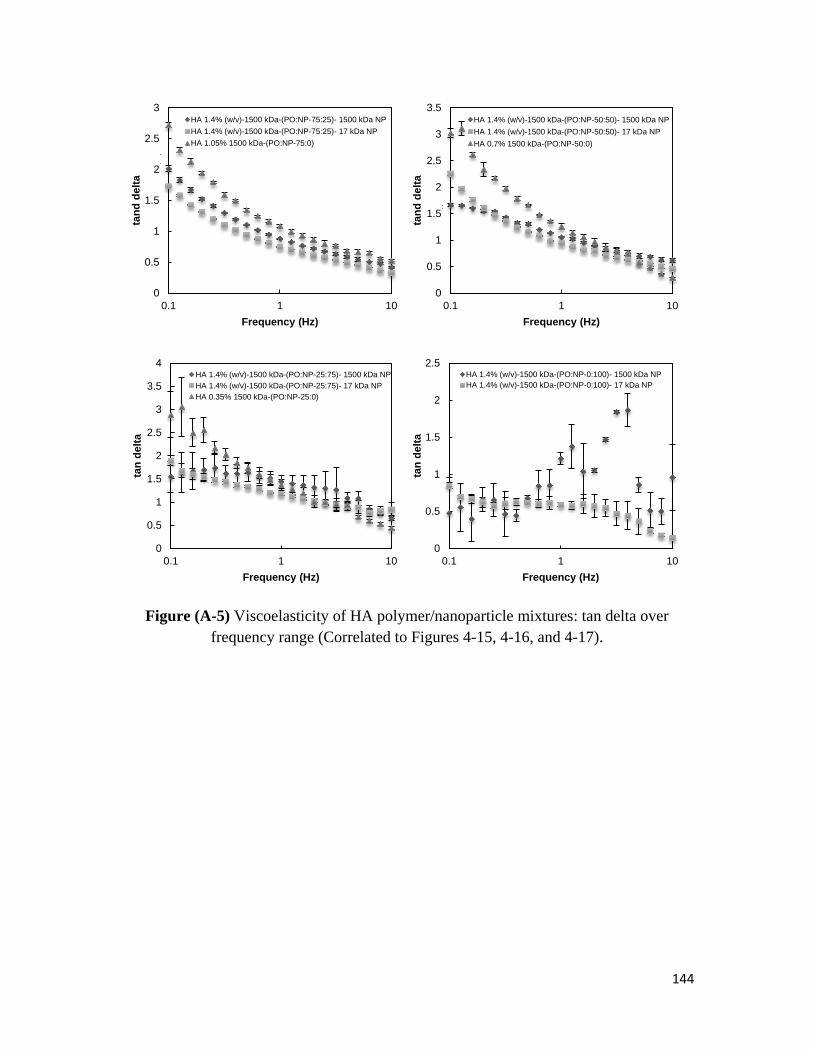
144
Figure (A-5) Viscoelasticity of HA polymer/nanoparticle mixtures: tan delta over
frequency range (Correlated to Figures 4-15, 4-16, and 4-17).
0
0.5
1
1.5
2
2.5
3
0.1 1 10
tan
d d
elt
a
Frequency (Hz)
HA 1.4% (w/v)-1500 kDa-(PO:NP-75:25)- 1500 kDa NP
HA 1.4% (w/v)-1500 kDa-(PO:NP-75:25)- 17 kDa NP
HA 1.05% 1500 kDa-(PO:NP-75:0)
0
0.5
1
1.5
2
2.5
3
3.5
0.1 1 10
tan
d d
elt
a
Frequency (Hz)
HA 1.4% (w/v)-1500 kDa-(PO:NP-50:50)- 1500 kDa NP
HA 1.4% (w/v)-1500 kDa-(PO:NP-50:50)- 17 kDa NP
HA 0.7% 1500 kDa-(PO:NP-50:0)
0
0.5
1
1.5
2
2.5
3
3.5
4
0.1 1 10
tan
delt
a
Frequency (Hz)
HA 1.4% (w/v)-1500 kDa-(PO:NP-25:75)- 1500 kDa NP
HA 1.4% (w/v)-1500 kDa-(PO:NP-25:75)- 17 kDa NP
HA 0.35% 1500 kDa-(PO:NP-25:0)
0
0.5
1
1.5
2
2.5
0.1 1 10
tan
delt
a
Frequency (Hz)
HA 1.4% (w/v)-1500 kDa-(PO:NP-0:100)- 1500 kDa NP
HA 1.4% (w/v)-1500 kDa-(PO:NP-0:100)- 17 kDa NP