Biomass to Liquid Process: new kind of cobalt and iron ...
221
UNIVERSITÀ DEGLI STUDI DI MILANO Scuola di Dottorato in Scienze e Tecnologie Chimiche Dipartimento di Chimica XXVI Ciclo Dottorato in Chimica Industriale Biomass to Liquid Process: new kind of cobalt and iron based catalysts for the Fischer-Tropsch Synthesis (Settori Scientifico Disciplinari: ING-IND/25; CHIM/04) Antonieta Di Fronzo (Matricola R09037) Tutor: Prof. Claudia L. Bianchi Co-Tutor: Prof. Carlo Pirola Coordinatore del Dottorato: Prof. Dominique Roberto A.A. 2012/2013
Transcript of Biomass to Liquid Process: new kind of cobalt and iron ...
UNIVERSITAgrave DEGLI STUDI DI MILANO
Scuola di Dottorato in Scienze e Tecnologie Chimiche Dipartimento di Chimica
XXVI Ciclo Dottorato in Chimica Industriale
Biomass to Liquid Process new kind of cobalt and iron based catalysts for the
Fischer-Tropsch Synthesis
(Settori Scientifico Disciplinari ING-IND25 CHIM04)
Antonieta Di Fronzo (Matricola R09037)
Tutor Prof Claudia L Bianchi Co-Tutor Prof Carlo Pirola Coordinatore del Dottorato Prof Dominique Roberto
AA 20122013
2
3
TABLE OF CONTENTS
General abstract 5
Chapter 1 General Introduction 27
Chapter 2 Chemistry of Fischer-Tropsch Synthesis 57
21 FT Thermodynamics 58
22 FT Reaction Mechanism 59
23 FT Products Selectivity 65
24 FT kinetics 68
25 Influence of FT process conditions 71
Chapter 3 Catalysts for Fischer Tropsch Synthesis 76
31 Iron and Cobalt industrial FT catalysts 80
i) Iron catalysts 80
ii) Cobalt catalysts 81
32 Chemical State of active phase 82
33 Size of active phase 83
Chapter 4 Experimental FT plant and analytical methods 86
41 FT Laboratory plant 88
a) First FTS unit (Unit 1) 88
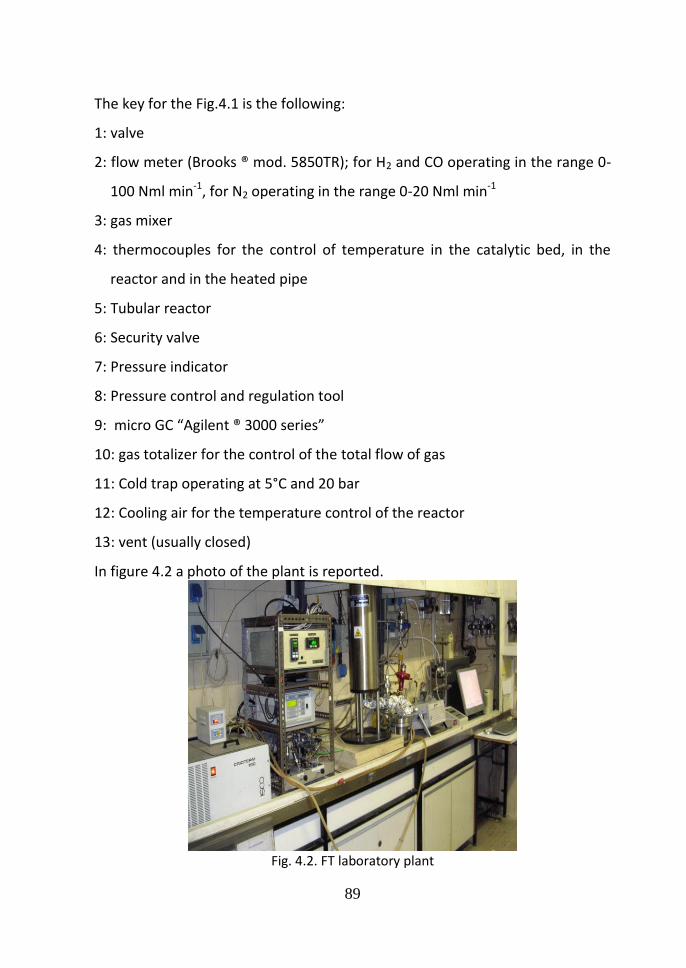
41a Main parts of the plant 90
42a Analytical instruments 94
43a Analytical instruments calibration 98
44a Experimental procedure 109
b) Second FTS unit (Unit 2) 114
41b Main parts of the plant 116
42b Analytical instruments 119
43b Experimental procedure 121
42 Experimental data elaboration 124
a)First FTS unit (Unit 1) 124
425 Hydrogen 137
427 Oxygen Balance 139
b)Seconf FTS unit (Unit 2) 140
43 Novelties on the FT plant made in this PhD work 142
Chapter 5 Catalysts preparation and characterization 143
51 Catalysts preparation 146
511 Catalyst preparation procedure 146
52 Catalysts characterization 155
521 Catalysis characterization introduction and theory 155
4
5211 BET analysis 157
522 Catalysts characterization results 174
Chapter 6 High Fe Loaded Supported Catalysts for Biosyngas Fischer ndash Tropsch Conversion experimental and simulation results 197
6 Development of the kinetic model 197
61 Regression of kinetic constants 197
62 Mass Balance 199
63 Energy Balance 200
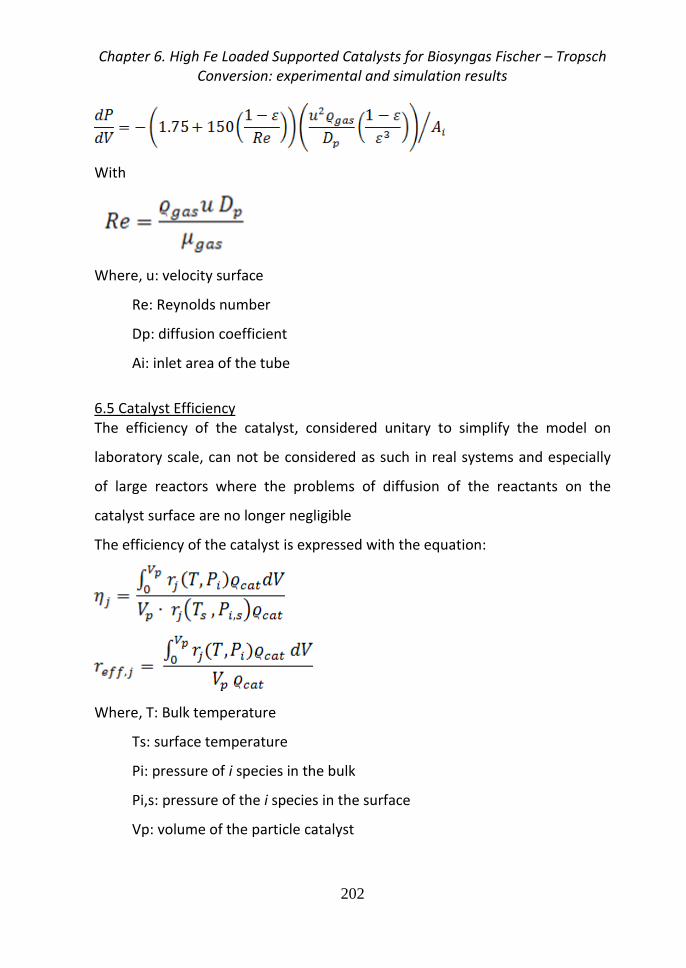
64 Pressure variation 201
65 Catalyst Efficiency 202
Chapter 7 Fischer Tropsch runs results and discussion 204
Chapter 8 Final remarks and Conclusions 216
List of publications 219
Publications in Conference Proceedings (peer reviewed) 219
Communications at congress 220
General abstract
1 Introduction
Nowadays it is imperative to develop economical and energy-efficient
processes for the sustainable production of fuels and chemicals alternative to
the ones deriving from petroleum Climate change and air quality are major
environmental concerns because they directly affect the way we live and
breath In order to meet the present and future threats generated by emissions
to the atmosphere environmental agencies around the world have issued
more stringent regulations One of them is the control of residual sulfur in
diesel fuel and emission standards for particulates from diesel vehicles All
these facts have recently aroused renewed interest in the FischerndashTropsch
Synthesis because it can produce super clean diesel oil fraction with high
cetane number (typically above 70) without any sulfur and aromatic
compounds using syngas (mixture of H2 CO CO2) from natural gas CH4 coal
or as a new tendency from biomass [1 2] The essential target of FTS is to
produce paraffins and olefins with different molecular weight and to limit the
maximum formation of methane and CO2 [3]
The main reactions involved in FTS are reported in the following scheme [4-8]
Irreversible reactions
1) n CO + 2n H2 rarr CnH2n + n H2O for olefins
2) n CO + (1+2n) H2 rarr CnH(2n+2) + n H2O for paraffins
3) 2n CO + n H2 rarr CnH2n + n CO2 for olefins
4) n CO + 2n H2 rarr CnH(2n+1)OH + (n-1) H2O for alcohols
Equilibrium
5) CO + H2O harr CO2 + H2 Water-gas-shift reaction (WGS)
General Abstract
6
6) CO + H2 harr C + H2O Carbon deposition
7) 2 CO harr C + CO2 Boudouard equilibrium
The whole reaction gives an energetic contribution strongly exothermic (about
150 kJmol CO reacted) FTS is a particularly complex system in which a
number of different reactions are combined to a unique mechanism
irreversible Fischer Tropsch (FT) reactions produce hydrocarbons and some
equilibrium reactions between CO CO2 CH4 and C such as the WGS reaction
and the Boudouard equilibrium are present too Nevertheless it is possible to
suppose that FTS can be simplified as a combination of the FT reactions and the
WGS reaction [7] According this hypothesis hydrocarbons are primary
products of FT reaction and CO2 can only be produced by WGS reaction a
reversible parallel-consecutive reaction with respect to CO [9]
FTS usually requires catalysts based on cobalt or iron Co-based catalysts have
been more largely used due to their high selectivity to heavy hydrocarbons and
low activity in the water-gas shift reaction so limiting the CO2 formation
Moreover Co-based catalysts have shown longer life-time and higher CO
conversion compared to the Fe-based ones [10] Iron based catalysts are
recently highly investigated for FTS Compared to cobalt systems iron-based
catalysts are cheaper but less resistant to deactivation due to the oxidizing
effect of water despite activating Water Gas Shift reaction (CO + H2O harr CO2 +
H2) well [5 9] Moreover they are flexible to changes in temperature pressure
and they can work at different H2CO feed ratios (for iron based catalysts this
ratio can be between 05 and 25) [11 12]
2 Aims of the work
Considering very recent research results [13-15] the aim of the PhDrsquos research
was addressed toward the development of three particular kind of catalysts
General Abstract
7
The first group of catalysts tested were the Co-based hydrotalcites (HTlc) with
different amount of Co in two different pilot plants HTlc-based materials have
been recently reported as good catalysts for several processes in the energy
field [16] [17] and [18] Up to now the only study reported in literature on the
use of synthetic HTlc as FTS catalysts concerns their use as inert supports for
the catalytically active metal According to this study hydrotalcite-supported
catalysts result in higher activity than CoAl2O3 even in absence of reduction
promoters [19]
The second group of catalysts tested were the Co-based catalysts and
bimetallic Co-Ru based catalyst synthesized with the help of ultrasound
because the ultrasound are presented in literature as an innovative way to
synthesize new kind of materials
Finally were synthesized and tested samples of Fe-based catalysts supported
on silica with different methods of synthesis (traditional impregnation method
with the help of ultrasound or microwave) and changing the H2CO ratio with
the aim to evaluate the performance of biomass Almost the development of a
kinetic model (modeling parameter regression and simulation) in collaboration
with the Politecnico di Milano
3 Experimental Details
a Preparation of catalysts
i) Cobalt based catalysts ndash Hydrotalcites a series of ternary hydrotalcites with
general formula [CoxZn(1-x-y)Aly(OH)2](NO3)y∙05H2O by a modified-urea method
[20] Different volumes of the solutions of the metals nitrates all at a
concentration of 05 M were mixed to obtain either a Al(Co+Al) or
Al(Co+Al+Zn) molar ratio of 03 as indicated in Table 1
General Abstract
8
Solid urea was added to the solution in a molar ratio of 4 vs Al The obtained
solution was maintained at the reflux temperature in an open flask for 48 hours
The precipitate was separated by centrifugation washed with water and then
dried at 80degC
Table 1 Details of the synthesis composition and specific surface area (SA) of samples
general formula [CoxZn(1-x-y)Aly(OH)2](NO3)y∙05H2O M sol = molar percentage of
metals in the precipitation solution
Sample wt Co M sol
x
y
SSA (m2g-1)
Zn Co Al
Co5 51 55 15 30 010 033 175
Co10 108 45 25 30 021 034 115
Co15 166 35 35 30 032 029 72
Co35 353 - 70 30 067 033 58
ii) Cobalt based catalysts and bimetallic Co-Ru based catalysts synthesized
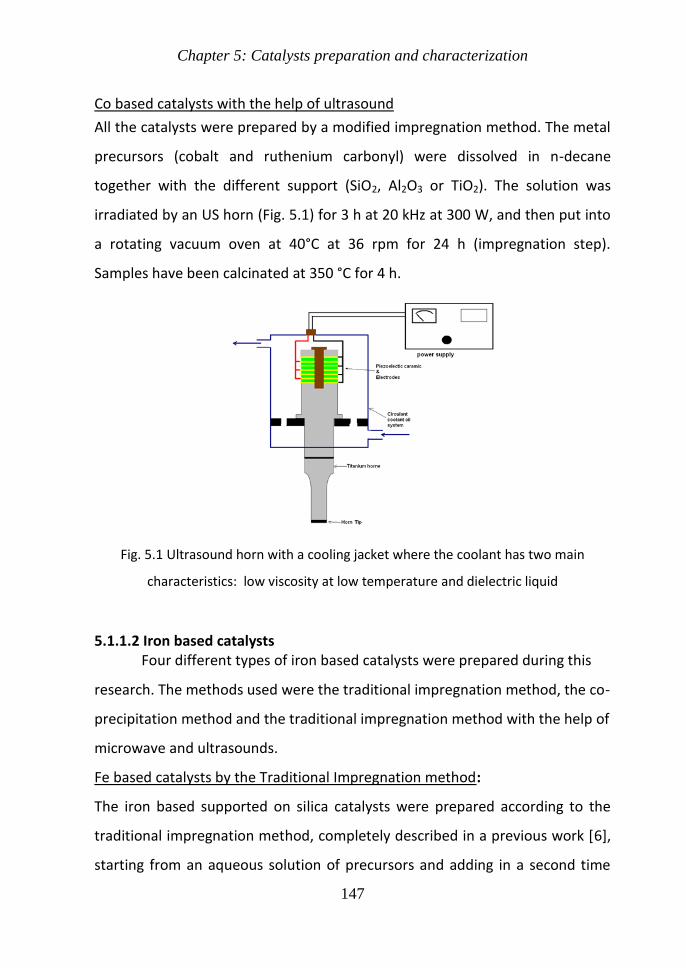
with the help of ultrasound All the catalysts were prepared by a modified
impregnation method The metal precursors (cobalt and ruthenium
carbonyl) were dissolved in n-decane together with the different support
(SiO2 Al2O3 or TiO2) The solution was irradiated by an ultrasound generator
with a horn type of 750 W a frequency of 20 kHz a diameter tip of 13 mm
and an amplitude of 40-50 for 3 h and then put into a rotating vacuum
oven at 40degC at 36 rpm for 24 h (impregnation step) Samples have been
calcinated at 350 degC for 4 h The ultrasound horn used have a cooling jacket
where the coolant has a low viscosity at low temperature and is a dielectric
liquid [21]
General Abstract
9
iii) Iron catalysts there were prepared the iron based catalysts using different
method of synthesis traditional impregnation (TR) impregnation with the help
of the microwave (MW) impregnation with the help of ultrasound (US) and co-
precipitation method MW and US techniques seem to be promising that offer
many advantages in the catalyst preparation as reported in [22-23] and their
effect was also evaluated
There were prepared according to the traditional impregnation method by
incipient wetness (TR) with 30wt of iron supported on a commercial high
surface area SiO2 (Fluka BET surface area 520 m2g-1 pore volume 122 ml g-1
and pore diameter 87 nm) The catalysts are promoted by K (20wt ) and Cu
(375wt ) The percentages are regarding a previous research [13] where
those compositions result as the most suitable catalyst In this work all the
percentages concerning the catalysts composition are on weight basis while
the percentages about the process conversion and selectivity are on molar
basis The catalysts will be named as Fe30K20Cu375 referring the wt of Fe K
and Cu on catalyst The support after heating treatment at 120degC for 12 h was
impregnated with an aqueous solution of Fe(NO3)3middot9H2O (Riedel de Haen
product) KNO3 (Merk product) and Cu(CH3COO)2middotH2O (Fluka product) and then
put into a vacuum oven at 40 degC at 36 rpm for 24 h The samples were heated
at 100 degC for 12 h and at 500degC for 4 h in air The results were also modeled
with a collaboration with the Politecnico di Milano and presented in this PhDrsquos
work
The synthesis of the catalyst with the aid of microwave is quite similar to the
TR The difference is the addition of a final step where the powder of catalyst
already calcined is subjected to a MW irradiation Two different methods for
the MW irradiation were used In the first one (MW1) it was taken a sample of
catalyst put it into a beaker and then put into a kitchen microwave oven
General Abstract
10
(Moulinex Micro-Chef 1305E 600W) for 30 min In the second method (MW2)
the catalyst (2 g) was suspended in hexane (400 ml) put it into a microwave
chemical reactor (ordinary 400 mL round bottom glass flask filled with the
liquid to be heated and activated) and treated for 1 h at 60W MW were
produced by a MW generator and sent to the MW applicator by an insulated
coaxial antenna Details of the MW applicator and of the associated
experimental techniques can be found in [24]
The US treatment have been used between the impregnation and the
evaporation step by irradiating the silica-precursors solution using a Sonicator
(W-385 Heat Systems Ultrasonics) with an effective input power of 60 W and a
tip diameter of 13 mm Silica solution promoters and water have been
sonicated by the US horn for 05 h in air atmosphere (US1) The same sample of
US1 was successively sonicated in a suspension of hexane in argon atmosphere
(instead of air) for 3h (US2)
b Catalysis Characterization
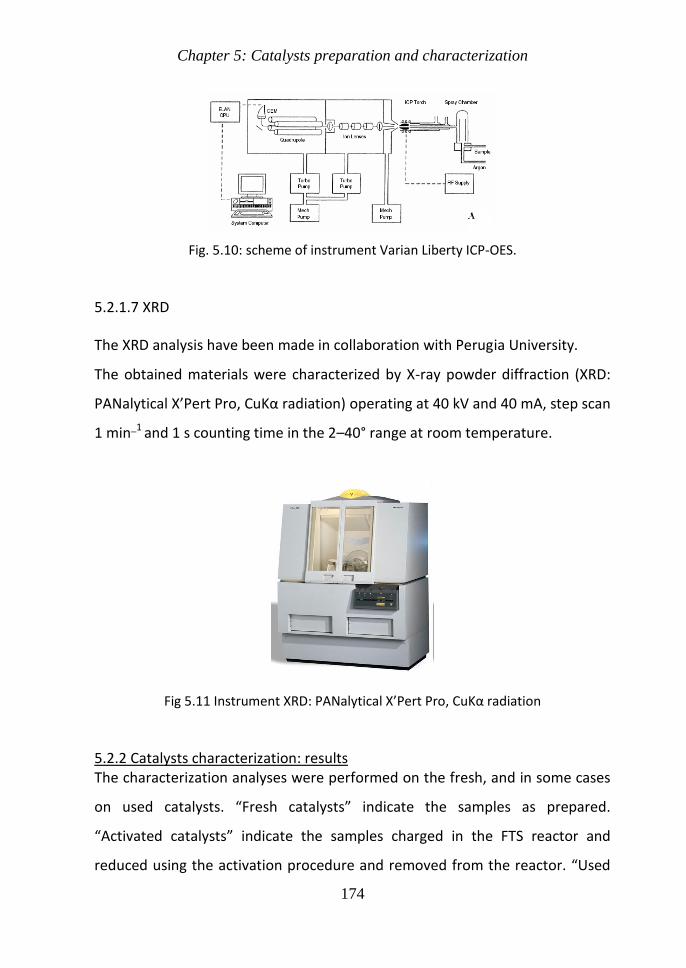
The obtained materials were characterized by X-ray powder diffraction
(XRD PANalytical XrsquoPert Pro CuKα radiation) operating at 40kV and 40mA
step size 00170 2θ degree and step scan 20s
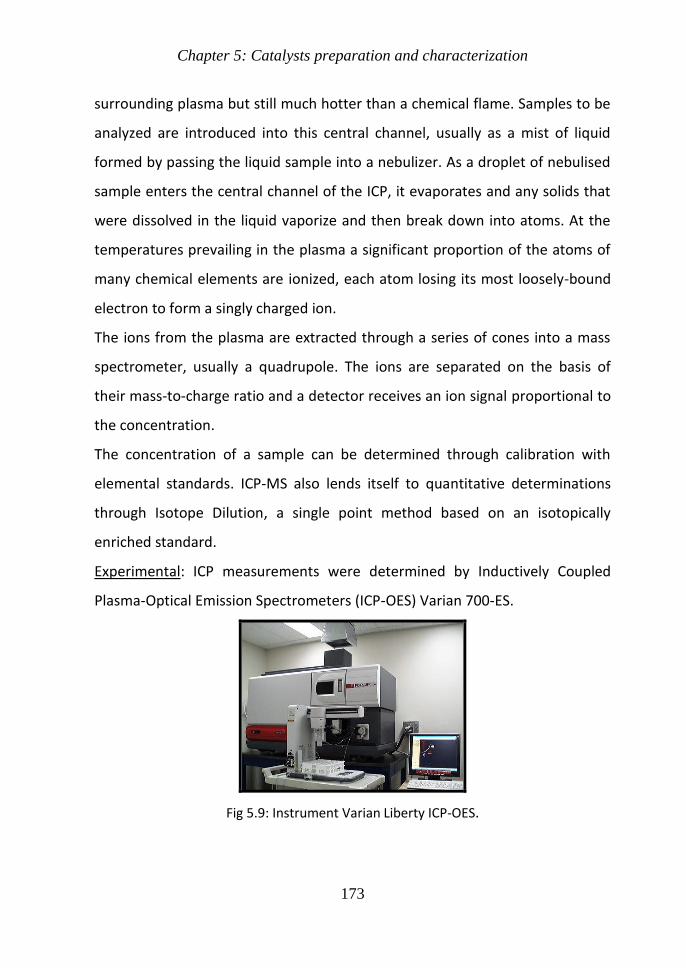
The metal content of samples was determined by inductively coupled
plasma optical emission spectrometry (ICP-OES) using a Varian Liberty
Series instrument
Field emission scanning electron microscopy (SEM) images were obtained
using a LEO1525 instrument after depositing the samples depositing the
catalysts onto the sample holder and sputter coating with chromium
The elemental mapping of metals was obtained by using energy dispersive
X-ray spectroscopy (EDS) with a Bruker Quantax EDS instrument
General Abstract
11
Transmission electron microscopy (TEM) images were obtained using a
Philips 208 instrument
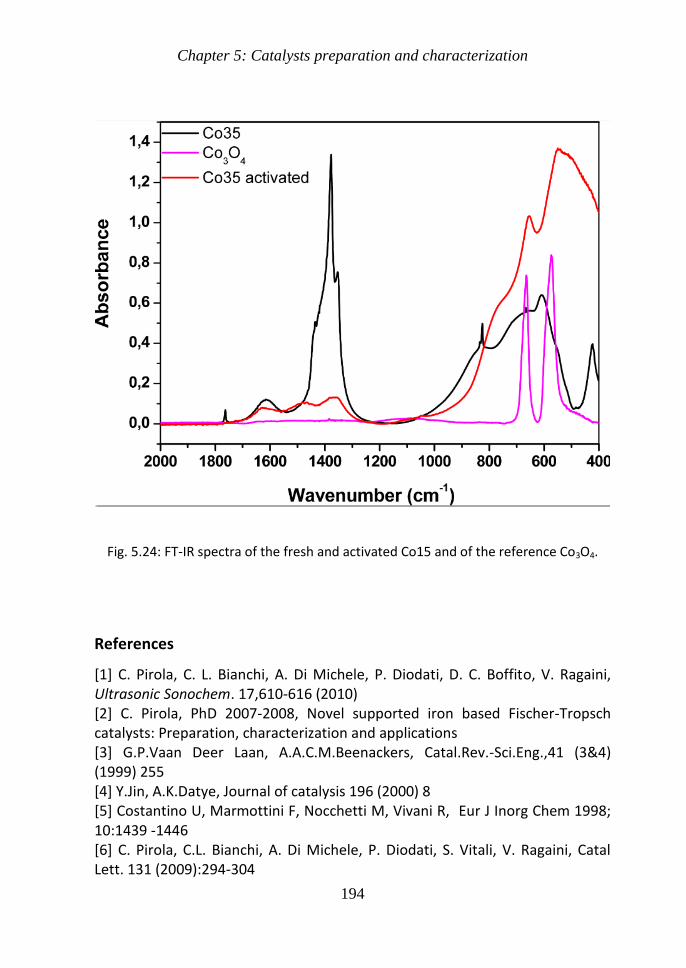
FT-IR spectra of different samples dispersed in KBr pellets were recorded
at room temperature using a Bruker IFS113V spectrometer Typically each
spectrum was obtained at a resolution of 1 cm-1 in the spectral region 400-
5000 cm-1
Specific surface area (SSA) of all catalysts was determined by
conventional N2 absorption using a Micromeritics ASAP2010 instrument
Before the analysis the samples were pre-treated at 200degC in a He flow
Conventional temperature-programmed reduction experiments (TPR) were
performed using a Thermoquest Mod TPRDO 1100 instrument The
samples were initially pre-treated in a flow of argon at 200degC for 05 h After
being cooled down to 50degC the H2Ar (51 vv) reducing mixture was
flushed through the sample at 30 mL min-1 and the temperature increased
from 50 to 900degC at a constant rate of 10degC min-1
Water and nitrate content of the solids was determined by
thermogravimetric (TG) analysis with a Netzsch STA 449C apparatus in air
flow and 10degCmin heating rate
c Kinetics Run
FT synthesis was performed into a fixed bed reactor using 1 g of fresh
catalyst mixed with 1 g of diluting material (-Al2O3) This diluting material
must be inert for FTS and acts as a good thermal conductor to control the
process temperature [25] The calcined catalysts were initially activated in
situ with the standard conditions of 468 Nml min-1 flow of syngas (H2CO =
21) at 350degC 3 bar for 4 h Then they were tested with the standard
conditions of 468 Nml min-1 flow of syngas (H2CO = 21) plus 50 Nml min-1
of N2 as internal standard at 20 bar at T = 250degC Others reducing activating
General Abstract
12
gases feeding compositions pressures temperatures have been tested in
the work Analyses of the gas-phase products (C1ndashC7) were performed with
an on-line micro gas-chromatograph (Agilent 3000) Liquid products were
collected in a trap at 5 degC and 20 bar and analyzed by a gas-chromatograph
(Fisons Mod 8000 Series) equipped with a Poparak-Q column after the total
time of reaction The aqueous phases collected in the cold trap were
analyzed by a TOC (Schimadzu Mod 5000A) to quantify the amount of
carbonaceous species dissolved in water
In the case of hydrotalcites FTS was performed in two different laboratory
plants with the same flow sheet The first one recently described and
located at the Universitagrave degli Studi di Milano and the second one at the
Universidad Central de Venezuela during a complementary stage in
Venezuela In this case the FTS was performed in a continuous flow system
with a fixed bed stainless-steel reactor (di =32mm l = 30 cm) The reactor
was loaded with 03 g of fresh catalyst mixed with 03 g of see sand as a
diluting material [26] The calcined catalysts were initially reduced in situ by
flowing hydrogen for 4 hours at 900 Nml˙min-1 350degC and 08 MPa After
the reduction step the temperature was lowered to 220degC under H2 They
were then tested in the standard conditions by flowing syngas (H2 CO N2
63325 vv N2 as internal standard) at 156 Nml˙min-1 increasing the
system pressure slowly up to 20 MPa and 220-260degC Once the reaction
temperature was achieved the reaction was led to proceed during a period
of 280 h
During reaction the reactor effluent passed through a hot trap kept at
150ordmC and 02 MPa to collect waxes and the products leaving this trap were
passed through a second trap kept at 0ordmC and 02MPa to collect the lighter
products (water alcohols and hydrocarbons) The analyses were performed
General Abstract
13
in various chromatographs according to the nature of the sample to be
analyzed Permanent gases and light hydrocarbons were analyzed on-line in
a PerkinElmer 3000GC Autosystem fitted with TCD detectors using a
Carbosieve SII Supelco column The liquid products (collected at 150ordmC and
0ordmC) were weighted and analyzed in a PerkinElmer chromatograph fitted
with a 50m long Alumina RT capillary column connected to a FID
A mass molar balance was performed for each FT run resulting in a
maximum error of plusmn 5 on molar basis
4 Results and discussion
a) Catalysts activation
i) Cobalt catalysts The catalytic activity of the samples depends on the
presence of metallic Co centres on the surface and the particle size Many
works have been done on the reducibility by TPR of CoOx mixed oxides The
reduction profile of Co3O4 consists of a low-temperature peak and a high-
temperature peak which correspond to the reduction of Co+3 to Co+2 and Co+2
to Co0 [27-30]
Two kinds of Co based catalysts were tested
The HTlc materials contain Co (II) ions randomly dispersed inside the brucitic
layers then the active phase in the FTS is the metallic cobalt Therefore in
order to have an active catalyst a reduction procedure is requires to maintain
the cobalt dispersion TPR analyses were performed to study the reduction
process and to select the best conditions for the catalyst activation Fig 1
reports the TPR profile of the sample Co5 Co10 Co15 Co35 All the profiles
exhibit two regions of reduction the first at lower temperatures (below 400degC)
which is due to the reduction of Co while the second peak above 700degC
indicates the presence of hardly reducible species These species are probably
spinel-type mixed oxides formed during the thermal treatment According to
General Abstract
14
Alvarez et al [31] these two peaks are well separated for samples with a small
particle size while an intermediate particle size causes the overlapping of the
two reduction steps resulting in a complete reduction with only one maximum
at an intermediate temperature (328degC) The TPR profiles of our HTlc (Fig 1)
are consistent with the latter case
Basing on the TPR results the tested catalysts were activated before FTS at
350degC for 4 hours under hydrogen atmosphere in order to reduce the Co ions
to metallic Co
Fig 1 TPR analysis of the samples Co5 Co10 Co15 Co35 Activation temperature is
indicated with the dashed line
After this treatment XRD analysis detected only mixed metal oxides and no
metallic Co phases so highlighting the presence of active metal atoms
homogeneously dispersed at the nanometer or sub-nanometer level [1432]
The same thing happens with the cobalt catalysts synthesized with ultrasound
The results of TPR confirm the data found in literature [27-30] where the Co
based catalysts need to be activated at 350degC for 4 hours under hydrogen
atmosphere It is important to note in Fig 2 how small amount of Ru decreases
the peak of the reduction temperature
General Abstract
15
100 200 300 400 500 600 700 800
Co-RuSiO2
CoSiO2
TC
D
Temperature (degC) 100 200 300 400 500 600 700 800
TC
D
CoAl2O
3
Co-RuAl2O
3
Temperature (degC) 100 200 300 400 500 600 700 800
CoTiO2
TC
D
Co-RuTiO2
Temperature (degC)
Fig 2 TPR analysis of the samples CoSiO2 and Co-RuSiO2 CoAl2O3 and Co-Ru Al2O3
CoTiO2 and Co-RuTiO2 Activation temperature is indicated with the dashed line
Basing on the TPR results the tested catalysts were activated before FTS at
350degC for 4 hours under hydrogen atmosphere in order to reduce the Co ions
to metallic Co
ii) Iron catalysts
As regard the method of synthesis of the iron based catalysts the main results
of catalysts characterization are reported in Table 2 All the surface areas (SA)
of the prepared catalysts are significantly lower than the SA of the
corresponding support (SiO2) This important decrease can be explained
considering the dilution effect due to the presence of iron on the support The
dilution effect can be easily assessed by considering the surface area of bare
silica support and assuming a negligible contribution of the iron phases to the
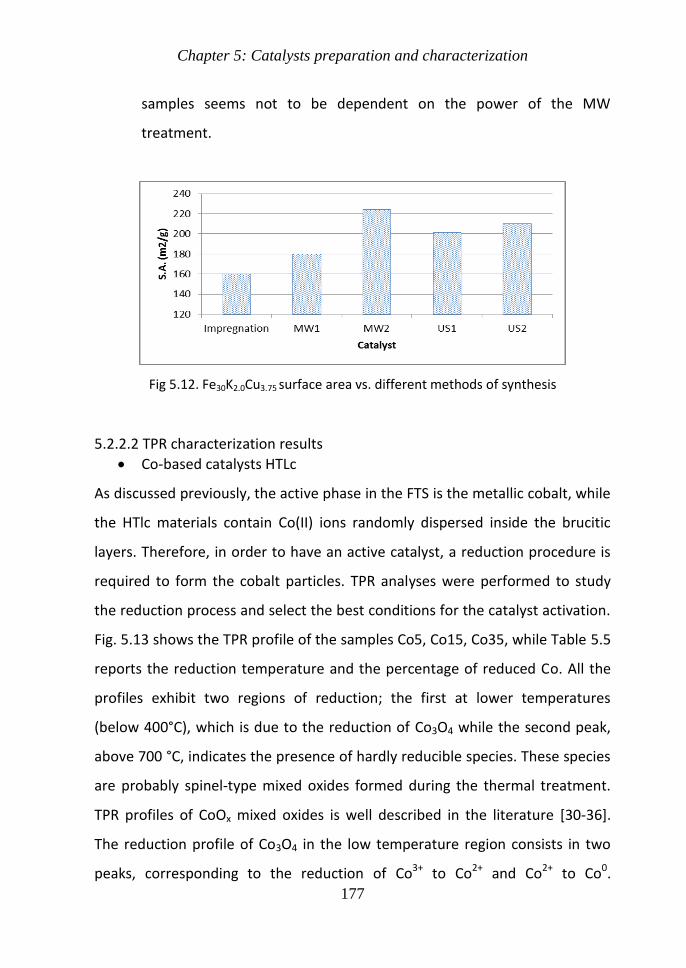
surface area The samples treated with MW and US have higher values of SA
than the traditional ones the effect of MW and US on SA is proportional with
the US or MW emitting power
The TPR analysis of these samples treated with MW gave results consistent
with those prepared by TR showing that the method of preparation does not
influence the step of reduction (Fe2O3-gt Fe3O4 -gt-Fe) of the catalyst but only
the peak temperature
General Abstract
16
Table 2 Characterization results of iron based catalysts using different method of synthesis
Sample Prep
Method
BET TPR TPD
Surface Area (m2g-1)
Temp of first
red peak (degC)
Temp of
second red peak (degC)
Temp of the peak (degC)
Bare support
Catalyst
Fe30K2Cu375SiO2 TR 4303 1601 240 600 170
Fe30K2Cu375SiO2 MW1
4303 1800 - - -
MW2 2240 240 580 162
Fe30K2Cu375SiO2 US1
4303 2011 236 572 171
US2 2101 - - - TR= Traditional Impregnation MW1= Catalyst put it into a kitchen MW and processed in powder MW2= Catalyst put it into MW and suspended in hexane US1= Catalyst suspended in aqueous solution in air atmosphere for 05 h US2= Catalyst sonicated and suspended in hexane in Argon atmosphere for 3h
In agreement with the literature [33] all the curves show a single TPDs peak in
the same range (150-170degC) that confirms the fact that only one type of
adsorbing species can exists up on the catalyst (see table 2) for all the catalysts
Before FT runs the catalysts must be activated reducing the hematite phase
(not active for FTS) in iron carbides (in particular Fe22C and Fe25C) and
magnetite (Fe3O4) [34] In literature there is not a uniform procedure for this
operation Many tests were performed by [34] and show that the best FT
results in term of CO conversion have been obtained using the activating
mixture H2CO (21) or pure CO starting from oxidized catalysts and making this
operation at T=350degC The process selectivity is not particularly modified using
the mixture H2CO (21) or pure CO and changing the activation temperature
b) FT results
i) Co based hydrotalcites as catalysts for Fischer-Tropsch synthesis
General Abstract
17
The activated samples were tested at different temperatures in the FTS plant
following the procedure reported in the experimental section In Fig 3 the CO
conversion vs the reaction temperature is reported for all the catalysts while
the products selectivity is displayed in Table 3
Fig 3 molar CO conversion to Co5 () Co10 ( ) Co15 (diams) Co35 () obtained at
different reactor temperatures after 24 hours of reaction
As expected for each catalyst the activity is strongly influenced by the reaction
temperature the higher the temperature the higher the CO conversion but
also the selectivity towards CO2 CH4 and light hydrocarbons is favored by a
higher temperature The CO conversion is similar for Co5 and Co10 while it is
higher for the two samples with a larger amount of cobalt ie Co15 and Co35
In particular Co15 exhibits the highest CO conversion at all the selected
temperatures In FTS it is fundamental to obtain low quantities of CH4 and CO2
(undesired products) to favor the formation of higher hydrocarbons For this
reason temperatures in the 220-235degC range are more suitable than the higher
ones
General Abstract
18
Moreover Table 3 shows that Co15 exhibits the highest CO conversion and the
highest C2+ total yield (without considering CH4 and CO2 see note in Table 3)
also at the lowest temperature (220degC) This result confirms that Co15 is the
best performing catalyst obtained in this study
The obtained data suggest the possibility of using synthetic hydrotalcites as Co-
based catalysts for FTS and pursuing subsequent studies on the same subject
Table 3 FTS products selectivity at different reactor temperatures
Sample Temperature
(degC)
Products Selectivity C2+
Yield CO2 CH4 leC7 gtC7
Co5 220 03 29 33 934 165
235 03 59 104 834 194
245 11 85 127 776 224
260 19 141 160 679 300
Co10 220 32 26 98 844 155
235 38 49 143 769 178
245 33 60 154 753 218
260 81 163 413 343 262
Co15 220 14 101 17 705 467
235 81 262 473 185 498
250 178 177 443 202 491
Co35 220 14 39 103 844 250
235 18 96 234 651 395
245 51 257 656 105 473
leC7 all the hydrocarbons in the range C2-C7 gtC7 all the hydrocarbons greater than C7 Product lsquolsquoirdquo selectivity = (moles C in product i) (converted moles C) x 100 C2+ yield = CO conversion x (selectivity leC7 + selectivity gtC7) x10-2
General Abstract
19
iii) Sonochemical synthesis of Co and Co-Ru based catalysts for Fischer-Tropsch
synthesis
The use of ultrasound might be very efficient to optimize the dispersion of a so
high metal charge as already verified in our laboratory in the past [35-36] This
special type of synthesis should give at the catalyst a particular structure with a
high surface area and a high metal dispersion that improves its activity towards
the synthesis of Fischer-Tropsch In the case of cobalt supported catalysts a
simple US step has been added in the catalyst preparation The precursors
(cobalt and ruthenium carbonyl) were dissolved in n-decane together with the
different support (SiO2 Al2O3 or TiO2) the solution was irradiated with
ultrasound at a frequency of 20 kHz and an output power of 300 W for 3 hours
As seen in table 4 the catalysts show a low selectivity to methane and carbon
dioxide and formation of higher hydrocarbons The more interesting results are
the highest CO conversion at lower temperatures measured with a catalysts
promoted with a Ru
Table 4 CO Conversion C2+total yield CH4 CO2 light hydrocarbon and heavy
hydrocarbon selectivity of CoCo-Ru based catalyst
Catalyst CO
Conversion ()
C2+ total yield
Selectivity ()
CH4 CO2 ltC7 gt C7
CoTiO2 28 23 5 14 10 71
CoSiO2 6 5 19 6 23 52
CoAl2O3 8 6 13 7 19 61
Co-RuTiO2 98 73 18 8 14 60
Co-RuSiO2 94 82 9 4 8 79
Co-RuAl2O3 84 73 11 2 12 75
As we have seen from the BET and TPR analysis the support and the promoter
play a key role in the performance of the catalyst because they are responsible
General Abstract
20
for the modification of some key parameters such as surface area and the
metal dispersion
ii)High Fe Loaded Supported Catalysts for Biosyngas Fischer ndash Tropsch
Conversion experimental results and detailed simulation
With regard to the treatment with the help of US (see table 5) it can be
concluded that the sonication of an aqueous mixture salts and precursors of
support (US1) is preferable instead of to the calcined catalyst suspended in
non-polar solvent such as hexane (US2) With regard to treatment with MW
(see table 3) there were obtained better results in term of CO conversion with
the powder catalyst treated directly in the MW (MW1) while the test
conducted by suspending the catalysts in hexane and then treated in a MW
reactor (MW2) for an hour did not give valid results The best FTS results in
term of C2+ yield (41) has been obtained using MW1 while in tem of CO
conversion (58) using US1 All of them gave FTS results better than the
traditional one Itrsquos evident that the use of US or MW optimizes the catalytic
performance in accord with previous similar results [36]
In agreement with [37] the FTS results show that TEOS as silica source is
favorable for the enhancement of the FTS activity
A very important property of iron based catalysts is their possibility to operate
using feeding gas having a ratio H2CO not stoichiometric (ie 2) In the
present work there were made some tests with Fe30K20Cu375 catalyst by
feeding mixtures with a ratio H2CO between 05 and 20 in order to optimize
the activity selectivity and the lifetime of this kind of FT catalyst in work
conditions of biosyngas feeding
General Abstract
21
Table 5 Catalytic Results of Fe30K20Cu375 Different preparation techniques Support
SiO2 Diluting Material α-Al2O3 T=220degC
Preparation CO Conversion
()
C2+
Total yield
Selectivity ()
CO2
CH4
lt C7
gt C7
TR 49 32 27 7 22 44
MW1 52 41 17 5 18 60
MW2 32 24 17 8 27 48
US1 58 38 29 6 22 43
US2 36 25 22 9 30 39
Co-precipitation 38 32 2 13 28 57 leC7 all the hydrocarbons in the range C2-C7 gtC7 all the hydrocarbons greater than C7 Product lsquolsquoirdquo selectivity = (moles C in product i) (converted moles C) x 100 C2+ yield = CO conversion x (selectivity leC7 + selectivity gtC7) x10-2
The co-precipitation test was made at T=250degC and TEOS as a support
On the basis of the collected data a rigorous simulation of the FT synthesis
reactor has been developed for different purposes (i) to support the
experimentations and their planning (ii) to predict the reactor yield and
conversion (iii) to optimize the performance of the reactor system with
different operating conditions and (iv) to calculate novel reliable kinetic
parameters based on the experimental data fitting by means of model-based
nonlinear regression techniques To do so the FT reactor is modeled as a
catalytic plug-flow reactor using mass and energy balances and reaction
kinetics for Fe-based catalyst defined by Zimmerman and Bukur [38] leading to
an ordinary differential equation system with structured Jacobian Lumping
techniques have been used to model heavy hydrocarbons The system is solved
by means of dedicated solvers to handle stiffness and nonlinearities of
heterogeneous reactive systems [39]
General Abstract
22
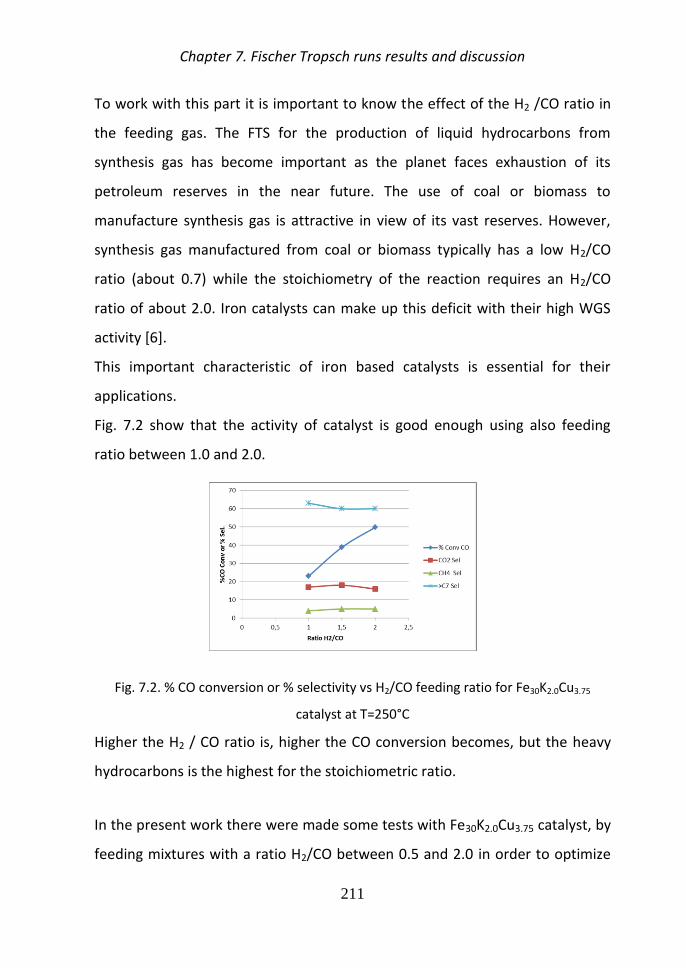
Typical H2CO ratio of syngas manufactured from coal or biomass are between
07-12 and the Fig 4 show that the activity of catalyst is good enough using
also feeding ratio between 10 and 20
Fig4 CO conversion or selectivity vs H2CO feeding ratio for Fe30K20Cu375 catalyst
at T=250degC
In Table 6 there is the data concerning the carbon monoxide conversion ()
and the selectivity towards undesired products (CO2 and CH4) and lighter and
heavy hydrocarbons of Fe-based catalyst The data collected using this catalyst
were modeled in collaboration with Politecnico di Milano
The selected model was based on the hypothesis that both FT and WGS
reaction were active on this catalyst The kinetic parameters were calculated
and compared with the experimental data
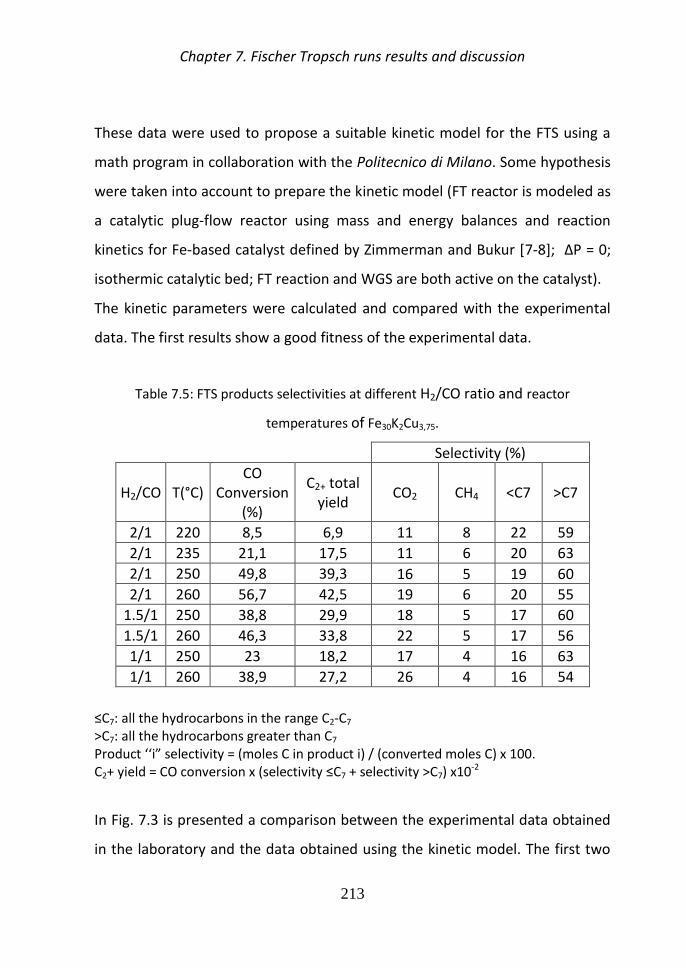
Table 6 FTS products selectivities at different H2CO ratio and reactor temperatures of
Fe30K20Cu375
Selectivity ()
H2CO T(degC) CO
Conversion ()
C2+ total yield
CO2 CH4 ltC7 gtC7
21 220 85 69 11 8 22 59
21 235 211 175 11 6 20 63
21 250 498 393 16 5 19 60
21 260 567 425 19 6 20 55
151 250 388 299 18 5 17 60
151 260 463 338 22 5 17 56
11 250 23 182 17 4 16 63
11 260 389 272 26 4 16 54
General Abstract
23
leC7 all the hydrocarbons in the range C2-C7 gtC7 all the hydrocarbons greater than C7 Product lsquolsquoirdquo selectivity = (moles C in product i) (converted moles C) x 100 C2+ yield = CO conversion x (selectivity leC7 + selectivity gtC7) x10-2
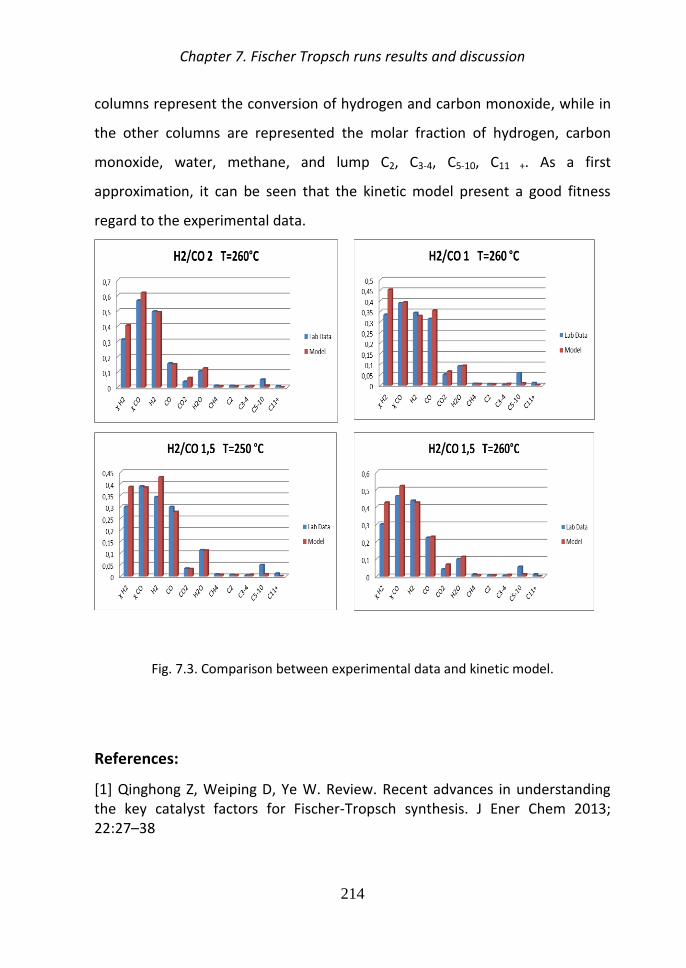
In Fig 5 is presented a comparison between the experimental data obtained in
the laboratory and the data obtained using the kinetic model The first two
columns represent the conversion of hydrogen and carbon monoxide while in
the other columns are represented the molar fraction of hydrogen carbon
monoxide water methane and lump C2 C3-4 C5-10 C11 + It can be seen that the
kinetic model present a good fitness regard to the experimental data
Fig 5 Comparison between experimental data and kinetic model
5 Conclusions
General Abstract
24
Concerning the results obtained in this PhDrsquos research work it is clear that all
the samples tested have given good results The Co-based catalysts
synthesized using the traditional impregnation method with an additional step
of ultrasound have given good results in comparison with the results in the
current literature The hydrotalcites have given lower results if compared with
the Co-based catalysts synthesized with the help of ultrasound but they have
opened an alternative and innovative way that has never been tried before
Iron based catalysts allow a direct conversion of the biosyngas and the results
have shown how our catalysts are active with an H2CO ratio le2 Furthermore
trends have been modeled with success In conclusion the PhDrsquos research
work has given a serious contribution to the current state of the art on
catalysis in the Fischer-Tropsch synthesis either with cobalt and iron based
catalysts With cobalt has been optimized a traditional synthesis procedure
with the introduction of ultrasound furthermore has been created a
completely new kind of catalyst With iron has continued an optimizationrsquos
work of iron supported with high loading metals so to develop a suitable
kinetic model able to work not only with syngas but also with biosyngas
References
[1] M S Hadnadev-Kostic J Tatjana T Vulic R Marinkovic-Neducin A D Nikolic B Jovic Journal of the Serbian Chemical Society 76 (12) (2011) 1661ndash1671 [2] E Lira C Loacutepez F Oropeza M Bartolini J Alvarez M Goldwasser F Loacutepez J Lamonier J Peacuterez Journal of Molecular Catalysis A Chemical 281 (2008) 146ndash153 [3] Q Zhang J Kang Y Wang ChemCatChem Catalysis 2 (2010) 1030 [4] F Fischer and H Tropsch BrennstChem 4 (1923) 276 [5] M E Dry Enciclopedia of Catalysis New York (2003) 247 [6] Fischer-Tropsch Technology Studies in Surface Science and Catalysis Elsevier (2004)
General Abstract
25
[7] G P Vaan Deer Laan A A C M Beenackers Catalysis Reviews Science and Engineering 41(3amp4) (1999) 255 [8] H Schulz Applied Catalysis A 186 (1999) 3 [9] GP van der Laan AACMBeenackers Applied Catalysis A 193 (2000) 39 [10] A Martinez C Lopez F Marquez IJ Diaz Catalysis 220 (2003) 486 [11] AY Khodakov WChu P Fongarland Chemical Reviews 107 (2007) 1692 [12] BHDavis Catal Today 84 (2003) 83 [13] Pirola C Bianchi CL Di Michele A Diodati P Vitali S Ragaini V Catal Lett 2009 131294ndash304 [14] A Di Fronzo C Pirola A Comazzi F Galli CL Bianchi A Di Michele R Vivani M Nocchetti M Bastianini DC Boffito Fuel 119 (2014) 62-69 [15] C Pirola CL Bianchi A Di Michele S Vitali V Ragaini Catal Comm 10 (2009) 823ndash827 [16] T Montanari M Sisani M Nocchetti R Vivani M C H Delgado G Ramis G Busca U Costantino Catalysis Today 152 (2010) 104 [17] C Resini T Montanari L Barattini G Ramis G Busca S Presto P Riani R Marazza M Sisani F Marmottini U Costantino Applied Catalysis A 355 (2009) 83 [18] Y Lee J H Choi H J Jeon K M Choi J W Lee J K Kang Energy Environment Science 4 (2011) 914 [19] Y Tsai X Mo A Campos J G Goodwin Jr J Spivey Applied Catalysis A General 396 (2011) 91ndash100 [20] M Bastianini D Costenaro C Bisio L Marchese U Costantino R Vivani M Nocchetti Inorg Chem 51 (2012) 2560-2567 [21] Suslick SK ldquoApplications of ultrasound to materials chemistryrdquo MRS Bulletin 1995 [22] S Qi B Yang Methane aromatization using Mo-based catalysts prepared by microwave heating Catal Today 98 (2004) 639-645 [23] Y Liu Y Lu S Liu Y Yin The effect of microwaves on the catalysts preparation and the oxidation of o-xilene over a V2O5SiO2 system Catal Today 51 (1999) 147-151] [24] G Biffi Gentili M Linari I Longo A Ricci IEEE Transactions on microwave theory and techniques Vol 57 (2009) 9 [25] C Bianchi C Pirola V Ragaini Catalysis Communications 7 (2006) 669-672 [26] ML Cubeiro Loacutepez A Colmenares L Texeira M Goldwasser M J Peacuterez F Machado F Gonzaacutelez Applied Catalysis A General 167 (1998) 183-193 [27] C L Bianchi Catalysis Letters Vol 76 No 3ndash4 (2001)155-159 [28] H-Y Lin Y-W Chen C Li Thermochim Acta 400 (2003) 61ndash67 [29] H-Y Lin Y-W Chen Materials Chemistry and Physics 85 (2004) 171ndash175
General Abstract
26
[30] BA Sexton AE Hughes TW Turney Journal of Catalysis 97 (1986) 390ndash406 [31] A Alvarez S Ivanova MA Centeno JA Odriozola Applied Catalysis A General (2012) 431ndash 432 [32] C L Bianchi C Pirola DC Boffito A Di Fronzo A Di Michele R Vivani M Nocchetti M Bastianini S Gatto DGMK Tagungsbericht Volume2011-2 IssuePreprints of the DGMK-Conference Catalysis Innovative Applications in Petrochemistry and Refining 2011 Pages 93-98 Journal 2011 CODEN DGTAF7 ISSN1433-9013 [33] 7 H Wan B Wu C Zhang H Xiang Y Li Promotional effects of Cu and K on precipitated iron-based catalysts for Fischer ndash Tropsch synthesis J molecular Catalysis 283 (2008) 33-42 [34] J Xu CHBartholomew J Phys Chem B 109 (2005) 2392 [35] CLBianchi VRagaini Catalysis Letters 95 (2004) 61-65 [36] C Pirola C L Bianchi A Di Michele P Diodati D C Boffito V Ragaini Ultrasonic Sonochem 17 (2010) 610 [37] Suo Haiyun Zhang Chenghua Wu Baoshan Xu Jian Yang Yong Xiang Hongwei Li Yongwang A comparative study of FeSiO2 FischerndashTropsch synthesis catalysts using tetraethoxysilane and acidic silica sol as silica sources Catalysis Today Volume 183 Issue 1 20 March 2012 Pages 88ndash95 [38] WH Zimmerman DB Bukur Can J Chem Eng 68 (1990) 292-301 [39] F Manenti I Dones G Buzzi-Ferraris HA Preisig Ind Eng Chem Res 48 (2009) 9979-9984
27
Chapter 1 General Introduction The National Renewable Energy Laboratory (NREL) and the Pacific Northwest
National Laboratory (PNNL) [1] are undertaking studies of biomass conversion
technologies to hydrocarbon fuels
Process designs and preliminary economic estimates for each of these pathway
cases were developed using rigorous modeling tools This technology pathway
case investigates the upgrading of woody biomass derived synthesis gas
(syngas) to hydrocarbon biofuels While this specific discussion focuses on the
conversion of syngas via a methanol intermediate to hydrocarbon blend stocks
there are a number of alternative conversion routes for production of
hydrocarbons through a wide array of intermediates from syngas (Fig 11)
Technical barriers and key research needs have been identified that should be
pursued for the syngas-to-hydrocarbon pathway to be competitive with
petroleum-derived gasoline- diesel- and jet-range hydrocarbon blend stocks
Fig 11 Process Block Diagram [1]
At present the development of economical and energy-efficient processes for
the sustainable production of alternative fuels and chemicals is a global
Chapter 1 General Introduction
28
demand and FTS is a crucial technology for this purpose [2] On the one side
the observed climate change particularly global warming is widely held as a
consequence of the increase of atmospheric CO2 concentration due to fossil
fuel combustion On the other side people are increasingly aware that fossil
fuels reserves are huge but not unlimited and the air quality are major
environmental concerns because they directly affect the way we live and
breathe
In order to meet the present and future threats generated by emissions to the
atmosphere environmental agencies around the world have issued more
stringent regulations One of them is the control of residual sulfur in diesel fuel
and emission standards for particulates from diesel vehicles All these facts
have recently aroused renewed interest in the FischerndashTropsch Synthesis
because it can produce super clean diesel oil fraction with high cetane number
(typically above 70) without any sulfur and aromatic compounds using syngas
(mixture of H2 CO CO2) from natural gas CH4 coal landfill gas coal or biomass
through steam reforming partial or auto thermal oxidation gasification
processes or as a new tendency from biomass [3-5] Mineral diesel basically
results from refining and fractional distillation of crude oil between 160 and
380degC at atmospheric pressure and is mostly formed by mixtures of paraffins
containing between 12 and 20 carbon atoms per molecule In these mixtures
linear paraffins are particularly appreciated due to their high cetane number
ie their excellent ignition performances Expansion and social progress is
however boosting a further increase of energy demand particularly in the
transportation sector which in developed countries accounts for most of this
increase This is the reason why carbon-neutral biofuels are largely considered
a possible way to satisfy the energy demand without dramatically increasing
the CO2 content of the atmosphere [6]
Chapter 1 General Introduction
29
In this context the production of hydrocarbons starting from syngas (CO + H2) is
a crucial topic because syngas can be manufactured from natural gas (GTL Gas
to liquid) coal (CTL coal to liquids) or biomass (BTL Biomass to liquid) [7] In
Fig 12 the industrial way to utilize syngas are reported the fuels produced
from syngas include hydrogen by the water-gas-shift (WGS) reaction methanol
by methanol synthesis alkenes by Fischer Tropsch synthesis (FTS) isobutene by
isosynthesis ethanol by fermentation or with homogeneous catalysts and
aldehydes or alcohols by oxosynthesis
Fig 12 Diagram of Syngas Conversion Processes [8]
Fischer-Tropsch Synthesis (FTS) is a well-known industrial process discovered
by Franz Fischer and Hans Tropsch in Germany in 1923 [9] starting from syngas
(H2 + CO) and using iron or cobalt based catalysts it is possible to produce
several hydrocarbons in the range from 1 to 100 carbon atoms Co-based
catalysts have been more largely used due to their high selectivity to heavy
hydrocarbons and low activity in the water-gas shift reaction so limiting the
CO2 formation Moreover Co-based catalysts have shown longer life-time and
higher CO conversion compared to the Fe-based ones [10-11] The essential
target of FTS is to produce paraffins and olefins with different molecular weight
Chapter 1 General Introduction
30
and to limit the maximum formation of methane and CO2 [4 12-15] The main
reactions involved in FTS are reported in the following scheme
Irreversible reactions
1) n CO + 2n H2 rarr CnH2n + n H2O for olefins
2) n CO + (1+2n) H2 rarr CnH(2n+2) + n H2O for paraffins
3) 2n CO + n H2 rarr CnH2n + n CO2 for olefins
4) n CO + 2n H2 rarr CnH(2n+1)OH + (n-1) H2O for alcohols
Equilibria
5) CO + H2O harr CO2 + H2 Water-gas-shift reaction (WGS)
6) CO + 3 H2 harr CH4 + H2O
7) 2 CO harr C + CO2 Boudouard equilibrium
The whole reaction gives an energetic contribution strongly exothermic (about
150 kJmol CO reacted) FTS is a particularly complex system in which a
number of different reactions are combined to a unique mechanism
irreversible FT reactions produce hydrocarbons and some equilibria reactions
between CO CO2 CH4 and C such as the WGS reaction and the Boudouard
equilibrium are present too Nevertheless it is possible to suppose that FTS
can be simplified as a combination of the FT reactions and the WGS reaction
[14] Hydrocarbons are primary products of FT reaction and CO2 can only be
produced by WGS reaction a reversible parallel-consecutive reaction with
respect to CO [16]
At present the marketplace places a premium on FT diesel but not gasoline
thus the current view is that the most attractive option is to produce high
molecular weight FT products and then to hydrocrack them to produce high
quality diesel fuel [17] According to Calderone et al [18] the most important
limitation to the industrialization of FT processes is the availability of cheap oil
Industrial interest in FT reactions always peaks during oil crises (Fig 13) The
Chapter 1 General Introduction
31
Kyoto protocol recognizes the importance of developing and deploying new
technologies with less impact on the environment
Fig 13 The oil price (line) related to the output of peer reviewed FTS research papers and patents (bars) in 1925ndash2007 [19]
Fig 14 Number of papers related to FT synthesis published in the past decade From
ISI Web of Science using the keyword ldquoFischer-Tropschrdquo [20]
Selectivity control remains one of the most important and difficult challenges
in the research area of FTS Development of efficient catalysts with controlled
selectivity or tuned product distribution is a highly desirable goal [5]
Compared to cobalt systems iron-based catalysts are cheaper but less resistant
to deactivation due to the oxidizing effect of water despite activating Water
Gas Shift (WGS) reaction (CO + H2O harr CO2 + H2) [12 16] Moreover they are
flexible to changes in temperature pressure and they can work at different H2
CO feed ratios (for iron based catalysts this ratio can be between 05 and 25)
[21-22] Iron catalysts seem to be more suitable to work with biomass-derived
Chapter 1 General Introduction
32
syngas as outlined by Corma et al [23] that are characterized by a low ratio
H2CO and by the presence of CO2 (the activation of WGS reaction in fact can
produce CO from CO2) They present lower methane selectivity and they are
less deactivated by poisons species [24] The iron based catalysts have different
active site the Fe-carbides sites are active for the formation of hydrocarbons
(FTS) while the magnetite (Fe3O4) sites are the most active phase for the WGS
reaction [16 25-26]
11 Fischer Tropsch Synthesis Historical background
A Short Historical Sketch
Year Ref
1902 P Sabatier and J D Senderens
Hydrogenated CO over Ni to produce CH4 [27]
1910 A M Mittasch C Bosch and F Haber
Developed promoted Fe catalysts for the synthesis of NH3 [28]
1913 Badische Anilin und Soda Fabrik (BASF)
Received patents on the preparation of hydrocarbons and oxygenates by the hydrogenation of CO at high pressure usually on oxide catalysts
1936 Eugene Houdry Developed and installed the first commercial catalytic cracking unit [29]
1943-1944
Kogravelbel KWIK and five companies participated
Initiated and directed the comparative tests I and II held at Schwarzheide to select a Fe catalyst to replace Co in existing reactors Although the results were remarkably good no replacement catalyst was selected probably because of the overall disarray of activity that attended the approach of the end of the war
[30]
1949 Kogravelbel and F Engelhardt
Discovered that H2O and CO react on FTS catalysts to yield typical FTS products
1950 A fluidized-fixed bed process developed by Hydrocarbon Research Trenton New Jersey was installed in Brownsville Texas This plant called Carthage Hydrocol Inc used reformed natural gas Severe operating difficulties required designing a new reactor which was installed in 1953 The new reactor operated properly but the plant was promptly shut down sold and dismantled By the time the plant was operating correctly the price of natural gas had more than doubled Merely selling the gas was more profitable than converting it to gasoline and chemicals At the same time in South Africa the SASOL FTS plant using coal was constructed and opened in 1955 Lurgi gas generators and Rectisol gas-cleaning units were employed Two types of FTS reactors both with Fe catalysts were used a fixed-bed with recycle unit designed by Ruhrchemie in West Germany having long tubes with an internal diameter of 2 inch and an entrained-solids reactor by M W Kellogg in New Jersey After a year or more of start-up problems these units have operated successfully up to the present
[31]
1953 R B Anderson and J F Shultz
Found that Fe nitrides are unique durable catalysts for the FTS that produce large yields of alcohols Anderson developed equations that predict the isomer and carbon-number distributions of FTS products
[32]
1957 G Natta and co-workers
Studied the methanol and higher alcohol syntheses [3334]
1959 Pichler Resumed work on FTS on Ru which led to the polymethylene synthesis
Chapter 1 General Introduction
33
1961 H H Storch He died he was the architect of the useful scientific and engineering research programs on coal-to-oil processes at the US Bureau of Mines in Pittsburgh and Bruceton Pennsylvania
[3235]
1967 US Bureau of Mines workers
Developed methods for flame spraying catalysts onto metals for the platelet assemblies of hot-gas-recycle reactors These techniques led to the development of a new FTS unit the tube-wall reactor
[36]
1975 SASOL II SASOL III
In South Africa the decision was made to build SASOL II scheduled for operation in 1980 and in 1979 plans were made for SASOL III to begin operation in 1982 The new plants are similar to the initial plant except that fixed-bed FTS reactors were not included in the new installations
[31]
1976 Mobil Announced a process for converting methanol to an aromatic gasoline and C to C4 olefins on the shape-selective catalyst ZSM5 This process may be a serious competitor for FTS
1981 New Zealand A methanol plant operating on natural gas plus the Mobil process was planned scheduled for competition in 1985
1982 The worldwide recession
Sharply decreased demand for petroleum OPEC was unable to control the production and price of oil among its members The relatively low cost and abundance of petroleum has discouraged new coal-to-oil ventures
1993 Shell in Bintulu Malaysia
Completed construction and began operating their ldquoShell Middle Distillate Processrdquo The Bintulu Plant produces 12500 BPD and in 2000 increase that capacity to 15000 BPD This F-T plant has effectively captured the world specialty wax market
2000 While Saudi Arabia produced about 8 million barrels of oil per day in 2000 the world flared (burned) or re-injected associated gas equivalent to 72 million barrels per day of clean synthetic fuels Worldwide environmental legislation requiring ultra-low sulphur and aromatic levels in fuel will cost billions in oil refinery upgrading
2002 Nearly every major oil company is either developing their own F-T technology forming joint ventures or scrambling to do so ExxonMobil has spent over $500 MM Chevron formed a joint venture with Sasol Statoil has formed a joint venture with Mossgas Conoco built a $400MM test plant in Oklahoma BP completed its pilottest plant in Alaska Shell has announced 7 new projects
2004 50 new Fischer-Tropsch projects have been announced These projects total over 900000 BPD capacity Some of these projects are pilot plants some are feasibility studies for clients and some have started construction
2005 In South Africa Mossel Bay GTL Expansion operated by PetroSA with a capacity of 15000bpd
2006 In Qatar ORYX GTL Phase 1 operated by SasolQatar Petrol with a capacity of 32400 bpd
2011 In Qatar Pearl GTL Phase 1 operated by Shell with a capacity of 70000 bpd
2011 In Qatar Pearl GTL Phase 2 operated by Shell with a capacity of 70000 bpd
2013 In Nigeria Escravos operated by ChevronNNPC with a capacity of 34000bpd
2017 In Uzbekistan Oltin Yorsquol GTL operated by SasolUNGPetron with a capacity of 38000bpd
2018-19
In USA Sasol Lousiana operated by Sasol with a capacity of 96000bpd
Firm proposed large-scale GTL capacity outlook
Chapter 1 General Introduction
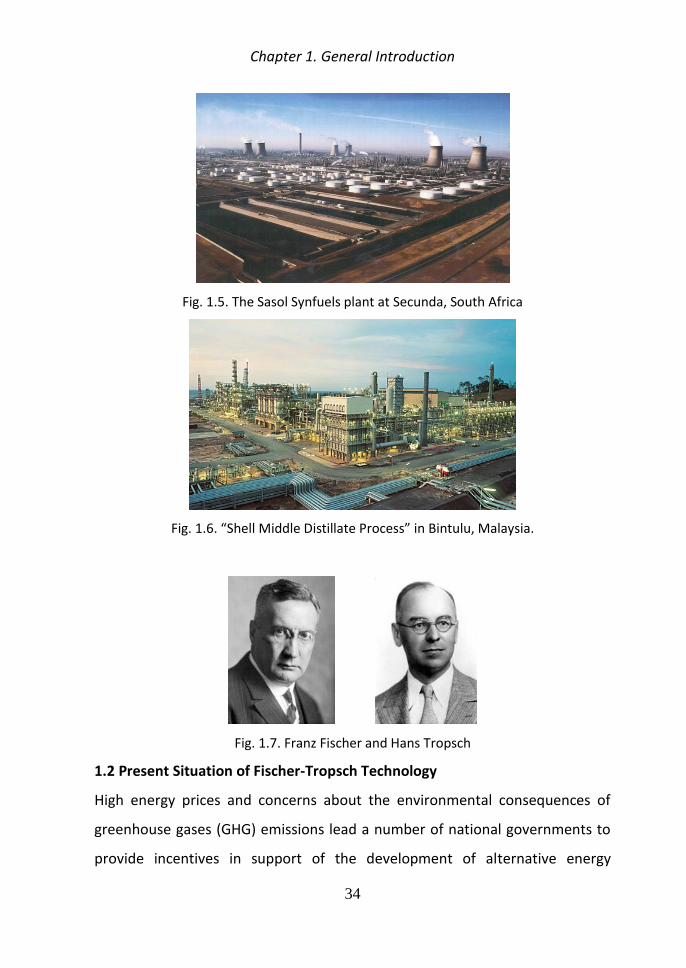
34
Fig 15 The Sasol Synfuels plant at Secunda South Africa
Fig 16 ldquoShell Middle Distillate Processrdquo in Bintulu Malaysia
Fig 17 Franz Fischer and Hans Tropsch
12 Present Situation of Fischer-Tropsch Technology
High energy prices and concerns about the environmental consequences of
greenhouse gases (GHG) emissions lead a number of national governments to
provide incentives in support of the development of alternative energy
Chapter 1 General Introduction
35
sources making renewables the worldrsquos fastest-growing source of energy in
the outlook
According to the Annual Energy Outlook 2013 [37] the aggregate fossil fuel
share of total energy use falls from 82 percent in 2011 to 78 percent in 2040 in
the Reference case while renewable use grows rapidly (Fig 17) The
renewable share of total energy use grows from 9 percent in 2011 to 13
percent in 2040 in response to the federal renewable fuels standard
availability of federal tax credits for renewable electricity generation and
capacity during the early years of the projection and state renewable portfolio
standard (RPS) programs
Increased vehicle fuel economy offsets growth in transportation activity
resulting in a decline in the petroleum and other liquids share of fuel use even
as consumption of liquid biofuels increases Biofuels including biodiesel
blended into diesel E85 and ethanol blended into motor gasoline (up to 15
percent) account for 6 percent of all petroleum and other liquids consumption
by energy content in 2040
Consumption of petroleum and other liquids peaks at 198 million barrels per
day in 2019 in the AEO2013 reference case and then falls to 189 million barrels
per day in 2040 (Figure 18)
Fig 18 Primary energy use by fuel 1980-2040 (quadrillion BTU)
Chapter 1 General Introduction
36
The transportation sector accounts for the largest share of total consumption
throughout the projection although its share falls to 68 percent in 2040 from
72 percent in 2012 as a result of improvements in vehicle efficiency following
the incorporation of CAFE standards for both LDVs and HDVs
An increase in consumption of biodiesel and next-generation biofuels (include
pyrolysis oils biomass derived Fisher-Tropsch liquids and renewable feedstocks
used for on-site production of diesel and gasoline) totaling about 04 million
barrels per day from 2011 to 2040 is attributable to the EISA2007 RFS
mandates The relative competitiveness of CTL and GTL fuels improves over the
projection period as petroleum prices rise In 2040 CTL and GTL together
supply 03 million barrels per day of nonpetroleum liquids
Fig 19 Consumption of petroleum and other liquids by sector 1990-2040 (million
barrels per day)
2 Oil prices and total energy consumption
The importance of the research in FTS is directly dependent of the oil prices
and the total energy consumption So it is so important to meet the
projections of these variables before to make every kind of investments on this
area In AEO2013 oil prices are represented by spot prices for Brent crude
Prices rise in the Reference case from $111 per barrel in 2011 to about $117
Chapter 1 General Introduction
37
per barrel in 2025 and $163 per barrel in 2040 (Table 1) The price rise starts
slowly then accelerates toward the end of the projection period
Market volatility and different assumptions about the future of the world
economy are reflected in the range of oil price projections for both the near
and long term however most projections show oil prices rising over the entire
projection period
Table 1 Comparisons of oil price projections 2025 2035 and 2040 (2011 dollars per
barrel)
As regard the total energy consumption the in table 2 there are four different
projections made by other organizations (INFORUM IHSGI ExxonMobil and
IEA) [37]
Chapter 1 General Introduction
38
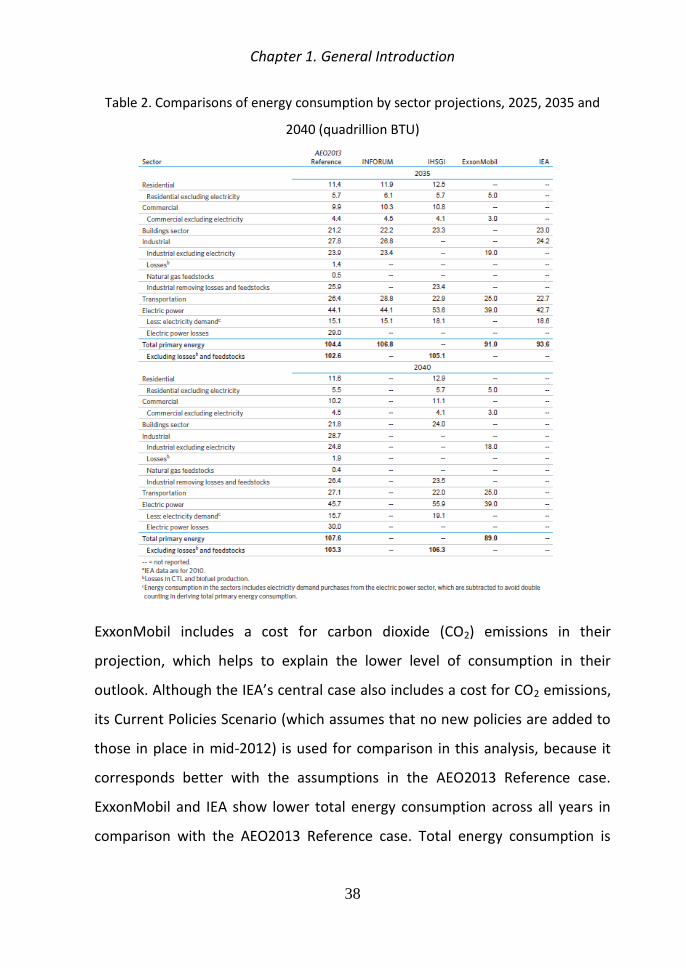
Table 2 Comparisons of energy consumption by sector projections 2025 2035 and
2040 (quadrillion BTU)
ExxonMobil includes a cost for carbon dioxide (CO2) emissions in their
projection which helps to explain the lower level of consumption in their
outlook Although the IEArsquos central case also includes a cost for CO2 emissions
its Current Policies Scenario (which assumes that no new policies are added to
those in place in mid-2012) is used for comparison in this analysis because it
corresponds better with the assumptions in the AEO2013 Reference case
ExxonMobil and IEA show lower total energy consumption across all years in
comparison with the AEO2013 Reference case Total energy consumption is
Chapter 1 General Introduction
39
higher in all years of the IHSGI projection than in the AEO2013 Reference case
but starts from a lower level in 2011
For the transportation sector the difference could be related to vehicle
efficiency as the INFORUM projection for motor gasoline consumption (2
quadrillion Btu lower than AEO2013) is comparable with the EIA projection in
AEO2012 which did not include the efficiency standard for vehicle model years
2017 through 2025
IHSGI projects significantly higher electricity consumption for all sectors than in
the AEO2013 Reference case which helps to explain much of the difference in
total energy consumption between the two projections
Then the projections make possible the investment on research in Fischer ndash
Tropsch synthesis
The process known as Gas to Liquid (GTL) was based on two steps
Steam reforming of natural gas into syngas
Fischer Tropsch synthesis from syngas into synthetic liquid fuels
Recently (2004-2006) the massive growth of GPN (Gross National Product) in
China and India has caused crude oil process to rise continuously and FTS
(including both coal and biomass as feedstock BTL) has become once more an
appealing technology Recent interest in FT technology especially in Europe and
South America is driven by a focus on the gasification of biomass into fuel [38]
(BTL)
Biomass to Liquid via FischerndashTropsch (BTL-FT) synthesis is gaining increasing
interests from academia and industry because of its ability to produce carbon
neutral and environmentally friendly clean fuels
In the BTL-FT process biomass such as woodchips and straw stalk is firstly
converted into biomass-derived syngas (bio-syngas) by gasification
Chapter 1 General Introduction
40
Bio-syngas resulting from biomass gasification contains CO H2 CO2 CH4 and
N2 in various proportions [39 40] Then a cleaning process is applied to
remove impurities from the bio-syngas to produce clean bio-syngas which
meets the FischerndashTropsch synthesis requirements Cleaned bio-syngas is then
conducted into a FischerndashTropsch catalytic reactor to produce green gasoline
diesel and other clean biofuels
Generally there are three main steps in the Biomass to Liquid via Fischerndash
Tropsch (BTL-FT) synthesis [41-43] Biomass is firstly converted into biomass-
derived syngas (bio-syngas) by gasification In a second step a cleaning process
is applied to the bio-syngas in order to remove impurities resulting in clean
bio-syngas which meets the FischerndashTropsch synthesis requirements Finally
the cleaned bio-syngas is then conducted into FischerndashTropsch catalytic reactor
to produce green gasoline diesel and other clean biofuels The flow sheet of
the BTL-FT process is depicted in Figure 110
Fig110 Flow sheet of the Biomass to Liquid via FischerndashTropsch Synthesis (BTL-FT)
process [44]
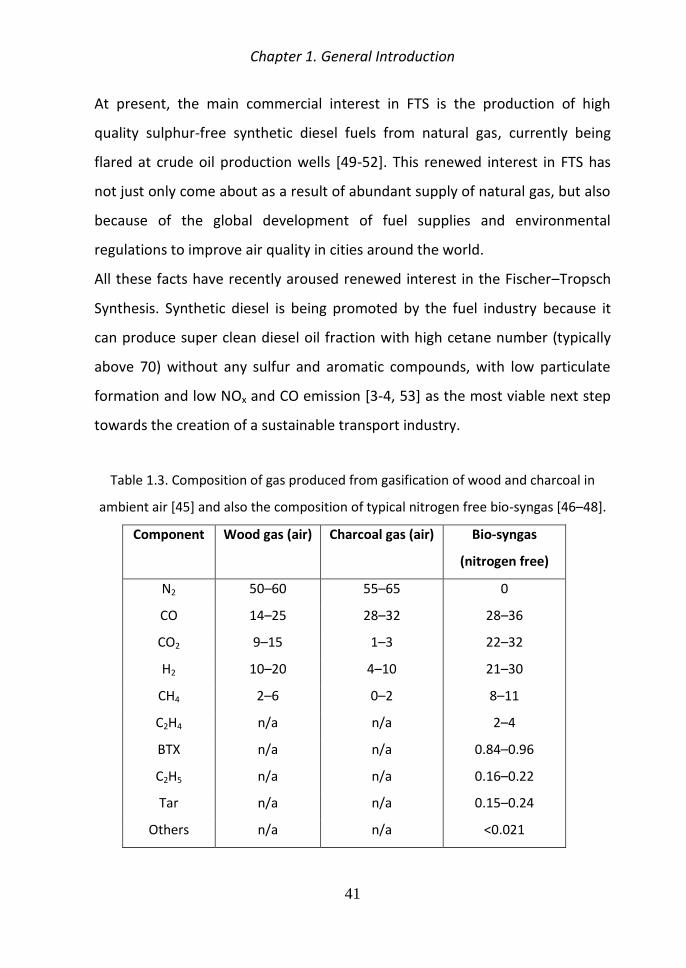
It is difficult to predict the composition of the gas product from a gasifier due
to the complex reactions occurred during the gasification Table 13 shows the
typical composition of gas produced from gasification of wood and charcoal
with low to medium moisture content with ambient air as the gasifying agent
in a downdraft gasifier [45] and composition of bio-syngas from biomass
gasification [46ndash48]
Chapter 1 General Introduction
41
At present the main commercial interest in FTS is the production of high
quality sulphur-free synthetic diesel fuels from natural gas currently being
flared at crude oil production wells [49-52] This renewed interest in FTS has
not just only come about as a result of abundant supply of natural gas but also
because of the global development of fuel supplies and environmental
regulations to improve air quality in cities around the world
All these facts have recently aroused renewed interest in the FischerndashTropsch
Synthesis Synthetic diesel is being promoted by the fuel industry because it
can produce super clean diesel oil fraction with high cetane number (typically
above 70) without any sulfur and aromatic compounds with low particulate
formation and low NOx and CO emission [3-4 53] as the most viable next step
towards the creation of a sustainable transport industry
Table 13 Composition of gas produced from gasification of wood and charcoal in
ambient air [45] and also the composition of typical nitrogen free bio-syngas [46ndash48]
Component Wood gas (air) Charcoal gas (air) Bio-syngas
(nitrogen free)
N2 50ndash60 55ndash65 0
CO 14ndash25 28ndash32 28ndash36
CO2 9ndash15 1ndash3 22ndash32
H2 10ndash20 4ndash10 21ndash30
CH4 2ndash6 0ndash2 8ndash11
C2H4 na na 2ndash4
BTX na na 084ndash096
C2H5 na na 016ndash022
Tar na na 015ndash024
Others na na lt0021
Chapter 1 General Introduction
42
3 Viability of GTL for the gas market
According to Brown [54] between 1950 and 2010 global volumes of GTL
product output capacity had materialized at less than 100000 bd -roughly
equivalent to the output of just one average- sized east European refinery
However the recent confluence of several factors has altered the commercial
viability of the GTL industry suggesting that wide margins and robust revenues
can be earned by converting natural gas into clean-burning liquid fuels and
other high value oil-linked commodities Broadly speaking these factors are
1) Improvements in the lifespan of the catalysts used to derive hydrocarbon
chains from natural gas (methane) and efficiency gains in the Fischer Tropsch
processes
2) The detachment of natural gas markets from oil prices and the subsequent
wide differential between the two prices courtesy of the unconventional gas
boom
3) Long-term global demand trends favouring low-emissions fuels in the
transport sector
Despite these auspicious circumstances however this paper argues that GTL
fuels will have only a limited reach into oil product markets and the transport
sector going forward While downward pressure on natural gas prices and
increasing demand for clean-burning motor fuels have ushered in visions of a
new future of transport fuels (that) will soon go global [55] the transient
conditions that had supported a favourable outlook for the proliferation of GTL
liquid fuels over the period of 2009-12 have more recently shown signs of
deterioration Moreover alternative and less capital-intensive pathways to
natural gas monetization are emerging via small-scale modular GTL plants
whose development has been encouraged by the rapidly increasing supply of
Chapter 1 General Introduction
43
unconventional and associated gas which has necessitated more practical and
localized gas monetization solutions
Commodity prices for transport fuels such as diesel are closely correlated to
crude price movements (see Fig 110) and moreover trade at a premium to
crude benchmarks depending on regional dynamics such as product balances
and cyclical demand conditions GTL products sharing identical physical
characteristics with crude-refined diesel have the potential to exploit not only
the market price differential between gas feedstock and oil prices but in
addition the spread between oil benchmark prices and oil product markets
The confluence of these dynamics leads to significantly wider margin potential
than that experienced by crude-refined alternatives in oil product markets at
least in a context defined by high oil and low gas prices Accordingly the upside
revenue potential of large-capacity GTL builds is dictated by the relatively
straightforward principle that the more capacity dedicated to products trading
at a premium to crude a plant has the higher the plants revenues will be
Fig 111 Correlation between ultra-low sulphur diesel spot prices and Brent crude
Europe offers an ideal destination for GTL-derived diesel A combination of
stringent fuel quality specifications and declining domestic supply supports a
healthy environment for gasoil and diesel imports Moreover the oil product
market is predominately driven by gasoildiesel consumption which accounted
Chapter 1 General Introduction
44
for well over half (56 per cent see Fig 111) of main product demand in 2012
As such the current application and commercialization of GTL diesel in Europe
reflects the potential of GTL diesel to impact global gasoil markets
Fig 112 Europe main oil product demand (2012)
In order to meet supranational carbon emissions targets progressively tighter
EU-wide Fuel Quality Directives have mandated a sharp reduction of sulphur
content in gasoildiesel marketed within the European Union The
specifications for sulphur content in motor fuels (gasoline and diesel) in the
road sector were reduced from 350 parts per million (ppm) in 2000 to just 10
ppm in 2009 The legislation was amended in 2011 to encompass gasoil and
diesel consumed in off-road sectors such as railways and inland navigation
and by 2012 10 ppm gasoil accounted for an estimated 80 per cent of Europe-
wide gasoil demand [54]
The gasoil produced by refineries in Europe has varying physical characteristics
in terms of sulphur content (affecting particulate emissions) cetane index
(influencing ignition quality in combustion engines) and viscosity (affecting
energy content and fuel efficiency) each influencing market value
It has been estimated that FT-GTL should be viable at crude oil prices of about
$20 per barrel The oil price has been well above $70 per barrel (more recently
Chapter 1 General Introduction
45
it has even topped above $100 per barrel) making it a very appealing for
countries that have huge reserves of natural gas but little local market for it
and no major pipeline infrastructure to ship it to larger economies
In Fig 112 it can be seen a geographical representation of the world proved
reserves for 2011
Fig 113 World proved reserves 2011 [37a]
12 Fischer Tropsch GTL Process and Chemistry
According to [56] the basic FT-GTL process consists of three fundamental steps
which require significant supporting infrastructure and a secure feed gas supply
to function effectively (Fig 113)
1 The production of synthesis gas (syngas) The carbon and hydrogen are
initially divided from the methane molecule and reconfigured by steam
reforming andor partial oxidation The syngas produced consists
primarily of carbon monoxide and hydrogen
2 Catalytic Fischer Tropsch synthesis The syngas is processed in Fischer-
Tropsch reactors of various designs depending on technology creating a
wide range of paraffinic hydrocarbons product (synthetic crude or
Chapter 1 General Introduction
46
syncrude) particularly those with long chain molecules (eg those with
as many as 100 carbons in the molecule)
3 Cracking-product workup The syncrude is refined using conventional
refinery cracking processes to produce diesel naphtha and lube oils for
commercial markets [57] By starting with very long chain molecules
the cracking processes can be adjusted to an extent in order to produce
more of the products in demand by the market at any given time In
most applications it is the middle distillate diesel fuel and jet fuels that
represent the highest-value bulk products with lubricants offering high-
margin products for more limited volume markets In modern plants
FT-GTL unit designs and operations tend to be modulated to achieve
desired product distribution and a range of products slates [58]
Fig 114 Large scale FT-GTL projects become more economically robust for the
developer if they involve integrated upstream and downstream components securing
feed gas supplies and additional revenues from NGL and condensate extracted from
the feed gas [56]
Chapter 1 General Introduction
47
The Fischer Tropsch processes are not limited to using gas derived from large
conventional non- associated natural gas as a feedstock coal seam gas
associated gas coal or biomass can all be processed using FT technologies by
changing the catalysts and work conditions (Pressure and temperature) A
secure supply of feed gas from whatever origin is important for the
commercial viability of large-scale FT-GTL plants Integrated upstream and
downstream projects therefore offer GTL project developers lower-risk returns
1) The production of synthesis gas (syngas)
Synthesis gas (ldquosyngasrdquo) is typically produced using either partial oxidation or
steam reforming processes [59] Syngas is an intermediate gas feed for many
different petrochemical processes including a range of GTL alternative
technologies
Partial
Oxidation
CH4 + frac12O2 CO +
2H2 (exothermic)
The key components required for this approach include A combustion chamber operated at high temperatures (1200-1500degC) without catalysts Process designs to impede a competing reaction to syngas formation which involves the decomposition of methane to carbon black (due to high temperature non-catalytic nature of the chemistry) [59]
Steam
Reforming
CH4 + H2O CO + 3H2 (endothermic)
Steam reforming is usually carried out in the presence of catalyst ndasheg nickel dispersed in alumina in operating conditions involving temperatures of 850-940degC and pressure of about 3MPa The process is typically conducted in tubular packed reactors with heat recovery from flue gas used to pre-
Chapter 1 General Introduction
48
heat the feed gas or to raise steam in waste heat boilers Several well-established engineering companies offer their own variants of this process
Other possible reactions are
CO+ H2O CO2 + H2
CH4+ CO2 2CO + 2H2
2) Fischer-Tropsch synthesis
According to [55] Fischer-Tropsch synthesis is one of a several technologies to
polymerise the carbon and hydrogen components into long-chain molecules
CO + 2H2 -CH2- + H2O (very exothermic)
Which in practice operates more typically as
2CO (gas) + H2 (gas) (-CH2-)n (liquid) + CO2 (gas) + H2O
The process involves some carbon dioxide emission and watersteam
production along with the hydrocarbon liquid production
The typical FT reactions compete with the methanation (reverse of steam
reforming) reaction (and reactions that lead to the production of propane and
butane (LPG) which are also highly exothermic
CO + 3H2 CH4 + H2O
In order to promote FT reaction in preference to methanation (or LPG
reactions) the synthesis is run at low temperatures 220-350degC pressure 2-3
MPa with carefully selected catalysts (ie commonly cobalt) in reactors that
encourage the growth of long-chain hydrocarbon molecules Several
companies hold patents associated with XTL catalysts process vessels and
process sequences (eg Conoco Phillips CompactGTL ExxonMobil Rentech
Sasol Shell Syntroleum and others) however it is only Sasol and Shell that
have built large-scale commercial plants (iegt5000 barrelsday of GTL product)
Chapter 1 General Introduction
49
rather than pilot-scale or demonstration plants The industry therefore remains
in its infancy and the many patents held by relatively few companies act as a
costly barrier to entry for resource-rich gas companies and countries wishing to
use GTL as an alternative means of monetizing their gas
There are two major categories of natural gas-based FT process technology the
high-temperature and the low-temperature types
HTFT (High-Temperature Fischer-Tropsch) In HTFT because of the process
conditions and the catalysts involved the syncrude produced includes a high
percentages of short chain (ie lt10 carbon atoms) with significant amounts of
propane and butane mixed with olefins (eg propylene and butylene) These
short-chain hydrocarbons gases are typically extracted from the tail gas stream
utilizing cryogenic separation The resultant lean tail gas is recycled and mixed
with additional lean feed gas for further syngas production [60] The high-
temperature (HT) iron catalysts-based FT GTL process produces fuels such as
gasoline and diesel that are closer to those produced from conventional oil
refining The resultant GTL fuels are sulphur-free but contain some aromatics
[61] Typical process operation conditions for HTFT are temperatures of
approximately 320degC and pressures of approximately 25MPa Conversion in
HTFT can begt85 efficient [62] but not all the products are readily usable or
capable of producing high-quality transport fuels HTFT processes tend to be
conducted in either circulating fluidized bed reactors or fluidized bed reactors
[63]
LTFT (Low-Temperature Fischer-Tropsch) LTFT involves the use of low-
temperature (LT) cobalt-catalyst-based processes either in slurry-phase
bubble-column reactors (eg Sasol) or in multi-tubular fixed bed reactors (eg
Shell) LTFT produces a synthetic fraction of diesel (GTL diesel) that is virtually
free of sulphur and aromatics Typical process operation conditions for LTFT are
Chapter 1 General Introduction
50
temperatures of approximately 220degC to 240degC and pressures of approximately
20 to 25 MPa Conversion in LTFT is typically only about 60 with recycle or
the reactors operating in series to limit catalyst deactivation [62]
The primary focus of most large-scale FT technologies in current market
conditions is to produce high-quality low-emissions GTL diesel jet fuel and
naphtha (for petrochemical feedstock or gasoline blending)
3) Cracking ndash product workup
From [56] FT GTL plants can be configured to produce a wide range of
products from lubricating base oils and waxes through to petrochemical
naphtha and specialty chemicals Most of the already developed and planned
plants target the production of diesel fuels (C14-C20) together with some
kerosenejet fuel (C10-C13) naphtha (C5-C10) lubricants (gtC50) and a little LPG
(C3-C4)- By adjusting operating conditions in the Fischer Tropsch reactor the
mix of products can be altered This enables FT GTL products to be produced in
quantities that enable them to target the high-value product markets of
petroleum products produced by conventional oil refineries
However the yield pattern from a typical FT GTL plant is significantly different
to that rom a catalytic cracking crude oil refinery (Fig 114) Typically the
diesel yield of FT GTL plant is around 70 much higher than for crude oil
refineries which is typically some 40 [64]
From Fig 114 the products derived from upgrading syncrude produced by FT-
GTL differ significantly from those produced by refining barrel of crude oil
Notably FT GTL produces more high-value zero-sulphur products especially
middle distillates On the other hand refining crude oil particularly heavy oil
produces substantial quantities of low-value fuel oil ie more than prevailing
markets can consume Source modified from [65]
Chapter 1 General Introduction
51
Most oil refineries yield some low-value fuel oil the yield depending on the
quality of the fuel processed and the type and capacity of the refineryrsquos fuel-oil
conversion units By contrast the FT GTL plants are configured to yield only
higher-value (relative to crude oil) light and middle distillate products From a
plant with existing technology the yield of middle distillates (gasoildiesel and
kerosene) is nearly a third more of the total product slate than that from a
typical oil refinery [66]
As predicted a decade ago [67] globally diesel demand is growing rapidly at
some 3 a year more quickly than other refinery products Against this
backdrop refiners face significant challenges to meet diesel demand and
quality in the future as crude oil supply becomes heavier and sourer [68]
Fig 115 Refinery Volume Yields versus FT GTL Yields
From [56] for FT-GTL to be commercial at oil prices of less than about
40$barrel plant capital costs operating costs and feed gas costs all have to be
substantially lower on a unit basis than large-scale plants built in recent years
have been able to deliver If the unit capital cost of an FT-GTL plant is close to
100000$barrelday the operating cost of that plant is close to 20$barrel of
Chapter 1 General Introduction
52
product and the feed gas costs in the vicinity of 5$MMBtu the liquid products
would cost in the vicinity of 100$barrel and the economics of such as a plant
do not look so inviting in 2012 market conditions The industry has to achieve
lower plant and feed gas costs to be economically attractive
Fischer- Tropsch Synthesis Opportunities and challenges
GTL technologies offer the potential to reduce global dependency on crude-oil
derived transportation fuels They also offer substantial opportunities for the
owners of stranded gas to diversify the markets into which they deliver their
gas-derived liquid products particularly targeting the large and rapidly growing
global middle distillate markets (See Fig 116)
However the technologies are complex costly and tightly held by a few
companies holding patents for the key process steps which present significant
barriers to entry for building large-scale plants This also renders the building of
large-scale plants challenging for the gas resource holders in terms of capital
costs access to technology and long-term transfer of GTL technologies
At the current time Fischer Tropsch technologies dominate GTL applications for
large scale-plants Technology breakthroughs are required if methane-to-
gasoline or methane-to-olefin plants are to displace traditional refinery and
petrochemical routes to those products On the other hand dimethyl-ether
(DME) has a growing market in Asia particularly in China which is likely to
expand if the one-step process avoiding the production route via methanol is
successfully scaled up as planned and transportation fuel markets are
developed for DME
Chapter 1 General Introduction
53
Fig 116 The GTL Industry Opportunities and Challenges
References
[1] Michael Talmadge Mary Biddy and Abhijit Dutta Syngas Upgrading to Hydrocarbon Fuels Technology Pathway National Renewable Energy Laboratory Technical Report NRELTP-5100-58052 PNNL-22323 March 2013 httpwwwostigovbridge [2] C Pirola C Bianchi A Di Michele P Diodati S Vitali V Ragaini Catal Lett 131 294-304 (2009) [3] M S Hadnadev-Kostic J Tatjana T Vulic R Marinkovic-Neducin A D Nikolic B Jovic Journal of Serbian Chemical Society 76 (12) (2011) 1661ndash1671 [4]E Lira C Loacutepez F Oropeza M Bartolini J Alvarez M Goldwasser F Loacutepez J Lamonier J Peacuterez Journal of Molecular Catalysis A Chemical 281 (2008) 146ndash153 [5] Qinghong Zhang Jincan Kang and Ye Wang ChemCatChem 2 (2010) 1030 ndash 1058 [6] C Perego M Ricci Catalysis Science amp Technology (2012) 2 1776ndash1786 [7] GWHuber SIborra ACorma Chemical Reviews 106 (2006) 4044
Chapter 1 General Introduction
54
[8] PL Spath and DC Dayton Preliminary Screening - Technical and Economic Assessment of Synthesis Gas to Fuels and Chemicals with Emphasis on the Potential for Biomass-Derived Syngas NRELTP-510-34929 December 2003 [9] F Fischer and HTropsch BrennstChem 4 (1923) 276 [10] A Martinez C Lopez F Marquez IJ Diaz Catalysis 220 (2003) 486 [11] John L Casci C Martin Lok Mervyn D Shannon Catalysis Today 145 (2009) 38ndash44 [12] MEDry in Enciclopedia of Catalysis ITHorvarth Ed JWileyampSons New York (2003) 247 [13] Fischer-Tropsch Technology in Studies in Surface Science and Catalysis Elsevier New York (2004) [14] GPVaan Deer Laan AACMBeenackers Catalysis Reviews-SciEng 41(3amp4) (1999) 255 [15] HSchulz Applied Catal A 186 (1999) 3 [16] GP van der Laan AACMBeenackers Applied Catal A 193 (2000) 39 [17] RJOrsquoBrien LXu SBao ARaje BHDavis Applied Catalysis A general 196 (2000) 173 [18] V Roberto Calderone N Raveendran Shiju Daniel Curulla Ferreacute and Gadi Rothenberg Green Chemistry 2011 13 1950ndash1959 [19] E D Smit and B MWeckhuysen Chem Soc Rev 2008 37 2758ndash 2781 [20] Qinghong Z Weiping D Ye W Review Recent advances in understanding the key catalyst factors for Fischer-Tropsch synthesis J Ener Chem 2013 2227ndash38
[21] AY Khodakov WChu P Fongarland Chem Rev 107 (2007) 1692 [22] BHDavis Catal Today 84 (2003) 83 [23] GWHuber SIborra ACorma ChemRev 106 (2006) 4044 [24] J Xu CHBartholomew J Phys Chem B 109 (2005) 2392 [25] HB Zhang GL Schrader JCatal 95 (1985) 325 [26] ES Lox GB Marin E de Graeve P Bussiere Appl Catal A 40 (1988) 197 [27] PSabatier and JDSenderens CRHebdSeance AcadSci 134 514 680 (1902) [28] AMittash AdvCatal 2 (1950) 81 [29] EHoudry WFBurt AEPew WAPeters Pet Refiner 17 (1938) 574 [30] H Pichler AdvCatal 4 (1952) 271 [31] MEDry Chemtech 12 (1982) 744 [32] RBAnderson ACS SympSer 222 (1983) 389 [33] GNatta in ldquoCatalysisrdquo (PH Emmett ed) Vol3 p349 Van Nostrand-Reinhold Priceton New Jersey 1955 [34] GNatta UColombo IPasquon in ldquoCatalysisrdquo (PH Emmet Ed) Vol5 p131 Van Nostrand-Reinhold Princeton New Jersey 1957
Chapter 1 General Introduction
55
[35] RBAnderson Fuel 41 (1962) 295 [36] MJ Baird RRSchehl WPHaynes and JTCobb Ind Eng Chem Prod Res Dev 19 (1980) 175 [37] EIA Annual energy outlook 2013 Available at httpwwweiagovforecastsaeopdf0383(2013)pdf accessed on 16 august 2013 [37a] US Energy Information Administration Available at httpwwweiagovcountriesindexcfmview=reserves accesed on 16 august 2013 [38] MJ Prins KJ Ptasinski FJJG Janssen Fuel Process Technol 86 (2005) 375 [39] Klass DL Biomass for Renewable Energy Fuels and Chemicals Academic Press San Diego CA USA 1998 [40]Beenackers AACM Swaaij WPM Thermochemical Processing of Biomass Butterworth London UK 1984 [41] Demirbas A Energy Educ Sci Technol 17 (2006) 27ndash63 [42] Tijmensen MJA Faaij APC Hamelinck CN van Hardeveld MRM Biomass Bioenergy 23 (2002) 129ndash152 [43]Hamelinck CN Faaij APC den Uil H Boerrigter H Energy 29 (2004) 1743ndash1771 [44] J Hu F Yu Y Lu Catalysts 2 (2012) 303-326 [45] Stassen HEM Knoef HAM Biomass Technology Group University of Twente Enschede The Netherlands 1993 [46] Demirbas A Prog Energy Combust Sci 33 (2007)1ndash18 [47] Demirbas A Energy Sources A 29 (2007) 1507ndash1512 [48] Demirbas A Energy Sources A 30 (2008) 924ndash931 [49] MJPrins KJPtasinski FJJGJanssen Fuel Process Technol 86 (2005) 375 [50] CLIandoli SKjelstrup EnergyampFuels 21 (2007) 2317 [51] JJacometti AEkvall Shell in the Middle East 17 (2002) 1 [52] GCoupe Step on the gas in The Engineer 6 (2004) [53] T Fu Y Jiang J Lv Z Li Fuel Process Technol 110 (2013) 141ndash149 [54] C Brown The Oxford Institute for Energy Studies May 2013 ISBN 978-1-907555-74-9 Available on httpwwwoxfordenergyorgwpcmswp-contentuploads201305WPM-50pdf [55]K MacKenzie Financial Times 30 April 2013 httpftalphavilleftcom201304301473572where-are-all-those-natural-gas-fleet-conversions [56] D Wood C Nwaoha B Towler Journal of natural gas science and engineering 9 (2012) 196-208
Chapter 1 General Introduction
56
[57] Agee K Fundamentals of gas to liquids 2nd ed London Petroleum economist 29 (2005) 30-31 [58] Rahmin II Oil and gas Journal (2005) [59]Rahmin II Gas-to-liquid technologies Recent advances Economics Prospects 26th IAEE Annual International Conference June 2003 Prague Pp 1-36 [60] Minnie R et a 2005 Where it all began In Fundamentals of Gas to Liquids second ed Petroleum Economist London pp 27e29 (Chapter 28) [61] Waddacor M 2005 Converting gas into ultra-clean diesel in three steps In Fundamentals of Gas to Liquids second ed Petroleum Economist London pp 46-49 (Chapter 41) [62] De Klerk A 2012 Gas-to-liquids conversion In Natural Gas Conversion Technologies Workshop of ARPA-E US Department of Energy Houston TX 13 January 2012 [63] Velasco JA Lopez L Velasquez M Boutonnet M Cabrera S Jaras S 2010 Gas to liquids a technology for natural gas industrialization in Bolivia Journal of Natural Gas Science and Engineering 2 (5) 222e228 [64] Pytte T 2005 GTL diesel the way forward In Fundamentals of Gas to Liquids second ed Petroleum Economist London pp 32e35 (Chapter 31) [65] Fleisch TH Sills R Briscoe M Freide JF 2003 GTL-FT in the Emerging Gas Economy Fundamentals of Gas to Liquids Petroleum Economist p 39e41 [66] Corke M 2005 Securing a market In Fundamentals of Gas to Liquids second ed Petroleum Economist London pp 36e38 (Chapter 32) [67] Cherrillo RA Clark RH Virrels IG 2003 Shell Gas to Liquids in the Context of a Future Fuel Strategy e Technical Marketing Aspects 9th Diesel Engine Emissions Reduction Workshop Newport RI 24e28 Aug 2003 [68] Wood DA 2007 Consequences of a heavier and sourer barrel Petroleum Review April ed 30e32
57
Chapter 2 Chemistry of Fischer-Tropsch Synthesis
The FischerndashTropsch (FT) reaction is a heterogeneous catalytic reaction that
converts synthesis gas that is a mixture of carbon monoxide (CO) and
hydrogen (H2) into mainly linear hydrocarbons in the range C1 to C100 It is a
surface polymerization reaction that uses monomers formed by hydrogenation
of adsorbed CO in order to produce hydrocarbons and oxygenated products
with a broad range of chain length and functionality
The chemistry of the process can be described by the set of irreversible and
equilibrium reactions
According to Glasser et al [1] the FischerndashTropsch (FT) reaction mechanism is
still an issue of contention [2 3] Many apparently different mechanisms have
been proposed but common to them all is the concept that a stepwise chain
growth process is involved This is supported by the fact that the carbon
number product distributions calculated on probabilities of chain growth match
the experimentally observed results obtained in different reactor types and
sizes over widely varying process conditions with different catalysts [1]
There are some important aspects related to the FTS that will be discuss in this
chapter to better understand the chemistry of this process
1) FT thermodynamics
2) FT reaction mechanism
3) FT products selectivity
4) FT kinetics
5) Influence of FT process conditions
Chapter 2 Chemistry of Fischer Tropsch Synthesis
58
21 FT Thermodynamics
The Fischer-Tropsch Synthesis is a highly exothermic reaction [4]
n CO + (2n +1) H2 CnH2n+2 + n H2O Hdeg - 40 kcalmol (1)
n CO + 2n H2 CnH2n + n H2O Hdeg - 35 kcalmol (2)
n CO + 2n H2 CnH2n+1 OH + (n-1) H2O Hdeg - 35 kcalmol (3)
Thermodynamically the formation of methane and other hydrocarbons
is energetically favourable that means negative Gibbs energy values for
reaction (1)-(3)
In figure 21 standard Gibbs energy variation for the production of
hydrocarbons and alcohols is reported as a function of temperature
0
80
60
40
20
- 20
- 40
- 60
- 80
- 100
- 120
- 140
500 1000
Temperature K
G
degn
kJ
mol
of
CO
CH3OH
C2H5OH
CH4
C2H6
C2H4
C8H16
C4H8
Figure 21 Standard Gibbs energy of some FTS products [5]
From the diagram reported in figure 21 it can be deduced that methane
formation is highly favoured over that of the alcohols olefins and
hydrocarbons of heavier molecular weight In Fig 21 to keep all of the curves
on the same scale the enthalpy and free energy changes are divided by the
number of carbons atoms in the product Thus the equilibrium constant for
the reaction is given by RTnGnK exp 0
Chapter 2 Chemistry of Fischer Tropsch Synthesis
59
On the basis of thermodynamics a vast variety of molecules can be produced
in synthesis reaction up to 400degC and for some up to 500degC particularly at
elevated pressures including acetaldehyde and higher aldehydes ketones
esters Usually a broad spectrum of types of molecules carbon numbers and
carbon-chains structures is produced and the distribution of molecules
depends on the selectivity of the catalyst employed Generally the reaction
products are not in thermodynamic equilibrium with other product molecules
or reactants
Summarizing it is important to highlight some important aspects of the FT
thermodynamics
It is energetically possible to produce a vast array of hydrocarbons and organic
molecules by the hydrogenation of CO and related process such as the H2 + CO2
and the H2O + 3 CO reactions Most of these reactions are highly exothermic
A variety of reactions of synthesis products are thermodynamically possible
such as dehydration of alcohols hydrogenation of olefins hydrogenolysis of
paraffins and a number of isomerization reactions
On an energetic basis olefins and alcohols can be ldquoincorporatedrdquo into synthesis
reactions to produce higher molecular weight hydrocarbons in any amount
Paraffins element carbon or carbidic carbon can be ldquoincorporatedrdquo into
synthesis reactions to only a limited extent that is part of the carbon of the
hydrocarbon must come from H2 + CO
22 FT Reaction Mechanism
According to [6] FT synthesis follows the polymerization mechanism It is
generally accepted that CO undergoes dissociative or hydrogen-assisted
dissociative chemisorption on the surface of Ru Co or Fe metal or metal
Chapter 2 Chemistry of Fischer Tropsch Synthesis
60
carbide nanoparticles forming CHx (x = 0minus3) intermediates as the monomers
for polymerization The coupling between CHx monomers leads to chain
growth providing CnHm intermediates CnHm intermediates with different
carbon numbers can then undergo hydrogenation or dehydrogenation to
afford paraffins or olefins as the final products An early work pointed out that
the coupling between methylene (CH2) groups mainly accounted for the chain
growth but recent theoretical studies suggested that the situation was more
complicated [7-12] Depending on the identity and the structure of the surface
concerned the monomeric CHx species for polymerization may be different
The calculation of energy barriers suggests that the couplings of (CH+CH)
(C+CH) (C+CH2) or (CHx+HCO) may all be possible [7-12]
Since its discovery many efforts have been made to identify the surface
species that lead to chain initiation and chain growth The FT reaction
mechanism is still an issue of contention
There are some mechanisms like the mechanism proposed by Fischer in 1926
(lsquocarbidersquo theory) but it has a problem he did not explain the production of
relatively large amounts of oxygenated products ie alcohols
According to [13] elementary steps of FTS can be grouped into few basic sets
including
(1) reactant (CO and H2) adsorption
(2) CO activation (or chain initiation)
(3) chain propagation and
(4) chain termination (product formation)
Fig 22 shows possible CO activation steps in the carbide (also referred to as
the alkyl or methylene) and the CO-insertion mechanisms For the classical
carbide mechanism the CO activation step consists of a direct CO dissociation
(ie the C O bond is severed before C is hydrogenated) whereas in the CO-
Chapter 2 Chemistry of Fischer Tropsch Synthesis
61
insertion pathway CO is first hydrogenated and only then is the C O bond
broken to give the chain starter (CH3S) Newer modification of the carbide
mechanism assumes that hydrogen assists in the C O bond scission The
primary difference between the two mechanisms is the type of species being
inserted into the growing chain CHx for the carbide (most often CH2) and
adsorbed CO for the CO-insertion mechanism Storsaeligter et al [14] compared
versions of the two mechanismsndash carbide (including direct and H-assisted CO
dissociation) and CO-insertion ndash using the UBI-QEP (unity bond index ndash
quadratic exponential potential) method [15] and micro-kinetic modeling ofC1
and C2 species formation Their results showed that the chosen CO-insertion
pathway had a lower activation barrier compared to both direct and H-assisted
CO dissociation mechanisms that were utilized Based on these findings they
suggested that the CO-insertion mechanism is likely the main mechanism of
FTS
Fig 22 Examples of CO activation pathways (a) direct CO dissociation (carbide
mechanism) and (b) H-assisted CO dissociation (carbide mechanism) (c) CO hydrogenation (CO-insertion mechanism) [13]
Chapter 2 Chemistry of Fischer Tropsch Synthesis
62
The following Figure (23) [16] shows another representation of the chain
initiation growth and termination deeply find in literature
Chain Initiation
CO C O C O
M M M
+
C
M
H2
CH2
MCH3OH
H2O
INITIATION AND C1 COMPOUNDS
M
+ C
GRAPHITE
OHH
H2
H2
H2CH4
Chain Growth
Chain Termination
Fig 23 Different steps of the reaction mechanism in FTS
Fig 24 shows a simplified scheme for the formation of chain starters and
incorporation into growing chains The CH3 groups formed as a precursor to
methane are assumed to act as chain growth centres Addition of a hydrogen
atom produces methane while insertion of a CH2 group into the metal-carbon
Chapter 2 Chemistry of Fischer Tropsch Synthesis
63
bond of a CH3 group produces an ethyl group and continuation of this type of
reaction gives rise to a spectrum of adsorbed alkyl groups
C CH2CH
H H
CH3H
CH2
R
chain starter
chain growth
(incorporation)
CH3CH3
CH2
H
CH4
R
Fig 24 Simplified kinetic scheme of the successive hydrogenation of surface carbon
yielding chain starters and incorporation into growing chains
The oxygen released by CO dissociation is removed from the catalyst as either
H2O or CO2
As far as hydrogenation process is concerned there is still controversy on the
reaction mechanism first of all it is uncertain if the monomer formation
proceeds via hydrogenation of dissociated or undissociated CO Moreover
methyne methylene and methyl groups are assumed to be in equilibrium by
some authors on the basis of studies with metal clusters containing these as
ligands while others postulate that the hydrogenation of surface carbon and of
CHx species is an irreversible reaction
The nature of primary FT products reflects the nature of the surface bonded
intermediates from which they originate Primary hydrocarbon FT products are
preferentially straight chain terminal olefins and straight chain paraffins The
formation of primary paraffin molecule is represented as
Chapter 2 Chemistry of Fischer Tropsch Synthesis
64
R-CH2-CH2
HR-CH2-CH3
Terminally bonded (alpha) alkyl species on the catalyst surface can be
considered the most common intermediates
Olefin formation is represented as dissociative desorption from the alkyl
species (-elimination)
R-CH2-CH2R-CH=CH2 + H
The ratio probabilities of primary desorption as a paraffin or as an olefin is
commonly 025 That means that the reaction of desorption as a paraffin is
much less probable than the reaction of desorption as an olefin It is suggested
that the chain propagation is favoured against chain termination because of
the principle of lsquoselective inhibitionrsquo ie termination reaction are more
inhibited than propagation reaction by steric hindrance This effect is more
pronounced with paraffin than with olefin formation In fact while paraffin
desorption requiring the reaction between alkyl and H involves two metal
sites olefin desorption need an intermediate ie a transition state with and
bonding at the same metal site
R-CH2-CH2R-CH=CH2
HM M
R-CH=CH2 H
M
+
Chapter 2 Chemistry of Fischer Tropsch Synthesis
65
In both cases however this might not be easily accessible under the condition
of strong competitive chemisorption and strong spatial constraints
Chain termination can also occur by CO insertion into surface alkyls a step that
leads to the formation of predominantly primary alcohols [16]
23 FT Products Selectivity
The products from the FT on Co Fe and Ru show the following characteristics
[17]
1) the carbon-number distributions for hydrocarbons gives the highest
concentration for C1 and decrease monotonically for higher carbons
number although around C3-C4 often a local maximum is observed
2) Monomethyl-substituted hydrocarbons are present in moderate
amounts whereas dimethyl products are present in significantly smaller
amounts than monomethyl None of these branched products contain
quaternary carbons atom on Co Fe and Ru
3) Olefins from iron catalysts exceed 50 of the hydrocarbon products at
low carbon numbers and more than 60 of these -olefins The ethane
selectivity is low in comparison to propene The olefin content decrease
asymptotically to zero with increasing carbon number on Co Ru and Fe
catalysts
4) A change in chain growth parameter in the distribution is only observed
for linear paraffins and not for olefins
5) Yields of alcohols are maximal at C2 and decrease with carbon number
Low yields of methanol are probably the result of thermodynamic
limitations
Chapter 2 Chemistry of Fischer Tropsch Synthesis
66
Investigations of the carbon number spectrum based on the assumption of a
stepwise chain mechanism were carried out in considerable detail by several
authors
Herrington [18] described the distribution of paraffins wax using individual
chain termination probabilities for each chain size and he found that the
probability of chain growth in FT synthesis over a cobalt catalyst did not change
much with the chain length of the hydrocarbon
Anderson investigated the spectrum of a number of different catalysts The
plot of log Wnn against carbon number gave straight line over a fairly large
carbon number range (Wn is the mass fraction and n the carbon number) This
indicated again that the probability of chain growth was fairly constant [18]
Schulz modified and applied to the FT product spectrum the Flory equation
dealing with the product distribution in a polymerization process As pointed
out by Anderson the Schulz-Flory treatment was no different from the earlier
treatment and led to the equation henceforth referred as the Anderson-
Schulz-Flory (ASF) model
Wnn = (1- ) 2
n-1 (1)
where n is the number of carbon atoms in the product Wn is the weight
fraction of product containing n carbon atoms is the chain growth
propagation probability expressed by the equation
= rp (rp + rt) (2)
where rp is the propagation rate constant and rt is the termination rate
constant
The value is independent of carbon number it is estimated by a least-
squares linear regression of the logarithmic form of equation (3) the slope and
intercept both yielding
ln (Wnn) = ln (1-)2 + (n-1) ln (3)
Chapter 2 Chemistry of Fischer Tropsch Synthesis
67
Different factors have an influence on the alpha parameter such as process
conditions type of catalyst and chemical promoters [19 20] The ASF product
distribution as a function of α is depicted in Figure 25
The ASF equation did not distinguish between different product types In
practice a multicomponent product mixture is formed According to the ASF
model the maximum selectivity toward C2minusC4 olefins is achieved with an alpha
value between 04 and 05 One of the most efficient ways of shifting product
selectivity to low alpha values is by increasing reaction temperature However
a decrease on the chain growth probability results in an increase of methane
selectivity as indicated by the ASF product distribution This effect was long
considered a major restriction for the industrial application of the direct
conversion of syngas into lower olefins via the FischerminusTropsch synthesis [21
22] Negative deviations of the ASF model for methane selectivity have been
observed for iron-based catalysts [23 24] Schwab et al [23] proposed that Fe
catalysts possess different catalytic sites some in charge of CminusC coupling for
the growth of the carbon chain and others responsible for methane formation
Fig 25 AndersonminusSchulzminusFlory (ASF) model for the prediction of product distribution
Deviations from ASF Distribution Anderson-Schulz-Flory Distribution is a well-
accepted model for describing product selectivity in FT synthesis especially for
Chapter 2 Chemistry of Fischer Tropsch Synthesis
68
its simplicity nevertheless significant deviations have been noticed and
reported in literature
1) Methane selectivity is in general higher than predicted theoretically by ASF
kinetics Several mechanisms have been postulated to explain these
experimental data [25-26]
2) Anomalies of Ethane and Ethene The maximum C2 selectivity is expected to
be about 30 wt while in practice the maximum found is only about 18 wt It
is commonly observed for iron as well as for cobalt and ruthenium catalysts
that the C2 selectivity is lower than the C1 and C3 selectivity [17]
3) Change in Chain Growth Parameter is defined by ASF model as a
parameter independent of the product carbon number n nevertheless it has
been observed that at a carbon number of about 10 the slope of the
semilogarithmic mole fractions of hydrocarbons against carbon number
increases This phenomenon has been described on iron cobalt and ruthenium
catalysts [27] Suggestions for the increased chain growth parameter or two
probabilities of chain growth are the occurrence of different catalytic sites [28]
or the existence of different chain termination reactions [25] Several attempts
to model hydrocarbon distribution with two different values of have been
reported However the assumption of multiple catalytic sites cannot explain
the decrease of the olefin-to-paraffin ratio with increasing chain length
decreasing space velocity and increasing H2CO ratios in the reactor Kuipers et
al [29] stated that the occurrence of secondary reactions gives the most
reasonable explanation for the deviations from the ASF distribution
24 FT kinetics According to Glasser et al [1] kinetic models of FTS on cobalt iron and
ruthenium catalysts have received considerable attention [30-35] from
Chapter 2 Chemistry of Fischer Tropsch Synthesis
69
researchers in the past but not recently The major problem in describing the
FT reaction kinetics is the apparent complexity of the reaction mechanism and
the large number of species involved When one looks at the kinetic studies in
the literature one finds that there are a variety of rate expressions as well as a
wide range of activation energies for both Co and Fe catalysts This raises
questions about which of these data kinetic parameters and rate expressions
can be relied on for estimating reaction rates andor conducting preliminary
reactor design [36] This strongly suggests that the complex FT reaction
behavior may not be described efficiently by kinetics alone This point is
addressed at a later stage
However the proposed mechanism used a variety of surface species and
different elementary reaction steps resulting in empirical power-law
expressions for the kinetics However also Langmuir-Hinshelwood-Hougen-
Watson (LHHW) and Eley-Rideal type of rate equations have been applied
based on a reaction mechanism for the hydrocarbon-forming reactions In most
cases the rate-determining step was assumed to be the formation of the
monomer These rate expressions for the consumption of synthesis gas mainly
differ in the monomerrsquos nature and in the adsorption of CO H2 and products
(H2O and CO2) on the catalyst surface Ideally the development of kinetic rate
expressions should be based on each possible rate determining process in a
well-defined mechanistic scheme in the hydrocarbon forming reactions Kinetic
studies of the consumption of synthesis gas on cobalt and in particular way
iron catalysts will be discussed in detail in this chapter Kinetic models which
describe the rate of formation of products and the water gas shift reaction will
not be discussed here their studies are reported in [17 37]
1) Overall conversion of synthesis gas
Chapter 2 Chemistry of Fischer Tropsch Synthesis
70
The kinetic rate equations presented for the synthesis-gas consumption do not
present a uniform picture In general the FT synthesis is simplified as a
combination of the FT reaction and the water-gas-shift reaction
CO + (1 + m2n) H2 1n CnHm + H2O (RFT) (4)
CO + H2O CO2 + H2 (RWGS) (5)
where n is the average carbon number and m is the average number of
hydrogen atoms of the hydrocarbon products Water is a primary product of
the FT reaction and CO2 can be produced by the water-gas-shift reaction
(WGS) Iron based catalysts show a high WGS activity unlike Co and Ru based
catalysts That is reflected by the different kinetic expressions
Kinetic equation can be based on the overall synthesis gas consumption (-
RH2+CO = -RCO ndash RH2) which is independent of the WGS equilibrium or based on
CO consumption to hydrocarbon product (RFT = -RCO ndash RWGS) The rate of
synthesis gas consumption only differs from the FT reaction rate by reaction
stoichiometry -RH2+CO = (2 + m2n) RFT The kinetic rate equations presented for
the synthesis gas consumption do not present a uniform picture Table 21 [17]
gives an overview In general catalyst composition as well as reaction
conditions determine the numerical values of the intrinsic rate parameter
Moreover the rate equations are not identical thus k can be decomposed of
different combinations of kinetic and adsorption constant There is
experimental evidence that the FT activity of Fe and Co depends on the
preparation method metal loading of the catalyst and catalyst support
Table 21 Reaction rate equation for overall synthesis gas consumption rate
proposed in Ref [17]
Chapter 2 Chemistry of Fischer Tropsch Synthesis
71
Kinetic
expression
type
Kinetic expression
(a) 2HkP
(b) b
CO
a
H PkP2
(c) OHCO
COH
aPP
PkP
2
2
(d) OHHCO
COH
aPPP
PkP
22
2
2
(e) 2
2
2
2
1 HCO
COH
PaP
PkP
(f) 2
2
COCO
COH
aPP
PkP
(g) 22
2
COOHCO
COH
bPaPP
PkP
(h) 22121
2121
2
2
1 HCO
HCO
bPaP
PkP
(i) 221
21
2
2
1 HCO
HCO
bPaP
PkP
(h) 21
2
CO
HCO
bP
PkP
25 Influence of FT process conditions
A Temperature
Chapter 2 Chemistry of Fischer Tropsch Synthesis
72
The influence of temperature on the selectivity is considerable for all FT
catalysts As the operating temperature is increased the product selectivity
shifts to products with a lower carbon number on iron ruthenium and cobalt
catalysts Increasing the temperature the CO conversion increases but the
WGS reaction increases too mainly with iron based catalysts
B Partial pressure of H2 and CO
Most studies show that the product selectivity shifts to heavier products and to
more oxygenates while increasing total pressure Increasing H2CO ratios in the
reactor results in lighter hydrocarbons and lower olefin content Donnelly and
Satterfield [38] observed a decreased of the olefin to paraffin ratio from 6 to 1
by increasing the H2CO ratio from 03 to 4 Sufficiently high CO pressures
inhibit secondary reactions ie olefin isomerization hydroformilation
hydrogenation and oligomerization
C Space Velocity
The influence of space velocity of the synthesis gas (residence time) on the
selectivity has been investigated The increase of the olefin to paraffin ratio
with increasing space velocity (thus a decrease of the conversion) was
observed The selectivity to methane and olefins decreases with a decrease of
the space velocity whereas the selectivity toward paraffins remains
unchanged These findings can be ascribed by an enhancement of secondary
reactions as the residence time and the concentration of reactive -olefins
increase within bed interstices and catalyst pellets [17]
D Time-on-stream
It is known that catalyst deactivation may occur at reaction conditions and that
may affect the activity and selectivity of a catalytic system An increase of the
Chapter 2 Chemistry of Fischer Tropsch Synthesis
73
methane selectivity and low molecular weight products is observed on iron
catalyst [17] These selectivity changes can be ascribed to carbonaceous
deposits formed on sites with potassium promoters Moreover sintering leads
to a reduction of the surface area hence lowering the catalyst activity High
water pressures enhance agglomeration of initially small crystallites
E Conversion
The influence of CO conversion on the reaction selectivity must be related to
the decrease of CO partial pressure and the increase of water partial pressure
with high levels of conversion Low CO partial pressures (ie high CO
conversion) imply that secondary hydrogenation reaction are less inhibited
hence olefins are hydrogenated to inactive paraffins so that olefin selectivity
decreases Moreover secondary-cracking reactions may occur especially if high
temperature is adopted to increase conversion hence methane selectivity
increases
A schematic view of the general influence of different parameters on the
selectivity is given in Table 22
Table 22 Selectivity control in F-T synthesis by process conditions ( =
increase with increasing parameter = decrease with increasing parameter
= complex relation) From [17]
Parameter Chain Lenght
Chain branching
Olefin Selectivity
Alcohol Selectivity
Carbon deposition
Methane Selectivity
Temperature Pressure H2CO Conversion Space Velocity
Chapter 2 Chemistry of Fischer Tropsch Synthesis
74
References
[1] David Glasser Diane Hildebrandt Xinying Liu Xiaojun Lu and ornelius M Masuku Current Opinion in Chemical Engineering 2012 1296ndash302 [2] Gaube J Klein H-F J Mol Catal A Chem 2008 28360-68 [3] Davis BH Catal Today 2009 14125-33 [4] RBAnderson Academic Press (Harcourt Brace Jovanovich Publishers (1984) Chapter 2 [5] RBAnderson CBLee JCMachiels CanJChemEng 54 (1976) 590 [6] Qinghong Z Weiping D Ye W J Ener Chem 2013 2227ndash38 [7] Ciobıca I M Kramer G J Ge O Neurock M van Santen R A J Catal 2002 212(2) 136 [8] Cheng J Gong X Q Hu P Lok C M Ellis P French S J Catal 2008 254(2) 285 [9] Lo J M H Ziegler T J Phys Chem C 2007 111(35) 13149 [10] Cheng J Hu P Ellis P French S Kelly G Lok C M J Phys Chem C 2008 112(15) 6082 [11] Cao D B Li Y W Wang J G Jiao H J J Mol Catal A 2011 346(1-2) 55 [12] Zhao Y H Sun K J Ma X F Liu J X Sun D P SuH Y Li WX Angew Chem Int Ed 2011 50(23) 5335 [13] B Todic Wenping M G Jacob BH Davis Dragomir B Bukur Catal Today (2013) httpdxdoiorg101016jcattod201308008 [14] S Storsaeligter D Chen A Holmen Surf Sci 600 (2006) 2051ndash2063 [15] E Shustorovich H Sellers Surf Sci Rep 31 (1998) 1ndash119 [16] C Pirola PhD 2007-2008 Novel supported iron based Fischer-Tropsch catalysts Preparation characterization and applications [17] GPVan Der Laan AACM Beenackers CatalRev-SciEng 41 (3amp4) (1999) 255 [18] APSteynberg MEDry (Editors) Fischer Tropsch Technology Studies in surface science and catalysis 152 (2004) p623 [19] Hirsa M Torres Galvis and Krijn P de Jong ACS Catal 2013 3 2130minus2149 [20] Abello S Montane D ChemSusChem 2011 4 1538minus1556 [21] Wang C Xu L Wang Q J Nat Gas Chem 2003 12 10minus16 [22] Janardanarao M Ind Eng Chem Res 1990 29 1735minus1753 [23] Schwab E Weck A Steiner J Bay K Oil Gas Eur Mag 2010 1 44minus47 [24] Torres Galvis HM Bitter JH Khare CB Ruitenbeek M Dugulan AI De Jong KP Science 2012 335 835minus838 [25] Sarup and B W Wojciechowski Can J Chem Eng 66 (1988) 831 [26] C H Bartholomew W Lee Stud Surf Sci Catal 130 (2000) 1151 [27] RBAnderson The Fischer Tropsch Synthesis Academic Press inc (1984)
Chapter 2 Chemistry of Fischer Tropsch Synthesis
75
[28] G A Huff Jr and C N Satterfield Ind Eng Chem Process Des Dev 24 (1985) 407 [29] E W Kuipers I H Vinkenburg and H Oesterbeek J Catal 152 (1995) 137 [30] Dry ME Conversion of Syngas to Fuels and Chemicals Int Conf on Catal amp Catal Proc Cape Town South Africa 199357-66 [31] Dry ME Appl Catal A 1996 138319-344 [32] Maitilis PM Quyoum R Long HC Turner ML Appl Catal A 1999 186363-374 [33] Ribeiro FH von Wittenau AES Bartholemew CH Somorjai GA Catal Rev Sci Eng 1997 3949-76 [34] Huff GA Jr Satterfield CN Ind Eng Chem Process Des Dev 1984 23696-705 [35] Zimmerman WH Bukur DB Can J Chem Eng 1990 68292-301 [36] Bartholomew CH Farrauto RJ New Jersey Wiley 2006 [37] DPinna ETronconi LLietti RZennaro PForzatti La Rivista dei Combustibili 56 fasc2 (2002) 69 [38] TJDonnelly and CNSatterfield ApplCatalA 52 (1989) 93
76
Chapter 3 Catalysts for Fischer Tropsch Synthesis
The core of any FT process is its catalyst Only a few metals show catalytic
activity in the FT synthesis [1] As explained before the reaction is generally
assumed to start with the adsorption of CO on the catalyst surface where it
reacts with adsorbed hydrogen to afford a methylene group which in its turn
is responsible for the CndashC chain growth Probably at least two reaction paths
co-exist for the initial steps of the FT reaction one in which carbon monoxide is
adsorbed in a dissociative way (ie its CndashO bond is cleaved before any possible
reaction with hydrogen) and another in which some hydrogenation by
adsorbed hydrogen atoms precedes the CndashO cleavage [2]
So a good catalyst should adsorb both CO possibly in a dissociative way and
H2 Furthermore since metal oxide formation is always possible under FT
conditions either by dissociative CO absorption or by metal reaction with co-
produced water the metal oxide should be easily reduced under the reaction
conditions With this respect most early transition metals are not good FT
catalysts because despite their favorable CO adsorption they form very stable
oxides that are not reduced under FT conditions Iridium platinum and
palladium adsorb CO in a non-dissociative manner while metals of groups 11
and 12 hardly adsorb it none of them is an effective FT catalyst The specific
activities (ie the reaction rates per unit surface area of metal) of most of the
metals of the former Group VIII (all but osmium) were assessed under
comparable conditions and ruthenium proved to be the most active catalyst
As expected on the basis of the classical work by Sabatier (1902) nickel (and
even to a larger extent palladium) showed very high selectivity towards
Chapter 3 Catalysts for Fischer Tropsch Synthesis
77
methane formation obviously a feature not appreciated in a FT catalyst [2]
Osmium was successively evaluated but turned out to be ca 100 times less
active than ruthenium So the best FT catalysts are based on iron cobalt and
ruthenium with nickel rhodium and osmium (and possibly rhenium) being
moderately active (Fig 31) [3]
Fig 31 Catalytic activity of transition metals in the FT reaction Blue denotes early transition metals able to adsorb CO in a dissociative way they however show poor or no capability to adsorb H2 and their oxides are not reduced under usual FT conditions
accordingly these metals are not active FT catalysts Orange denotes late transition metals and a few main group elements which show poor or no CO adsorption and no FT activity Yellow shaded elements have good H2 adsorption capability and reducible oxides they however adsorb CO in a non-dissociative way and as a matter of fact are poor FT catalysts Brilliant green denotes the best FT catalysts Nickel rhodium
osmium and possibly rhenium (pale green) are moderately active [3]
However FT industrial plants require huge amounts of catalyst and ruthenium
is too rare and expensive to be used on this scale As a matter of fact cobalt
and iron are the only metals of choice for industrial applications Iron is
obviously cheaper than cobalt but to select between them a key issue is the
carbon feedstock Iron is a good water gas shift catalyst and for this reason is
particularly suitable for hydrogen-poor syngas such as those obtained from
coal or biomasses Cobalt performs better with an almost stoichiometric ratio
between hydrogen and carbon monoxide so it is preferred when the carbon
feedstock is natural gas Alternatively cobalt can also be used with hydrogen-
poor syngas provided that the H2CO molar is adjusted by a WGS unit between
the gasification and the FT reactors [1]
Chapter 3 Catalysts for Fischer Tropsch Synthesis
78
Apart from methane (which usually forms in amounts higher than expected)
the FT products distribution follows the AndersonndashSchulzndashFlory model [2] So
the FT output is always a complex mixture of products ranging from methane
to waxes formed by high molecular weight linear paraffins as explained before
A proper choice of catalyst and reaction conditions allows tuning to some
extent the composition of the final mixture but it is impossible to force the
process to produce selectively a well-defined range of products ie middle
distillates So the best strategy to maximize diesel production is to select
conditions which allow obtaining the maximum amount of long chain linear
paraffins that can be then fed to a hydrocracking stage transforming them into
a most valuable fuel
Cobalt and iron are the metals which were proposed by Fischer and Tropsch as
the first catalysts for syngas conversion Both cobalt and iron catalysts have
been used in the industry for hydrocarbon synthesis A brief comparison of
cobalt and iron catalysts [4] is reported in Table 31 Cobalt catalysts are more
expensive but they are more resistant to deactivation Although the activity at
low conversion of two metals is comparable the productivity at higher
conversion is more significant with cobalt catalysts Water generated by FT
synthesis slows the reaction rate on iron to a greater extent than on cobalt
catalysts At relatively low temperatures (200 - 250degC) chain growth
probabilities of about 094 have been reported [5] for cobalt-based catalysts
and about 095 for iron catalysts The water-gas shift reaction is more
significant on iron than on cobalt catalysts [4]
Iron catalysts usually produce more olefins Both iron and cobalt catalysts are
very sensitive to sulphur which could readily contaminate them For iron-
based catalysts the syngas should not contain more than 02 ppm of sulphur
For Co catalysts the amount of sulphur in the feed should be much less than
Chapter 3 Catalysts for Fischer Tropsch Synthesis
79
01 ppm Cobalt catalysts supported on oxide supports are generally more
resistant to attrition than iron co precipitated counterparts they are more
suitable for use in slurry-type reactors Iron catalysts produce hydrocarbons
and oxygenated compounds under different pressures H2CO ratios and
temperatures (up to 340degC) Cobalt catalysts operate at a very narrow range of
temperatures and pressures an increase in temperature leads to a spectacular
increase in methane selectivity Iron catalysts seem to be more appropriate for
conversion of biomass-derived syngas to hydrocarbons than cobalt systems
because they can operate at lower H2CO ratios [4]
Table 31 Comparison of Cobalt and Iron FT catalysts [4]
Parameter Cobalt catalyst Iron Catalyst
Cost More expensive Less expensive
Lifetime
Resistant to deactivation Less resistant to deactivation (coking carbon deposit iron carbide)
Activity at low conversion comparable
Productivity at high conversion
Higher less significant effect of water on the rate of CO conversion
Lower strong negative effect of water on the rate of CO conversion
Maximal chain growth probability
094 095
Water gas shift reaction Not very significant more noticeable at high conversion
Significant
Maximal sulphur content lt 01 ppm lt 02 ppm
Flexibility (temperature and pressure)
Less flexible significant influence of temperature and pressure on hydrocarbon selectivity
Flexible CH4 selectivity is relatively low even at 340degC
H2CO ratio 2 05-25
Attrition resistance Good (always supported) Not very resistant if not
supported
Chapter 3 Catalysts for Fischer Tropsch Synthesis
80
A large number of studies have pointed out that various factors can influence
the catalytic behaviors of a FT catalyst As summarized in Table 32 besides the
engineering factors such as reactor design and operation conditions [6-10]
there exist many catalyst factors which can exert significant influences on the
activity and product selectivity
Table 32 Typical key factors influencing the activity and product selectivity of a FT
catalyst [11]
Engineering factors Catalyst factors
(i) Reactor design
(ii) Operation
conditions
(i) identity of active metal (Ru Co or Fe) (ii) chemical state of active phase (metal oxide or carbide) (iii) support (identity pore structure physicochemical properties) (iv) promoter (typically including noble metals oxides of Mn Zr or rare earth metals alkali metal ions) (v) size of active phase (vi) microenvironment of active phase
31 Iron and Cobalt industrial FT catalysts i) Iron catalysts With iron catalysts two directions of selectivity have been
pursued One direction has aimed at a low molecular weight olefinic
hydrocarbon mixture to be produced in an entrained phase or fluid bed process
(Sasol Synthol process) Due to the relatively high reaction temperature
(340degC) the average molecular weight of the product is so low that no liquid
product phase occurs under reaction conditions The catalyst particles moving
around in the reactor are small (dp =100 mm) [12] and carbon deposition on
the catalyst does not disturb reactor operation Thus low catalyst porosity with
Chapter 3 Catalysts for Fischer Tropsch Synthesis
81
small pore diameters as obtained from fused magnetite (plus promoters) after
reduction with hydrogen is appropriate For maximising the overall gasoline
yield the olefins C3 C4 have been oligomerised at Sasol However recovering
the olefins for use as chemicals in eg polymerisation processes is
advantageous today [13]
The second direction of iron catalyst development has aimed at highest
catalyst activity to be used at low reaction temperature where most of the
hydrocarbon product is in the liquid phase under reaction conditions Typically
such catalysts are obtained through precipitation from nitrate solutions A high
content of a carrier provides mechanical strength and wide pores for easy mass
transfer of the reactants in the liquid product filling the pores The main
product fraction then is a paraffin wax which is refined to marketable wax
materials at Sasol however also can be very selectively hydrocracked to a high
quality Diesel fuel Thus iron catalysts are very flexible Selective FT synthesis of
linear terminal olefins seems only possible with iron catalysts Alkalised iron FT
catalysts exhibit water gas shift activity (in contrast to cobalt catalysts) This is a
favourable feature for FT synthesis with CO-rich syngas as obtained from high
temperature coal- or heavy-oil-gasification through partial oxidation (H2CO
molar ratio =10) however it is undesirable for FT synthesis with hydrogen-rich
syngas as produced from natural gas The activity of iron catalysts decreases
through product inhibition by water [14] This feature restricts the attainable
degree of conversion and leads to gas recycle operation after water removal
together with the organic condensate
ii) Cobalt catalysts Cobalt catalysts have been applied in the first FT plant of
Ruhrchemie in 1935 Present catalyst design makes use of several preparation
techniques however the intention to produce a well-dispersed cobalt phase in
a wide pore support remains the same Today cobalt catalysts for FT Diesel
Chapter 3 Catalysts for Fischer Tropsch Synthesis
82
production from natural gas are designed for a maximum wax selectivity the
waxy product then being the feed for hydrocracking Hydrocracking of FT
paraffins follows the kinetic regime of lsquoideal hydrocrackingrsquo as observed by
Schulz and Weitkamp [15] always the largest molecules are cracked selectively
and no secondary cracking occurs With cobalt catalysts olefin readsorption on
FT sites takes place and this contributes significantly to the desired high wax
selectivity This implies that olefin secondary hydrogenation and double bond
shift should be kept low Diesel fuel selectivity approaching 80 can be
obtained by the process combination FT synthesishydrocracking [15]
32 Chemical State of active phase As explained before the typical active metals used for FT synthesis are Fe Co
and Ru According to [11] the current consensus is that metallic Co and Ru ie
Co0 and Ru0 nanoparticles function as the active phases for CO hydrogenation
to heavier hydrocarbons whereas iron carbides are responsible for CO
hydrogenation [16] However deeper knowledge about the effects of different
chemical states of these active phases on catalytic performances is still needed
for the rational design of an efficient FT catalyst
21 Co-based catalysts
Metallic Co may exist in two different crystalline forms ie fcc and hcp
phases For bulk Co the hcp phase is more stable at lower temperatures but
the fcc phase becomes more stable when the size of Co particles becomes less
than 20 nm [17] However the actual crystalline structure of Co catalyst under
working conditions is not well known The formation of Co2C may cause the
catalyst deactivation Another recent work also demonstrated that the
deactivation of Co-based catalyst was due to the carbide formation and carbon
deposition [18] The prolonging of the time on stream caused the partial
Chapter 3 Catalysts for Fischer Tropsch Synthesis
83
decomposition of the bulk Co2C to Co0 and increased the conversion of CO and
the selectivity to heavier hydrocarbons
22 Fe-based catalysts
Iron carbides are easily formed under FT reaction conditions because of the
lower or similar activation energy for iron carbide formation as compared with
that of CO hydrogenation Many types of iron carbides such as ε-Fe2C ε_ -
Fe22C Fe7C3 χ-Fe5C2 and θ-Fe3C all have been observed in FT synthesis [19-
20] However the true active species under working conditions remains still
unsettled Many studies have been devoted to characterizing the active iron
carbide phase Because the carburized iron catalysts are very sensitive to air
exposures even under controlled passivation [21] the in situ or operando
characterizations under working conditions are quite important
33 Size of active phase According to [11] the size of the active phase is one of the most important
factors determining the catalytic behaviors of a heterogeneous catalyst [23]
For Co-based catalysts Iglesia once analyzed data obtained over different
metal oxide-supported Co catalysts and the results suggested that the
turnover frequency (TOF) for CO conversion ie the amount of CO converted
per surface Co per time was independent of the size of Co particles loaded on
different metal oxides in a Co-size range of 9minus200 nm [24] The selectivity to
CH4 was higher over the catalysts with smaller Co particles and decreased with
increasing Co size particularly in the range of 26minus8 nm C5+ selectivity
increased with the mean size of Co nanoparticles monotonically and the
increase became insignificant when Co size exceeded 6minus8 nm Thus Co-
catalyzed FT synthesis is a structure sensitive reaction in the Co-size range of
lt10 nm Size effect studies for Ru- and Fe-based catalysts are not numerous A
Chapter 3 Catalysts for Fischer Tropsch Synthesis
84
few early studies pointed out the increase in TOF for CO hydrogenation with
increasing the size of Ru or Fe particles (or decreasing the metal dispersion)
[25-27]
In general the results obtained for many Co- and Ru-based catalysts all indicate
that the TOF for CO conversion increases with the size of metal nanoparticles
up to a critical point (6minus10 nm) and then changes slightly For Fe-based
catalysts the results are still inconsistent
References
[1] C Perego MRicci Catalysis Science amp Technology 2012 2 1776ndash1786 [2] P M Maitlis V Zanotti Chem Commun 2009 1619ndash1634 [3] C Perego R Bortolo and R Zennaro Catal Today 2009 142 9ndash16 [4] AY Khodakov W Chu P Fongarland ChemRev 107 (2007) 1692 [5] B Jager Stud Surf Sci Catal 119 (1998) 25 [6] Luque R de la Osa A R Campelo J M Romero A A Valverde J L Sanchez P Energy Environ Sci 2012 5(1) 5186 [7] Hao X Dong G Q Yang Y Xu Y Y Li YW Chem Eng Technol 2007 30(9) 1157 [8] van Steen E Claeys M Chem Eng Technol 2008 31(5) 655 [9] Davis B H Ind Eng Chem Res 2007 46(26) 8938 [10] Gao J H Wu B S Zhou L P Yang Y Hao X Xu Y Y Li Y W Chin J Catal (Cuihua Xuebao) 2011 32(12) 1790 [11] Qinghong Z Weiping D Ye W Review J Ener Chem 2013 2227ndash38 [12] OGMalan JDLouw LCFerreira Brennstoff-Chem 42 (1961) 209 [13] AP Steynberg RL Espinoza B Jager AC Vosloo ApplCatalA 186 (1999) 41 [14] ME Dry JR Anderson M Boudart (Eds) Catalysis Science and Technology M Springer Berlin (1981) 159 [15] HSchulz Appl Catal A 186 (1999) 3 [16] Zhang Q H Kang J C Wang Y ChemCatChem 2010 2(9)1030 [17] Kitakami O Sato H Shimada Y Sato F Tanaka M Phys Rev B 1997 56(21) 13849 [18] Tan K F Xu J Chang J Borgna A Saeys M J Catal 2010 274(2) 121 [19] De Smit E Weckhuysen B M Chem Soc Rev 2008 37(12) 2758
Chapter 3 Catalysts for Fischer Tropsch Synthesis
85
[20] Zhang Q H Kang J C Wang Y ChemCatChem 2010 2(9) 1030 [21] Janbroers S Louwen J N Zandbergen H W Kooyman P J J Catal 2009 268(2) 235 [22] PJ Van Berge J Van de Loosdrecht JCaricato EA Barradas Patent WO 9942214 [23] Zhang Q H Deng W P Wang Y Chem Commun 2011 47(33) 9275 [24] Iglesia E Appl Catal A 1997 161(1-2) 59 [25] Kellner C S Bell A T J Catal 1982 75(2) 251 [26] Jones V K Neubauer L R Bartholomew C H J Phys Chem 1986 90(20) 4832 [27] Boudart M McDonald M A J Phys Chem 1984 88(11) 2185
86
Chapter 4 Experimental FT plant and analytical methods
Two different FTS units were used in this PhDrsquos research work in order to
homologate some results The first one is located at the Universitagrave degli Studi
di Milano in Italy while the second one is located at the Universidad Central de
Venezuela in Venezuela Following there is the description of both FTS unit
First FTS Unit (Unit 1) Universitagrave degli Studi di Milano in Italy
FT reaction tests were performed into a fixed bed reactor (di =06 cm l = 56
cm) using 1 g of fresh catalyst mixed with 1 g of diluting material (-Al2O3
Fluka) This diluting material must be inert for FT and a good thermal conductor
to control the process temperature [1] The catalysts were tested after their
activation in a 468 NmL min-1 flow of syngas with H2CO ratios of 21 (total
flow = 468 Nml min-1) and nitrogen as internal analytical standard (flow = 50
NmL min-1) at P = 20 bar and temperature range between 220-260degC for a
duration between 20 and 90 h in continuous Analyses of the gas-phase
products (C1-C7) were performed with an on-line micro-gaschromatograph
(Agilent) measurements were carried out every 60 min during the reaction
Liquid products were collected in a trap (V=400mL) operating at 5degC and at the
same pressure of the reactor (20 bar) and analyzed by a gas chromatograph
(Agilent) equipped with a Porapack-Q columns (able to separate C7-C30
hydrocarbon fraction) after the reaction duration The aqueous phases
collected in the cold trap were analyzed by a TOC (Schimadzu) for the
quantification of carbonaceous species dissolved in water Using all the data
87
collected for each run a mass molar balance has been verified with a
maximum error of plusmn 5moles
Second FTS Unit (Unit 2) Universidad Central de Venezuela in Caracas-
Venezuela)
FTS was performed in a continuous flow system with a fixed bed stainless-steel
reactor (di =095 cm l = 30 cm) The reactor was loaded with 03 g of fresh
catalyst mixed with 03 g of see sand as a diluting material [2] The calcined
catalysts were initially reduced in situ by flowing hydrogen for 4 hours at 900
Nml˙min-1 350degC and 08 MPa After the reduction step the temperature was
lowered to 220degC under H2 They were then tested in the standard conditions
by flowing syngas (H2 CO N2 63325 vv N2 as internal standard) at 156
Nml˙min-1 increasing the system pressure slowly up to 20 MPa and 220-260degC
Once the reaction temperature was achieved the reaction was led to proceed
during a period of 280 h
During reaction the reactor effluent passed through a hot trap kept at 150degC
and 02 MPa to collect waxes and the products leaving this trap were passed
through a second trap kept at 0degC and 02MPa to collect the lighter products
(water alcohols and hydrocarbons) The analyses were performed in various
chromatographs according to the nature of the sample to be analyzed
Permanent gases and light hydrocarbons were analyzed on-line in a
PerkinElmer 3000GC Autosystem fitted with TCD detectors using a Carbosieve
SII Supelco column The liquid products (collected at 150ordmC and 0ordmC) were
weighted and analyzed in a PerkinElmer chromatograph fitted with a 50m long
Alumina RT capillary column connected to a FID
A mass molar balance was performed for each FT run resulting in a maximum
error of plusmn 5moles
88
41 FT Laboratory plant a) First FTS unit (Unit 1)
As explained by Pirola [3-5] the experimental tests were performed in a
laboratory plant with a tubular reactor (made by ldquoRenato Brignolerdquo Company)
with a fixed bed of catalyst vertically placed The feed (CO H2 and N2 as
internal standard) is prepared in situ mixing three different flow of pure CO
pure H2 and pure N2 using three different flow meters Then the feed goes into
the catalytic reactor from the top part reacts with the catalyst and then the
reacted flow comes out from the lower part The plant pipes are heated till the
cold trap to avoid the heavy products condensation In this cold trap cooled at
5degC the heavy products and the water condense The not reacted gas and the
light hydrocarbons go in a flow meter for their quantification and finally in an
analytical zone where they are analyzed by a micro gaschromatograph In the
condensed liquid in the cold trap there are two phases the first one is an
aqueous phase (in which water and small quantities of light hydrocarbons and
oxygenated compounds are present) and the second one is an organic phase
(in which hydrocarbons in the range C7-C30 are present)
In Fig 41 the detailed flow-sheet of FT plant has been reported
Fig 41 Laboratory plant flow-sheet
89
The key for the Fig41 is the following
1 valve
2 flow meter (Brooks reg mod 5850TR) for H2 and CO operating in the range 0-
100 Nml min-1 for N2 operating in the range 0-20 Nml min-1
3 gas mixer
4 thermocouples for the control of temperature in the catalytic bed in the
reactor and in the heated pipe
5 Tubular reactor
6 Security valve
7 Pressure indicator
8 Pressure control and regulation tool
9 micro GC ldquoAgilent reg 3000 seriesrdquo
10 gas totalizer for the control of the total flow of gas
11 Cold trap operating at 5degC and 20 bar
12 Cooling air for the temperature control of the reactor
13 vent (usually closed)
In figure 42 a photo of the plant is reported
Fig 42 FT laboratory plant
90
In the following paragraphs the main parts of this plant will be described
41a Main parts of the plant 41a1 Apparatus for the regulation and control of temperature pressure and flow of reagents
In the plant the pressure is controlled and regulated by an electronic controller
(Brooksreg) that interacts with a pressure valve able to work till 25 bars (Fig 43)
located after the reactor and the cold trap
Fig 43 Pressure valve
This system can control the plant pressure with a care of 01 bar respect the set
up
The reactor temperature is regulated by a heating oven (Renato Brignole) and
the pipe lines after the reactor are heated at 220degC to prevent the heavy
products condensation by two electrical cables (both with a resistance of 7
m) controlled by a Ascon reg apparatus The CO H2 and N2 flows are regulated
by Brooksreg 5850TR series flow meters (Fig 44)
91
44 Flowmeters for CO H2 N2
In table 41 the main characteristics of these flow meters are reported
Table 41 Flowmeters characteristics
Range
(Nmlmin) IO signal
(vdc) Max Pressure
(Bar)
H2 0-50 0-5 100
CO 0-50 0-5 100
N2 0-20 0-5 100
41a2 FT reactor
The FT plant reactor (Fig 45) has been made by Renato Brignole reg Company
(Legnano Italy) It is a fixed bed tubular reactor with the catalyst vertically
located It is made of AISI 316 stainless steel and in the internal surface of
reactor there is a coaxial copper tube (thickness = 1 mm) to prevent some
catalytic activities of steel and to uniform the heating of reactor The technical
characteristics of reactor are summarized in Table 42
Table 42 Reactor Characteristics
Volume (cm3)
Max operating pressure
(Bar)
Max operating temperature
(degC)
Internal diameter
(mm)
Height (mm)
158 100 400 6 560
92
In this reactor it is possible to charge till 3 g of the mixture catalyst-diluting
material The feed goes into the reactor at the top and goes out from the lower
part The operation of opening and closing of reactor is made using the disks
illustrated in Fig 46 and this is an operation that needs a particular attention
to avoid gases losses or mechanical damage
Fig 45 FT tubular reactor Fig 46 Reactor opening disks
The temperature inside the reactor is monitored by two thermocouples the
first one is vertical and it is inside the catalyst the second one is horizontal and
it is inside the reactor The values of temperatures recorded are quite the same
(max difference = 2degC)
41a3 Cold Trap
The condensation of heavy FT products (mainly hydrocarbons higher than C7
and water) is made using a cold trap in stainless steel able to work at 20 bar
and a T=5degC (Fig 47) The low temperature is maintained by an external
circulation of water coming from a ldquoCrioterm reg 190 iscordquo thermocriostat The
93
volume height and width of the cold trap are respectively 125 ml 100 mm
and 40 mm
Fig 47 Cold trap
The cold trap at the end of each kinetic run is opened and the liquid
condensed inside is quantified and analyzed There are two phases the first
one is an organic phase made by hydrocarbons in the range C7-C30 and it is
analyzed by a GC the second one is an aqueous phases with some organic
mainly oxygenated compounds and the quantification of all the present
carbon is made by a TOC analysis The results obtained in this way give an
average value of all the time of kinetics It is not possible to open the cold trap
during the experiment In fact opening the cold trap the pressure and flow
equilibrium of the plant is broken
41a4 Flow totalizers
The calculation of CO conversion and products selectivity of the plant needs to
know exactly the quantity of gas incoming and out coming Moreover adding
those data to the quantity of liquid condensed in the cold trap and to analytical
data it is possible to verify the mass balance on the plant The calculation of the
mass balance is very important to verify the goodness of the experimental data
collected
94
In FT plant it is possible to quantify all flow passed in a fixed time The incoming
flow of H2 N2 and CO is totalized by the same flow meters that regulate the
flow (Brooks reg Instruments) and the out coming flow (mixture of not reacted
CO and H2 N2 and non-condensed FT products) is totalized by a Ritter reg mod
TG01-5 (Fig 48) instrument
Fig 48 Ritter reg totalizer
42a Analytical instruments
FT plant needs three different analysis for the quantification of the composition
of
i) out coming gas (mixture of not reacted CO and H2 N2 and non-
condensed FT products) by a micro-GC Agilent reg mod 3000A
ii) organic phase of condensed liquid in cold trap (hydrocarbons in the
range C7-C30) by a GC ldquoFison Carlo Erba reg Mod 8000 seriesrdquo and
iii) liquid phase of condensed liquid in the cold trap (water with
hydrocarbon mainly oxygenated dissolved inside) by a Total
Organic Carbon ldquoShimadzu reg mod 5000Ardquo
42a1 micro Gas Chromatograph ldquoAgilent reg mod 3000Ardquo
In the micro GC Agilent reg there are two different columns the first one is a
molsieves module by which it is possible to separate in order of retention
time He H2 Ne Ar O2 N2 CH4 and CO the second one is a OV-1 module
(filled with polydymethylsiloxilane) by which it is possible to separate CO2 and
95
all the hydrocarbons in the range C2-C7 In this instrument the gas sample is
splitted in the two modules and then analyzed in the same time For each
sample then we obtain two different analyses In our application using the first
module the CO N2 and CH4 were quantified with a column temperature of
45degC using the second module CO2 and hydrocarbons were quantified with a
column temperature of 100degC Each module is equipped with a TCD detector
The sensibility limit of the analyses is about 50 ppm for each compound and
the carrier gas is helium The instrument scheme is reported in Fig 59 and the
instrument is represented in Fig 410 An example of analyses is reported in
Fig 411
Fig 49 Agilent Micro GC scheme
Fig 410 Micro GC Agilent
96
Fig 411 Example of Agilent micro GC analyses on FT out coming gas
42a2 Gas Chromatograph ldquoFision Carlo Erba reg Mod 8000 seriesrdquo
In this traditional Gas Chromatograph (GC) equipped with a wide bore Varian
(model VF-1ms) (dymethylpolyxolane) column (length = 25 m diameter = 025
mm) it is possible to separate and quantify the hydrocarbons in the range C7-
C30 The GC detector is a FID with a sensibility limit of about 100 ppm for each
compound and the carrier is helium The column temperature is maintained at
60degC for 3 minutes then heated till 260degC at 7degCmin for 15 minutes after that
heated at 280degC for 40 minutes at 5degCmin and then heated till 310degC for 5
minutes In Fig 412 and 413 the gas chromatograph in its column
97
Fig 412 Example of GC analysis for the quantification of heavy FT products
Fig 413 Wide bore Varian VF-1ms column
42a3 Total Organic Carbon ldquoShimadzu reg mod 5000Ardquo
Using this instrument it is possible to quantify the organic carbon dissolved in
water The sample passes through an oxidation catalyst (Pt) at high
temperature (700degC) and then all the organic carbon is converted to CO2 This
CO2 is then exactly quantified by an IR detector In Fig 414 it can be seen the
instrument
Fig 414 SHIMADZU TOC-5000A
98
43a Analytical instruments calibration
43a1 Flow meters calibration
All flow meters have been calibrated comparing the flow measured by these
instruments and that measured using a ldquosoap-bubblerdquo flow meter at the end of
the plant This calibration has been made using the FT plant both in FT work
condition (T=250degC P=20 bar) and at room condition (T=20degC P=1 bar) For
each flow meter some tests at different flow have been made always in the
range between 0 and 40 Nmlmin For each flow meter a diagram has been
made where the real flow (y) is reported in function of the set-up flow (x) The
result for all the instruments is a straight line (y = ax + b) In Tab 43 the results
for all the instruments have been reported in term of ldquoardquo and ldquobrdquo coefficient
and ldquoR2rdquo value
Tab 43 Flow meters calibrations
Flow meter Calibration conditions a b R2 1 CO T = 20degC P = 1 bar 11364 12727 09996
2 H2 T = 20degC P = 1 bar 1008 -1749 0999
3 N2 T = 20degC P = 1 bar 12744 67994 09935
4 Mix CO H2 N2 T = 20degC P = 1 bar 0968 1816 09998
The conclusion is that the instruments give a very good calibration and their
indications of the flow are quite perfect
43a2 micro GC calibration
This calibration has been made in Cernusco sul Naviglio (MI) in the laboratory
of ldquoSRA Instruments Italiardquo Company This company is an Agilent Technologies
Premier Solution Partner directly present in Italy and France and it is
constantly engaged in research and development of solutions based on
portable and ultra-fast Micro Gas chromatograph (wwwsrainstrumentscom)
99
The calibration has been made analyzing two mixture of certified gas and is
reported by [5]
The calibration of CO2 and light hydrocarbon is a direct calibration As the
volume of gas injected in column is always the same it is possible to calibrate
directly (without an internal standard) the peaks area with the concentration of
different compounds ie the concentration is directly proportional to
chromatographic area In ldquoSRA Instruments Italiardquo all calibration factors fci
(chromatographic area compound concentration) and all retention times
have been found and they are reported in table 44
Table 44 Calibration results for CO2 and light hydrocarbons
Module Compound Retention time
(min) Calibration factor
Molsieves
N2 1007 35119
CH4 1203 27027
CO 1402 45799
OV-1
CO2 0592 16722
Ethane 0624 19230
Propane 0745 25706
I-butane 0918 28248
N-butane 1061 27027
I-pentane 1556 32051
N-pentane 1808 32326
N-hexane 3578 33670
CO quantification has been performed using another calibration
Using these data it is possible to calculate the concentration of each compound
using the formula
iiiv fcareacompound (1)
Nevertheless it is important to remember that in FT plant there is N2 as
internal standard for CO quantification and then the equation (1) must be
corrected because the N2 flow is not to be considered as FT gas
100
FT
totaliiiv
flow
flowfcareacompound (2)
Where
2NtotalFT flowflowflow (3)
To better understand this calculation an example is here reported
If we assume to have a real FT flow of 20 Nmlmin with a CO2 v = 2 it
means to have 04 Nmlmin CO2
If we have 10 Nml minmin of N2 as standard and 30 Nmlmin of FT flow and
we calculate the CO2 percentage using the total flow we obtain
233110030
40vCO making a mistake If we use the correction in the
equation (2) we obtain 20220
30100
30
40vCO
the true value
The CO calibration concerns only the CO and N2 flow The CO is the compound
to be quantified and the N2 is the standard gas in fact N2 is not involved in FT
reactions and it pass through the FT plant without any modification then the
incoming and out coming N2 is the same The necessity with CO to have a
calibration with a standard is explained considering that the CO quantification
gives the CO conversion of FT process then a more accurate measure is
convenient Moreover it is not possible to use N2 as internal standard also for
CO2 and light hydrocarbons because they are not analyzed in the same module
(OV-1) of N2 (molsieves) Another important consideration is that in literature
the CO conversion for FT reactor is always calculated using this method
In this calibration method the ratio (flow CO flow N2) is directly proportional
to ratio (area CO area N2) Using FT plant in reaction conditions (T=250degC
P=20 bar CO = 156 Nmlmin H2 = 312 Nmlmin N2 = 100 Nmlmin) obviously
101
without catalyst inside we have calculated these ratios and the co-relation
between them The results are reported in Table 45
Table 45 CO-N2 calibration results
Flow N2
(Nmlmin) Flow CO
(Nmlmin) Flow H2
(Nmlmin) Area
N2 Area CO
R flow CON2
R area CON2
Rarea Rflow
100 156 312 411142 782455 156 19031 12199
100 156 312 390220 793329 156 20330 13032
100 156 312 388002 794913 156 20487 13133
100 156 312 384672 795362 156 20676 13254
The mean value of ratio between area and flow ratios is 12905 and this is the
calibration factor (fc) for the system as reported in the equation (4)
flowN
COflowf
areaN
COareac
22
(4)
then the CO flow out coming from the FT plant is
29051
2
2
flowN
areaN
COareaflowCOout (5)
finally the CO conversion is
100xflowCO
flowCOflowCOonCOconversi
in
outin (6)
The H2 calibration
To optimize the kinetic model of the FT synthesis was necessary to develop a
measurement method to quantify the hydrogen leaving the plant For this it
was performed a calibration of the micro-gas chromatograph using N2 as
standard in different streams of H2
To identify and quantify the hydrogen it is necessary to change the carrier in
the micro-gas chromatograph (from He to Ar)
Using Argon as a carrier the response of the micro-GC is about ten times
smaller than the response compared with He For this reason it has been
102
necessary to modify the injection time for the analysis and set to 40ms instead
of the usual 30ms
In Table 46 and Fig 415 are shown the results relating to the calibration of the
system H2-N2
Table 46 H2-N2 calibration results
Flow N2 (Nmlmin)
Flow H2 (Nmlmin)
F H2 F N2 Area N2 Area H2 A H2 A
N2
20 3 015 31511 33480 1062
20 35 0175 29525 36348 1231
20 41 0205 28420 40995 1442
20 49 0245 26747 45908 1716
20 56 028 20897 41151 1969
20 61 0305 20748 44040 2123
Fig 415 Calibration results for the micro-GC for the system H2 ndashN2
From the equation of the straight line is obtained a correction factor equal to
70018
By this correction factor (Fc) is possible to deduce the flow of the H2 outflowing
from the reactor and its conversion during the reaction using the following
equation
103
1002
222
in
outin
FlowH
FlowHFlowHHconversion
The calculation set to detect the flow of H2 in output is based on the fact that
the ratio between the areas H2N2 is equal to the ratio between the respective
flows multiplied by Fc (correction factor) according to the following equation
2
2
2
2
FlowN
FlowHFc
AreaN
AreaH
So from this equation it is possible to determine the flow of H2 at the out of the
reactor
00187
2
2
22
FlowN
AreaN
AreaHHFlow OUT
In Fig 416 is shown an example of a gas chromatographic analysis of hydrogen
Fig 416 Gas chromatographic analysis of a system H2-N2
43a3 GC calibration
In this instrument as before discussed it is possible to analyze the heavy
hydrocarbons condensed in the cold trap Obviously for their quantification we
need a calibration with some standard compounds because the detector
quantification is not the same for all the species For this reason the equation
j
j
i
i
mol
area
mol
area (7)
it is not correct and we must use
104
j
j
j
i
i
i Fmol
areaF
mol
area
(8)
where Fi and Fj are the calibration factor for the compound i and j respectively
The calibration method used is the ldquointernal standard methodrdquo in which one of
the compounds to be analyzed is chosen as internal standard and his
calibration factor (F) is established equal to 1 N-heptane has been chosen as
internal standard because it is normally present in FT products Analyzing a
calibration hydrocarbon mixture it is possible to calculate the calibration factor
of all the hydrocarbon present inside this mixture using the following
equation
i
i
j
j
jiarea
mol
mol
areaFF
(9)
The composition of the calibration mixture is reported in table 47 and the
calibration results in table 48
In FT runs all hydrocarbons in the range C1-C19 were obtained To find the
calibration factor and the retention times of hydrocarbons not present in the
calibration mixture an interpolation calculation was made In the following
figure are reported the diagram of the calibrations factors (Fig 417) and of the
retention times (Fig 418) in function of carbon number Starting from these
experimental results an interpolation curve were calculated and then the
calibrations factors and retention times for each carbon number was calculated
too The results are reported in Table 49 It is important to outline that for
each single carbon number there is only one calibration factor for all the
isomers as they are not well separated by the GC column and the detector
answer for the isomers is the same
105
Table 47 Composition of GC calibration mixture
Hydrocarbon PM (gmol) Quantity (g) Mol
n-Heptane (C7) 1002 0229 02295
Nonane (C9) 12826 02389 01871
Decane (C10) 14228 01284 00906
Undecane (C11) 15631 01197 00769
Dodecane (C12) 17033 01139 00672
Tridecane (C13) 18436 01202 00655
Tetradecane (C14) 1984 01577 00798
Pentadecane (C15) 21241 01123 00531
Hexadecane(C16) 22644 01817 00806
Octadecane (C18)
2545 00919 00363
Nonadecane (C19) 26852 00895 00335
106
Table 48 GC calibration results
Mix Mol
Chromatographic areas
Fc mean Analysis
1
Analysis
2
Analysis
3
Analysis
4
Analysis
5
C7 0229522 7763 9384 881 9036 8981 100
C9 018706 16343 16475 15226 13896 15051 047
C10 0090631 8463 88707 7902 7588 7856 043
C11 0076907 8716 7627 8235 7916 8239 036
C12 0067157 8485 7313 8137 7709 8168 032
C13 0065478 847 7654 8253 7859 8271 031
C14 0079826 11095 9689 10988 9685 11042 029
C15 0053096 8309 819 8876 8844 8535 024
C16 0080586 12395 11571 12863 12834 13014 025
C18 0036265 6059 6061 6679 6817 659 022
C19 0033474 6134 5958 6527 6663 6549 020
Fig 417 GC calibration factor vs carbon number
107
Fig 418 GC retention time vs carbon number
Table 49 GC Calibration factor and retention times for all the hydrocarbons C7 ndash C30
Carbon number Fi Retention time (min)
7 0997 0975
8 0649 3431
9 0497 5887
10 0412 8343
11 0358 10799
12 0320 13255
13 0293 15711
14 0272 18167
15 0255 20623
16 0241 23079
17 0230 25535
18 0220 27991
19 0212 30447
20 0205 32903
21 0199 35359
22 0194 37815
23 0189 40271
24 0185 42727
25 0181 45183
26 0178 47639
27 0175 50095
28 0172 52551
29 0170 55007
30 0167 57463
108
43a4 TOC calibration
The detector of the instrument (type NDIR) is able to analyze and quantify by
means of infrared spectroscopic technique the CO2 produced by the sample
For this calibration is not necessary to use a standard equal to the analyte (in
the case of the synthesis of FT the carbonaceous species dissolved in water)
but it is necessary to use a stable standard such as potassium hydrogen
phthalate because due to its physical nature (solid) is therefore inherently
more reliable than a liquid and allows the exact correlation between the ppm
of carbon present in solutions of standards and the areas provided by the
instrument after analysis
There were prepared different solutions at known concentrations (200 and 100
ppm) from a stock solution of 300 ppm obtained by dissolving 031895 g in
100ml of distilled water
Standard solutions were corrected by a correction factor f according to the
following equation
masssampleltheoretica
masssamplerealf (10)
The calculated value of f is equal to 1000627 and the table 410 and the Fig
419 show the correct ppm standard and the areas supplied by the instrument
Table 410 calibrationTOC
Corrected
ppm
Area
3002 28679
2001 17261
1001 6568
109
Fig 419 Interpolation of areas obtained in function of the concentration (ppm) of the
standard
44a Experimental procedure
All the kinetic FT runs were made on the plant following the same experimental
procedure
1) Catalyst preparation
2) Catalyst loading on the plant in the FT reactor
3) Catalyst activation
4) FT run
5) When FT finish opening of cold trap and separation of organic from
aqueous phases
6) Catalyst removal from reactor
7) Reactor cleaning and micro-GC column regeneration
44a1 Catalyst preparation
Before the catalyst was loaded in the reactor a standard procedure was
followed on the same catalyst
- Catalyst mesh operation between 106 and 150 micron
- Heating in oven at 120degC for a night
- Mixture catalyst - Al2O3 (inert material ndash diluent) 11
110
In table 411 the main characteristics of -Al2O3 are reported The role of this
material is to help the heating removal from the catalyst (FT reaction is highly
exothermic)
Table 411 Main characteristics of -Al2O3
Superficial area (m2g)
Bulk density (gcm3)
Composition Humidity
07-13 172
996 Al2O3 lt005 SiO2
01 FeO lt001 TiO2
26
44a2 Catalyst loading
The catalyst loading is obviously an essential operation The catalyst must be
charged in the middle of reactor because this is the isothermal zone as it is
possible to observe in Figure 420
Fig 420 Thermic profile of FT reactor
As the height of the mixture catalyst + -Al2O3 is about 7 cm (using a pipe with
an internal diameter of 6 mm) if this material is charged in the middle of the
reactor this work surely at the same temperature in each point The final
arrangement of the reactor is reported in Fig 421
111
Fig 421 FT reactor internal loading arrangement
Finally after the closing the pressure inside the reactor is raised till 4 bar with
the activation gases The gas flow is stopped and then the held of reactor is
checked to control possible gas losses If the reactor pressure is stable the
activation catalyst step will be performed The same procedure for the check of
possible gas loss will be performed when the pressure of the reactor will be
raised till 20 bar for FTS
44a3 Catalyst activation
The catalyst activation is the process in which the catalyst is reduced from the
oxidised state in the reduced or metallic state In the FT reaction the active
form for the Cobalt based catalysts is the Cobalt metallic and for the iron based
catalysts are the carbide iron forms All the catalysts were charged into the
reactor in the oxidised form because the last operation in the catalysts
preparation is the calcination (T=500degC) in air The catalyst activation-reduction
is performed in this PhDrsquos research work at 350degC and using H2 for Co based
112
catalysts and CO+H2 for iron based catalysts always for 4 h at 3 bar of pressure
At the end of this step the FT process start
44a4 Fischer Tropsch runs
After the catalyst activation the plant is raised at standard reactions conditions
Temperature = 220-260degC (depending of the test)
Pressure = 20 bar
Feed ratio H2CO = 21 11 1751 151 (depending on the test were
varied the feed ratio too)
H2 flow = 312 Nmlmin
CO flow = 156 Nmlmin
N2 flow = 50 Nmlmin
These are the ldquostandardrdquo reaction conditions but for some specific studies
they have been changed When the plant reaches the set-up values this is the
ldquozero-timerdquo of the FT runs The first operation is to annul the totalizers both in
the entrance and in the exit of the plant Then every one hour the micro-GC
make one analysis on the out coming flow (also during the night) and the
operator takes the flow out coming from the plant Each data is reported and
elaborate using an excel database The FT run has duration between 48 and 90
hours At the end of run the cold trap is opened (Fig 422) and both the organic
phase (GC) and the aqueous phase (TOC) are separated and then weighed and
analyzed Also these data is collected in the excel database and now it is
possible to calculate the CO conversion the products selectivity the alpha
parameter and to verify the final mass balance
113
Fig 422 Opening cold trap operation
After the reactor cooling the catalyst is unloaded and recovered for possible
characterization after its use The reactor and the cold trap are obviously
cleaned carefully The last operation is the micro-GC column regeneration
using the condition reported in Table 412
Table 412 Micro-GC column regeneration conditions
Parameter Module 1 (molsieves) Module 2 (OV-
1)
Sample Injector temperature (degC) 80 80
Column Injector temperature (degC) 45 60
Column temperature (degC) 160 160
Sampling time (s) -- --
Injection time (ms) -- --
Analysis time (s) -- --
Post-analysis time (s) -- --
Column pressure (kPa) 120 241
Detector sensibility Detector off Detector off
114
b) Second FTS unit (Unit 2) At the end of the second and the beginning of the third year of the PhD there
were performed a serious of catalytic tests in a FT unit at the Universidad
Central de Venezuela in Caracas-Venezuela in order to homologate the results
obtained in the first FTS unit as regard the cobalt based catalysts specifically
the hydrotalcites The experimental tests were performed in a laboratory plant
with a tubular reactor with a fixed bed of catalyst vertically placed They were
then tested in the standard conditions by flowing syngas (H2 CO N2 63325
vv N2 as internal standard) at 156 Nml˙min-1 using a flow meter Then the
feed goes into the catalytic reactor from the top part reacts with the catalyst
and then the reacted flow comes out from the lower part The plant pipes are
heated at 220degC During reaction the reactor effluent passed through a hot
trap kept at 150ordmC and 20 bar to collect waxes and the products leaving this
trap were passed through a second trap kept at 0ordmC and 20 bar to collect the
lighter products (water alcohols and hydrocarbons) The analyses were
performed in various chromatographs according to the nature of the sample to
be analyzed Permanent gases and light hydrocarbons were analyzed on-line in
a PerkinElmer 3000GC Autosystem fitted with TCD detectors using a Carbosieve
SII Supelco column The liquid products (collected at 150ordmC and 0ordmC) were
weighted and analyzed in a PerkinElmer chromatograph fitted with a 50m long
Alumina RT capillary column connected to a FID
In Fig 423 the detailed flow-sheet of FT plant has been reported
115
Fig 423 Laboratory plant flow-sheet
The key for the Fig423 is the following
1 Valve
2 Flow meter for H2 and syngas operating in the range 0-100 Nml min-1
3 Gas mixer
4 Thermocouples for the control of temperature in the catalytic bed in the
reactor and in the heated pipe
5 Tubular reactor
6 Security valve
7 Pressure indicator
8 Pressure control and regulation tool
9 GC ldquoPerkin Elmerrdquo
10 Gas totalizer for the control of the total flow of gas
11 Cold trap operating at 150degC and 20 bar to collect waxes
111 Second cold trap kept at 0ordmC and 20 bar to collect the lighter products
(water alcohols and hydrocarbons)
12 Cooling air for the temperature control of the reactor
13 vent (usually closed)
In figure 424 a photo of the plant is reported
116
Fig 424 FT laboratory plant
In the following paragraphs the main parts of this plant will be described
41b Main parts of the plant
41b1 Apparatus for the regulation and control of temperature pressure and
flow of reagents
In the plant the pressure is controlled by a pneumatic valve that interacts with
a pressure valve able to work till 1000 psi (Fig 425) located after the reactor
and the cold trap
Fig 425 Pressure valve
This system can control the plant pressure with a care of 10 psi respect the set
up
117
The reactor temperature is regulated by a heating jacket and the pipe lines
after the reactor are heated at 220degC to prevent the heavy products
condensation by a heater The CO H2 and N2 flows are regulated by Brooks
Instrument Control and Read out Equipment for Thermal Mass Flow meters
Model 5878 series flow meters (Fig 426)
426 Flow meters for H2 and syngas
41b2 FT reactor
The FT plant reactor is a fixed bed tubular reactor vertically placed It is made
of AISI 316 stainless steel The technical characteristics of reactor are
summarized in Table 413
Table 413 Reactor Characteristics
Volume (cm3)
Max operating pressure
(Bar)
Max operating temperature
(degC)
Internal diameter
(mm)
Height (mm)
850 69 400 95 300
In this reactor it is possible to charge a quantity of catalysts equivalent to
occupy 1 cm of length of the reactor The feed goes into the reactor at the top
and goes out from the lower part
118
Fig 427 FT tubular reactor
The temperature inside the reactor is monitored by one thermocouple inside
the catalyst
41b3 Cold Trap The reactor effluent passed through a hot trap kept at 150degC and 02 MPa to
collect waxes and the products leaving this trap were passed through a second
trap kept at 0degC and 02MPa to collect the lighter products (water alcohols and
hydrocarbons) See Fig 428
Fig 428 Cold trap
The two cold traps can be opened at any time of the reaction and the liquid
condensed inside can be quantified and analyzed
119
The analyses were performed in various chromatographs according to the
nature of the sample to be analyzed Permanent gases and light hydrocarbons
were analyzed on-line in a PerkinElmer 3000GC Autosystem fitted with TCD
detectors using a Carbosieve SII Supelco column The liquid products (collected
at 150degC and 0degC) were weighted and analyzed in a PerkinElmer chromatograph
fitted with a 50m long Alumina RT capillary column connected to a FID
42b Analytical instruments
Two different analysis were made for the quantification of the composition of
i) Out coming gas (mixture of not reacted CO and H2 N2 and non-
condensed FT products) by an on-line in a PerkinElmer 3000GC
Autosystem fitted with TCD detectors using a Carbosieve SII Supelco
column
ii) Organic phase of condensed liquid products (collected in a cold trap at
150ordmC and 0ordmC) hydrocarbons in the range C7-C30 were weighted
and analyzed in a PerkinElmer chromatograph fitted with a 50m
long and 053 mm diameter of Alumina RT capillary column
connected to a FID
An example of analyses of the permanent gases is reported in Fig 429 and an
example of analysis of heavy FT hydrocarbons is reported in Fig 430 and Fig
431
120
Fig 429 Example of analyses of the permanent gases in the TCD
Fig 430 Example of not-condensed products GC analyses on FT out coming gas
121
Fig 431 Example of GC analysis for the quantification of heavy FT products
43b Experimental procedure
All the kinetic FT runs were made on the plant following the same experimental
procedure
1) Catalyst preparation
2) Catalyst loading on the plant in the FT reactor
3) Leak test
4) Catalyst activation
5) FT run
6) Opening of cold trap and separation of organic from aqueous phases
7) Catalyst removal from reactor
8) Reactor cleaning
43b1 Catalyst preparation
Before the catalyst was loaded in the reactor a standard procedure was
followed on the same catalyst
- Catalyst mesh operation between 106 and 150 micron
- Heating in oven at 120degC for a night
122
- Mixture catalyst ndash sea sand (inert material ndash diluent) 11
In table 414 the main characteristics of sea sand are reported The role of this
material is to help the heating removal from the catalyst (FT reaction is highly
exothermic) [5]
Table 414 Main characteristics of sea sand
Particle Size (μm)
Specific Surface
Area (m2g)
Bulk density (Kgm3)
Pore Volume
(mL)
Interstitial Velocity
(md)
Porosity (-) Composition
100-300 074
200-1430
117 26
044 SiO2
43b2 Catalyst loading
As the height of the mixture catalyst + sea sand is about 1 cm (using a pipe with
an internal diameter of 95 mm) if this material is charged in the middle of the
reactor this work surely at the same temperature in each point The final
arrangement of the reactor is reported in Fig 432
Fig 432 FT reactor internal loading arrangement
123
Finally after the closing the pressure inside the reactor is raised till 3 bar with
the activation gases The gas flow is stopped for one night and then the reactor
is checked to control possible gas losses If the reactor pressure is stable the
activation catalyst step will be performed The same procedure for the check of
possible gas loss will be performed when the pressure of the reactor will be
raised till 20 bar for FTS
43b3 Catalyst activation The catalyst activation is the process in which the catalyst is reduced from the
oxidised state in the reduced or metallic state The samples tested in this
reactor were the Co based hydrotalcites In the FT reaction the active form for
the cobalt based catalysts is the cobalt metallic All the catalysts were charged
into the reactor in the oxidised form because the last operation in the catalysts
preparation is the calcination (T=500degC) in air The catalyst activation-reduction
is performed in this part of the PhDrsquos research work at 350degC using H2 always
for 4 h at 3 bar of pressure At the end of this step the FT process start
43b4 Fischer Tropsch runs
After the catalyst activation the plant is raised at standard reactions conditions
Temperature = 220-260degC
Pressure = 20 bar
Feed ratio H2CO = 21
Syngas (H2 + CO + N2) flow = 156 Nmlmin (in order to work with the
same space velocity used for the same samples tested in the Unit 1 in
Italy)
These are the ldquostandardrdquo reaction conditions When the plant reaches the set-
up values this is the ldquozero-timerdquo of the FT runs Every one hour the GC make
124
one analysis of the permanent gases (CO CO2 CH4 N2) on the out coming flow
(also during the night) Each data is reported and elaborate using an excel
database The FT run has a duration between 200-280 hours During the
reaction and before the changes of temperatures the valves of the two cold
trap are opened and both the organic phase (GC) and the aqueous phase are
separated and then weighed and analyzed Also these data is collected in the
excel database and now it is possible to calculate the CO conversion the
products selectivity the alpha parameter and it is possible to verify the final
mass balance
After the reactor cooling the catalyst is unloaded The reactor is cleaned
carefully
42 Experimental data elaboration
The experimental data collected in the laboratory are the gas-chromatographic
area (with micro and traditional GC) the gas flows the temperatures the
pressure the weight of condensed products and the TOC value of organic
compounds in aqueous phase For each run all these data were put in the
excel file where in an automatic way the CO conversion the products
selectivity the molar balance the parameter were calculated
There were used two different file excel for the two different FTS unit
a) First FTS unit (Unit 1)
The file excel is split in nine pages data results heavy hydrocarbons analysis
molar balance (CO hydrogen and oxygen) hydrogen analysis oxygen analysis
and alpha calculation As example the pages of one FT run (made with a Co
base catalyst Co35_2d) are reported in Fig 433a-f
Data page (Fig 433a)
125
This worksheet contains the mathematical elaboration of the experimental
data obtained from the various analyzes and is composed of different parts
Conditions It is referred to the number of tests carried out by the
micro-gas chromatograph the time at which the analysis were made
and the outside temperature at the time of sampling
Flow in It is referred to the flow in (Nmlmin) of the reactants (H2 and
CO) and the internal standard (N2) that remain constant during the
entire kinetic energy
Volumes totalizers It is referred to the values of the three volumes of
gas consumed while the kinetic is in progress (this values are read from
the totalizer just before performing the analysis) and the total volume
of gas output in ml and Nml Furthermore it also evaluates an error in
percentage between the volume of gas out and the gas in
Flow out is measured by a flow meter bubbles and a counter ldquoRitterrdquo
the flow rates are calculated with the output flow measured from the
bubble flow meter and the Ritter counter and then compared
Flow from bubble flow meter (min
ml ) = 60t
V (11)
V[ml] Volume path from the bubble
t[min] Time it takes the bubble to traverse this volume
Flow from Ritter counter (min
ml ) = 100)(
t
VV INOUT (12)
VIN [ml] and VOUT [ml]are the volume of gas in and out
Both values of flow are converted in Nmlmin by the next equation
T273
273ml
min T[degC] (13)
126
CO Conversion It is referred to the quantity of gas reacted or converted
referred to the gas entering inn the plant From the micro-gc analysis
are taken the chromatographic areas of CO and N2 and used to
calculate the flow out-coming of CO from the equation
29121
2
2
OUTNflow
NArea
COAreaCOflow OUT (14)
Where 12912 is the calibration factor As the flow in and the flow out of N2
is the same
29121
025
2
NArea
COAreaCOflow OUT (15)
502 is the flow of the internal standard N2
Now it is possible to calculate the CO conversion using the next formula
IN
OUTIN
COflow
COflowCOflowConversionCO
(16)
Selectivity Concerning the gas flow out-coming from the FT plant made
of not reacted CO CO2 CH4 and light hydrocarbons
CO in reaction mixture 100
2
NTOT
OUT
flowflow
COflowCO (17)
product i in reaction mixture
100
2
NTOT
OUT
i
i
iflowflow
flowcF
area
product (18)
where
flowTOT is the total flow out-coming from the FT plant and concentrationi is
the amount (m) of product i found using the micro-GC
Fci is the calibration factor for each compound
127
Carbon molar flow for the i compound
i
i
C
i
tot
Cnumber
flowmoles
422
100
0010
min (19)
where iCnumber is the number of carbon atom of compound i
0001 transform Nml to Nl and 224 let to transform Nl to moles
Molar balance
CO moles entering in the plant 1000422min x
flowCmolesinin COCO
(20)
CO moles out coming
6
1 min1000422min i
iCOCO molesC
x
flowCmolesoutOUT (21)
128
Fig 433a Example of ldquodata pagerdquo in FT data elaboration excel file
Results page (Fig 433b)
Concerning the products selectivity
Light products (ltC7) j selectivity
129
100
minmin
min
outin
C
j molesCOmolesCO
moles
S
j
(22)
where jCmoles means the moles of carbon atom in the j products
Heavy products (geC7) i selectivity
100
minmin
min
outin
C
i molesCOmolesCO
moles
S
i
(23)
where iCmoles means the moles of carbon atom in the i products
Total light products selectivity jlight SS (24)
Total heavy products selectivity iheavy SS (25)
Fig 433b Example of ldquoresults pagerdquo in FT data elaboration excel file
Concerning the heavy product (organic phase condensed in the cold trap) elaboration (Fig 433c)
moles of i compound 100
CA
fcCAmoles ii
i (26)
where CA is the chromatographic area and fc is the calibration factor
130
Total moles of ldquo-CH2-ldquo unit in organic phase 142
OPCH
weightmoles (27)
Where weightOP means the weight of the organic phase in gram and 14 is the molecular weight of the unit ldquo-CH2-ldquo
Carbon moles of compound i 100
2 i
CH
Cmoles
molesmoles
i
(28)
Moles of carbon per minute of each component
60min
timereaction
CmolesCmoles ii (29)
Fig 433c Example of ldquoheavy hydrocarbons analysis pagerdquo in FT data elaboration excel file
Molar balance page (Fig 433d)
The molar balance is verified using the following equation
outoutoutoutinCwaterCheavyClightCOCO molesmolesmolesmolesmoles (30)
Where
131
inCOmoles and outCOmoles are respectively the moles of CO in entrance and
escape of the FT plant in all the runrsquos time outClightmoles are the carbon
atom moles of light FT products came out from the FT plant in all the runrsquos
time outCheavymoles are the carbon atom moles of the heavy hydrocarbons in
the organic phase condensed in the cold trap and outCwatermoles are the
carbon atom moles inside the water phase condensed in the cold trap In
particular
422
0102 iiNtot
Clight
Cnflowflowmoles out
out (31)
2CH
OPCheavy
PM
weightmoles
out (32)
12106
fdweightppmmoles OPTOC
Cwaterout (33)
where ppmTOC are the ppm of Total Organic Carbon measured by TOC
instrument and fd is a diluting factor (normally 1500) as the aqueous phase
must be diluted before the TOC analysis
Fig 433d Example of ldquomolar balance pagerdquo in FT data elaboration excel file
132
alpha parameter (Fig 433e)
This parameter represents a prediction of the distribution related to the
number of carbon atoms according to the Anderson-Schulz-Flory
distribution
In the excel file of data elaboration it is possible to calculate the alpha
parameter in different range of hydrocarbons C1-C6 C3-C12 C13-C30 C3-C30
The hydrocarbon range is chosen depending of the FT results if as
example the heavy product selectivity is very low it is not convenient to
consider these products in the calculation The equation for the
calculation is
21
logloglog nn
Wn (34)
where Wn is the weight fraction of product with n carbon atom number In
the excel file the equation used are
tot
C
C tmoles
moles i
i 60
min (35)
where ttot is the total time of FT run in hours
iCi PMmolesgi (36)
n
i
i
in
g
gW
1
(37)
The calculation of is then performed making a diagram in which the
n
Wnlog is reported vs the carbon atom number
133
Fig 433e Example of ldquo calculation pagerdquo in FT data elaboration excel file
ldquo calculation pagerdquo
The product distribution can be predicted using the AndersonminusSchulzminusFlory
(ASF) model that depends on the chain growth probability α Different factors
have an influence on the alpha parameter such as process conditions type of
catalyst and chemical promoters [6] The ASF product distribution as a function
of α is depicted in Figure 25 (Chapter 2)
According to ASF distribution ideally the molar fraction (Mn) of the
hydrocarbon product with a carbon number of n is only dependent on the
chain-growth probability (α) which is a function of the rates of chain growth
and chain termination by the following equation
Mn = (1minusα)αnminus1 (38)
In other words the product selectivity is determined by α value in an ideal
case A smaller α value leads to lighter (C1ndashC4) hydrocarbons while larger α
value results in the formation of heavier (C21+) hydrocarbons However the ASF
distribution is unselective for the middle-distillate products which are usually
the target products For examples the maximum selectivity to gasoline-range
(C5ndashC11) hydrocarbons is sim45 and that to diesel-range (C10ndashC20) hydrocarbons
is sim35 The development of selective FT catalysts which can tune the
134
selectivities to desired products is one of the most challenging targets in the
field of FT synthesis [7]
The probability is defined as the speed of growth (rg) divided by the sum of
the speeds of all the possible reactions for the species in growth
The probability to form a product Pn with n carbon atoms is the product of the
probabilities that the adsorbed species are formed in 1 2 n-1 carbon atoms
(precursors of the species Pn) and the probability that the adsorbed species an
carbon atoms desorb Writing a mathematical model leads to the ASF
2n 1
loglognn
Wlog (39)
where Wn is the mass fraction of the product with n carbon atoms
To get the equation of Anderson-Schulz-Flory We define
- as the probability of growth - rt as the rate of chain terminations - rp the speed of chain propagation
For a chain of n carbon atoms is defined another parameter n given by
1n
i
n
n
n
p
tn
1
r
r
(40)
where n is the probability that a chain of n carbon atoms remains on the
catalyst to continue the propagation of the chains n is the number of moles of
product Cn If n is constant throughout the range of products it may simply
indicate with and therefore starting from n = 1 we can write
3
134
2
123
12
So in general
135
1n1n
Starting from a generic molecule with x carbon atoms we can write
xnxn
(41)
Assuming that the monomeric units have the same molecular weight without
regard to their position in the growing chain (these monomer units are CH2
with PM = 14) we can obtain the weight fraction Wn multiplying the equation
(1) by n and dividing it by
1n
nn If we set x = 1 equation (41) remains
1n
1n
1n
1n
1n1
1n1
1n
n
nn
n
n
n
n
n
nW
(42)
The denominator of the last member of equation (42) can be written as
0n
n
(43)
In fact the operators
can be reversed and therefore
0n
1nn
0n0n
n
The series
0n
n for 1 be equal to 1
1
The series in question is of the type n32 arararaS
and the solution is equal to
r1
r1aS
n
Equation (2) can therefore be rewritten as follows
136
2
1n1n
0
n
1n
n1
n
1
1
nnW
or
21nn 1nW (44)
Bringing in logarithmic form the equation (44) we have
2n
n
n
n
1n
n
W
12nn
W
121nn
W
121nnW
)(lnlnln
)ln(lnlnln
)ln(ln)(ln
)ln(ln)(lnln
is identified by the slope of the straight line obtained by plotting the log
(Wnn) as a function of n The quality and the defect of the ASF model is its
simplicity one is in fact arises because of its ease of use across the agreement
with experimental data is not always fully satisfactory in fact the equation
provides undifferentiated products while in reality various species are
summarized
In this file are calculated different values of depending on the range of
carbon atoms C3-C12 C13-C30 C3-C30 Furthermore it was calculated an value
for the range C1-C6 because it is common to all the catalysts in fact the nature
of the tests performed on the various samples kinetics do not guarantee the
of the other range
Mathematically is calculated from
bullthe moles of carbonmin of the various components
bull from the moles of carbonmin it is possible to find the moles of each
component with the formula
137
hreactiontimeh
Cmolcarbontomol i
i
min60
min
From the moles it is possible to get the grams of each component
mol
gPMmolCmolg ii
Wn is calculated (weight fraction) for each component
n
1i
i
in
g
gW
i
calculating the value of Wnn (where n is the number of carbon atoms)
for each component
calculating the ln(Wnn)
By plotting the logarithm of the value of Wnn as a function of the number of
carbon atoms (n) is obtained a straight line whose slope gives the value of
desired
425 Hydrogen
Hydrogen balance (Fig 433f)
This data page allows to calculate the conversion of hydrogen and also the of
H2 in the gas mixture leaving from the reactor
H2 Conversion
Area H2
Area N2
Real Flow mix [Nml min-1]
Flow H2 OUT
[Nml min-1]
CONV H2 ()
() H2
138
As for the CO from the analysis at the micro-GC we get the chromatographic
areas of H2 and N2 that are used to calculate the outlet flow from the Fischer-
Tropsch plant of carbon monoxide by the formula
0017
2
2
22
OUTNflow
NArea
HAreaHflow OUT
where 7001 is the correction factor determined by the calibration of the
micro-gas chromatograph As the output flow of nitrogen is equal to that in the
input will have
0017
025
2
22
NArea
HAreaHflow OUT
At this point we can calculate the conversion of H2 by the formula
IN
OUTIN
Hflow
HflowHflowHConversion
2
222
The H2 is necessary to obtain the number of moles of hydrogen present in the
gaseous stream leaving from the reactor it is calculated through the formula
1002
2 TOT
OUT
flow
HflowH
Hydrogen Balance Also the balance of the hydrogen is performed at the end of the kinetic and it is
calculated with the following formula
2_
_2_
2
22222
Hfrom
waterheavylightMixfromHfrom
IN
OUTOUTOUTOUTIN
Hmoles
HmoliHmolesHmolesHmolesHmoles
where
139
1 18
2
phaseaqueous
OUT
weightwaterHmoles
2 2
2
CHPM
phaseorganicweightphaseorganicfomHmoles
The use of the molecular weight of methylene is because the CH2 is the
segment that grow joining to other segment of CH2 to give the different
hydrocarbons
3 moles of H2OUT light are the moles obtained by the summation of moles
of H2OUT of light hydrocarbons through the formula
2422
0102
jiOUT
OUT
compoundHngasmllightHmoles
Fig 433f Example of ldquohydrogen balancerdquo in FT data elaboration excel file
427 Oxygen Balance As for the other two balances also the oxygen balance is carried out at the end
of the kinetic run and it is calculated using the formula
COfrom
OHfomCOfromCOfromCOfrom
IN
OUTOUTOUTIN
Omoles
OmolesOmolesOmolesOmoles
_
2_2___
Where
140
1 18
phaseaqueous
OUT
weightwaterOmoles
2 422
2010 22
COgasmlCOOmoles OUT
OUT
In the calculation of the oxygen balance are not considered the oxygenated
products while the moles of OIN from CO and the moles of OOUT from CO are
respectively equal to the moles of COIN and COOUT from CO
b) Seconf FTS unit (Unit 2)
The shape of the file excel is presented in a different way but the equations
are the same equations presented before (See First FTS unit in this chapter)
The file is split in eleven pages XCO CH4 CO2 TCD data media paraffins
fractions (1-4) As example the pages of one FT run (made with a Co based
hydrotalcites catalyst Co35_2d) are reported in Fig 434a-d
TCD In Fig 434a-b are shown the conditions related to the number of tests
carried out by the gas chromatograph the time at which the analysis were
made and the outside temperature at the time of sampling the CO Conversion
that is referred to the quantity of gas reacted or converted referred to the gas
entering inn the plant From the gas chromatograph are taken the
chromatographic areas of CO CH4 CO2 and N2 and used to calculate the
selectivity
Fig 434a Example of ldquodata page _ TCDrdquo in FT data elaboration excel file
141
Fig 434b Example of ldquodata page _ TCDrdquo in FT data elaboration excel file
Datos In Fig434 c is shown the information related to the selectivity of light hydrocarbons
Fig 434 c Example of ldquolight hydrocarbons analysis pagerdquo in FT data elaboration
excel file
In Fig 434d the calculation of is then performed making a diagram in
which the
n
Wnlog is reported vs the carbon atom number
Fig 434 d Example of ldquo calculation pagerdquo in FT data elaboration excel file
142
43 Novelties on the FT plant made in this PhD work In the second year of the PhD the reactor used in the laboratory at the
ldquoUniversitagrave degli Studi di Milanordquo was brought in ldquoBrignolerdquo Company
(Legnano ndash MI) for a general control and revision
In this long revision some fundamentals improvements have been made on
the FT plant
all the analytical procedures were optimized verified and calibrated
A new flowmeter was included in the feed verified and calibrate
References
[1] CLBianchi C Pirola V Ragaini Cat Comm 7 (2006) 669
[2] ML Cubeiro Loacutepez A Colmenares L Texeira M Goldwasser M J Peacuterez
F Machado F Gonzaacutelez Applied Catalysis A General 167 (1998) 183-193
[3] C Pirola C L Bianchi A Di Michele P Diodati S Vitali V Ragaini Catal
Lett 131 (2009) 294ndash304
[4] C Pirola CL Bianchi A Di Michele S Vitali V Ragaini Catal Comm 10
(2009) 823ndash827
[5] C Pirola PhD 2007-2008 Novel supported iron based Fischer-Tropsch
catalysts Preparation characterization and applications Chapter 5
[6] Abell S Montan D ChemSusChem 2011 4 1538minus1556]
[7] Qinghong Z Weiping D Ye W Review Recent advances in understanding the key catalyst factors for Fischer-Tropsch synthesis J Ener Chem 2013 2227ndash38
143
Chapter 5 Catalysts preparation and characterization A serious of catalysts were prepared according different method of synthesis
and using cobalt and iron depending on the kind of the study
The catalysts reported in Table 51 are divided in two classes
1) Catalysts of cobalt based divided into two more groups
a Co based hydrotalcites with different amount of cobalt (5-35
wt) prepared with an innovative method of synthesis (urea
method)
b Co based catalysts with 8wt of cobalt with different supports
(SiO2 Al2O3 or TiO2) and the same samples with the addition of
01 of ruthenium carbonyl all of them synthesized with the
help of ultrasound
2) Catalysts of iron (30 wt) with fixed (optimized) loading of promoters
(K=20 Cu=375) and different method of synthesis
The catalysts of the first series (Co) subdivided in two more groups (HTlc and
bimetallic with the help of ultrasound) were studied to verify the activity of
this new kind of catalysts in the CO hydrogenation
More specifically the hydrotalcites were proposed as a new kind of catalysts
in which the active metal is part of the structural core of the HTlc has been
synthesized and tested Activity tests conducted in a fixed bed reactor resulted
in satisfactory catalytic performances as we will discuss later Moreover the
structural and catalytic properties of these materials were verified at FTS
operating conditions and correlations between catalyst features and efficiency
144
towards light and heavy hydrocarbons selectivities were achieved And the
cobalt based catalysts synthesized with the help of ultrasound (US) were
studied to test the effects of sonochemical synthesis to prepare novel
supported materials with particular properties as nanostructured catalysts [1]
The chemical effect of ultrasound arises from acoustic cavitation ie the
formation growth and implosive collapse of bubbles in a liquid Some of the
interesting features resulting from the application of sonication as a synthetic
method are the nanoparticles preparation showing a more uniform size
distribution higher surface area and a more controlled phase composition The
use of high power ultrasound for long time is a difficult procedure because it is
a critical point the control of the thermal stability of the ultrasound horn In
this PhDrsquos work the possibility to use an ultrasound assisted synthesis of Co-
based catalysts by high power ultrasound for a long time has been
investigated using an innovative experimental apparatus equipped with a new
cooling system able to maintain stable the temperature US emitting horn
The catalysts of the second series (Fe) were studied to verify the effect of the
different methods of synthesis and the variation of the H2 CO ratio in order to
simulate a feed with biosyngas and for an ulterior study about the develop of a
kinetic model The selection of this specific amount of Fe (30 wt) and
promoters (Cu and K with 20 wt and 375wt respectively) was taken from
a previous research [2] in which the effect of these amounts was extensively
studied
Promoters influence the bond strength of hydrogen and carbon oxide to metal
Addition of alkali metals (K in particular) to iron catalysts promotes electron
transfer to the iron and inhibits hydrogen adsorption because adsorption of
hydrogen induces electron donation to the iron surface Moreover K promotion
Chapter 5 Catalysts preparation and characterization
145
increases the electron density in iron and will result in an increase of CO
adsorption On Fe stronger metal-carbon bonds will lead to C2+ formation and
then to a low methane selectivity [3] Copper promotes the reduction of iron
oxide phases from hematite (Fe2O3) to magnetite (Fe3O4) and then from
magnetite to iron metal A suggested mechanism for this promotion effect is
the migration of atomic hydrogen from reduced Cu sites to the iron oxide The
copper needs to be very well mixed with iron oxide to provide the most
favourable promoter effect [4]
An innovative preparation procedure with the use of Ultrasound and
Microwave has been used with the iron based catalysts
In Table 51 a general summary of all the prepared catalyst is reported
Table 51 Summary of the catalysts synthesized and tested
Metal Catalysts Samples
Co
HTlc Co5
Co 10
Co 15
Co 35
Bimetallic US CoTiO2
CoSiO2
CoAl2O3
Co-RuTiO2
Co-RuSiO2
Co-RuAl2O3
Fe
Traditional Fe30K20Cu375 SiO2 At different temperature and H2CO ratio 21 15111
Traditional + MW MW1
MW2
Traditional + US
US1
US2
Co-precipitation
FeSiO2-TEOS
Chapter 5 Catalysts preparation and characterization
146
The catalysts were characterized by TPR BET SEM TEM ICP FT-IR micro-
RAMAN techniques in their fresh form (before the use in FT reactor) and in
some cases after different activation procedure or after FT runs
The physical properties of the catalysts (surface area and morphology) were
investigated by BET SEM and TEM analyses The theoretic catalysts
composition has been investigated and verified both qualitatively using SEM-
EDS FT-IR and micro-RAMAN techniques and quantitatively using ICP
characterization The reduction behaviour of metal phase has been
investigated by TPR analyses
51 Catalysts preparation
511 Catalyst preparation procedure
5111 Cobalt based catalysts
Two different types of cobalt based catalysts were prepared during this
research The synthesis is presented in the next paragraphs
Co based Hydrotalcites by a modified urea method
A series of ternary HTlc with general formula [CoxZn(1-x-
y)Aly(OH)2](NO3)y∙05H2O was synthesized by a modified-urea method [5]
Different volumes of the solutions of the metal nitrates all at a concentration
of 05 M were mixed to obtained either a Al(Co+Al) or Al(Co+Al+Zn) molar
ratio of 03
Solid urea was added to the solutions in a molar ratio of 4 vs Al The obtained
solutions were maintained at the reflux temperature in an open flask for 48 h
The precipitates were separated by centrifugation washed with water and
then dried at 80degC
Chapter 5 Catalysts preparation and characterization
147
Co based catalysts with the help of ultrasound
All the catalysts were prepared by a modified impregnation method The metal
precursors (cobalt and ruthenium carbonyl) were dissolved in n-decane
together with the different support (SiO2 Al2O3 or TiO2) The solution was
irradiated by an US horn (Fig 51) for 3 h at 20 kHz at 300 W and then put into
a rotating vacuum oven at 40degC at 36 rpm for 24 h (impregnation step)
Samples have been calcinated at 350 degC for 4 h
Fig 51 Ultrasound horn with a cooling jacket where the coolant has two main
characteristics low viscosity at low temperature and dielectric liquid
5112 Iron based catalysts Four different types of iron based catalysts were prepared during this
research The methods used were the traditional impregnation method the co-
precipitation method and the traditional impregnation method with the help of
microwave and ultrasounds
Fe based catalysts by the Traditional Impregnation method
The iron based supported on silica catalysts were prepared according to the
traditional impregnation method completely described in a previous work [6]
starting from an aqueous solution of precursors and adding in a second time
Chapter 5 Catalysts preparation and characterization
148
the support (silica) The reagents used for the samples preparation are
reported in Table 52
Table 52 Reagents used in the catalysts preparation Fe30K20Cu375 SiO2
Reagent Main characteristics
Support SiO2
Company Fluka (cod 60740) Mesh 70-230 60 Aring Molecular weight 60086 gmol Purity gt 99 Superficial area 500 m2g
Precursors
Fe(NO3)3middot9H2O Company Riedel de Hean Molecular weight 40385 gmol Purity 98
KNO3 Company Merk Molecular weight 10111 gmol Purity gt 99
Cu(CH3COO)2middotH2O Company Fluka Molecular weight 19965 gmol Purity 99
Solvent Extra pure water
The standard methodology for the catalysts preparation is the following
Drying of silica in oven (T=120degC) for a night
Weigh of the calculated amount of iron potassium and copper
precursors
In a pyrex vessel (250 ml) the weighed precursors the water (25 ml)
and silica (5 g) are added
The vessel is put on a rotavapor (36 rpm T=40degC P = 1 bar) for 24 hours
(Fig 52)
The solvent is evaporated (T = 80degC)
The powder is dried in oven (T=120degC) for 4 hours
Calcination (T = 500degC) in air for 4 hours
Chapter 5 Catalysts preparation and characterization
149
The catalyst is sieved to obtain a powder mesh between 100 and 140
Fig 52 Rotavapor used for catalyst preparation
The amount of precursors is calculated starting from the equation (1) to have
the requested iron percentage in the not promoted catalysts
FegSiOgFe
gFe
2
(1)
Then the moles of iron are equal as the moles of his precursor (moles Fe =
moles Fe(NO3)39H2O) The grams of precursors are calculated multiplying the
moles for the molecular weight of Fe(NO3)39H2O This quantity must be divided
for the purity grade of precursor
For the promoted catalysts the amount of precursors is calculated using the
following equations
FegSiOgCugKgFe
gFe
2
(2)
KgSiOgCugKgFe
gK
2
(3)
CugSiOgCugKgFe
gCu
2
(4)
Chapter 5 Catalysts preparation and characterization
150
The equation (2) (3) and (4) must be solved as equations system The moles of
Fe K and Cu are equal as the moles of respective precursors The grams of
precursors are calculated multiplying the moles for the molecular weight of
Fe(NO3)39H2O KNO3 and Cu(CH3COO)2H2O respectively This quantity must be
divided for the purity grade of each precursors
Specifically for the preparation of a catalyst having 30 wt of iron 2wt of
potassium and 375wt of copper on silica
2920037505
15600205
33523005
gCuggCugKgFe
gCu
gKggCugKgFe
gK
gFeggCugKgFe
gFe
moles Fe =molesg
g
84755
3352=00418 moles
moles K =molesg
g
098339
1560= 000398 moles
moles Cu =molesg
g
54663
2920= 00046 moles
g Fe(NO3)3middot9H2O = 00418 molesmiddot40385 gmoles = 16882 g
g KNO3 = 000398 molesmiddot10111gmoles = 04024 g
g Cu(CH3COO)2middotH2O = 00046 molesmiddot19965 gmoles = 09168 g
and the grams required to prepare the catalysts are
980
88216 g=17227 g Fe(NO3)3middot9H2O
Chapter 5 Catalysts preparation and characterization
151
1
40240 g = 04024 g KNO3
990
91680 g= 09261 g Cu(CH3COO)2middotH2O
Fe based catalysts by the Traditional Impregnation method with the help of
microwave (MW)
For the synthesis of the catalysts with the aid of microwave (MW) a final step
where the powder of catalyst already calcined is subjected to a MW
irradiation was added Two different methods for the MW irradiation were
used In the first one (MW1) a sample of catalyst was put into a beaker and
then into a classical microwave oven (Moulinex Micro-Chef 1305E 600W) for
30 min
In the second method (MW2) the catalyst (2 g) was suspended in hexane (400
ml) put into a microwave chemical reactor (ordinary 400 mL round bottom
glass flask filled with the liquid to be heated and activated) and treated for 1 h
at 60W MW were produced by a MW generator and sent to the MW
applicator by an insulated coaxial antenna Details of the MW applicator and of
the associated experimental techniques can be found in [7]
Fig 53 Microwave (MW) Power (35-300 W) Treatment duration (60 min)
Atmosphere (air)
Chapter 5 Catalysts preparation and characterization
152
Fe based catalysts by Traditional Impregnation method with the help of
ultrasound (US)
In this particular preparation method a step using ultrasound (US) has been
added Ultrasound is simply sound pitched above the frequency bond of human
hearing It is a part of sonic spectrum that ranges from 20 kHz to 10 MHz and
corresponds to the wavelengths from 10 to 10-3 cm [8] The application of
ultrasound in connection to chemical reactions is called sonochemistry The
range from 20 kHz to around 1 MHz is used in sonochemistry since acoustic
cavitation in liquids can be efficiently generated within this frequency range
[9] However common laboratory equipment utilizes the range between 20
and 40 kHz The Ultrasound are often used in the preparation of supported
catalysts (some examples are reported in ref [10]) and their useful
contribution concerns for example the dispersion of metal the size of particles
the surface area and the advantage is evident in the performance of catalyst in
many cases both in term of conversion and of process selectivity [11]
The use of ultrasound may be very efficient to optimize the dispersion of high
metal charge as already verified in our laboratory in the past [2 12-13]
US treatment has been performed between the impregnation and the
evaporation step by irradiating the silica-precursors solution using a Sonicator
(W-385 Heat Systems Ultrasonics) with an effective input power of 60 W and a
tip diameter of 13 mm (Fig54 and Fig 55) Silica solution promoters and
water have been sonicated by the US horn for 05 h in air (US1) The same
sample was successively sonicated in a suspension of hexane in argon for 3h
(US2)
Chapter 5 Catalysts preparation and characterization
153
Figura 54 Diagram of sonication step
1 Sonicator US (W-385 of Heat Systems Ultrasonics)
2 Emitter head of US equipped with a titanium tip of 13 mm
3 Beaker with the solution immerse in a bath of waterice
4 Flow meter of Ar
5 Connection with air
6 Argon Cylinder
Fig 55 Detail of the US treatment step 20 kHz 60 W tip diameter of 13 mm US
switched on and off alternatively for 05 seconds (pulsed US) t =30 min
1
4
6 3
2
5
Chapter 5 Catalysts preparation and characterization
154
Fe based catalyst by the co-precipitation method with TEOS
Acidic silica sol (ASS) and tetraethoxysilane (TEOS) are widely used as silica
sources of FeSiO2 catalysts [14-15] which can be incorporated into iron
catalyst matrix during the precipitation of catalyst precursors and have an
obviously dispersive effect on the iron oxide phase It is well known that the
tetraethoxysilane (TEOS) is insolvable in aqueous solutions but can slowly
hydrolyze to hydrophilic silica solgel [16]
In the TEOS- water system acid or basic can catalyze the hydrolysis of TEOS
[17] In the process of the co-precipitation TEOS hydrolyzes into silica
accompanied by the precipitation of ferric ions whereas the silica particles in
ASS may directly interact with ferric ions The different properties of two silica
sources should lead to a great diversity in both the structures and the
physicochemical properties of catalysts such as morphology dispersion
phases chemisorption Fe-SiO2 interactions and so on
As a FeSiO2 catalyst was prepared by a co-precipitation method using TEOS
The detailed process of the co-precipitation method has been described
elsewhere [18] In brief an alcoholic solution of TEOS was mixed with an
aqueous solution of iron nitrate with a FeSi atomic ratio of 10025 The mixed
solution was precipitated using an ammonium solution at 80 degC and a pH value
of 85-90 After precipitation the precipitates were aged for 2 h washed and
filtered Then the filtered cakes were dried at 120 degC overnight and calcined at
500 degC for 5 h The catalyst was denoted as FeSiO2-TEOS
Some calculations have been made to prepare the catalyst
To prepare 50ml 1M of solution of TEOS
To prepare a catalyst with a FeTEOS= 41 ratio and using 1g of Fe are required
Chapter 5 Catalysts preparation and characterization
155
To prepare the catalysts is required a ratio FeTEOS=41 thatrsquos mean 1g of Fe
correspond with 025g of TEOS
molFemolFeg
gFemolFe 01790
84755
1
OHNOgFeOHNOmolFe
OHNOgFe
molFe
OHNOmolFemolFeOHNOgFe 233
233
233233233 9)(387
980
1
9)(
9)(52403
1
9)(1017909)(
mll
ml
mol
Mlsol
gTEOS
molTEOSgTEOSmlTEOS 201
1
1000
1
11
33208
1250
700ml of distillate water was put into a beaker and heated at 77degC
OHNOgFe 233 9)(387 and 120ml of TEOS were added
Measurements of pH was taken until the solution acquired a pH
between 8 and 9
Let stand for 2 hours
The solvent is evaporated (T = 80degC)
The powder is dried in oven (T=120degC) for 4 hours
Calcination (T = 500degC) in air for 4 hours
The catalyst is sieved to obtain a powder mesh between 100 and 140
52 Catalysts characterization 521 Catalysis characterization introduction and theory
According to [19] the basic catalyst characterization involves two main steps
the investigation on the porous nature of the catalyst support (physical
properties) and on the properties of the active sites that are dispersed on the
support surface (table 53)
The complete and accurate knowledge of the properties of a catalyst is
fundamental for evaluating its performance In this work there were used
several techniques to investigate their physical and chemical properties
Chapter 5 Catalysts preparation and characterization
156
The characterization has been made for the fresh catalysts (after the
calcination at 500degC and before their loading and activation or use in FT
reactor) and in some cases after the activation and the FT reaction
Table 53 General scheme of catalysts characterization [19]
Catalyst texture
Physical properties Chemical properties
Result Technique Result Technique Geometry and shape - Optical microscopy Chemical composition -Electron spectroscopy
-Atomic adsorption
Total specific surface area
-Gas physisorption -Mercury porosimetry
Degree of dispersion -Selective chemisorption -X-ray -Electron microscopy -Magnetisation analysis
True density -X-ray analysis -Neutron diffraction
Degree of dispersion -Selective chemisorption -X-Ray -Electron microscopy -Magnetisation analysis
Bulk and apparent density
-Helium pycnometry -Mercury porosimetry -Liquid displacement
Surface Energy -Thermal analysis test -Temperature programmed desorption and reaction calorimetry
-Pore specific volume -Porosity
-Mercury porosimetry -Gas adsorption
Acid-base sites -Selective chemisorption -Temperature programmed desorption
Pore size and mean pore size
-Mercury porosimetry -Gas Adsorption
Redox sites -Spectroscopic methods -Temp programmed reduction -Temp Programmed oxidation
Particle size -Sieves -Laser scattering -Sedimentation -Electrical sensing zone -Etc
-Catalytic properties -Activity -Selectivity
Reactor tests and simulation
Surface structure -Optical microscopy -Electron microscopy -X-Ray analysis
Surface change Z potential
A brief description of the different techniques used in this work will be
presented as follow
Chapter 5 Catalysts preparation and characterization
157
BET (adsorption method for surface area evaluation)
SEM
TEM (electron microscopy)
FT-IR and RAMAN (vibrational spectroscopy for chemistry of surface
groups)
TPR (study of catalyst reduction vs temperature)
TPD
ICP (quantification of element inside the catalyst)
XRD
5211 BET analysis (adsorption method for surface area evaluation)
According to [20] the most widely used method for determining surface area
involves measuring the amount of gas adsorbed on a solid surface at a
temperature close to the boiling point of the gas Nitrogen is most commonly
used as the adsorbate
The interaction between the adsorbate and the adsorbent may be chemical
(chemisorption) or physical (physisorption) in nature and ideally should be a
surface-specific interaction If the adsorption is measured at several gas
pressures the Brunauer- Emmett-Teller (BET) [21] equation can be used to
calculate the amount of adsorbate required to form a monolayer [22] This
technique of characterization of solid has the particular equation that allows to
determine a parameter of great importance in the study of the solid ones that
is the superficial specific area Such parameter expresses the relationship
between the total surface of the catalyst and the weight of the same one and
usually is expressed in m2g Technique BET uses the principle of the physical
inert gas adsorption (nitrogen) to varying of the relationship between the
Chapter 5 Catalysts preparation and characterization
158
partial pressure of nitrogen and its vapor pressure to the temperature of liquid
nitrogen The technique can be carried in static or dynamic conditions
Opportune procedures of calculation allow also to determine the distribution
of the pores in the field of mesoporosity BET theory is a well-known rule for
the physical adsorption of gas molecules on a solid surface that is basis for an
important analysis technique for the measurement of the specific surface area
of a material The concept of the theory is an extension of the Langmuir theory
which is a theory for monolayer molecular adsorption to multilayer adsorption
with the following hypotheses (a) gas molecules physically adsorb on a solid in
layers infinitely (b) there is no interaction between each adsorption layer and
(c) the Langmuir theory can be applied to each layer The resulting BET
equation is the following
p
pc
p
p
p
pc
V
V
m111
(5)
Where
V = volume of adsorbed gas at pressure P
pdeg = gas saturation pressure at temperature T
ppdeg = relative pressure
C = BET constant expressed by the following
RTqqC L exp 1 (6)
Where
q1 = heat of adsorption of the first layer
qL = heat of adsorption of the second and higher layers
For the Vm calculation the (6) must be linearized and the linear relationship of
this equation is maintained only in the range of 005 lt P P0 lt 035
Chapter 5 Catalysts preparation and characterization
159
mm cV
p
pc
CV
p
pV
p
p
1
1
1
(7)
Equation (7) is an adsorption isotherm and can be plotted as a straight line with
1 V[(Pdeg P) minus 1] on the y-axis and P P0 on the x-axis according to
experimental results The specific surface area is determined on the Vm basis
mol
molAVm
V
ANVAS
(8)
Where
NAV = Avogradorsquos number
Amol= adsorption cross section (for N2 = 162 Aring2)
Vmol= molar volume of gas (22414 mlmol)
Experimental The samples have been analyzed using a Costech Sorptometer
1042 ldquoKELVINrdquo using liquid nitrogen Before the analysis the catalyst is put in
oven (T = 110degC for 16 h) to remove the adsorbed water Then a quantity
between 008 g and 02 g in analyzed in the instrument The sample is pre-
treated for 2 h at T = 200degC in a N2 flow to remove all the impurity then a
check with helium is made to calibrate the interspatial volume
5212 Temperature programmed reduction TPR analysis [19]
Some aspects related to catalysts characteristic and behaviour will be treated
as determination of metal surface area and dispersion spillover effect and
synterisation A description of the available techniques will follow taking in
consideration some aspects of the gas-solid interactions mechanisms
(associativedissociative adsorption acid-base interactions etc)
Chapter 5 Catalysts preparation and characterization
160
The thermal analysis methods may be used with different objectives the
reaction or desorption profile may be used qualitatively to fingerprint a given
system and then it is possible to make a quantitative considerations about the
nature of chemical processes the amount of gas involved in the chemical
reaction and finally to calculate the number of the active sites the reducibility
degree of the sample related to the catalytic activity All the methods relating
some characteristic properties of a catalyst to its temperature during a
programmable heating ramp are named commonly in the field of the thermal
analysis
The thermal analyses are often used to investigate surface modifications and
bulk reactivity by varying the surface composition the catalyst preparation
method the pre-treatment for catalyst activation and the analytical conditions
The TPRO involve a bulk reaction
The objectives of the programmed reduction (TPR) are essentially the
following 1) to find the most efficient reduction conditions 2) to identify the
supported precursor phases and their interactions with the support 3) to
characterize complex systems as bimetallic or doped catalyst to determine the
role of the second component ant to establish alloy formation or promotion
effects There are several interesting studies about this technique Robertson
et al [23] first reported TPR profile of nickel and nickel-copper catalysts and
since then many catalysts have been investigated In the TPR technique an
oxided catalyst precursor is submitted to a programmed temperature rise
while a reducing gas mixture is flowed over it (usually hydrogen diluted in
some inert gas as nitrogen or argon) An interesting application of this
technique is that the TPRO analysis may be used to obtain evidence for the
interaction between the atoms of two metallic components in the case of
bimetallic system or alloy as already cited In general TPRTPO studies are
Chapter 5 Catalysts preparation and characterization
161
carried out under low partial pressure of the reactive gas In this way it is
possible to observe the intermediate reactions depending from analytical
conditions as temperature rate flow rate and concentration of reactive gas
Experimental
Conventional temperature-programmed reduction experiments (TPR)
were performed on the calcined catalysts using a TPRDO110
instrument (Thermoquest) The samples were initially pre-treated in
flowing argon at 200degC for 05 h After being cooled to 50degC the H2Ar
(51 vv) reducing mixture flowed through the sample at 30 mlmin
while the temperature was increased from 50 to 900degC at constant rate
of 8 degCmin
5213 SEM and TEM analysis
In electron microscopy as in any field of optics the overall contrast is due to
differential absorption of photons or particles (amplitude contrast) or
diffraction phenomena (phase contrast) The method provides identification of
phases and structural information on crystals direct images of surfaces and
elemental composition and distribution Routine applications however may be
hampered by complexities of image interpretation and by constraints on the
type and preparation of specimens and on the environment within the
microscope
The scanning electron microscope (SEM) is a type of electron microscope that
creates various images by focusing a high energy beam of electrons onto the
surface of a sample and detecting signals from the interaction of the incident
electrons with the samples surface The type of signals gathered in a SEM
varies and can include secondary electrons characteristic x-rays and back
scattered electrons In a SEM these signals come not only from the primary
Chapter 5 Catalysts preparation and characterization
162
beam impinging upon the sample but from other interactions within the
sample near the surface The SEM is capable of producing high-resolution
images of a sample surface in its primary use mode secondary electron
imaging Due to the manner in which this image is created SEM images have
great depth of field yielding a characteristic three-dimensional appearance
useful for understanding the surface structure of a sample This great depth of
field and the wide range of magnifications are the most familiar imaging mode
for specimens in the SEM Characteristic x-rays are emitted when the primary
beam causes the ejection of inner shell electrons from the sample and are used
to tell the elemental composition of the sample The back-scattered electrons
emitted from the sample may be used alone to form an image or in conjunction
with the characteristic x-rays as atomic number contrast clues to the elemental
composition of the sample The SEM was pioneered by Manfred von Ardenne
in 1937 [24] and [25] The instrument was further developed by Charles Oatley
and first commercialized by Cambridge Instruments The spatial resolution of
the SEM depends on the size of the electron spot which in turn depends on
both the wavelength of the electrons and the magnetic electron-optical system
which produces the scanning beam The resolution is also limited by the size of
the interaction volume or the extent to which the material interacts with the
electron beam The spot size and the interaction volume both might be large
compared to the distances between atoms so the resolution of the SEM is not
high enough to image individual atoms as is possible in the shorter wavelength
(ie higher energy) transmission electron microscope (TEM) The SEM has
compensating advantages though including the ability to image a
comparatively large area of the specimen the ability to image bulk materials
(not just thin films or foils) and the variety of analytical mode available for
measuring the composition and nature of the specimen Depending on the
Chapter 5 Catalysts preparation and characterization
163
instrument the resolution can fall somewhere between less than 1 nm and 20
nm In general SEM images are easier to interpret than TEM images
According to [22] topographical images in a SEM are formed from back-
scattered primary or low-energy secondary electrons The best resolution is
about 2-5 nm but many routine studies are satisfied with a lower value and
exploit the case of image interpretation and the extraordinary depth of field to
obtain a comprehensive view of the specimen With non-crystalline catalysts
SEM is especially useful for examining the distribution and sizes of mesopores
An energy dispersive X-ray spectroscopy device is a frequent attachment in the
instrument
Fig 56 Schematic ray path for a scanning electron microscope (SEM) [26]
Transmission electron microscopy (TEM) is a microscopy technique whereby a
beam of electrons is transmitted through an ultra-thin specimen interacting
with the specimen as it passes through it An image is formed from the
electrons transmitted through the specimen magnified and focused by an
objective lens and appears on an imaging screen a fluorescent screen in most
TEMs plus a monitor or on a layer of photographic film or to be detected by a
sensor such as a CCD camera The first practical transmission electron
microscope was built by Albert Prebus and James Hillier at the University of
Chapter 5 Catalysts preparation and characterization
164
Toronto in 1938 using concepts developed earlier by Max Knoll and Ernst
Ruska
Theoretically the maximum resolution that one can obtain with a light
microscope has been limited by the wavelength of the photons that are being
used to probe the sample and the numerical aperture of the system Early
twentieth century scientists theorized ways of getting around the limitations of
the relatively large wavelength of visible light (wavelengths of 400ndash700
nanometers) by using electrons Like all matter electrons have both wave and
particle properties (as theorized by Louis-Victor de Broglie) and their wave-like
properties mean that a beam of electrons can be made to behave like a beam
of electromagnetic radiation Electrons are usually generated in an electron
microscope by a process known as thermionic emission from a filament usually
tungsten in the same manner as a light bulb or by field emission The
electrons are then accelerated by an electric potential (measured in V or volts)
and focused by electrostatic and electromagnetic lenses onto the sample The
beam interacts variously with the sample due to differences in density or
chemistry The beam that is transmitted through the sample contains
information about these differences and this information in the beam of
electrons is used to form an image of the sample The contrast in a TEM image
is not like the contrast in a light microscope image A crystalline material
interacts with the electron beam mostly by diffraction rather than absorption
although the intensity of the transmitted beam is still affected by the volume
and density of the material through which it passes The intensity of the
diffraction depends on the orientation of the planes of atoms in a crystal
relative to the electron beam at certain angles the electron beam is diffracted
strongly from the axis of the incoming beam while at other angles the beam is
largely transmitted
Chapter 5 Catalysts preparation and characterization
165
Just as details of a light microscope sample can be enhanced by the use of
stains staining can be used to enhance differences in a sample for electron
microscopy Compounds of heavy metals such as osmium lead or uranium can
be used to selectively deposit heavy atoms in areas of the sample and to
enhance structural detail by the dense nuclei of the heavy atoms scattering the
electrons out of the optical path The electrons that remain in the beam can be
detected using a photographic film or fluorescent screen among other
technologies So areas where electrons have been scattered in the sample can
appear dark on the screen or on a positive image due to this scattering TEM is
suitable for examination of supported catalysts with particle sizes down to 2-3
nm giving information on particle location over the support on particle-size
distributions in favourable cases on particle and support morphology and on
the nature and distribution of deposits having a thickness of the order of 2-3
nm Surface topography can be examined using replication techniques [22]
Fig57 Schematic ray path for a transmission electron microscope (TEM) [26]
Experimental The SEM analysis have been made in collaboration with Perugia University
SEM images were measured using an electron microscopy Philips XL-30CP with
RBS detector of back-scattered electrons and EDS analyzer was used to
describe the surface and elemental composition of catalysts
Chapter 5 Catalysts preparation and characterization
166
The TEM analysis have been made in collaboration with Perugia University The
morphology of the samples was investigated by a transmission electron
microscope Philips 208 Transmission Electron Microscope (TEM) a drop of the
dispersion was deposited on a copper grid covered with a polymeric film
Formvar subsequently evaporated in air at room temperature
In order to obtain more accurate information concerning the atomic
percentage of the elements on the surface EDX measurements were made
using the high-resolution TEM instrument at the Department of Chemical
Science and Technology and Biosystems studies at the University of Siena This
instrumentation allows to obtain with high precision information on the atomic
percentage in different areas of the sample going to select individual points or
individual areas
5214 FT-IR analysis
This vibrational spectroscopy is used for characterization of high area
supported or unsupported catalysts Information is available either directly or
by study of probe adsorbates on the chemistry of surface groups (particularly
on oxides) It is also used for the study of the behavior of precursor compounds
during catalyst preparation
Infrared spectroscopy is the subset of spectroscopy that deals with the infrared
region of the electromagnetic spectrum It covers a range of techniques the
most common being a form of absorption spectroscopy As with all
spectroscopic techniques it can be used to identify compounds or investigate
sample composition Infrared spectroscopy correlation tables are tabulated in
the literature
The infrared portion of the electromagnetic spectrum is divided into three
regions the near- mid- and far- infrared named for their relation to the visible
spectrum The far-infrared approximately 400-10 cm-1 (1000ndash30 μm) lying
Chapter 5 Catalysts preparation and characterization
167
adjacent to the microwave region has low energy and may be used for
rotational spectroscopy The mid-infrared approximately 4000-400 cm-1 (30ndash
14 μm) may be used to study the fundamental vibrations and associated
rotational-vibrational structure The higher energy near-IR approximately
14000-4000 cm-1 (14ndash08 μm) can excite overtone or harmonic vibrations The
names and classifications of these sub regions are merely conventions They
are neither strict divisions nor based on exact molecular or electromagnetic
properties
Infrared spectroscopy exploits the fact that molecules have specific frequencies
at which they rotate or vibrate corresponding to discrete energy levels These
resonant frequencies are determined by the shape of the molecular potential
energy surfaces the masses of the atoms and by the associated vibronic
coupling In order for a vibrational mode in a molecule to be IR active it must
be associated with changes in the permanent dipole In particular in the Born-
Oppenheimer and harmonic approximations ie when the molecular
Hamiltonian corresponding to the electronic ground state can be approximated
by a harmonic oscillator in the neighbourhood of the equilibrium molecular
geometry the resonant frequencies are determined by the normal modes
corresponding to the molecular electronic ground state potential energy
surface Nevertheless the resonant frequencies can be in a first approach
related to the strength of the bond and the mass of the atoms at either end of
it Thus the frequency of the vibrations can be associated with a particular
bond type
Simple diatomic molecules have only one bond which may stretch More
complex molecules have many bonds and vibrations can be conjugated
leading to infrared absorptions at characteristic frequencies that may be
related to chemical groups For example the atoms in a CH2 group commonly
Chapter 5 Catalysts preparation and characterization
168
found in organic compounds can vibrate in six different ways symmetrical and
antisymmetrical stretching scissoring rocking wagging and twisting
The infrared spectra of a sample are collected by passing a beam of infrared
light through the sample Examination of the transmitted light reveals how
much energy was absorbed at each wavelength This can be done with a
monochromatic beam which changes in wavelength over time or by using a
Fourier transform instrument to measure all wavelengths at once From this a
transmittance or absorbance spectrum can be produced showing at which IR
wavelengths the sample absorbs Analysis of these absorption characteristics
reveals details about the molecular structure of the sample
This technique works almost exclusively on samples with covalent bonds
Simple spectra are obtained from samples with few IR active bonds and high
levels of purity More complex molecular structures lead to more absorption
bands and more complex spectra The technique has been used for the
characterization of very complex mixtures
According to [10] problems in vibrational spectroscopy include low
transmission at high metal loadings and strong oxide scattering Absorption at
lower wavenumbers often prevents observation of modes such as adsorbate-
metal stretching Fourier Transform (FI-IR) spectrometers offer two
pronounced advantages over dispersive instruments higher energy throughput
and faster data acquisition or higher signal-to-noise ratio Data processing is
easy These features are significant when examining very strongly absorbing
and scattering solids and when following dynamic processes Much IR
transmission work however requires examination of only limited frequency
ranges at medium resolution and computerised dispersive spectrometers may
then be preferable
Chapter 5 Catalysts preparation and characterization
169
Experimental The FT-IR analysis have been made in collaboration with Perugia
University Infrared spectra were measured with a FTIR model IFS113V Bruker
spectrometer resolution of 1 cm-1 in the spectral region 370-5000 cm-1
Fig 58 FTIR model IFS113V Bruker spectrometer
5215 micro-Raman analysis
Raman spectroscopy is more versatile for catalysts characterization and in
comparison with IR spectroscopy it presents at least two important
advantages there is no need of sample preparation and the spectra of water-
metal interfaces are obtained easily and quickly
Raman spectroscopy is a spectroscopic technique used in condensed matter
physics and chemistry to study vibrational rotational and other low-frequency
modes in a system [27] It relies on inelastic scattering or Raman scattering of
monochromatic light usually from a laser in the visible near infrared or near
ultraviolet range The laser light interacts with photons or other excitations in
the system resulting in the energy of the laser photons being shifted up or
down The shift in energy gives information about the phonon modes in the
system Infrared spectroscopy yields similar but complementary information
Typically a sample is illuminated with a laser beam Light from the illuminated
spot is collected with a lens and sent through a monochromator Wavelengths
close to the laser line due to elastic Rayleigh scattering are filtered out while
Chapter 5 Catalysts preparation and characterization
170
the rest of the collected light is dispersed onto a detector Spontaneous Raman
scattering is typically very weak and as a result the main difficulty of Raman
spectroscopy is separating the weak inelastically scattered light from the
intense Rayleigh scattered laser light Raman spectrometers typically use
holographic diffraction gratings and multiple dispersion stages to achieve a
high degree of laser rejection In the past PMTs were the detectors of choice
for dispersive Raman setups which resulted in long acquisition times
However the recent uses of CCD detectors have made dispersive Raman
spectral acquisition much more rapid Raman spectroscopy has a stimulated
version analogous to stimulated emission called stimulated Raman scattering
The Raman effect occurs when light impinges upon a molecule and interacts
with the electron cloud of the bonds of that molecule The incident photon
excites one of the electrons into a virtual state For the spontaneous Raman
effect the molecule will be excited from the ground state to a virtual energy
state and relax into a vibrational excited state which generates Stokes Raman
scattering If the molecule was already in an elevated vibrational energy state
the Raman scattering is then called anti-Stokes Raman scattering A molecular
polarizability change or amount of deformation of the electron cloud with
respect to the vibrational coordinate is required for the molecule to exhibit the
Raman effect The amount of the polarizability change will determine the
intensity whereas the Raman shift is equal to the vibrational level that is
involved This technique is widely applicable The large frequency range (50-
4000 cm-1) makes adsorbate-adsorbent stretching modes accessible Problems
include specimen heating high background fluorescence and low signal
strengths Surface enhanced Raman scattering (SERS) however can give
greatly increased signals in favorable cases eg with rough surfaces or small
Chapter 5 Catalysts preparation and characterization
171
particles of certain compounds It is particularly useful in the studies of
supported monolayer catalysts and adsorbed layers [22]
Experimental The Micro-Raman analysis have been made in collaboration with
Perugia University Micro-Raman spectra were made by an Olympus
microscope mod BX40 connected to an ISA Jobin-Yvon model TRIAX320 single
monochromator resolution 1 cm-1 The exciting source was a Melles Griot
25LHP925 He-Ne laser used in single line excitation mode at 6328 nm The
power focused on the samples was always less than 2 mW The scattered
Raman photons were detected by a liquid-nitrogen cooled CCD Jobin Yvon
Mod Spectrum One Samples were not pre-treated but measured as a power
placed on a microscope slide in this way it is possible to analyse the few
microns grain size and not to focus on those regions where the presence of the
support (silica) was predominant The reproducibility of the spectra was always
controlled sampling different points of the catalyst Through the optical
microscope analysis we also verified that no local degradation occur during
laser irradiation
5216 ICP-MS analysis
ICP-MS (Inductively coupled plasma mass spectrometry) is a type of mass
spectrometry that is highly sensitive and capable of the determination of a
range of metals and several non-metals at very low concentrations It is based
on coupling together an inductively coupled plasma as a method of producing
ions (ionization) with a mass spectrometer as a method of separating and
detecting the ions ICP-MS is also capable of monitoring isotopic speciation for
the ions of choice A plasma is a gas that contains a sufficient concentration of
ions and electrons to make the gas electrically conductive The plasmas used in
Chapter 5 Catalysts preparation and characterization
172
spectrochemical analysis are essentially electrically neutral with each positive
charge on an ion balanced by a free electron In these plasmas the positive ions
are almost all singly-charged and there are few negative ions so there are
nearly equal numbers of ions and electrons in each unit volume of plasma
ICP for spectrometry is sustained in a torch that consists of three concentric
tubes usually made of quartz The end of this torch is placed inside an
induction coil supplied with a radio-frequency electric current A flow of argon
gas (usually 14 to 18 lmin) is introduced between the two outermost tubes of
the torch and an electrical spark is applied for a short time to introduce free
electrons into the gas stream These electrons interact with the radio-
frequency magnetic field of the induction coil and are accelerated first in one
direction then the other as the field changes at high frequency (usually 2712
million cycles per second) The accelerated electrons collide with argon atoms
and sometimes a collision causes an argon atom to part with one of its
electrons The released electron is in turn accelerated by the rapidly-changing
magnetic field The process continues until the rate of release of new electrons
in collisions is balanced by the rate of recombination of electrons with argon
ions (atoms that have lost an electron) This produces a lsquofireballrsquo that consists
mostly of argon atoms with a rather small fraction of free electrons and argon
ions The temperature of the plasma is very high of the order of 10000 K The
ICP can be retained in the quartz torch because the flow of gas between the
two outermost tubes keeps the plasma away from the walls of the torch A
second flow of argon (around 1 lmin) is usually introduced between the
central tube and the intermediate tube to keep the plasma away from the end
of the central tube A third flow (again usually around 1 lmin) of gas is
introduced into the central tube of the torch This gas flow passes through the
centre of the plasma where it forms a channel that is cooler than the
Chapter 5 Catalysts preparation and characterization
173
surrounding plasma but still much hotter than a chemical flame Samples to be
analyzed are introduced into this central channel usually as a mist of liquid
formed by passing the liquid sample into a nebulizer As a droplet of nebulised
sample enters the central channel of the ICP it evaporates and any solids that
were dissolved in the liquid vaporize and then break down into atoms At the
temperatures prevailing in the plasma a significant proportion of the atoms of
many chemical elements are ionized each atom losing its most loosely-bound
electron to form a singly charged ion
The ions from the plasma are extracted through a series of cones into a mass
spectrometer usually a quadrupole The ions are separated on the basis of
their mass-to-charge ratio and a detector receives an ion signal proportional to
the concentration
The concentration of a sample can be determined through calibration with
elemental standards ICP-MS also lends itself to quantitative determinations
through Isotope Dilution a single point method based on an isotopically
enriched standard
Experimental ICP measurements were determined by Inductively Coupled
Plasma-Optical Emission Spectrometers (ICP-OES) Varian 700-ES
Fig 59 Instrument Varian Liberty ICP-OES
Chapter 5 Catalysts preparation and characterization
174
Fig 510 scheme of instrument Varian Liberty ICP-OES
5217 XRD
The XRD analysis have been made in collaboration with Perugia University
The obtained materials were characterized by X-ray powder diffraction (XRD
PANalytical XrsquoPert Pro CuKα radiation) operating at 40 kV and 40 mA step scan
1 min_1 and 1 s counting time in the 2ndash40deg range at room temperature
Fig 511 Instrument XRD PANalytical XrsquoPert Pro CuKα radiation
522 Catalysts characterization results The characterization analyses were performed on the fresh and in some cases
on used catalysts ldquoFresh catalystsrdquo indicate the samples as prepared
ldquoActivated catalystsrdquo indicate the samples charged in the FTS reactor and
reduced using the activation procedure and removed from the reactor ldquoUsed
Chapter 5 Catalysts preparation and characterization
175
catalystsrdquo indicate the samples after their use in the Fischer-Tropsch synthesis
reaction
5221 BET characterization results
The BET results are reported in Table 54
Table 54 BET characterization results
CATALYST Specific Surface area
(m2g)
Co-based
HTlc
Co5 1746
Co10 1147
Co15 720
Co35 584
Co
synthesized
with US
CoSiO2 3600
CoAl2O3 1160
CoTiO2 550
Co-RuSiO2 3460
Co-RuAl2O3 1080
Co-RuTiO2 130
Fe-based
Fe30K20Cu375 TR 160
Fe30K20Cu375-MW1 180
Fe30K20Cu375-MW2 224
Fe30K20Cu375-US1 201
Fe30K20Cu375-US2 210
MW1= Catalyst put it into a kitchen MW and processed in powder MW2= Catalyst put it into MW and suspended in hexane US1= Catalyst suspended in aqueous solution in air atmosphere for 05 h US2= Catalyst sonicated and suspended in hexane in Argon atmosphere for 3h
The composition and specific surface area (SSA) of the HTlc are reported
in Table 54 Note that the SSA decreases with the increase of the
amount of cobalt The relatively large dimensions and high crystallinity
of particles reflect a low specific surface area [28] The surface area of
Co15 and Co35 after the reduction procedure was determined by BET
Chapter 5 Catalysts preparation and characterization
176
method The values obtained are 734 m2 g-1 for the sample Co15 and
783 m2 g-1 for the sample Co35 both higher than the untreated
materials
For the Co and Co-Ru based catalysts synthesized with the help of
ultrasound it is clear how the addition of the promoter show a
diminution of the SSA in every case (CoSiO2 3600 higher than the co-
respective Co-RuSiO2 with 3460 550 and 130 for Co and Co-RuTiO2
and 1160 and 1080 for Co and Co-RuAl2O3) The SiO2 acts as the best
support even in presence of the promoter The TiO2 tends to keep lower
the SSA of the catalyst and the Al2O3 represents an intermediate way of
the supports used in this group of catalysts
The surface area of catalysts is influenced by the method of synthesis
as shown in Table 55 and in Fig 512 Fe-based catalysts treated with
MW and US have higher values of SSA than the traditional ones the
effect of MW and US on SSA increases increasing the US or MW
emitting power
According to [1] The samples sonicated in argon (US2) present the
highest SSA indicating that the US effects in argon atmosphere are
more remarkable The use of this gas enhances cavitation effects
because increases the temperatures of the collapsing bubbles
generated by US [29] The change of catalysts morphology due to US
treatment (SEM analyses) could explain the increase of SSA in these
samples Catalysts prepared by MW show a higher SSA than the
traditional ones 180 and 224 m2 g-1 for the samples Fe30-MW1 and
Fe30-MW2 respectively with a similar increase of about 25 respect
the traditional prepared sample Moreover the surface area of these
Chapter 5 Catalysts preparation and characterization
177
samples seems not to be dependent on the power of the MW
treatment
Fig 512 Fe30K20Cu375 surface area vs different methods of synthesis
5222 TPR characterization results
Co-based catalysts HTLc
As discussed previously the active phase in the FTS is the metallic cobalt while
the HTlc materials contain Co(II) ions randomly dispersed inside the brucitic
layers Therefore in order to have an active catalyst a reduction procedure is
required to form the cobalt particles TPR analyses were performed to study
the reduction process and select the best conditions for the catalyst activation
Fig 513 shows the TPR profile of the samples Co5 Co15 Co35 while Table 55
reports the reduction temperature and the percentage of reduced Co All the
profiles exhibit two regions of reduction the first at lower temperatures
(below 400degC) which is due to the reduction of Co3O4 while the second peak
above 700 degC indicates the presence of hardly reducible species These species
are probably spinel-type mixed oxides formed during the thermal treatment
TPR profiles of CoOx mixed oxides is well described in the literature [30-36]
The reduction profile of Co3O4 in the low temperature region consists in two
peaks corresponding to the reduction of Co3+ to Co2+ and Co2+ to Co0
Chapter 5 Catalysts preparation and characterization
178
According to Alvarez et al [37] these two peaks are well separated for samples
with small particle size while an intermediate particle size causes the
overlapping of the two reduction steps resulting in a complete reduction with
only one maximum at an intermediate temperature (328 degC) The TPR profiles
of our HTlc (Fig 513) are consistent with the latter case Based on the TPR
results (Table 55) the tested catalysts were activated at 350degC for 4 hours
under hydrogen atmosphere in order to reduce the Co ions to metallic Co
Fig 513 TPR profile of the fresh samples Co5 Co10 Co15 Co35 The activation
temperature used in the FTS reactor before the catalytic test is indicated with the
dashed line
Chapter 5 Catalysts preparation and characterization
179
Note that the sample Co15 exhibit the lowest reduction temperature that is
significantly lower than the activation temperature adopted in the FT process
(350degC) A low reduction temperature may favour the presence of catalyst in its
reduced state during the catalytic process The of reduced Co evaluated by
TPR is generally high However these values strongly depend on reduction
conditions (pressure temperature ramp gas flow etc) that are different from
those used in the FT reactor as detailed in the experimental section
Table 55 Reduction temperature and of cobalt reduction of the fresh samples Co5
Co15 Co35
Sample TPR
Tmax (degC) Co Red
Co5 328 58
Co15 278 54
Co35 295 83
Co and Co-Ru catalysts synthesized with US
Table 56 shows the TPR profiles of the samples CoAl2O3 CoSiO2 CoTiO2
and Co-RuAl2O3 Co-Ru SiO2 Co-Ru TiO2
Chapter 5 Catalysts preparation and characterization
180
Table 56 TPR diagrams and values summary for Co and Co-Ru catalysts with US
Catalyst TPR Profile
CoAl2O3
Co SiO2
CoTiO2
Co-RuSiO2
Co-RuAl2O3
Co-RuTiO2
Iron catalysts
Chapter 5 Catalysts preparation and characterization
181
For the supported iron based catalysts three stage of phase transformation
could be identified starting from oxidised form of iron hematite (Fe2O3) to
magnetite (Fe3O4) magnetite to metallic iron (-Fe) [39] It is known [39-40]
that copper promotes the reduction to hematite to magnetite and also the
reduction of magnetite to -Fe to a lesser extent but it needs to be very well
mixed with iron to provide the most favourable promoter effect on the
hematite rarr magnetite phase transformation For what concerns the support
(silica) Jin and Datye [38] observed that the most important effect of silica is
an improvement in the thermal stability of the catalysts in fact the silica
support is very effective at inhibiting the sintering of the iron catalyst
The results of TPR characterization for iron catalysts are reported in Table 57
The number the position and the shape of the peaks agree with literature [38]
In many cases the TPR peaks corresponding to transformations of CuO rarr Cu
and Fe2O3 rarr Fe3O4 were found to overlap and this is the first peaks at low
temperature The second broad peak at higher temperature on the TPR profile
corresponds to the phase transformation of Fe3O4 rarr -Fe The large peak
width for this last transformation indicates this is slow process
TPR analyses show that the metal reduction starts at about 230degC for promoted
catalysts According to Pirola [2] it is clear therefore the role of Cu in the
improvement of iron oxide phases reduction as well known in literature a
suggested mechanism for this promotion effect is the migration of atomic
hydrogen from reduced Cu sites to the iron oxide [38 40]
Therefore the different preparation methods do not influence the peaks
temperature of the reduction steps of the catalytic samples in any case
Chapter 5 Catalysts preparation and characterization
182
Table 57 TPR diagrams and values summary for Fe30K20Cu375 catalysts with different
methods of synthesis
Catalysts Diagrams
Fe30K2Cu375SiO2
Fe30K2Cu375SiO2
(MW2)
Fe30K2Cu375SiO2
(MW1)
Fe30K20Cu375 SiO2 (US1)
305133 467463
800
Temperature degC0 200 400 600 800
800
Sig
na
l (
mV
)
0
200
400
600
800
5223 SEM ndash TEM characterization results
Chapter 5 Catalysts preparation and characterization
183
SEM analyses are reported in Fig 514 (for HTlc) Fig 515 (for Co and Co-Ru
with US) and in Fig 516 (for Fe catalysts)
Cobalt Catalysts
o HTlc
The morphology of the synthesized HTlc was investigated by SEM and TEM
Images of Co15 and Co35 selected as representative samples (Fig 514 a-d)
show that they are constituted by homogeneous aggregates of hexagonal and
platy particles of few hundreds nanometers of thickness and with a
dimensional range between 2-5 μm In TEM micrographs the hexagonal
morphology of HTlc microcrystals is clearer The relatively large dimensions and
high crystallinity of particles reflect a low specific surface area in the range of
6-18 m2g-1 (Table 54) Composition maps of Co15 (Fig 515) obtained with
coupled SEM-EDS analysis highlight the homogeneous Co Zn and Al dispersion
over the entire analyzed spot area without creating single-metal domains
indicating good metal distributions in the samples Similar dispersion
characteristics were obtained for all the samples studied although not
reported here for the sake of brevity
Fig5 14 SEM (left) and TEM (right) images of fresh samples Co15 (ab) and Co35 (cd)
Chapter 5 Catalysts preparation and characterization
184
Fig5 15 SEM image of fresh sample Co15 and the corresponding EDS images of the
metals Al (red) Co (white) and Zn (pink)
SEM and TEM images of two activated samples are reported in Fig 16a-d The
results indicate that the material keeps the original morphology with hexagonal
crystals of micrometric dimensions At higher magnification (TEM images) the
segregation of dense particles homogeneously distributed on the surface and
having dimensions of about 8 nm probably due to metallic Co was evident
[41]
Fig 516 SEM (left) and TEM (right) images of activated Co15 (ab) and Co35 (cd)
SEM images of Co5 Co15 and Co35 after the catalytic run at 260degC are shown
in Fig 517 Samples containing Zn (Co5 and Co15) reveal the presence of a
Chapter 5 Catalysts preparation and characterization
185
nanometric phase crystallized on the catalyst surfaces The absence of this
nanometric phase on Co35 surface (which does not contain Zn) may indicate
the presence of ZnO according to the XRD pattern (it will be show later)
Fig517 SEM images of Co5 (ab) Co15 (cd) Co35 (ef) after catalytic run at
260degC and 20 bar and at different magnifications
o Co and Co-Ru synthesized with US The Fig 518 show the SEM
analyses of the samples with and without the presence of Ru
The chemical effect of US arises from acoustic cavitation ie the
formation growth and implosive collapse of bubbles in a liquid
Some of the interesting features resulting from the application
of sonication as a synthetic method are the nanoparticles
Chapter 5 Catalysts preparation and characterization
186
preparation showing a more uniform size distribution higher
surface area and a more controlled phase composition
(Fig518)
Fig 518 SEM analyses for Co based catalysts with US Magnification 2000X
Iron Catalysts
SEM analyses are essential to evaluate the morphology of catalysts with high
loading of iron and to control the metal dispersion The iron covers the surface
of silica in a progressive level with its increase and it is well distributed in the
more loaded catalyst too [40]
Chapter 5 Catalysts preparation and characterization
187
The aggregates of iron with spherical shape are regularly distributed on the
support In the case of the catalysts prepared with the step of ultrasound it
can be seen an uniform layer of iron on SiO2 The spherical shape aggregates
are substituted by this iron layer The catalyst morphology and the metal
dispersion are similar for the two US samples [43]
SEM analyses (Fig 519) have been the key to both evaluate the morphology of
all the prepared catalysts and observe their metal distribution (using EDX
analysis) Notwithstanding this general trend both the morphology and the
shape of iron aggregates strongly depend on preparation method In Fig 519
SEM analysis of samples through different preparation methods are reported
In the traditional prepared sample (Fig 519a) it is possible to observe Fe
spherical shape aggregates on the bare silica surface Iron is present only in
these particles and coverage of the support is not complete The same
morphology is present in the MW prepared sample (Fig 519b) On the
contrary on US prepared ones (Fig 519c (air) and 519d (argon)) there is a
uniform layer of iron on SiO2 The support in fact is not easily visible due to its
complete coverage as confirmed by SEMndashEDX analyses The spherical shape
aggregates are substituted by this iron layer both the catalyst morphology and
the metal dispersion are similar for the two US samples but completely
different with both the traditional and the MW ones
It is even more interesting the comparison between samples prepared by
different sonication time for example Fe30-US2 (Fig 519c) and Fe30-US1 (Fig
519d) when the US treatment is performed for 05 h the surface seems to be
covered by Fe small leafs that are completely faded when sonication is
prolonged for 3 h and in their place only crashed Fe clusters are present [1]
Chapter 5 Catalysts preparation and characterization
188
a) Traditional b) MW2
c) US1 d) US2
Fig 519 SEM analyses for iron catalysts Magnification 2000X
5224 XRD and micro-RAMAN characterization results
Cobalt Catalysts
o For the HTlc the XRD and micro-RAMAN analyses Figure 520
shows the XRD patterns of the samples listed in Table 51 The
interlayer distance of 89 Aring determined from the first XRD
reflection is compatible with the presence of nitrate between
the sheets [43]
Chapter 5 Catalysts preparation and characterization
189
Fig 520 XRD pattern of the fresh samples (a) Co5 (b) Co10 (c) Co15 and (d) Co35
Activated HTlc were first characterized by XRD As an example the XRD pattern
of activated Co15 is reported in Fig 521 The pattern shows the presence of
very poorly crystalline ZnO and a spinel phase such as Co3O4 CoAl2O4 andor
ZnAl2O4 (note that mixed-oxide spinel phases show very similar XRD patterns
irrespective of their composition) Moreover the reflection at 43deg 2has been
assigned to a CoO phase with very low crystallinity and no metal aggregation is
observed The sample after the reduction treatment does not show metallic Co
phases indicating the presence of active metal atoms homogeneously
dispersed at the nanometer level [44] According to Jong et al [45] and Den
Breejenet et al [46] cobalt-based catalysts need large particle size of the active
species to create optimal domains of active sites because the activity drops for
particles smaller than 6 nm
Chapter 5 Catalysts preparation and characterization
190
Fig 521 XRD pattern of activated Co15 ZnO Co3O4 CoAl2O4 ZnAl2O4 sect CoO
In order to better understand the stability of the materials XRD patterns of
sample Co15 after the catalytic tests at two different temperatures (235degC and
260degC) were collected (Fig 522) At the lower temperature (Fig 522 a) the
pattern is close to that recorded just after the reduction process (Fig 521)
Therefore we can hypothesize that the catalyst does not change as a
consequence of the FTS process On the other hand the XRD pattern of the
catalyst recovered after the reaction at 260degC (Fig 522b) shows more
crystalline ZnO and spinel phase and the strong reduction of the peak assigned
to CoO This may indicate that during the FTS process at high temperatures
cobalt ions crystallized into a spinel phase
Chapter 5 Catalysts preparation and characterization
191
Fig522 XRD pattern of used Co15 after catalytic runs a) at 235degC and
20 bar and b) at 260degC and 20 bar ZnO Co3O4 CoAl2O4 ZnAl2O4 sect
CoO
Iron catalysts
The XRD and micro-RAMAN analyses were made to identify the iron phase
after the calcination treatments A Raman spectrum (Fig 523a) and an XRD
pattern (Fig 523b) for Fe30K2Cu375SiO2 are reported
Chapter 5 Catalysts preparation and characterization
192
Fig 523 a) Micro-Raman analysis and b) XRD for the Fe30K2Cu375SiO2 catalyst
Comparing these results with the tables reported in literature [47-48] for the
assignment of the peaks it is possible to conclude that the iron after calcination
is present as hematite Fe2O3 as expected and as reported in literature [39]
5255 ICP characterization results ICP analysis was made to verify the catalysts composition
Cobalt based catalyst
o HTlc In Table 58 the results are reported
Table 58 ICP characterization results for Co catalysts (HTlc)
HTlc
Atomic percentage in solution Basic Formula
Zn Co Al
Co5 55 15 30 [Zn057
Co010
Al033
(OH)2](NO
3)033
middot05 H2O
Co10 45 25 30 [Zn045
Co021
Al034
(OH)2](NO
3)034
middot05 H2O
Co15 35 35 30 [Zn039
Co032
Al029
(OH)2](NO
3)029
middot05 H2O
Co35 - 70 30 [Co067
Al033
(OH)2](NO
3)033
middot05H2O
Chapter 5 Catalysts preparation and characterization
193
o Co and Co-Ru with US In Table 59 the results are reported
Table 59 ICP characterization results for Co catalysts
Sample Co wt Ru wt
Co10 80 -
Co10Ru01 80 008
In general these results indicate the composition of catalysts is in good
agreement with the theoretical values
Iron based catalysts In Table 510 the results are reported
Table 510 ICP characterization results for Fe catalysts
Sample Fe wt K wt Cu wt
Fe30K20Cu375 314 19 40
5226 XRD and micro-RAMAN characterization results
Cobalt Catalysts
o For the HTlc the XRD and micro-RAMAN analyses
In order to better understand the behaviour of the materials after activation
FT-IR spectra of the sample Co15 (as a representative sample) calcined and
activated and Co3O4 have been registered (Fig 526) The spectrum of Co15
showed the typical absorption bands of the nitrate anion at 1377 cm-1 present
in the interlayer region of HTlc After calcination this band disappeared due to
nitrate degradation and the spectrum presented the typical absorptions of
Co3O4 spinel phase at 667 cm-1 and 566 cm-1 The activation process leads to
the formation of a material with very wide bands attributed to the Co3O4
phase
Chapter 5 Catalysts preparation and characterization
194
Fig 524 FT-IR spectra of the fresh and activated Co15 and of the reference Co3O4
References
[1] C Pirola C L Bianchi A Di Michele P Diodati D C Boffito V Ragaini Ultrasonic Sonochem 17610-616 (2010) [2] C Pirola PhD 2007-2008 Novel supported iron based Fischer-Tropsch catalysts Preparation characterization and applications [3] GPVaan Deer Laan AACMBeenackers CatalRev-SciEng41 (3amp4) (1999) 255 [4] YJin AKDatye Journal of catalysis 196 (2000) 8 [5] Costantino U Marmottini F Nocchetti M Vivani R Eur J Inorg Chem 1998 101439 -1446 [6] C Pirola CL Bianchi A Di Michele P Diodati S Vitali V Ragaini Catal Lett 131 (2009)294-304
Chapter 5 Catalysts preparation and characterization
195
[7] G Biffi Gentili M Linari I Longo A Ricci A IEEE Transactions on microwave theory and techniques 57 (9-2009) 2268-2275 [8] BToukoniitty JPMikkola DYuMurzin TSalmi Applied Catalysis A General 279 (2005) 1 [9] KSSuslick Sonocatalysis Handbook of Heterogeneous Catalysis VCH Verlagsgesellschaft mbH Weinheim Germany (1997) 1350 [10] BToukoniitty JPMikkola DYuMurzin TSalmi Applied Catalysis A General 279 (2005) 1 [11] WBonrath Ultrasonics Sonochemistry 12 (2005) 103 [12] CLBianchi VRagaini Catalysis Letters 95 (2004) 61 [13] CLBianchi FMartini VRagaini Ultrasonics Sonochemistry 82 (2001) 131 [14] Zhao R Goodwin JG Jr Jothimurugesan K Gangwal SK Spivey JJ (2001) Ind Eng Chem Res 401065 10 [15] Yang Y Xiang HW Tian L Wang H Zhang CH Zhong B Li YW (2005) Appl Catal A 284105 [16] Suo Haiyun Zhang Chenghua Wu Baoshan Xu Jian Yang Yong Xiang Hongwei Li Yongwang Cat Today Volume 183-1 (2012) 88ndash95 [17] Donatti DA Ruiz AI Vollet DR (2002) Ultrason Sonochem 9133 [18] Yang Y Xiang HW Tian L Wang H Zhang CH Zhong B Li YW (2005) Appl Catal A 284105 [19] Fadoni M and Lucarelli University of Milan and CE Instruments (Thermoques SpA) [20] F M NELSEN and Ff EGGERTSEN Shell Development Co Emeryville Calif ANALYTICAL CHEMISTRY VOL 30 NO 8 AUGUST 1958 1387-1390 [21] 11 S Brunauer P H Emmett and E Teller J Am Chem Soc 60 (1938) 309 [22] JHaber JHBlock and BDelmon Pureampappl Chem 67 Nos 89 (1995) 1257 [23] SDRobertson BDMcNicol JHDe Baas SCKloet JWJenkins JCatal 37 (1975) 424 [24] Von Ardenne Manfred Das Elektronen-Rastermikroskop Theoretische Grundlagen Zeitschrift fur Physik 108 (1938) 553 [25] Von Ardenne Manfred Das Elektronen-Rastermikroskop Praktische Ausfuumlhrung Z Techn Phys 108 (1938) 407 [26] Ludwig Reimer Helmut Kohl Springer Series in Optical Sciences 36 fifth edition 2008 Transmission Electron Microscopy Physics of Image Formation [27] Gardiner DJ (1989) Practical Raman spectroscopy Springer-Verlag ISBN 978-0387502540 [28] A Di Fronzo C Pirola A Comazzi F Galli CL Bianchi A Di Michele R Vivani M Nocchetti M Bastianini DC Boffito Fuel 119 (2014) 62-69
Chapter 5 Catalysts preparation and characterization
196
[29] TJ Mason JP Lorimer Sonochemistry Ellis Horwood Chichester 1988 p 58 [30] Bianchi CL Catal Lett 2001 76(3ndash4)155-159 [31] Lin HY Chen YW Li C Thermochim Acta 2003 40061ndash67 [32] Lin HY Chen YW Mater Chem Phys 2004 85171ndash175 [33] Sexton BA Hughes AE Turney TW J Catal 1986 97(2)390ndash406 [34] Kumar N Payzant EA Jothimurugesan K Spivey JJ Phys Chem Chem Phys 2011 1314735ndash14741 [35] Tsakoumis NE Dehghan R Johnsend RE Voronov A Van Beek W Walmsley JC Borg Oslash Rytter E Chen D Roslashnning M Holmen A Catal Today 2013 20586ndash93 [36] Tsakoumis NE Roslashnning M Borg Oslash Rytter E Holmen A Catal Today 2010 154162ndash182 [37] Alvarez A Ivanova S Centeno MA Odriozola JA Appl Catal A 2012 431-4329-17 [38] YJin AKDatye Journal of catalysis 196 (2000) 8 20 [39] DBBukur KOkabe MPRosynek CPWang DJRao KRPM and GPHuffman JCatal 155 (1995)353 [40] YYang HXiang YXu LBai YLi ApplCatalA 266 (2004) 181 [41] 32 Rudolf C Dragoi B Ungureanu A Chirieac A Royer S Nastro A Dumitriu E Catal Sci Technol DOI 1011039C3CY00611E [42] C Pirola CL Bianchi A Di Michele S Vitali V Ragaini Catal Comm 10 823 (2009) [43] Iyi N Fujii K Okamoto K Sasaki T Appl Clay Sci 2007 35218-227 [44] CL Bianchi C Pirola DC Boffito A Di Fronzo A Di Michele R Vivani M
Nocchetti M Bastianini S Gatto Co-Zn-Al based hydrotalcites as catalysts for
Fischer-Tropsch process Proceeding of DGMK Conference 2011
CatalysisInnovative Applications in Petrochemistry and Refining 4-6 October
2011 Dresden Germany ISBN 978-3-941721-17-3
[45] Leendert G Bitter JH Kuipers HPCE Oosterbeek H Holewijn JE Xu X
Kapteijn F Jos van Dillen A Krijn P J Am Chem Soc 2006 1283956-3964
[46] 31 Den Breejen JP Radstake PB Bezemer GL Bitter JH Froslashseth V Holmen A Krijn P J Am Chem Soc 2009 1317197-7203 [47] Thickett and Oldyha JThermAnalCal 80 (2005) [48] MALegodi Dde WaalDyes and Pigments 74 (2007) 161
197
Chapter 6 High Fe Loaded Supported Catalysts for Biosyngas Fischer ndash Tropsch Conversion experimental and simulation results 6 Development of the kinetic model One of the objectives of this research work was the development of a kinetic
model for the synthesis of FT in collaboration with the Politecnico di Milano
This model based on experimental data obtained in the pilot plant using iron
based catalyst (Fe30K20Cu375) at different temperatures and different H2CO
ratios allows to obtain and simulate the performance of these catalysts at
temperatures and ratios of incoming flows feeding different
The modeling work has not been limited to the laboratory scale since it is
possible to predict the trend of the reaction kinetics using these types of
catalysts in reactors with much greater volumes and integrated in an entire
industrial process such as the use of biosyngas for FT synthesis obtained from
biomass
61 Regression of kinetic constants After obtaining the experimental data it is necessary to regress them With the
regression we could obtain the respective kinetic constants
The model is based on the fact that both reactions the FT reactions and WGS
are active therefore we will need to regress the rate constants of both
reactions which we call kFT (kinetic constant of the FT reaction) and kWGS
(kinetic constant of the WGS reaction)
The equations that express the reaction rate of the two reactions are [1] For the FT reactions
Chapter 6 High Fe Loaded Supported Catalysts for Biosyngas Fischer ndash Tropsch Conversion experimental and simulation results
198
For the WGS reaction
From these equations we note that the reaction rate in both cases is a
function of the partial pressures of the reactants (CO and H2) of the products
(H2O and CO2) of the constants (aFTWGS e bFTWGS) and the equilibrium constant
Kp expressed as
From the regression of the reaction rate constants is obtained the K0i These
values are correlated to the kFTWGS through the equation
The parameter values of the previous reports were obtained with a regression
using the MATLAB software based on the method of least squares from the
experimental data using the original coefficients K0FT k0WGS aFT aWGS bFT bWGS
as values of the first iteration [2] The software allows the regression of k0i
establishing an objective function that must be minimized as much as possible
(10-6 tolerance basis of MATLAB)
There was no regression of the activation energy of the two reactions but kept
constant as reported in literature [2]
The probability of growth of the hydrocarbon chain is instead given by the
correlation developed by Lox and Froment [3-4] or iron based catalysts
Chapter 6 High Fe Loaded Supported Catalysts for Biosyngas Fischer ndash Tropsch Conversion experimental and simulation results
199
For the regression of the data there were not taken into account the energy
balances because we consider an isothermal catalytic bed The drop pressure is
neglected since it can be assumed that in the whole catalytic bed the pressure
is constant at 20 bar and the efficiency of the catalyst was considered unitary
On the contrary these aspects must be taken into account if we are working
with industrial volumes
62 Mass Balance In the kinetic model have been fully taken into account (even on lab-scale) the
mass balances shown in the equations below
Mass balance equations in the gas phase
Where ε degree of vacuum
a catalyst surface per unit volume
(Pis-Pib) pressure difference of the reactants between the bulk and the
solidrsquos surface
ν stoichiometric coefficient
r reaction in homogeneous phase
Chapter 6 High Fe Loaded Supported Catalysts for Biosyngas Fischer ndash Tropsch Conversion experimental and simulation results
200
If it does not consider gas-phase reactions but only on the surface of the
catalyst
Mass balance on the solid
Where ρ density of the catalyst
Mi molecular weight
It gets
Where is the total mass flow and is the mass fraction of i component
63 Energy Balance As previously mentioned in the modeling of laboratory scale is not considered
any heat balance in the catalytic bed because it is considered as isothermal
one however in the case of modeling a reactor in industrial volumes the
energy balance will be addressed in this way
Energy balance equation in the gas phase for a plug-flow reactor (PFR)
Chapter 6 High Fe Loaded Supported Catalysts for Biosyngas Fischer ndash Tropsch Conversion experimental and simulation results
201
Where Cpi Specific heat of the i species
h Laminar coefficient
(Ts-T) the temperature difference between the surface and the bulk
∆Homk entalphy of the K-esimo reaction in gas phase
U overall heat transfer coefficient
If there are no gas-phase reactions
Energy balance on the solid
64 Pressure variation
As for the energy balance also the P has not been taken into account in the
modeling however in the case of simulations of kinetic tests over PFR reactors
in industrial volumes it will be necessary to take them into account because
before and after the catalytic bed there will be a difference of pressure
The equation that allows to calculate the pressure drop in a fixed bed reactor is
the Ergunrsquos equation
Chapter 6 High Fe Loaded Supported Catalysts for Biosyngas Fischer ndash Tropsch Conversion experimental and simulation results
202
With
Where u velocity surface
Re Reynolds number
Dp diffusion coefficient
Ai inlet area of the tube
65 Catalyst Efficiency The efficiency of the catalyst considered unitary to simplify the model on
laboratory scale can not be considered as such in real systems and especially
of large reactors where the problems of diffusion of the reactants on the
catalyst surface are no longer negligible
The efficiency of the catalyst is expressed with the equation
Where T Bulk temperature
Ts surface temperature
Pi pressure of i species in the bulk
Pis pressure of the i species in the surface
Vp volume of the particle catalyst
Chapter 6 High Fe Loaded Supported Catalysts for Biosyngas Fischer ndash Tropsch Conversion experimental and simulation results
203
References
[1] WH Zimmerman DB Bukur Reaction kinetics over iron catalysts used for
Fischer-Tropsch synthesis The Canadian journal of chemical engineering (68)
1990 p 292-301
[2] Ahmad Rafiee Optimal design issues of a gas-to-liquid process Thesis for
the degree of Philosophy Doctor Norwegian University of Science and
Technology Faculty of Natural Sciences and Technology Chemical Engineering
Department2012
[3] ES Lox GF Froment Kinetics of the Fischer-Tropsch reaction on a
precipitated promoted iron catalyst 2 Kinetic modeling Ind Eng Chem Res
(32) 1993 p71-82
[4] ES Lox GF Froment Kinetics of the Fischer-Tropsch reaction on a
precipitated promoted iron catalyst 2 Kinetic modeling Ind Eng Chem Res
(32) 1993 p 61-70
204
Chapter 7 Fischer Tropsch runs results and discussion
In this chapter the experimental results concerning the FT runs will be
presented in term of CO conversion and of products selectivity toward CO2
CH4 light hydrocarbons (lt C7) and heavy hydrocarbons (gt C7) To join all these
data the parameter ldquoyield C2+rdquo will be reported too This parameter is defined
in the following equation
Yield C2+ = CO conversion x (selectivity ltC7 +selectivity gtC7) (1)
then the selectivity to CO2 and CH4 (undelivered products) is not taken into
account by this parameter The data concerning all the products distribution
ie selectivity for each carbon atom number have been collected in this PhDrsquos
research work for all the catalysts and all the experimental conditions but for
practical space of reasons they are not here reported
The results could be divided into two groups The experimental runs with two
kind of catalytical systems it means cobalt based catalysts and iron based
catalyst (kinetic runs) and the development of a kinetic model for the sample
Fe30K2Cu375 The selection is related to the better performance in terms of
stability
More in detail
Kinetic Runs
Cobalt based catalysts
HTlc The activated samples were tested at different temperatures in
the FTS plant following the procedure reported in the experimental
section In Fig 71 the CO conversion vs the reaction temperature is
Chapter 7 Fischer Tropsch runs results and discussion
205
reported for all the catalysts while the products selectivity is displayed in
Table 71
Fig 71 molar CO conversion to Co5 () Co10 () Co15 (diams) Co35 () obtained at
different reactor temperatures after 24 hours of reaction
As expected for each catalyst the activity is strongly influenced by the reaction
temperature the higher the temperature the higher the CO conversion but
also the selectivity towards CO2 CH4 and light hydrocarbons is favored by a
higher temperature The CO conversion is similar for Co5 and Co10 while it is
higher for the two samples with a larger amount of cobalt ie Co15 and Co35
In particular Co15 exhibits the highest CO conversion at all the selected
temperatures In FTS it is fundamental to obtain low quantities of CH4 and CO2
(undesired products) to favor the formation of higher hydrocarbons For this
reason temperatures in the 220-235degC range are more suitable than the higher
ones
Moreover Table 71 shows that Co15 exhibits the highest CO conversion and
the highest C2+ total yield (without considering CH4 and CO2 see note in Table
71) also at the lowest temperature (220degC) which is so important from an
economical point of view This result confirms that Co15 is the best performing
catalyst obtained in this part of the study
Chapter 7 Fischer Tropsch runs results and discussion
206
Table 71 FTS products selectivity at different reactor temperatures
Sample Temperature
(degC)
Products Selectivity C2+
Yield CO2 CH4 leC7 gtC7
Co5 220 03 29 33 934 165
235 03 59 104 834 194
245 11 85 127 776 224
260 19 141 160 679 300
Co10 220 32 26 98 844 155
235 38 49 143 769 178
245 33 60 154 753 218
260 81 163 413 343 262
Co15 220 14 101 17 705 467
235 81 262 473 185 498
250 178 177 443 202 491
Co35 220 14 39 103 844 250
235 18 96 234 651 395
245 51 257 656 105 473
leC7 all the hydrocarbons in the range C2-C7 gtC7 all the hydrocarbons greater than C7 Product lsquolsquoirdquo selectivity = (moles C in product i) (converted moles C) x 100 C2+ yield = CO conversion x (selectivity leC7 + selectivity gtC7) x10-2
The obtained data suggest the possibility of using synthetic hydrotalcites as Co-
based catalysts for FTS and pursuing subsequent studies on the same subject
Similar trends were obtained in ldquoUnit 2rdquo at lower temperatures and lower
amount of cobalt (Co10 and Co15) (Table 72)
Chapter 7 Fischer Tropsch runs results and discussion
207
The stability of these catalysts in the operating conditions adopted in the
catalytic tests (P le 20 MPa and T le 350degC) was evaluated by comparative
analysis between fresh samples and samples discharged from the reactor
maintained at high pressures and temperatures
Table 72 FTS products selectivities at different reactor temperatures Two different
pilot plants with the same flow sheet
Sample Temp
(degC)
CO
Conv
()
Products Selectivity C2+
Yield CO2 CH4 leC7 gtC7
Co10
(Unit 1)
220 170 32 26 98 844 155
235 207 38 49 143 769 178
245 248 33 60 154 753 218
260 358 81 163 413 343 262
Co10
(Unit 2)
220 147 01 12 53 935 145
235 180 15 32 73 880 171
245 891 140 291 393 176 506
Co35
(Unit 1)
220 264 14 39 103 844 250
235 446 18 96 234 651 395
245 621 51 257 656 105 473
Co35
(Unit 2)
220 473 50 224 296 431 343
235 768 162 205 288 345 485
245 998 154 241 322 282 604
leC7 all the hydrocarbons in the range C2-C7gtC7 all the hydrocarbons greater
than C7Product lsquolsquoirdquo selectivity = (moles C in product i) (converted moles C) x
100 C2+ yield = CO conversion x (selectivity leC7 + selectivity gtC7) x10-2
It is important to highlight that the aim of this work was the evaluation of the
possibility to use HTlc as a new kind of catalyst for the Fischer-Tropsch process
rather than a quantitative comparison with other kinds of traditional FTS
catalysts Moreover a reliable comparison between HTlc and traditional cobalt
Chapter 7 Fischer Tropsch runs results and discussion
208
based FTS catalysts is very difficult due to the different structural and
morphological features (surface area metal dispersion morphological
structure reduction properties porosity and so on) which are involved in the
very complex catalytic systems for the FTS Nevertheless from a qualitative
point of view it is possible to conclude that this new kind of catalytic materials
for FTS process give results fully comparable with those obtained by traditional
supported cobalt As general behaviour it is possible to state that cobalt
catalysts are characterized by high CO conversion high heavy hydrocarbons
selectivity and low light hydrocarbons CH4 and CO2 selectivity The wide
literature concerning traditional Co-based catalysts is rich of different examples
that depending on several operative parameters and preparation procedure
give different FTS results but always following the general trends reported by
the previous papers Some exhaustive examples are shown in a recent review
of Qinghong et al [1] and Muthu et al [2]
Co and Co-Ru
The use of ultrasound (US) might be very efficient to optimize the dispersion of
a so high metal charge as already verified in our laboratory in the past [3-4]
This special type of synthesis should give at the catalyst a particular structure
with a high surface area and a high metal dispersion that improves its activity
towards the synthesis of Fischer-Tropsch In the case of cobalt supported
catalysts a simple ultrasound step has been added in the catalyst preparation
As regard the results presented in table 73 it can be seen how all the samples
resulted active in FTS in particular the bimetallic samples give high CO
conversion with a noteworthy selectivity towards heavy hydrocarbons The
Chapter 7 Fischer Tropsch runs results and discussion
209
support plays a crucial role and in particular TiO2 based samples are the most
active
Moreover Table 73 shows that Co-RuSiO2 exhibits the highest selectivity
towards heavy hydrocarbons and the highest C2+ total yield (without
considering CH4 and CO2 see note in Table 73) This result confirms that Co-
RuSiO2 is the best performing catalyst obtained in this part of the study
Table 73 CO Conversion C2+total yield CH4 CO2 light hydrocarbon and heavy
hydrocarbon selectivity of CoCo-Ru based catalyst at T=255degC
Catalyst
CO
Conv
()
C2+
total
yield
Selectivity ()
CH4 CO2 ltC7 gt C7
CoTiO2 28 23 5 14 10 71
CoSiO2 6 5 19 6 23 52
CoAl2O3 8 6 13 7 19 61
Co-RuTiO2 98 73 18 8 14 60
Co-RuSiO2 94 82 9 4 8 79
Co-RuAl2O3 84 73 11 2 12 75
As we have seen from the BET and TPR analysis the support and the promoter
play a key role in the performance of the catalyst because they are responsible
for the modification of some key parameters such as surface area and the
metal dispersion
Iron based Catalysts
With regard to the treatment with the help of US (see table 74) it can be
concluded that the sonication of an aqueous mixture salts and precursors of
support (US1) is preferable instead of to the calcined catalyst suspended in
Chapter 7 Fischer Tropsch runs results and discussion
210
non-polar solvent such as hexane (US2) With regard to treatment with MW
(see table 74) there were obtained better results in term of CO conversion
with the powder catalyst treated directly in the MW (MW1) while the test
conducted by suspending the catalysts in hexane and then treated in a MW
reactor (MW2) for an hour did not give valid results The best FTS results in
term of C2+ yield (41) has been obtained using MW1 while in tem of CO
conversion (58) using US1 All of them gave FTS results better than the
traditional one Itrsquos evident that the use of US or MW optimizes the catalytic
performance in accord with previous similar results [4]
In agreement with [5] the FTS results show that TEOS as silica source is
favorable for the enhancement of the FTS activity
Table 74 Catalytic Results of Fe30K20Cu375 Different preparation techniques Support
SiO2 Diluting Material α-Al2O3 T=220degC
Preparation CO Conv ()
C2+
Total yield
Selectivity ()
CO2
CH4
lt C7
gt C7
TR 49 32 27 7 22 44
MW1 52 41 17 5 18 60
MW2 32 24 17 8 27 48
US1 58 38 29 6 22 43
US2 36 25 22 9 30 39
Co-precipitation
38 32 2 13 28 57
leC7 all the hydrocarbons in the range C2-C7 gtC7 all the hydrocarbons greater than C7 Product lsquolsquoirdquo selectivity = (moles C in product i) (converted moles C) x 100 C2+ yield = CO conversion x (selectivity leC7 + selectivity gtC7) x10-2
The co-precipitation test was made at T=250degC and TEOS as a support
Iron based Catalysts
Chapter 7 Fischer Tropsch runs results and discussion
211
To work with this part it is important to know the effect of the H2 CO ratio in
the feeding gas The FTS for the production of liquid hydrocarbons from
synthesis gas has become important as the planet faces exhaustion of its
petroleum reserves in the near future The use of coal or biomass to
manufacture synthesis gas is attractive in view of its vast reserves However
synthesis gas manufactured from coal or biomass typically has a low H2CO
ratio (about 07) while the stoichiometry of the reaction requires an H2CO
ratio of about 20 Iron catalysts can make up this deficit with their high WGS
activity [6]
This important characteristic of iron based catalysts is essential for their
applications
Fig 72 show that the activity of catalyst is good enough using also feeding
ratio between 10 and 20
Fig 72 CO conversion or selectivity vs H2CO feeding ratio for Fe30K20Cu375
catalyst at T=250degC
Higher the H2 CO ratio is higher the CO conversion becomes but the heavy
hydrocarbons is the highest for the stoichiometric ratio
In the present work there were made some tests with Fe30K20Cu375 catalyst by
feeding mixtures with a ratio H2CO between 05 and 20 in order to optimize
Chapter 7 Fischer Tropsch runs results and discussion
212
the activity selectivity and the lifetime of this kind of FT catalyst in work
conditions of biosyngas feeding
On the basis of the collected data a rigorous simulation of the FT synthesis
reactor has been developed for different purposes (i) to support the
experimentations and their planning (ii) to predict the reactor yield and
conversion (iii) to optimize the performance of the reactor system with
different operating conditions and (iv) to calculate novel reliable kinetic
parameters based on the experimental data fitting by means of model-based
nonlinear regression techniques To do so the FT reactor is modeled as a
catalytic plug-flow reactor using mass and energy balances and reaction
kinetics for Fe-based catalyst defined by Zimmerman and Bukur as explained in
chapter 6 [7] leading to an ordinary differential equation system with
structured Jacobian Lumping techniques have been used to model heavy
hydrocarbons The system is solved by means of dedicated solvers to handle
stiffness and nonlinearities of heterogeneous reactive systems [8]
Typical H2CO ratio of syngas manufactured from coal or biomass are between
07-12 and the Fig 72 show that the activity of catalyst is good enough using
also feeding ratio between 10 and 20
In the table 75 there is the data concerning the carbon monoxide conversion
() and the selectivity towards undesired products (CO2 and CH4) and lighter
and heavy hydrocarbons of Fe-based catalyst The CO conversion increase with
the increase of the H2CO ratio because of the proximity of the stoichiometric
required of the reaction The selectivities are constant with the variations of
H2CO ratio Instead of that the C2+ yield increase with the variations of H2CO
ratio A comparison at T=250degC show that the best performance in terms of CO
conversion C2+ and selectivity towards heavy hydrocarbons is given by working
with a H2CO ratio of 2 (stoichiometric required of the reaction)
Chapter 7 Fischer Tropsch runs results and discussion
213
These data were used to propose a suitable kinetic model for the FTS using a
math program in collaboration with the Politecnico di Milano Some hypothesis
were taken into account to prepare the kinetic model (FT reactor is modeled as
a catalytic plug-flow reactor using mass and energy balances and reaction
kinetics for Fe-based catalyst defined by Zimmerman and Bukur [7-8] ∆P = 0
isothermic catalytic bed FT reaction and WGS are both active on the catalyst)
The kinetic parameters were calculated and compared with the experimental
data The first results show a good fitness of the experimental data
Table 75 FTS products selectivities at different H2CO ratio and reactor
temperatures of Fe30K2Cu375
Selectivity ()
H2CO T(degC) CO
Conversion ()
C2+ total yield
CO2 CH4 ltC7 gtC7
21 220 85 69 11 8 22 59
21 235 211 175 11 6 20 63
21 250 498 393 16 5 19 60
21 260 567 425 19 6 20 55
151 250 388 299 18 5 17 60
151 260 463 338 22 5 17 56
11 250 23 182 17 4 16 63
11 260 389 272 26 4 16 54
leC7 all the hydrocarbons in the range C2-C7 gtC7 all the hydrocarbons greater than C7 Product lsquolsquoirdquo selectivity = (moles C in product i) (converted moles C) x 100 C2+ yield = CO conversion x (selectivity leC7 + selectivity gtC7) x10-2
In Fig 73 is presented a comparison between the experimental data obtained
in the laboratory and the data obtained using the kinetic model The first two
Chapter 7 Fischer Tropsch runs results and discussion
214
columns represent the conversion of hydrogen and carbon monoxide while in
the other columns are represented the molar fraction of hydrogen carbon
monoxide water methane and lump C2 C3-4 C5-10 C11 + As a first
approximation it can be seen that the kinetic model present a good fitness
regard to the experimental data
Fig 73 Comparison between experimental data and kinetic model
References
[1] Qinghong Z Weiping D Ye W Review Recent advances in understanding the key catalyst factors for Fischer-Tropsch synthesis J Ener Chem 2013 2227ndash38
Chapter 7 Fischer Tropsch runs results and discussion
215
[2] Muthu KG Gary J Wilson DS Burtron HD FischerndashTropsch synthesis Activity of metallic phases of cobalt supported on silica Catal Today 2013 21513ndash 17 [3] CLBianchi VRagaini Catalysis Letters 95 (2004) 61-65 [4] C Pirola C L Bianchi A Di Michele P Diodati D C Boffito V Ragaini Ultrasonic Sonochem 17 (2010) 610 [5] Suo Haiyun Zhang Chenghua Wu Baoshan Xu Jian Yang Yong Xiang Hongwei Li Yongwang A comparative study of FeSiO2 FischerndashTropsch synthesis catalysts using tetraethoxysilane and acidic silica sol as silica sources Catalysis Today Volume 183 Issue 1 20 March 2012 Pages 88ndash95 [6] MDShroff AKDatye Catalysis Letters 37 (1996) 101
[7] WH Zimmerman DB Bukur Can J Chem Eng 68 (1990) 292-301 [8] F Manenti I Dones G Buzzi-Ferraris HA Preisig Ind Eng Chem Res 48 (2009) 9979-9984
216
Chapter 8 Final remarks and Conclusions
New kind of cobalt and iron based catalysts were synthetized and used in the
Fischer-Tropsch synthesis Different methods of synthesis different amounts of
cobalt and different process temperatures were investigated All the catalysts
under study were active in the FTS The catalytic activity of the samples strictly
depends on the temperature as expected
Cobalt based hydrotalcites cobalt and cobalt-ruthenium synthesized with the
help of ultrasound and iron supported catalysts with a high loading of iron (30
wt) have been prepared and characterized and both the preparation
procedure and the working conditions were fully optimized
For each catalytic system it can be summarized the following aspects
Cobalt based catalysts
HTLC In the case of Co-based hydrotalcites CO conversion and process
selectivity towards light and heavy hydrocarbons are closely related to the
cobalt amount in the catalysts but not in a linear way
The reduction behavior under a H2 flow of the Co-based hydrotalcites is
achieved in one step at lower temperature and it is not related to its
morphology but is strictly correlated to the particle size In addition the
relatively large dimensions and high cristallinity of these catalysts favor the
creation of optimal domains of active sites that make them more efficient
The obtained data suggest the possibility of using synthetic hydrotalcite as Co-
based catalysts for FTS and open the possibility for subsequent studies on the
same subject
Chapter 8 Final remarks and Conclusions
217
Future studies may involve the investigation of the effects of various
parameters such as morphologysize of crystallites or the addition of small
amounts of promoters such as Ru in the composition of Co based hydrotalcites
Temperatures in the 220-235degC range are more suitable than the higher ones
Cobalt based bimetallic The catalysts show a low selectivity to methane and
carbon dioxide and formation of higher hydrocarbons The more interesting
results are the highest CO conversion at lower temperatures measured with a
catalysts promoted with a Ru Even the support although it is inert it is very
important because it radically alters the surface area of the catalyst
Iron catalysts The samples appears to be highly dependent on the method of
preparation used The catalysts treated with US and MW seem to show
significant improvements over traditional catalysts and the reason is a more
homogeneous and uniform distribution of Fe in the media
The catalyst Fe30K2Cu375 is active with a H2CO ratio le2
Develop of a kinetic model On the basis of the collected data a rigorous
simulation of the FT synthesis reactor has been developed to support the
experimentations and their planning to predict the reactor yield and
conversion to optimize the performance of the reactor system with different
operating conditions and to calculate novel reliable kinetic parameters based
on the experimental data fitting by means of model-based nonlinear regression
techniques For this lumping techniques have been used to model heavy
hydrocarbons the system is solved by means of dedicated solvers to handle
stiffness and nonlinearities of heterogeneous reactive systems and finally the
Chapter 8 Final remarks and Conclusions
218
model made in collaboration with the Politecnico di Milano show a good fit of
the experimental data
Concerning the results obtained in this PhDrsquos research work it is clear that all
the samples tested have given good results The Co-based catalysts
synthesized using the traditional impregnation method with an additional step
of ultrasound have given good results in comparison with the results in the
current literature The hydrotalcites have given lower results if compared with
the Co-based catalysts synthesized with the help of ultrasound but they have
opened an alternative and innovative way that has never been tried before
Iron based catalysts allow a direct conversion of the biosyngas and the results
have shown how our catalysts are active with an H2CO ratio le2 Furthermore
trends have been modeled with success In conclusion the PhDrsquos research
work has given a serious contribution to the current state of the art on
catalysis in the Fischer-Tropsch synthesis either with cobalt and iron based
catalysts With cobalt has been optimized a traditional synthesis procedure
with the introduction of ultrasound furthermore has been created a
completely new kind of catalyst With iron has continued an optimizationrsquos
work of iron supported with high loading metals so to develop a suitable
kinetic model able to work not only with syngas but also with biosyngas
List of Publications and Communications
219
List of publications
Publications
C Pirola DC Boffito G Carvoli A Di Fronzo V Ragaini and CL
Bianchi (2011) Soybean Oil De-Acidification as a First Step Towards
Biodiesel Production Recent Trends for Enhancing the Diversity and
Quality of Soybean Products Prof Dora Krezhova (Ed) ISBN 978-953-
307-533-4 InTech DOI 10577217812 Available from
httpwwwintechopencombooksrecent-trends-for-enhancing-the-
diversity-and-quality-of-soybean-productssoybean-oil-de-acidification-
as-a-first-step-towards-biodiesel-production
CL Bianchi C Pirola DC Boffito A Di Fronzo G Carvoli D Barnab
R Bucchi and A Rispoli (2011) Non Edible Oils Raw Materials for
Sustainable Biodiesel Biodiesel - Feedstocks and Processing
Technologies Dr Margarita Stoytcheva (Ed) ISBN 978-953-307-713-0
InTech DOI 10577225397 Available from
httpwwwintechopencombooksbiodiesel-feedstocks-and-
processing-technologiesnon-edible-oils-raw-materials-for-sustainable-
biodiesel
A Di Fronzo C Pirola A Comazzi F Galli CL Bianchi A Di Michele R
Vivani M Nocchetti M Bastianini DC Boffito Co-based Hydrotalcites
as new Catalysts for the Fischer-Tropsch Synthesis Process Fuel 119
(2014) 62ndash69
Publications in Conference Proceedings (peer reviewed)
CL Bianchi C Pirola DC Boffito A Di Fronzo A Di Michele R Vivani
M Nocchetti M Bastianini S Gatto Co-Zn-Al based hydrotalcites as
catalysts for Fischer-Tropsch process Proceeding of DGMK Conference
2011 Catalysis Innovative Applications in Petrochemistry and Refining
4-6 October 2011 Dresden Germany ISBN 978-3-941721-17-3
C Pirola A Di Fronzo DC Boffito CL Bianchi A Di Michele
Biosyngas Fischer ndash Tropsch Conversion by High Fe Loaded Supported
List of Publications and Communications
220
Catalysts Prepared with ultrasound and Microwave Proceeding of
DGMK Conference 2012 Reducing Carbon Footprint of Fuels and
Petrochemicals October 8 ndash 10 2012 Berlin Germany ISBN 978-3-
941721-26-5
Communications at congress A Di Fronzo C Pirola DC Boffito CL Bianchi A Di Michele R Vivani
M Nocchetti M Bastianini Synthetic Hydrotalcites as suitable Co-
based catalysts for Fischer-Tropsch Process XVIII Congresso Nazionale
della Divisione di Chimica Industriale della SCI LE SFIDE DELLA CHIMICA
INDUSTRIALE PER UNrsquoINNOVAZIONE SOSTENIBILE 11-14 giugno 2012
(Oral presentation)
A Di Fronzo DC Boffito CPirola G Carvoli S Vitali CL Bianchi
Scalable free fatty acids esterification for methyl esters production
XVIII Congresso Nazionale della Divisione di Chimica Industriale della
SCI LE SFIDE DELLA CHIMICA INDUSTRIALE PER UNrsquoINNOVAZIONE
SOSTENIBILE 11-14 giugno 2012 (Poster presentation)
ADi Fronzo C Pirola DC Boffito CL Bianchi A Di Michele R Vivani
M Nocchetti M Bastianini Synthetic Hydrotalcites as suitable Co-
based catalysts for Fischer-Tropsch Process Cat4bio conference
Advances in catalysys for biomass valorization Tesaloacutenica Grecia 2012
(Poster)
CL Bianchi A Di Fronzo C Pirola DC Boffito A Di Michele R Vivani
M Nocchetti M Bastianini Synthetic Hydrotalcites as suitable Co-
based catalysts for Fischer-Tropsch Process 7th edition of the
International Conference on Environmental Catalysis Lion-Francia
(Poster)
A Di Fronzo C Pirola CL Bianchi A Di Michele Ultrasonidos y
microondas en la preparaciograven de catalizadores soportados para la
sigraventesis de Fischer-Tropsch JIFI-EAI 2012 Jornadas de Investigaciograven
Ecuentro acadegravemico industrial Universidad Central de Venezuela
Facultad de Ingenierigravea 26-30 noviembre
C Pirola CL Bianchi A Di Fronzo D Boffito A Di Michele G S
Patience Ultrasound and microwave assisted preparation of high Fe
List of Publications and Communications
221
loaded supported catalysts for biosyngas Fischer-Tropsch conversion
Intervento presentato al 245 convegno ACS National Meeting amp
Exposition tenutosi a New Orleans Louisiana nel 2013
C Pirola C L Bianchi A Di Fronzo F Manenti M Hillestad High Fe
Loaded Supported Catalysts for Biosyngas Fischer ndash Tropsch Conversion
experimental results and detailed simulation XVII National Congress of
Catalysis GIC 2013 and XI National Congress of Zeolites Science and
Technology 15-18092013
F Galli C Pirola A Di Fronzo A Comazzi CLBianchi Di Michele Co
Based Bimetallic Catalysts for Fischer-Tropsch Synthesis Prepared by
High Power Ultrasound XVII National Congress of Catalysis GIC 2013
and XI National Congress of Zeolites Science and Technology 15-
18092013
Di Michele C Pirola A Di Fronzo A Comazzi F Galli and CLBianchi
Co Based Bimetallic Catalysts for Fischer-Tropsch Synthesis Prepared by
High Power Ultrasound AOSS Melbourne 10-12072013
C Pirola A Di Fronzo A Comazzi F Galli A Di Michele CLBianchi Co
based bimetallic catalysts for Fischer-Tropsch synthesis prepared by
high power ultrasound 11th European Congress on Catalysis ndash
EuropaCat-XI Lyon France September 1st-6th 2013
Workshop Clausthal Germany 22-23112013 Fischer-Tropsch Synthesis
from syngas and biomass using Fe or Co based catalysts Experimental
and simulation results (Oral Presentation)

2
3
TABLE OF CONTENTS
General abstract 5
Chapter 1 General Introduction 27
Chapter 2 Chemistry of Fischer-Tropsch Synthesis 57
21 FT Thermodynamics 58
22 FT Reaction Mechanism 59
23 FT Products Selectivity 65
24 FT kinetics 68
25 Influence of FT process conditions 71
Chapter 3 Catalysts for Fischer Tropsch Synthesis 76
31 Iron and Cobalt industrial FT catalysts 80
i) Iron catalysts 80
ii) Cobalt catalysts 81
32 Chemical State of active phase 82
33 Size of active phase 83
Chapter 4 Experimental FT plant and analytical methods 86
41 FT Laboratory plant 88
a) First FTS unit (Unit 1) 88
41a Main parts of the plant 90
42a Analytical instruments 94
43a Analytical instruments calibration 98
44a Experimental procedure 109
b) Second FTS unit (Unit 2) 114
41b Main parts of the plant 116
42b Analytical instruments 119
43b Experimental procedure 121
42 Experimental data elaboration 124
a)First FTS unit (Unit 1) 124
425 Hydrogen 137
427 Oxygen Balance 139
b)Seconf FTS unit (Unit 2) 140
43 Novelties on the FT plant made in this PhD work 142
Chapter 5 Catalysts preparation and characterization 143
51 Catalysts preparation 146
511 Catalyst preparation procedure 146
52 Catalysts characterization 155
521 Catalysis characterization introduction and theory 155
4
5211 BET analysis 157
522 Catalysts characterization results 174
Chapter 6 High Fe Loaded Supported Catalysts for Biosyngas Fischer ndash Tropsch Conversion experimental and simulation results 197
6 Development of the kinetic model 197
61 Regression of kinetic constants 197
62 Mass Balance 199
63 Energy Balance 200
64 Pressure variation 201
65 Catalyst Efficiency 202
Chapter 7 Fischer Tropsch runs results and discussion 204
Chapter 8 Final remarks and Conclusions 216
List of publications 219
Publications in Conference Proceedings (peer reviewed) 219
Communications at congress 220
General abstract
1 Introduction
Nowadays it is imperative to develop economical and energy-efficient
processes for the sustainable production of fuels and chemicals alternative to
the ones deriving from petroleum Climate change and air quality are major
environmental concerns because they directly affect the way we live and
breath In order to meet the present and future threats generated by emissions
to the atmosphere environmental agencies around the world have issued
more stringent regulations One of them is the control of residual sulfur in
diesel fuel and emission standards for particulates from diesel vehicles All
these facts have recently aroused renewed interest in the FischerndashTropsch
Synthesis because it can produce super clean diesel oil fraction with high
cetane number (typically above 70) without any sulfur and aromatic
compounds using syngas (mixture of H2 CO CO2) from natural gas CH4 coal
or as a new tendency from biomass [1 2] The essential target of FTS is to
produce paraffins and olefins with different molecular weight and to limit the
maximum formation of methane and CO2 [3]
The main reactions involved in FTS are reported in the following scheme [4-8]
Irreversible reactions
1) n CO + 2n H2 rarr CnH2n + n H2O for olefins
2) n CO + (1+2n) H2 rarr CnH(2n+2) + n H2O for paraffins
3) 2n CO + n H2 rarr CnH2n + n CO2 for olefins
4) n CO + 2n H2 rarr CnH(2n+1)OH + (n-1) H2O for alcohols
Equilibrium
5) CO + H2O harr CO2 + H2 Water-gas-shift reaction (WGS)
General Abstract
6
6) CO + H2 harr C + H2O Carbon deposition
7) 2 CO harr C + CO2 Boudouard equilibrium
The whole reaction gives an energetic contribution strongly exothermic (about
150 kJmol CO reacted) FTS is a particularly complex system in which a
number of different reactions are combined to a unique mechanism
irreversible Fischer Tropsch (FT) reactions produce hydrocarbons and some
equilibrium reactions between CO CO2 CH4 and C such as the WGS reaction
and the Boudouard equilibrium are present too Nevertheless it is possible to
suppose that FTS can be simplified as a combination of the FT reactions and the
WGS reaction [7] According this hypothesis hydrocarbons are primary
products of FT reaction and CO2 can only be produced by WGS reaction a
reversible parallel-consecutive reaction with respect to CO [9]
FTS usually requires catalysts based on cobalt or iron Co-based catalysts have
been more largely used due to their high selectivity to heavy hydrocarbons and
low activity in the water-gas shift reaction so limiting the CO2 formation
Moreover Co-based catalysts have shown longer life-time and higher CO
conversion compared to the Fe-based ones [10] Iron based catalysts are
recently highly investigated for FTS Compared to cobalt systems iron-based
catalysts are cheaper but less resistant to deactivation due to the oxidizing
effect of water despite activating Water Gas Shift reaction (CO + H2O harr CO2 +
H2) well [5 9] Moreover they are flexible to changes in temperature pressure
and they can work at different H2CO feed ratios (for iron based catalysts this
ratio can be between 05 and 25) [11 12]
2 Aims of the work
Considering very recent research results [13-15] the aim of the PhDrsquos research
was addressed toward the development of three particular kind of catalysts
General Abstract
7
The first group of catalysts tested were the Co-based hydrotalcites (HTlc) with
different amount of Co in two different pilot plants HTlc-based materials have
been recently reported as good catalysts for several processes in the energy
field [16] [17] and [18] Up to now the only study reported in literature on the
use of synthetic HTlc as FTS catalysts concerns their use as inert supports for
the catalytically active metal According to this study hydrotalcite-supported
catalysts result in higher activity than CoAl2O3 even in absence of reduction
promoters [19]
The second group of catalysts tested were the Co-based catalysts and
bimetallic Co-Ru based catalyst synthesized with the help of ultrasound
because the ultrasound are presented in literature as an innovative way to
synthesize new kind of materials
Finally were synthesized and tested samples of Fe-based catalysts supported
on silica with different methods of synthesis (traditional impregnation method
with the help of ultrasound or microwave) and changing the H2CO ratio with
the aim to evaluate the performance of biomass Almost the development of a
kinetic model (modeling parameter regression and simulation) in collaboration
with the Politecnico di Milano
3 Experimental Details
a Preparation of catalysts
i) Cobalt based catalysts ndash Hydrotalcites a series of ternary hydrotalcites with
general formula [CoxZn(1-x-y)Aly(OH)2](NO3)y∙05H2O by a modified-urea method
[20] Different volumes of the solutions of the metals nitrates all at a
concentration of 05 M were mixed to obtain either a Al(Co+Al) or
Al(Co+Al+Zn) molar ratio of 03 as indicated in Table 1
General Abstract
8
Solid urea was added to the solution in a molar ratio of 4 vs Al The obtained
solution was maintained at the reflux temperature in an open flask for 48 hours
The precipitate was separated by centrifugation washed with water and then
dried at 80degC
Table 1 Details of the synthesis composition and specific surface area (SA) of samples
general formula [CoxZn(1-x-y)Aly(OH)2](NO3)y∙05H2O M sol = molar percentage of
metals in the precipitation solution
Sample wt Co M sol
x
y
SSA (m2g-1)
Zn Co Al
Co5 51 55 15 30 010 033 175
Co10 108 45 25 30 021 034 115
Co15 166 35 35 30 032 029 72
Co35 353 - 70 30 067 033 58
ii) Cobalt based catalysts and bimetallic Co-Ru based catalysts synthesized
with the help of ultrasound All the catalysts were prepared by a modified
impregnation method The metal precursors (cobalt and ruthenium
carbonyl) were dissolved in n-decane together with the different support
(SiO2 Al2O3 or TiO2) The solution was irradiated by an ultrasound generator
with a horn type of 750 W a frequency of 20 kHz a diameter tip of 13 mm
and an amplitude of 40-50 for 3 h and then put into a rotating vacuum
oven at 40degC at 36 rpm for 24 h (impregnation step) Samples have been
calcinated at 350 degC for 4 h The ultrasound horn used have a cooling jacket
where the coolant has a low viscosity at low temperature and is a dielectric
liquid [21]
General Abstract
9
iii) Iron catalysts there were prepared the iron based catalysts using different
method of synthesis traditional impregnation (TR) impregnation with the help
of the microwave (MW) impregnation with the help of ultrasound (US) and co-
precipitation method MW and US techniques seem to be promising that offer
many advantages in the catalyst preparation as reported in [22-23] and their
effect was also evaluated
There were prepared according to the traditional impregnation method by
incipient wetness (TR) with 30wt of iron supported on a commercial high
surface area SiO2 (Fluka BET surface area 520 m2g-1 pore volume 122 ml g-1
and pore diameter 87 nm) The catalysts are promoted by K (20wt ) and Cu
(375wt ) The percentages are regarding a previous research [13] where
those compositions result as the most suitable catalyst In this work all the
percentages concerning the catalysts composition are on weight basis while
the percentages about the process conversion and selectivity are on molar
basis The catalysts will be named as Fe30K20Cu375 referring the wt of Fe K
and Cu on catalyst The support after heating treatment at 120degC for 12 h was
impregnated with an aqueous solution of Fe(NO3)3middot9H2O (Riedel de Haen
product) KNO3 (Merk product) and Cu(CH3COO)2middotH2O (Fluka product) and then
put into a vacuum oven at 40 degC at 36 rpm for 24 h The samples were heated
at 100 degC for 12 h and at 500degC for 4 h in air The results were also modeled
with a collaboration with the Politecnico di Milano and presented in this PhDrsquos
work
The synthesis of the catalyst with the aid of microwave is quite similar to the
TR The difference is the addition of a final step where the powder of catalyst
already calcined is subjected to a MW irradiation Two different methods for
the MW irradiation were used In the first one (MW1) it was taken a sample of
catalyst put it into a beaker and then put into a kitchen microwave oven
General Abstract
10
(Moulinex Micro-Chef 1305E 600W) for 30 min In the second method (MW2)
the catalyst (2 g) was suspended in hexane (400 ml) put it into a microwave
chemical reactor (ordinary 400 mL round bottom glass flask filled with the
liquid to be heated and activated) and treated for 1 h at 60W MW were
produced by a MW generator and sent to the MW applicator by an insulated
coaxial antenna Details of the MW applicator and of the associated
experimental techniques can be found in [24]
The US treatment have been used between the impregnation and the
evaporation step by irradiating the silica-precursors solution using a Sonicator
(W-385 Heat Systems Ultrasonics) with an effective input power of 60 W and a
tip diameter of 13 mm Silica solution promoters and water have been
sonicated by the US horn for 05 h in air atmosphere (US1) The same sample of
US1 was successively sonicated in a suspension of hexane in argon atmosphere
(instead of air) for 3h (US2)
b Catalysis Characterization
The obtained materials were characterized by X-ray powder diffraction
(XRD PANalytical XrsquoPert Pro CuKα radiation) operating at 40kV and 40mA
step size 00170 2θ degree and step scan 20s
The metal content of samples was determined by inductively coupled
plasma optical emission spectrometry (ICP-OES) using a Varian Liberty
Series instrument
Field emission scanning electron microscopy (SEM) images were obtained
using a LEO1525 instrument after depositing the samples depositing the
catalysts onto the sample holder and sputter coating with chromium
The elemental mapping of metals was obtained by using energy dispersive
X-ray spectroscopy (EDS) with a Bruker Quantax EDS instrument
General Abstract
11
Transmission electron microscopy (TEM) images were obtained using a
Philips 208 instrument
FT-IR spectra of different samples dispersed in KBr pellets were recorded
at room temperature using a Bruker IFS113V spectrometer Typically each
spectrum was obtained at a resolution of 1 cm-1 in the spectral region 400-
5000 cm-1
Specific surface area (SSA) of all catalysts was determined by
conventional N2 absorption using a Micromeritics ASAP2010 instrument
Before the analysis the samples were pre-treated at 200degC in a He flow
Conventional temperature-programmed reduction experiments (TPR) were
performed using a Thermoquest Mod TPRDO 1100 instrument The
samples were initially pre-treated in a flow of argon at 200degC for 05 h After
being cooled down to 50degC the H2Ar (51 vv) reducing mixture was
flushed through the sample at 30 mL min-1 and the temperature increased
from 50 to 900degC at a constant rate of 10degC min-1
Water and nitrate content of the solids was determined by
thermogravimetric (TG) analysis with a Netzsch STA 449C apparatus in air
flow and 10degCmin heating rate
c Kinetics Run
FT synthesis was performed into a fixed bed reactor using 1 g of fresh
catalyst mixed with 1 g of diluting material (-Al2O3) This diluting material
must be inert for FTS and acts as a good thermal conductor to control the
process temperature [25] The calcined catalysts were initially activated in
situ with the standard conditions of 468 Nml min-1 flow of syngas (H2CO =
21) at 350degC 3 bar for 4 h Then they were tested with the standard
conditions of 468 Nml min-1 flow of syngas (H2CO = 21) plus 50 Nml min-1
of N2 as internal standard at 20 bar at T = 250degC Others reducing activating
General Abstract
12
gases feeding compositions pressures temperatures have been tested in
the work Analyses of the gas-phase products (C1ndashC7) were performed with
an on-line micro gas-chromatograph (Agilent 3000) Liquid products were
collected in a trap at 5 degC and 20 bar and analyzed by a gas-chromatograph
(Fisons Mod 8000 Series) equipped with a Poparak-Q column after the total
time of reaction The aqueous phases collected in the cold trap were
analyzed by a TOC (Schimadzu Mod 5000A) to quantify the amount of
carbonaceous species dissolved in water
In the case of hydrotalcites FTS was performed in two different laboratory
plants with the same flow sheet The first one recently described and
located at the Universitagrave degli Studi di Milano and the second one at the
Universidad Central de Venezuela during a complementary stage in
Venezuela In this case the FTS was performed in a continuous flow system
with a fixed bed stainless-steel reactor (di =32mm l = 30 cm) The reactor
was loaded with 03 g of fresh catalyst mixed with 03 g of see sand as a
diluting material [26] The calcined catalysts were initially reduced in situ by
flowing hydrogen for 4 hours at 900 Nml˙min-1 350degC and 08 MPa After
the reduction step the temperature was lowered to 220degC under H2 They
were then tested in the standard conditions by flowing syngas (H2 CO N2
63325 vv N2 as internal standard) at 156 Nml˙min-1 increasing the
system pressure slowly up to 20 MPa and 220-260degC Once the reaction
temperature was achieved the reaction was led to proceed during a period
of 280 h
During reaction the reactor effluent passed through a hot trap kept at
150ordmC and 02 MPa to collect waxes and the products leaving this trap were
passed through a second trap kept at 0ordmC and 02MPa to collect the lighter
products (water alcohols and hydrocarbons) The analyses were performed
General Abstract
13
in various chromatographs according to the nature of the sample to be
analyzed Permanent gases and light hydrocarbons were analyzed on-line in
a PerkinElmer 3000GC Autosystem fitted with TCD detectors using a
Carbosieve SII Supelco column The liquid products (collected at 150ordmC and
0ordmC) were weighted and analyzed in a PerkinElmer chromatograph fitted
with a 50m long Alumina RT capillary column connected to a FID
A mass molar balance was performed for each FT run resulting in a
maximum error of plusmn 5 on molar basis
4 Results and discussion
a) Catalysts activation
i) Cobalt catalysts The catalytic activity of the samples depends on the
presence of metallic Co centres on the surface and the particle size Many
works have been done on the reducibility by TPR of CoOx mixed oxides The
reduction profile of Co3O4 consists of a low-temperature peak and a high-
temperature peak which correspond to the reduction of Co+3 to Co+2 and Co+2
to Co0 [27-30]
Two kinds of Co based catalysts were tested
The HTlc materials contain Co (II) ions randomly dispersed inside the brucitic
layers then the active phase in the FTS is the metallic cobalt Therefore in
order to have an active catalyst a reduction procedure is requires to maintain
the cobalt dispersion TPR analyses were performed to study the reduction
process and to select the best conditions for the catalyst activation Fig 1
reports the TPR profile of the sample Co5 Co10 Co15 Co35 All the profiles
exhibit two regions of reduction the first at lower temperatures (below 400degC)
which is due to the reduction of Co while the second peak above 700degC
indicates the presence of hardly reducible species These species are probably
spinel-type mixed oxides formed during the thermal treatment According to
General Abstract
14
Alvarez et al [31] these two peaks are well separated for samples with a small
particle size while an intermediate particle size causes the overlapping of the
two reduction steps resulting in a complete reduction with only one maximum
at an intermediate temperature (328degC) The TPR profiles of our HTlc (Fig 1)
are consistent with the latter case
Basing on the TPR results the tested catalysts were activated before FTS at
350degC for 4 hours under hydrogen atmosphere in order to reduce the Co ions
to metallic Co
Fig 1 TPR analysis of the samples Co5 Co10 Co15 Co35 Activation temperature is
indicated with the dashed line
After this treatment XRD analysis detected only mixed metal oxides and no
metallic Co phases so highlighting the presence of active metal atoms
homogeneously dispersed at the nanometer or sub-nanometer level [1432]
The same thing happens with the cobalt catalysts synthesized with ultrasound
The results of TPR confirm the data found in literature [27-30] where the Co
based catalysts need to be activated at 350degC for 4 hours under hydrogen
atmosphere It is important to note in Fig 2 how small amount of Ru decreases
the peak of the reduction temperature
General Abstract
15
100 200 300 400 500 600 700 800
Co-RuSiO2
CoSiO2
TC
D
Temperature (degC) 100 200 300 400 500 600 700 800
TC
D
CoAl2O
3
Co-RuAl2O
3
Temperature (degC) 100 200 300 400 500 600 700 800
CoTiO2
TC
D
Co-RuTiO2
Temperature (degC)
Fig 2 TPR analysis of the samples CoSiO2 and Co-RuSiO2 CoAl2O3 and Co-Ru Al2O3
CoTiO2 and Co-RuTiO2 Activation temperature is indicated with the dashed line
Basing on the TPR results the tested catalysts were activated before FTS at
350degC for 4 hours under hydrogen atmosphere in order to reduce the Co ions
to metallic Co
ii) Iron catalysts
As regard the method of synthesis of the iron based catalysts the main results
of catalysts characterization are reported in Table 2 All the surface areas (SA)
of the prepared catalysts are significantly lower than the SA of the
corresponding support (SiO2) This important decrease can be explained
considering the dilution effect due to the presence of iron on the support The
dilution effect can be easily assessed by considering the surface area of bare
silica support and assuming a negligible contribution of the iron phases to the
surface area The samples treated with MW and US have higher values of SA
than the traditional ones the effect of MW and US on SA is proportional with
the US or MW emitting power
The TPR analysis of these samples treated with MW gave results consistent
with those prepared by TR showing that the method of preparation does not
influence the step of reduction (Fe2O3-gt Fe3O4 -gt-Fe) of the catalyst but only
the peak temperature
General Abstract
16
Table 2 Characterization results of iron based catalysts using different method of synthesis
Sample Prep
Method
BET TPR TPD
Surface Area (m2g-1)
Temp of first
red peak (degC)
Temp of
second red peak (degC)
Temp of the peak (degC)
Bare support
Catalyst
Fe30K2Cu375SiO2 TR 4303 1601 240 600 170
Fe30K2Cu375SiO2 MW1
4303 1800 - - -
MW2 2240 240 580 162
Fe30K2Cu375SiO2 US1
4303 2011 236 572 171
US2 2101 - - - TR= Traditional Impregnation MW1= Catalyst put it into a kitchen MW and processed in powder MW2= Catalyst put it into MW and suspended in hexane US1= Catalyst suspended in aqueous solution in air atmosphere for 05 h US2= Catalyst sonicated and suspended in hexane in Argon atmosphere for 3h
In agreement with the literature [33] all the curves show a single TPDs peak in
the same range (150-170degC) that confirms the fact that only one type of
adsorbing species can exists up on the catalyst (see table 2) for all the catalysts
Before FT runs the catalysts must be activated reducing the hematite phase
(not active for FTS) in iron carbides (in particular Fe22C and Fe25C) and
magnetite (Fe3O4) [34] In literature there is not a uniform procedure for this
operation Many tests were performed by [34] and show that the best FT
results in term of CO conversion have been obtained using the activating
mixture H2CO (21) or pure CO starting from oxidized catalysts and making this
operation at T=350degC The process selectivity is not particularly modified using
the mixture H2CO (21) or pure CO and changing the activation temperature
b) FT results
i) Co based hydrotalcites as catalysts for Fischer-Tropsch synthesis
General Abstract
17
The activated samples were tested at different temperatures in the FTS plant
following the procedure reported in the experimental section In Fig 3 the CO
conversion vs the reaction temperature is reported for all the catalysts while
the products selectivity is displayed in Table 3
Fig 3 molar CO conversion to Co5 () Co10 ( ) Co15 (diams) Co35 () obtained at
different reactor temperatures after 24 hours of reaction
As expected for each catalyst the activity is strongly influenced by the reaction
temperature the higher the temperature the higher the CO conversion but
also the selectivity towards CO2 CH4 and light hydrocarbons is favored by a
higher temperature The CO conversion is similar for Co5 and Co10 while it is
higher for the two samples with a larger amount of cobalt ie Co15 and Co35
In particular Co15 exhibits the highest CO conversion at all the selected
temperatures In FTS it is fundamental to obtain low quantities of CH4 and CO2
(undesired products) to favor the formation of higher hydrocarbons For this
reason temperatures in the 220-235degC range are more suitable than the higher
ones
General Abstract
18
Moreover Table 3 shows that Co15 exhibits the highest CO conversion and the
highest C2+ total yield (without considering CH4 and CO2 see note in Table 3)
also at the lowest temperature (220degC) This result confirms that Co15 is the
best performing catalyst obtained in this study
The obtained data suggest the possibility of using synthetic hydrotalcites as Co-
based catalysts for FTS and pursuing subsequent studies on the same subject
Table 3 FTS products selectivity at different reactor temperatures
Sample Temperature
(degC)
Products Selectivity C2+
Yield CO2 CH4 leC7 gtC7
Co5 220 03 29 33 934 165
235 03 59 104 834 194
245 11 85 127 776 224
260 19 141 160 679 300
Co10 220 32 26 98 844 155
235 38 49 143 769 178
245 33 60 154 753 218
260 81 163 413 343 262
Co15 220 14 101 17 705 467
235 81 262 473 185 498
250 178 177 443 202 491
Co35 220 14 39 103 844 250
235 18 96 234 651 395
245 51 257 656 105 473
leC7 all the hydrocarbons in the range C2-C7 gtC7 all the hydrocarbons greater than C7 Product lsquolsquoirdquo selectivity = (moles C in product i) (converted moles C) x 100 C2+ yield = CO conversion x (selectivity leC7 + selectivity gtC7) x10-2
General Abstract
19
iii) Sonochemical synthesis of Co and Co-Ru based catalysts for Fischer-Tropsch
synthesis
The use of ultrasound might be very efficient to optimize the dispersion of a so
high metal charge as already verified in our laboratory in the past [35-36] This
special type of synthesis should give at the catalyst a particular structure with a
high surface area and a high metal dispersion that improves its activity towards
the synthesis of Fischer-Tropsch In the case of cobalt supported catalysts a
simple US step has been added in the catalyst preparation The precursors
(cobalt and ruthenium carbonyl) were dissolved in n-decane together with the
different support (SiO2 Al2O3 or TiO2) the solution was irradiated with
ultrasound at a frequency of 20 kHz and an output power of 300 W for 3 hours
As seen in table 4 the catalysts show a low selectivity to methane and carbon
dioxide and formation of higher hydrocarbons The more interesting results are
the highest CO conversion at lower temperatures measured with a catalysts
promoted with a Ru
Table 4 CO Conversion C2+total yield CH4 CO2 light hydrocarbon and heavy
hydrocarbon selectivity of CoCo-Ru based catalyst
Catalyst CO
Conversion ()
C2+ total yield
Selectivity ()
CH4 CO2 ltC7 gt C7
CoTiO2 28 23 5 14 10 71
CoSiO2 6 5 19 6 23 52
CoAl2O3 8 6 13 7 19 61
Co-RuTiO2 98 73 18 8 14 60
Co-RuSiO2 94 82 9 4 8 79
Co-RuAl2O3 84 73 11 2 12 75
As we have seen from the BET and TPR analysis the support and the promoter
play a key role in the performance of the catalyst because they are responsible
General Abstract
20
for the modification of some key parameters such as surface area and the
metal dispersion
ii)High Fe Loaded Supported Catalysts for Biosyngas Fischer ndash Tropsch
Conversion experimental results and detailed simulation
With regard to the treatment with the help of US (see table 5) it can be
concluded that the sonication of an aqueous mixture salts and precursors of
support (US1) is preferable instead of to the calcined catalyst suspended in
non-polar solvent such as hexane (US2) With regard to treatment with MW
(see table 3) there were obtained better results in term of CO conversion with
the powder catalyst treated directly in the MW (MW1) while the test
conducted by suspending the catalysts in hexane and then treated in a MW
reactor (MW2) for an hour did not give valid results The best FTS results in
term of C2+ yield (41) has been obtained using MW1 while in tem of CO
conversion (58) using US1 All of them gave FTS results better than the
traditional one Itrsquos evident that the use of US or MW optimizes the catalytic
performance in accord with previous similar results [36]
In agreement with [37] the FTS results show that TEOS as silica source is
favorable for the enhancement of the FTS activity
A very important property of iron based catalysts is their possibility to operate
using feeding gas having a ratio H2CO not stoichiometric (ie 2) In the
present work there were made some tests with Fe30K20Cu375 catalyst by
feeding mixtures with a ratio H2CO between 05 and 20 in order to optimize
the activity selectivity and the lifetime of this kind of FT catalyst in work
conditions of biosyngas feeding
General Abstract
21
Table 5 Catalytic Results of Fe30K20Cu375 Different preparation techniques Support
SiO2 Diluting Material α-Al2O3 T=220degC
Preparation CO Conversion
()
C2+
Total yield
Selectivity ()
CO2
CH4
lt C7
gt C7
TR 49 32 27 7 22 44
MW1 52 41 17 5 18 60
MW2 32 24 17 8 27 48
US1 58 38 29 6 22 43
US2 36 25 22 9 30 39
Co-precipitation 38 32 2 13 28 57 leC7 all the hydrocarbons in the range C2-C7 gtC7 all the hydrocarbons greater than C7 Product lsquolsquoirdquo selectivity = (moles C in product i) (converted moles C) x 100 C2+ yield = CO conversion x (selectivity leC7 + selectivity gtC7) x10-2
The co-precipitation test was made at T=250degC and TEOS as a support
On the basis of the collected data a rigorous simulation of the FT synthesis
reactor has been developed for different purposes (i) to support the
experimentations and their planning (ii) to predict the reactor yield and
conversion (iii) to optimize the performance of the reactor system with
different operating conditions and (iv) to calculate novel reliable kinetic
parameters based on the experimental data fitting by means of model-based
nonlinear regression techniques To do so the FT reactor is modeled as a
catalytic plug-flow reactor using mass and energy balances and reaction
kinetics for Fe-based catalyst defined by Zimmerman and Bukur [38] leading to
an ordinary differential equation system with structured Jacobian Lumping
techniques have been used to model heavy hydrocarbons The system is solved
by means of dedicated solvers to handle stiffness and nonlinearities of
heterogeneous reactive systems [39]
General Abstract
22
Typical H2CO ratio of syngas manufactured from coal or biomass are between
07-12 and the Fig 4 show that the activity of catalyst is good enough using
also feeding ratio between 10 and 20
Fig4 CO conversion or selectivity vs H2CO feeding ratio for Fe30K20Cu375 catalyst
at T=250degC
In Table 6 there is the data concerning the carbon monoxide conversion ()
and the selectivity towards undesired products (CO2 and CH4) and lighter and
heavy hydrocarbons of Fe-based catalyst The data collected using this catalyst
were modeled in collaboration with Politecnico di Milano
The selected model was based on the hypothesis that both FT and WGS
reaction were active on this catalyst The kinetic parameters were calculated
and compared with the experimental data
Table 6 FTS products selectivities at different H2CO ratio and reactor temperatures of
Fe30K20Cu375
Selectivity ()
H2CO T(degC) CO
Conversion ()
C2+ total yield
CO2 CH4 ltC7 gtC7
21 220 85 69 11 8 22 59
21 235 211 175 11 6 20 63
21 250 498 393 16 5 19 60
21 260 567 425 19 6 20 55
151 250 388 299 18 5 17 60
151 260 463 338 22 5 17 56
11 250 23 182 17 4 16 63
11 260 389 272 26 4 16 54
General Abstract
23
leC7 all the hydrocarbons in the range C2-C7 gtC7 all the hydrocarbons greater than C7 Product lsquolsquoirdquo selectivity = (moles C in product i) (converted moles C) x 100 C2+ yield = CO conversion x (selectivity leC7 + selectivity gtC7) x10-2
In Fig 5 is presented a comparison between the experimental data obtained in
the laboratory and the data obtained using the kinetic model The first two
columns represent the conversion of hydrogen and carbon monoxide while in
the other columns are represented the molar fraction of hydrogen carbon
monoxide water methane and lump C2 C3-4 C5-10 C11 + It can be seen that the
kinetic model present a good fitness regard to the experimental data
Fig 5 Comparison between experimental data and kinetic model
5 Conclusions
General Abstract
24
Concerning the results obtained in this PhDrsquos research work it is clear that all
the samples tested have given good results The Co-based catalysts
synthesized using the traditional impregnation method with an additional step
of ultrasound have given good results in comparison with the results in the
current literature The hydrotalcites have given lower results if compared with
the Co-based catalysts synthesized with the help of ultrasound but they have
opened an alternative and innovative way that has never been tried before
Iron based catalysts allow a direct conversion of the biosyngas and the results
have shown how our catalysts are active with an H2CO ratio le2 Furthermore
trends have been modeled with success In conclusion the PhDrsquos research
work has given a serious contribution to the current state of the art on
catalysis in the Fischer-Tropsch synthesis either with cobalt and iron based
catalysts With cobalt has been optimized a traditional synthesis procedure
with the introduction of ultrasound furthermore has been created a
completely new kind of catalyst With iron has continued an optimizationrsquos
work of iron supported with high loading metals so to develop a suitable
kinetic model able to work not only with syngas but also with biosyngas
References
[1] M S Hadnadev-Kostic J Tatjana T Vulic R Marinkovic-Neducin A D Nikolic B Jovic Journal of the Serbian Chemical Society 76 (12) (2011) 1661ndash1671 [2] E Lira C Loacutepez F Oropeza M Bartolini J Alvarez M Goldwasser F Loacutepez J Lamonier J Peacuterez Journal of Molecular Catalysis A Chemical 281 (2008) 146ndash153 [3] Q Zhang J Kang Y Wang ChemCatChem Catalysis 2 (2010) 1030 [4] F Fischer and H Tropsch BrennstChem 4 (1923) 276 [5] M E Dry Enciclopedia of Catalysis New York (2003) 247 [6] Fischer-Tropsch Technology Studies in Surface Science and Catalysis Elsevier (2004)
General Abstract
25
[7] G P Vaan Deer Laan A A C M Beenackers Catalysis Reviews Science and Engineering 41(3amp4) (1999) 255 [8] H Schulz Applied Catalysis A 186 (1999) 3 [9] GP van der Laan AACMBeenackers Applied Catalysis A 193 (2000) 39 [10] A Martinez C Lopez F Marquez IJ Diaz Catalysis 220 (2003) 486 [11] AY Khodakov WChu P Fongarland Chemical Reviews 107 (2007) 1692 [12] BHDavis Catal Today 84 (2003) 83 [13] Pirola C Bianchi CL Di Michele A Diodati P Vitali S Ragaini V Catal Lett 2009 131294ndash304 [14] A Di Fronzo C Pirola A Comazzi F Galli CL Bianchi A Di Michele R Vivani M Nocchetti M Bastianini DC Boffito Fuel 119 (2014) 62-69 [15] C Pirola CL Bianchi A Di Michele S Vitali V Ragaini Catal Comm 10 (2009) 823ndash827 [16] T Montanari M Sisani M Nocchetti R Vivani M C H Delgado G Ramis G Busca U Costantino Catalysis Today 152 (2010) 104 [17] C Resini T Montanari L Barattini G Ramis G Busca S Presto P Riani R Marazza M Sisani F Marmottini U Costantino Applied Catalysis A 355 (2009) 83 [18] Y Lee J H Choi H J Jeon K M Choi J W Lee J K Kang Energy Environment Science 4 (2011) 914 [19] Y Tsai X Mo A Campos J G Goodwin Jr J Spivey Applied Catalysis A General 396 (2011) 91ndash100 [20] M Bastianini D Costenaro C Bisio L Marchese U Costantino R Vivani M Nocchetti Inorg Chem 51 (2012) 2560-2567 [21] Suslick SK ldquoApplications of ultrasound to materials chemistryrdquo MRS Bulletin 1995 [22] S Qi B Yang Methane aromatization using Mo-based catalysts prepared by microwave heating Catal Today 98 (2004) 639-645 [23] Y Liu Y Lu S Liu Y Yin The effect of microwaves on the catalysts preparation and the oxidation of o-xilene over a V2O5SiO2 system Catal Today 51 (1999) 147-151] [24] G Biffi Gentili M Linari I Longo A Ricci IEEE Transactions on microwave theory and techniques Vol 57 (2009) 9 [25] C Bianchi C Pirola V Ragaini Catalysis Communications 7 (2006) 669-672 [26] ML Cubeiro Loacutepez A Colmenares L Texeira M Goldwasser M J Peacuterez F Machado F Gonzaacutelez Applied Catalysis A General 167 (1998) 183-193 [27] C L Bianchi Catalysis Letters Vol 76 No 3ndash4 (2001)155-159 [28] H-Y Lin Y-W Chen C Li Thermochim Acta 400 (2003) 61ndash67 [29] H-Y Lin Y-W Chen Materials Chemistry and Physics 85 (2004) 171ndash175
General Abstract
26
[30] BA Sexton AE Hughes TW Turney Journal of Catalysis 97 (1986) 390ndash406 [31] A Alvarez S Ivanova MA Centeno JA Odriozola Applied Catalysis A General (2012) 431ndash 432 [32] C L Bianchi C Pirola DC Boffito A Di Fronzo A Di Michele R Vivani M Nocchetti M Bastianini S Gatto DGMK Tagungsbericht Volume2011-2 IssuePreprints of the DGMK-Conference Catalysis Innovative Applications in Petrochemistry and Refining 2011 Pages 93-98 Journal 2011 CODEN DGTAF7 ISSN1433-9013 [33] 7 H Wan B Wu C Zhang H Xiang Y Li Promotional effects of Cu and K on precipitated iron-based catalysts for Fischer ndash Tropsch synthesis J molecular Catalysis 283 (2008) 33-42 [34] J Xu CHBartholomew J Phys Chem B 109 (2005) 2392 [35] CLBianchi VRagaini Catalysis Letters 95 (2004) 61-65 [36] C Pirola C L Bianchi A Di Michele P Diodati D C Boffito V Ragaini Ultrasonic Sonochem 17 (2010) 610 [37] Suo Haiyun Zhang Chenghua Wu Baoshan Xu Jian Yang Yong Xiang Hongwei Li Yongwang A comparative study of FeSiO2 FischerndashTropsch synthesis catalysts using tetraethoxysilane and acidic silica sol as silica sources Catalysis Today Volume 183 Issue 1 20 March 2012 Pages 88ndash95 [38] WH Zimmerman DB Bukur Can J Chem Eng 68 (1990) 292-301 [39] F Manenti I Dones G Buzzi-Ferraris HA Preisig Ind Eng Chem Res 48 (2009) 9979-9984
27
Chapter 1 General Introduction The National Renewable Energy Laboratory (NREL) and the Pacific Northwest
National Laboratory (PNNL) [1] are undertaking studies of biomass conversion
technologies to hydrocarbon fuels
Process designs and preliminary economic estimates for each of these pathway
cases were developed using rigorous modeling tools This technology pathway
case investigates the upgrading of woody biomass derived synthesis gas
(syngas) to hydrocarbon biofuels While this specific discussion focuses on the
conversion of syngas via a methanol intermediate to hydrocarbon blend stocks
there are a number of alternative conversion routes for production of
hydrocarbons through a wide array of intermediates from syngas (Fig 11)
Technical barriers and key research needs have been identified that should be
pursued for the syngas-to-hydrocarbon pathway to be competitive with
petroleum-derived gasoline- diesel- and jet-range hydrocarbon blend stocks
Fig 11 Process Block Diagram [1]
At present the development of economical and energy-efficient processes for
the sustainable production of alternative fuels and chemicals is a global
Chapter 1 General Introduction
28
demand and FTS is a crucial technology for this purpose [2] On the one side
the observed climate change particularly global warming is widely held as a
consequence of the increase of atmospheric CO2 concentration due to fossil
fuel combustion On the other side people are increasingly aware that fossil
fuels reserves are huge but not unlimited and the air quality are major
environmental concerns because they directly affect the way we live and
breathe
In order to meet the present and future threats generated by emissions to the
atmosphere environmental agencies around the world have issued more
stringent regulations One of them is the control of residual sulfur in diesel fuel
and emission standards for particulates from diesel vehicles All these facts
have recently aroused renewed interest in the FischerndashTropsch Synthesis
because it can produce super clean diesel oil fraction with high cetane number
(typically above 70) without any sulfur and aromatic compounds using syngas
(mixture of H2 CO CO2) from natural gas CH4 coal landfill gas coal or biomass
through steam reforming partial or auto thermal oxidation gasification
processes or as a new tendency from biomass [3-5] Mineral diesel basically
results from refining and fractional distillation of crude oil between 160 and
380degC at atmospheric pressure and is mostly formed by mixtures of paraffins
containing between 12 and 20 carbon atoms per molecule In these mixtures
linear paraffins are particularly appreciated due to their high cetane number
ie their excellent ignition performances Expansion and social progress is
however boosting a further increase of energy demand particularly in the
transportation sector which in developed countries accounts for most of this
increase This is the reason why carbon-neutral biofuels are largely considered
a possible way to satisfy the energy demand without dramatically increasing
the CO2 content of the atmosphere [6]
Chapter 1 General Introduction
29
In this context the production of hydrocarbons starting from syngas (CO + H2) is
a crucial topic because syngas can be manufactured from natural gas (GTL Gas
to liquid) coal (CTL coal to liquids) or biomass (BTL Biomass to liquid) [7] In
Fig 12 the industrial way to utilize syngas are reported the fuels produced
from syngas include hydrogen by the water-gas-shift (WGS) reaction methanol
by methanol synthesis alkenes by Fischer Tropsch synthesis (FTS) isobutene by
isosynthesis ethanol by fermentation or with homogeneous catalysts and
aldehydes or alcohols by oxosynthesis
Fig 12 Diagram of Syngas Conversion Processes [8]
Fischer-Tropsch Synthesis (FTS) is a well-known industrial process discovered
by Franz Fischer and Hans Tropsch in Germany in 1923 [9] starting from syngas
(H2 + CO) and using iron or cobalt based catalysts it is possible to produce
several hydrocarbons in the range from 1 to 100 carbon atoms Co-based
catalysts have been more largely used due to their high selectivity to heavy
hydrocarbons and low activity in the water-gas shift reaction so limiting the
CO2 formation Moreover Co-based catalysts have shown longer life-time and
higher CO conversion compared to the Fe-based ones [10-11] The essential
target of FTS is to produce paraffins and olefins with different molecular weight
Chapter 1 General Introduction
30
and to limit the maximum formation of methane and CO2 [4 12-15] The main
reactions involved in FTS are reported in the following scheme
Irreversible reactions
1) n CO + 2n H2 rarr CnH2n + n H2O for olefins
2) n CO + (1+2n) H2 rarr CnH(2n+2) + n H2O for paraffins
3) 2n CO + n H2 rarr CnH2n + n CO2 for olefins
4) n CO + 2n H2 rarr CnH(2n+1)OH + (n-1) H2O for alcohols
Equilibria
5) CO + H2O harr CO2 + H2 Water-gas-shift reaction (WGS)
6) CO + 3 H2 harr CH4 + H2O
7) 2 CO harr C + CO2 Boudouard equilibrium
The whole reaction gives an energetic contribution strongly exothermic (about
150 kJmol CO reacted) FTS is a particularly complex system in which a
number of different reactions are combined to a unique mechanism
irreversible FT reactions produce hydrocarbons and some equilibria reactions
between CO CO2 CH4 and C such as the WGS reaction and the Boudouard
equilibrium are present too Nevertheless it is possible to suppose that FTS
can be simplified as a combination of the FT reactions and the WGS reaction
[14] Hydrocarbons are primary products of FT reaction and CO2 can only be
produced by WGS reaction a reversible parallel-consecutive reaction with
respect to CO [16]
At present the marketplace places a premium on FT diesel but not gasoline
thus the current view is that the most attractive option is to produce high
molecular weight FT products and then to hydrocrack them to produce high
quality diesel fuel [17] According to Calderone et al [18] the most important
limitation to the industrialization of FT processes is the availability of cheap oil
Industrial interest in FT reactions always peaks during oil crises (Fig 13) The
Chapter 1 General Introduction
31
Kyoto protocol recognizes the importance of developing and deploying new
technologies with less impact on the environment
Fig 13 The oil price (line) related to the output of peer reviewed FTS research papers and patents (bars) in 1925ndash2007 [19]
Fig 14 Number of papers related to FT synthesis published in the past decade From
ISI Web of Science using the keyword ldquoFischer-Tropschrdquo [20]
Selectivity control remains one of the most important and difficult challenges
in the research area of FTS Development of efficient catalysts with controlled
selectivity or tuned product distribution is a highly desirable goal [5]
Compared to cobalt systems iron-based catalysts are cheaper but less resistant
to deactivation due to the oxidizing effect of water despite activating Water
Gas Shift (WGS) reaction (CO + H2O harr CO2 + H2) [12 16] Moreover they are
flexible to changes in temperature pressure and they can work at different H2
CO feed ratios (for iron based catalysts this ratio can be between 05 and 25)
[21-22] Iron catalysts seem to be more suitable to work with biomass-derived
Chapter 1 General Introduction
32
syngas as outlined by Corma et al [23] that are characterized by a low ratio
H2CO and by the presence of CO2 (the activation of WGS reaction in fact can
produce CO from CO2) They present lower methane selectivity and they are
less deactivated by poisons species [24] The iron based catalysts have different
active site the Fe-carbides sites are active for the formation of hydrocarbons
(FTS) while the magnetite (Fe3O4) sites are the most active phase for the WGS
reaction [16 25-26]
11 Fischer Tropsch Synthesis Historical background
A Short Historical Sketch
Year Ref
1902 P Sabatier and J D Senderens
Hydrogenated CO over Ni to produce CH4 [27]
1910 A M Mittasch C Bosch and F Haber
Developed promoted Fe catalysts for the synthesis of NH3 [28]
1913 Badische Anilin und Soda Fabrik (BASF)
Received patents on the preparation of hydrocarbons and oxygenates by the hydrogenation of CO at high pressure usually on oxide catalysts
1936 Eugene Houdry Developed and installed the first commercial catalytic cracking unit [29]
1943-1944
Kogravelbel KWIK and five companies participated
Initiated and directed the comparative tests I and II held at Schwarzheide to select a Fe catalyst to replace Co in existing reactors Although the results were remarkably good no replacement catalyst was selected probably because of the overall disarray of activity that attended the approach of the end of the war
[30]
1949 Kogravelbel and F Engelhardt
Discovered that H2O and CO react on FTS catalysts to yield typical FTS products
1950 A fluidized-fixed bed process developed by Hydrocarbon Research Trenton New Jersey was installed in Brownsville Texas This plant called Carthage Hydrocol Inc used reformed natural gas Severe operating difficulties required designing a new reactor which was installed in 1953 The new reactor operated properly but the plant was promptly shut down sold and dismantled By the time the plant was operating correctly the price of natural gas had more than doubled Merely selling the gas was more profitable than converting it to gasoline and chemicals At the same time in South Africa the SASOL FTS plant using coal was constructed and opened in 1955 Lurgi gas generators and Rectisol gas-cleaning units were employed Two types of FTS reactors both with Fe catalysts were used a fixed-bed with recycle unit designed by Ruhrchemie in West Germany having long tubes with an internal diameter of 2 inch and an entrained-solids reactor by M W Kellogg in New Jersey After a year or more of start-up problems these units have operated successfully up to the present
[31]
1953 R B Anderson and J F Shultz
Found that Fe nitrides are unique durable catalysts for the FTS that produce large yields of alcohols Anderson developed equations that predict the isomer and carbon-number distributions of FTS products
[32]
1957 G Natta and co-workers
Studied the methanol and higher alcohol syntheses [3334]
1959 Pichler Resumed work on FTS on Ru which led to the polymethylene synthesis
Chapter 1 General Introduction
33
1961 H H Storch He died he was the architect of the useful scientific and engineering research programs on coal-to-oil processes at the US Bureau of Mines in Pittsburgh and Bruceton Pennsylvania
[3235]
1967 US Bureau of Mines workers
Developed methods for flame spraying catalysts onto metals for the platelet assemblies of hot-gas-recycle reactors These techniques led to the development of a new FTS unit the tube-wall reactor
[36]
1975 SASOL II SASOL III
In South Africa the decision was made to build SASOL II scheduled for operation in 1980 and in 1979 plans were made for SASOL III to begin operation in 1982 The new plants are similar to the initial plant except that fixed-bed FTS reactors were not included in the new installations
[31]
1976 Mobil Announced a process for converting methanol to an aromatic gasoline and C to C4 olefins on the shape-selective catalyst ZSM5 This process may be a serious competitor for FTS
1981 New Zealand A methanol plant operating on natural gas plus the Mobil process was planned scheduled for competition in 1985
1982 The worldwide recession
Sharply decreased demand for petroleum OPEC was unable to control the production and price of oil among its members The relatively low cost and abundance of petroleum has discouraged new coal-to-oil ventures
1993 Shell in Bintulu Malaysia
Completed construction and began operating their ldquoShell Middle Distillate Processrdquo The Bintulu Plant produces 12500 BPD and in 2000 increase that capacity to 15000 BPD This F-T plant has effectively captured the world specialty wax market
2000 While Saudi Arabia produced about 8 million barrels of oil per day in 2000 the world flared (burned) or re-injected associated gas equivalent to 72 million barrels per day of clean synthetic fuels Worldwide environmental legislation requiring ultra-low sulphur and aromatic levels in fuel will cost billions in oil refinery upgrading
2002 Nearly every major oil company is either developing their own F-T technology forming joint ventures or scrambling to do so ExxonMobil has spent over $500 MM Chevron formed a joint venture with Sasol Statoil has formed a joint venture with Mossgas Conoco built a $400MM test plant in Oklahoma BP completed its pilottest plant in Alaska Shell has announced 7 new projects
2004 50 new Fischer-Tropsch projects have been announced These projects total over 900000 BPD capacity Some of these projects are pilot plants some are feasibility studies for clients and some have started construction
2005 In South Africa Mossel Bay GTL Expansion operated by PetroSA with a capacity of 15000bpd
2006 In Qatar ORYX GTL Phase 1 operated by SasolQatar Petrol with a capacity of 32400 bpd
2011 In Qatar Pearl GTL Phase 1 operated by Shell with a capacity of 70000 bpd
2011 In Qatar Pearl GTL Phase 2 operated by Shell with a capacity of 70000 bpd
2013 In Nigeria Escravos operated by ChevronNNPC with a capacity of 34000bpd
2017 In Uzbekistan Oltin Yorsquol GTL operated by SasolUNGPetron with a capacity of 38000bpd
2018-19
In USA Sasol Lousiana operated by Sasol with a capacity of 96000bpd
Firm proposed large-scale GTL capacity outlook
Chapter 1 General Introduction
34
Fig 15 The Sasol Synfuels plant at Secunda South Africa
Fig 16 ldquoShell Middle Distillate Processrdquo in Bintulu Malaysia
Fig 17 Franz Fischer and Hans Tropsch
12 Present Situation of Fischer-Tropsch Technology
High energy prices and concerns about the environmental consequences of
greenhouse gases (GHG) emissions lead a number of national governments to
provide incentives in support of the development of alternative energy
Chapter 1 General Introduction
35
sources making renewables the worldrsquos fastest-growing source of energy in
the outlook
According to the Annual Energy Outlook 2013 [37] the aggregate fossil fuel
share of total energy use falls from 82 percent in 2011 to 78 percent in 2040 in
the Reference case while renewable use grows rapidly (Fig 17) The
renewable share of total energy use grows from 9 percent in 2011 to 13
percent in 2040 in response to the federal renewable fuels standard
availability of federal tax credits for renewable electricity generation and
capacity during the early years of the projection and state renewable portfolio
standard (RPS) programs
Increased vehicle fuel economy offsets growth in transportation activity
resulting in a decline in the petroleum and other liquids share of fuel use even
as consumption of liquid biofuels increases Biofuels including biodiesel
blended into diesel E85 and ethanol blended into motor gasoline (up to 15
percent) account for 6 percent of all petroleum and other liquids consumption
by energy content in 2040
Consumption of petroleum and other liquids peaks at 198 million barrels per
day in 2019 in the AEO2013 reference case and then falls to 189 million barrels
per day in 2040 (Figure 18)
Fig 18 Primary energy use by fuel 1980-2040 (quadrillion BTU)
Chapter 1 General Introduction
36
The transportation sector accounts for the largest share of total consumption
throughout the projection although its share falls to 68 percent in 2040 from
72 percent in 2012 as a result of improvements in vehicle efficiency following
the incorporation of CAFE standards for both LDVs and HDVs
An increase in consumption of biodiesel and next-generation biofuels (include
pyrolysis oils biomass derived Fisher-Tropsch liquids and renewable feedstocks
used for on-site production of diesel and gasoline) totaling about 04 million
barrels per day from 2011 to 2040 is attributable to the EISA2007 RFS
mandates The relative competitiveness of CTL and GTL fuels improves over the
projection period as petroleum prices rise In 2040 CTL and GTL together
supply 03 million barrels per day of nonpetroleum liquids
Fig 19 Consumption of petroleum and other liquids by sector 1990-2040 (million
barrels per day)
2 Oil prices and total energy consumption
The importance of the research in FTS is directly dependent of the oil prices
and the total energy consumption So it is so important to meet the
projections of these variables before to make every kind of investments on this
area In AEO2013 oil prices are represented by spot prices for Brent crude
Prices rise in the Reference case from $111 per barrel in 2011 to about $117
Chapter 1 General Introduction
37
per barrel in 2025 and $163 per barrel in 2040 (Table 1) The price rise starts
slowly then accelerates toward the end of the projection period
Market volatility and different assumptions about the future of the world
economy are reflected in the range of oil price projections for both the near
and long term however most projections show oil prices rising over the entire
projection period
Table 1 Comparisons of oil price projections 2025 2035 and 2040 (2011 dollars per
barrel)
As regard the total energy consumption the in table 2 there are four different
projections made by other organizations (INFORUM IHSGI ExxonMobil and
IEA) [37]
Chapter 1 General Introduction
38
Table 2 Comparisons of energy consumption by sector projections 2025 2035 and
2040 (quadrillion BTU)
ExxonMobil includes a cost for carbon dioxide (CO2) emissions in their
projection which helps to explain the lower level of consumption in their
outlook Although the IEArsquos central case also includes a cost for CO2 emissions
its Current Policies Scenario (which assumes that no new policies are added to
those in place in mid-2012) is used for comparison in this analysis because it
corresponds better with the assumptions in the AEO2013 Reference case
ExxonMobil and IEA show lower total energy consumption across all years in
comparison with the AEO2013 Reference case Total energy consumption is
Chapter 1 General Introduction
39
higher in all years of the IHSGI projection than in the AEO2013 Reference case
but starts from a lower level in 2011
For the transportation sector the difference could be related to vehicle
efficiency as the INFORUM projection for motor gasoline consumption (2
quadrillion Btu lower than AEO2013) is comparable with the EIA projection in
AEO2012 which did not include the efficiency standard for vehicle model years
2017 through 2025
IHSGI projects significantly higher electricity consumption for all sectors than in
the AEO2013 Reference case which helps to explain much of the difference in
total energy consumption between the two projections
Then the projections make possible the investment on research in Fischer ndash
Tropsch synthesis
The process known as Gas to Liquid (GTL) was based on two steps
Steam reforming of natural gas into syngas
Fischer Tropsch synthesis from syngas into synthetic liquid fuels
Recently (2004-2006) the massive growth of GPN (Gross National Product) in
China and India has caused crude oil process to rise continuously and FTS
(including both coal and biomass as feedstock BTL) has become once more an
appealing technology Recent interest in FT technology especially in Europe and
South America is driven by a focus on the gasification of biomass into fuel [38]
(BTL)
Biomass to Liquid via FischerndashTropsch (BTL-FT) synthesis is gaining increasing
interests from academia and industry because of its ability to produce carbon
neutral and environmentally friendly clean fuels
In the BTL-FT process biomass such as woodchips and straw stalk is firstly
converted into biomass-derived syngas (bio-syngas) by gasification
Chapter 1 General Introduction
40
Bio-syngas resulting from biomass gasification contains CO H2 CO2 CH4 and
N2 in various proportions [39 40] Then a cleaning process is applied to
remove impurities from the bio-syngas to produce clean bio-syngas which
meets the FischerndashTropsch synthesis requirements Cleaned bio-syngas is then
conducted into a FischerndashTropsch catalytic reactor to produce green gasoline
diesel and other clean biofuels
Generally there are three main steps in the Biomass to Liquid via Fischerndash
Tropsch (BTL-FT) synthesis [41-43] Biomass is firstly converted into biomass-
derived syngas (bio-syngas) by gasification In a second step a cleaning process
is applied to the bio-syngas in order to remove impurities resulting in clean
bio-syngas which meets the FischerndashTropsch synthesis requirements Finally
the cleaned bio-syngas is then conducted into FischerndashTropsch catalytic reactor
to produce green gasoline diesel and other clean biofuels The flow sheet of
the BTL-FT process is depicted in Figure 110
Fig110 Flow sheet of the Biomass to Liquid via FischerndashTropsch Synthesis (BTL-FT)
process [44]
It is difficult to predict the composition of the gas product from a gasifier due
to the complex reactions occurred during the gasification Table 13 shows the
typical composition of gas produced from gasification of wood and charcoal
with low to medium moisture content with ambient air as the gasifying agent
in a downdraft gasifier [45] and composition of bio-syngas from biomass
gasification [46ndash48]
Chapter 1 General Introduction
41
At present the main commercial interest in FTS is the production of high
quality sulphur-free synthetic diesel fuels from natural gas currently being
flared at crude oil production wells [49-52] This renewed interest in FTS has
not just only come about as a result of abundant supply of natural gas but also
because of the global development of fuel supplies and environmental
regulations to improve air quality in cities around the world
All these facts have recently aroused renewed interest in the FischerndashTropsch
Synthesis Synthetic diesel is being promoted by the fuel industry because it
can produce super clean diesel oil fraction with high cetane number (typically
above 70) without any sulfur and aromatic compounds with low particulate
formation and low NOx and CO emission [3-4 53] as the most viable next step
towards the creation of a sustainable transport industry
Table 13 Composition of gas produced from gasification of wood and charcoal in
ambient air [45] and also the composition of typical nitrogen free bio-syngas [46ndash48]
Component Wood gas (air) Charcoal gas (air) Bio-syngas
(nitrogen free)
N2 50ndash60 55ndash65 0
CO 14ndash25 28ndash32 28ndash36
CO2 9ndash15 1ndash3 22ndash32
H2 10ndash20 4ndash10 21ndash30
CH4 2ndash6 0ndash2 8ndash11
C2H4 na na 2ndash4
BTX na na 084ndash096
C2H5 na na 016ndash022
Tar na na 015ndash024
Others na na lt0021
Chapter 1 General Introduction
42
3 Viability of GTL for the gas market
According to Brown [54] between 1950 and 2010 global volumes of GTL
product output capacity had materialized at less than 100000 bd -roughly
equivalent to the output of just one average- sized east European refinery
However the recent confluence of several factors has altered the commercial
viability of the GTL industry suggesting that wide margins and robust revenues
can be earned by converting natural gas into clean-burning liquid fuels and
other high value oil-linked commodities Broadly speaking these factors are
1) Improvements in the lifespan of the catalysts used to derive hydrocarbon
chains from natural gas (methane) and efficiency gains in the Fischer Tropsch
processes
2) The detachment of natural gas markets from oil prices and the subsequent
wide differential between the two prices courtesy of the unconventional gas
boom
3) Long-term global demand trends favouring low-emissions fuels in the
transport sector
Despite these auspicious circumstances however this paper argues that GTL
fuels will have only a limited reach into oil product markets and the transport
sector going forward While downward pressure on natural gas prices and
increasing demand for clean-burning motor fuels have ushered in visions of a
new future of transport fuels (that) will soon go global [55] the transient
conditions that had supported a favourable outlook for the proliferation of GTL
liquid fuels over the period of 2009-12 have more recently shown signs of
deterioration Moreover alternative and less capital-intensive pathways to
natural gas monetization are emerging via small-scale modular GTL plants
whose development has been encouraged by the rapidly increasing supply of
Chapter 1 General Introduction
43
unconventional and associated gas which has necessitated more practical and
localized gas monetization solutions
Commodity prices for transport fuels such as diesel are closely correlated to
crude price movements (see Fig 110) and moreover trade at a premium to
crude benchmarks depending on regional dynamics such as product balances
and cyclical demand conditions GTL products sharing identical physical
characteristics with crude-refined diesel have the potential to exploit not only
the market price differential between gas feedstock and oil prices but in
addition the spread between oil benchmark prices and oil product markets
The confluence of these dynamics leads to significantly wider margin potential
than that experienced by crude-refined alternatives in oil product markets at
least in a context defined by high oil and low gas prices Accordingly the upside
revenue potential of large-capacity GTL builds is dictated by the relatively
straightforward principle that the more capacity dedicated to products trading
at a premium to crude a plant has the higher the plants revenues will be
Fig 111 Correlation between ultra-low sulphur diesel spot prices and Brent crude
Europe offers an ideal destination for GTL-derived diesel A combination of
stringent fuel quality specifications and declining domestic supply supports a
healthy environment for gasoil and diesel imports Moreover the oil product
market is predominately driven by gasoildiesel consumption which accounted
Chapter 1 General Introduction
44
for well over half (56 per cent see Fig 111) of main product demand in 2012
As such the current application and commercialization of GTL diesel in Europe
reflects the potential of GTL diesel to impact global gasoil markets
Fig 112 Europe main oil product demand (2012)
In order to meet supranational carbon emissions targets progressively tighter
EU-wide Fuel Quality Directives have mandated a sharp reduction of sulphur
content in gasoildiesel marketed within the European Union The
specifications for sulphur content in motor fuels (gasoline and diesel) in the
road sector were reduced from 350 parts per million (ppm) in 2000 to just 10
ppm in 2009 The legislation was amended in 2011 to encompass gasoil and
diesel consumed in off-road sectors such as railways and inland navigation
and by 2012 10 ppm gasoil accounted for an estimated 80 per cent of Europe-
wide gasoil demand [54]
The gasoil produced by refineries in Europe has varying physical characteristics
in terms of sulphur content (affecting particulate emissions) cetane index
(influencing ignition quality in combustion engines) and viscosity (affecting
energy content and fuel efficiency) each influencing market value
It has been estimated that FT-GTL should be viable at crude oil prices of about
$20 per barrel The oil price has been well above $70 per barrel (more recently
Chapter 1 General Introduction
45
it has even topped above $100 per barrel) making it a very appealing for
countries that have huge reserves of natural gas but little local market for it
and no major pipeline infrastructure to ship it to larger economies
In Fig 112 it can be seen a geographical representation of the world proved
reserves for 2011
Fig 113 World proved reserves 2011 [37a]
12 Fischer Tropsch GTL Process and Chemistry
According to [56] the basic FT-GTL process consists of three fundamental steps
which require significant supporting infrastructure and a secure feed gas supply
to function effectively (Fig 113)
1 The production of synthesis gas (syngas) The carbon and hydrogen are
initially divided from the methane molecule and reconfigured by steam
reforming andor partial oxidation The syngas produced consists
primarily of carbon monoxide and hydrogen
2 Catalytic Fischer Tropsch synthesis The syngas is processed in Fischer-
Tropsch reactors of various designs depending on technology creating a
wide range of paraffinic hydrocarbons product (synthetic crude or
Chapter 1 General Introduction
46
syncrude) particularly those with long chain molecules (eg those with
as many as 100 carbons in the molecule)
3 Cracking-product workup The syncrude is refined using conventional
refinery cracking processes to produce diesel naphtha and lube oils for
commercial markets [57] By starting with very long chain molecules
the cracking processes can be adjusted to an extent in order to produce
more of the products in demand by the market at any given time In
most applications it is the middle distillate diesel fuel and jet fuels that
represent the highest-value bulk products with lubricants offering high-
margin products for more limited volume markets In modern plants
FT-GTL unit designs and operations tend to be modulated to achieve
desired product distribution and a range of products slates [58]
Fig 114 Large scale FT-GTL projects become more economically robust for the
developer if they involve integrated upstream and downstream components securing
feed gas supplies and additional revenues from NGL and condensate extracted from
the feed gas [56]
Chapter 1 General Introduction
47
The Fischer Tropsch processes are not limited to using gas derived from large
conventional non- associated natural gas as a feedstock coal seam gas
associated gas coal or biomass can all be processed using FT technologies by
changing the catalysts and work conditions (Pressure and temperature) A
secure supply of feed gas from whatever origin is important for the
commercial viability of large-scale FT-GTL plants Integrated upstream and
downstream projects therefore offer GTL project developers lower-risk returns
1) The production of synthesis gas (syngas)
Synthesis gas (ldquosyngasrdquo) is typically produced using either partial oxidation or
steam reforming processes [59] Syngas is an intermediate gas feed for many
different petrochemical processes including a range of GTL alternative
technologies
Partial
Oxidation
CH4 + frac12O2 CO +
2H2 (exothermic)
The key components required for this approach include A combustion chamber operated at high temperatures (1200-1500degC) without catalysts Process designs to impede a competing reaction to syngas formation which involves the decomposition of methane to carbon black (due to high temperature non-catalytic nature of the chemistry) [59]
Steam
Reforming
CH4 + H2O CO + 3H2 (endothermic)
Steam reforming is usually carried out in the presence of catalyst ndasheg nickel dispersed in alumina in operating conditions involving temperatures of 850-940degC and pressure of about 3MPa The process is typically conducted in tubular packed reactors with heat recovery from flue gas used to pre-
Chapter 1 General Introduction
48
heat the feed gas or to raise steam in waste heat boilers Several well-established engineering companies offer their own variants of this process
Other possible reactions are
CO+ H2O CO2 + H2
CH4+ CO2 2CO + 2H2
2) Fischer-Tropsch synthesis
According to [55] Fischer-Tropsch synthesis is one of a several technologies to
polymerise the carbon and hydrogen components into long-chain molecules
CO + 2H2 -CH2- + H2O (very exothermic)
Which in practice operates more typically as
2CO (gas) + H2 (gas) (-CH2-)n (liquid) + CO2 (gas) + H2O
The process involves some carbon dioxide emission and watersteam
production along with the hydrocarbon liquid production
The typical FT reactions compete with the methanation (reverse of steam
reforming) reaction (and reactions that lead to the production of propane and
butane (LPG) which are also highly exothermic
CO + 3H2 CH4 + H2O
In order to promote FT reaction in preference to methanation (or LPG
reactions) the synthesis is run at low temperatures 220-350degC pressure 2-3
MPa with carefully selected catalysts (ie commonly cobalt) in reactors that
encourage the growth of long-chain hydrocarbon molecules Several
companies hold patents associated with XTL catalysts process vessels and
process sequences (eg Conoco Phillips CompactGTL ExxonMobil Rentech
Sasol Shell Syntroleum and others) however it is only Sasol and Shell that
have built large-scale commercial plants (iegt5000 barrelsday of GTL product)
Chapter 1 General Introduction
49
rather than pilot-scale or demonstration plants The industry therefore remains
in its infancy and the many patents held by relatively few companies act as a
costly barrier to entry for resource-rich gas companies and countries wishing to
use GTL as an alternative means of monetizing their gas
There are two major categories of natural gas-based FT process technology the
high-temperature and the low-temperature types
HTFT (High-Temperature Fischer-Tropsch) In HTFT because of the process
conditions and the catalysts involved the syncrude produced includes a high
percentages of short chain (ie lt10 carbon atoms) with significant amounts of
propane and butane mixed with olefins (eg propylene and butylene) These
short-chain hydrocarbons gases are typically extracted from the tail gas stream
utilizing cryogenic separation The resultant lean tail gas is recycled and mixed
with additional lean feed gas for further syngas production [60] The high-
temperature (HT) iron catalysts-based FT GTL process produces fuels such as
gasoline and diesel that are closer to those produced from conventional oil
refining The resultant GTL fuels are sulphur-free but contain some aromatics
[61] Typical process operation conditions for HTFT are temperatures of
approximately 320degC and pressures of approximately 25MPa Conversion in
HTFT can begt85 efficient [62] but not all the products are readily usable or
capable of producing high-quality transport fuels HTFT processes tend to be
conducted in either circulating fluidized bed reactors or fluidized bed reactors
[63]
LTFT (Low-Temperature Fischer-Tropsch) LTFT involves the use of low-
temperature (LT) cobalt-catalyst-based processes either in slurry-phase
bubble-column reactors (eg Sasol) or in multi-tubular fixed bed reactors (eg
Shell) LTFT produces a synthetic fraction of diesel (GTL diesel) that is virtually
free of sulphur and aromatics Typical process operation conditions for LTFT are
Chapter 1 General Introduction
50
temperatures of approximately 220degC to 240degC and pressures of approximately
20 to 25 MPa Conversion in LTFT is typically only about 60 with recycle or
the reactors operating in series to limit catalyst deactivation [62]
The primary focus of most large-scale FT technologies in current market
conditions is to produce high-quality low-emissions GTL diesel jet fuel and
naphtha (for petrochemical feedstock or gasoline blending)
3) Cracking ndash product workup
From [56] FT GTL plants can be configured to produce a wide range of
products from lubricating base oils and waxes through to petrochemical
naphtha and specialty chemicals Most of the already developed and planned
plants target the production of diesel fuels (C14-C20) together with some
kerosenejet fuel (C10-C13) naphtha (C5-C10) lubricants (gtC50) and a little LPG
(C3-C4)- By adjusting operating conditions in the Fischer Tropsch reactor the
mix of products can be altered This enables FT GTL products to be produced in
quantities that enable them to target the high-value product markets of
petroleum products produced by conventional oil refineries
However the yield pattern from a typical FT GTL plant is significantly different
to that rom a catalytic cracking crude oil refinery (Fig 114) Typically the
diesel yield of FT GTL plant is around 70 much higher than for crude oil
refineries which is typically some 40 [64]
From Fig 114 the products derived from upgrading syncrude produced by FT-
GTL differ significantly from those produced by refining barrel of crude oil
Notably FT GTL produces more high-value zero-sulphur products especially
middle distillates On the other hand refining crude oil particularly heavy oil
produces substantial quantities of low-value fuel oil ie more than prevailing
markets can consume Source modified from [65]
Chapter 1 General Introduction
51
Most oil refineries yield some low-value fuel oil the yield depending on the
quality of the fuel processed and the type and capacity of the refineryrsquos fuel-oil
conversion units By contrast the FT GTL plants are configured to yield only
higher-value (relative to crude oil) light and middle distillate products From a
plant with existing technology the yield of middle distillates (gasoildiesel and
kerosene) is nearly a third more of the total product slate than that from a
typical oil refinery [66]
As predicted a decade ago [67] globally diesel demand is growing rapidly at
some 3 a year more quickly than other refinery products Against this
backdrop refiners face significant challenges to meet diesel demand and
quality in the future as crude oil supply becomes heavier and sourer [68]
Fig 115 Refinery Volume Yields versus FT GTL Yields
From [56] for FT-GTL to be commercial at oil prices of less than about
40$barrel plant capital costs operating costs and feed gas costs all have to be
substantially lower on a unit basis than large-scale plants built in recent years
have been able to deliver If the unit capital cost of an FT-GTL plant is close to
100000$barrelday the operating cost of that plant is close to 20$barrel of
Chapter 1 General Introduction
52
product and the feed gas costs in the vicinity of 5$MMBtu the liquid products
would cost in the vicinity of 100$barrel and the economics of such as a plant
do not look so inviting in 2012 market conditions The industry has to achieve
lower plant and feed gas costs to be economically attractive
Fischer- Tropsch Synthesis Opportunities and challenges
GTL technologies offer the potential to reduce global dependency on crude-oil
derived transportation fuels They also offer substantial opportunities for the
owners of stranded gas to diversify the markets into which they deliver their
gas-derived liquid products particularly targeting the large and rapidly growing
global middle distillate markets (See Fig 116)
However the technologies are complex costly and tightly held by a few
companies holding patents for the key process steps which present significant
barriers to entry for building large-scale plants This also renders the building of
large-scale plants challenging for the gas resource holders in terms of capital
costs access to technology and long-term transfer of GTL technologies
At the current time Fischer Tropsch technologies dominate GTL applications for
large scale-plants Technology breakthroughs are required if methane-to-
gasoline or methane-to-olefin plants are to displace traditional refinery and
petrochemical routes to those products On the other hand dimethyl-ether
(DME) has a growing market in Asia particularly in China which is likely to
expand if the one-step process avoiding the production route via methanol is
successfully scaled up as planned and transportation fuel markets are
developed for DME
Chapter 1 General Introduction
53
Fig 116 The GTL Industry Opportunities and Challenges
References
[1] Michael Talmadge Mary Biddy and Abhijit Dutta Syngas Upgrading to Hydrocarbon Fuels Technology Pathway National Renewable Energy Laboratory Technical Report NRELTP-5100-58052 PNNL-22323 March 2013 httpwwwostigovbridge [2] C Pirola C Bianchi A Di Michele P Diodati S Vitali V Ragaini Catal Lett 131 294-304 (2009) [3] M S Hadnadev-Kostic J Tatjana T Vulic R Marinkovic-Neducin A D Nikolic B Jovic Journal of Serbian Chemical Society 76 (12) (2011) 1661ndash1671 [4]E Lira C Loacutepez F Oropeza M Bartolini J Alvarez M Goldwasser F Loacutepez J Lamonier J Peacuterez Journal of Molecular Catalysis A Chemical 281 (2008) 146ndash153 [5] Qinghong Zhang Jincan Kang and Ye Wang ChemCatChem 2 (2010) 1030 ndash 1058 [6] C Perego M Ricci Catalysis Science amp Technology (2012) 2 1776ndash1786 [7] GWHuber SIborra ACorma Chemical Reviews 106 (2006) 4044
Chapter 1 General Introduction
54
[8] PL Spath and DC Dayton Preliminary Screening - Technical and Economic Assessment of Synthesis Gas to Fuels and Chemicals with Emphasis on the Potential for Biomass-Derived Syngas NRELTP-510-34929 December 2003 [9] F Fischer and HTropsch BrennstChem 4 (1923) 276 [10] A Martinez C Lopez F Marquez IJ Diaz Catalysis 220 (2003) 486 [11] John L Casci C Martin Lok Mervyn D Shannon Catalysis Today 145 (2009) 38ndash44 [12] MEDry in Enciclopedia of Catalysis ITHorvarth Ed JWileyampSons New York (2003) 247 [13] Fischer-Tropsch Technology in Studies in Surface Science and Catalysis Elsevier New York (2004) [14] GPVaan Deer Laan AACMBeenackers Catalysis Reviews-SciEng 41(3amp4) (1999) 255 [15] HSchulz Applied Catal A 186 (1999) 3 [16] GP van der Laan AACMBeenackers Applied Catal A 193 (2000) 39 [17] RJOrsquoBrien LXu SBao ARaje BHDavis Applied Catalysis A general 196 (2000) 173 [18] V Roberto Calderone N Raveendran Shiju Daniel Curulla Ferreacute and Gadi Rothenberg Green Chemistry 2011 13 1950ndash1959 [19] E D Smit and B MWeckhuysen Chem Soc Rev 2008 37 2758ndash 2781 [20] Qinghong Z Weiping D Ye W Review Recent advances in understanding the key catalyst factors for Fischer-Tropsch synthesis J Ener Chem 2013 2227ndash38
[21] AY Khodakov WChu P Fongarland Chem Rev 107 (2007) 1692 [22] BHDavis Catal Today 84 (2003) 83 [23] GWHuber SIborra ACorma ChemRev 106 (2006) 4044 [24] J Xu CHBartholomew J Phys Chem B 109 (2005) 2392 [25] HB Zhang GL Schrader JCatal 95 (1985) 325 [26] ES Lox GB Marin E de Graeve P Bussiere Appl Catal A 40 (1988) 197 [27] PSabatier and JDSenderens CRHebdSeance AcadSci 134 514 680 (1902) [28] AMittash AdvCatal 2 (1950) 81 [29] EHoudry WFBurt AEPew WAPeters Pet Refiner 17 (1938) 574 [30] H Pichler AdvCatal 4 (1952) 271 [31] MEDry Chemtech 12 (1982) 744 [32] RBAnderson ACS SympSer 222 (1983) 389 [33] GNatta in ldquoCatalysisrdquo (PH Emmett ed) Vol3 p349 Van Nostrand-Reinhold Priceton New Jersey 1955 [34] GNatta UColombo IPasquon in ldquoCatalysisrdquo (PH Emmet Ed) Vol5 p131 Van Nostrand-Reinhold Princeton New Jersey 1957
Chapter 1 General Introduction
55
[35] RBAnderson Fuel 41 (1962) 295 [36] MJ Baird RRSchehl WPHaynes and JTCobb Ind Eng Chem Prod Res Dev 19 (1980) 175 [37] EIA Annual energy outlook 2013 Available at httpwwweiagovforecastsaeopdf0383(2013)pdf accessed on 16 august 2013 [37a] US Energy Information Administration Available at httpwwweiagovcountriesindexcfmview=reserves accesed on 16 august 2013 [38] MJ Prins KJ Ptasinski FJJG Janssen Fuel Process Technol 86 (2005) 375 [39] Klass DL Biomass for Renewable Energy Fuels and Chemicals Academic Press San Diego CA USA 1998 [40]Beenackers AACM Swaaij WPM Thermochemical Processing of Biomass Butterworth London UK 1984 [41] Demirbas A Energy Educ Sci Technol 17 (2006) 27ndash63 [42] Tijmensen MJA Faaij APC Hamelinck CN van Hardeveld MRM Biomass Bioenergy 23 (2002) 129ndash152 [43]Hamelinck CN Faaij APC den Uil H Boerrigter H Energy 29 (2004) 1743ndash1771 [44] J Hu F Yu Y Lu Catalysts 2 (2012) 303-326 [45] Stassen HEM Knoef HAM Biomass Technology Group University of Twente Enschede The Netherlands 1993 [46] Demirbas A Prog Energy Combust Sci 33 (2007)1ndash18 [47] Demirbas A Energy Sources A 29 (2007) 1507ndash1512 [48] Demirbas A Energy Sources A 30 (2008) 924ndash931 [49] MJPrins KJPtasinski FJJGJanssen Fuel Process Technol 86 (2005) 375 [50] CLIandoli SKjelstrup EnergyampFuels 21 (2007) 2317 [51] JJacometti AEkvall Shell in the Middle East 17 (2002) 1 [52] GCoupe Step on the gas in The Engineer 6 (2004) [53] T Fu Y Jiang J Lv Z Li Fuel Process Technol 110 (2013) 141ndash149 [54] C Brown The Oxford Institute for Energy Studies May 2013 ISBN 978-1-907555-74-9 Available on httpwwwoxfordenergyorgwpcmswp-contentuploads201305WPM-50pdf [55]K MacKenzie Financial Times 30 April 2013 httpftalphavilleftcom201304301473572where-are-all-those-natural-gas-fleet-conversions [56] D Wood C Nwaoha B Towler Journal of natural gas science and engineering 9 (2012) 196-208
Chapter 1 General Introduction
56
[57] Agee K Fundamentals of gas to liquids 2nd ed London Petroleum economist 29 (2005) 30-31 [58] Rahmin II Oil and gas Journal (2005) [59]Rahmin II Gas-to-liquid technologies Recent advances Economics Prospects 26th IAEE Annual International Conference June 2003 Prague Pp 1-36 [60] Minnie R et a 2005 Where it all began In Fundamentals of Gas to Liquids second ed Petroleum Economist London pp 27e29 (Chapter 28) [61] Waddacor M 2005 Converting gas into ultra-clean diesel in three steps In Fundamentals of Gas to Liquids second ed Petroleum Economist London pp 46-49 (Chapter 41) [62] De Klerk A 2012 Gas-to-liquids conversion In Natural Gas Conversion Technologies Workshop of ARPA-E US Department of Energy Houston TX 13 January 2012 [63] Velasco JA Lopez L Velasquez M Boutonnet M Cabrera S Jaras S 2010 Gas to liquids a technology for natural gas industrialization in Bolivia Journal of Natural Gas Science and Engineering 2 (5) 222e228 [64] Pytte T 2005 GTL diesel the way forward In Fundamentals of Gas to Liquids second ed Petroleum Economist London pp 32e35 (Chapter 31) [65] Fleisch TH Sills R Briscoe M Freide JF 2003 GTL-FT in the Emerging Gas Economy Fundamentals of Gas to Liquids Petroleum Economist p 39e41 [66] Corke M 2005 Securing a market In Fundamentals of Gas to Liquids second ed Petroleum Economist London pp 36e38 (Chapter 32) [67] Cherrillo RA Clark RH Virrels IG 2003 Shell Gas to Liquids in the Context of a Future Fuel Strategy e Technical Marketing Aspects 9th Diesel Engine Emissions Reduction Workshop Newport RI 24e28 Aug 2003 [68] Wood DA 2007 Consequences of a heavier and sourer barrel Petroleum Review April ed 30e32
57
Chapter 2 Chemistry of Fischer-Tropsch Synthesis
The FischerndashTropsch (FT) reaction is a heterogeneous catalytic reaction that
converts synthesis gas that is a mixture of carbon monoxide (CO) and
hydrogen (H2) into mainly linear hydrocarbons in the range C1 to C100 It is a
surface polymerization reaction that uses monomers formed by hydrogenation
of adsorbed CO in order to produce hydrocarbons and oxygenated products
with a broad range of chain length and functionality
The chemistry of the process can be described by the set of irreversible and
equilibrium reactions
According to Glasser et al [1] the FischerndashTropsch (FT) reaction mechanism is
still an issue of contention [2 3] Many apparently different mechanisms have
been proposed but common to them all is the concept that a stepwise chain
growth process is involved This is supported by the fact that the carbon
number product distributions calculated on probabilities of chain growth match
the experimentally observed results obtained in different reactor types and
sizes over widely varying process conditions with different catalysts [1]
There are some important aspects related to the FTS that will be discuss in this
chapter to better understand the chemistry of this process
1) FT thermodynamics
2) FT reaction mechanism
3) FT products selectivity
4) FT kinetics
5) Influence of FT process conditions
Chapter 2 Chemistry of Fischer Tropsch Synthesis
58
21 FT Thermodynamics
The Fischer-Tropsch Synthesis is a highly exothermic reaction [4]
n CO + (2n +1) H2 CnH2n+2 + n H2O Hdeg - 40 kcalmol (1)
n CO + 2n H2 CnH2n + n H2O Hdeg - 35 kcalmol (2)
n CO + 2n H2 CnH2n+1 OH + (n-1) H2O Hdeg - 35 kcalmol (3)
Thermodynamically the formation of methane and other hydrocarbons
is energetically favourable that means negative Gibbs energy values for
reaction (1)-(3)
In figure 21 standard Gibbs energy variation for the production of
hydrocarbons and alcohols is reported as a function of temperature
0
80
60
40
20
- 20
- 40
- 60
- 80
- 100
- 120
- 140
500 1000
Temperature K
G
degn
kJ
mol
of
CO
CH3OH
C2H5OH
CH4
C2H6
C2H4
C8H16
C4H8
Figure 21 Standard Gibbs energy of some FTS products [5]
From the diagram reported in figure 21 it can be deduced that methane
formation is highly favoured over that of the alcohols olefins and
hydrocarbons of heavier molecular weight In Fig 21 to keep all of the curves
on the same scale the enthalpy and free energy changes are divided by the
number of carbons atoms in the product Thus the equilibrium constant for
the reaction is given by RTnGnK exp 0
Chapter 2 Chemistry of Fischer Tropsch Synthesis
59
On the basis of thermodynamics a vast variety of molecules can be produced
in synthesis reaction up to 400degC and for some up to 500degC particularly at
elevated pressures including acetaldehyde and higher aldehydes ketones
esters Usually a broad spectrum of types of molecules carbon numbers and
carbon-chains structures is produced and the distribution of molecules
depends on the selectivity of the catalyst employed Generally the reaction
products are not in thermodynamic equilibrium with other product molecules
or reactants
Summarizing it is important to highlight some important aspects of the FT
thermodynamics
It is energetically possible to produce a vast array of hydrocarbons and organic
molecules by the hydrogenation of CO and related process such as the H2 + CO2
and the H2O + 3 CO reactions Most of these reactions are highly exothermic
A variety of reactions of synthesis products are thermodynamically possible
such as dehydration of alcohols hydrogenation of olefins hydrogenolysis of
paraffins and a number of isomerization reactions
On an energetic basis olefins and alcohols can be ldquoincorporatedrdquo into synthesis
reactions to produce higher molecular weight hydrocarbons in any amount
Paraffins element carbon or carbidic carbon can be ldquoincorporatedrdquo into
synthesis reactions to only a limited extent that is part of the carbon of the
hydrocarbon must come from H2 + CO
22 FT Reaction Mechanism
According to [6] FT synthesis follows the polymerization mechanism It is
generally accepted that CO undergoes dissociative or hydrogen-assisted
dissociative chemisorption on the surface of Ru Co or Fe metal or metal
Chapter 2 Chemistry of Fischer Tropsch Synthesis
60
carbide nanoparticles forming CHx (x = 0minus3) intermediates as the monomers
for polymerization The coupling between CHx monomers leads to chain
growth providing CnHm intermediates CnHm intermediates with different
carbon numbers can then undergo hydrogenation or dehydrogenation to
afford paraffins or olefins as the final products An early work pointed out that
the coupling between methylene (CH2) groups mainly accounted for the chain
growth but recent theoretical studies suggested that the situation was more
complicated [7-12] Depending on the identity and the structure of the surface
concerned the monomeric CHx species for polymerization may be different
The calculation of energy barriers suggests that the couplings of (CH+CH)
(C+CH) (C+CH2) or (CHx+HCO) may all be possible [7-12]
Since its discovery many efforts have been made to identify the surface
species that lead to chain initiation and chain growth The FT reaction
mechanism is still an issue of contention
There are some mechanisms like the mechanism proposed by Fischer in 1926
(lsquocarbidersquo theory) but it has a problem he did not explain the production of
relatively large amounts of oxygenated products ie alcohols
According to [13] elementary steps of FTS can be grouped into few basic sets
including
(1) reactant (CO and H2) adsorption
(2) CO activation (or chain initiation)
(3) chain propagation and
(4) chain termination (product formation)
Fig 22 shows possible CO activation steps in the carbide (also referred to as
the alkyl or methylene) and the CO-insertion mechanisms For the classical
carbide mechanism the CO activation step consists of a direct CO dissociation
(ie the C O bond is severed before C is hydrogenated) whereas in the CO-
Chapter 2 Chemistry of Fischer Tropsch Synthesis
61
insertion pathway CO is first hydrogenated and only then is the C O bond
broken to give the chain starter (CH3S) Newer modification of the carbide
mechanism assumes that hydrogen assists in the C O bond scission The
primary difference between the two mechanisms is the type of species being
inserted into the growing chain CHx for the carbide (most often CH2) and
adsorbed CO for the CO-insertion mechanism Storsaeligter et al [14] compared
versions of the two mechanismsndash carbide (including direct and H-assisted CO
dissociation) and CO-insertion ndash using the UBI-QEP (unity bond index ndash
quadratic exponential potential) method [15] and micro-kinetic modeling ofC1
and C2 species formation Their results showed that the chosen CO-insertion
pathway had a lower activation barrier compared to both direct and H-assisted
CO dissociation mechanisms that were utilized Based on these findings they
suggested that the CO-insertion mechanism is likely the main mechanism of
FTS
Fig 22 Examples of CO activation pathways (a) direct CO dissociation (carbide
mechanism) and (b) H-assisted CO dissociation (carbide mechanism) (c) CO hydrogenation (CO-insertion mechanism) [13]
Chapter 2 Chemistry of Fischer Tropsch Synthesis
62
The following Figure (23) [16] shows another representation of the chain
initiation growth and termination deeply find in literature
Chain Initiation
CO C O C O
M M M
+
C
M
H2
CH2
MCH3OH
H2O
INITIATION AND C1 COMPOUNDS
M
+ C
GRAPHITE
OHH
H2
H2
H2CH4
Chain Growth
Chain Termination
Fig 23 Different steps of the reaction mechanism in FTS
Fig 24 shows a simplified scheme for the formation of chain starters and
incorporation into growing chains The CH3 groups formed as a precursor to
methane are assumed to act as chain growth centres Addition of a hydrogen
atom produces methane while insertion of a CH2 group into the metal-carbon
Chapter 2 Chemistry of Fischer Tropsch Synthesis
63
bond of a CH3 group produces an ethyl group and continuation of this type of
reaction gives rise to a spectrum of adsorbed alkyl groups
C CH2CH
H H
CH3H
CH2
R
chain starter
chain growth
(incorporation)
CH3CH3
CH2
H
CH4
R
Fig 24 Simplified kinetic scheme of the successive hydrogenation of surface carbon
yielding chain starters and incorporation into growing chains
The oxygen released by CO dissociation is removed from the catalyst as either
H2O or CO2
As far as hydrogenation process is concerned there is still controversy on the
reaction mechanism first of all it is uncertain if the monomer formation
proceeds via hydrogenation of dissociated or undissociated CO Moreover
methyne methylene and methyl groups are assumed to be in equilibrium by
some authors on the basis of studies with metal clusters containing these as
ligands while others postulate that the hydrogenation of surface carbon and of
CHx species is an irreversible reaction
The nature of primary FT products reflects the nature of the surface bonded
intermediates from which they originate Primary hydrocarbon FT products are
preferentially straight chain terminal olefins and straight chain paraffins The
formation of primary paraffin molecule is represented as
Chapter 2 Chemistry of Fischer Tropsch Synthesis
64
R-CH2-CH2
HR-CH2-CH3
Terminally bonded (alpha) alkyl species on the catalyst surface can be
considered the most common intermediates
Olefin formation is represented as dissociative desorption from the alkyl
species (-elimination)
R-CH2-CH2R-CH=CH2 + H
The ratio probabilities of primary desorption as a paraffin or as an olefin is
commonly 025 That means that the reaction of desorption as a paraffin is
much less probable than the reaction of desorption as an olefin It is suggested
that the chain propagation is favoured against chain termination because of
the principle of lsquoselective inhibitionrsquo ie termination reaction are more
inhibited than propagation reaction by steric hindrance This effect is more
pronounced with paraffin than with olefin formation In fact while paraffin
desorption requiring the reaction between alkyl and H involves two metal
sites olefin desorption need an intermediate ie a transition state with and
bonding at the same metal site
R-CH2-CH2R-CH=CH2
HM M
R-CH=CH2 H
M
+
Chapter 2 Chemistry of Fischer Tropsch Synthesis
65
In both cases however this might not be easily accessible under the condition
of strong competitive chemisorption and strong spatial constraints
Chain termination can also occur by CO insertion into surface alkyls a step that
leads to the formation of predominantly primary alcohols [16]
23 FT Products Selectivity
The products from the FT on Co Fe and Ru show the following characteristics
[17]
1) the carbon-number distributions for hydrocarbons gives the highest
concentration for C1 and decrease monotonically for higher carbons
number although around C3-C4 often a local maximum is observed
2) Monomethyl-substituted hydrocarbons are present in moderate
amounts whereas dimethyl products are present in significantly smaller
amounts than monomethyl None of these branched products contain
quaternary carbons atom on Co Fe and Ru
3) Olefins from iron catalysts exceed 50 of the hydrocarbon products at
low carbon numbers and more than 60 of these -olefins The ethane
selectivity is low in comparison to propene The olefin content decrease
asymptotically to zero with increasing carbon number on Co Ru and Fe
catalysts
4) A change in chain growth parameter in the distribution is only observed
for linear paraffins and not for olefins
5) Yields of alcohols are maximal at C2 and decrease with carbon number
Low yields of methanol are probably the result of thermodynamic
limitations
Chapter 2 Chemistry of Fischer Tropsch Synthesis
66
Investigations of the carbon number spectrum based on the assumption of a
stepwise chain mechanism were carried out in considerable detail by several
authors
Herrington [18] described the distribution of paraffins wax using individual
chain termination probabilities for each chain size and he found that the
probability of chain growth in FT synthesis over a cobalt catalyst did not change
much with the chain length of the hydrocarbon
Anderson investigated the spectrum of a number of different catalysts The
plot of log Wnn against carbon number gave straight line over a fairly large
carbon number range (Wn is the mass fraction and n the carbon number) This
indicated again that the probability of chain growth was fairly constant [18]
Schulz modified and applied to the FT product spectrum the Flory equation
dealing with the product distribution in a polymerization process As pointed
out by Anderson the Schulz-Flory treatment was no different from the earlier
treatment and led to the equation henceforth referred as the Anderson-
Schulz-Flory (ASF) model
Wnn = (1- ) 2
n-1 (1)
where n is the number of carbon atoms in the product Wn is the weight
fraction of product containing n carbon atoms is the chain growth
propagation probability expressed by the equation
= rp (rp + rt) (2)
where rp is the propagation rate constant and rt is the termination rate
constant
The value is independent of carbon number it is estimated by a least-
squares linear regression of the logarithmic form of equation (3) the slope and
intercept both yielding
ln (Wnn) = ln (1-)2 + (n-1) ln (3)
Chapter 2 Chemistry of Fischer Tropsch Synthesis
67
Different factors have an influence on the alpha parameter such as process
conditions type of catalyst and chemical promoters [19 20] The ASF product
distribution as a function of α is depicted in Figure 25
The ASF equation did not distinguish between different product types In
practice a multicomponent product mixture is formed According to the ASF
model the maximum selectivity toward C2minusC4 olefins is achieved with an alpha
value between 04 and 05 One of the most efficient ways of shifting product
selectivity to low alpha values is by increasing reaction temperature However
a decrease on the chain growth probability results in an increase of methane
selectivity as indicated by the ASF product distribution This effect was long
considered a major restriction for the industrial application of the direct
conversion of syngas into lower olefins via the FischerminusTropsch synthesis [21
22] Negative deviations of the ASF model for methane selectivity have been
observed for iron-based catalysts [23 24] Schwab et al [23] proposed that Fe
catalysts possess different catalytic sites some in charge of CminusC coupling for
the growth of the carbon chain and others responsible for methane formation
Fig 25 AndersonminusSchulzminusFlory (ASF) model for the prediction of product distribution
Deviations from ASF Distribution Anderson-Schulz-Flory Distribution is a well-
accepted model for describing product selectivity in FT synthesis especially for
Chapter 2 Chemistry of Fischer Tropsch Synthesis
68
its simplicity nevertheless significant deviations have been noticed and
reported in literature
1) Methane selectivity is in general higher than predicted theoretically by ASF
kinetics Several mechanisms have been postulated to explain these
experimental data [25-26]
2) Anomalies of Ethane and Ethene The maximum C2 selectivity is expected to
be about 30 wt while in practice the maximum found is only about 18 wt It
is commonly observed for iron as well as for cobalt and ruthenium catalysts
that the C2 selectivity is lower than the C1 and C3 selectivity [17]
3) Change in Chain Growth Parameter is defined by ASF model as a
parameter independent of the product carbon number n nevertheless it has
been observed that at a carbon number of about 10 the slope of the
semilogarithmic mole fractions of hydrocarbons against carbon number
increases This phenomenon has been described on iron cobalt and ruthenium
catalysts [27] Suggestions for the increased chain growth parameter or two
probabilities of chain growth are the occurrence of different catalytic sites [28]
or the existence of different chain termination reactions [25] Several attempts
to model hydrocarbon distribution with two different values of have been
reported However the assumption of multiple catalytic sites cannot explain
the decrease of the olefin-to-paraffin ratio with increasing chain length
decreasing space velocity and increasing H2CO ratios in the reactor Kuipers et
al [29] stated that the occurrence of secondary reactions gives the most
reasonable explanation for the deviations from the ASF distribution
24 FT kinetics According to Glasser et al [1] kinetic models of FTS on cobalt iron and
ruthenium catalysts have received considerable attention [30-35] from
Chapter 2 Chemistry of Fischer Tropsch Synthesis
69
researchers in the past but not recently The major problem in describing the
FT reaction kinetics is the apparent complexity of the reaction mechanism and
the large number of species involved When one looks at the kinetic studies in
the literature one finds that there are a variety of rate expressions as well as a
wide range of activation energies for both Co and Fe catalysts This raises
questions about which of these data kinetic parameters and rate expressions
can be relied on for estimating reaction rates andor conducting preliminary
reactor design [36] This strongly suggests that the complex FT reaction
behavior may not be described efficiently by kinetics alone This point is
addressed at a later stage
However the proposed mechanism used a variety of surface species and
different elementary reaction steps resulting in empirical power-law
expressions for the kinetics However also Langmuir-Hinshelwood-Hougen-
Watson (LHHW) and Eley-Rideal type of rate equations have been applied
based on a reaction mechanism for the hydrocarbon-forming reactions In most
cases the rate-determining step was assumed to be the formation of the
monomer These rate expressions for the consumption of synthesis gas mainly
differ in the monomerrsquos nature and in the adsorption of CO H2 and products
(H2O and CO2) on the catalyst surface Ideally the development of kinetic rate
expressions should be based on each possible rate determining process in a
well-defined mechanistic scheme in the hydrocarbon forming reactions Kinetic
studies of the consumption of synthesis gas on cobalt and in particular way
iron catalysts will be discussed in detail in this chapter Kinetic models which
describe the rate of formation of products and the water gas shift reaction will
not be discussed here their studies are reported in [17 37]
1) Overall conversion of synthesis gas
Chapter 2 Chemistry of Fischer Tropsch Synthesis
70
The kinetic rate equations presented for the synthesis-gas consumption do not
present a uniform picture In general the FT synthesis is simplified as a
combination of the FT reaction and the water-gas-shift reaction
CO + (1 + m2n) H2 1n CnHm + H2O (RFT) (4)
CO + H2O CO2 + H2 (RWGS) (5)
where n is the average carbon number and m is the average number of
hydrogen atoms of the hydrocarbon products Water is a primary product of
the FT reaction and CO2 can be produced by the water-gas-shift reaction
(WGS) Iron based catalysts show a high WGS activity unlike Co and Ru based
catalysts That is reflected by the different kinetic expressions
Kinetic equation can be based on the overall synthesis gas consumption (-
RH2+CO = -RCO ndash RH2) which is independent of the WGS equilibrium or based on
CO consumption to hydrocarbon product (RFT = -RCO ndash RWGS) The rate of
synthesis gas consumption only differs from the FT reaction rate by reaction
stoichiometry -RH2+CO = (2 + m2n) RFT The kinetic rate equations presented for
the synthesis gas consumption do not present a uniform picture Table 21 [17]
gives an overview In general catalyst composition as well as reaction
conditions determine the numerical values of the intrinsic rate parameter
Moreover the rate equations are not identical thus k can be decomposed of
different combinations of kinetic and adsorption constant There is
experimental evidence that the FT activity of Fe and Co depends on the
preparation method metal loading of the catalyst and catalyst support
Table 21 Reaction rate equation for overall synthesis gas consumption rate
proposed in Ref [17]
Chapter 2 Chemistry of Fischer Tropsch Synthesis
71
Kinetic
expression
type
Kinetic expression
(a) 2HkP
(b) b
CO
a
H PkP2
(c) OHCO
COH
aPP
PkP
2
2
(d) OHHCO
COH
aPPP
PkP
22
2
2
(e) 2
2
2
2
1 HCO
COH
PaP
PkP
(f) 2
2
COCO
COH
aPP
PkP
(g) 22
2
COOHCO
COH
bPaPP
PkP
(h) 22121
2121
2
2
1 HCO
HCO
bPaP
PkP
(i) 221
21
2
2
1 HCO
HCO
bPaP
PkP
(h) 21
2
CO
HCO
bP
PkP
25 Influence of FT process conditions
A Temperature
Chapter 2 Chemistry of Fischer Tropsch Synthesis
72
The influence of temperature on the selectivity is considerable for all FT
catalysts As the operating temperature is increased the product selectivity
shifts to products with a lower carbon number on iron ruthenium and cobalt
catalysts Increasing the temperature the CO conversion increases but the
WGS reaction increases too mainly with iron based catalysts
B Partial pressure of H2 and CO
Most studies show that the product selectivity shifts to heavier products and to
more oxygenates while increasing total pressure Increasing H2CO ratios in the
reactor results in lighter hydrocarbons and lower olefin content Donnelly and
Satterfield [38] observed a decreased of the olefin to paraffin ratio from 6 to 1
by increasing the H2CO ratio from 03 to 4 Sufficiently high CO pressures
inhibit secondary reactions ie olefin isomerization hydroformilation
hydrogenation and oligomerization
C Space Velocity
The influence of space velocity of the synthesis gas (residence time) on the
selectivity has been investigated The increase of the olefin to paraffin ratio
with increasing space velocity (thus a decrease of the conversion) was
observed The selectivity to methane and olefins decreases with a decrease of
the space velocity whereas the selectivity toward paraffins remains
unchanged These findings can be ascribed by an enhancement of secondary
reactions as the residence time and the concentration of reactive -olefins
increase within bed interstices and catalyst pellets [17]
D Time-on-stream
It is known that catalyst deactivation may occur at reaction conditions and that
may affect the activity and selectivity of a catalytic system An increase of the
Chapter 2 Chemistry of Fischer Tropsch Synthesis
73
methane selectivity and low molecular weight products is observed on iron
catalyst [17] These selectivity changes can be ascribed to carbonaceous
deposits formed on sites with potassium promoters Moreover sintering leads
to a reduction of the surface area hence lowering the catalyst activity High
water pressures enhance agglomeration of initially small crystallites
E Conversion
The influence of CO conversion on the reaction selectivity must be related to
the decrease of CO partial pressure and the increase of water partial pressure
with high levels of conversion Low CO partial pressures (ie high CO
conversion) imply that secondary hydrogenation reaction are less inhibited
hence olefins are hydrogenated to inactive paraffins so that olefin selectivity
decreases Moreover secondary-cracking reactions may occur especially if high
temperature is adopted to increase conversion hence methane selectivity
increases
A schematic view of the general influence of different parameters on the
selectivity is given in Table 22
Table 22 Selectivity control in F-T synthesis by process conditions ( =
increase with increasing parameter = decrease with increasing parameter
= complex relation) From [17]
Parameter Chain Lenght
Chain branching
Olefin Selectivity
Alcohol Selectivity
Carbon deposition
Methane Selectivity
Temperature Pressure H2CO Conversion Space Velocity
Chapter 2 Chemistry of Fischer Tropsch Synthesis
74
References
[1] David Glasser Diane Hildebrandt Xinying Liu Xiaojun Lu and ornelius M Masuku Current Opinion in Chemical Engineering 2012 1296ndash302 [2] Gaube J Klein H-F J Mol Catal A Chem 2008 28360-68 [3] Davis BH Catal Today 2009 14125-33 [4] RBAnderson Academic Press (Harcourt Brace Jovanovich Publishers (1984) Chapter 2 [5] RBAnderson CBLee JCMachiels CanJChemEng 54 (1976) 590 [6] Qinghong Z Weiping D Ye W J Ener Chem 2013 2227ndash38 [7] Ciobıca I M Kramer G J Ge O Neurock M van Santen R A J Catal 2002 212(2) 136 [8] Cheng J Gong X Q Hu P Lok C M Ellis P French S J Catal 2008 254(2) 285 [9] Lo J M H Ziegler T J Phys Chem C 2007 111(35) 13149 [10] Cheng J Hu P Ellis P French S Kelly G Lok C M J Phys Chem C 2008 112(15) 6082 [11] Cao D B Li Y W Wang J G Jiao H J J Mol Catal A 2011 346(1-2) 55 [12] Zhao Y H Sun K J Ma X F Liu J X Sun D P SuH Y Li WX Angew Chem Int Ed 2011 50(23) 5335 [13] B Todic Wenping M G Jacob BH Davis Dragomir B Bukur Catal Today (2013) httpdxdoiorg101016jcattod201308008 [14] S Storsaeligter D Chen A Holmen Surf Sci 600 (2006) 2051ndash2063 [15] E Shustorovich H Sellers Surf Sci Rep 31 (1998) 1ndash119 [16] C Pirola PhD 2007-2008 Novel supported iron based Fischer-Tropsch catalysts Preparation characterization and applications [17] GPVan Der Laan AACM Beenackers CatalRev-SciEng 41 (3amp4) (1999) 255 [18] APSteynberg MEDry (Editors) Fischer Tropsch Technology Studies in surface science and catalysis 152 (2004) p623 [19] Hirsa M Torres Galvis and Krijn P de Jong ACS Catal 2013 3 2130minus2149 [20] Abello S Montane D ChemSusChem 2011 4 1538minus1556 [21] Wang C Xu L Wang Q J Nat Gas Chem 2003 12 10minus16 [22] Janardanarao M Ind Eng Chem Res 1990 29 1735minus1753 [23] Schwab E Weck A Steiner J Bay K Oil Gas Eur Mag 2010 1 44minus47 [24] Torres Galvis HM Bitter JH Khare CB Ruitenbeek M Dugulan AI De Jong KP Science 2012 335 835minus838 [25] Sarup and B W Wojciechowski Can J Chem Eng 66 (1988) 831 [26] C H Bartholomew W Lee Stud Surf Sci Catal 130 (2000) 1151 [27] RBAnderson The Fischer Tropsch Synthesis Academic Press inc (1984)
Chapter 2 Chemistry of Fischer Tropsch Synthesis
75
[28] G A Huff Jr and C N Satterfield Ind Eng Chem Process Des Dev 24 (1985) 407 [29] E W Kuipers I H Vinkenburg and H Oesterbeek J Catal 152 (1995) 137 [30] Dry ME Conversion of Syngas to Fuels and Chemicals Int Conf on Catal amp Catal Proc Cape Town South Africa 199357-66 [31] Dry ME Appl Catal A 1996 138319-344 [32] Maitilis PM Quyoum R Long HC Turner ML Appl Catal A 1999 186363-374 [33] Ribeiro FH von Wittenau AES Bartholemew CH Somorjai GA Catal Rev Sci Eng 1997 3949-76 [34] Huff GA Jr Satterfield CN Ind Eng Chem Process Des Dev 1984 23696-705 [35] Zimmerman WH Bukur DB Can J Chem Eng 1990 68292-301 [36] Bartholomew CH Farrauto RJ New Jersey Wiley 2006 [37] DPinna ETronconi LLietti RZennaro PForzatti La Rivista dei Combustibili 56 fasc2 (2002) 69 [38] TJDonnelly and CNSatterfield ApplCatalA 52 (1989) 93
76
Chapter 3 Catalysts for Fischer Tropsch Synthesis
The core of any FT process is its catalyst Only a few metals show catalytic
activity in the FT synthesis [1] As explained before the reaction is generally
assumed to start with the adsorption of CO on the catalyst surface where it
reacts with adsorbed hydrogen to afford a methylene group which in its turn
is responsible for the CndashC chain growth Probably at least two reaction paths
co-exist for the initial steps of the FT reaction one in which carbon monoxide is
adsorbed in a dissociative way (ie its CndashO bond is cleaved before any possible
reaction with hydrogen) and another in which some hydrogenation by
adsorbed hydrogen atoms precedes the CndashO cleavage [2]
So a good catalyst should adsorb both CO possibly in a dissociative way and
H2 Furthermore since metal oxide formation is always possible under FT
conditions either by dissociative CO absorption or by metal reaction with co-
produced water the metal oxide should be easily reduced under the reaction
conditions With this respect most early transition metals are not good FT
catalysts because despite their favorable CO adsorption they form very stable
oxides that are not reduced under FT conditions Iridium platinum and
palladium adsorb CO in a non-dissociative manner while metals of groups 11
and 12 hardly adsorb it none of them is an effective FT catalyst The specific
activities (ie the reaction rates per unit surface area of metal) of most of the
metals of the former Group VIII (all but osmium) were assessed under
comparable conditions and ruthenium proved to be the most active catalyst
As expected on the basis of the classical work by Sabatier (1902) nickel (and
even to a larger extent palladium) showed very high selectivity towards
Chapter 3 Catalysts for Fischer Tropsch Synthesis
77
methane formation obviously a feature not appreciated in a FT catalyst [2]
Osmium was successively evaluated but turned out to be ca 100 times less
active than ruthenium So the best FT catalysts are based on iron cobalt and
ruthenium with nickel rhodium and osmium (and possibly rhenium) being
moderately active (Fig 31) [3]
Fig 31 Catalytic activity of transition metals in the FT reaction Blue denotes early transition metals able to adsorb CO in a dissociative way they however show poor or no capability to adsorb H2 and their oxides are not reduced under usual FT conditions
accordingly these metals are not active FT catalysts Orange denotes late transition metals and a few main group elements which show poor or no CO adsorption and no FT activity Yellow shaded elements have good H2 adsorption capability and reducible oxides they however adsorb CO in a non-dissociative way and as a matter of fact are poor FT catalysts Brilliant green denotes the best FT catalysts Nickel rhodium
osmium and possibly rhenium (pale green) are moderately active [3]
However FT industrial plants require huge amounts of catalyst and ruthenium
is too rare and expensive to be used on this scale As a matter of fact cobalt
and iron are the only metals of choice for industrial applications Iron is
obviously cheaper than cobalt but to select between them a key issue is the
carbon feedstock Iron is a good water gas shift catalyst and for this reason is
particularly suitable for hydrogen-poor syngas such as those obtained from
coal or biomasses Cobalt performs better with an almost stoichiometric ratio
between hydrogen and carbon monoxide so it is preferred when the carbon
feedstock is natural gas Alternatively cobalt can also be used with hydrogen-
poor syngas provided that the H2CO molar is adjusted by a WGS unit between
the gasification and the FT reactors [1]
Chapter 3 Catalysts for Fischer Tropsch Synthesis
78
Apart from methane (which usually forms in amounts higher than expected)
the FT products distribution follows the AndersonndashSchulzndashFlory model [2] So
the FT output is always a complex mixture of products ranging from methane
to waxes formed by high molecular weight linear paraffins as explained before
A proper choice of catalyst and reaction conditions allows tuning to some
extent the composition of the final mixture but it is impossible to force the
process to produce selectively a well-defined range of products ie middle
distillates So the best strategy to maximize diesel production is to select
conditions which allow obtaining the maximum amount of long chain linear
paraffins that can be then fed to a hydrocracking stage transforming them into
a most valuable fuel
Cobalt and iron are the metals which were proposed by Fischer and Tropsch as
the first catalysts for syngas conversion Both cobalt and iron catalysts have
been used in the industry for hydrocarbon synthesis A brief comparison of
cobalt and iron catalysts [4] is reported in Table 31 Cobalt catalysts are more
expensive but they are more resistant to deactivation Although the activity at
low conversion of two metals is comparable the productivity at higher
conversion is more significant with cobalt catalysts Water generated by FT
synthesis slows the reaction rate on iron to a greater extent than on cobalt
catalysts At relatively low temperatures (200 - 250degC) chain growth
probabilities of about 094 have been reported [5] for cobalt-based catalysts
and about 095 for iron catalysts The water-gas shift reaction is more
significant on iron than on cobalt catalysts [4]
Iron catalysts usually produce more olefins Both iron and cobalt catalysts are
very sensitive to sulphur which could readily contaminate them For iron-
based catalysts the syngas should not contain more than 02 ppm of sulphur
For Co catalysts the amount of sulphur in the feed should be much less than
Chapter 3 Catalysts for Fischer Tropsch Synthesis
79
01 ppm Cobalt catalysts supported on oxide supports are generally more
resistant to attrition than iron co precipitated counterparts they are more
suitable for use in slurry-type reactors Iron catalysts produce hydrocarbons
and oxygenated compounds under different pressures H2CO ratios and
temperatures (up to 340degC) Cobalt catalysts operate at a very narrow range of
temperatures and pressures an increase in temperature leads to a spectacular
increase in methane selectivity Iron catalysts seem to be more appropriate for
conversion of biomass-derived syngas to hydrocarbons than cobalt systems
because they can operate at lower H2CO ratios [4]
Table 31 Comparison of Cobalt and Iron FT catalysts [4]
Parameter Cobalt catalyst Iron Catalyst
Cost More expensive Less expensive
Lifetime
Resistant to deactivation Less resistant to deactivation (coking carbon deposit iron carbide)
Activity at low conversion comparable
Productivity at high conversion
Higher less significant effect of water on the rate of CO conversion
Lower strong negative effect of water on the rate of CO conversion
Maximal chain growth probability
094 095
Water gas shift reaction Not very significant more noticeable at high conversion
Significant
Maximal sulphur content lt 01 ppm lt 02 ppm
Flexibility (temperature and pressure)
Less flexible significant influence of temperature and pressure on hydrocarbon selectivity
Flexible CH4 selectivity is relatively low even at 340degC
H2CO ratio 2 05-25
Attrition resistance Good (always supported) Not very resistant if not
supported
Chapter 3 Catalysts for Fischer Tropsch Synthesis
80
A large number of studies have pointed out that various factors can influence
the catalytic behaviors of a FT catalyst As summarized in Table 32 besides the
engineering factors such as reactor design and operation conditions [6-10]
there exist many catalyst factors which can exert significant influences on the
activity and product selectivity
Table 32 Typical key factors influencing the activity and product selectivity of a FT
catalyst [11]
Engineering factors Catalyst factors
(i) Reactor design
(ii) Operation
conditions
(i) identity of active metal (Ru Co or Fe) (ii) chemical state of active phase (metal oxide or carbide) (iii) support (identity pore structure physicochemical properties) (iv) promoter (typically including noble metals oxides of Mn Zr or rare earth metals alkali metal ions) (v) size of active phase (vi) microenvironment of active phase
31 Iron and Cobalt industrial FT catalysts i) Iron catalysts With iron catalysts two directions of selectivity have been
pursued One direction has aimed at a low molecular weight olefinic
hydrocarbon mixture to be produced in an entrained phase or fluid bed process
(Sasol Synthol process) Due to the relatively high reaction temperature
(340degC) the average molecular weight of the product is so low that no liquid
product phase occurs under reaction conditions The catalyst particles moving
around in the reactor are small (dp =100 mm) [12] and carbon deposition on
the catalyst does not disturb reactor operation Thus low catalyst porosity with
Chapter 3 Catalysts for Fischer Tropsch Synthesis
81
small pore diameters as obtained from fused magnetite (plus promoters) after
reduction with hydrogen is appropriate For maximising the overall gasoline
yield the olefins C3 C4 have been oligomerised at Sasol However recovering
the olefins for use as chemicals in eg polymerisation processes is
advantageous today [13]
The second direction of iron catalyst development has aimed at highest
catalyst activity to be used at low reaction temperature where most of the
hydrocarbon product is in the liquid phase under reaction conditions Typically
such catalysts are obtained through precipitation from nitrate solutions A high
content of a carrier provides mechanical strength and wide pores for easy mass
transfer of the reactants in the liquid product filling the pores The main
product fraction then is a paraffin wax which is refined to marketable wax
materials at Sasol however also can be very selectively hydrocracked to a high
quality Diesel fuel Thus iron catalysts are very flexible Selective FT synthesis of
linear terminal olefins seems only possible with iron catalysts Alkalised iron FT
catalysts exhibit water gas shift activity (in contrast to cobalt catalysts) This is a
favourable feature for FT synthesis with CO-rich syngas as obtained from high
temperature coal- or heavy-oil-gasification through partial oxidation (H2CO
molar ratio =10) however it is undesirable for FT synthesis with hydrogen-rich
syngas as produced from natural gas The activity of iron catalysts decreases
through product inhibition by water [14] This feature restricts the attainable
degree of conversion and leads to gas recycle operation after water removal
together with the organic condensate
ii) Cobalt catalysts Cobalt catalysts have been applied in the first FT plant of
Ruhrchemie in 1935 Present catalyst design makes use of several preparation
techniques however the intention to produce a well-dispersed cobalt phase in
a wide pore support remains the same Today cobalt catalysts for FT Diesel
Chapter 3 Catalysts for Fischer Tropsch Synthesis
82
production from natural gas are designed for a maximum wax selectivity the
waxy product then being the feed for hydrocracking Hydrocracking of FT
paraffins follows the kinetic regime of lsquoideal hydrocrackingrsquo as observed by
Schulz and Weitkamp [15] always the largest molecules are cracked selectively
and no secondary cracking occurs With cobalt catalysts olefin readsorption on
FT sites takes place and this contributes significantly to the desired high wax
selectivity This implies that olefin secondary hydrogenation and double bond
shift should be kept low Diesel fuel selectivity approaching 80 can be
obtained by the process combination FT synthesishydrocracking [15]
32 Chemical State of active phase As explained before the typical active metals used for FT synthesis are Fe Co
and Ru According to [11] the current consensus is that metallic Co and Ru ie
Co0 and Ru0 nanoparticles function as the active phases for CO hydrogenation
to heavier hydrocarbons whereas iron carbides are responsible for CO
hydrogenation [16] However deeper knowledge about the effects of different
chemical states of these active phases on catalytic performances is still needed
for the rational design of an efficient FT catalyst
21 Co-based catalysts
Metallic Co may exist in two different crystalline forms ie fcc and hcp
phases For bulk Co the hcp phase is more stable at lower temperatures but
the fcc phase becomes more stable when the size of Co particles becomes less
than 20 nm [17] However the actual crystalline structure of Co catalyst under
working conditions is not well known The formation of Co2C may cause the
catalyst deactivation Another recent work also demonstrated that the
deactivation of Co-based catalyst was due to the carbide formation and carbon
deposition [18] The prolonging of the time on stream caused the partial
Chapter 3 Catalysts for Fischer Tropsch Synthesis
83
decomposition of the bulk Co2C to Co0 and increased the conversion of CO and
the selectivity to heavier hydrocarbons
22 Fe-based catalysts
Iron carbides are easily formed under FT reaction conditions because of the
lower or similar activation energy for iron carbide formation as compared with
that of CO hydrogenation Many types of iron carbides such as ε-Fe2C ε_ -
Fe22C Fe7C3 χ-Fe5C2 and θ-Fe3C all have been observed in FT synthesis [19-
20] However the true active species under working conditions remains still
unsettled Many studies have been devoted to characterizing the active iron
carbide phase Because the carburized iron catalysts are very sensitive to air
exposures even under controlled passivation [21] the in situ or operando
characterizations under working conditions are quite important
33 Size of active phase According to [11] the size of the active phase is one of the most important
factors determining the catalytic behaviors of a heterogeneous catalyst [23]
For Co-based catalysts Iglesia once analyzed data obtained over different
metal oxide-supported Co catalysts and the results suggested that the
turnover frequency (TOF) for CO conversion ie the amount of CO converted
per surface Co per time was independent of the size of Co particles loaded on
different metal oxides in a Co-size range of 9minus200 nm [24] The selectivity to
CH4 was higher over the catalysts with smaller Co particles and decreased with
increasing Co size particularly in the range of 26minus8 nm C5+ selectivity
increased with the mean size of Co nanoparticles monotonically and the
increase became insignificant when Co size exceeded 6minus8 nm Thus Co-
catalyzed FT synthesis is a structure sensitive reaction in the Co-size range of
lt10 nm Size effect studies for Ru- and Fe-based catalysts are not numerous A
Chapter 3 Catalysts for Fischer Tropsch Synthesis
84
few early studies pointed out the increase in TOF for CO hydrogenation with
increasing the size of Ru or Fe particles (or decreasing the metal dispersion)
[25-27]
In general the results obtained for many Co- and Ru-based catalysts all indicate
that the TOF for CO conversion increases with the size of metal nanoparticles
up to a critical point (6minus10 nm) and then changes slightly For Fe-based
catalysts the results are still inconsistent
References
[1] C Perego MRicci Catalysis Science amp Technology 2012 2 1776ndash1786 [2] P M Maitlis V Zanotti Chem Commun 2009 1619ndash1634 [3] C Perego R Bortolo and R Zennaro Catal Today 2009 142 9ndash16 [4] AY Khodakov W Chu P Fongarland ChemRev 107 (2007) 1692 [5] B Jager Stud Surf Sci Catal 119 (1998) 25 [6] Luque R de la Osa A R Campelo J M Romero A A Valverde J L Sanchez P Energy Environ Sci 2012 5(1) 5186 [7] Hao X Dong G Q Yang Y Xu Y Y Li YW Chem Eng Technol 2007 30(9) 1157 [8] van Steen E Claeys M Chem Eng Technol 2008 31(5) 655 [9] Davis B H Ind Eng Chem Res 2007 46(26) 8938 [10] Gao J H Wu B S Zhou L P Yang Y Hao X Xu Y Y Li Y W Chin J Catal (Cuihua Xuebao) 2011 32(12) 1790 [11] Qinghong Z Weiping D Ye W Review J Ener Chem 2013 2227ndash38 [12] OGMalan JDLouw LCFerreira Brennstoff-Chem 42 (1961) 209 [13] AP Steynberg RL Espinoza B Jager AC Vosloo ApplCatalA 186 (1999) 41 [14] ME Dry JR Anderson M Boudart (Eds) Catalysis Science and Technology M Springer Berlin (1981) 159 [15] HSchulz Appl Catal A 186 (1999) 3 [16] Zhang Q H Kang J C Wang Y ChemCatChem 2010 2(9)1030 [17] Kitakami O Sato H Shimada Y Sato F Tanaka M Phys Rev B 1997 56(21) 13849 [18] Tan K F Xu J Chang J Borgna A Saeys M J Catal 2010 274(2) 121 [19] De Smit E Weckhuysen B M Chem Soc Rev 2008 37(12) 2758
Chapter 3 Catalysts for Fischer Tropsch Synthesis
85
[20] Zhang Q H Kang J C Wang Y ChemCatChem 2010 2(9) 1030 [21] Janbroers S Louwen J N Zandbergen H W Kooyman P J J Catal 2009 268(2) 235 [22] PJ Van Berge J Van de Loosdrecht JCaricato EA Barradas Patent WO 9942214 [23] Zhang Q H Deng W P Wang Y Chem Commun 2011 47(33) 9275 [24] Iglesia E Appl Catal A 1997 161(1-2) 59 [25] Kellner C S Bell A T J Catal 1982 75(2) 251 [26] Jones V K Neubauer L R Bartholomew C H J Phys Chem 1986 90(20) 4832 [27] Boudart M McDonald M A J Phys Chem 1984 88(11) 2185
86
Chapter 4 Experimental FT plant and analytical methods
Two different FTS units were used in this PhDrsquos research work in order to
homologate some results The first one is located at the Universitagrave degli Studi
di Milano in Italy while the second one is located at the Universidad Central de
Venezuela in Venezuela Following there is the description of both FTS unit
First FTS Unit (Unit 1) Universitagrave degli Studi di Milano in Italy
FT reaction tests were performed into a fixed bed reactor (di =06 cm l = 56
cm) using 1 g of fresh catalyst mixed with 1 g of diluting material (-Al2O3
Fluka) This diluting material must be inert for FT and a good thermal conductor
to control the process temperature [1] The catalysts were tested after their
activation in a 468 NmL min-1 flow of syngas with H2CO ratios of 21 (total
flow = 468 Nml min-1) and nitrogen as internal analytical standard (flow = 50
NmL min-1) at P = 20 bar and temperature range between 220-260degC for a
duration between 20 and 90 h in continuous Analyses of the gas-phase
products (C1-C7) were performed with an on-line micro-gaschromatograph
(Agilent) measurements were carried out every 60 min during the reaction
Liquid products were collected in a trap (V=400mL) operating at 5degC and at the
same pressure of the reactor (20 bar) and analyzed by a gas chromatograph
(Agilent) equipped with a Porapack-Q columns (able to separate C7-C30
hydrocarbon fraction) after the reaction duration The aqueous phases
collected in the cold trap were analyzed by a TOC (Schimadzu) for the
quantification of carbonaceous species dissolved in water Using all the data
87
collected for each run a mass molar balance has been verified with a
maximum error of plusmn 5moles
Second FTS Unit (Unit 2) Universidad Central de Venezuela in Caracas-
Venezuela)
FTS was performed in a continuous flow system with a fixed bed stainless-steel
reactor (di =095 cm l = 30 cm) The reactor was loaded with 03 g of fresh
catalyst mixed with 03 g of see sand as a diluting material [2] The calcined
catalysts were initially reduced in situ by flowing hydrogen for 4 hours at 900
Nml˙min-1 350degC and 08 MPa After the reduction step the temperature was
lowered to 220degC under H2 They were then tested in the standard conditions
by flowing syngas (H2 CO N2 63325 vv N2 as internal standard) at 156
Nml˙min-1 increasing the system pressure slowly up to 20 MPa and 220-260degC
Once the reaction temperature was achieved the reaction was led to proceed
during a period of 280 h
During reaction the reactor effluent passed through a hot trap kept at 150degC
and 02 MPa to collect waxes and the products leaving this trap were passed
through a second trap kept at 0degC and 02MPa to collect the lighter products
(water alcohols and hydrocarbons) The analyses were performed in various
chromatographs according to the nature of the sample to be analyzed
Permanent gases and light hydrocarbons were analyzed on-line in a
PerkinElmer 3000GC Autosystem fitted with TCD detectors using a Carbosieve
SII Supelco column The liquid products (collected at 150ordmC and 0ordmC) were
weighted and analyzed in a PerkinElmer chromatograph fitted with a 50m long
Alumina RT capillary column connected to a FID
A mass molar balance was performed for each FT run resulting in a maximum
error of plusmn 5moles
88
41 FT Laboratory plant a) First FTS unit (Unit 1)
As explained by Pirola [3-5] the experimental tests were performed in a
laboratory plant with a tubular reactor (made by ldquoRenato Brignolerdquo Company)
with a fixed bed of catalyst vertically placed The feed (CO H2 and N2 as
internal standard) is prepared in situ mixing three different flow of pure CO
pure H2 and pure N2 using three different flow meters Then the feed goes into
the catalytic reactor from the top part reacts with the catalyst and then the
reacted flow comes out from the lower part The plant pipes are heated till the
cold trap to avoid the heavy products condensation In this cold trap cooled at
5degC the heavy products and the water condense The not reacted gas and the
light hydrocarbons go in a flow meter for their quantification and finally in an
analytical zone where they are analyzed by a micro gaschromatograph In the
condensed liquid in the cold trap there are two phases the first one is an
aqueous phase (in which water and small quantities of light hydrocarbons and
oxygenated compounds are present) and the second one is an organic phase
(in which hydrocarbons in the range C7-C30 are present)
In Fig 41 the detailed flow-sheet of FT plant has been reported
Fig 41 Laboratory plant flow-sheet
89
The key for the Fig41 is the following
1 valve
2 flow meter (Brooks reg mod 5850TR) for H2 and CO operating in the range 0-
100 Nml min-1 for N2 operating in the range 0-20 Nml min-1
3 gas mixer
4 thermocouples for the control of temperature in the catalytic bed in the
reactor and in the heated pipe
5 Tubular reactor
6 Security valve
7 Pressure indicator
8 Pressure control and regulation tool
9 micro GC ldquoAgilent reg 3000 seriesrdquo
10 gas totalizer for the control of the total flow of gas
11 Cold trap operating at 5degC and 20 bar
12 Cooling air for the temperature control of the reactor
13 vent (usually closed)
In figure 42 a photo of the plant is reported
Fig 42 FT laboratory plant
90
In the following paragraphs the main parts of this plant will be described
41a Main parts of the plant 41a1 Apparatus for the regulation and control of temperature pressure and flow of reagents
In the plant the pressure is controlled and regulated by an electronic controller
(Brooksreg) that interacts with a pressure valve able to work till 25 bars (Fig 43)
located after the reactor and the cold trap
Fig 43 Pressure valve
This system can control the plant pressure with a care of 01 bar respect the set
up
The reactor temperature is regulated by a heating oven (Renato Brignole) and
the pipe lines after the reactor are heated at 220degC to prevent the heavy
products condensation by two electrical cables (both with a resistance of 7
m) controlled by a Ascon reg apparatus The CO H2 and N2 flows are regulated
by Brooksreg 5850TR series flow meters (Fig 44)
91
44 Flowmeters for CO H2 N2
In table 41 the main characteristics of these flow meters are reported
Table 41 Flowmeters characteristics
Range
(Nmlmin) IO signal
(vdc) Max Pressure
(Bar)
H2 0-50 0-5 100
CO 0-50 0-5 100
N2 0-20 0-5 100
41a2 FT reactor
The FT plant reactor (Fig 45) has been made by Renato Brignole reg Company
(Legnano Italy) It is a fixed bed tubular reactor with the catalyst vertically
located It is made of AISI 316 stainless steel and in the internal surface of
reactor there is a coaxial copper tube (thickness = 1 mm) to prevent some
catalytic activities of steel and to uniform the heating of reactor The technical
characteristics of reactor are summarized in Table 42
Table 42 Reactor Characteristics
Volume (cm3)
Max operating pressure
(Bar)
Max operating temperature
(degC)
Internal diameter
(mm)
Height (mm)
158 100 400 6 560
92
In this reactor it is possible to charge till 3 g of the mixture catalyst-diluting
material The feed goes into the reactor at the top and goes out from the lower
part The operation of opening and closing of reactor is made using the disks
illustrated in Fig 46 and this is an operation that needs a particular attention
to avoid gases losses or mechanical damage
Fig 45 FT tubular reactor Fig 46 Reactor opening disks
The temperature inside the reactor is monitored by two thermocouples the
first one is vertical and it is inside the catalyst the second one is horizontal and
it is inside the reactor The values of temperatures recorded are quite the same
(max difference = 2degC)
41a3 Cold Trap
The condensation of heavy FT products (mainly hydrocarbons higher than C7
and water) is made using a cold trap in stainless steel able to work at 20 bar
and a T=5degC (Fig 47) The low temperature is maintained by an external
circulation of water coming from a ldquoCrioterm reg 190 iscordquo thermocriostat The
93
volume height and width of the cold trap are respectively 125 ml 100 mm
and 40 mm
Fig 47 Cold trap
The cold trap at the end of each kinetic run is opened and the liquid
condensed inside is quantified and analyzed There are two phases the first
one is an organic phase made by hydrocarbons in the range C7-C30 and it is
analyzed by a GC the second one is an aqueous phases with some organic
mainly oxygenated compounds and the quantification of all the present
carbon is made by a TOC analysis The results obtained in this way give an
average value of all the time of kinetics It is not possible to open the cold trap
during the experiment In fact opening the cold trap the pressure and flow
equilibrium of the plant is broken
41a4 Flow totalizers
The calculation of CO conversion and products selectivity of the plant needs to
know exactly the quantity of gas incoming and out coming Moreover adding
those data to the quantity of liquid condensed in the cold trap and to analytical
data it is possible to verify the mass balance on the plant The calculation of the
mass balance is very important to verify the goodness of the experimental data
collected
94
In FT plant it is possible to quantify all flow passed in a fixed time The incoming
flow of H2 N2 and CO is totalized by the same flow meters that regulate the
flow (Brooks reg Instruments) and the out coming flow (mixture of not reacted
CO and H2 N2 and non-condensed FT products) is totalized by a Ritter reg mod
TG01-5 (Fig 48) instrument
Fig 48 Ritter reg totalizer
42a Analytical instruments
FT plant needs three different analysis for the quantification of the composition
of
i) out coming gas (mixture of not reacted CO and H2 N2 and non-
condensed FT products) by a micro-GC Agilent reg mod 3000A
ii) organic phase of condensed liquid in cold trap (hydrocarbons in the
range C7-C30) by a GC ldquoFison Carlo Erba reg Mod 8000 seriesrdquo and
iii) liquid phase of condensed liquid in the cold trap (water with
hydrocarbon mainly oxygenated dissolved inside) by a Total
Organic Carbon ldquoShimadzu reg mod 5000Ardquo
42a1 micro Gas Chromatograph ldquoAgilent reg mod 3000Ardquo
In the micro GC Agilent reg there are two different columns the first one is a
molsieves module by which it is possible to separate in order of retention
time He H2 Ne Ar O2 N2 CH4 and CO the second one is a OV-1 module
(filled with polydymethylsiloxilane) by which it is possible to separate CO2 and
95
all the hydrocarbons in the range C2-C7 In this instrument the gas sample is
splitted in the two modules and then analyzed in the same time For each
sample then we obtain two different analyses In our application using the first
module the CO N2 and CH4 were quantified with a column temperature of
45degC using the second module CO2 and hydrocarbons were quantified with a
column temperature of 100degC Each module is equipped with a TCD detector
The sensibility limit of the analyses is about 50 ppm for each compound and
the carrier gas is helium The instrument scheme is reported in Fig 59 and the
instrument is represented in Fig 410 An example of analyses is reported in
Fig 411
Fig 49 Agilent Micro GC scheme
Fig 410 Micro GC Agilent
96
Fig 411 Example of Agilent micro GC analyses on FT out coming gas
42a2 Gas Chromatograph ldquoFision Carlo Erba reg Mod 8000 seriesrdquo
In this traditional Gas Chromatograph (GC) equipped with a wide bore Varian
(model VF-1ms) (dymethylpolyxolane) column (length = 25 m diameter = 025
mm) it is possible to separate and quantify the hydrocarbons in the range C7-
C30 The GC detector is a FID with a sensibility limit of about 100 ppm for each
compound and the carrier is helium The column temperature is maintained at
60degC for 3 minutes then heated till 260degC at 7degCmin for 15 minutes after that
heated at 280degC for 40 minutes at 5degCmin and then heated till 310degC for 5
minutes In Fig 412 and 413 the gas chromatograph in its column
97
Fig 412 Example of GC analysis for the quantification of heavy FT products
Fig 413 Wide bore Varian VF-1ms column
42a3 Total Organic Carbon ldquoShimadzu reg mod 5000Ardquo
Using this instrument it is possible to quantify the organic carbon dissolved in
water The sample passes through an oxidation catalyst (Pt) at high
temperature (700degC) and then all the organic carbon is converted to CO2 This
CO2 is then exactly quantified by an IR detector In Fig 414 it can be seen the
instrument
Fig 414 SHIMADZU TOC-5000A
98
43a Analytical instruments calibration
43a1 Flow meters calibration
All flow meters have been calibrated comparing the flow measured by these
instruments and that measured using a ldquosoap-bubblerdquo flow meter at the end of
the plant This calibration has been made using the FT plant both in FT work
condition (T=250degC P=20 bar) and at room condition (T=20degC P=1 bar) For
each flow meter some tests at different flow have been made always in the
range between 0 and 40 Nmlmin For each flow meter a diagram has been
made where the real flow (y) is reported in function of the set-up flow (x) The
result for all the instruments is a straight line (y = ax + b) In Tab 43 the results
for all the instruments have been reported in term of ldquoardquo and ldquobrdquo coefficient
and ldquoR2rdquo value
Tab 43 Flow meters calibrations
Flow meter Calibration conditions a b R2 1 CO T = 20degC P = 1 bar 11364 12727 09996
2 H2 T = 20degC P = 1 bar 1008 -1749 0999
3 N2 T = 20degC P = 1 bar 12744 67994 09935
4 Mix CO H2 N2 T = 20degC P = 1 bar 0968 1816 09998
The conclusion is that the instruments give a very good calibration and their
indications of the flow are quite perfect
43a2 micro GC calibration
This calibration has been made in Cernusco sul Naviglio (MI) in the laboratory
of ldquoSRA Instruments Italiardquo Company This company is an Agilent Technologies
Premier Solution Partner directly present in Italy and France and it is
constantly engaged in research and development of solutions based on
portable and ultra-fast Micro Gas chromatograph (wwwsrainstrumentscom)
99
The calibration has been made analyzing two mixture of certified gas and is
reported by [5]
The calibration of CO2 and light hydrocarbon is a direct calibration As the
volume of gas injected in column is always the same it is possible to calibrate
directly (without an internal standard) the peaks area with the concentration of
different compounds ie the concentration is directly proportional to
chromatographic area In ldquoSRA Instruments Italiardquo all calibration factors fci
(chromatographic area compound concentration) and all retention times
have been found and they are reported in table 44
Table 44 Calibration results for CO2 and light hydrocarbons
Module Compound Retention time
(min) Calibration factor
Molsieves
N2 1007 35119
CH4 1203 27027
CO 1402 45799
OV-1
CO2 0592 16722
Ethane 0624 19230
Propane 0745 25706
I-butane 0918 28248
N-butane 1061 27027
I-pentane 1556 32051
N-pentane 1808 32326
N-hexane 3578 33670
CO quantification has been performed using another calibration
Using these data it is possible to calculate the concentration of each compound
using the formula
iiiv fcareacompound (1)
Nevertheless it is important to remember that in FT plant there is N2 as
internal standard for CO quantification and then the equation (1) must be
corrected because the N2 flow is not to be considered as FT gas
100
FT
totaliiiv
flow
flowfcareacompound (2)
Where
2NtotalFT flowflowflow (3)
To better understand this calculation an example is here reported
If we assume to have a real FT flow of 20 Nmlmin with a CO2 v = 2 it
means to have 04 Nmlmin CO2
If we have 10 Nml minmin of N2 as standard and 30 Nmlmin of FT flow and
we calculate the CO2 percentage using the total flow we obtain
233110030
40vCO making a mistake If we use the correction in the
equation (2) we obtain 20220
30100
30
40vCO
the true value
The CO calibration concerns only the CO and N2 flow The CO is the compound
to be quantified and the N2 is the standard gas in fact N2 is not involved in FT
reactions and it pass through the FT plant without any modification then the
incoming and out coming N2 is the same The necessity with CO to have a
calibration with a standard is explained considering that the CO quantification
gives the CO conversion of FT process then a more accurate measure is
convenient Moreover it is not possible to use N2 as internal standard also for
CO2 and light hydrocarbons because they are not analyzed in the same module
(OV-1) of N2 (molsieves) Another important consideration is that in literature
the CO conversion for FT reactor is always calculated using this method
In this calibration method the ratio (flow CO flow N2) is directly proportional
to ratio (area CO area N2) Using FT plant in reaction conditions (T=250degC
P=20 bar CO = 156 Nmlmin H2 = 312 Nmlmin N2 = 100 Nmlmin) obviously
101
without catalyst inside we have calculated these ratios and the co-relation
between them The results are reported in Table 45
Table 45 CO-N2 calibration results
Flow N2
(Nmlmin) Flow CO
(Nmlmin) Flow H2
(Nmlmin) Area
N2 Area CO
R flow CON2
R area CON2
Rarea Rflow
100 156 312 411142 782455 156 19031 12199
100 156 312 390220 793329 156 20330 13032
100 156 312 388002 794913 156 20487 13133
100 156 312 384672 795362 156 20676 13254
The mean value of ratio between area and flow ratios is 12905 and this is the
calibration factor (fc) for the system as reported in the equation (4)
flowN
COflowf
areaN
COareac
22
(4)
then the CO flow out coming from the FT plant is
29051
2
2
flowN
areaN
COareaflowCOout (5)
finally the CO conversion is
100xflowCO
flowCOflowCOonCOconversi
in
outin (6)
The H2 calibration
To optimize the kinetic model of the FT synthesis was necessary to develop a
measurement method to quantify the hydrogen leaving the plant For this it
was performed a calibration of the micro-gas chromatograph using N2 as
standard in different streams of H2
To identify and quantify the hydrogen it is necessary to change the carrier in
the micro-gas chromatograph (from He to Ar)
Using Argon as a carrier the response of the micro-GC is about ten times
smaller than the response compared with He For this reason it has been
102
necessary to modify the injection time for the analysis and set to 40ms instead
of the usual 30ms
In Table 46 and Fig 415 are shown the results relating to the calibration of the
system H2-N2
Table 46 H2-N2 calibration results
Flow N2 (Nmlmin)
Flow H2 (Nmlmin)
F H2 F N2 Area N2 Area H2 A H2 A
N2
20 3 015 31511 33480 1062
20 35 0175 29525 36348 1231
20 41 0205 28420 40995 1442
20 49 0245 26747 45908 1716
20 56 028 20897 41151 1969
20 61 0305 20748 44040 2123
Fig 415 Calibration results for the micro-GC for the system H2 ndashN2
From the equation of the straight line is obtained a correction factor equal to
70018
By this correction factor (Fc) is possible to deduce the flow of the H2 outflowing
from the reactor and its conversion during the reaction using the following
equation
103
1002
222
in
outin
FlowH
FlowHFlowHHconversion
The calculation set to detect the flow of H2 in output is based on the fact that
the ratio between the areas H2N2 is equal to the ratio between the respective
flows multiplied by Fc (correction factor) according to the following equation
2
2
2
2
FlowN
FlowHFc
AreaN
AreaH
So from this equation it is possible to determine the flow of H2 at the out of the
reactor
00187
2
2
22
FlowN
AreaN
AreaHHFlow OUT
In Fig 416 is shown an example of a gas chromatographic analysis of hydrogen
Fig 416 Gas chromatographic analysis of a system H2-N2
43a3 GC calibration
In this instrument as before discussed it is possible to analyze the heavy
hydrocarbons condensed in the cold trap Obviously for their quantification we
need a calibration with some standard compounds because the detector
quantification is not the same for all the species For this reason the equation
j
j
i
i
mol
area
mol
area (7)
it is not correct and we must use
104
j
j
j
i
i
i Fmol
areaF
mol
area
(8)
where Fi and Fj are the calibration factor for the compound i and j respectively
The calibration method used is the ldquointernal standard methodrdquo in which one of
the compounds to be analyzed is chosen as internal standard and his
calibration factor (F) is established equal to 1 N-heptane has been chosen as
internal standard because it is normally present in FT products Analyzing a
calibration hydrocarbon mixture it is possible to calculate the calibration factor
of all the hydrocarbon present inside this mixture using the following
equation
i
i
j
j
jiarea
mol
mol
areaFF
(9)
The composition of the calibration mixture is reported in table 47 and the
calibration results in table 48
In FT runs all hydrocarbons in the range C1-C19 were obtained To find the
calibration factor and the retention times of hydrocarbons not present in the
calibration mixture an interpolation calculation was made In the following
figure are reported the diagram of the calibrations factors (Fig 417) and of the
retention times (Fig 418) in function of carbon number Starting from these
experimental results an interpolation curve were calculated and then the
calibrations factors and retention times for each carbon number was calculated
too The results are reported in Table 49 It is important to outline that for
each single carbon number there is only one calibration factor for all the
isomers as they are not well separated by the GC column and the detector
answer for the isomers is the same
105
Table 47 Composition of GC calibration mixture
Hydrocarbon PM (gmol) Quantity (g) Mol
n-Heptane (C7) 1002 0229 02295
Nonane (C9) 12826 02389 01871
Decane (C10) 14228 01284 00906
Undecane (C11) 15631 01197 00769
Dodecane (C12) 17033 01139 00672
Tridecane (C13) 18436 01202 00655
Tetradecane (C14) 1984 01577 00798
Pentadecane (C15) 21241 01123 00531
Hexadecane(C16) 22644 01817 00806
Octadecane (C18)
2545 00919 00363
Nonadecane (C19) 26852 00895 00335
106
Table 48 GC calibration results
Mix Mol
Chromatographic areas
Fc mean Analysis
1
Analysis
2
Analysis
3
Analysis
4
Analysis
5
C7 0229522 7763 9384 881 9036 8981 100
C9 018706 16343 16475 15226 13896 15051 047
C10 0090631 8463 88707 7902 7588 7856 043
C11 0076907 8716 7627 8235 7916 8239 036
C12 0067157 8485 7313 8137 7709 8168 032
C13 0065478 847 7654 8253 7859 8271 031
C14 0079826 11095 9689 10988 9685 11042 029
C15 0053096 8309 819 8876 8844 8535 024
C16 0080586 12395 11571 12863 12834 13014 025
C18 0036265 6059 6061 6679 6817 659 022
C19 0033474 6134 5958 6527 6663 6549 020
Fig 417 GC calibration factor vs carbon number
107
Fig 418 GC retention time vs carbon number
Table 49 GC Calibration factor and retention times for all the hydrocarbons C7 ndash C30
Carbon number Fi Retention time (min)
7 0997 0975
8 0649 3431
9 0497 5887
10 0412 8343
11 0358 10799
12 0320 13255
13 0293 15711
14 0272 18167
15 0255 20623
16 0241 23079
17 0230 25535
18 0220 27991
19 0212 30447
20 0205 32903
21 0199 35359
22 0194 37815
23 0189 40271
24 0185 42727
25 0181 45183
26 0178 47639
27 0175 50095
28 0172 52551
29 0170 55007
30 0167 57463
108
43a4 TOC calibration
The detector of the instrument (type NDIR) is able to analyze and quantify by
means of infrared spectroscopic technique the CO2 produced by the sample
For this calibration is not necessary to use a standard equal to the analyte (in
the case of the synthesis of FT the carbonaceous species dissolved in water)
but it is necessary to use a stable standard such as potassium hydrogen
phthalate because due to its physical nature (solid) is therefore inherently
more reliable than a liquid and allows the exact correlation between the ppm
of carbon present in solutions of standards and the areas provided by the
instrument after analysis
There were prepared different solutions at known concentrations (200 and 100
ppm) from a stock solution of 300 ppm obtained by dissolving 031895 g in
100ml of distilled water
Standard solutions were corrected by a correction factor f according to the
following equation
masssampleltheoretica
masssamplerealf (10)
The calculated value of f is equal to 1000627 and the table 410 and the Fig
419 show the correct ppm standard and the areas supplied by the instrument
Table 410 calibrationTOC
Corrected
ppm
Area
3002 28679
2001 17261
1001 6568
109
Fig 419 Interpolation of areas obtained in function of the concentration (ppm) of the
standard
44a Experimental procedure
All the kinetic FT runs were made on the plant following the same experimental
procedure
1) Catalyst preparation
2) Catalyst loading on the plant in the FT reactor
3) Catalyst activation
4) FT run
5) When FT finish opening of cold trap and separation of organic from
aqueous phases
6) Catalyst removal from reactor
7) Reactor cleaning and micro-GC column regeneration
44a1 Catalyst preparation
Before the catalyst was loaded in the reactor a standard procedure was
followed on the same catalyst
- Catalyst mesh operation between 106 and 150 micron
- Heating in oven at 120degC for a night
- Mixture catalyst - Al2O3 (inert material ndash diluent) 11
110
In table 411 the main characteristics of -Al2O3 are reported The role of this
material is to help the heating removal from the catalyst (FT reaction is highly
exothermic)
Table 411 Main characteristics of -Al2O3
Superficial area (m2g)
Bulk density (gcm3)
Composition Humidity
07-13 172
996 Al2O3 lt005 SiO2
01 FeO lt001 TiO2
26
44a2 Catalyst loading
The catalyst loading is obviously an essential operation The catalyst must be
charged in the middle of reactor because this is the isothermal zone as it is
possible to observe in Figure 420
Fig 420 Thermic profile of FT reactor
As the height of the mixture catalyst + -Al2O3 is about 7 cm (using a pipe with
an internal diameter of 6 mm) if this material is charged in the middle of the
reactor this work surely at the same temperature in each point The final
arrangement of the reactor is reported in Fig 421
111
Fig 421 FT reactor internal loading arrangement
Finally after the closing the pressure inside the reactor is raised till 4 bar with
the activation gases The gas flow is stopped and then the held of reactor is
checked to control possible gas losses If the reactor pressure is stable the
activation catalyst step will be performed The same procedure for the check of
possible gas loss will be performed when the pressure of the reactor will be
raised till 20 bar for FTS
44a3 Catalyst activation
The catalyst activation is the process in which the catalyst is reduced from the
oxidised state in the reduced or metallic state In the FT reaction the active
form for the Cobalt based catalysts is the Cobalt metallic and for the iron based
catalysts are the carbide iron forms All the catalysts were charged into the
reactor in the oxidised form because the last operation in the catalysts
preparation is the calcination (T=500degC) in air The catalyst activation-reduction
is performed in this PhDrsquos research work at 350degC and using H2 for Co based
112
catalysts and CO+H2 for iron based catalysts always for 4 h at 3 bar of pressure
At the end of this step the FT process start
44a4 Fischer Tropsch runs
After the catalyst activation the plant is raised at standard reactions conditions
Temperature = 220-260degC (depending of the test)
Pressure = 20 bar
Feed ratio H2CO = 21 11 1751 151 (depending on the test were
varied the feed ratio too)
H2 flow = 312 Nmlmin
CO flow = 156 Nmlmin
N2 flow = 50 Nmlmin
These are the ldquostandardrdquo reaction conditions but for some specific studies
they have been changed When the plant reaches the set-up values this is the
ldquozero-timerdquo of the FT runs The first operation is to annul the totalizers both in
the entrance and in the exit of the plant Then every one hour the micro-GC
make one analysis on the out coming flow (also during the night) and the
operator takes the flow out coming from the plant Each data is reported and
elaborate using an excel database The FT run has duration between 48 and 90
hours At the end of run the cold trap is opened (Fig 422) and both the organic
phase (GC) and the aqueous phase (TOC) are separated and then weighed and
analyzed Also these data is collected in the excel database and now it is
possible to calculate the CO conversion the products selectivity the alpha
parameter and to verify the final mass balance
113
Fig 422 Opening cold trap operation
After the reactor cooling the catalyst is unloaded and recovered for possible
characterization after its use The reactor and the cold trap are obviously
cleaned carefully The last operation is the micro-GC column regeneration
using the condition reported in Table 412
Table 412 Micro-GC column regeneration conditions
Parameter Module 1 (molsieves) Module 2 (OV-
1)
Sample Injector temperature (degC) 80 80
Column Injector temperature (degC) 45 60
Column temperature (degC) 160 160
Sampling time (s) -- --
Injection time (ms) -- --
Analysis time (s) -- --
Post-analysis time (s) -- --
Column pressure (kPa) 120 241
Detector sensibility Detector off Detector off
114
b) Second FTS unit (Unit 2) At the end of the second and the beginning of the third year of the PhD there
were performed a serious of catalytic tests in a FT unit at the Universidad
Central de Venezuela in Caracas-Venezuela in order to homologate the results
obtained in the first FTS unit as regard the cobalt based catalysts specifically
the hydrotalcites The experimental tests were performed in a laboratory plant
with a tubular reactor with a fixed bed of catalyst vertically placed They were
then tested in the standard conditions by flowing syngas (H2 CO N2 63325
vv N2 as internal standard) at 156 Nml˙min-1 using a flow meter Then the
feed goes into the catalytic reactor from the top part reacts with the catalyst
and then the reacted flow comes out from the lower part The plant pipes are
heated at 220degC During reaction the reactor effluent passed through a hot
trap kept at 150ordmC and 20 bar to collect waxes and the products leaving this
trap were passed through a second trap kept at 0ordmC and 20 bar to collect the
lighter products (water alcohols and hydrocarbons) The analyses were
performed in various chromatographs according to the nature of the sample to
be analyzed Permanent gases and light hydrocarbons were analyzed on-line in
a PerkinElmer 3000GC Autosystem fitted with TCD detectors using a Carbosieve
SII Supelco column The liquid products (collected at 150ordmC and 0ordmC) were
weighted and analyzed in a PerkinElmer chromatograph fitted with a 50m long
Alumina RT capillary column connected to a FID
In Fig 423 the detailed flow-sheet of FT plant has been reported
115
Fig 423 Laboratory plant flow-sheet
The key for the Fig423 is the following
1 Valve
2 Flow meter for H2 and syngas operating in the range 0-100 Nml min-1
3 Gas mixer
4 Thermocouples for the control of temperature in the catalytic bed in the
reactor and in the heated pipe
5 Tubular reactor
6 Security valve
7 Pressure indicator
8 Pressure control and regulation tool
9 GC ldquoPerkin Elmerrdquo
10 Gas totalizer for the control of the total flow of gas
11 Cold trap operating at 150degC and 20 bar to collect waxes
111 Second cold trap kept at 0ordmC and 20 bar to collect the lighter products
(water alcohols and hydrocarbons)
12 Cooling air for the temperature control of the reactor
13 vent (usually closed)
In figure 424 a photo of the plant is reported
116
Fig 424 FT laboratory plant
In the following paragraphs the main parts of this plant will be described
41b Main parts of the plant
41b1 Apparatus for the regulation and control of temperature pressure and
flow of reagents
In the plant the pressure is controlled by a pneumatic valve that interacts with
a pressure valve able to work till 1000 psi (Fig 425) located after the reactor
and the cold trap
Fig 425 Pressure valve
This system can control the plant pressure with a care of 10 psi respect the set
up
117
The reactor temperature is regulated by a heating jacket and the pipe lines
after the reactor are heated at 220degC to prevent the heavy products
condensation by a heater The CO H2 and N2 flows are regulated by Brooks
Instrument Control and Read out Equipment for Thermal Mass Flow meters
Model 5878 series flow meters (Fig 426)
426 Flow meters for H2 and syngas
41b2 FT reactor
The FT plant reactor is a fixed bed tubular reactor vertically placed It is made
of AISI 316 stainless steel The technical characteristics of reactor are
summarized in Table 413
Table 413 Reactor Characteristics
Volume (cm3)
Max operating pressure
(Bar)
Max operating temperature
(degC)
Internal diameter
(mm)
Height (mm)
850 69 400 95 300
In this reactor it is possible to charge a quantity of catalysts equivalent to
occupy 1 cm of length of the reactor The feed goes into the reactor at the top
and goes out from the lower part
118
Fig 427 FT tubular reactor
The temperature inside the reactor is monitored by one thermocouple inside
the catalyst
41b3 Cold Trap The reactor effluent passed through a hot trap kept at 150degC and 02 MPa to
collect waxes and the products leaving this trap were passed through a second
trap kept at 0degC and 02MPa to collect the lighter products (water alcohols and
hydrocarbons) See Fig 428
Fig 428 Cold trap
The two cold traps can be opened at any time of the reaction and the liquid
condensed inside can be quantified and analyzed
119
The analyses were performed in various chromatographs according to the
nature of the sample to be analyzed Permanent gases and light hydrocarbons
were analyzed on-line in a PerkinElmer 3000GC Autosystem fitted with TCD
detectors using a Carbosieve SII Supelco column The liquid products (collected
at 150degC and 0degC) were weighted and analyzed in a PerkinElmer chromatograph
fitted with a 50m long Alumina RT capillary column connected to a FID
42b Analytical instruments
Two different analysis were made for the quantification of the composition of
i) Out coming gas (mixture of not reacted CO and H2 N2 and non-
condensed FT products) by an on-line in a PerkinElmer 3000GC
Autosystem fitted with TCD detectors using a Carbosieve SII Supelco
column
ii) Organic phase of condensed liquid products (collected in a cold trap at
150ordmC and 0ordmC) hydrocarbons in the range C7-C30 were weighted
and analyzed in a PerkinElmer chromatograph fitted with a 50m
long and 053 mm diameter of Alumina RT capillary column
connected to a FID
An example of analyses of the permanent gases is reported in Fig 429 and an
example of analysis of heavy FT hydrocarbons is reported in Fig 430 and Fig
431
120
Fig 429 Example of analyses of the permanent gases in the TCD
Fig 430 Example of not-condensed products GC analyses on FT out coming gas
121
Fig 431 Example of GC analysis for the quantification of heavy FT products
43b Experimental procedure
All the kinetic FT runs were made on the plant following the same experimental
procedure
1) Catalyst preparation
2) Catalyst loading on the plant in the FT reactor
3) Leak test
4) Catalyst activation
5) FT run
6) Opening of cold trap and separation of organic from aqueous phases
7) Catalyst removal from reactor
8) Reactor cleaning
43b1 Catalyst preparation
Before the catalyst was loaded in the reactor a standard procedure was
followed on the same catalyst
- Catalyst mesh operation between 106 and 150 micron
- Heating in oven at 120degC for a night
122
- Mixture catalyst ndash sea sand (inert material ndash diluent) 11
In table 414 the main characteristics of sea sand are reported The role of this
material is to help the heating removal from the catalyst (FT reaction is highly
exothermic) [5]
Table 414 Main characteristics of sea sand
Particle Size (μm)
Specific Surface
Area (m2g)
Bulk density (Kgm3)
Pore Volume
(mL)
Interstitial Velocity
(md)
Porosity (-) Composition
100-300 074
200-1430
117 26
044 SiO2
43b2 Catalyst loading
As the height of the mixture catalyst + sea sand is about 1 cm (using a pipe with
an internal diameter of 95 mm) if this material is charged in the middle of the
reactor this work surely at the same temperature in each point The final
arrangement of the reactor is reported in Fig 432
Fig 432 FT reactor internal loading arrangement
123
Finally after the closing the pressure inside the reactor is raised till 3 bar with
the activation gases The gas flow is stopped for one night and then the reactor
is checked to control possible gas losses If the reactor pressure is stable the
activation catalyst step will be performed The same procedure for the check of
possible gas loss will be performed when the pressure of the reactor will be
raised till 20 bar for FTS
43b3 Catalyst activation The catalyst activation is the process in which the catalyst is reduced from the
oxidised state in the reduced or metallic state The samples tested in this
reactor were the Co based hydrotalcites In the FT reaction the active form for
the cobalt based catalysts is the cobalt metallic All the catalysts were charged
into the reactor in the oxidised form because the last operation in the catalysts
preparation is the calcination (T=500degC) in air The catalyst activation-reduction
is performed in this part of the PhDrsquos research work at 350degC using H2 always
for 4 h at 3 bar of pressure At the end of this step the FT process start
43b4 Fischer Tropsch runs
After the catalyst activation the plant is raised at standard reactions conditions
Temperature = 220-260degC
Pressure = 20 bar
Feed ratio H2CO = 21
Syngas (H2 + CO + N2) flow = 156 Nmlmin (in order to work with the
same space velocity used for the same samples tested in the Unit 1 in
Italy)
These are the ldquostandardrdquo reaction conditions When the plant reaches the set-
up values this is the ldquozero-timerdquo of the FT runs Every one hour the GC make
124
one analysis of the permanent gases (CO CO2 CH4 N2) on the out coming flow
(also during the night) Each data is reported and elaborate using an excel
database The FT run has a duration between 200-280 hours During the
reaction and before the changes of temperatures the valves of the two cold
trap are opened and both the organic phase (GC) and the aqueous phase are
separated and then weighed and analyzed Also these data is collected in the
excel database and now it is possible to calculate the CO conversion the
products selectivity the alpha parameter and it is possible to verify the final
mass balance
After the reactor cooling the catalyst is unloaded The reactor is cleaned
carefully
42 Experimental data elaboration
The experimental data collected in the laboratory are the gas-chromatographic
area (with micro and traditional GC) the gas flows the temperatures the
pressure the weight of condensed products and the TOC value of organic
compounds in aqueous phase For each run all these data were put in the
excel file where in an automatic way the CO conversion the products
selectivity the molar balance the parameter were calculated
There were used two different file excel for the two different FTS unit
a) First FTS unit (Unit 1)
The file excel is split in nine pages data results heavy hydrocarbons analysis
molar balance (CO hydrogen and oxygen) hydrogen analysis oxygen analysis
and alpha calculation As example the pages of one FT run (made with a Co
base catalyst Co35_2d) are reported in Fig 433a-f
Data page (Fig 433a)
125
This worksheet contains the mathematical elaboration of the experimental
data obtained from the various analyzes and is composed of different parts
Conditions It is referred to the number of tests carried out by the
micro-gas chromatograph the time at which the analysis were made
and the outside temperature at the time of sampling
Flow in It is referred to the flow in (Nmlmin) of the reactants (H2 and
CO) and the internal standard (N2) that remain constant during the
entire kinetic energy
Volumes totalizers It is referred to the values of the three volumes of
gas consumed while the kinetic is in progress (this values are read from
the totalizer just before performing the analysis) and the total volume
of gas output in ml and Nml Furthermore it also evaluates an error in
percentage between the volume of gas out and the gas in
Flow out is measured by a flow meter bubbles and a counter ldquoRitterrdquo
the flow rates are calculated with the output flow measured from the
bubble flow meter and the Ritter counter and then compared
Flow from bubble flow meter (min
ml ) = 60t
V (11)
V[ml] Volume path from the bubble
t[min] Time it takes the bubble to traverse this volume
Flow from Ritter counter (min
ml ) = 100)(
t
VV INOUT (12)
VIN [ml] and VOUT [ml]are the volume of gas in and out
Both values of flow are converted in Nmlmin by the next equation
T273
273ml
min T[degC] (13)
126
CO Conversion It is referred to the quantity of gas reacted or converted
referred to the gas entering inn the plant From the micro-gc analysis
are taken the chromatographic areas of CO and N2 and used to
calculate the flow out-coming of CO from the equation
29121
2
2
OUTNflow
NArea
COAreaCOflow OUT (14)
Where 12912 is the calibration factor As the flow in and the flow out of N2
is the same
29121
025
2
NArea
COAreaCOflow OUT (15)
502 is the flow of the internal standard N2
Now it is possible to calculate the CO conversion using the next formula
IN
OUTIN
COflow
COflowCOflowConversionCO
(16)
Selectivity Concerning the gas flow out-coming from the FT plant made
of not reacted CO CO2 CH4 and light hydrocarbons
CO in reaction mixture 100
2
NTOT
OUT
flowflow
COflowCO (17)
product i in reaction mixture
100
2
NTOT
OUT
i
i
iflowflow
flowcF
area
product (18)
where
flowTOT is the total flow out-coming from the FT plant and concentrationi is
the amount (m) of product i found using the micro-GC
Fci is the calibration factor for each compound
127
Carbon molar flow for the i compound
i
i
C
i
tot
Cnumber
flowmoles
422
100
0010
min (19)
where iCnumber is the number of carbon atom of compound i
0001 transform Nml to Nl and 224 let to transform Nl to moles
Molar balance
CO moles entering in the plant 1000422min x
flowCmolesinin COCO
(20)
CO moles out coming
6
1 min1000422min i
iCOCO molesC
x
flowCmolesoutOUT (21)
128
Fig 433a Example of ldquodata pagerdquo in FT data elaboration excel file
Results page (Fig 433b)
Concerning the products selectivity
Light products (ltC7) j selectivity
129
100
minmin
min
outin
C
j molesCOmolesCO
moles
S
j
(22)
where jCmoles means the moles of carbon atom in the j products
Heavy products (geC7) i selectivity
100
minmin
min
outin
C
i molesCOmolesCO
moles
S
i
(23)
where iCmoles means the moles of carbon atom in the i products
Total light products selectivity jlight SS (24)
Total heavy products selectivity iheavy SS (25)
Fig 433b Example of ldquoresults pagerdquo in FT data elaboration excel file
Concerning the heavy product (organic phase condensed in the cold trap) elaboration (Fig 433c)
moles of i compound 100
CA
fcCAmoles ii
i (26)
where CA is the chromatographic area and fc is the calibration factor
130
Total moles of ldquo-CH2-ldquo unit in organic phase 142
OPCH
weightmoles (27)
Where weightOP means the weight of the organic phase in gram and 14 is the molecular weight of the unit ldquo-CH2-ldquo
Carbon moles of compound i 100
2 i
CH
Cmoles
molesmoles
i
(28)
Moles of carbon per minute of each component
60min
timereaction
CmolesCmoles ii (29)
Fig 433c Example of ldquoheavy hydrocarbons analysis pagerdquo in FT data elaboration excel file
Molar balance page (Fig 433d)
The molar balance is verified using the following equation
outoutoutoutinCwaterCheavyClightCOCO molesmolesmolesmolesmoles (30)
Where
131
inCOmoles and outCOmoles are respectively the moles of CO in entrance and
escape of the FT plant in all the runrsquos time outClightmoles are the carbon
atom moles of light FT products came out from the FT plant in all the runrsquos
time outCheavymoles are the carbon atom moles of the heavy hydrocarbons in
the organic phase condensed in the cold trap and outCwatermoles are the
carbon atom moles inside the water phase condensed in the cold trap In
particular
422
0102 iiNtot
Clight
Cnflowflowmoles out
out (31)
2CH
OPCheavy
PM
weightmoles
out (32)
12106
fdweightppmmoles OPTOC
Cwaterout (33)
where ppmTOC are the ppm of Total Organic Carbon measured by TOC
instrument and fd is a diluting factor (normally 1500) as the aqueous phase
must be diluted before the TOC analysis
Fig 433d Example of ldquomolar balance pagerdquo in FT data elaboration excel file
132
alpha parameter (Fig 433e)
This parameter represents a prediction of the distribution related to the
number of carbon atoms according to the Anderson-Schulz-Flory
distribution
In the excel file of data elaboration it is possible to calculate the alpha
parameter in different range of hydrocarbons C1-C6 C3-C12 C13-C30 C3-C30
The hydrocarbon range is chosen depending of the FT results if as
example the heavy product selectivity is very low it is not convenient to
consider these products in the calculation The equation for the
calculation is
21
logloglog nn
Wn (34)
where Wn is the weight fraction of product with n carbon atom number In
the excel file the equation used are
tot
C
C tmoles
moles i
i 60
min (35)
where ttot is the total time of FT run in hours
iCi PMmolesgi (36)
n
i
i
in
g
gW
1
(37)
The calculation of is then performed making a diagram in which the
n
Wnlog is reported vs the carbon atom number
133
Fig 433e Example of ldquo calculation pagerdquo in FT data elaboration excel file
ldquo calculation pagerdquo
The product distribution can be predicted using the AndersonminusSchulzminusFlory
(ASF) model that depends on the chain growth probability α Different factors
have an influence on the alpha parameter such as process conditions type of
catalyst and chemical promoters [6] The ASF product distribution as a function
of α is depicted in Figure 25 (Chapter 2)
According to ASF distribution ideally the molar fraction (Mn) of the
hydrocarbon product with a carbon number of n is only dependent on the
chain-growth probability (α) which is a function of the rates of chain growth
and chain termination by the following equation
Mn = (1minusα)αnminus1 (38)
In other words the product selectivity is determined by α value in an ideal
case A smaller α value leads to lighter (C1ndashC4) hydrocarbons while larger α
value results in the formation of heavier (C21+) hydrocarbons However the ASF
distribution is unselective for the middle-distillate products which are usually
the target products For examples the maximum selectivity to gasoline-range
(C5ndashC11) hydrocarbons is sim45 and that to diesel-range (C10ndashC20) hydrocarbons
is sim35 The development of selective FT catalysts which can tune the
134
selectivities to desired products is one of the most challenging targets in the
field of FT synthesis [7]
The probability is defined as the speed of growth (rg) divided by the sum of
the speeds of all the possible reactions for the species in growth
The probability to form a product Pn with n carbon atoms is the product of the
probabilities that the adsorbed species are formed in 1 2 n-1 carbon atoms
(precursors of the species Pn) and the probability that the adsorbed species an
carbon atoms desorb Writing a mathematical model leads to the ASF
2n 1
loglognn
Wlog (39)
where Wn is the mass fraction of the product with n carbon atoms
To get the equation of Anderson-Schulz-Flory We define
- as the probability of growth - rt as the rate of chain terminations - rp the speed of chain propagation
For a chain of n carbon atoms is defined another parameter n given by
1n
i
n
n
n
p
tn
1
r
r
(40)
where n is the probability that a chain of n carbon atoms remains on the
catalyst to continue the propagation of the chains n is the number of moles of
product Cn If n is constant throughout the range of products it may simply
indicate with and therefore starting from n = 1 we can write
3
134
2
123
12
So in general
135
1n1n
Starting from a generic molecule with x carbon atoms we can write
xnxn
(41)
Assuming that the monomeric units have the same molecular weight without
regard to their position in the growing chain (these monomer units are CH2
with PM = 14) we can obtain the weight fraction Wn multiplying the equation
(1) by n and dividing it by
1n
nn If we set x = 1 equation (41) remains
1n
1n
1n
1n
1n1
1n1
1n
n
nn
n
n
n
n
n
nW
(42)
The denominator of the last member of equation (42) can be written as
0n
n
(43)
In fact the operators
can be reversed and therefore
0n
1nn
0n0n
n
The series
0n
n for 1 be equal to 1
1
The series in question is of the type n32 arararaS
and the solution is equal to
r1
r1aS
n
Equation (2) can therefore be rewritten as follows
136
2
1n1n
0
n
1n
n1
n
1
1
nnW
or
21nn 1nW (44)
Bringing in logarithmic form the equation (44) we have
2n
n
n
n
1n
n
W
12nn
W
121nn
W
121nnW
)(lnlnln
)ln(lnlnln
)ln(ln)(ln
)ln(ln)(lnln
is identified by the slope of the straight line obtained by plotting the log
(Wnn) as a function of n The quality and the defect of the ASF model is its
simplicity one is in fact arises because of its ease of use across the agreement
with experimental data is not always fully satisfactory in fact the equation
provides undifferentiated products while in reality various species are
summarized
In this file are calculated different values of depending on the range of
carbon atoms C3-C12 C13-C30 C3-C30 Furthermore it was calculated an value
for the range C1-C6 because it is common to all the catalysts in fact the nature
of the tests performed on the various samples kinetics do not guarantee the
of the other range
Mathematically is calculated from
bullthe moles of carbonmin of the various components
bull from the moles of carbonmin it is possible to find the moles of each
component with the formula
137
hreactiontimeh
Cmolcarbontomol i
i
min60
min
From the moles it is possible to get the grams of each component
mol
gPMmolCmolg ii
Wn is calculated (weight fraction) for each component
n
1i
i
in
g
gW
i
calculating the value of Wnn (where n is the number of carbon atoms)
for each component
calculating the ln(Wnn)
By plotting the logarithm of the value of Wnn as a function of the number of
carbon atoms (n) is obtained a straight line whose slope gives the value of
desired
425 Hydrogen
Hydrogen balance (Fig 433f)
This data page allows to calculate the conversion of hydrogen and also the of
H2 in the gas mixture leaving from the reactor
H2 Conversion
Area H2
Area N2
Real Flow mix [Nml min-1]
Flow H2 OUT
[Nml min-1]
CONV H2 ()
() H2
138
As for the CO from the analysis at the micro-GC we get the chromatographic
areas of H2 and N2 that are used to calculate the outlet flow from the Fischer-
Tropsch plant of carbon monoxide by the formula
0017
2
2
22
OUTNflow
NArea
HAreaHflow OUT
where 7001 is the correction factor determined by the calibration of the
micro-gas chromatograph As the output flow of nitrogen is equal to that in the
input will have
0017
025
2
22
NArea
HAreaHflow OUT
At this point we can calculate the conversion of H2 by the formula
IN
OUTIN
Hflow
HflowHflowHConversion
2
222
The H2 is necessary to obtain the number of moles of hydrogen present in the
gaseous stream leaving from the reactor it is calculated through the formula
1002
2 TOT
OUT
flow
HflowH
Hydrogen Balance Also the balance of the hydrogen is performed at the end of the kinetic and it is
calculated with the following formula
2_
_2_
2
22222
Hfrom
waterheavylightMixfromHfrom
IN
OUTOUTOUTOUTIN
Hmoles
HmoliHmolesHmolesHmolesHmoles
where
139
1 18
2
phaseaqueous
OUT
weightwaterHmoles
2 2
2
CHPM
phaseorganicweightphaseorganicfomHmoles
The use of the molecular weight of methylene is because the CH2 is the
segment that grow joining to other segment of CH2 to give the different
hydrocarbons
3 moles of H2OUT light are the moles obtained by the summation of moles
of H2OUT of light hydrocarbons through the formula
2422
0102
jiOUT
OUT
compoundHngasmllightHmoles
Fig 433f Example of ldquohydrogen balancerdquo in FT data elaboration excel file
427 Oxygen Balance As for the other two balances also the oxygen balance is carried out at the end
of the kinetic run and it is calculated using the formula
COfrom
OHfomCOfromCOfromCOfrom
IN
OUTOUTOUTIN
Omoles
OmolesOmolesOmolesOmoles
_
2_2___
Where
140
1 18
phaseaqueous
OUT
weightwaterOmoles
2 422
2010 22
COgasmlCOOmoles OUT
OUT
In the calculation of the oxygen balance are not considered the oxygenated
products while the moles of OIN from CO and the moles of OOUT from CO are
respectively equal to the moles of COIN and COOUT from CO
b) Seconf FTS unit (Unit 2)
The shape of the file excel is presented in a different way but the equations
are the same equations presented before (See First FTS unit in this chapter)
The file is split in eleven pages XCO CH4 CO2 TCD data media paraffins
fractions (1-4) As example the pages of one FT run (made with a Co based
hydrotalcites catalyst Co35_2d) are reported in Fig 434a-d
TCD In Fig 434a-b are shown the conditions related to the number of tests
carried out by the gas chromatograph the time at which the analysis were
made and the outside temperature at the time of sampling the CO Conversion
that is referred to the quantity of gas reacted or converted referred to the gas
entering inn the plant From the gas chromatograph are taken the
chromatographic areas of CO CH4 CO2 and N2 and used to calculate the
selectivity
Fig 434a Example of ldquodata page _ TCDrdquo in FT data elaboration excel file
141
Fig 434b Example of ldquodata page _ TCDrdquo in FT data elaboration excel file
Datos In Fig434 c is shown the information related to the selectivity of light hydrocarbons
Fig 434 c Example of ldquolight hydrocarbons analysis pagerdquo in FT data elaboration
excel file
In Fig 434d the calculation of is then performed making a diagram in
which the
n
Wnlog is reported vs the carbon atom number
Fig 434 d Example of ldquo calculation pagerdquo in FT data elaboration excel file
142
43 Novelties on the FT plant made in this PhD work In the second year of the PhD the reactor used in the laboratory at the
ldquoUniversitagrave degli Studi di Milanordquo was brought in ldquoBrignolerdquo Company
(Legnano ndash MI) for a general control and revision
In this long revision some fundamentals improvements have been made on
the FT plant
all the analytical procedures were optimized verified and calibrated
A new flowmeter was included in the feed verified and calibrate
References
[1] CLBianchi C Pirola V Ragaini Cat Comm 7 (2006) 669
[2] ML Cubeiro Loacutepez A Colmenares L Texeira M Goldwasser M J Peacuterez
F Machado F Gonzaacutelez Applied Catalysis A General 167 (1998) 183-193
[3] C Pirola C L Bianchi A Di Michele P Diodati S Vitali V Ragaini Catal
Lett 131 (2009) 294ndash304
[4] C Pirola CL Bianchi A Di Michele S Vitali V Ragaini Catal Comm 10
(2009) 823ndash827
[5] C Pirola PhD 2007-2008 Novel supported iron based Fischer-Tropsch
catalysts Preparation characterization and applications Chapter 5
[6] Abell S Montan D ChemSusChem 2011 4 1538minus1556]
[7] Qinghong Z Weiping D Ye W Review Recent advances in understanding the key catalyst factors for Fischer-Tropsch synthesis J Ener Chem 2013 2227ndash38
143
Chapter 5 Catalysts preparation and characterization A serious of catalysts were prepared according different method of synthesis
and using cobalt and iron depending on the kind of the study
The catalysts reported in Table 51 are divided in two classes
1) Catalysts of cobalt based divided into two more groups
a Co based hydrotalcites with different amount of cobalt (5-35
wt) prepared with an innovative method of synthesis (urea
method)
b Co based catalysts with 8wt of cobalt with different supports
(SiO2 Al2O3 or TiO2) and the same samples with the addition of
01 of ruthenium carbonyl all of them synthesized with the
help of ultrasound
2) Catalysts of iron (30 wt) with fixed (optimized) loading of promoters
(K=20 Cu=375) and different method of synthesis
The catalysts of the first series (Co) subdivided in two more groups (HTlc and
bimetallic with the help of ultrasound) were studied to verify the activity of
this new kind of catalysts in the CO hydrogenation
More specifically the hydrotalcites were proposed as a new kind of catalysts
in which the active metal is part of the structural core of the HTlc has been
synthesized and tested Activity tests conducted in a fixed bed reactor resulted
in satisfactory catalytic performances as we will discuss later Moreover the
structural and catalytic properties of these materials were verified at FTS
operating conditions and correlations between catalyst features and efficiency
144
towards light and heavy hydrocarbons selectivities were achieved And the
cobalt based catalysts synthesized with the help of ultrasound (US) were
studied to test the effects of sonochemical synthesis to prepare novel
supported materials with particular properties as nanostructured catalysts [1]
The chemical effect of ultrasound arises from acoustic cavitation ie the
formation growth and implosive collapse of bubbles in a liquid Some of the
interesting features resulting from the application of sonication as a synthetic
method are the nanoparticles preparation showing a more uniform size
distribution higher surface area and a more controlled phase composition The
use of high power ultrasound for long time is a difficult procedure because it is
a critical point the control of the thermal stability of the ultrasound horn In
this PhDrsquos work the possibility to use an ultrasound assisted synthesis of Co-
based catalysts by high power ultrasound for a long time has been
investigated using an innovative experimental apparatus equipped with a new
cooling system able to maintain stable the temperature US emitting horn
The catalysts of the second series (Fe) were studied to verify the effect of the
different methods of synthesis and the variation of the H2 CO ratio in order to
simulate a feed with biosyngas and for an ulterior study about the develop of a
kinetic model The selection of this specific amount of Fe (30 wt) and
promoters (Cu and K with 20 wt and 375wt respectively) was taken from
a previous research [2] in which the effect of these amounts was extensively
studied
Promoters influence the bond strength of hydrogen and carbon oxide to metal
Addition of alkali metals (K in particular) to iron catalysts promotes electron
transfer to the iron and inhibits hydrogen adsorption because adsorption of
hydrogen induces electron donation to the iron surface Moreover K promotion
Chapter 5 Catalysts preparation and characterization
145
increases the electron density in iron and will result in an increase of CO
adsorption On Fe stronger metal-carbon bonds will lead to C2+ formation and
then to a low methane selectivity [3] Copper promotes the reduction of iron
oxide phases from hematite (Fe2O3) to magnetite (Fe3O4) and then from
magnetite to iron metal A suggested mechanism for this promotion effect is
the migration of atomic hydrogen from reduced Cu sites to the iron oxide The
copper needs to be very well mixed with iron oxide to provide the most
favourable promoter effect [4]
An innovative preparation procedure with the use of Ultrasound and
Microwave has been used with the iron based catalysts
In Table 51 a general summary of all the prepared catalyst is reported
Table 51 Summary of the catalysts synthesized and tested
Metal Catalysts Samples
Co
HTlc Co5
Co 10
Co 15
Co 35
Bimetallic US CoTiO2
CoSiO2
CoAl2O3
Co-RuTiO2
Co-RuSiO2
Co-RuAl2O3
Fe
Traditional Fe30K20Cu375 SiO2 At different temperature and H2CO ratio 21 15111
Traditional + MW MW1
MW2
Traditional + US
US1
US2
Co-precipitation
FeSiO2-TEOS
Chapter 5 Catalysts preparation and characterization
146
The catalysts were characterized by TPR BET SEM TEM ICP FT-IR micro-
RAMAN techniques in their fresh form (before the use in FT reactor) and in
some cases after different activation procedure or after FT runs
The physical properties of the catalysts (surface area and morphology) were
investigated by BET SEM and TEM analyses The theoretic catalysts
composition has been investigated and verified both qualitatively using SEM-
EDS FT-IR and micro-RAMAN techniques and quantitatively using ICP
characterization The reduction behaviour of metal phase has been
investigated by TPR analyses
51 Catalysts preparation
511 Catalyst preparation procedure
5111 Cobalt based catalysts
Two different types of cobalt based catalysts were prepared during this
research The synthesis is presented in the next paragraphs
Co based Hydrotalcites by a modified urea method
A series of ternary HTlc with general formula [CoxZn(1-x-
y)Aly(OH)2](NO3)y∙05H2O was synthesized by a modified-urea method [5]
Different volumes of the solutions of the metal nitrates all at a concentration
of 05 M were mixed to obtained either a Al(Co+Al) or Al(Co+Al+Zn) molar
ratio of 03
Solid urea was added to the solutions in a molar ratio of 4 vs Al The obtained
solutions were maintained at the reflux temperature in an open flask for 48 h
The precipitates were separated by centrifugation washed with water and
then dried at 80degC
Chapter 5 Catalysts preparation and characterization
147
Co based catalysts with the help of ultrasound
All the catalysts were prepared by a modified impregnation method The metal
precursors (cobalt and ruthenium carbonyl) were dissolved in n-decane
together with the different support (SiO2 Al2O3 or TiO2) The solution was
irradiated by an US horn (Fig 51) for 3 h at 20 kHz at 300 W and then put into
a rotating vacuum oven at 40degC at 36 rpm for 24 h (impregnation step)
Samples have been calcinated at 350 degC for 4 h
Fig 51 Ultrasound horn with a cooling jacket where the coolant has two main
characteristics low viscosity at low temperature and dielectric liquid
5112 Iron based catalysts Four different types of iron based catalysts were prepared during this
research The methods used were the traditional impregnation method the co-
precipitation method and the traditional impregnation method with the help of
microwave and ultrasounds
Fe based catalysts by the Traditional Impregnation method
The iron based supported on silica catalysts were prepared according to the
traditional impregnation method completely described in a previous work [6]
starting from an aqueous solution of precursors and adding in a second time
Chapter 5 Catalysts preparation and characterization
148
the support (silica) The reagents used for the samples preparation are
reported in Table 52
Table 52 Reagents used in the catalysts preparation Fe30K20Cu375 SiO2
Reagent Main characteristics
Support SiO2
Company Fluka (cod 60740) Mesh 70-230 60 Aring Molecular weight 60086 gmol Purity gt 99 Superficial area 500 m2g
Precursors
Fe(NO3)3middot9H2O Company Riedel de Hean Molecular weight 40385 gmol Purity 98
KNO3 Company Merk Molecular weight 10111 gmol Purity gt 99
Cu(CH3COO)2middotH2O Company Fluka Molecular weight 19965 gmol Purity 99
Solvent Extra pure water
The standard methodology for the catalysts preparation is the following
Drying of silica in oven (T=120degC) for a night
Weigh of the calculated amount of iron potassium and copper
precursors
In a pyrex vessel (250 ml) the weighed precursors the water (25 ml)
and silica (5 g) are added
The vessel is put on a rotavapor (36 rpm T=40degC P = 1 bar) for 24 hours
(Fig 52)
The solvent is evaporated (T = 80degC)
The powder is dried in oven (T=120degC) for 4 hours
Calcination (T = 500degC) in air for 4 hours
Chapter 5 Catalysts preparation and characterization
149
The catalyst is sieved to obtain a powder mesh between 100 and 140
Fig 52 Rotavapor used for catalyst preparation
The amount of precursors is calculated starting from the equation (1) to have
the requested iron percentage in the not promoted catalysts
FegSiOgFe
gFe
2
(1)
Then the moles of iron are equal as the moles of his precursor (moles Fe =
moles Fe(NO3)39H2O) The grams of precursors are calculated multiplying the
moles for the molecular weight of Fe(NO3)39H2O This quantity must be divided
for the purity grade of precursor
For the promoted catalysts the amount of precursors is calculated using the
following equations
FegSiOgCugKgFe
gFe
2
(2)
KgSiOgCugKgFe
gK
2
(3)
CugSiOgCugKgFe
gCu
2
(4)
Chapter 5 Catalysts preparation and characterization
150
The equation (2) (3) and (4) must be solved as equations system The moles of
Fe K and Cu are equal as the moles of respective precursors The grams of
precursors are calculated multiplying the moles for the molecular weight of
Fe(NO3)39H2O KNO3 and Cu(CH3COO)2H2O respectively This quantity must be
divided for the purity grade of each precursors
Specifically for the preparation of a catalyst having 30 wt of iron 2wt of
potassium and 375wt of copper on silica
2920037505
15600205
33523005
gCuggCugKgFe
gCu
gKggCugKgFe
gK
gFeggCugKgFe
gFe
moles Fe =molesg
g
84755
3352=00418 moles
moles K =molesg
g
098339
1560= 000398 moles
moles Cu =molesg
g
54663
2920= 00046 moles
g Fe(NO3)3middot9H2O = 00418 molesmiddot40385 gmoles = 16882 g
g KNO3 = 000398 molesmiddot10111gmoles = 04024 g
g Cu(CH3COO)2middotH2O = 00046 molesmiddot19965 gmoles = 09168 g
and the grams required to prepare the catalysts are
980
88216 g=17227 g Fe(NO3)3middot9H2O
Chapter 5 Catalysts preparation and characterization
151
1
40240 g = 04024 g KNO3
990
91680 g= 09261 g Cu(CH3COO)2middotH2O
Fe based catalysts by the Traditional Impregnation method with the help of
microwave (MW)
For the synthesis of the catalysts with the aid of microwave (MW) a final step
where the powder of catalyst already calcined is subjected to a MW
irradiation was added Two different methods for the MW irradiation were
used In the first one (MW1) a sample of catalyst was put into a beaker and
then into a classical microwave oven (Moulinex Micro-Chef 1305E 600W) for
30 min
In the second method (MW2) the catalyst (2 g) was suspended in hexane (400
ml) put into a microwave chemical reactor (ordinary 400 mL round bottom
glass flask filled with the liquid to be heated and activated) and treated for 1 h
at 60W MW were produced by a MW generator and sent to the MW
applicator by an insulated coaxial antenna Details of the MW applicator and of
the associated experimental techniques can be found in [7]
Fig 53 Microwave (MW) Power (35-300 W) Treatment duration (60 min)
Atmosphere (air)
Chapter 5 Catalysts preparation and characterization
152
Fe based catalysts by Traditional Impregnation method with the help of
ultrasound (US)
In this particular preparation method a step using ultrasound (US) has been
added Ultrasound is simply sound pitched above the frequency bond of human
hearing It is a part of sonic spectrum that ranges from 20 kHz to 10 MHz and
corresponds to the wavelengths from 10 to 10-3 cm [8] The application of
ultrasound in connection to chemical reactions is called sonochemistry The
range from 20 kHz to around 1 MHz is used in sonochemistry since acoustic
cavitation in liquids can be efficiently generated within this frequency range
[9] However common laboratory equipment utilizes the range between 20
and 40 kHz The Ultrasound are often used in the preparation of supported
catalysts (some examples are reported in ref [10]) and their useful
contribution concerns for example the dispersion of metal the size of particles
the surface area and the advantage is evident in the performance of catalyst in
many cases both in term of conversion and of process selectivity [11]
The use of ultrasound may be very efficient to optimize the dispersion of high
metal charge as already verified in our laboratory in the past [2 12-13]
US treatment has been performed between the impregnation and the
evaporation step by irradiating the silica-precursors solution using a Sonicator
(W-385 Heat Systems Ultrasonics) with an effective input power of 60 W and a
tip diameter of 13 mm (Fig54 and Fig 55) Silica solution promoters and
water have been sonicated by the US horn for 05 h in air (US1) The same
sample was successively sonicated in a suspension of hexane in argon for 3h
(US2)
Chapter 5 Catalysts preparation and characterization
153
Figura 54 Diagram of sonication step
1 Sonicator US (W-385 of Heat Systems Ultrasonics)
2 Emitter head of US equipped with a titanium tip of 13 mm
3 Beaker with the solution immerse in a bath of waterice
4 Flow meter of Ar
5 Connection with air
6 Argon Cylinder
Fig 55 Detail of the US treatment step 20 kHz 60 W tip diameter of 13 mm US
switched on and off alternatively for 05 seconds (pulsed US) t =30 min
1
4
6 3
2
5
Chapter 5 Catalysts preparation and characterization
154
Fe based catalyst by the co-precipitation method with TEOS
Acidic silica sol (ASS) and tetraethoxysilane (TEOS) are widely used as silica
sources of FeSiO2 catalysts [14-15] which can be incorporated into iron
catalyst matrix during the precipitation of catalyst precursors and have an
obviously dispersive effect on the iron oxide phase It is well known that the
tetraethoxysilane (TEOS) is insolvable in aqueous solutions but can slowly
hydrolyze to hydrophilic silica solgel [16]
In the TEOS- water system acid or basic can catalyze the hydrolysis of TEOS
[17] In the process of the co-precipitation TEOS hydrolyzes into silica
accompanied by the precipitation of ferric ions whereas the silica particles in
ASS may directly interact with ferric ions The different properties of two silica
sources should lead to a great diversity in both the structures and the
physicochemical properties of catalysts such as morphology dispersion
phases chemisorption Fe-SiO2 interactions and so on
As a FeSiO2 catalyst was prepared by a co-precipitation method using TEOS
The detailed process of the co-precipitation method has been described
elsewhere [18] In brief an alcoholic solution of TEOS was mixed with an
aqueous solution of iron nitrate with a FeSi atomic ratio of 10025 The mixed
solution was precipitated using an ammonium solution at 80 degC and a pH value
of 85-90 After precipitation the precipitates were aged for 2 h washed and
filtered Then the filtered cakes were dried at 120 degC overnight and calcined at
500 degC for 5 h The catalyst was denoted as FeSiO2-TEOS
Some calculations have been made to prepare the catalyst
To prepare 50ml 1M of solution of TEOS
To prepare a catalyst with a FeTEOS= 41 ratio and using 1g of Fe are required
Chapter 5 Catalysts preparation and characterization
155
To prepare the catalysts is required a ratio FeTEOS=41 thatrsquos mean 1g of Fe
correspond with 025g of TEOS
molFemolFeg
gFemolFe 01790
84755
1
OHNOgFeOHNOmolFe
OHNOgFe
molFe
OHNOmolFemolFeOHNOgFe 233
233
233233233 9)(387
980
1
9)(
9)(52403
1
9)(1017909)(
mll
ml
mol
Mlsol
gTEOS
molTEOSgTEOSmlTEOS 201
1
1000
1
11
33208
1250
700ml of distillate water was put into a beaker and heated at 77degC
OHNOgFe 233 9)(387 and 120ml of TEOS were added
Measurements of pH was taken until the solution acquired a pH
between 8 and 9
Let stand for 2 hours
The solvent is evaporated (T = 80degC)
The powder is dried in oven (T=120degC) for 4 hours
Calcination (T = 500degC) in air for 4 hours
The catalyst is sieved to obtain a powder mesh between 100 and 140
52 Catalysts characterization 521 Catalysis characterization introduction and theory
According to [19] the basic catalyst characterization involves two main steps
the investigation on the porous nature of the catalyst support (physical
properties) and on the properties of the active sites that are dispersed on the
support surface (table 53)
The complete and accurate knowledge of the properties of a catalyst is
fundamental for evaluating its performance In this work there were used
several techniques to investigate their physical and chemical properties
Chapter 5 Catalysts preparation and characterization
156
The characterization has been made for the fresh catalysts (after the
calcination at 500degC and before their loading and activation or use in FT
reactor) and in some cases after the activation and the FT reaction
Table 53 General scheme of catalysts characterization [19]
Catalyst texture
Physical properties Chemical properties
Result Technique Result Technique Geometry and shape - Optical microscopy Chemical composition -Electron spectroscopy
-Atomic adsorption
Total specific surface area
-Gas physisorption -Mercury porosimetry
Degree of dispersion -Selective chemisorption -X-ray -Electron microscopy -Magnetisation analysis
True density -X-ray analysis -Neutron diffraction
Degree of dispersion -Selective chemisorption -X-Ray -Electron microscopy -Magnetisation analysis
Bulk and apparent density
-Helium pycnometry -Mercury porosimetry -Liquid displacement
Surface Energy -Thermal analysis test -Temperature programmed desorption and reaction calorimetry
-Pore specific volume -Porosity
-Mercury porosimetry -Gas adsorption
Acid-base sites -Selective chemisorption -Temperature programmed desorption
Pore size and mean pore size
-Mercury porosimetry -Gas Adsorption
Redox sites -Spectroscopic methods -Temp programmed reduction -Temp Programmed oxidation
Particle size -Sieves -Laser scattering -Sedimentation -Electrical sensing zone -Etc
-Catalytic properties -Activity -Selectivity
Reactor tests and simulation
Surface structure -Optical microscopy -Electron microscopy -X-Ray analysis
Surface change Z potential
A brief description of the different techniques used in this work will be
presented as follow
Chapter 5 Catalysts preparation and characterization
157
BET (adsorption method for surface area evaluation)
SEM
TEM (electron microscopy)
FT-IR and RAMAN (vibrational spectroscopy for chemistry of surface
groups)
TPR (study of catalyst reduction vs temperature)
TPD
ICP (quantification of element inside the catalyst)
XRD
5211 BET analysis (adsorption method for surface area evaluation)
According to [20] the most widely used method for determining surface area
involves measuring the amount of gas adsorbed on a solid surface at a
temperature close to the boiling point of the gas Nitrogen is most commonly
used as the adsorbate
The interaction between the adsorbate and the adsorbent may be chemical
(chemisorption) or physical (physisorption) in nature and ideally should be a
surface-specific interaction If the adsorption is measured at several gas
pressures the Brunauer- Emmett-Teller (BET) [21] equation can be used to
calculate the amount of adsorbate required to form a monolayer [22] This
technique of characterization of solid has the particular equation that allows to
determine a parameter of great importance in the study of the solid ones that
is the superficial specific area Such parameter expresses the relationship
between the total surface of the catalyst and the weight of the same one and
usually is expressed in m2g Technique BET uses the principle of the physical
inert gas adsorption (nitrogen) to varying of the relationship between the
Chapter 5 Catalysts preparation and characterization
158
partial pressure of nitrogen and its vapor pressure to the temperature of liquid
nitrogen The technique can be carried in static or dynamic conditions
Opportune procedures of calculation allow also to determine the distribution
of the pores in the field of mesoporosity BET theory is a well-known rule for
the physical adsorption of gas molecules on a solid surface that is basis for an
important analysis technique for the measurement of the specific surface area
of a material The concept of the theory is an extension of the Langmuir theory
which is a theory for monolayer molecular adsorption to multilayer adsorption
with the following hypotheses (a) gas molecules physically adsorb on a solid in
layers infinitely (b) there is no interaction between each adsorption layer and
(c) the Langmuir theory can be applied to each layer The resulting BET
equation is the following
p
pc
p
p
p
pc
V
V
m111
(5)
Where
V = volume of adsorbed gas at pressure P
pdeg = gas saturation pressure at temperature T
ppdeg = relative pressure
C = BET constant expressed by the following
RTqqC L exp 1 (6)
Where
q1 = heat of adsorption of the first layer
qL = heat of adsorption of the second and higher layers
For the Vm calculation the (6) must be linearized and the linear relationship of
this equation is maintained only in the range of 005 lt P P0 lt 035
Chapter 5 Catalysts preparation and characterization
159
mm cV
p
pc
CV
p
pV
p
p
1
1
1
(7)
Equation (7) is an adsorption isotherm and can be plotted as a straight line with
1 V[(Pdeg P) minus 1] on the y-axis and P P0 on the x-axis according to
experimental results The specific surface area is determined on the Vm basis
mol
molAVm
V
ANVAS
(8)
Where
NAV = Avogradorsquos number
Amol= adsorption cross section (for N2 = 162 Aring2)
Vmol= molar volume of gas (22414 mlmol)
Experimental The samples have been analyzed using a Costech Sorptometer
1042 ldquoKELVINrdquo using liquid nitrogen Before the analysis the catalyst is put in
oven (T = 110degC for 16 h) to remove the adsorbed water Then a quantity
between 008 g and 02 g in analyzed in the instrument The sample is pre-
treated for 2 h at T = 200degC in a N2 flow to remove all the impurity then a
check with helium is made to calibrate the interspatial volume
5212 Temperature programmed reduction TPR analysis [19]
Some aspects related to catalysts characteristic and behaviour will be treated
as determination of metal surface area and dispersion spillover effect and
synterisation A description of the available techniques will follow taking in
consideration some aspects of the gas-solid interactions mechanisms
(associativedissociative adsorption acid-base interactions etc)
Chapter 5 Catalysts preparation and characterization
160
The thermal analysis methods may be used with different objectives the
reaction or desorption profile may be used qualitatively to fingerprint a given
system and then it is possible to make a quantitative considerations about the
nature of chemical processes the amount of gas involved in the chemical
reaction and finally to calculate the number of the active sites the reducibility
degree of the sample related to the catalytic activity All the methods relating
some characteristic properties of a catalyst to its temperature during a
programmable heating ramp are named commonly in the field of the thermal
analysis
The thermal analyses are often used to investigate surface modifications and
bulk reactivity by varying the surface composition the catalyst preparation
method the pre-treatment for catalyst activation and the analytical conditions
The TPRO involve a bulk reaction
The objectives of the programmed reduction (TPR) are essentially the
following 1) to find the most efficient reduction conditions 2) to identify the
supported precursor phases and their interactions with the support 3) to
characterize complex systems as bimetallic or doped catalyst to determine the
role of the second component ant to establish alloy formation or promotion
effects There are several interesting studies about this technique Robertson
et al [23] first reported TPR profile of nickel and nickel-copper catalysts and
since then many catalysts have been investigated In the TPR technique an
oxided catalyst precursor is submitted to a programmed temperature rise
while a reducing gas mixture is flowed over it (usually hydrogen diluted in
some inert gas as nitrogen or argon) An interesting application of this
technique is that the TPRO analysis may be used to obtain evidence for the
interaction between the atoms of two metallic components in the case of
bimetallic system or alloy as already cited In general TPRTPO studies are
Chapter 5 Catalysts preparation and characterization
161
carried out under low partial pressure of the reactive gas In this way it is
possible to observe the intermediate reactions depending from analytical
conditions as temperature rate flow rate and concentration of reactive gas
Experimental
Conventional temperature-programmed reduction experiments (TPR)
were performed on the calcined catalysts using a TPRDO110
instrument (Thermoquest) The samples were initially pre-treated in
flowing argon at 200degC for 05 h After being cooled to 50degC the H2Ar
(51 vv) reducing mixture flowed through the sample at 30 mlmin
while the temperature was increased from 50 to 900degC at constant rate
of 8 degCmin
5213 SEM and TEM analysis
In electron microscopy as in any field of optics the overall contrast is due to
differential absorption of photons or particles (amplitude contrast) or
diffraction phenomena (phase contrast) The method provides identification of
phases and structural information on crystals direct images of surfaces and
elemental composition and distribution Routine applications however may be
hampered by complexities of image interpretation and by constraints on the
type and preparation of specimens and on the environment within the
microscope
The scanning electron microscope (SEM) is a type of electron microscope that
creates various images by focusing a high energy beam of electrons onto the
surface of a sample and detecting signals from the interaction of the incident
electrons with the samples surface The type of signals gathered in a SEM
varies and can include secondary electrons characteristic x-rays and back
scattered electrons In a SEM these signals come not only from the primary
Chapter 5 Catalysts preparation and characterization
162
beam impinging upon the sample but from other interactions within the
sample near the surface The SEM is capable of producing high-resolution
images of a sample surface in its primary use mode secondary electron
imaging Due to the manner in which this image is created SEM images have
great depth of field yielding a characteristic three-dimensional appearance
useful for understanding the surface structure of a sample This great depth of
field and the wide range of magnifications are the most familiar imaging mode
for specimens in the SEM Characteristic x-rays are emitted when the primary
beam causes the ejection of inner shell electrons from the sample and are used
to tell the elemental composition of the sample The back-scattered electrons
emitted from the sample may be used alone to form an image or in conjunction
with the characteristic x-rays as atomic number contrast clues to the elemental
composition of the sample The SEM was pioneered by Manfred von Ardenne
in 1937 [24] and [25] The instrument was further developed by Charles Oatley
and first commercialized by Cambridge Instruments The spatial resolution of
the SEM depends on the size of the electron spot which in turn depends on
both the wavelength of the electrons and the magnetic electron-optical system
which produces the scanning beam The resolution is also limited by the size of
the interaction volume or the extent to which the material interacts with the
electron beam The spot size and the interaction volume both might be large
compared to the distances between atoms so the resolution of the SEM is not
high enough to image individual atoms as is possible in the shorter wavelength
(ie higher energy) transmission electron microscope (TEM) The SEM has
compensating advantages though including the ability to image a
comparatively large area of the specimen the ability to image bulk materials
(not just thin films or foils) and the variety of analytical mode available for
measuring the composition and nature of the specimen Depending on the
Chapter 5 Catalysts preparation and characterization
163
instrument the resolution can fall somewhere between less than 1 nm and 20
nm In general SEM images are easier to interpret than TEM images
According to [22] topographical images in a SEM are formed from back-
scattered primary or low-energy secondary electrons The best resolution is
about 2-5 nm but many routine studies are satisfied with a lower value and
exploit the case of image interpretation and the extraordinary depth of field to
obtain a comprehensive view of the specimen With non-crystalline catalysts
SEM is especially useful for examining the distribution and sizes of mesopores
An energy dispersive X-ray spectroscopy device is a frequent attachment in the
instrument
Fig 56 Schematic ray path for a scanning electron microscope (SEM) [26]
Transmission electron microscopy (TEM) is a microscopy technique whereby a
beam of electrons is transmitted through an ultra-thin specimen interacting
with the specimen as it passes through it An image is formed from the
electrons transmitted through the specimen magnified and focused by an
objective lens and appears on an imaging screen a fluorescent screen in most
TEMs plus a monitor or on a layer of photographic film or to be detected by a
sensor such as a CCD camera The first practical transmission electron
microscope was built by Albert Prebus and James Hillier at the University of
Chapter 5 Catalysts preparation and characterization
164
Toronto in 1938 using concepts developed earlier by Max Knoll and Ernst
Ruska
Theoretically the maximum resolution that one can obtain with a light
microscope has been limited by the wavelength of the photons that are being
used to probe the sample and the numerical aperture of the system Early
twentieth century scientists theorized ways of getting around the limitations of
the relatively large wavelength of visible light (wavelengths of 400ndash700
nanometers) by using electrons Like all matter electrons have both wave and
particle properties (as theorized by Louis-Victor de Broglie) and their wave-like
properties mean that a beam of electrons can be made to behave like a beam
of electromagnetic radiation Electrons are usually generated in an electron
microscope by a process known as thermionic emission from a filament usually
tungsten in the same manner as a light bulb or by field emission The
electrons are then accelerated by an electric potential (measured in V or volts)
and focused by electrostatic and electromagnetic lenses onto the sample The
beam interacts variously with the sample due to differences in density or
chemistry The beam that is transmitted through the sample contains
information about these differences and this information in the beam of
electrons is used to form an image of the sample The contrast in a TEM image
is not like the contrast in a light microscope image A crystalline material
interacts with the electron beam mostly by diffraction rather than absorption
although the intensity of the transmitted beam is still affected by the volume
and density of the material through which it passes The intensity of the
diffraction depends on the orientation of the planes of atoms in a crystal
relative to the electron beam at certain angles the electron beam is diffracted
strongly from the axis of the incoming beam while at other angles the beam is
largely transmitted
Chapter 5 Catalysts preparation and characterization
165
Just as details of a light microscope sample can be enhanced by the use of
stains staining can be used to enhance differences in a sample for electron
microscopy Compounds of heavy metals such as osmium lead or uranium can
be used to selectively deposit heavy atoms in areas of the sample and to
enhance structural detail by the dense nuclei of the heavy atoms scattering the
electrons out of the optical path The electrons that remain in the beam can be
detected using a photographic film or fluorescent screen among other
technologies So areas where electrons have been scattered in the sample can
appear dark on the screen or on a positive image due to this scattering TEM is
suitable for examination of supported catalysts with particle sizes down to 2-3
nm giving information on particle location over the support on particle-size
distributions in favourable cases on particle and support morphology and on
the nature and distribution of deposits having a thickness of the order of 2-3
nm Surface topography can be examined using replication techniques [22]
Fig57 Schematic ray path for a transmission electron microscope (TEM) [26]
Experimental The SEM analysis have been made in collaboration with Perugia University
SEM images were measured using an electron microscopy Philips XL-30CP with
RBS detector of back-scattered electrons and EDS analyzer was used to
describe the surface and elemental composition of catalysts
Chapter 5 Catalysts preparation and characterization
166
The TEM analysis have been made in collaboration with Perugia University The
morphology of the samples was investigated by a transmission electron
microscope Philips 208 Transmission Electron Microscope (TEM) a drop of the
dispersion was deposited on a copper grid covered with a polymeric film
Formvar subsequently evaporated in air at room temperature
In order to obtain more accurate information concerning the atomic
percentage of the elements on the surface EDX measurements were made
using the high-resolution TEM instrument at the Department of Chemical
Science and Technology and Biosystems studies at the University of Siena This
instrumentation allows to obtain with high precision information on the atomic
percentage in different areas of the sample going to select individual points or
individual areas
5214 FT-IR analysis
This vibrational spectroscopy is used for characterization of high area
supported or unsupported catalysts Information is available either directly or
by study of probe adsorbates on the chemistry of surface groups (particularly
on oxides) It is also used for the study of the behavior of precursor compounds
during catalyst preparation
Infrared spectroscopy is the subset of spectroscopy that deals with the infrared
region of the electromagnetic spectrum It covers a range of techniques the
most common being a form of absorption spectroscopy As with all
spectroscopic techniques it can be used to identify compounds or investigate
sample composition Infrared spectroscopy correlation tables are tabulated in
the literature
The infrared portion of the electromagnetic spectrum is divided into three
regions the near- mid- and far- infrared named for their relation to the visible
spectrum The far-infrared approximately 400-10 cm-1 (1000ndash30 μm) lying
Chapter 5 Catalysts preparation and characterization
167
adjacent to the microwave region has low energy and may be used for
rotational spectroscopy The mid-infrared approximately 4000-400 cm-1 (30ndash
14 μm) may be used to study the fundamental vibrations and associated
rotational-vibrational structure The higher energy near-IR approximately
14000-4000 cm-1 (14ndash08 μm) can excite overtone or harmonic vibrations The
names and classifications of these sub regions are merely conventions They
are neither strict divisions nor based on exact molecular or electromagnetic
properties
Infrared spectroscopy exploits the fact that molecules have specific frequencies
at which they rotate or vibrate corresponding to discrete energy levels These
resonant frequencies are determined by the shape of the molecular potential
energy surfaces the masses of the atoms and by the associated vibronic
coupling In order for a vibrational mode in a molecule to be IR active it must
be associated with changes in the permanent dipole In particular in the Born-
Oppenheimer and harmonic approximations ie when the molecular
Hamiltonian corresponding to the electronic ground state can be approximated
by a harmonic oscillator in the neighbourhood of the equilibrium molecular
geometry the resonant frequencies are determined by the normal modes
corresponding to the molecular electronic ground state potential energy
surface Nevertheless the resonant frequencies can be in a first approach
related to the strength of the bond and the mass of the atoms at either end of
it Thus the frequency of the vibrations can be associated with a particular
bond type
Simple diatomic molecules have only one bond which may stretch More
complex molecules have many bonds and vibrations can be conjugated
leading to infrared absorptions at characteristic frequencies that may be
related to chemical groups For example the atoms in a CH2 group commonly
Chapter 5 Catalysts preparation and characterization
168
found in organic compounds can vibrate in six different ways symmetrical and
antisymmetrical stretching scissoring rocking wagging and twisting
The infrared spectra of a sample are collected by passing a beam of infrared
light through the sample Examination of the transmitted light reveals how
much energy was absorbed at each wavelength This can be done with a
monochromatic beam which changes in wavelength over time or by using a
Fourier transform instrument to measure all wavelengths at once From this a
transmittance or absorbance spectrum can be produced showing at which IR
wavelengths the sample absorbs Analysis of these absorption characteristics
reveals details about the molecular structure of the sample
This technique works almost exclusively on samples with covalent bonds
Simple spectra are obtained from samples with few IR active bonds and high
levels of purity More complex molecular structures lead to more absorption
bands and more complex spectra The technique has been used for the
characterization of very complex mixtures
According to [10] problems in vibrational spectroscopy include low
transmission at high metal loadings and strong oxide scattering Absorption at
lower wavenumbers often prevents observation of modes such as adsorbate-
metal stretching Fourier Transform (FI-IR) spectrometers offer two
pronounced advantages over dispersive instruments higher energy throughput
and faster data acquisition or higher signal-to-noise ratio Data processing is
easy These features are significant when examining very strongly absorbing
and scattering solids and when following dynamic processes Much IR
transmission work however requires examination of only limited frequency
ranges at medium resolution and computerised dispersive spectrometers may
then be preferable
Chapter 5 Catalysts preparation and characterization
169
Experimental The FT-IR analysis have been made in collaboration with Perugia
University Infrared spectra were measured with a FTIR model IFS113V Bruker
spectrometer resolution of 1 cm-1 in the spectral region 370-5000 cm-1
Fig 58 FTIR model IFS113V Bruker spectrometer
5215 micro-Raman analysis
Raman spectroscopy is more versatile for catalysts characterization and in
comparison with IR spectroscopy it presents at least two important
advantages there is no need of sample preparation and the spectra of water-
metal interfaces are obtained easily and quickly
Raman spectroscopy is a spectroscopic technique used in condensed matter
physics and chemistry to study vibrational rotational and other low-frequency
modes in a system [27] It relies on inelastic scattering or Raman scattering of
monochromatic light usually from a laser in the visible near infrared or near
ultraviolet range The laser light interacts with photons or other excitations in
the system resulting in the energy of the laser photons being shifted up or
down The shift in energy gives information about the phonon modes in the
system Infrared spectroscopy yields similar but complementary information
Typically a sample is illuminated with a laser beam Light from the illuminated
spot is collected with a lens and sent through a monochromator Wavelengths
close to the laser line due to elastic Rayleigh scattering are filtered out while
Chapter 5 Catalysts preparation and characterization
170
the rest of the collected light is dispersed onto a detector Spontaneous Raman
scattering is typically very weak and as a result the main difficulty of Raman
spectroscopy is separating the weak inelastically scattered light from the
intense Rayleigh scattered laser light Raman spectrometers typically use
holographic diffraction gratings and multiple dispersion stages to achieve a
high degree of laser rejection In the past PMTs were the detectors of choice
for dispersive Raman setups which resulted in long acquisition times
However the recent uses of CCD detectors have made dispersive Raman
spectral acquisition much more rapid Raman spectroscopy has a stimulated
version analogous to stimulated emission called stimulated Raman scattering
The Raman effect occurs when light impinges upon a molecule and interacts
with the electron cloud of the bonds of that molecule The incident photon
excites one of the electrons into a virtual state For the spontaneous Raman
effect the molecule will be excited from the ground state to a virtual energy
state and relax into a vibrational excited state which generates Stokes Raman
scattering If the molecule was already in an elevated vibrational energy state
the Raman scattering is then called anti-Stokes Raman scattering A molecular
polarizability change or amount of deformation of the electron cloud with
respect to the vibrational coordinate is required for the molecule to exhibit the
Raman effect The amount of the polarizability change will determine the
intensity whereas the Raman shift is equal to the vibrational level that is
involved This technique is widely applicable The large frequency range (50-
4000 cm-1) makes adsorbate-adsorbent stretching modes accessible Problems
include specimen heating high background fluorescence and low signal
strengths Surface enhanced Raman scattering (SERS) however can give
greatly increased signals in favorable cases eg with rough surfaces or small
Chapter 5 Catalysts preparation and characterization
171
particles of certain compounds It is particularly useful in the studies of
supported monolayer catalysts and adsorbed layers [22]
Experimental The Micro-Raman analysis have been made in collaboration with
Perugia University Micro-Raman spectra were made by an Olympus
microscope mod BX40 connected to an ISA Jobin-Yvon model TRIAX320 single
monochromator resolution 1 cm-1 The exciting source was a Melles Griot
25LHP925 He-Ne laser used in single line excitation mode at 6328 nm The
power focused on the samples was always less than 2 mW The scattered
Raman photons were detected by a liquid-nitrogen cooled CCD Jobin Yvon
Mod Spectrum One Samples were not pre-treated but measured as a power
placed on a microscope slide in this way it is possible to analyse the few
microns grain size and not to focus on those regions where the presence of the
support (silica) was predominant The reproducibility of the spectra was always
controlled sampling different points of the catalyst Through the optical
microscope analysis we also verified that no local degradation occur during
laser irradiation
5216 ICP-MS analysis
ICP-MS (Inductively coupled plasma mass spectrometry) is a type of mass
spectrometry that is highly sensitive and capable of the determination of a
range of metals and several non-metals at very low concentrations It is based
on coupling together an inductively coupled plasma as a method of producing
ions (ionization) with a mass spectrometer as a method of separating and
detecting the ions ICP-MS is also capable of monitoring isotopic speciation for
the ions of choice A plasma is a gas that contains a sufficient concentration of
ions and electrons to make the gas electrically conductive The plasmas used in
Chapter 5 Catalysts preparation and characterization
172
spectrochemical analysis are essentially electrically neutral with each positive
charge on an ion balanced by a free electron In these plasmas the positive ions
are almost all singly-charged and there are few negative ions so there are
nearly equal numbers of ions and electrons in each unit volume of plasma
ICP for spectrometry is sustained in a torch that consists of three concentric
tubes usually made of quartz The end of this torch is placed inside an
induction coil supplied with a radio-frequency electric current A flow of argon
gas (usually 14 to 18 lmin) is introduced between the two outermost tubes of
the torch and an electrical spark is applied for a short time to introduce free
electrons into the gas stream These electrons interact with the radio-
frequency magnetic field of the induction coil and are accelerated first in one
direction then the other as the field changes at high frequency (usually 2712
million cycles per second) The accelerated electrons collide with argon atoms
and sometimes a collision causes an argon atom to part with one of its
electrons The released electron is in turn accelerated by the rapidly-changing
magnetic field The process continues until the rate of release of new electrons
in collisions is balanced by the rate of recombination of electrons with argon
ions (atoms that have lost an electron) This produces a lsquofireballrsquo that consists
mostly of argon atoms with a rather small fraction of free electrons and argon
ions The temperature of the plasma is very high of the order of 10000 K The
ICP can be retained in the quartz torch because the flow of gas between the
two outermost tubes keeps the plasma away from the walls of the torch A
second flow of argon (around 1 lmin) is usually introduced between the
central tube and the intermediate tube to keep the plasma away from the end
of the central tube A third flow (again usually around 1 lmin) of gas is
introduced into the central tube of the torch This gas flow passes through the
centre of the plasma where it forms a channel that is cooler than the
Chapter 5 Catalysts preparation and characterization
173
surrounding plasma but still much hotter than a chemical flame Samples to be
analyzed are introduced into this central channel usually as a mist of liquid
formed by passing the liquid sample into a nebulizer As a droplet of nebulised
sample enters the central channel of the ICP it evaporates and any solids that
were dissolved in the liquid vaporize and then break down into atoms At the
temperatures prevailing in the plasma a significant proportion of the atoms of
many chemical elements are ionized each atom losing its most loosely-bound
electron to form a singly charged ion
The ions from the plasma are extracted through a series of cones into a mass
spectrometer usually a quadrupole The ions are separated on the basis of
their mass-to-charge ratio and a detector receives an ion signal proportional to
the concentration
The concentration of a sample can be determined through calibration with
elemental standards ICP-MS also lends itself to quantitative determinations
through Isotope Dilution a single point method based on an isotopically
enriched standard
Experimental ICP measurements were determined by Inductively Coupled
Plasma-Optical Emission Spectrometers (ICP-OES) Varian 700-ES
Fig 59 Instrument Varian Liberty ICP-OES
Chapter 5 Catalysts preparation and characterization
174
Fig 510 scheme of instrument Varian Liberty ICP-OES
5217 XRD
The XRD analysis have been made in collaboration with Perugia University
The obtained materials were characterized by X-ray powder diffraction (XRD
PANalytical XrsquoPert Pro CuKα radiation) operating at 40 kV and 40 mA step scan
1 min_1 and 1 s counting time in the 2ndash40deg range at room temperature
Fig 511 Instrument XRD PANalytical XrsquoPert Pro CuKα radiation
522 Catalysts characterization results The characterization analyses were performed on the fresh and in some cases
on used catalysts ldquoFresh catalystsrdquo indicate the samples as prepared
ldquoActivated catalystsrdquo indicate the samples charged in the FTS reactor and
reduced using the activation procedure and removed from the reactor ldquoUsed
Chapter 5 Catalysts preparation and characterization
175
catalystsrdquo indicate the samples after their use in the Fischer-Tropsch synthesis
reaction
5221 BET characterization results
The BET results are reported in Table 54
Table 54 BET characterization results
CATALYST Specific Surface area
(m2g)
Co-based
HTlc
Co5 1746
Co10 1147
Co15 720
Co35 584
Co
synthesized
with US
CoSiO2 3600
CoAl2O3 1160
CoTiO2 550
Co-RuSiO2 3460
Co-RuAl2O3 1080
Co-RuTiO2 130
Fe-based
Fe30K20Cu375 TR 160
Fe30K20Cu375-MW1 180
Fe30K20Cu375-MW2 224
Fe30K20Cu375-US1 201
Fe30K20Cu375-US2 210
MW1= Catalyst put it into a kitchen MW and processed in powder MW2= Catalyst put it into MW and suspended in hexane US1= Catalyst suspended in aqueous solution in air atmosphere for 05 h US2= Catalyst sonicated and suspended in hexane in Argon atmosphere for 3h
The composition and specific surface area (SSA) of the HTlc are reported
in Table 54 Note that the SSA decreases with the increase of the
amount of cobalt The relatively large dimensions and high crystallinity
of particles reflect a low specific surface area [28] The surface area of
Co15 and Co35 after the reduction procedure was determined by BET
Chapter 5 Catalysts preparation and characterization
176
method The values obtained are 734 m2 g-1 for the sample Co15 and
783 m2 g-1 for the sample Co35 both higher than the untreated
materials
For the Co and Co-Ru based catalysts synthesized with the help of
ultrasound it is clear how the addition of the promoter show a
diminution of the SSA in every case (CoSiO2 3600 higher than the co-
respective Co-RuSiO2 with 3460 550 and 130 for Co and Co-RuTiO2
and 1160 and 1080 for Co and Co-RuAl2O3) The SiO2 acts as the best
support even in presence of the promoter The TiO2 tends to keep lower
the SSA of the catalyst and the Al2O3 represents an intermediate way of
the supports used in this group of catalysts
The surface area of catalysts is influenced by the method of synthesis
as shown in Table 55 and in Fig 512 Fe-based catalysts treated with
MW and US have higher values of SSA than the traditional ones the
effect of MW and US on SSA increases increasing the US or MW
emitting power
According to [1] The samples sonicated in argon (US2) present the
highest SSA indicating that the US effects in argon atmosphere are
more remarkable The use of this gas enhances cavitation effects
because increases the temperatures of the collapsing bubbles
generated by US [29] The change of catalysts morphology due to US
treatment (SEM analyses) could explain the increase of SSA in these
samples Catalysts prepared by MW show a higher SSA than the
traditional ones 180 and 224 m2 g-1 for the samples Fe30-MW1 and
Fe30-MW2 respectively with a similar increase of about 25 respect
the traditional prepared sample Moreover the surface area of these
Chapter 5 Catalysts preparation and characterization
177
samples seems not to be dependent on the power of the MW
treatment
Fig 512 Fe30K20Cu375 surface area vs different methods of synthesis
5222 TPR characterization results
Co-based catalysts HTLc
As discussed previously the active phase in the FTS is the metallic cobalt while
the HTlc materials contain Co(II) ions randomly dispersed inside the brucitic
layers Therefore in order to have an active catalyst a reduction procedure is
required to form the cobalt particles TPR analyses were performed to study
the reduction process and select the best conditions for the catalyst activation
Fig 513 shows the TPR profile of the samples Co5 Co15 Co35 while Table 55
reports the reduction temperature and the percentage of reduced Co All the
profiles exhibit two regions of reduction the first at lower temperatures
(below 400degC) which is due to the reduction of Co3O4 while the second peak
above 700 degC indicates the presence of hardly reducible species These species
are probably spinel-type mixed oxides formed during the thermal treatment
TPR profiles of CoOx mixed oxides is well described in the literature [30-36]
The reduction profile of Co3O4 in the low temperature region consists in two
peaks corresponding to the reduction of Co3+ to Co2+ and Co2+ to Co0
Chapter 5 Catalysts preparation and characterization
178
According to Alvarez et al [37] these two peaks are well separated for samples
with small particle size while an intermediate particle size causes the
overlapping of the two reduction steps resulting in a complete reduction with
only one maximum at an intermediate temperature (328 degC) The TPR profiles
of our HTlc (Fig 513) are consistent with the latter case Based on the TPR
results (Table 55) the tested catalysts were activated at 350degC for 4 hours
under hydrogen atmosphere in order to reduce the Co ions to metallic Co
Fig 513 TPR profile of the fresh samples Co5 Co10 Co15 Co35 The activation
temperature used in the FTS reactor before the catalytic test is indicated with the
dashed line
Chapter 5 Catalysts preparation and characterization
179
Note that the sample Co15 exhibit the lowest reduction temperature that is
significantly lower than the activation temperature adopted in the FT process
(350degC) A low reduction temperature may favour the presence of catalyst in its
reduced state during the catalytic process The of reduced Co evaluated by
TPR is generally high However these values strongly depend on reduction
conditions (pressure temperature ramp gas flow etc) that are different from
those used in the FT reactor as detailed in the experimental section
Table 55 Reduction temperature and of cobalt reduction of the fresh samples Co5
Co15 Co35
Sample TPR
Tmax (degC) Co Red
Co5 328 58
Co15 278 54
Co35 295 83
Co and Co-Ru catalysts synthesized with US
Table 56 shows the TPR profiles of the samples CoAl2O3 CoSiO2 CoTiO2
and Co-RuAl2O3 Co-Ru SiO2 Co-Ru TiO2
Chapter 5 Catalysts preparation and characterization
180
Table 56 TPR diagrams and values summary for Co and Co-Ru catalysts with US
Catalyst TPR Profile
CoAl2O3
Co SiO2
CoTiO2
Co-RuSiO2
Co-RuAl2O3
Co-RuTiO2
Iron catalysts
Chapter 5 Catalysts preparation and characterization
181
For the supported iron based catalysts three stage of phase transformation
could be identified starting from oxidised form of iron hematite (Fe2O3) to
magnetite (Fe3O4) magnetite to metallic iron (-Fe) [39] It is known [39-40]
that copper promotes the reduction to hematite to magnetite and also the
reduction of magnetite to -Fe to a lesser extent but it needs to be very well
mixed with iron to provide the most favourable promoter effect on the
hematite rarr magnetite phase transformation For what concerns the support
(silica) Jin and Datye [38] observed that the most important effect of silica is
an improvement in the thermal stability of the catalysts in fact the silica
support is very effective at inhibiting the sintering of the iron catalyst
The results of TPR characterization for iron catalysts are reported in Table 57
The number the position and the shape of the peaks agree with literature [38]
In many cases the TPR peaks corresponding to transformations of CuO rarr Cu
and Fe2O3 rarr Fe3O4 were found to overlap and this is the first peaks at low
temperature The second broad peak at higher temperature on the TPR profile
corresponds to the phase transformation of Fe3O4 rarr -Fe The large peak
width for this last transformation indicates this is slow process
TPR analyses show that the metal reduction starts at about 230degC for promoted
catalysts According to Pirola [2] it is clear therefore the role of Cu in the
improvement of iron oxide phases reduction as well known in literature a
suggested mechanism for this promotion effect is the migration of atomic
hydrogen from reduced Cu sites to the iron oxide [38 40]
Therefore the different preparation methods do not influence the peaks
temperature of the reduction steps of the catalytic samples in any case
Chapter 5 Catalysts preparation and characterization
182
Table 57 TPR diagrams and values summary for Fe30K20Cu375 catalysts with different
methods of synthesis
Catalysts Diagrams
Fe30K2Cu375SiO2
Fe30K2Cu375SiO2
(MW2)
Fe30K2Cu375SiO2
(MW1)
Fe30K20Cu375 SiO2 (US1)
305133 467463
800
Temperature degC0 200 400 600 800
800
Sig
na
l (
mV
)
0
200
400
600
800
5223 SEM ndash TEM characterization results
Chapter 5 Catalysts preparation and characterization
183
SEM analyses are reported in Fig 514 (for HTlc) Fig 515 (for Co and Co-Ru
with US) and in Fig 516 (for Fe catalysts)
Cobalt Catalysts
o HTlc
The morphology of the synthesized HTlc was investigated by SEM and TEM
Images of Co15 and Co35 selected as representative samples (Fig 514 a-d)
show that they are constituted by homogeneous aggregates of hexagonal and
platy particles of few hundreds nanometers of thickness and with a
dimensional range between 2-5 μm In TEM micrographs the hexagonal
morphology of HTlc microcrystals is clearer The relatively large dimensions and
high crystallinity of particles reflect a low specific surface area in the range of
6-18 m2g-1 (Table 54) Composition maps of Co15 (Fig 515) obtained with
coupled SEM-EDS analysis highlight the homogeneous Co Zn and Al dispersion
over the entire analyzed spot area without creating single-metal domains
indicating good metal distributions in the samples Similar dispersion
characteristics were obtained for all the samples studied although not
reported here for the sake of brevity
Fig5 14 SEM (left) and TEM (right) images of fresh samples Co15 (ab) and Co35 (cd)
Chapter 5 Catalysts preparation and characterization
184
Fig5 15 SEM image of fresh sample Co15 and the corresponding EDS images of the
metals Al (red) Co (white) and Zn (pink)
SEM and TEM images of two activated samples are reported in Fig 16a-d The
results indicate that the material keeps the original morphology with hexagonal
crystals of micrometric dimensions At higher magnification (TEM images) the
segregation of dense particles homogeneously distributed on the surface and
having dimensions of about 8 nm probably due to metallic Co was evident
[41]
Fig 516 SEM (left) and TEM (right) images of activated Co15 (ab) and Co35 (cd)
SEM images of Co5 Co15 and Co35 after the catalytic run at 260degC are shown
in Fig 517 Samples containing Zn (Co5 and Co15) reveal the presence of a
Chapter 5 Catalysts preparation and characterization
185
nanometric phase crystallized on the catalyst surfaces The absence of this
nanometric phase on Co35 surface (which does not contain Zn) may indicate
the presence of ZnO according to the XRD pattern (it will be show later)
Fig517 SEM images of Co5 (ab) Co15 (cd) Co35 (ef) after catalytic run at
260degC and 20 bar and at different magnifications
o Co and Co-Ru synthesized with US The Fig 518 show the SEM
analyses of the samples with and without the presence of Ru
The chemical effect of US arises from acoustic cavitation ie the
formation growth and implosive collapse of bubbles in a liquid
Some of the interesting features resulting from the application
of sonication as a synthetic method are the nanoparticles
Chapter 5 Catalysts preparation and characterization
186
preparation showing a more uniform size distribution higher
surface area and a more controlled phase composition
(Fig518)
Fig 518 SEM analyses for Co based catalysts with US Magnification 2000X
Iron Catalysts
SEM analyses are essential to evaluate the morphology of catalysts with high
loading of iron and to control the metal dispersion The iron covers the surface
of silica in a progressive level with its increase and it is well distributed in the
more loaded catalyst too [40]
Chapter 5 Catalysts preparation and characterization
187
The aggregates of iron with spherical shape are regularly distributed on the
support In the case of the catalysts prepared with the step of ultrasound it
can be seen an uniform layer of iron on SiO2 The spherical shape aggregates
are substituted by this iron layer The catalyst morphology and the metal
dispersion are similar for the two US samples [43]
SEM analyses (Fig 519) have been the key to both evaluate the morphology of
all the prepared catalysts and observe their metal distribution (using EDX
analysis) Notwithstanding this general trend both the morphology and the
shape of iron aggregates strongly depend on preparation method In Fig 519
SEM analysis of samples through different preparation methods are reported
In the traditional prepared sample (Fig 519a) it is possible to observe Fe
spherical shape aggregates on the bare silica surface Iron is present only in
these particles and coverage of the support is not complete The same
morphology is present in the MW prepared sample (Fig 519b) On the
contrary on US prepared ones (Fig 519c (air) and 519d (argon)) there is a
uniform layer of iron on SiO2 The support in fact is not easily visible due to its
complete coverage as confirmed by SEMndashEDX analyses The spherical shape
aggregates are substituted by this iron layer both the catalyst morphology and
the metal dispersion are similar for the two US samples but completely
different with both the traditional and the MW ones
It is even more interesting the comparison between samples prepared by
different sonication time for example Fe30-US2 (Fig 519c) and Fe30-US1 (Fig
519d) when the US treatment is performed for 05 h the surface seems to be
covered by Fe small leafs that are completely faded when sonication is
prolonged for 3 h and in their place only crashed Fe clusters are present [1]
Chapter 5 Catalysts preparation and characterization
188
a) Traditional b) MW2
c) US1 d) US2
Fig 519 SEM analyses for iron catalysts Magnification 2000X
5224 XRD and micro-RAMAN characterization results
Cobalt Catalysts
o For the HTlc the XRD and micro-RAMAN analyses Figure 520
shows the XRD patterns of the samples listed in Table 51 The
interlayer distance of 89 Aring determined from the first XRD
reflection is compatible with the presence of nitrate between
the sheets [43]
Chapter 5 Catalysts preparation and characterization
189
Fig 520 XRD pattern of the fresh samples (a) Co5 (b) Co10 (c) Co15 and (d) Co35
Activated HTlc were first characterized by XRD As an example the XRD pattern
of activated Co15 is reported in Fig 521 The pattern shows the presence of
very poorly crystalline ZnO and a spinel phase such as Co3O4 CoAl2O4 andor
ZnAl2O4 (note that mixed-oxide spinel phases show very similar XRD patterns
irrespective of their composition) Moreover the reflection at 43deg 2has been
assigned to a CoO phase with very low crystallinity and no metal aggregation is
observed The sample after the reduction treatment does not show metallic Co
phases indicating the presence of active metal atoms homogeneously
dispersed at the nanometer level [44] According to Jong et al [45] and Den
Breejenet et al [46] cobalt-based catalysts need large particle size of the active
species to create optimal domains of active sites because the activity drops for
particles smaller than 6 nm
Chapter 5 Catalysts preparation and characterization
190
Fig 521 XRD pattern of activated Co15 ZnO Co3O4 CoAl2O4 ZnAl2O4 sect CoO
In order to better understand the stability of the materials XRD patterns of
sample Co15 after the catalytic tests at two different temperatures (235degC and
260degC) were collected (Fig 522) At the lower temperature (Fig 522 a) the
pattern is close to that recorded just after the reduction process (Fig 521)
Therefore we can hypothesize that the catalyst does not change as a
consequence of the FTS process On the other hand the XRD pattern of the
catalyst recovered after the reaction at 260degC (Fig 522b) shows more
crystalline ZnO and spinel phase and the strong reduction of the peak assigned
to CoO This may indicate that during the FTS process at high temperatures
cobalt ions crystallized into a spinel phase
Chapter 5 Catalysts preparation and characterization
191
Fig522 XRD pattern of used Co15 after catalytic runs a) at 235degC and
20 bar and b) at 260degC and 20 bar ZnO Co3O4 CoAl2O4 ZnAl2O4 sect
CoO
Iron catalysts
The XRD and micro-RAMAN analyses were made to identify the iron phase
after the calcination treatments A Raman spectrum (Fig 523a) and an XRD
pattern (Fig 523b) for Fe30K2Cu375SiO2 are reported
Chapter 5 Catalysts preparation and characterization
192
Fig 523 a) Micro-Raman analysis and b) XRD for the Fe30K2Cu375SiO2 catalyst
Comparing these results with the tables reported in literature [47-48] for the
assignment of the peaks it is possible to conclude that the iron after calcination
is present as hematite Fe2O3 as expected and as reported in literature [39]
5255 ICP characterization results ICP analysis was made to verify the catalysts composition
Cobalt based catalyst
o HTlc In Table 58 the results are reported
Table 58 ICP characterization results for Co catalysts (HTlc)
HTlc
Atomic percentage in solution Basic Formula
Zn Co Al
Co5 55 15 30 [Zn057
Co010
Al033
(OH)2](NO
3)033
middot05 H2O
Co10 45 25 30 [Zn045
Co021
Al034
(OH)2](NO
3)034
middot05 H2O
Co15 35 35 30 [Zn039
Co032
Al029
(OH)2](NO
3)029
middot05 H2O
Co35 - 70 30 [Co067
Al033
(OH)2](NO
3)033
middot05H2O
Chapter 5 Catalysts preparation and characterization
193
o Co and Co-Ru with US In Table 59 the results are reported
Table 59 ICP characterization results for Co catalysts
Sample Co wt Ru wt
Co10 80 -
Co10Ru01 80 008
In general these results indicate the composition of catalysts is in good
agreement with the theoretical values
Iron based catalysts In Table 510 the results are reported
Table 510 ICP characterization results for Fe catalysts
Sample Fe wt K wt Cu wt
Fe30K20Cu375 314 19 40
5226 XRD and micro-RAMAN characterization results
Cobalt Catalysts
o For the HTlc the XRD and micro-RAMAN analyses
In order to better understand the behaviour of the materials after activation
FT-IR spectra of the sample Co15 (as a representative sample) calcined and
activated and Co3O4 have been registered (Fig 526) The spectrum of Co15
showed the typical absorption bands of the nitrate anion at 1377 cm-1 present
in the interlayer region of HTlc After calcination this band disappeared due to
nitrate degradation and the spectrum presented the typical absorptions of
Co3O4 spinel phase at 667 cm-1 and 566 cm-1 The activation process leads to
the formation of a material with very wide bands attributed to the Co3O4
phase
Chapter 5 Catalysts preparation and characterization
194
Fig 524 FT-IR spectra of the fresh and activated Co15 and of the reference Co3O4
References
[1] C Pirola C L Bianchi A Di Michele P Diodati D C Boffito V Ragaini Ultrasonic Sonochem 17610-616 (2010) [2] C Pirola PhD 2007-2008 Novel supported iron based Fischer-Tropsch catalysts Preparation characterization and applications [3] GPVaan Deer Laan AACMBeenackers CatalRev-SciEng41 (3amp4) (1999) 255 [4] YJin AKDatye Journal of catalysis 196 (2000) 8 [5] Costantino U Marmottini F Nocchetti M Vivani R Eur J Inorg Chem 1998 101439 -1446 [6] C Pirola CL Bianchi A Di Michele P Diodati S Vitali V Ragaini Catal Lett 131 (2009)294-304
Chapter 5 Catalysts preparation and characterization
195
[7] G Biffi Gentili M Linari I Longo A Ricci A IEEE Transactions on microwave theory and techniques 57 (9-2009) 2268-2275 [8] BToukoniitty JPMikkola DYuMurzin TSalmi Applied Catalysis A General 279 (2005) 1 [9] KSSuslick Sonocatalysis Handbook of Heterogeneous Catalysis VCH Verlagsgesellschaft mbH Weinheim Germany (1997) 1350 [10] BToukoniitty JPMikkola DYuMurzin TSalmi Applied Catalysis A General 279 (2005) 1 [11] WBonrath Ultrasonics Sonochemistry 12 (2005) 103 [12] CLBianchi VRagaini Catalysis Letters 95 (2004) 61 [13] CLBianchi FMartini VRagaini Ultrasonics Sonochemistry 82 (2001) 131 [14] Zhao R Goodwin JG Jr Jothimurugesan K Gangwal SK Spivey JJ (2001) Ind Eng Chem Res 401065 10 [15] Yang Y Xiang HW Tian L Wang H Zhang CH Zhong B Li YW (2005) Appl Catal A 284105 [16] Suo Haiyun Zhang Chenghua Wu Baoshan Xu Jian Yang Yong Xiang Hongwei Li Yongwang Cat Today Volume 183-1 (2012) 88ndash95 [17] Donatti DA Ruiz AI Vollet DR (2002) Ultrason Sonochem 9133 [18] Yang Y Xiang HW Tian L Wang H Zhang CH Zhong B Li YW (2005) Appl Catal A 284105 [19] Fadoni M and Lucarelli University of Milan and CE Instruments (Thermoques SpA) [20] F M NELSEN and Ff EGGERTSEN Shell Development Co Emeryville Calif ANALYTICAL CHEMISTRY VOL 30 NO 8 AUGUST 1958 1387-1390 [21] 11 S Brunauer P H Emmett and E Teller J Am Chem Soc 60 (1938) 309 [22] JHaber JHBlock and BDelmon Pureampappl Chem 67 Nos 89 (1995) 1257 [23] SDRobertson BDMcNicol JHDe Baas SCKloet JWJenkins JCatal 37 (1975) 424 [24] Von Ardenne Manfred Das Elektronen-Rastermikroskop Theoretische Grundlagen Zeitschrift fur Physik 108 (1938) 553 [25] Von Ardenne Manfred Das Elektronen-Rastermikroskop Praktische Ausfuumlhrung Z Techn Phys 108 (1938) 407 [26] Ludwig Reimer Helmut Kohl Springer Series in Optical Sciences 36 fifth edition 2008 Transmission Electron Microscopy Physics of Image Formation [27] Gardiner DJ (1989) Practical Raman spectroscopy Springer-Verlag ISBN 978-0387502540 [28] A Di Fronzo C Pirola A Comazzi F Galli CL Bianchi A Di Michele R Vivani M Nocchetti M Bastianini DC Boffito Fuel 119 (2014) 62-69
Chapter 5 Catalysts preparation and characterization
196
[29] TJ Mason JP Lorimer Sonochemistry Ellis Horwood Chichester 1988 p 58 [30] Bianchi CL Catal Lett 2001 76(3ndash4)155-159 [31] Lin HY Chen YW Li C Thermochim Acta 2003 40061ndash67 [32] Lin HY Chen YW Mater Chem Phys 2004 85171ndash175 [33] Sexton BA Hughes AE Turney TW J Catal 1986 97(2)390ndash406 [34] Kumar N Payzant EA Jothimurugesan K Spivey JJ Phys Chem Chem Phys 2011 1314735ndash14741 [35] Tsakoumis NE Dehghan R Johnsend RE Voronov A Van Beek W Walmsley JC Borg Oslash Rytter E Chen D Roslashnning M Holmen A Catal Today 2013 20586ndash93 [36] Tsakoumis NE Roslashnning M Borg Oslash Rytter E Holmen A Catal Today 2010 154162ndash182 [37] Alvarez A Ivanova S Centeno MA Odriozola JA Appl Catal A 2012 431-4329-17 [38] YJin AKDatye Journal of catalysis 196 (2000) 8 20 [39] DBBukur KOkabe MPRosynek CPWang DJRao KRPM and GPHuffman JCatal 155 (1995)353 [40] YYang HXiang YXu LBai YLi ApplCatalA 266 (2004) 181 [41] 32 Rudolf C Dragoi B Ungureanu A Chirieac A Royer S Nastro A Dumitriu E Catal Sci Technol DOI 1011039C3CY00611E [42] C Pirola CL Bianchi A Di Michele S Vitali V Ragaini Catal Comm 10 823 (2009) [43] Iyi N Fujii K Okamoto K Sasaki T Appl Clay Sci 2007 35218-227 [44] CL Bianchi C Pirola DC Boffito A Di Fronzo A Di Michele R Vivani M
Nocchetti M Bastianini S Gatto Co-Zn-Al based hydrotalcites as catalysts for
Fischer-Tropsch process Proceeding of DGMK Conference 2011
CatalysisInnovative Applications in Petrochemistry and Refining 4-6 October
2011 Dresden Germany ISBN 978-3-941721-17-3
[45] Leendert G Bitter JH Kuipers HPCE Oosterbeek H Holewijn JE Xu X
Kapteijn F Jos van Dillen A Krijn P J Am Chem Soc 2006 1283956-3964
[46] 31 Den Breejen JP Radstake PB Bezemer GL Bitter JH Froslashseth V Holmen A Krijn P J Am Chem Soc 2009 1317197-7203 [47] Thickett and Oldyha JThermAnalCal 80 (2005) [48] MALegodi Dde WaalDyes and Pigments 74 (2007) 161
197
Chapter 6 High Fe Loaded Supported Catalysts for Biosyngas Fischer ndash Tropsch Conversion experimental and simulation results 6 Development of the kinetic model One of the objectives of this research work was the development of a kinetic
model for the synthesis of FT in collaboration with the Politecnico di Milano
This model based on experimental data obtained in the pilot plant using iron
based catalyst (Fe30K20Cu375) at different temperatures and different H2CO
ratios allows to obtain and simulate the performance of these catalysts at
temperatures and ratios of incoming flows feeding different
The modeling work has not been limited to the laboratory scale since it is
possible to predict the trend of the reaction kinetics using these types of
catalysts in reactors with much greater volumes and integrated in an entire
industrial process such as the use of biosyngas for FT synthesis obtained from
biomass
61 Regression of kinetic constants After obtaining the experimental data it is necessary to regress them With the
regression we could obtain the respective kinetic constants
The model is based on the fact that both reactions the FT reactions and WGS
are active therefore we will need to regress the rate constants of both
reactions which we call kFT (kinetic constant of the FT reaction) and kWGS
(kinetic constant of the WGS reaction)
The equations that express the reaction rate of the two reactions are [1] For the FT reactions
Chapter 6 High Fe Loaded Supported Catalysts for Biosyngas Fischer ndash Tropsch Conversion experimental and simulation results
198
For the WGS reaction
From these equations we note that the reaction rate in both cases is a
function of the partial pressures of the reactants (CO and H2) of the products
(H2O and CO2) of the constants (aFTWGS e bFTWGS) and the equilibrium constant
Kp expressed as
From the regression of the reaction rate constants is obtained the K0i These
values are correlated to the kFTWGS through the equation
The parameter values of the previous reports were obtained with a regression
using the MATLAB software based on the method of least squares from the
experimental data using the original coefficients K0FT k0WGS aFT aWGS bFT bWGS
as values of the first iteration [2] The software allows the regression of k0i
establishing an objective function that must be minimized as much as possible
(10-6 tolerance basis of MATLAB)
There was no regression of the activation energy of the two reactions but kept
constant as reported in literature [2]
The probability of growth of the hydrocarbon chain is instead given by the
correlation developed by Lox and Froment [3-4] or iron based catalysts
Chapter 6 High Fe Loaded Supported Catalysts for Biosyngas Fischer ndash Tropsch Conversion experimental and simulation results
199
For the regression of the data there were not taken into account the energy
balances because we consider an isothermal catalytic bed The drop pressure is
neglected since it can be assumed that in the whole catalytic bed the pressure
is constant at 20 bar and the efficiency of the catalyst was considered unitary
On the contrary these aspects must be taken into account if we are working
with industrial volumes
62 Mass Balance In the kinetic model have been fully taken into account (even on lab-scale) the
mass balances shown in the equations below
Mass balance equations in the gas phase
Where ε degree of vacuum
a catalyst surface per unit volume
(Pis-Pib) pressure difference of the reactants between the bulk and the
solidrsquos surface
ν stoichiometric coefficient
r reaction in homogeneous phase
Chapter 6 High Fe Loaded Supported Catalysts for Biosyngas Fischer ndash Tropsch Conversion experimental and simulation results
200
If it does not consider gas-phase reactions but only on the surface of the
catalyst
Mass balance on the solid
Where ρ density of the catalyst
Mi molecular weight
It gets
Where is the total mass flow and is the mass fraction of i component
63 Energy Balance As previously mentioned in the modeling of laboratory scale is not considered
any heat balance in the catalytic bed because it is considered as isothermal
one however in the case of modeling a reactor in industrial volumes the
energy balance will be addressed in this way
Energy balance equation in the gas phase for a plug-flow reactor (PFR)
Chapter 6 High Fe Loaded Supported Catalysts for Biosyngas Fischer ndash Tropsch Conversion experimental and simulation results
201
Where Cpi Specific heat of the i species
h Laminar coefficient
(Ts-T) the temperature difference between the surface and the bulk
∆Homk entalphy of the K-esimo reaction in gas phase
U overall heat transfer coefficient
If there are no gas-phase reactions
Energy balance on the solid
64 Pressure variation
As for the energy balance also the P has not been taken into account in the
modeling however in the case of simulations of kinetic tests over PFR reactors
in industrial volumes it will be necessary to take them into account because
before and after the catalytic bed there will be a difference of pressure
The equation that allows to calculate the pressure drop in a fixed bed reactor is
the Ergunrsquos equation
Chapter 6 High Fe Loaded Supported Catalysts for Biosyngas Fischer ndash Tropsch Conversion experimental and simulation results
202
With
Where u velocity surface
Re Reynolds number
Dp diffusion coefficient
Ai inlet area of the tube
65 Catalyst Efficiency The efficiency of the catalyst considered unitary to simplify the model on
laboratory scale can not be considered as such in real systems and especially
of large reactors where the problems of diffusion of the reactants on the
catalyst surface are no longer negligible
The efficiency of the catalyst is expressed with the equation
Where T Bulk temperature
Ts surface temperature
Pi pressure of i species in the bulk
Pis pressure of the i species in the surface
Vp volume of the particle catalyst
Chapter 6 High Fe Loaded Supported Catalysts for Biosyngas Fischer ndash Tropsch Conversion experimental and simulation results
203
References
[1] WH Zimmerman DB Bukur Reaction kinetics over iron catalysts used for
Fischer-Tropsch synthesis The Canadian journal of chemical engineering (68)
1990 p 292-301
[2] Ahmad Rafiee Optimal design issues of a gas-to-liquid process Thesis for
the degree of Philosophy Doctor Norwegian University of Science and
Technology Faculty of Natural Sciences and Technology Chemical Engineering
Department2012
[3] ES Lox GF Froment Kinetics of the Fischer-Tropsch reaction on a
precipitated promoted iron catalyst 2 Kinetic modeling Ind Eng Chem Res
(32) 1993 p71-82
[4] ES Lox GF Froment Kinetics of the Fischer-Tropsch reaction on a
precipitated promoted iron catalyst 2 Kinetic modeling Ind Eng Chem Res
(32) 1993 p 61-70
204
Chapter 7 Fischer Tropsch runs results and discussion
In this chapter the experimental results concerning the FT runs will be
presented in term of CO conversion and of products selectivity toward CO2
CH4 light hydrocarbons (lt C7) and heavy hydrocarbons (gt C7) To join all these
data the parameter ldquoyield C2+rdquo will be reported too This parameter is defined
in the following equation
Yield C2+ = CO conversion x (selectivity ltC7 +selectivity gtC7) (1)
then the selectivity to CO2 and CH4 (undelivered products) is not taken into
account by this parameter The data concerning all the products distribution
ie selectivity for each carbon atom number have been collected in this PhDrsquos
research work for all the catalysts and all the experimental conditions but for
practical space of reasons they are not here reported
The results could be divided into two groups The experimental runs with two
kind of catalytical systems it means cobalt based catalysts and iron based
catalyst (kinetic runs) and the development of a kinetic model for the sample
Fe30K2Cu375 The selection is related to the better performance in terms of
stability
More in detail
Kinetic Runs
Cobalt based catalysts
HTlc The activated samples were tested at different temperatures in
the FTS plant following the procedure reported in the experimental
section In Fig 71 the CO conversion vs the reaction temperature is
Chapter 7 Fischer Tropsch runs results and discussion
205
reported for all the catalysts while the products selectivity is displayed in
Table 71
Fig 71 molar CO conversion to Co5 () Co10 () Co15 (diams) Co35 () obtained at
different reactor temperatures after 24 hours of reaction
As expected for each catalyst the activity is strongly influenced by the reaction
temperature the higher the temperature the higher the CO conversion but
also the selectivity towards CO2 CH4 and light hydrocarbons is favored by a
higher temperature The CO conversion is similar for Co5 and Co10 while it is
higher for the two samples with a larger amount of cobalt ie Co15 and Co35
In particular Co15 exhibits the highest CO conversion at all the selected
temperatures In FTS it is fundamental to obtain low quantities of CH4 and CO2
(undesired products) to favor the formation of higher hydrocarbons For this
reason temperatures in the 220-235degC range are more suitable than the higher
ones
Moreover Table 71 shows that Co15 exhibits the highest CO conversion and
the highest C2+ total yield (without considering CH4 and CO2 see note in Table
71) also at the lowest temperature (220degC) which is so important from an
economical point of view This result confirms that Co15 is the best performing
catalyst obtained in this part of the study
Chapter 7 Fischer Tropsch runs results and discussion
206
Table 71 FTS products selectivity at different reactor temperatures
Sample Temperature
(degC)
Products Selectivity C2+
Yield CO2 CH4 leC7 gtC7
Co5 220 03 29 33 934 165
235 03 59 104 834 194
245 11 85 127 776 224
260 19 141 160 679 300
Co10 220 32 26 98 844 155
235 38 49 143 769 178
245 33 60 154 753 218
260 81 163 413 343 262
Co15 220 14 101 17 705 467
235 81 262 473 185 498
250 178 177 443 202 491
Co35 220 14 39 103 844 250
235 18 96 234 651 395
245 51 257 656 105 473
leC7 all the hydrocarbons in the range C2-C7 gtC7 all the hydrocarbons greater than C7 Product lsquolsquoirdquo selectivity = (moles C in product i) (converted moles C) x 100 C2+ yield = CO conversion x (selectivity leC7 + selectivity gtC7) x10-2
The obtained data suggest the possibility of using synthetic hydrotalcites as Co-
based catalysts for FTS and pursuing subsequent studies on the same subject
Similar trends were obtained in ldquoUnit 2rdquo at lower temperatures and lower
amount of cobalt (Co10 and Co15) (Table 72)
Chapter 7 Fischer Tropsch runs results and discussion
207
The stability of these catalysts in the operating conditions adopted in the
catalytic tests (P le 20 MPa and T le 350degC) was evaluated by comparative
analysis between fresh samples and samples discharged from the reactor
maintained at high pressures and temperatures
Table 72 FTS products selectivities at different reactor temperatures Two different
pilot plants with the same flow sheet
Sample Temp
(degC)
CO
Conv
()
Products Selectivity C2+
Yield CO2 CH4 leC7 gtC7
Co10
(Unit 1)
220 170 32 26 98 844 155
235 207 38 49 143 769 178
245 248 33 60 154 753 218
260 358 81 163 413 343 262
Co10
(Unit 2)
220 147 01 12 53 935 145
235 180 15 32 73 880 171
245 891 140 291 393 176 506
Co35
(Unit 1)
220 264 14 39 103 844 250
235 446 18 96 234 651 395
245 621 51 257 656 105 473
Co35
(Unit 2)
220 473 50 224 296 431 343
235 768 162 205 288 345 485
245 998 154 241 322 282 604
leC7 all the hydrocarbons in the range C2-C7gtC7 all the hydrocarbons greater
than C7Product lsquolsquoirdquo selectivity = (moles C in product i) (converted moles C) x
100 C2+ yield = CO conversion x (selectivity leC7 + selectivity gtC7) x10-2
It is important to highlight that the aim of this work was the evaluation of the
possibility to use HTlc as a new kind of catalyst for the Fischer-Tropsch process
rather than a quantitative comparison with other kinds of traditional FTS
catalysts Moreover a reliable comparison between HTlc and traditional cobalt
Chapter 7 Fischer Tropsch runs results and discussion
208
based FTS catalysts is very difficult due to the different structural and
morphological features (surface area metal dispersion morphological
structure reduction properties porosity and so on) which are involved in the
very complex catalytic systems for the FTS Nevertheless from a qualitative
point of view it is possible to conclude that this new kind of catalytic materials
for FTS process give results fully comparable with those obtained by traditional
supported cobalt As general behaviour it is possible to state that cobalt
catalysts are characterized by high CO conversion high heavy hydrocarbons
selectivity and low light hydrocarbons CH4 and CO2 selectivity The wide
literature concerning traditional Co-based catalysts is rich of different examples
that depending on several operative parameters and preparation procedure
give different FTS results but always following the general trends reported by
the previous papers Some exhaustive examples are shown in a recent review
of Qinghong et al [1] and Muthu et al [2]
Co and Co-Ru
The use of ultrasound (US) might be very efficient to optimize the dispersion of
a so high metal charge as already verified in our laboratory in the past [3-4]
This special type of synthesis should give at the catalyst a particular structure
with a high surface area and a high metal dispersion that improves its activity
towards the synthesis of Fischer-Tropsch In the case of cobalt supported
catalysts a simple ultrasound step has been added in the catalyst preparation
As regard the results presented in table 73 it can be seen how all the samples
resulted active in FTS in particular the bimetallic samples give high CO
conversion with a noteworthy selectivity towards heavy hydrocarbons The
Chapter 7 Fischer Tropsch runs results and discussion
209
support plays a crucial role and in particular TiO2 based samples are the most
active
Moreover Table 73 shows that Co-RuSiO2 exhibits the highest selectivity
towards heavy hydrocarbons and the highest C2+ total yield (without
considering CH4 and CO2 see note in Table 73) This result confirms that Co-
RuSiO2 is the best performing catalyst obtained in this part of the study
Table 73 CO Conversion C2+total yield CH4 CO2 light hydrocarbon and heavy
hydrocarbon selectivity of CoCo-Ru based catalyst at T=255degC
Catalyst
CO
Conv
()
C2+
total
yield
Selectivity ()
CH4 CO2 ltC7 gt C7
CoTiO2 28 23 5 14 10 71
CoSiO2 6 5 19 6 23 52
CoAl2O3 8 6 13 7 19 61
Co-RuTiO2 98 73 18 8 14 60
Co-RuSiO2 94 82 9 4 8 79
Co-RuAl2O3 84 73 11 2 12 75
As we have seen from the BET and TPR analysis the support and the promoter
play a key role in the performance of the catalyst because they are responsible
for the modification of some key parameters such as surface area and the
metal dispersion
Iron based Catalysts
With regard to the treatment with the help of US (see table 74) it can be
concluded that the sonication of an aqueous mixture salts and precursors of
support (US1) is preferable instead of to the calcined catalyst suspended in
Chapter 7 Fischer Tropsch runs results and discussion
210
non-polar solvent such as hexane (US2) With regard to treatment with MW
(see table 74) there were obtained better results in term of CO conversion
with the powder catalyst treated directly in the MW (MW1) while the test
conducted by suspending the catalysts in hexane and then treated in a MW
reactor (MW2) for an hour did not give valid results The best FTS results in
term of C2+ yield (41) has been obtained using MW1 while in tem of CO
conversion (58) using US1 All of them gave FTS results better than the
traditional one Itrsquos evident that the use of US or MW optimizes the catalytic
performance in accord with previous similar results [4]
In agreement with [5] the FTS results show that TEOS as silica source is
favorable for the enhancement of the FTS activity
Table 74 Catalytic Results of Fe30K20Cu375 Different preparation techniques Support
SiO2 Diluting Material α-Al2O3 T=220degC
Preparation CO Conv ()
C2+
Total yield
Selectivity ()
CO2
CH4
lt C7
gt C7
TR 49 32 27 7 22 44
MW1 52 41 17 5 18 60
MW2 32 24 17 8 27 48
US1 58 38 29 6 22 43
US2 36 25 22 9 30 39
Co-precipitation
38 32 2 13 28 57
leC7 all the hydrocarbons in the range C2-C7 gtC7 all the hydrocarbons greater than C7 Product lsquolsquoirdquo selectivity = (moles C in product i) (converted moles C) x 100 C2+ yield = CO conversion x (selectivity leC7 + selectivity gtC7) x10-2
The co-precipitation test was made at T=250degC and TEOS as a support
Iron based Catalysts
Chapter 7 Fischer Tropsch runs results and discussion
211
To work with this part it is important to know the effect of the H2 CO ratio in
the feeding gas The FTS for the production of liquid hydrocarbons from
synthesis gas has become important as the planet faces exhaustion of its
petroleum reserves in the near future The use of coal or biomass to
manufacture synthesis gas is attractive in view of its vast reserves However
synthesis gas manufactured from coal or biomass typically has a low H2CO
ratio (about 07) while the stoichiometry of the reaction requires an H2CO
ratio of about 20 Iron catalysts can make up this deficit with their high WGS
activity [6]
This important characteristic of iron based catalysts is essential for their
applications
Fig 72 show that the activity of catalyst is good enough using also feeding
ratio between 10 and 20
Fig 72 CO conversion or selectivity vs H2CO feeding ratio for Fe30K20Cu375
catalyst at T=250degC
Higher the H2 CO ratio is higher the CO conversion becomes but the heavy
hydrocarbons is the highest for the stoichiometric ratio
In the present work there were made some tests with Fe30K20Cu375 catalyst by
feeding mixtures with a ratio H2CO between 05 and 20 in order to optimize
Chapter 7 Fischer Tropsch runs results and discussion
212
the activity selectivity and the lifetime of this kind of FT catalyst in work
conditions of biosyngas feeding
On the basis of the collected data a rigorous simulation of the FT synthesis
reactor has been developed for different purposes (i) to support the
experimentations and their planning (ii) to predict the reactor yield and
conversion (iii) to optimize the performance of the reactor system with
different operating conditions and (iv) to calculate novel reliable kinetic
parameters based on the experimental data fitting by means of model-based
nonlinear regression techniques To do so the FT reactor is modeled as a
catalytic plug-flow reactor using mass and energy balances and reaction
kinetics for Fe-based catalyst defined by Zimmerman and Bukur as explained in
chapter 6 [7] leading to an ordinary differential equation system with
structured Jacobian Lumping techniques have been used to model heavy
hydrocarbons The system is solved by means of dedicated solvers to handle
stiffness and nonlinearities of heterogeneous reactive systems [8]
Typical H2CO ratio of syngas manufactured from coal or biomass are between
07-12 and the Fig 72 show that the activity of catalyst is good enough using
also feeding ratio between 10 and 20
In the table 75 there is the data concerning the carbon monoxide conversion
() and the selectivity towards undesired products (CO2 and CH4) and lighter
and heavy hydrocarbons of Fe-based catalyst The CO conversion increase with
the increase of the H2CO ratio because of the proximity of the stoichiometric
required of the reaction The selectivities are constant with the variations of
H2CO ratio Instead of that the C2+ yield increase with the variations of H2CO
ratio A comparison at T=250degC show that the best performance in terms of CO
conversion C2+ and selectivity towards heavy hydrocarbons is given by working
with a H2CO ratio of 2 (stoichiometric required of the reaction)
Chapter 7 Fischer Tropsch runs results and discussion
213
These data were used to propose a suitable kinetic model for the FTS using a
math program in collaboration with the Politecnico di Milano Some hypothesis
were taken into account to prepare the kinetic model (FT reactor is modeled as
a catalytic plug-flow reactor using mass and energy balances and reaction
kinetics for Fe-based catalyst defined by Zimmerman and Bukur [7-8] ∆P = 0
isothermic catalytic bed FT reaction and WGS are both active on the catalyst)
The kinetic parameters were calculated and compared with the experimental
data The first results show a good fitness of the experimental data
Table 75 FTS products selectivities at different H2CO ratio and reactor
temperatures of Fe30K2Cu375
Selectivity ()
H2CO T(degC) CO
Conversion ()
C2+ total yield
CO2 CH4 ltC7 gtC7
21 220 85 69 11 8 22 59
21 235 211 175 11 6 20 63
21 250 498 393 16 5 19 60
21 260 567 425 19 6 20 55
151 250 388 299 18 5 17 60
151 260 463 338 22 5 17 56
11 250 23 182 17 4 16 63
11 260 389 272 26 4 16 54
leC7 all the hydrocarbons in the range C2-C7 gtC7 all the hydrocarbons greater than C7 Product lsquolsquoirdquo selectivity = (moles C in product i) (converted moles C) x 100 C2+ yield = CO conversion x (selectivity leC7 + selectivity gtC7) x10-2
In Fig 73 is presented a comparison between the experimental data obtained
in the laboratory and the data obtained using the kinetic model The first two
Chapter 7 Fischer Tropsch runs results and discussion
214
columns represent the conversion of hydrogen and carbon monoxide while in
the other columns are represented the molar fraction of hydrogen carbon
monoxide water methane and lump C2 C3-4 C5-10 C11 + As a first
approximation it can be seen that the kinetic model present a good fitness
regard to the experimental data
Fig 73 Comparison between experimental data and kinetic model
References
[1] Qinghong Z Weiping D Ye W Review Recent advances in understanding the key catalyst factors for Fischer-Tropsch synthesis J Ener Chem 2013 2227ndash38
Chapter 7 Fischer Tropsch runs results and discussion
215
[2] Muthu KG Gary J Wilson DS Burtron HD FischerndashTropsch synthesis Activity of metallic phases of cobalt supported on silica Catal Today 2013 21513ndash 17 [3] CLBianchi VRagaini Catalysis Letters 95 (2004) 61-65 [4] C Pirola C L Bianchi A Di Michele P Diodati D C Boffito V Ragaini Ultrasonic Sonochem 17 (2010) 610 [5] Suo Haiyun Zhang Chenghua Wu Baoshan Xu Jian Yang Yong Xiang Hongwei Li Yongwang A comparative study of FeSiO2 FischerndashTropsch synthesis catalysts using tetraethoxysilane and acidic silica sol as silica sources Catalysis Today Volume 183 Issue 1 20 March 2012 Pages 88ndash95 [6] MDShroff AKDatye Catalysis Letters 37 (1996) 101
[7] WH Zimmerman DB Bukur Can J Chem Eng 68 (1990) 292-301 [8] F Manenti I Dones G Buzzi-Ferraris HA Preisig Ind Eng Chem Res 48 (2009) 9979-9984
216
Chapter 8 Final remarks and Conclusions
New kind of cobalt and iron based catalysts were synthetized and used in the
Fischer-Tropsch synthesis Different methods of synthesis different amounts of
cobalt and different process temperatures were investigated All the catalysts
under study were active in the FTS The catalytic activity of the samples strictly
depends on the temperature as expected
Cobalt based hydrotalcites cobalt and cobalt-ruthenium synthesized with the
help of ultrasound and iron supported catalysts with a high loading of iron (30
wt) have been prepared and characterized and both the preparation
procedure and the working conditions were fully optimized
For each catalytic system it can be summarized the following aspects
Cobalt based catalysts
HTLC In the case of Co-based hydrotalcites CO conversion and process
selectivity towards light and heavy hydrocarbons are closely related to the
cobalt amount in the catalysts but not in a linear way
The reduction behavior under a H2 flow of the Co-based hydrotalcites is
achieved in one step at lower temperature and it is not related to its
morphology but is strictly correlated to the particle size In addition the
relatively large dimensions and high cristallinity of these catalysts favor the
creation of optimal domains of active sites that make them more efficient
The obtained data suggest the possibility of using synthetic hydrotalcite as Co-
based catalysts for FTS and open the possibility for subsequent studies on the
same subject
Chapter 8 Final remarks and Conclusions
217
Future studies may involve the investigation of the effects of various
parameters such as morphologysize of crystallites or the addition of small
amounts of promoters such as Ru in the composition of Co based hydrotalcites
Temperatures in the 220-235degC range are more suitable than the higher ones
Cobalt based bimetallic The catalysts show a low selectivity to methane and
carbon dioxide and formation of higher hydrocarbons The more interesting
results are the highest CO conversion at lower temperatures measured with a
catalysts promoted with a Ru Even the support although it is inert it is very
important because it radically alters the surface area of the catalyst
Iron catalysts The samples appears to be highly dependent on the method of
preparation used The catalysts treated with US and MW seem to show
significant improvements over traditional catalysts and the reason is a more
homogeneous and uniform distribution of Fe in the media
The catalyst Fe30K2Cu375 is active with a H2CO ratio le2
Develop of a kinetic model On the basis of the collected data a rigorous
simulation of the FT synthesis reactor has been developed to support the
experimentations and their planning to predict the reactor yield and
conversion to optimize the performance of the reactor system with different
operating conditions and to calculate novel reliable kinetic parameters based
on the experimental data fitting by means of model-based nonlinear regression
techniques For this lumping techniques have been used to model heavy
hydrocarbons the system is solved by means of dedicated solvers to handle
stiffness and nonlinearities of heterogeneous reactive systems and finally the
Chapter 8 Final remarks and Conclusions
218
model made in collaboration with the Politecnico di Milano show a good fit of
the experimental data
Concerning the results obtained in this PhDrsquos research work it is clear that all
the samples tested have given good results The Co-based catalysts
synthesized using the traditional impregnation method with an additional step
of ultrasound have given good results in comparison with the results in the
current literature The hydrotalcites have given lower results if compared with
the Co-based catalysts synthesized with the help of ultrasound but they have
opened an alternative and innovative way that has never been tried before
Iron based catalysts allow a direct conversion of the biosyngas and the results
have shown how our catalysts are active with an H2CO ratio le2 Furthermore
trends have been modeled with success In conclusion the PhDrsquos research
work has given a serious contribution to the current state of the art on
catalysis in the Fischer-Tropsch synthesis either with cobalt and iron based
catalysts With cobalt has been optimized a traditional synthesis procedure
with the introduction of ultrasound furthermore has been created a
completely new kind of catalyst With iron has continued an optimizationrsquos
work of iron supported with high loading metals so to develop a suitable
kinetic model able to work not only with syngas but also with biosyngas
List of Publications and Communications
219
List of publications
Publications
C Pirola DC Boffito G Carvoli A Di Fronzo V Ragaini and CL
Bianchi (2011) Soybean Oil De-Acidification as a First Step Towards
Biodiesel Production Recent Trends for Enhancing the Diversity and
Quality of Soybean Products Prof Dora Krezhova (Ed) ISBN 978-953-
307-533-4 InTech DOI 10577217812 Available from
httpwwwintechopencombooksrecent-trends-for-enhancing-the-
diversity-and-quality-of-soybean-productssoybean-oil-de-acidification-
as-a-first-step-towards-biodiesel-production
CL Bianchi C Pirola DC Boffito A Di Fronzo G Carvoli D Barnab
R Bucchi and A Rispoli (2011) Non Edible Oils Raw Materials for
Sustainable Biodiesel Biodiesel - Feedstocks and Processing
Technologies Dr Margarita Stoytcheva (Ed) ISBN 978-953-307-713-0
InTech DOI 10577225397 Available from
httpwwwintechopencombooksbiodiesel-feedstocks-and-
processing-technologiesnon-edible-oils-raw-materials-for-sustainable-
biodiesel
A Di Fronzo C Pirola A Comazzi F Galli CL Bianchi A Di Michele R
Vivani M Nocchetti M Bastianini DC Boffito Co-based Hydrotalcites
as new Catalysts for the Fischer-Tropsch Synthesis Process Fuel 119
(2014) 62ndash69
Publications in Conference Proceedings (peer reviewed)
CL Bianchi C Pirola DC Boffito A Di Fronzo A Di Michele R Vivani
M Nocchetti M Bastianini S Gatto Co-Zn-Al based hydrotalcites as
catalysts for Fischer-Tropsch process Proceeding of DGMK Conference
2011 Catalysis Innovative Applications in Petrochemistry and Refining
4-6 October 2011 Dresden Germany ISBN 978-3-941721-17-3
C Pirola A Di Fronzo DC Boffito CL Bianchi A Di Michele
Biosyngas Fischer ndash Tropsch Conversion by High Fe Loaded Supported
List of Publications and Communications
220
Catalysts Prepared with ultrasound and Microwave Proceeding of
DGMK Conference 2012 Reducing Carbon Footprint of Fuels and
Petrochemicals October 8 ndash 10 2012 Berlin Germany ISBN 978-3-
941721-26-5
Communications at congress A Di Fronzo C Pirola DC Boffito CL Bianchi A Di Michele R Vivani
M Nocchetti M Bastianini Synthetic Hydrotalcites as suitable Co-
based catalysts for Fischer-Tropsch Process XVIII Congresso Nazionale
della Divisione di Chimica Industriale della SCI LE SFIDE DELLA CHIMICA
INDUSTRIALE PER UNrsquoINNOVAZIONE SOSTENIBILE 11-14 giugno 2012
(Oral presentation)
A Di Fronzo DC Boffito CPirola G Carvoli S Vitali CL Bianchi
Scalable free fatty acids esterification for methyl esters production
XVIII Congresso Nazionale della Divisione di Chimica Industriale della
SCI LE SFIDE DELLA CHIMICA INDUSTRIALE PER UNrsquoINNOVAZIONE
SOSTENIBILE 11-14 giugno 2012 (Poster presentation)
ADi Fronzo C Pirola DC Boffito CL Bianchi A Di Michele R Vivani
M Nocchetti M Bastianini Synthetic Hydrotalcites as suitable Co-
based catalysts for Fischer-Tropsch Process Cat4bio conference
Advances in catalysys for biomass valorization Tesaloacutenica Grecia 2012
(Poster)
CL Bianchi A Di Fronzo C Pirola DC Boffito A Di Michele R Vivani
M Nocchetti M Bastianini Synthetic Hydrotalcites as suitable Co-
based catalysts for Fischer-Tropsch Process 7th edition of the
International Conference on Environmental Catalysis Lion-Francia
(Poster)
A Di Fronzo C Pirola CL Bianchi A Di Michele Ultrasonidos y
microondas en la preparaciograven de catalizadores soportados para la
sigraventesis de Fischer-Tropsch JIFI-EAI 2012 Jornadas de Investigaciograven
Ecuentro acadegravemico industrial Universidad Central de Venezuela
Facultad de Ingenierigravea 26-30 noviembre
C Pirola CL Bianchi A Di Fronzo D Boffito A Di Michele G S
Patience Ultrasound and microwave assisted preparation of high Fe
List of Publications and Communications
221
loaded supported catalysts for biosyngas Fischer-Tropsch conversion
Intervento presentato al 245 convegno ACS National Meeting amp
Exposition tenutosi a New Orleans Louisiana nel 2013
C Pirola C L Bianchi A Di Fronzo F Manenti M Hillestad High Fe
Loaded Supported Catalysts for Biosyngas Fischer ndash Tropsch Conversion
experimental results and detailed simulation XVII National Congress of
Catalysis GIC 2013 and XI National Congress of Zeolites Science and
Technology 15-18092013
F Galli C Pirola A Di Fronzo A Comazzi CLBianchi Di Michele Co
Based Bimetallic Catalysts for Fischer-Tropsch Synthesis Prepared by
High Power Ultrasound XVII National Congress of Catalysis GIC 2013
and XI National Congress of Zeolites Science and Technology 15-
18092013
Di Michele C Pirola A Di Fronzo A Comazzi F Galli and CLBianchi
Co Based Bimetallic Catalysts for Fischer-Tropsch Synthesis Prepared by
High Power Ultrasound AOSS Melbourne 10-12072013
C Pirola A Di Fronzo A Comazzi F Galli A Di Michele CLBianchi Co
based bimetallic catalysts for Fischer-Tropsch synthesis prepared by
high power ultrasound 11th European Congress on Catalysis ndash
EuropaCat-XI Lyon France September 1st-6th 2013
Workshop Clausthal Germany 22-23112013 Fischer-Tropsch Synthesis
from syngas and biomass using Fe or Co based catalysts Experimental
and simulation results (Oral Presentation)

3
TABLE OF CONTENTS
General abstract 5
Chapter 1 General Introduction 27
Chapter 2 Chemistry of Fischer-Tropsch Synthesis 57
21 FT Thermodynamics 58
22 FT Reaction Mechanism 59
23 FT Products Selectivity 65
24 FT kinetics 68
25 Influence of FT process conditions 71
Chapter 3 Catalysts for Fischer Tropsch Synthesis 76
31 Iron and Cobalt industrial FT catalysts 80
i) Iron catalysts 80
ii) Cobalt catalysts 81
32 Chemical State of active phase 82
33 Size of active phase 83
Chapter 4 Experimental FT plant and analytical methods 86
41 FT Laboratory plant 88
a) First FTS unit (Unit 1) 88
41a Main parts of the plant 90
42a Analytical instruments 94
43a Analytical instruments calibration 98
44a Experimental procedure 109
b) Second FTS unit (Unit 2) 114
41b Main parts of the plant 116
42b Analytical instruments 119
43b Experimental procedure 121
42 Experimental data elaboration 124
a)First FTS unit (Unit 1) 124
425 Hydrogen 137
427 Oxygen Balance 139
b)Seconf FTS unit (Unit 2) 140
43 Novelties on the FT plant made in this PhD work 142
Chapter 5 Catalysts preparation and characterization 143
51 Catalysts preparation 146
511 Catalyst preparation procedure 146
52 Catalysts characterization 155
521 Catalysis characterization introduction and theory 155
4
5211 BET analysis 157
522 Catalysts characterization results 174
Chapter 6 High Fe Loaded Supported Catalysts for Biosyngas Fischer ndash Tropsch Conversion experimental and simulation results 197
6 Development of the kinetic model 197
61 Regression of kinetic constants 197
62 Mass Balance 199
63 Energy Balance 200
64 Pressure variation 201
65 Catalyst Efficiency 202
Chapter 7 Fischer Tropsch runs results and discussion 204
Chapter 8 Final remarks and Conclusions 216
List of publications 219
Publications in Conference Proceedings (peer reviewed) 219
Communications at congress 220
General abstract
1 Introduction
Nowadays it is imperative to develop economical and energy-efficient
processes for the sustainable production of fuels and chemicals alternative to
the ones deriving from petroleum Climate change and air quality are major
environmental concerns because they directly affect the way we live and
breath In order to meet the present and future threats generated by emissions
to the atmosphere environmental agencies around the world have issued
more stringent regulations One of them is the control of residual sulfur in
diesel fuel and emission standards for particulates from diesel vehicles All
these facts have recently aroused renewed interest in the FischerndashTropsch
Synthesis because it can produce super clean diesel oil fraction with high
cetane number (typically above 70) without any sulfur and aromatic
compounds using syngas (mixture of H2 CO CO2) from natural gas CH4 coal
or as a new tendency from biomass [1 2] The essential target of FTS is to
produce paraffins and olefins with different molecular weight and to limit the
maximum formation of methane and CO2 [3]
The main reactions involved in FTS are reported in the following scheme [4-8]
Irreversible reactions
1) n CO + 2n H2 rarr CnH2n + n H2O for olefins
2) n CO + (1+2n) H2 rarr CnH(2n+2) + n H2O for paraffins
3) 2n CO + n H2 rarr CnH2n + n CO2 for olefins
4) n CO + 2n H2 rarr CnH(2n+1)OH + (n-1) H2O for alcohols
Equilibrium
5) CO + H2O harr CO2 + H2 Water-gas-shift reaction (WGS)
General Abstract
6
6) CO + H2 harr C + H2O Carbon deposition
7) 2 CO harr C + CO2 Boudouard equilibrium
The whole reaction gives an energetic contribution strongly exothermic (about
150 kJmol CO reacted) FTS is a particularly complex system in which a
number of different reactions are combined to a unique mechanism
irreversible Fischer Tropsch (FT) reactions produce hydrocarbons and some
equilibrium reactions between CO CO2 CH4 and C such as the WGS reaction
and the Boudouard equilibrium are present too Nevertheless it is possible to
suppose that FTS can be simplified as a combination of the FT reactions and the
WGS reaction [7] According this hypothesis hydrocarbons are primary
products of FT reaction and CO2 can only be produced by WGS reaction a
reversible parallel-consecutive reaction with respect to CO [9]
FTS usually requires catalysts based on cobalt or iron Co-based catalysts have
been more largely used due to their high selectivity to heavy hydrocarbons and
low activity in the water-gas shift reaction so limiting the CO2 formation
Moreover Co-based catalysts have shown longer life-time and higher CO
conversion compared to the Fe-based ones [10] Iron based catalysts are
recently highly investigated for FTS Compared to cobalt systems iron-based
catalysts are cheaper but less resistant to deactivation due to the oxidizing
effect of water despite activating Water Gas Shift reaction (CO + H2O harr CO2 +
H2) well [5 9] Moreover they are flexible to changes in temperature pressure
and they can work at different H2CO feed ratios (for iron based catalysts this
ratio can be between 05 and 25) [11 12]
2 Aims of the work
Considering very recent research results [13-15] the aim of the PhDrsquos research
was addressed toward the development of three particular kind of catalysts
General Abstract
7
The first group of catalysts tested were the Co-based hydrotalcites (HTlc) with
different amount of Co in two different pilot plants HTlc-based materials have
been recently reported as good catalysts for several processes in the energy
field [16] [17] and [18] Up to now the only study reported in literature on the
use of synthetic HTlc as FTS catalysts concerns their use as inert supports for
the catalytically active metal According to this study hydrotalcite-supported
catalysts result in higher activity than CoAl2O3 even in absence of reduction
promoters [19]
The second group of catalysts tested were the Co-based catalysts and
bimetallic Co-Ru based catalyst synthesized with the help of ultrasound
because the ultrasound are presented in literature as an innovative way to
synthesize new kind of materials
Finally were synthesized and tested samples of Fe-based catalysts supported
on silica with different methods of synthesis (traditional impregnation method
with the help of ultrasound or microwave) and changing the H2CO ratio with
the aim to evaluate the performance of biomass Almost the development of a
kinetic model (modeling parameter regression and simulation) in collaboration
with the Politecnico di Milano
3 Experimental Details
a Preparation of catalysts
i) Cobalt based catalysts ndash Hydrotalcites a series of ternary hydrotalcites with
general formula [CoxZn(1-x-y)Aly(OH)2](NO3)y∙05H2O by a modified-urea method
[20] Different volumes of the solutions of the metals nitrates all at a
concentration of 05 M were mixed to obtain either a Al(Co+Al) or
Al(Co+Al+Zn) molar ratio of 03 as indicated in Table 1
General Abstract
8
Solid urea was added to the solution in a molar ratio of 4 vs Al The obtained
solution was maintained at the reflux temperature in an open flask for 48 hours
The precipitate was separated by centrifugation washed with water and then
dried at 80degC
Table 1 Details of the synthesis composition and specific surface area (SA) of samples
general formula [CoxZn(1-x-y)Aly(OH)2](NO3)y∙05H2O M sol = molar percentage of
metals in the precipitation solution
Sample wt Co M sol
x
y
SSA (m2g-1)
Zn Co Al
Co5 51 55 15 30 010 033 175
Co10 108 45 25 30 021 034 115
Co15 166 35 35 30 032 029 72
Co35 353 - 70 30 067 033 58
ii) Cobalt based catalysts and bimetallic Co-Ru based catalysts synthesized
with the help of ultrasound All the catalysts were prepared by a modified
impregnation method The metal precursors (cobalt and ruthenium
carbonyl) were dissolved in n-decane together with the different support
(SiO2 Al2O3 or TiO2) The solution was irradiated by an ultrasound generator
with a horn type of 750 W a frequency of 20 kHz a diameter tip of 13 mm
and an amplitude of 40-50 for 3 h and then put into a rotating vacuum
oven at 40degC at 36 rpm for 24 h (impregnation step) Samples have been
calcinated at 350 degC for 4 h The ultrasound horn used have a cooling jacket
where the coolant has a low viscosity at low temperature and is a dielectric
liquid [21]
General Abstract
9
iii) Iron catalysts there were prepared the iron based catalysts using different
method of synthesis traditional impregnation (TR) impregnation with the help
of the microwave (MW) impregnation with the help of ultrasound (US) and co-
precipitation method MW and US techniques seem to be promising that offer
many advantages in the catalyst preparation as reported in [22-23] and their
effect was also evaluated
There were prepared according to the traditional impregnation method by
incipient wetness (TR) with 30wt of iron supported on a commercial high
surface area SiO2 (Fluka BET surface area 520 m2g-1 pore volume 122 ml g-1
and pore diameter 87 nm) The catalysts are promoted by K (20wt ) and Cu
(375wt ) The percentages are regarding a previous research [13] where
those compositions result as the most suitable catalyst In this work all the
percentages concerning the catalysts composition are on weight basis while
the percentages about the process conversion and selectivity are on molar
basis The catalysts will be named as Fe30K20Cu375 referring the wt of Fe K
and Cu on catalyst The support after heating treatment at 120degC for 12 h was
impregnated with an aqueous solution of Fe(NO3)3middot9H2O (Riedel de Haen
product) KNO3 (Merk product) and Cu(CH3COO)2middotH2O (Fluka product) and then
put into a vacuum oven at 40 degC at 36 rpm for 24 h The samples were heated
at 100 degC for 12 h and at 500degC for 4 h in air The results were also modeled
with a collaboration with the Politecnico di Milano and presented in this PhDrsquos
work
The synthesis of the catalyst with the aid of microwave is quite similar to the
TR The difference is the addition of a final step where the powder of catalyst
already calcined is subjected to a MW irradiation Two different methods for
the MW irradiation were used In the first one (MW1) it was taken a sample of
catalyst put it into a beaker and then put into a kitchen microwave oven
General Abstract
10
(Moulinex Micro-Chef 1305E 600W) for 30 min In the second method (MW2)
the catalyst (2 g) was suspended in hexane (400 ml) put it into a microwave
chemical reactor (ordinary 400 mL round bottom glass flask filled with the
liquid to be heated and activated) and treated for 1 h at 60W MW were
produced by a MW generator and sent to the MW applicator by an insulated
coaxial antenna Details of the MW applicator and of the associated
experimental techniques can be found in [24]
The US treatment have been used between the impregnation and the
evaporation step by irradiating the silica-precursors solution using a Sonicator
(W-385 Heat Systems Ultrasonics) with an effective input power of 60 W and a
tip diameter of 13 mm Silica solution promoters and water have been
sonicated by the US horn for 05 h in air atmosphere (US1) The same sample of
US1 was successively sonicated in a suspension of hexane in argon atmosphere
(instead of air) for 3h (US2)
b Catalysis Characterization
The obtained materials were characterized by X-ray powder diffraction
(XRD PANalytical XrsquoPert Pro CuKα radiation) operating at 40kV and 40mA
step size 00170 2θ degree and step scan 20s
The metal content of samples was determined by inductively coupled
plasma optical emission spectrometry (ICP-OES) using a Varian Liberty
Series instrument
Field emission scanning electron microscopy (SEM) images were obtained
using a LEO1525 instrument after depositing the samples depositing the
catalysts onto the sample holder and sputter coating with chromium
The elemental mapping of metals was obtained by using energy dispersive
X-ray spectroscopy (EDS) with a Bruker Quantax EDS instrument
General Abstract
11
Transmission electron microscopy (TEM) images were obtained using a
Philips 208 instrument
FT-IR spectra of different samples dispersed in KBr pellets were recorded
at room temperature using a Bruker IFS113V spectrometer Typically each
spectrum was obtained at a resolution of 1 cm-1 in the spectral region 400-
5000 cm-1
Specific surface area (SSA) of all catalysts was determined by
conventional N2 absorption using a Micromeritics ASAP2010 instrument
Before the analysis the samples were pre-treated at 200degC in a He flow
Conventional temperature-programmed reduction experiments (TPR) were
performed using a Thermoquest Mod TPRDO 1100 instrument The
samples were initially pre-treated in a flow of argon at 200degC for 05 h After
being cooled down to 50degC the H2Ar (51 vv) reducing mixture was
flushed through the sample at 30 mL min-1 and the temperature increased
from 50 to 900degC at a constant rate of 10degC min-1
Water and nitrate content of the solids was determined by
thermogravimetric (TG) analysis with a Netzsch STA 449C apparatus in air
flow and 10degCmin heating rate
c Kinetics Run
FT synthesis was performed into a fixed bed reactor using 1 g of fresh
catalyst mixed with 1 g of diluting material (-Al2O3) This diluting material
must be inert for FTS and acts as a good thermal conductor to control the
process temperature [25] The calcined catalysts were initially activated in
situ with the standard conditions of 468 Nml min-1 flow of syngas (H2CO =
21) at 350degC 3 bar for 4 h Then they were tested with the standard
conditions of 468 Nml min-1 flow of syngas (H2CO = 21) plus 50 Nml min-1
of N2 as internal standard at 20 bar at T = 250degC Others reducing activating
General Abstract
12
gases feeding compositions pressures temperatures have been tested in
the work Analyses of the gas-phase products (C1ndashC7) were performed with
an on-line micro gas-chromatograph (Agilent 3000) Liquid products were
collected in a trap at 5 degC and 20 bar and analyzed by a gas-chromatograph
(Fisons Mod 8000 Series) equipped with a Poparak-Q column after the total
time of reaction The aqueous phases collected in the cold trap were
analyzed by a TOC (Schimadzu Mod 5000A) to quantify the amount of
carbonaceous species dissolved in water
In the case of hydrotalcites FTS was performed in two different laboratory
plants with the same flow sheet The first one recently described and
located at the Universitagrave degli Studi di Milano and the second one at the
Universidad Central de Venezuela during a complementary stage in
Venezuela In this case the FTS was performed in a continuous flow system
with a fixed bed stainless-steel reactor (di =32mm l = 30 cm) The reactor
was loaded with 03 g of fresh catalyst mixed with 03 g of see sand as a
diluting material [26] The calcined catalysts were initially reduced in situ by
flowing hydrogen for 4 hours at 900 Nml˙min-1 350degC and 08 MPa After
the reduction step the temperature was lowered to 220degC under H2 They
were then tested in the standard conditions by flowing syngas (H2 CO N2
63325 vv N2 as internal standard) at 156 Nml˙min-1 increasing the
system pressure slowly up to 20 MPa and 220-260degC Once the reaction
temperature was achieved the reaction was led to proceed during a period
of 280 h
During reaction the reactor effluent passed through a hot trap kept at
150ordmC and 02 MPa to collect waxes and the products leaving this trap were
passed through a second trap kept at 0ordmC and 02MPa to collect the lighter
products (water alcohols and hydrocarbons) The analyses were performed
General Abstract
13
in various chromatographs according to the nature of the sample to be
analyzed Permanent gases and light hydrocarbons were analyzed on-line in
a PerkinElmer 3000GC Autosystem fitted with TCD detectors using a
Carbosieve SII Supelco column The liquid products (collected at 150ordmC and
0ordmC) were weighted and analyzed in a PerkinElmer chromatograph fitted
with a 50m long Alumina RT capillary column connected to a FID
A mass molar balance was performed for each FT run resulting in a
maximum error of plusmn 5 on molar basis
4 Results and discussion
a) Catalysts activation
i) Cobalt catalysts The catalytic activity of the samples depends on the
presence of metallic Co centres on the surface and the particle size Many
works have been done on the reducibility by TPR of CoOx mixed oxides The
reduction profile of Co3O4 consists of a low-temperature peak and a high-
temperature peak which correspond to the reduction of Co+3 to Co+2 and Co+2
to Co0 [27-30]
Two kinds of Co based catalysts were tested
The HTlc materials contain Co (II) ions randomly dispersed inside the brucitic
layers then the active phase in the FTS is the metallic cobalt Therefore in
order to have an active catalyst a reduction procedure is requires to maintain
the cobalt dispersion TPR analyses were performed to study the reduction
process and to select the best conditions for the catalyst activation Fig 1
reports the TPR profile of the sample Co5 Co10 Co15 Co35 All the profiles
exhibit two regions of reduction the first at lower temperatures (below 400degC)
which is due to the reduction of Co while the second peak above 700degC
indicates the presence of hardly reducible species These species are probably
spinel-type mixed oxides formed during the thermal treatment According to
General Abstract
14
Alvarez et al [31] these two peaks are well separated for samples with a small
particle size while an intermediate particle size causes the overlapping of the
two reduction steps resulting in a complete reduction with only one maximum
at an intermediate temperature (328degC) The TPR profiles of our HTlc (Fig 1)
are consistent with the latter case
Basing on the TPR results the tested catalysts were activated before FTS at
350degC for 4 hours under hydrogen atmosphere in order to reduce the Co ions
to metallic Co
Fig 1 TPR analysis of the samples Co5 Co10 Co15 Co35 Activation temperature is
indicated with the dashed line
After this treatment XRD analysis detected only mixed metal oxides and no
metallic Co phases so highlighting the presence of active metal atoms
homogeneously dispersed at the nanometer or sub-nanometer level [1432]
The same thing happens with the cobalt catalysts synthesized with ultrasound
The results of TPR confirm the data found in literature [27-30] where the Co
based catalysts need to be activated at 350degC for 4 hours under hydrogen
atmosphere It is important to note in Fig 2 how small amount of Ru decreases
the peak of the reduction temperature
General Abstract
15
100 200 300 400 500 600 700 800
Co-RuSiO2
CoSiO2
TC
D
Temperature (degC) 100 200 300 400 500 600 700 800
TC
D
CoAl2O
3
Co-RuAl2O
3
Temperature (degC) 100 200 300 400 500 600 700 800
CoTiO2
TC
D
Co-RuTiO2
Temperature (degC)
Fig 2 TPR analysis of the samples CoSiO2 and Co-RuSiO2 CoAl2O3 and Co-Ru Al2O3
CoTiO2 and Co-RuTiO2 Activation temperature is indicated with the dashed line
Basing on the TPR results the tested catalysts were activated before FTS at
350degC for 4 hours under hydrogen atmosphere in order to reduce the Co ions
to metallic Co
ii) Iron catalysts
As regard the method of synthesis of the iron based catalysts the main results
of catalysts characterization are reported in Table 2 All the surface areas (SA)
of the prepared catalysts are significantly lower than the SA of the
corresponding support (SiO2) This important decrease can be explained
considering the dilution effect due to the presence of iron on the support The
dilution effect can be easily assessed by considering the surface area of bare
silica support and assuming a negligible contribution of the iron phases to the
surface area The samples treated with MW and US have higher values of SA
than the traditional ones the effect of MW and US on SA is proportional with
the US or MW emitting power
The TPR analysis of these samples treated with MW gave results consistent
with those prepared by TR showing that the method of preparation does not
influence the step of reduction (Fe2O3-gt Fe3O4 -gt-Fe) of the catalyst but only
the peak temperature
General Abstract
16
Table 2 Characterization results of iron based catalysts using different method of synthesis
Sample Prep
Method
BET TPR TPD
Surface Area (m2g-1)
Temp of first
red peak (degC)
Temp of
second red peak (degC)
Temp of the peak (degC)
Bare support
Catalyst
Fe30K2Cu375SiO2 TR 4303 1601 240 600 170
Fe30K2Cu375SiO2 MW1
4303 1800 - - -
MW2 2240 240 580 162
Fe30K2Cu375SiO2 US1
4303 2011 236 572 171
US2 2101 - - - TR= Traditional Impregnation MW1= Catalyst put it into a kitchen MW and processed in powder MW2= Catalyst put it into MW and suspended in hexane US1= Catalyst suspended in aqueous solution in air atmosphere for 05 h US2= Catalyst sonicated and suspended in hexane in Argon atmosphere for 3h
In agreement with the literature [33] all the curves show a single TPDs peak in
the same range (150-170degC) that confirms the fact that only one type of
adsorbing species can exists up on the catalyst (see table 2) for all the catalysts
Before FT runs the catalysts must be activated reducing the hematite phase
(not active for FTS) in iron carbides (in particular Fe22C and Fe25C) and
magnetite (Fe3O4) [34] In literature there is not a uniform procedure for this
operation Many tests were performed by [34] and show that the best FT
results in term of CO conversion have been obtained using the activating
mixture H2CO (21) or pure CO starting from oxidized catalysts and making this
operation at T=350degC The process selectivity is not particularly modified using
the mixture H2CO (21) or pure CO and changing the activation temperature
b) FT results
i) Co based hydrotalcites as catalysts for Fischer-Tropsch synthesis
General Abstract
17
The activated samples were tested at different temperatures in the FTS plant
following the procedure reported in the experimental section In Fig 3 the CO
conversion vs the reaction temperature is reported for all the catalysts while
the products selectivity is displayed in Table 3
Fig 3 molar CO conversion to Co5 () Co10 ( ) Co15 (diams) Co35 () obtained at
different reactor temperatures after 24 hours of reaction
As expected for each catalyst the activity is strongly influenced by the reaction
temperature the higher the temperature the higher the CO conversion but
also the selectivity towards CO2 CH4 and light hydrocarbons is favored by a
higher temperature The CO conversion is similar for Co5 and Co10 while it is
higher for the two samples with a larger amount of cobalt ie Co15 and Co35
In particular Co15 exhibits the highest CO conversion at all the selected
temperatures In FTS it is fundamental to obtain low quantities of CH4 and CO2
(undesired products) to favor the formation of higher hydrocarbons For this
reason temperatures in the 220-235degC range are more suitable than the higher
ones
General Abstract
18
Moreover Table 3 shows that Co15 exhibits the highest CO conversion and the
highest C2+ total yield (without considering CH4 and CO2 see note in Table 3)
also at the lowest temperature (220degC) This result confirms that Co15 is the
best performing catalyst obtained in this study
The obtained data suggest the possibility of using synthetic hydrotalcites as Co-
based catalysts for FTS and pursuing subsequent studies on the same subject
Table 3 FTS products selectivity at different reactor temperatures
Sample Temperature
(degC)
Products Selectivity C2+
Yield CO2 CH4 leC7 gtC7
Co5 220 03 29 33 934 165
235 03 59 104 834 194
245 11 85 127 776 224
260 19 141 160 679 300
Co10 220 32 26 98 844 155
235 38 49 143 769 178
245 33 60 154 753 218
260 81 163 413 343 262
Co15 220 14 101 17 705 467
235 81 262 473 185 498
250 178 177 443 202 491
Co35 220 14 39 103 844 250
235 18 96 234 651 395
245 51 257 656 105 473
leC7 all the hydrocarbons in the range C2-C7 gtC7 all the hydrocarbons greater than C7 Product lsquolsquoirdquo selectivity = (moles C in product i) (converted moles C) x 100 C2+ yield = CO conversion x (selectivity leC7 + selectivity gtC7) x10-2
General Abstract
19
iii) Sonochemical synthesis of Co and Co-Ru based catalysts for Fischer-Tropsch
synthesis
The use of ultrasound might be very efficient to optimize the dispersion of a so
high metal charge as already verified in our laboratory in the past [35-36] This
special type of synthesis should give at the catalyst a particular structure with a
high surface area and a high metal dispersion that improves its activity towards
the synthesis of Fischer-Tropsch In the case of cobalt supported catalysts a
simple US step has been added in the catalyst preparation The precursors
(cobalt and ruthenium carbonyl) were dissolved in n-decane together with the
different support (SiO2 Al2O3 or TiO2) the solution was irradiated with
ultrasound at a frequency of 20 kHz and an output power of 300 W for 3 hours
As seen in table 4 the catalysts show a low selectivity to methane and carbon
dioxide and formation of higher hydrocarbons The more interesting results are
the highest CO conversion at lower temperatures measured with a catalysts
promoted with a Ru
Table 4 CO Conversion C2+total yield CH4 CO2 light hydrocarbon and heavy
hydrocarbon selectivity of CoCo-Ru based catalyst
Catalyst CO
Conversion ()
C2+ total yield
Selectivity ()
CH4 CO2 ltC7 gt C7
CoTiO2 28 23 5 14 10 71
CoSiO2 6 5 19 6 23 52
CoAl2O3 8 6 13 7 19 61
Co-RuTiO2 98 73 18 8 14 60
Co-RuSiO2 94 82 9 4 8 79
Co-RuAl2O3 84 73 11 2 12 75
As we have seen from the BET and TPR analysis the support and the promoter
play a key role in the performance of the catalyst because they are responsible
General Abstract
20
for the modification of some key parameters such as surface area and the
metal dispersion
ii)High Fe Loaded Supported Catalysts for Biosyngas Fischer ndash Tropsch
Conversion experimental results and detailed simulation
With regard to the treatment with the help of US (see table 5) it can be
concluded that the sonication of an aqueous mixture salts and precursors of
support (US1) is preferable instead of to the calcined catalyst suspended in
non-polar solvent such as hexane (US2) With regard to treatment with MW
(see table 3) there were obtained better results in term of CO conversion with
the powder catalyst treated directly in the MW (MW1) while the test
conducted by suspending the catalysts in hexane and then treated in a MW
reactor (MW2) for an hour did not give valid results The best FTS results in
term of C2+ yield (41) has been obtained using MW1 while in tem of CO
conversion (58) using US1 All of them gave FTS results better than the
traditional one Itrsquos evident that the use of US or MW optimizes the catalytic
performance in accord with previous similar results [36]
In agreement with [37] the FTS results show that TEOS as silica source is
favorable for the enhancement of the FTS activity
A very important property of iron based catalysts is their possibility to operate
using feeding gas having a ratio H2CO not stoichiometric (ie 2) In the
present work there were made some tests with Fe30K20Cu375 catalyst by
feeding mixtures with a ratio H2CO between 05 and 20 in order to optimize
the activity selectivity and the lifetime of this kind of FT catalyst in work
conditions of biosyngas feeding
General Abstract
21
Table 5 Catalytic Results of Fe30K20Cu375 Different preparation techniques Support
SiO2 Diluting Material α-Al2O3 T=220degC
Preparation CO Conversion
()
C2+
Total yield
Selectivity ()
CO2
CH4
lt C7
gt C7
TR 49 32 27 7 22 44
MW1 52 41 17 5 18 60
MW2 32 24 17 8 27 48
US1 58 38 29 6 22 43
US2 36 25 22 9 30 39
Co-precipitation 38 32 2 13 28 57 leC7 all the hydrocarbons in the range C2-C7 gtC7 all the hydrocarbons greater than C7 Product lsquolsquoirdquo selectivity = (moles C in product i) (converted moles C) x 100 C2+ yield = CO conversion x (selectivity leC7 + selectivity gtC7) x10-2
The co-precipitation test was made at T=250degC and TEOS as a support
On the basis of the collected data a rigorous simulation of the FT synthesis
reactor has been developed for different purposes (i) to support the
experimentations and their planning (ii) to predict the reactor yield and
conversion (iii) to optimize the performance of the reactor system with
different operating conditions and (iv) to calculate novel reliable kinetic
parameters based on the experimental data fitting by means of model-based
nonlinear regression techniques To do so the FT reactor is modeled as a
catalytic plug-flow reactor using mass and energy balances and reaction
kinetics for Fe-based catalyst defined by Zimmerman and Bukur [38] leading to
an ordinary differential equation system with structured Jacobian Lumping
techniques have been used to model heavy hydrocarbons The system is solved
by means of dedicated solvers to handle stiffness and nonlinearities of
heterogeneous reactive systems [39]
General Abstract
22
Typical H2CO ratio of syngas manufactured from coal or biomass are between
07-12 and the Fig 4 show that the activity of catalyst is good enough using
also feeding ratio between 10 and 20
Fig4 CO conversion or selectivity vs H2CO feeding ratio for Fe30K20Cu375 catalyst
at T=250degC
In Table 6 there is the data concerning the carbon monoxide conversion ()
and the selectivity towards undesired products (CO2 and CH4) and lighter and
heavy hydrocarbons of Fe-based catalyst The data collected using this catalyst
were modeled in collaboration with Politecnico di Milano
The selected model was based on the hypothesis that both FT and WGS
reaction were active on this catalyst The kinetic parameters were calculated
and compared with the experimental data
Table 6 FTS products selectivities at different H2CO ratio and reactor temperatures of
Fe30K20Cu375
Selectivity ()
H2CO T(degC) CO
Conversion ()
C2+ total yield
CO2 CH4 ltC7 gtC7
21 220 85 69 11 8 22 59
21 235 211 175 11 6 20 63
21 250 498 393 16 5 19 60
21 260 567 425 19 6 20 55
151 250 388 299 18 5 17 60
151 260 463 338 22 5 17 56
11 250 23 182 17 4 16 63
11 260 389 272 26 4 16 54
General Abstract
23
leC7 all the hydrocarbons in the range C2-C7 gtC7 all the hydrocarbons greater than C7 Product lsquolsquoirdquo selectivity = (moles C in product i) (converted moles C) x 100 C2+ yield = CO conversion x (selectivity leC7 + selectivity gtC7) x10-2
In Fig 5 is presented a comparison between the experimental data obtained in
the laboratory and the data obtained using the kinetic model The first two
columns represent the conversion of hydrogen and carbon monoxide while in
the other columns are represented the molar fraction of hydrogen carbon
monoxide water methane and lump C2 C3-4 C5-10 C11 + It can be seen that the
kinetic model present a good fitness regard to the experimental data
Fig 5 Comparison between experimental data and kinetic model
5 Conclusions
General Abstract
24
Concerning the results obtained in this PhDrsquos research work it is clear that all
the samples tested have given good results The Co-based catalysts
synthesized using the traditional impregnation method with an additional step
of ultrasound have given good results in comparison with the results in the
current literature The hydrotalcites have given lower results if compared with
the Co-based catalysts synthesized with the help of ultrasound but they have
opened an alternative and innovative way that has never been tried before
Iron based catalysts allow a direct conversion of the biosyngas and the results
have shown how our catalysts are active with an H2CO ratio le2 Furthermore
trends have been modeled with success In conclusion the PhDrsquos research
work has given a serious contribution to the current state of the art on
catalysis in the Fischer-Tropsch synthesis either with cobalt and iron based
catalysts With cobalt has been optimized a traditional synthesis procedure
with the introduction of ultrasound furthermore has been created a
completely new kind of catalyst With iron has continued an optimizationrsquos
work of iron supported with high loading metals so to develop a suitable
kinetic model able to work not only with syngas but also with biosyngas
References
[1] M S Hadnadev-Kostic J Tatjana T Vulic R Marinkovic-Neducin A D Nikolic B Jovic Journal of the Serbian Chemical Society 76 (12) (2011) 1661ndash1671 [2] E Lira C Loacutepez F Oropeza M Bartolini J Alvarez M Goldwasser F Loacutepez J Lamonier J Peacuterez Journal of Molecular Catalysis A Chemical 281 (2008) 146ndash153 [3] Q Zhang J Kang Y Wang ChemCatChem Catalysis 2 (2010) 1030 [4] F Fischer and H Tropsch BrennstChem 4 (1923) 276 [5] M E Dry Enciclopedia of Catalysis New York (2003) 247 [6] Fischer-Tropsch Technology Studies in Surface Science and Catalysis Elsevier (2004)
General Abstract
25
[7] G P Vaan Deer Laan A A C M Beenackers Catalysis Reviews Science and Engineering 41(3amp4) (1999) 255 [8] H Schulz Applied Catalysis A 186 (1999) 3 [9] GP van der Laan AACMBeenackers Applied Catalysis A 193 (2000) 39 [10] A Martinez C Lopez F Marquez IJ Diaz Catalysis 220 (2003) 486 [11] AY Khodakov WChu P Fongarland Chemical Reviews 107 (2007) 1692 [12] BHDavis Catal Today 84 (2003) 83 [13] Pirola C Bianchi CL Di Michele A Diodati P Vitali S Ragaini V Catal Lett 2009 131294ndash304 [14] A Di Fronzo C Pirola A Comazzi F Galli CL Bianchi A Di Michele R Vivani M Nocchetti M Bastianini DC Boffito Fuel 119 (2014) 62-69 [15] C Pirola CL Bianchi A Di Michele S Vitali V Ragaini Catal Comm 10 (2009) 823ndash827 [16] T Montanari M Sisani M Nocchetti R Vivani M C H Delgado G Ramis G Busca U Costantino Catalysis Today 152 (2010) 104 [17] C Resini T Montanari L Barattini G Ramis G Busca S Presto P Riani R Marazza M Sisani F Marmottini U Costantino Applied Catalysis A 355 (2009) 83 [18] Y Lee J H Choi H J Jeon K M Choi J W Lee J K Kang Energy Environment Science 4 (2011) 914 [19] Y Tsai X Mo A Campos J G Goodwin Jr J Spivey Applied Catalysis A General 396 (2011) 91ndash100 [20] M Bastianini D Costenaro C Bisio L Marchese U Costantino R Vivani M Nocchetti Inorg Chem 51 (2012) 2560-2567 [21] Suslick SK ldquoApplications of ultrasound to materials chemistryrdquo MRS Bulletin 1995 [22] S Qi B Yang Methane aromatization using Mo-based catalysts prepared by microwave heating Catal Today 98 (2004) 639-645 [23] Y Liu Y Lu S Liu Y Yin The effect of microwaves on the catalysts preparation and the oxidation of o-xilene over a V2O5SiO2 system Catal Today 51 (1999) 147-151] [24] G Biffi Gentili M Linari I Longo A Ricci IEEE Transactions on microwave theory and techniques Vol 57 (2009) 9 [25] C Bianchi C Pirola V Ragaini Catalysis Communications 7 (2006) 669-672 [26] ML Cubeiro Loacutepez A Colmenares L Texeira M Goldwasser M J Peacuterez F Machado F Gonzaacutelez Applied Catalysis A General 167 (1998) 183-193 [27] C L Bianchi Catalysis Letters Vol 76 No 3ndash4 (2001)155-159 [28] H-Y Lin Y-W Chen C Li Thermochim Acta 400 (2003) 61ndash67 [29] H-Y Lin Y-W Chen Materials Chemistry and Physics 85 (2004) 171ndash175
General Abstract
26
[30] BA Sexton AE Hughes TW Turney Journal of Catalysis 97 (1986) 390ndash406 [31] A Alvarez S Ivanova MA Centeno JA Odriozola Applied Catalysis A General (2012) 431ndash 432 [32] C L Bianchi C Pirola DC Boffito A Di Fronzo A Di Michele R Vivani M Nocchetti M Bastianini S Gatto DGMK Tagungsbericht Volume2011-2 IssuePreprints of the DGMK-Conference Catalysis Innovative Applications in Petrochemistry and Refining 2011 Pages 93-98 Journal 2011 CODEN DGTAF7 ISSN1433-9013 [33] 7 H Wan B Wu C Zhang H Xiang Y Li Promotional effects of Cu and K on precipitated iron-based catalysts for Fischer ndash Tropsch synthesis J molecular Catalysis 283 (2008) 33-42 [34] J Xu CHBartholomew J Phys Chem B 109 (2005) 2392 [35] CLBianchi VRagaini Catalysis Letters 95 (2004) 61-65 [36] C Pirola C L Bianchi A Di Michele P Diodati D C Boffito V Ragaini Ultrasonic Sonochem 17 (2010) 610 [37] Suo Haiyun Zhang Chenghua Wu Baoshan Xu Jian Yang Yong Xiang Hongwei Li Yongwang A comparative study of FeSiO2 FischerndashTropsch synthesis catalysts using tetraethoxysilane and acidic silica sol as silica sources Catalysis Today Volume 183 Issue 1 20 March 2012 Pages 88ndash95 [38] WH Zimmerman DB Bukur Can J Chem Eng 68 (1990) 292-301 [39] F Manenti I Dones G Buzzi-Ferraris HA Preisig Ind Eng Chem Res 48 (2009) 9979-9984
27
Chapter 1 General Introduction The National Renewable Energy Laboratory (NREL) and the Pacific Northwest
National Laboratory (PNNL) [1] are undertaking studies of biomass conversion
technologies to hydrocarbon fuels
Process designs and preliminary economic estimates for each of these pathway
cases were developed using rigorous modeling tools This technology pathway
case investigates the upgrading of woody biomass derived synthesis gas
(syngas) to hydrocarbon biofuels While this specific discussion focuses on the
conversion of syngas via a methanol intermediate to hydrocarbon blend stocks
there are a number of alternative conversion routes for production of
hydrocarbons through a wide array of intermediates from syngas (Fig 11)
Technical barriers and key research needs have been identified that should be
pursued for the syngas-to-hydrocarbon pathway to be competitive with
petroleum-derived gasoline- diesel- and jet-range hydrocarbon blend stocks
Fig 11 Process Block Diagram [1]
At present the development of economical and energy-efficient processes for
the sustainable production of alternative fuels and chemicals is a global
Chapter 1 General Introduction
28
demand and FTS is a crucial technology for this purpose [2] On the one side
the observed climate change particularly global warming is widely held as a
consequence of the increase of atmospheric CO2 concentration due to fossil
fuel combustion On the other side people are increasingly aware that fossil
fuels reserves are huge but not unlimited and the air quality are major
environmental concerns because they directly affect the way we live and
breathe
In order to meet the present and future threats generated by emissions to the
atmosphere environmental agencies around the world have issued more
stringent regulations One of them is the control of residual sulfur in diesel fuel
and emission standards for particulates from diesel vehicles All these facts
have recently aroused renewed interest in the FischerndashTropsch Synthesis
because it can produce super clean diesel oil fraction with high cetane number
(typically above 70) without any sulfur and aromatic compounds using syngas
(mixture of H2 CO CO2) from natural gas CH4 coal landfill gas coal or biomass
through steam reforming partial or auto thermal oxidation gasification
processes or as a new tendency from biomass [3-5] Mineral diesel basically
results from refining and fractional distillation of crude oil between 160 and
380degC at atmospheric pressure and is mostly formed by mixtures of paraffins
containing between 12 and 20 carbon atoms per molecule In these mixtures
linear paraffins are particularly appreciated due to their high cetane number
ie their excellent ignition performances Expansion and social progress is
however boosting a further increase of energy demand particularly in the
transportation sector which in developed countries accounts for most of this
increase This is the reason why carbon-neutral biofuels are largely considered
a possible way to satisfy the energy demand without dramatically increasing
the CO2 content of the atmosphere [6]
Chapter 1 General Introduction
29
In this context the production of hydrocarbons starting from syngas (CO + H2) is
a crucial topic because syngas can be manufactured from natural gas (GTL Gas
to liquid) coal (CTL coal to liquids) or biomass (BTL Biomass to liquid) [7] In
Fig 12 the industrial way to utilize syngas are reported the fuels produced
from syngas include hydrogen by the water-gas-shift (WGS) reaction methanol
by methanol synthesis alkenes by Fischer Tropsch synthesis (FTS) isobutene by
isosynthesis ethanol by fermentation or with homogeneous catalysts and
aldehydes or alcohols by oxosynthesis
Fig 12 Diagram of Syngas Conversion Processes [8]
Fischer-Tropsch Synthesis (FTS) is a well-known industrial process discovered
by Franz Fischer and Hans Tropsch in Germany in 1923 [9] starting from syngas
(H2 + CO) and using iron or cobalt based catalysts it is possible to produce
several hydrocarbons in the range from 1 to 100 carbon atoms Co-based
catalysts have been more largely used due to their high selectivity to heavy
hydrocarbons and low activity in the water-gas shift reaction so limiting the
CO2 formation Moreover Co-based catalysts have shown longer life-time and
higher CO conversion compared to the Fe-based ones [10-11] The essential
target of FTS is to produce paraffins and olefins with different molecular weight
Chapter 1 General Introduction
30
and to limit the maximum formation of methane and CO2 [4 12-15] The main
reactions involved in FTS are reported in the following scheme
Irreversible reactions
1) n CO + 2n H2 rarr CnH2n + n H2O for olefins
2) n CO + (1+2n) H2 rarr CnH(2n+2) + n H2O for paraffins
3) 2n CO + n H2 rarr CnH2n + n CO2 for olefins
4) n CO + 2n H2 rarr CnH(2n+1)OH + (n-1) H2O for alcohols
Equilibria
5) CO + H2O harr CO2 + H2 Water-gas-shift reaction (WGS)
6) CO + 3 H2 harr CH4 + H2O
7) 2 CO harr C + CO2 Boudouard equilibrium
The whole reaction gives an energetic contribution strongly exothermic (about
150 kJmol CO reacted) FTS is a particularly complex system in which a
number of different reactions are combined to a unique mechanism
irreversible FT reactions produce hydrocarbons and some equilibria reactions
between CO CO2 CH4 and C such as the WGS reaction and the Boudouard
equilibrium are present too Nevertheless it is possible to suppose that FTS
can be simplified as a combination of the FT reactions and the WGS reaction
[14] Hydrocarbons are primary products of FT reaction and CO2 can only be
produced by WGS reaction a reversible parallel-consecutive reaction with
respect to CO [16]
At present the marketplace places a premium on FT diesel but not gasoline
thus the current view is that the most attractive option is to produce high
molecular weight FT products and then to hydrocrack them to produce high
quality diesel fuel [17] According to Calderone et al [18] the most important
limitation to the industrialization of FT processes is the availability of cheap oil
Industrial interest in FT reactions always peaks during oil crises (Fig 13) The
Chapter 1 General Introduction
31
Kyoto protocol recognizes the importance of developing and deploying new
technologies with less impact on the environment
Fig 13 The oil price (line) related to the output of peer reviewed FTS research papers and patents (bars) in 1925ndash2007 [19]
Fig 14 Number of papers related to FT synthesis published in the past decade From
ISI Web of Science using the keyword ldquoFischer-Tropschrdquo [20]
Selectivity control remains one of the most important and difficult challenges
in the research area of FTS Development of efficient catalysts with controlled
selectivity or tuned product distribution is a highly desirable goal [5]
Compared to cobalt systems iron-based catalysts are cheaper but less resistant
to deactivation due to the oxidizing effect of water despite activating Water
Gas Shift (WGS) reaction (CO + H2O harr CO2 + H2) [12 16] Moreover they are
flexible to changes in temperature pressure and they can work at different H2
CO feed ratios (for iron based catalysts this ratio can be between 05 and 25)
[21-22] Iron catalysts seem to be more suitable to work with biomass-derived
Chapter 1 General Introduction
32
syngas as outlined by Corma et al [23] that are characterized by a low ratio
H2CO and by the presence of CO2 (the activation of WGS reaction in fact can
produce CO from CO2) They present lower methane selectivity and they are
less deactivated by poisons species [24] The iron based catalysts have different
active site the Fe-carbides sites are active for the formation of hydrocarbons
(FTS) while the magnetite (Fe3O4) sites are the most active phase for the WGS
reaction [16 25-26]
11 Fischer Tropsch Synthesis Historical background
A Short Historical Sketch
Year Ref
1902 P Sabatier and J D Senderens
Hydrogenated CO over Ni to produce CH4 [27]
1910 A M Mittasch C Bosch and F Haber
Developed promoted Fe catalysts for the synthesis of NH3 [28]
1913 Badische Anilin und Soda Fabrik (BASF)
Received patents on the preparation of hydrocarbons and oxygenates by the hydrogenation of CO at high pressure usually on oxide catalysts
1936 Eugene Houdry Developed and installed the first commercial catalytic cracking unit [29]
1943-1944
Kogravelbel KWIK and five companies participated
Initiated and directed the comparative tests I and II held at Schwarzheide to select a Fe catalyst to replace Co in existing reactors Although the results were remarkably good no replacement catalyst was selected probably because of the overall disarray of activity that attended the approach of the end of the war
[30]
1949 Kogravelbel and F Engelhardt
Discovered that H2O and CO react on FTS catalysts to yield typical FTS products
1950 A fluidized-fixed bed process developed by Hydrocarbon Research Trenton New Jersey was installed in Brownsville Texas This plant called Carthage Hydrocol Inc used reformed natural gas Severe operating difficulties required designing a new reactor which was installed in 1953 The new reactor operated properly but the plant was promptly shut down sold and dismantled By the time the plant was operating correctly the price of natural gas had more than doubled Merely selling the gas was more profitable than converting it to gasoline and chemicals At the same time in South Africa the SASOL FTS plant using coal was constructed and opened in 1955 Lurgi gas generators and Rectisol gas-cleaning units were employed Two types of FTS reactors both with Fe catalysts were used a fixed-bed with recycle unit designed by Ruhrchemie in West Germany having long tubes with an internal diameter of 2 inch and an entrained-solids reactor by M W Kellogg in New Jersey After a year or more of start-up problems these units have operated successfully up to the present
[31]
1953 R B Anderson and J F Shultz
Found that Fe nitrides are unique durable catalysts for the FTS that produce large yields of alcohols Anderson developed equations that predict the isomer and carbon-number distributions of FTS products
[32]
1957 G Natta and co-workers
Studied the methanol and higher alcohol syntheses [3334]
1959 Pichler Resumed work on FTS on Ru which led to the polymethylene synthesis
Chapter 1 General Introduction
33
1961 H H Storch He died he was the architect of the useful scientific and engineering research programs on coal-to-oil processes at the US Bureau of Mines in Pittsburgh and Bruceton Pennsylvania
[3235]
1967 US Bureau of Mines workers
Developed methods for flame spraying catalysts onto metals for the platelet assemblies of hot-gas-recycle reactors These techniques led to the development of a new FTS unit the tube-wall reactor
[36]
1975 SASOL II SASOL III
In South Africa the decision was made to build SASOL II scheduled for operation in 1980 and in 1979 plans were made for SASOL III to begin operation in 1982 The new plants are similar to the initial plant except that fixed-bed FTS reactors were not included in the new installations
[31]
1976 Mobil Announced a process for converting methanol to an aromatic gasoline and C to C4 olefins on the shape-selective catalyst ZSM5 This process may be a serious competitor for FTS
1981 New Zealand A methanol plant operating on natural gas plus the Mobil process was planned scheduled for competition in 1985
1982 The worldwide recession
Sharply decreased demand for petroleum OPEC was unable to control the production and price of oil among its members The relatively low cost and abundance of petroleum has discouraged new coal-to-oil ventures
1993 Shell in Bintulu Malaysia
Completed construction and began operating their ldquoShell Middle Distillate Processrdquo The Bintulu Plant produces 12500 BPD and in 2000 increase that capacity to 15000 BPD This F-T plant has effectively captured the world specialty wax market
2000 While Saudi Arabia produced about 8 million barrels of oil per day in 2000 the world flared (burned) or re-injected associated gas equivalent to 72 million barrels per day of clean synthetic fuels Worldwide environmental legislation requiring ultra-low sulphur and aromatic levels in fuel will cost billions in oil refinery upgrading
2002 Nearly every major oil company is either developing their own F-T technology forming joint ventures or scrambling to do so ExxonMobil has spent over $500 MM Chevron formed a joint venture with Sasol Statoil has formed a joint venture with Mossgas Conoco built a $400MM test plant in Oklahoma BP completed its pilottest plant in Alaska Shell has announced 7 new projects
2004 50 new Fischer-Tropsch projects have been announced These projects total over 900000 BPD capacity Some of these projects are pilot plants some are feasibility studies for clients and some have started construction
2005 In South Africa Mossel Bay GTL Expansion operated by PetroSA with a capacity of 15000bpd
2006 In Qatar ORYX GTL Phase 1 operated by SasolQatar Petrol with a capacity of 32400 bpd
2011 In Qatar Pearl GTL Phase 1 operated by Shell with a capacity of 70000 bpd
2011 In Qatar Pearl GTL Phase 2 operated by Shell with a capacity of 70000 bpd
2013 In Nigeria Escravos operated by ChevronNNPC with a capacity of 34000bpd
2017 In Uzbekistan Oltin Yorsquol GTL operated by SasolUNGPetron with a capacity of 38000bpd
2018-19
In USA Sasol Lousiana operated by Sasol with a capacity of 96000bpd
Firm proposed large-scale GTL capacity outlook
Chapter 1 General Introduction
34
Fig 15 The Sasol Synfuels plant at Secunda South Africa
Fig 16 ldquoShell Middle Distillate Processrdquo in Bintulu Malaysia
Fig 17 Franz Fischer and Hans Tropsch
12 Present Situation of Fischer-Tropsch Technology
High energy prices and concerns about the environmental consequences of
greenhouse gases (GHG) emissions lead a number of national governments to
provide incentives in support of the development of alternative energy
Chapter 1 General Introduction
35
sources making renewables the worldrsquos fastest-growing source of energy in
the outlook
According to the Annual Energy Outlook 2013 [37] the aggregate fossil fuel
share of total energy use falls from 82 percent in 2011 to 78 percent in 2040 in
the Reference case while renewable use grows rapidly (Fig 17) The
renewable share of total energy use grows from 9 percent in 2011 to 13
percent in 2040 in response to the federal renewable fuels standard
availability of federal tax credits for renewable electricity generation and
capacity during the early years of the projection and state renewable portfolio
standard (RPS) programs
Increased vehicle fuel economy offsets growth in transportation activity
resulting in a decline in the petroleum and other liquids share of fuel use even
as consumption of liquid biofuels increases Biofuels including biodiesel
blended into diesel E85 and ethanol blended into motor gasoline (up to 15
percent) account for 6 percent of all petroleum and other liquids consumption
by energy content in 2040
Consumption of petroleum and other liquids peaks at 198 million barrels per
day in 2019 in the AEO2013 reference case and then falls to 189 million barrels
per day in 2040 (Figure 18)
Fig 18 Primary energy use by fuel 1980-2040 (quadrillion BTU)
Chapter 1 General Introduction
36
The transportation sector accounts for the largest share of total consumption
throughout the projection although its share falls to 68 percent in 2040 from
72 percent in 2012 as a result of improvements in vehicle efficiency following
the incorporation of CAFE standards for both LDVs and HDVs
An increase in consumption of biodiesel and next-generation biofuels (include
pyrolysis oils biomass derived Fisher-Tropsch liquids and renewable feedstocks
used for on-site production of diesel and gasoline) totaling about 04 million
barrels per day from 2011 to 2040 is attributable to the EISA2007 RFS
mandates The relative competitiveness of CTL and GTL fuels improves over the
projection period as petroleum prices rise In 2040 CTL and GTL together
supply 03 million barrels per day of nonpetroleum liquids
Fig 19 Consumption of petroleum and other liquids by sector 1990-2040 (million
barrels per day)
2 Oil prices and total energy consumption
The importance of the research in FTS is directly dependent of the oil prices
and the total energy consumption So it is so important to meet the
projections of these variables before to make every kind of investments on this
area In AEO2013 oil prices are represented by spot prices for Brent crude
Prices rise in the Reference case from $111 per barrel in 2011 to about $117
Chapter 1 General Introduction
37
per barrel in 2025 and $163 per barrel in 2040 (Table 1) The price rise starts
slowly then accelerates toward the end of the projection period
Market volatility and different assumptions about the future of the world
economy are reflected in the range of oil price projections for both the near
and long term however most projections show oil prices rising over the entire
projection period
Table 1 Comparisons of oil price projections 2025 2035 and 2040 (2011 dollars per
barrel)
As regard the total energy consumption the in table 2 there are four different
projections made by other organizations (INFORUM IHSGI ExxonMobil and
IEA) [37]
Chapter 1 General Introduction
38
Table 2 Comparisons of energy consumption by sector projections 2025 2035 and
2040 (quadrillion BTU)
ExxonMobil includes a cost for carbon dioxide (CO2) emissions in their
projection which helps to explain the lower level of consumption in their
outlook Although the IEArsquos central case also includes a cost for CO2 emissions
its Current Policies Scenario (which assumes that no new policies are added to
those in place in mid-2012) is used for comparison in this analysis because it
corresponds better with the assumptions in the AEO2013 Reference case
ExxonMobil and IEA show lower total energy consumption across all years in
comparison with the AEO2013 Reference case Total energy consumption is
Chapter 1 General Introduction
39
higher in all years of the IHSGI projection than in the AEO2013 Reference case
but starts from a lower level in 2011
For the transportation sector the difference could be related to vehicle
efficiency as the INFORUM projection for motor gasoline consumption (2
quadrillion Btu lower than AEO2013) is comparable with the EIA projection in
AEO2012 which did not include the efficiency standard for vehicle model years
2017 through 2025
IHSGI projects significantly higher electricity consumption for all sectors than in
the AEO2013 Reference case which helps to explain much of the difference in
total energy consumption between the two projections
Then the projections make possible the investment on research in Fischer ndash
Tropsch synthesis
The process known as Gas to Liquid (GTL) was based on two steps
Steam reforming of natural gas into syngas
Fischer Tropsch synthesis from syngas into synthetic liquid fuels
Recently (2004-2006) the massive growth of GPN (Gross National Product) in
China and India has caused crude oil process to rise continuously and FTS
(including both coal and biomass as feedstock BTL) has become once more an
appealing technology Recent interest in FT technology especially in Europe and
South America is driven by a focus on the gasification of biomass into fuel [38]
(BTL)
Biomass to Liquid via FischerndashTropsch (BTL-FT) synthesis is gaining increasing
interests from academia and industry because of its ability to produce carbon
neutral and environmentally friendly clean fuels
In the BTL-FT process biomass such as woodchips and straw stalk is firstly
converted into biomass-derived syngas (bio-syngas) by gasification
Chapter 1 General Introduction
40
Bio-syngas resulting from biomass gasification contains CO H2 CO2 CH4 and
N2 in various proportions [39 40] Then a cleaning process is applied to
remove impurities from the bio-syngas to produce clean bio-syngas which
meets the FischerndashTropsch synthesis requirements Cleaned bio-syngas is then
conducted into a FischerndashTropsch catalytic reactor to produce green gasoline
diesel and other clean biofuels
Generally there are three main steps in the Biomass to Liquid via Fischerndash
Tropsch (BTL-FT) synthesis [41-43] Biomass is firstly converted into biomass-
derived syngas (bio-syngas) by gasification In a second step a cleaning process
is applied to the bio-syngas in order to remove impurities resulting in clean
bio-syngas which meets the FischerndashTropsch synthesis requirements Finally
the cleaned bio-syngas is then conducted into FischerndashTropsch catalytic reactor
to produce green gasoline diesel and other clean biofuels The flow sheet of
the BTL-FT process is depicted in Figure 110
Fig110 Flow sheet of the Biomass to Liquid via FischerndashTropsch Synthesis (BTL-FT)
process [44]
It is difficult to predict the composition of the gas product from a gasifier due
to the complex reactions occurred during the gasification Table 13 shows the
typical composition of gas produced from gasification of wood and charcoal
with low to medium moisture content with ambient air as the gasifying agent
in a downdraft gasifier [45] and composition of bio-syngas from biomass
gasification [46ndash48]
Chapter 1 General Introduction
41
At present the main commercial interest in FTS is the production of high
quality sulphur-free synthetic diesel fuels from natural gas currently being
flared at crude oil production wells [49-52] This renewed interest in FTS has
not just only come about as a result of abundant supply of natural gas but also
because of the global development of fuel supplies and environmental
regulations to improve air quality in cities around the world
All these facts have recently aroused renewed interest in the FischerndashTropsch
Synthesis Synthetic diesel is being promoted by the fuel industry because it
can produce super clean diesel oil fraction with high cetane number (typically
above 70) without any sulfur and aromatic compounds with low particulate
formation and low NOx and CO emission [3-4 53] as the most viable next step
towards the creation of a sustainable transport industry
Table 13 Composition of gas produced from gasification of wood and charcoal in
ambient air [45] and also the composition of typical nitrogen free bio-syngas [46ndash48]
Component Wood gas (air) Charcoal gas (air) Bio-syngas
(nitrogen free)
N2 50ndash60 55ndash65 0
CO 14ndash25 28ndash32 28ndash36
CO2 9ndash15 1ndash3 22ndash32
H2 10ndash20 4ndash10 21ndash30
CH4 2ndash6 0ndash2 8ndash11
C2H4 na na 2ndash4
BTX na na 084ndash096
C2H5 na na 016ndash022
Tar na na 015ndash024
Others na na lt0021
Chapter 1 General Introduction
42
3 Viability of GTL for the gas market
According to Brown [54] between 1950 and 2010 global volumes of GTL
product output capacity had materialized at less than 100000 bd -roughly
equivalent to the output of just one average- sized east European refinery
However the recent confluence of several factors has altered the commercial
viability of the GTL industry suggesting that wide margins and robust revenues
can be earned by converting natural gas into clean-burning liquid fuels and
other high value oil-linked commodities Broadly speaking these factors are
1) Improvements in the lifespan of the catalysts used to derive hydrocarbon
chains from natural gas (methane) and efficiency gains in the Fischer Tropsch
processes
2) The detachment of natural gas markets from oil prices and the subsequent
wide differential between the two prices courtesy of the unconventional gas
boom
3) Long-term global demand trends favouring low-emissions fuels in the
transport sector
Despite these auspicious circumstances however this paper argues that GTL
fuels will have only a limited reach into oil product markets and the transport
sector going forward While downward pressure on natural gas prices and
increasing demand for clean-burning motor fuels have ushered in visions of a
new future of transport fuels (that) will soon go global [55] the transient
conditions that had supported a favourable outlook for the proliferation of GTL
liquid fuels over the period of 2009-12 have more recently shown signs of
deterioration Moreover alternative and less capital-intensive pathways to
natural gas monetization are emerging via small-scale modular GTL plants
whose development has been encouraged by the rapidly increasing supply of
Chapter 1 General Introduction
43
unconventional and associated gas which has necessitated more practical and
localized gas monetization solutions
Commodity prices for transport fuels such as diesel are closely correlated to
crude price movements (see Fig 110) and moreover trade at a premium to
crude benchmarks depending on regional dynamics such as product balances
and cyclical demand conditions GTL products sharing identical physical
characteristics with crude-refined diesel have the potential to exploit not only
the market price differential between gas feedstock and oil prices but in
addition the spread between oil benchmark prices and oil product markets
The confluence of these dynamics leads to significantly wider margin potential
than that experienced by crude-refined alternatives in oil product markets at
least in a context defined by high oil and low gas prices Accordingly the upside
revenue potential of large-capacity GTL builds is dictated by the relatively
straightforward principle that the more capacity dedicated to products trading
at a premium to crude a plant has the higher the plants revenues will be
Fig 111 Correlation between ultra-low sulphur diesel spot prices and Brent crude
Europe offers an ideal destination for GTL-derived diesel A combination of
stringent fuel quality specifications and declining domestic supply supports a
healthy environment for gasoil and diesel imports Moreover the oil product
market is predominately driven by gasoildiesel consumption which accounted
Chapter 1 General Introduction
44
for well over half (56 per cent see Fig 111) of main product demand in 2012
As such the current application and commercialization of GTL diesel in Europe
reflects the potential of GTL diesel to impact global gasoil markets
Fig 112 Europe main oil product demand (2012)
In order to meet supranational carbon emissions targets progressively tighter
EU-wide Fuel Quality Directives have mandated a sharp reduction of sulphur
content in gasoildiesel marketed within the European Union The
specifications for sulphur content in motor fuels (gasoline and diesel) in the
road sector were reduced from 350 parts per million (ppm) in 2000 to just 10
ppm in 2009 The legislation was amended in 2011 to encompass gasoil and
diesel consumed in off-road sectors such as railways and inland navigation
and by 2012 10 ppm gasoil accounted for an estimated 80 per cent of Europe-
wide gasoil demand [54]
The gasoil produced by refineries in Europe has varying physical characteristics
in terms of sulphur content (affecting particulate emissions) cetane index
(influencing ignition quality in combustion engines) and viscosity (affecting
energy content and fuel efficiency) each influencing market value
It has been estimated that FT-GTL should be viable at crude oil prices of about
$20 per barrel The oil price has been well above $70 per barrel (more recently
Chapter 1 General Introduction
45
it has even topped above $100 per barrel) making it a very appealing for
countries that have huge reserves of natural gas but little local market for it
and no major pipeline infrastructure to ship it to larger economies
In Fig 112 it can be seen a geographical representation of the world proved
reserves for 2011
Fig 113 World proved reserves 2011 [37a]
12 Fischer Tropsch GTL Process and Chemistry
According to [56] the basic FT-GTL process consists of three fundamental steps
which require significant supporting infrastructure and a secure feed gas supply
to function effectively (Fig 113)
1 The production of synthesis gas (syngas) The carbon and hydrogen are
initially divided from the methane molecule and reconfigured by steam
reforming andor partial oxidation The syngas produced consists
primarily of carbon monoxide and hydrogen
2 Catalytic Fischer Tropsch synthesis The syngas is processed in Fischer-
Tropsch reactors of various designs depending on technology creating a
wide range of paraffinic hydrocarbons product (synthetic crude or
Chapter 1 General Introduction
46
syncrude) particularly those with long chain molecules (eg those with
as many as 100 carbons in the molecule)
3 Cracking-product workup The syncrude is refined using conventional
refinery cracking processes to produce diesel naphtha and lube oils for
commercial markets [57] By starting with very long chain molecules
the cracking processes can be adjusted to an extent in order to produce
more of the products in demand by the market at any given time In
most applications it is the middle distillate diesel fuel and jet fuels that
represent the highest-value bulk products with lubricants offering high-
margin products for more limited volume markets In modern plants
FT-GTL unit designs and operations tend to be modulated to achieve
desired product distribution and a range of products slates [58]
Fig 114 Large scale FT-GTL projects become more economically robust for the
developer if they involve integrated upstream and downstream components securing
feed gas supplies and additional revenues from NGL and condensate extracted from
the feed gas [56]
Chapter 1 General Introduction
47
The Fischer Tropsch processes are not limited to using gas derived from large
conventional non- associated natural gas as a feedstock coal seam gas
associated gas coal or biomass can all be processed using FT technologies by
changing the catalysts and work conditions (Pressure and temperature) A
secure supply of feed gas from whatever origin is important for the
commercial viability of large-scale FT-GTL plants Integrated upstream and
downstream projects therefore offer GTL project developers lower-risk returns
1) The production of synthesis gas (syngas)
Synthesis gas (ldquosyngasrdquo) is typically produced using either partial oxidation or
steam reforming processes [59] Syngas is an intermediate gas feed for many
different petrochemical processes including a range of GTL alternative
technologies
Partial
Oxidation
CH4 + frac12O2 CO +
2H2 (exothermic)
The key components required for this approach include A combustion chamber operated at high temperatures (1200-1500degC) without catalysts Process designs to impede a competing reaction to syngas formation which involves the decomposition of methane to carbon black (due to high temperature non-catalytic nature of the chemistry) [59]
Steam
Reforming
CH4 + H2O CO + 3H2 (endothermic)
Steam reforming is usually carried out in the presence of catalyst ndasheg nickel dispersed in alumina in operating conditions involving temperatures of 850-940degC and pressure of about 3MPa The process is typically conducted in tubular packed reactors with heat recovery from flue gas used to pre-
Chapter 1 General Introduction
48
heat the feed gas or to raise steam in waste heat boilers Several well-established engineering companies offer their own variants of this process
Other possible reactions are
CO+ H2O CO2 + H2
CH4+ CO2 2CO + 2H2
2) Fischer-Tropsch synthesis
According to [55] Fischer-Tropsch synthesis is one of a several technologies to
polymerise the carbon and hydrogen components into long-chain molecules
CO + 2H2 -CH2- + H2O (very exothermic)
Which in practice operates more typically as
2CO (gas) + H2 (gas) (-CH2-)n (liquid) + CO2 (gas) + H2O
The process involves some carbon dioxide emission and watersteam
production along with the hydrocarbon liquid production
The typical FT reactions compete with the methanation (reverse of steam
reforming) reaction (and reactions that lead to the production of propane and
butane (LPG) which are also highly exothermic
CO + 3H2 CH4 + H2O
In order to promote FT reaction in preference to methanation (or LPG
reactions) the synthesis is run at low temperatures 220-350degC pressure 2-3
MPa with carefully selected catalysts (ie commonly cobalt) in reactors that
encourage the growth of long-chain hydrocarbon molecules Several
companies hold patents associated with XTL catalysts process vessels and
process sequences (eg Conoco Phillips CompactGTL ExxonMobil Rentech
Sasol Shell Syntroleum and others) however it is only Sasol and Shell that
have built large-scale commercial plants (iegt5000 barrelsday of GTL product)
Chapter 1 General Introduction
49
rather than pilot-scale or demonstration plants The industry therefore remains
in its infancy and the many patents held by relatively few companies act as a
costly barrier to entry for resource-rich gas companies and countries wishing to
use GTL as an alternative means of monetizing their gas
There are two major categories of natural gas-based FT process technology the
high-temperature and the low-temperature types
HTFT (High-Temperature Fischer-Tropsch) In HTFT because of the process
conditions and the catalysts involved the syncrude produced includes a high
percentages of short chain (ie lt10 carbon atoms) with significant amounts of
propane and butane mixed with olefins (eg propylene and butylene) These
short-chain hydrocarbons gases are typically extracted from the tail gas stream
utilizing cryogenic separation The resultant lean tail gas is recycled and mixed
with additional lean feed gas for further syngas production [60] The high-
temperature (HT) iron catalysts-based FT GTL process produces fuels such as
gasoline and diesel that are closer to those produced from conventional oil
refining The resultant GTL fuels are sulphur-free but contain some aromatics
[61] Typical process operation conditions for HTFT are temperatures of
approximately 320degC and pressures of approximately 25MPa Conversion in
HTFT can begt85 efficient [62] but not all the products are readily usable or
capable of producing high-quality transport fuels HTFT processes tend to be
conducted in either circulating fluidized bed reactors or fluidized bed reactors
[63]
LTFT (Low-Temperature Fischer-Tropsch) LTFT involves the use of low-
temperature (LT) cobalt-catalyst-based processes either in slurry-phase
bubble-column reactors (eg Sasol) or in multi-tubular fixed bed reactors (eg
Shell) LTFT produces a synthetic fraction of diesel (GTL diesel) that is virtually
free of sulphur and aromatics Typical process operation conditions for LTFT are
Chapter 1 General Introduction
50
temperatures of approximately 220degC to 240degC and pressures of approximately
20 to 25 MPa Conversion in LTFT is typically only about 60 with recycle or
the reactors operating in series to limit catalyst deactivation [62]
The primary focus of most large-scale FT technologies in current market
conditions is to produce high-quality low-emissions GTL diesel jet fuel and
naphtha (for petrochemical feedstock or gasoline blending)
3) Cracking ndash product workup
From [56] FT GTL plants can be configured to produce a wide range of
products from lubricating base oils and waxes through to petrochemical
naphtha and specialty chemicals Most of the already developed and planned
plants target the production of diesel fuels (C14-C20) together with some
kerosenejet fuel (C10-C13) naphtha (C5-C10) lubricants (gtC50) and a little LPG
(C3-C4)- By adjusting operating conditions in the Fischer Tropsch reactor the
mix of products can be altered This enables FT GTL products to be produced in
quantities that enable them to target the high-value product markets of
petroleum products produced by conventional oil refineries
However the yield pattern from a typical FT GTL plant is significantly different
to that rom a catalytic cracking crude oil refinery (Fig 114) Typically the
diesel yield of FT GTL plant is around 70 much higher than for crude oil
refineries which is typically some 40 [64]
From Fig 114 the products derived from upgrading syncrude produced by FT-
GTL differ significantly from those produced by refining barrel of crude oil
Notably FT GTL produces more high-value zero-sulphur products especially
middle distillates On the other hand refining crude oil particularly heavy oil
produces substantial quantities of low-value fuel oil ie more than prevailing
markets can consume Source modified from [65]
Chapter 1 General Introduction
51
Most oil refineries yield some low-value fuel oil the yield depending on the
quality of the fuel processed and the type and capacity of the refineryrsquos fuel-oil
conversion units By contrast the FT GTL plants are configured to yield only
higher-value (relative to crude oil) light and middle distillate products From a
plant with existing technology the yield of middle distillates (gasoildiesel and
kerosene) is nearly a third more of the total product slate than that from a
typical oil refinery [66]
As predicted a decade ago [67] globally diesel demand is growing rapidly at
some 3 a year more quickly than other refinery products Against this
backdrop refiners face significant challenges to meet diesel demand and
quality in the future as crude oil supply becomes heavier and sourer [68]
Fig 115 Refinery Volume Yields versus FT GTL Yields
From [56] for FT-GTL to be commercial at oil prices of less than about
40$barrel plant capital costs operating costs and feed gas costs all have to be
substantially lower on a unit basis than large-scale plants built in recent years
have been able to deliver If the unit capital cost of an FT-GTL plant is close to
100000$barrelday the operating cost of that plant is close to 20$barrel of
Chapter 1 General Introduction
52
product and the feed gas costs in the vicinity of 5$MMBtu the liquid products
would cost in the vicinity of 100$barrel and the economics of such as a plant
do not look so inviting in 2012 market conditions The industry has to achieve
lower plant and feed gas costs to be economically attractive
Fischer- Tropsch Synthesis Opportunities and challenges
GTL technologies offer the potential to reduce global dependency on crude-oil
derived transportation fuels They also offer substantial opportunities for the
owners of stranded gas to diversify the markets into which they deliver their
gas-derived liquid products particularly targeting the large and rapidly growing
global middle distillate markets (See Fig 116)
However the technologies are complex costly and tightly held by a few
companies holding patents for the key process steps which present significant
barriers to entry for building large-scale plants This also renders the building of
large-scale plants challenging for the gas resource holders in terms of capital
costs access to technology and long-term transfer of GTL technologies
At the current time Fischer Tropsch technologies dominate GTL applications for
large scale-plants Technology breakthroughs are required if methane-to-
gasoline or methane-to-olefin plants are to displace traditional refinery and
petrochemical routes to those products On the other hand dimethyl-ether
(DME) has a growing market in Asia particularly in China which is likely to
expand if the one-step process avoiding the production route via methanol is
successfully scaled up as planned and transportation fuel markets are
developed for DME
Chapter 1 General Introduction
53
Fig 116 The GTL Industry Opportunities and Challenges
References
[1] Michael Talmadge Mary Biddy and Abhijit Dutta Syngas Upgrading to Hydrocarbon Fuels Technology Pathway National Renewable Energy Laboratory Technical Report NRELTP-5100-58052 PNNL-22323 March 2013 httpwwwostigovbridge [2] C Pirola C Bianchi A Di Michele P Diodati S Vitali V Ragaini Catal Lett 131 294-304 (2009) [3] M S Hadnadev-Kostic J Tatjana T Vulic R Marinkovic-Neducin A D Nikolic B Jovic Journal of Serbian Chemical Society 76 (12) (2011) 1661ndash1671 [4]E Lira C Loacutepez F Oropeza M Bartolini J Alvarez M Goldwasser F Loacutepez J Lamonier J Peacuterez Journal of Molecular Catalysis A Chemical 281 (2008) 146ndash153 [5] Qinghong Zhang Jincan Kang and Ye Wang ChemCatChem 2 (2010) 1030 ndash 1058 [6] C Perego M Ricci Catalysis Science amp Technology (2012) 2 1776ndash1786 [7] GWHuber SIborra ACorma Chemical Reviews 106 (2006) 4044
Chapter 1 General Introduction
54
[8] PL Spath and DC Dayton Preliminary Screening - Technical and Economic Assessment of Synthesis Gas to Fuels and Chemicals with Emphasis on the Potential for Biomass-Derived Syngas NRELTP-510-34929 December 2003 [9] F Fischer and HTropsch BrennstChem 4 (1923) 276 [10] A Martinez C Lopez F Marquez IJ Diaz Catalysis 220 (2003) 486 [11] John L Casci C Martin Lok Mervyn D Shannon Catalysis Today 145 (2009) 38ndash44 [12] MEDry in Enciclopedia of Catalysis ITHorvarth Ed JWileyampSons New York (2003) 247 [13] Fischer-Tropsch Technology in Studies in Surface Science and Catalysis Elsevier New York (2004) [14] GPVaan Deer Laan AACMBeenackers Catalysis Reviews-SciEng 41(3amp4) (1999) 255 [15] HSchulz Applied Catal A 186 (1999) 3 [16] GP van der Laan AACMBeenackers Applied Catal A 193 (2000) 39 [17] RJOrsquoBrien LXu SBao ARaje BHDavis Applied Catalysis A general 196 (2000) 173 [18] V Roberto Calderone N Raveendran Shiju Daniel Curulla Ferreacute and Gadi Rothenberg Green Chemistry 2011 13 1950ndash1959 [19] E D Smit and B MWeckhuysen Chem Soc Rev 2008 37 2758ndash 2781 [20] Qinghong Z Weiping D Ye W Review Recent advances in understanding the key catalyst factors for Fischer-Tropsch synthesis J Ener Chem 2013 2227ndash38
[21] AY Khodakov WChu P Fongarland Chem Rev 107 (2007) 1692 [22] BHDavis Catal Today 84 (2003) 83 [23] GWHuber SIborra ACorma ChemRev 106 (2006) 4044 [24] J Xu CHBartholomew J Phys Chem B 109 (2005) 2392 [25] HB Zhang GL Schrader JCatal 95 (1985) 325 [26] ES Lox GB Marin E de Graeve P Bussiere Appl Catal A 40 (1988) 197 [27] PSabatier and JDSenderens CRHebdSeance AcadSci 134 514 680 (1902) [28] AMittash AdvCatal 2 (1950) 81 [29] EHoudry WFBurt AEPew WAPeters Pet Refiner 17 (1938) 574 [30] H Pichler AdvCatal 4 (1952) 271 [31] MEDry Chemtech 12 (1982) 744 [32] RBAnderson ACS SympSer 222 (1983) 389 [33] GNatta in ldquoCatalysisrdquo (PH Emmett ed) Vol3 p349 Van Nostrand-Reinhold Priceton New Jersey 1955 [34] GNatta UColombo IPasquon in ldquoCatalysisrdquo (PH Emmet Ed) Vol5 p131 Van Nostrand-Reinhold Princeton New Jersey 1957
Chapter 1 General Introduction
55
[35] RBAnderson Fuel 41 (1962) 295 [36] MJ Baird RRSchehl WPHaynes and JTCobb Ind Eng Chem Prod Res Dev 19 (1980) 175 [37] EIA Annual energy outlook 2013 Available at httpwwweiagovforecastsaeopdf0383(2013)pdf accessed on 16 august 2013 [37a] US Energy Information Administration Available at httpwwweiagovcountriesindexcfmview=reserves accesed on 16 august 2013 [38] MJ Prins KJ Ptasinski FJJG Janssen Fuel Process Technol 86 (2005) 375 [39] Klass DL Biomass for Renewable Energy Fuels and Chemicals Academic Press San Diego CA USA 1998 [40]Beenackers AACM Swaaij WPM Thermochemical Processing of Biomass Butterworth London UK 1984 [41] Demirbas A Energy Educ Sci Technol 17 (2006) 27ndash63 [42] Tijmensen MJA Faaij APC Hamelinck CN van Hardeveld MRM Biomass Bioenergy 23 (2002) 129ndash152 [43]Hamelinck CN Faaij APC den Uil H Boerrigter H Energy 29 (2004) 1743ndash1771 [44] J Hu F Yu Y Lu Catalysts 2 (2012) 303-326 [45] Stassen HEM Knoef HAM Biomass Technology Group University of Twente Enschede The Netherlands 1993 [46] Demirbas A Prog Energy Combust Sci 33 (2007)1ndash18 [47] Demirbas A Energy Sources A 29 (2007) 1507ndash1512 [48] Demirbas A Energy Sources A 30 (2008) 924ndash931 [49] MJPrins KJPtasinski FJJGJanssen Fuel Process Technol 86 (2005) 375 [50] CLIandoli SKjelstrup EnergyampFuels 21 (2007) 2317 [51] JJacometti AEkvall Shell in the Middle East 17 (2002) 1 [52] GCoupe Step on the gas in The Engineer 6 (2004) [53] T Fu Y Jiang J Lv Z Li Fuel Process Technol 110 (2013) 141ndash149 [54] C Brown The Oxford Institute for Energy Studies May 2013 ISBN 978-1-907555-74-9 Available on httpwwwoxfordenergyorgwpcmswp-contentuploads201305WPM-50pdf [55]K MacKenzie Financial Times 30 April 2013 httpftalphavilleftcom201304301473572where-are-all-those-natural-gas-fleet-conversions [56] D Wood C Nwaoha B Towler Journal of natural gas science and engineering 9 (2012) 196-208
Chapter 1 General Introduction
56
[57] Agee K Fundamentals of gas to liquids 2nd ed London Petroleum economist 29 (2005) 30-31 [58] Rahmin II Oil and gas Journal (2005) [59]Rahmin II Gas-to-liquid technologies Recent advances Economics Prospects 26th IAEE Annual International Conference June 2003 Prague Pp 1-36 [60] Minnie R et a 2005 Where it all began In Fundamentals of Gas to Liquids second ed Petroleum Economist London pp 27e29 (Chapter 28) [61] Waddacor M 2005 Converting gas into ultra-clean diesel in three steps In Fundamentals of Gas to Liquids second ed Petroleum Economist London pp 46-49 (Chapter 41) [62] De Klerk A 2012 Gas-to-liquids conversion In Natural Gas Conversion Technologies Workshop of ARPA-E US Department of Energy Houston TX 13 January 2012 [63] Velasco JA Lopez L Velasquez M Boutonnet M Cabrera S Jaras S 2010 Gas to liquids a technology for natural gas industrialization in Bolivia Journal of Natural Gas Science and Engineering 2 (5) 222e228 [64] Pytte T 2005 GTL diesel the way forward In Fundamentals of Gas to Liquids second ed Petroleum Economist London pp 32e35 (Chapter 31) [65] Fleisch TH Sills R Briscoe M Freide JF 2003 GTL-FT in the Emerging Gas Economy Fundamentals of Gas to Liquids Petroleum Economist p 39e41 [66] Corke M 2005 Securing a market In Fundamentals of Gas to Liquids second ed Petroleum Economist London pp 36e38 (Chapter 32) [67] Cherrillo RA Clark RH Virrels IG 2003 Shell Gas to Liquids in the Context of a Future Fuel Strategy e Technical Marketing Aspects 9th Diesel Engine Emissions Reduction Workshop Newport RI 24e28 Aug 2003 [68] Wood DA 2007 Consequences of a heavier and sourer barrel Petroleum Review April ed 30e32
57
Chapter 2 Chemistry of Fischer-Tropsch Synthesis
The FischerndashTropsch (FT) reaction is a heterogeneous catalytic reaction that
converts synthesis gas that is a mixture of carbon monoxide (CO) and
hydrogen (H2) into mainly linear hydrocarbons in the range C1 to C100 It is a
surface polymerization reaction that uses monomers formed by hydrogenation
of adsorbed CO in order to produce hydrocarbons and oxygenated products
with a broad range of chain length and functionality
The chemistry of the process can be described by the set of irreversible and
equilibrium reactions
According to Glasser et al [1] the FischerndashTropsch (FT) reaction mechanism is
still an issue of contention [2 3] Many apparently different mechanisms have
been proposed but common to them all is the concept that a stepwise chain
growth process is involved This is supported by the fact that the carbon
number product distributions calculated on probabilities of chain growth match
the experimentally observed results obtained in different reactor types and
sizes over widely varying process conditions with different catalysts [1]
There are some important aspects related to the FTS that will be discuss in this
chapter to better understand the chemistry of this process
1) FT thermodynamics
2) FT reaction mechanism
3) FT products selectivity
4) FT kinetics
5) Influence of FT process conditions
Chapter 2 Chemistry of Fischer Tropsch Synthesis
58
21 FT Thermodynamics
The Fischer-Tropsch Synthesis is a highly exothermic reaction [4]
n CO + (2n +1) H2 CnH2n+2 + n H2O Hdeg - 40 kcalmol (1)
n CO + 2n H2 CnH2n + n H2O Hdeg - 35 kcalmol (2)
n CO + 2n H2 CnH2n+1 OH + (n-1) H2O Hdeg - 35 kcalmol (3)
Thermodynamically the formation of methane and other hydrocarbons
is energetically favourable that means negative Gibbs energy values for
reaction (1)-(3)
In figure 21 standard Gibbs energy variation for the production of
hydrocarbons and alcohols is reported as a function of temperature
0
80
60
40
20
- 20
- 40
- 60
- 80
- 100
- 120
- 140
500 1000
Temperature K
G
degn
kJ
mol
of
CO
CH3OH
C2H5OH
CH4
C2H6
C2H4
C8H16
C4H8
Figure 21 Standard Gibbs energy of some FTS products [5]
From the diagram reported in figure 21 it can be deduced that methane
formation is highly favoured over that of the alcohols olefins and
hydrocarbons of heavier molecular weight In Fig 21 to keep all of the curves
on the same scale the enthalpy and free energy changes are divided by the
number of carbons atoms in the product Thus the equilibrium constant for
the reaction is given by RTnGnK exp 0
Chapter 2 Chemistry of Fischer Tropsch Synthesis
59
On the basis of thermodynamics a vast variety of molecules can be produced
in synthesis reaction up to 400degC and for some up to 500degC particularly at
elevated pressures including acetaldehyde and higher aldehydes ketones
esters Usually a broad spectrum of types of molecules carbon numbers and
carbon-chains structures is produced and the distribution of molecules
depends on the selectivity of the catalyst employed Generally the reaction
products are not in thermodynamic equilibrium with other product molecules
or reactants
Summarizing it is important to highlight some important aspects of the FT
thermodynamics
It is energetically possible to produce a vast array of hydrocarbons and organic
molecules by the hydrogenation of CO and related process such as the H2 + CO2
and the H2O + 3 CO reactions Most of these reactions are highly exothermic
A variety of reactions of synthesis products are thermodynamically possible
such as dehydration of alcohols hydrogenation of olefins hydrogenolysis of
paraffins and a number of isomerization reactions
On an energetic basis olefins and alcohols can be ldquoincorporatedrdquo into synthesis
reactions to produce higher molecular weight hydrocarbons in any amount
Paraffins element carbon or carbidic carbon can be ldquoincorporatedrdquo into
synthesis reactions to only a limited extent that is part of the carbon of the
hydrocarbon must come from H2 + CO
22 FT Reaction Mechanism
According to [6] FT synthesis follows the polymerization mechanism It is
generally accepted that CO undergoes dissociative or hydrogen-assisted
dissociative chemisorption on the surface of Ru Co or Fe metal or metal
Chapter 2 Chemistry of Fischer Tropsch Synthesis
60
carbide nanoparticles forming CHx (x = 0minus3) intermediates as the monomers
for polymerization The coupling between CHx monomers leads to chain
growth providing CnHm intermediates CnHm intermediates with different
carbon numbers can then undergo hydrogenation or dehydrogenation to
afford paraffins or olefins as the final products An early work pointed out that
the coupling between methylene (CH2) groups mainly accounted for the chain
growth but recent theoretical studies suggested that the situation was more
complicated [7-12] Depending on the identity and the structure of the surface
concerned the monomeric CHx species for polymerization may be different
The calculation of energy barriers suggests that the couplings of (CH+CH)
(C+CH) (C+CH2) or (CHx+HCO) may all be possible [7-12]
Since its discovery many efforts have been made to identify the surface
species that lead to chain initiation and chain growth The FT reaction
mechanism is still an issue of contention
There are some mechanisms like the mechanism proposed by Fischer in 1926
(lsquocarbidersquo theory) but it has a problem he did not explain the production of
relatively large amounts of oxygenated products ie alcohols
According to [13] elementary steps of FTS can be grouped into few basic sets
including
(1) reactant (CO and H2) adsorption
(2) CO activation (or chain initiation)
(3) chain propagation and
(4) chain termination (product formation)
Fig 22 shows possible CO activation steps in the carbide (also referred to as
the alkyl or methylene) and the CO-insertion mechanisms For the classical
carbide mechanism the CO activation step consists of a direct CO dissociation
(ie the C O bond is severed before C is hydrogenated) whereas in the CO-
Chapter 2 Chemistry of Fischer Tropsch Synthesis
61
insertion pathway CO is first hydrogenated and only then is the C O bond
broken to give the chain starter (CH3S) Newer modification of the carbide
mechanism assumes that hydrogen assists in the C O bond scission The
primary difference between the two mechanisms is the type of species being
inserted into the growing chain CHx for the carbide (most often CH2) and
adsorbed CO for the CO-insertion mechanism Storsaeligter et al [14] compared
versions of the two mechanismsndash carbide (including direct and H-assisted CO
dissociation) and CO-insertion ndash using the UBI-QEP (unity bond index ndash
quadratic exponential potential) method [15] and micro-kinetic modeling ofC1
and C2 species formation Their results showed that the chosen CO-insertion
pathway had a lower activation barrier compared to both direct and H-assisted
CO dissociation mechanisms that were utilized Based on these findings they
suggested that the CO-insertion mechanism is likely the main mechanism of
FTS
Fig 22 Examples of CO activation pathways (a) direct CO dissociation (carbide
mechanism) and (b) H-assisted CO dissociation (carbide mechanism) (c) CO hydrogenation (CO-insertion mechanism) [13]
Chapter 2 Chemistry of Fischer Tropsch Synthesis
62
The following Figure (23) [16] shows another representation of the chain
initiation growth and termination deeply find in literature
Chain Initiation
CO C O C O
M M M
+
C
M
H2
CH2
MCH3OH
H2O
INITIATION AND C1 COMPOUNDS
M
+ C
GRAPHITE
OHH
H2
H2
H2CH4
Chain Growth
Chain Termination
Fig 23 Different steps of the reaction mechanism in FTS
Fig 24 shows a simplified scheme for the formation of chain starters and
incorporation into growing chains The CH3 groups formed as a precursor to
methane are assumed to act as chain growth centres Addition of a hydrogen
atom produces methane while insertion of a CH2 group into the metal-carbon
Chapter 2 Chemistry of Fischer Tropsch Synthesis
63
bond of a CH3 group produces an ethyl group and continuation of this type of
reaction gives rise to a spectrum of adsorbed alkyl groups
C CH2CH
H H
CH3H
CH2
R
chain starter
chain growth
(incorporation)
CH3CH3
CH2
H
CH4
R
Fig 24 Simplified kinetic scheme of the successive hydrogenation of surface carbon
yielding chain starters and incorporation into growing chains
The oxygen released by CO dissociation is removed from the catalyst as either
H2O or CO2
As far as hydrogenation process is concerned there is still controversy on the
reaction mechanism first of all it is uncertain if the monomer formation
proceeds via hydrogenation of dissociated or undissociated CO Moreover
methyne methylene and methyl groups are assumed to be in equilibrium by
some authors on the basis of studies with metal clusters containing these as
ligands while others postulate that the hydrogenation of surface carbon and of
CHx species is an irreversible reaction
The nature of primary FT products reflects the nature of the surface bonded
intermediates from which they originate Primary hydrocarbon FT products are
preferentially straight chain terminal olefins and straight chain paraffins The
formation of primary paraffin molecule is represented as
Chapter 2 Chemistry of Fischer Tropsch Synthesis
64
R-CH2-CH2
HR-CH2-CH3
Terminally bonded (alpha) alkyl species on the catalyst surface can be
considered the most common intermediates
Olefin formation is represented as dissociative desorption from the alkyl
species (-elimination)
R-CH2-CH2R-CH=CH2 + H
The ratio probabilities of primary desorption as a paraffin or as an olefin is
commonly 025 That means that the reaction of desorption as a paraffin is
much less probable than the reaction of desorption as an olefin It is suggested
that the chain propagation is favoured against chain termination because of
the principle of lsquoselective inhibitionrsquo ie termination reaction are more
inhibited than propagation reaction by steric hindrance This effect is more
pronounced with paraffin than with olefin formation In fact while paraffin
desorption requiring the reaction between alkyl and H involves two metal
sites olefin desorption need an intermediate ie a transition state with and
bonding at the same metal site
R-CH2-CH2R-CH=CH2
HM M
R-CH=CH2 H
M
+
Chapter 2 Chemistry of Fischer Tropsch Synthesis
65
In both cases however this might not be easily accessible under the condition
of strong competitive chemisorption and strong spatial constraints
Chain termination can also occur by CO insertion into surface alkyls a step that
leads to the formation of predominantly primary alcohols [16]
23 FT Products Selectivity
The products from the FT on Co Fe and Ru show the following characteristics
[17]
1) the carbon-number distributions for hydrocarbons gives the highest
concentration for C1 and decrease monotonically for higher carbons
number although around C3-C4 often a local maximum is observed
2) Monomethyl-substituted hydrocarbons are present in moderate
amounts whereas dimethyl products are present in significantly smaller
amounts than monomethyl None of these branched products contain
quaternary carbons atom on Co Fe and Ru
3) Olefins from iron catalysts exceed 50 of the hydrocarbon products at
low carbon numbers and more than 60 of these -olefins The ethane
selectivity is low in comparison to propene The olefin content decrease
asymptotically to zero with increasing carbon number on Co Ru and Fe
catalysts
4) A change in chain growth parameter in the distribution is only observed
for linear paraffins and not for olefins
5) Yields of alcohols are maximal at C2 and decrease with carbon number
Low yields of methanol are probably the result of thermodynamic
limitations
Chapter 2 Chemistry of Fischer Tropsch Synthesis
66
Investigations of the carbon number spectrum based on the assumption of a
stepwise chain mechanism were carried out in considerable detail by several
authors
Herrington [18] described the distribution of paraffins wax using individual
chain termination probabilities for each chain size and he found that the
probability of chain growth in FT synthesis over a cobalt catalyst did not change
much with the chain length of the hydrocarbon
Anderson investigated the spectrum of a number of different catalysts The
plot of log Wnn against carbon number gave straight line over a fairly large
carbon number range (Wn is the mass fraction and n the carbon number) This
indicated again that the probability of chain growth was fairly constant [18]
Schulz modified and applied to the FT product spectrum the Flory equation
dealing with the product distribution in a polymerization process As pointed
out by Anderson the Schulz-Flory treatment was no different from the earlier
treatment and led to the equation henceforth referred as the Anderson-
Schulz-Flory (ASF) model
Wnn = (1- ) 2
n-1 (1)
where n is the number of carbon atoms in the product Wn is the weight
fraction of product containing n carbon atoms is the chain growth
propagation probability expressed by the equation
= rp (rp + rt) (2)
where rp is the propagation rate constant and rt is the termination rate
constant
The value is independent of carbon number it is estimated by a least-
squares linear regression of the logarithmic form of equation (3) the slope and
intercept both yielding
ln (Wnn) = ln (1-)2 + (n-1) ln (3)
Chapter 2 Chemistry of Fischer Tropsch Synthesis
67
Different factors have an influence on the alpha parameter such as process
conditions type of catalyst and chemical promoters [19 20] The ASF product
distribution as a function of α is depicted in Figure 25
The ASF equation did not distinguish between different product types In
practice a multicomponent product mixture is formed According to the ASF
model the maximum selectivity toward C2minusC4 olefins is achieved with an alpha
value between 04 and 05 One of the most efficient ways of shifting product
selectivity to low alpha values is by increasing reaction temperature However
a decrease on the chain growth probability results in an increase of methane
selectivity as indicated by the ASF product distribution This effect was long
considered a major restriction for the industrial application of the direct
conversion of syngas into lower olefins via the FischerminusTropsch synthesis [21
22] Negative deviations of the ASF model for methane selectivity have been
observed for iron-based catalysts [23 24] Schwab et al [23] proposed that Fe
catalysts possess different catalytic sites some in charge of CminusC coupling for
the growth of the carbon chain and others responsible for methane formation
Fig 25 AndersonminusSchulzminusFlory (ASF) model for the prediction of product distribution
Deviations from ASF Distribution Anderson-Schulz-Flory Distribution is a well-
accepted model for describing product selectivity in FT synthesis especially for
Chapter 2 Chemistry of Fischer Tropsch Synthesis
68
its simplicity nevertheless significant deviations have been noticed and
reported in literature
1) Methane selectivity is in general higher than predicted theoretically by ASF
kinetics Several mechanisms have been postulated to explain these
experimental data [25-26]
2) Anomalies of Ethane and Ethene The maximum C2 selectivity is expected to
be about 30 wt while in practice the maximum found is only about 18 wt It
is commonly observed for iron as well as for cobalt and ruthenium catalysts
that the C2 selectivity is lower than the C1 and C3 selectivity [17]
3) Change in Chain Growth Parameter is defined by ASF model as a
parameter independent of the product carbon number n nevertheless it has
been observed that at a carbon number of about 10 the slope of the
semilogarithmic mole fractions of hydrocarbons against carbon number
increases This phenomenon has been described on iron cobalt and ruthenium
catalysts [27] Suggestions for the increased chain growth parameter or two
probabilities of chain growth are the occurrence of different catalytic sites [28]
or the existence of different chain termination reactions [25] Several attempts
to model hydrocarbon distribution with two different values of have been
reported However the assumption of multiple catalytic sites cannot explain
the decrease of the olefin-to-paraffin ratio with increasing chain length
decreasing space velocity and increasing H2CO ratios in the reactor Kuipers et
al [29] stated that the occurrence of secondary reactions gives the most
reasonable explanation for the deviations from the ASF distribution
24 FT kinetics According to Glasser et al [1] kinetic models of FTS on cobalt iron and
ruthenium catalysts have received considerable attention [30-35] from
Chapter 2 Chemistry of Fischer Tropsch Synthesis
69
researchers in the past but not recently The major problem in describing the
FT reaction kinetics is the apparent complexity of the reaction mechanism and
the large number of species involved When one looks at the kinetic studies in
the literature one finds that there are a variety of rate expressions as well as a
wide range of activation energies for both Co and Fe catalysts This raises
questions about which of these data kinetic parameters and rate expressions
can be relied on for estimating reaction rates andor conducting preliminary
reactor design [36] This strongly suggests that the complex FT reaction
behavior may not be described efficiently by kinetics alone This point is
addressed at a later stage
However the proposed mechanism used a variety of surface species and
different elementary reaction steps resulting in empirical power-law
expressions for the kinetics However also Langmuir-Hinshelwood-Hougen-
Watson (LHHW) and Eley-Rideal type of rate equations have been applied
based on a reaction mechanism for the hydrocarbon-forming reactions In most
cases the rate-determining step was assumed to be the formation of the
monomer These rate expressions for the consumption of synthesis gas mainly
differ in the monomerrsquos nature and in the adsorption of CO H2 and products
(H2O and CO2) on the catalyst surface Ideally the development of kinetic rate
expressions should be based on each possible rate determining process in a
well-defined mechanistic scheme in the hydrocarbon forming reactions Kinetic
studies of the consumption of synthesis gas on cobalt and in particular way
iron catalysts will be discussed in detail in this chapter Kinetic models which
describe the rate of formation of products and the water gas shift reaction will
not be discussed here their studies are reported in [17 37]
1) Overall conversion of synthesis gas
Chapter 2 Chemistry of Fischer Tropsch Synthesis
70
The kinetic rate equations presented for the synthesis-gas consumption do not
present a uniform picture In general the FT synthesis is simplified as a
combination of the FT reaction and the water-gas-shift reaction
CO + (1 + m2n) H2 1n CnHm + H2O (RFT) (4)
CO + H2O CO2 + H2 (RWGS) (5)
where n is the average carbon number and m is the average number of
hydrogen atoms of the hydrocarbon products Water is a primary product of
the FT reaction and CO2 can be produced by the water-gas-shift reaction
(WGS) Iron based catalysts show a high WGS activity unlike Co and Ru based
catalysts That is reflected by the different kinetic expressions
Kinetic equation can be based on the overall synthesis gas consumption (-
RH2+CO = -RCO ndash RH2) which is independent of the WGS equilibrium or based on
CO consumption to hydrocarbon product (RFT = -RCO ndash RWGS) The rate of
synthesis gas consumption only differs from the FT reaction rate by reaction
stoichiometry -RH2+CO = (2 + m2n) RFT The kinetic rate equations presented for
the synthesis gas consumption do not present a uniform picture Table 21 [17]
gives an overview In general catalyst composition as well as reaction
conditions determine the numerical values of the intrinsic rate parameter
Moreover the rate equations are not identical thus k can be decomposed of
different combinations of kinetic and adsorption constant There is
experimental evidence that the FT activity of Fe and Co depends on the
preparation method metal loading of the catalyst and catalyst support
Table 21 Reaction rate equation for overall synthesis gas consumption rate
proposed in Ref [17]
Chapter 2 Chemistry of Fischer Tropsch Synthesis
71
Kinetic
expression
type
Kinetic expression
(a) 2HkP
(b) b
CO
a
H PkP2
(c) OHCO
COH
aPP
PkP
2
2
(d) OHHCO
COH
aPPP
PkP
22
2
2
(e) 2
2
2
2
1 HCO
COH
PaP
PkP
(f) 2
2
COCO
COH
aPP
PkP
(g) 22
2
COOHCO
COH
bPaPP
PkP
(h) 22121
2121
2
2
1 HCO
HCO
bPaP
PkP
(i) 221
21
2
2
1 HCO
HCO
bPaP
PkP
(h) 21
2
CO
HCO
bP
PkP
25 Influence of FT process conditions
A Temperature
Chapter 2 Chemistry of Fischer Tropsch Synthesis
72
The influence of temperature on the selectivity is considerable for all FT
catalysts As the operating temperature is increased the product selectivity
shifts to products with a lower carbon number on iron ruthenium and cobalt
catalysts Increasing the temperature the CO conversion increases but the
WGS reaction increases too mainly with iron based catalysts
B Partial pressure of H2 and CO
Most studies show that the product selectivity shifts to heavier products and to
more oxygenates while increasing total pressure Increasing H2CO ratios in the
reactor results in lighter hydrocarbons and lower olefin content Donnelly and
Satterfield [38] observed a decreased of the olefin to paraffin ratio from 6 to 1
by increasing the H2CO ratio from 03 to 4 Sufficiently high CO pressures
inhibit secondary reactions ie olefin isomerization hydroformilation
hydrogenation and oligomerization
C Space Velocity
The influence of space velocity of the synthesis gas (residence time) on the
selectivity has been investigated The increase of the olefin to paraffin ratio
with increasing space velocity (thus a decrease of the conversion) was
observed The selectivity to methane and olefins decreases with a decrease of
the space velocity whereas the selectivity toward paraffins remains
unchanged These findings can be ascribed by an enhancement of secondary
reactions as the residence time and the concentration of reactive -olefins
increase within bed interstices and catalyst pellets [17]
D Time-on-stream
It is known that catalyst deactivation may occur at reaction conditions and that
may affect the activity and selectivity of a catalytic system An increase of the
Chapter 2 Chemistry of Fischer Tropsch Synthesis
73
methane selectivity and low molecular weight products is observed on iron
catalyst [17] These selectivity changes can be ascribed to carbonaceous
deposits formed on sites with potassium promoters Moreover sintering leads
to a reduction of the surface area hence lowering the catalyst activity High
water pressures enhance agglomeration of initially small crystallites
E Conversion
The influence of CO conversion on the reaction selectivity must be related to
the decrease of CO partial pressure and the increase of water partial pressure
with high levels of conversion Low CO partial pressures (ie high CO
conversion) imply that secondary hydrogenation reaction are less inhibited
hence olefins are hydrogenated to inactive paraffins so that olefin selectivity
decreases Moreover secondary-cracking reactions may occur especially if high
temperature is adopted to increase conversion hence methane selectivity
increases
A schematic view of the general influence of different parameters on the
selectivity is given in Table 22
Table 22 Selectivity control in F-T synthesis by process conditions ( =
increase with increasing parameter = decrease with increasing parameter
= complex relation) From [17]
Parameter Chain Lenght
Chain branching
Olefin Selectivity
Alcohol Selectivity
Carbon deposition
Methane Selectivity
Temperature Pressure H2CO Conversion Space Velocity
Chapter 2 Chemistry of Fischer Tropsch Synthesis
74
References
[1] David Glasser Diane Hildebrandt Xinying Liu Xiaojun Lu and ornelius M Masuku Current Opinion in Chemical Engineering 2012 1296ndash302 [2] Gaube J Klein H-F J Mol Catal A Chem 2008 28360-68 [3] Davis BH Catal Today 2009 14125-33 [4] RBAnderson Academic Press (Harcourt Brace Jovanovich Publishers (1984) Chapter 2 [5] RBAnderson CBLee JCMachiels CanJChemEng 54 (1976) 590 [6] Qinghong Z Weiping D Ye W J Ener Chem 2013 2227ndash38 [7] Ciobıca I M Kramer G J Ge O Neurock M van Santen R A J Catal 2002 212(2) 136 [8] Cheng J Gong X Q Hu P Lok C M Ellis P French S J Catal 2008 254(2) 285 [9] Lo J M H Ziegler T J Phys Chem C 2007 111(35) 13149 [10] Cheng J Hu P Ellis P French S Kelly G Lok C M J Phys Chem C 2008 112(15) 6082 [11] Cao D B Li Y W Wang J G Jiao H J J Mol Catal A 2011 346(1-2) 55 [12] Zhao Y H Sun K J Ma X F Liu J X Sun D P SuH Y Li WX Angew Chem Int Ed 2011 50(23) 5335 [13] B Todic Wenping M G Jacob BH Davis Dragomir B Bukur Catal Today (2013) httpdxdoiorg101016jcattod201308008 [14] S Storsaeligter D Chen A Holmen Surf Sci 600 (2006) 2051ndash2063 [15] E Shustorovich H Sellers Surf Sci Rep 31 (1998) 1ndash119 [16] C Pirola PhD 2007-2008 Novel supported iron based Fischer-Tropsch catalysts Preparation characterization and applications [17] GPVan Der Laan AACM Beenackers CatalRev-SciEng 41 (3amp4) (1999) 255 [18] APSteynberg MEDry (Editors) Fischer Tropsch Technology Studies in surface science and catalysis 152 (2004) p623 [19] Hirsa M Torres Galvis and Krijn P de Jong ACS Catal 2013 3 2130minus2149 [20] Abello S Montane D ChemSusChem 2011 4 1538minus1556 [21] Wang C Xu L Wang Q J Nat Gas Chem 2003 12 10minus16 [22] Janardanarao M Ind Eng Chem Res 1990 29 1735minus1753 [23] Schwab E Weck A Steiner J Bay K Oil Gas Eur Mag 2010 1 44minus47 [24] Torres Galvis HM Bitter JH Khare CB Ruitenbeek M Dugulan AI De Jong KP Science 2012 335 835minus838 [25] Sarup and B W Wojciechowski Can J Chem Eng 66 (1988) 831 [26] C H Bartholomew W Lee Stud Surf Sci Catal 130 (2000) 1151 [27] RBAnderson The Fischer Tropsch Synthesis Academic Press inc (1984)
Chapter 2 Chemistry of Fischer Tropsch Synthesis
75
[28] G A Huff Jr and C N Satterfield Ind Eng Chem Process Des Dev 24 (1985) 407 [29] E W Kuipers I H Vinkenburg and H Oesterbeek J Catal 152 (1995) 137 [30] Dry ME Conversion of Syngas to Fuels and Chemicals Int Conf on Catal amp Catal Proc Cape Town South Africa 199357-66 [31] Dry ME Appl Catal A 1996 138319-344 [32] Maitilis PM Quyoum R Long HC Turner ML Appl Catal A 1999 186363-374 [33] Ribeiro FH von Wittenau AES Bartholemew CH Somorjai GA Catal Rev Sci Eng 1997 3949-76 [34] Huff GA Jr Satterfield CN Ind Eng Chem Process Des Dev 1984 23696-705 [35] Zimmerman WH Bukur DB Can J Chem Eng 1990 68292-301 [36] Bartholomew CH Farrauto RJ New Jersey Wiley 2006 [37] DPinna ETronconi LLietti RZennaro PForzatti La Rivista dei Combustibili 56 fasc2 (2002) 69 [38] TJDonnelly and CNSatterfield ApplCatalA 52 (1989) 93
76
Chapter 3 Catalysts for Fischer Tropsch Synthesis
The core of any FT process is its catalyst Only a few metals show catalytic
activity in the FT synthesis [1] As explained before the reaction is generally
assumed to start with the adsorption of CO on the catalyst surface where it
reacts with adsorbed hydrogen to afford a methylene group which in its turn
is responsible for the CndashC chain growth Probably at least two reaction paths
co-exist for the initial steps of the FT reaction one in which carbon monoxide is
adsorbed in a dissociative way (ie its CndashO bond is cleaved before any possible
reaction with hydrogen) and another in which some hydrogenation by
adsorbed hydrogen atoms precedes the CndashO cleavage [2]
So a good catalyst should adsorb both CO possibly in a dissociative way and
H2 Furthermore since metal oxide formation is always possible under FT
conditions either by dissociative CO absorption or by metal reaction with co-
produced water the metal oxide should be easily reduced under the reaction
conditions With this respect most early transition metals are not good FT
catalysts because despite their favorable CO adsorption they form very stable
oxides that are not reduced under FT conditions Iridium platinum and
palladium adsorb CO in a non-dissociative manner while metals of groups 11
and 12 hardly adsorb it none of them is an effective FT catalyst The specific
activities (ie the reaction rates per unit surface area of metal) of most of the
metals of the former Group VIII (all but osmium) were assessed under
comparable conditions and ruthenium proved to be the most active catalyst
As expected on the basis of the classical work by Sabatier (1902) nickel (and
even to a larger extent palladium) showed very high selectivity towards
Chapter 3 Catalysts for Fischer Tropsch Synthesis
77
methane formation obviously a feature not appreciated in a FT catalyst [2]
Osmium was successively evaluated but turned out to be ca 100 times less
active than ruthenium So the best FT catalysts are based on iron cobalt and
ruthenium with nickel rhodium and osmium (and possibly rhenium) being
moderately active (Fig 31) [3]
Fig 31 Catalytic activity of transition metals in the FT reaction Blue denotes early transition metals able to adsorb CO in a dissociative way they however show poor or no capability to adsorb H2 and their oxides are not reduced under usual FT conditions
accordingly these metals are not active FT catalysts Orange denotes late transition metals and a few main group elements which show poor or no CO adsorption and no FT activity Yellow shaded elements have good H2 adsorption capability and reducible oxides they however adsorb CO in a non-dissociative way and as a matter of fact are poor FT catalysts Brilliant green denotes the best FT catalysts Nickel rhodium
osmium and possibly rhenium (pale green) are moderately active [3]
However FT industrial plants require huge amounts of catalyst and ruthenium
is too rare and expensive to be used on this scale As a matter of fact cobalt
and iron are the only metals of choice for industrial applications Iron is
obviously cheaper than cobalt but to select between them a key issue is the
carbon feedstock Iron is a good water gas shift catalyst and for this reason is
particularly suitable for hydrogen-poor syngas such as those obtained from
coal or biomasses Cobalt performs better with an almost stoichiometric ratio
between hydrogen and carbon monoxide so it is preferred when the carbon
feedstock is natural gas Alternatively cobalt can also be used with hydrogen-
poor syngas provided that the H2CO molar is adjusted by a WGS unit between
the gasification and the FT reactors [1]
Chapter 3 Catalysts for Fischer Tropsch Synthesis
78
Apart from methane (which usually forms in amounts higher than expected)
the FT products distribution follows the AndersonndashSchulzndashFlory model [2] So
the FT output is always a complex mixture of products ranging from methane
to waxes formed by high molecular weight linear paraffins as explained before
A proper choice of catalyst and reaction conditions allows tuning to some
extent the composition of the final mixture but it is impossible to force the
process to produce selectively a well-defined range of products ie middle
distillates So the best strategy to maximize diesel production is to select
conditions which allow obtaining the maximum amount of long chain linear
paraffins that can be then fed to a hydrocracking stage transforming them into
a most valuable fuel
Cobalt and iron are the metals which were proposed by Fischer and Tropsch as
the first catalysts for syngas conversion Both cobalt and iron catalysts have
been used in the industry for hydrocarbon synthesis A brief comparison of
cobalt and iron catalysts [4] is reported in Table 31 Cobalt catalysts are more
expensive but they are more resistant to deactivation Although the activity at
low conversion of two metals is comparable the productivity at higher
conversion is more significant with cobalt catalysts Water generated by FT
synthesis slows the reaction rate on iron to a greater extent than on cobalt
catalysts At relatively low temperatures (200 - 250degC) chain growth
probabilities of about 094 have been reported [5] for cobalt-based catalysts
and about 095 for iron catalysts The water-gas shift reaction is more
significant on iron than on cobalt catalysts [4]
Iron catalysts usually produce more olefins Both iron and cobalt catalysts are
very sensitive to sulphur which could readily contaminate them For iron-
based catalysts the syngas should not contain more than 02 ppm of sulphur
For Co catalysts the amount of sulphur in the feed should be much less than
Chapter 3 Catalysts for Fischer Tropsch Synthesis
79
01 ppm Cobalt catalysts supported on oxide supports are generally more
resistant to attrition than iron co precipitated counterparts they are more
suitable for use in slurry-type reactors Iron catalysts produce hydrocarbons
and oxygenated compounds under different pressures H2CO ratios and
temperatures (up to 340degC) Cobalt catalysts operate at a very narrow range of
temperatures and pressures an increase in temperature leads to a spectacular
increase in methane selectivity Iron catalysts seem to be more appropriate for
conversion of biomass-derived syngas to hydrocarbons than cobalt systems
because they can operate at lower H2CO ratios [4]
Table 31 Comparison of Cobalt and Iron FT catalysts [4]
Parameter Cobalt catalyst Iron Catalyst
Cost More expensive Less expensive
Lifetime
Resistant to deactivation Less resistant to deactivation (coking carbon deposit iron carbide)
Activity at low conversion comparable
Productivity at high conversion
Higher less significant effect of water on the rate of CO conversion
Lower strong negative effect of water on the rate of CO conversion
Maximal chain growth probability
094 095
Water gas shift reaction Not very significant more noticeable at high conversion
Significant
Maximal sulphur content lt 01 ppm lt 02 ppm
Flexibility (temperature and pressure)
Less flexible significant influence of temperature and pressure on hydrocarbon selectivity
Flexible CH4 selectivity is relatively low even at 340degC
H2CO ratio 2 05-25
Attrition resistance Good (always supported) Not very resistant if not
supported
Chapter 3 Catalysts for Fischer Tropsch Synthesis
80
A large number of studies have pointed out that various factors can influence
the catalytic behaviors of a FT catalyst As summarized in Table 32 besides the
engineering factors such as reactor design and operation conditions [6-10]
there exist many catalyst factors which can exert significant influences on the
activity and product selectivity
Table 32 Typical key factors influencing the activity and product selectivity of a FT
catalyst [11]
Engineering factors Catalyst factors
(i) Reactor design
(ii) Operation
conditions
(i) identity of active metal (Ru Co or Fe) (ii) chemical state of active phase (metal oxide or carbide) (iii) support (identity pore structure physicochemical properties) (iv) promoter (typically including noble metals oxides of Mn Zr or rare earth metals alkali metal ions) (v) size of active phase (vi) microenvironment of active phase
31 Iron and Cobalt industrial FT catalysts i) Iron catalysts With iron catalysts two directions of selectivity have been
pursued One direction has aimed at a low molecular weight olefinic
hydrocarbon mixture to be produced in an entrained phase or fluid bed process
(Sasol Synthol process) Due to the relatively high reaction temperature
(340degC) the average molecular weight of the product is so low that no liquid
product phase occurs under reaction conditions The catalyst particles moving
around in the reactor are small (dp =100 mm) [12] and carbon deposition on
the catalyst does not disturb reactor operation Thus low catalyst porosity with
Chapter 3 Catalysts for Fischer Tropsch Synthesis
81
small pore diameters as obtained from fused magnetite (plus promoters) after
reduction with hydrogen is appropriate For maximising the overall gasoline
yield the olefins C3 C4 have been oligomerised at Sasol However recovering
the olefins for use as chemicals in eg polymerisation processes is
advantageous today [13]
The second direction of iron catalyst development has aimed at highest
catalyst activity to be used at low reaction temperature where most of the
hydrocarbon product is in the liquid phase under reaction conditions Typically
such catalysts are obtained through precipitation from nitrate solutions A high
content of a carrier provides mechanical strength and wide pores for easy mass
transfer of the reactants in the liquid product filling the pores The main
product fraction then is a paraffin wax which is refined to marketable wax
materials at Sasol however also can be very selectively hydrocracked to a high
quality Diesel fuel Thus iron catalysts are very flexible Selective FT synthesis of
linear terminal olefins seems only possible with iron catalysts Alkalised iron FT
catalysts exhibit water gas shift activity (in contrast to cobalt catalysts) This is a
favourable feature for FT synthesis with CO-rich syngas as obtained from high
temperature coal- or heavy-oil-gasification through partial oxidation (H2CO
molar ratio =10) however it is undesirable for FT synthesis with hydrogen-rich
syngas as produced from natural gas The activity of iron catalysts decreases
through product inhibition by water [14] This feature restricts the attainable
degree of conversion and leads to gas recycle operation after water removal
together with the organic condensate
ii) Cobalt catalysts Cobalt catalysts have been applied in the first FT plant of
Ruhrchemie in 1935 Present catalyst design makes use of several preparation
techniques however the intention to produce a well-dispersed cobalt phase in
a wide pore support remains the same Today cobalt catalysts for FT Diesel
Chapter 3 Catalysts for Fischer Tropsch Synthesis
82
production from natural gas are designed for a maximum wax selectivity the
waxy product then being the feed for hydrocracking Hydrocracking of FT
paraffins follows the kinetic regime of lsquoideal hydrocrackingrsquo as observed by
Schulz and Weitkamp [15] always the largest molecules are cracked selectively
and no secondary cracking occurs With cobalt catalysts olefin readsorption on
FT sites takes place and this contributes significantly to the desired high wax
selectivity This implies that olefin secondary hydrogenation and double bond
shift should be kept low Diesel fuel selectivity approaching 80 can be
obtained by the process combination FT synthesishydrocracking [15]
32 Chemical State of active phase As explained before the typical active metals used for FT synthesis are Fe Co
and Ru According to [11] the current consensus is that metallic Co and Ru ie
Co0 and Ru0 nanoparticles function as the active phases for CO hydrogenation
to heavier hydrocarbons whereas iron carbides are responsible for CO
hydrogenation [16] However deeper knowledge about the effects of different
chemical states of these active phases on catalytic performances is still needed
for the rational design of an efficient FT catalyst
21 Co-based catalysts
Metallic Co may exist in two different crystalline forms ie fcc and hcp
phases For bulk Co the hcp phase is more stable at lower temperatures but
the fcc phase becomes more stable when the size of Co particles becomes less
than 20 nm [17] However the actual crystalline structure of Co catalyst under
working conditions is not well known The formation of Co2C may cause the
catalyst deactivation Another recent work also demonstrated that the
deactivation of Co-based catalyst was due to the carbide formation and carbon
deposition [18] The prolonging of the time on stream caused the partial
Chapter 3 Catalysts for Fischer Tropsch Synthesis
83
decomposition of the bulk Co2C to Co0 and increased the conversion of CO and
the selectivity to heavier hydrocarbons
22 Fe-based catalysts
Iron carbides are easily formed under FT reaction conditions because of the
lower or similar activation energy for iron carbide formation as compared with
that of CO hydrogenation Many types of iron carbides such as ε-Fe2C ε_ -
Fe22C Fe7C3 χ-Fe5C2 and θ-Fe3C all have been observed in FT synthesis [19-
20] However the true active species under working conditions remains still
unsettled Many studies have been devoted to characterizing the active iron
carbide phase Because the carburized iron catalysts are very sensitive to air
exposures even under controlled passivation [21] the in situ or operando
characterizations under working conditions are quite important
33 Size of active phase According to [11] the size of the active phase is one of the most important
factors determining the catalytic behaviors of a heterogeneous catalyst [23]
For Co-based catalysts Iglesia once analyzed data obtained over different
metal oxide-supported Co catalysts and the results suggested that the
turnover frequency (TOF) for CO conversion ie the amount of CO converted
per surface Co per time was independent of the size of Co particles loaded on
different metal oxides in a Co-size range of 9minus200 nm [24] The selectivity to
CH4 was higher over the catalysts with smaller Co particles and decreased with
increasing Co size particularly in the range of 26minus8 nm C5+ selectivity
increased with the mean size of Co nanoparticles monotonically and the
increase became insignificant when Co size exceeded 6minus8 nm Thus Co-
catalyzed FT synthesis is a structure sensitive reaction in the Co-size range of
lt10 nm Size effect studies for Ru- and Fe-based catalysts are not numerous A
Chapter 3 Catalysts for Fischer Tropsch Synthesis
84
few early studies pointed out the increase in TOF for CO hydrogenation with
increasing the size of Ru or Fe particles (or decreasing the metal dispersion)
[25-27]
In general the results obtained for many Co- and Ru-based catalysts all indicate
that the TOF for CO conversion increases with the size of metal nanoparticles
up to a critical point (6minus10 nm) and then changes slightly For Fe-based
catalysts the results are still inconsistent
References
[1] C Perego MRicci Catalysis Science amp Technology 2012 2 1776ndash1786 [2] P M Maitlis V Zanotti Chem Commun 2009 1619ndash1634 [3] C Perego R Bortolo and R Zennaro Catal Today 2009 142 9ndash16 [4] AY Khodakov W Chu P Fongarland ChemRev 107 (2007) 1692 [5] B Jager Stud Surf Sci Catal 119 (1998) 25 [6] Luque R de la Osa A R Campelo J M Romero A A Valverde J L Sanchez P Energy Environ Sci 2012 5(1) 5186 [7] Hao X Dong G Q Yang Y Xu Y Y Li YW Chem Eng Technol 2007 30(9) 1157 [8] van Steen E Claeys M Chem Eng Technol 2008 31(5) 655 [9] Davis B H Ind Eng Chem Res 2007 46(26) 8938 [10] Gao J H Wu B S Zhou L P Yang Y Hao X Xu Y Y Li Y W Chin J Catal (Cuihua Xuebao) 2011 32(12) 1790 [11] Qinghong Z Weiping D Ye W Review J Ener Chem 2013 2227ndash38 [12] OGMalan JDLouw LCFerreira Brennstoff-Chem 42 (1961) 209 [13] AP Steynberg RL Espinoza B Jager AC Vosloo ApplCatalA 186 (1999) 41 [14] ME Dry JR Anderson M Boudart (Eds) Catalysis Science and Technology M Springer Berlin (1981) 159 [15] HSchulz Appl Catal A 186 (1999) 3 [16] Zhang Q H Kang J C Wang Y ChemCatChem 2010 2(9)1030 [17] Kitakami O Sato H Shimada Y Sato F Tanaka M Phys Rev B 1997 56(21) 13849 [18] Tan K F Xu J Chang J Borgna A Saeys M J Catal 2010 274(2) 121 [19] De Smit E Weckhuysen B M Chem Soc Rev 2008 37(12) 2758
Chapter 3 Catalysts for Fischer Tropsch Synthesis
85
[20] Zhang Q H Kang J C Wang Y ChemCatChem 2010 2(9) 1030 [21] Janbroers S Louwen J N Zandbergen H W Kooyman P J J Catal 2009 268(2) 235 [22] PJ Van Berge J Van de Loosdrecht JCaricato EA Barradas Patent WO 9942214 [23] Zhang Q H Deng W P Wang Y Chem Commun 2011 47(33) 9275 [24] Iglesia E Appl Catal A 1997 161(1-2) 59 [25] Kellner C S Bell A T J Catal 1982 75(2) 251 [26] Jones V K Neubauer L R Bartholomew C H J Phys Chem 1986 90(20) 4832 [27] Boudart M McDonald M A J Phys Chem 1984 88(11) 2185
86
Chapter 4 Experimental FT plant and analytical methods
Two different FTS units were used in this PhDrsquos research work in order to
homologate some results The first one is located at the Universitagrave degli Studi
di Milano in Italy while the second one is located at the Universidad Central de
Venezuela in Venezuela Following there is the description of both FTS unit
First FTS Unit (Unit 1) Universitagrave degli Studi di Milano in Italy
FT reaction tests were performed into a fixed bed reactor (di =06 cm l = 56
cm) using 1 g of fresh catalyst mixed with 1 g of diluting material (-Al2O3
Fluka) This diluting material must be inert for FT and a good thermal conductor
to control the process temperature [1] The catalysts were tested after their
activation in a 468 NmL min-1 flow of syngas with H2CO ratios of 21 (total
flow = 468 Nml min-1) and nitrogen as internal analytical standard (flow = 50
NmL min-1) at P = 20 bar and temperature range between 220-260degC for a
duration between 20 and 90 h in continuous Analyses of the gas-phase
products (C1-C7) were performed with an on-line micro-gaschromatograph
(Agilent) measurements were carried out every 60 min during the reaction
Liquid products were collected in a trap (V=400mL) operating at 5degC and at the
same pressure of the reactor (20 bar) and analyzed by a gas chromatograph
(Agilent) equipped with a Porapack-Q columns (able to separate C7-C30
hydrocarbon fraction) after the reaction duration The aqueous phases
collected in the cold trap were analyzed by a TOC (Schimadzu) for the
quantification of carbonaceous species dissolved in water Using all the data
87
collected for each run a mass molar balance has been verified with a
maximum error of plusmn 5moles
Second FTS Unit (Unit 2) Universidad Central de Venezuela in Caracas-
Venezuela)
FTS was performed in a continuous flow system with a fixed bed stainless-steel
reactor (di =095 cm l = 30 cm) The reactor was loaded with 03 g of fresh
catalyst mixed with 03 g of see sand as a diluting material [2] The calcined
catalysts were initially reduced in situ by flowing hydrogen for 4 hours at 900
Nml˙min-1 350degC and 08 MPa After the reduction step the temperature was
lowered to 220degC under H2 They were then tested in the standard conditions
by flowing syngas (H2 CO N2 63325 vv N2 as internal standard) at 156
Nml˙min-1 increasing the system pressure slowly up to 20 MPa and 220-260degC
Once the reaction temperature was achieved the reaction was led to proceed
during a period of 280 h
During reaction the reactor effluent passed through a hot trap kept at 150degC
and 02 MPa to collect waxes and the products leaving this trap were passed
through a second trap kept at 0degC and 02MPa to collect the lighter products
(water alcohols and hydrocarbons) The analyses were performed in various
chromatographs according to the nature of the sample to be analyzed
Permanent gases and light hydrocarbons were analyzed on-line in a
PerkinElmer 3000GC Autosystem fitted with TCD detectors using a Carbosieve
SII Supelco column The liquid products (collected at 150ordmC and 0ordmC) were
weighted and analyzed in a PerkinElmer chromatograph fitted with a 50m long
Alumina RT capillary column connected to a FID
A mass molar balance was performed for each FT run resulting in a maximum
error of plusmn 5moles
88
41 FT Laboratory plant a) First FTS unit (Unit 1)
As explained by Pirola [3-5] the experimental tests were performed in a
laboratory plant with a tubular reactor (made by ldquoRenato Brignolerdquo Company)
with a fixed bed of catalyst vertically placed The feed (CO H2 and N2 as
internal standard) is prepared in situ mixing three different flow of pure CO
pure H2 and pure N2 using three different flow meters Then the feed goes into
the catalytic reactor from the top part reacts with the catalyst and then the
reacted flow comes out from the lower part The plant pipes are heated till the
cold trap to avoid the heavy products condensation In this cold trap cooled at
5degC the heavy products and the water condense The not reacted gas and the
light hydrocarbons go in a flow meter for their quantification and finally in an
analytical zone where they are analyzed by a micro gaschromatograph In the
condensed liquid in the cold trap there are two phases the first one is an
aqueous phase (in which water and small quantities of light hydrocarbons and
oxygenated compounds are present) and the second one is an organic phase
(in which hydrocarbons in the range C7-C30 are present)
In Fig 41 the detailed flow-sheet of FT plant has been reported
Fig 41 Laboratory plant flow-sheet
89
The key for the Fig41 is the following
1 valve
2 flow meter (Brooks reg mod 5850TR) for H2 and CO operating in the range 0-
100 Nml min-1 for N2 operating in the range 0-20 Nml min-1
3 gas mixer
4 thermocouples for the control of temperature in the catalytic bed in the
reactor and in the heated pipe
5 Tubular reactor
6 Security valve
7 Pressure indicator
8 Pressure control and regulation tool
9 micro GC ldquoAgilent reg 3000 seriesrdquo
10 gas totalizer for the control of the total flow of gas
11 Cold trap operating at 5degC and 20 bar
12 Cooling air for the temperature control of the reactor
13 vent (usually closed)
In figure 42 a photo of the plant is reported
Fig 42 FT laboratory plant
90
In the following paragraphs the main parts of this plant will be described
41a Main parts of the plant 41a1 Apparatus for the regulation and control of temperature pressure and flow of reagents
In the plant the pressure is controlled and regulated by an electronic controller
(Brooksreg) that interacts with a pressure valve able to work till 25 bars (Fig 43)
located after the reactor and the cold trap
Fig 43 Pressure valve
This system can control the plant pressure with a care of 01 bar respect the set
up
The reactor temperature is regulated by a heating oven (Renato Brignole) and
the pipe lines after the reactor are heated at 220degC to prevent the heavy
products condensation by two electrical cables (both with a resistance of 7
m) controlled by a Ascon reg apparatus The CO H2 and N2 flows are regulated
by Brooksreg 5850TR series flow meters (Fig 44)
91
44 Flowmeters for CO H2 N2
In table 41 the main characteristics of these flow meters are reported
Table 41 Flowmeters characteristics
Range
(Nmlmin) IO signal
(vdc) Max Pressure
(Bar)
H2 0-50 0-5 100
CO 0-50 0-5 100
N2 0-20 0-5 100
41a2 FT reactor
The FT plant reactor (Fig 45) has been made by Renato Brignole reg Company
(Legnano Italy) It is a fixed bed tubular reactor with the catalyst vertically
located It is made of AISI 316 stainless steel and in the internal surface of
reactor there is a coaxial copper tube (thickness = 1 mm) to prevent some
catalytic activities of steel and to uniform the heating of reactor The technical
characteristics of reactor are summarized in Table 42
Table 42 Reactor Characteristics
Volume (cm3)
Max operating pressure
(Bar)
Max operating temperature
(degC)
Internal diameter
(mm)
Height (mm)
158 100 400 6 560
92
In this reactor it is possible to charge till 3 g of the mixture catalyst-diluting
material The feed goes into the reactor at the top and goes out from the lower
part The operation of opening and closing of reactor is made using the disks
illustrated in Fig 46 and this is an operation that needs a particular attention
to avoid gases losses or mechanical damage
Fig 45 FT tubular reactor Fig 46 Reactor opening disks
The temperature inside the reactor is monitored by two thermocouples the
first one is vertical and it is inside the catalyst the second one is horizontal and
it is inside the reactor The values of temperatures recorded are quite the same
(max difference = 2degC)
41a3 Cold Trap
The condensation of heavy FT products (mainly hydrocarbons higher than C7
and water) is made using a cold trap in stainless steel able to work at 20 bar
and a T=5degC (Fig 47) The low temperature is maintained by an external
circulation of water coming from a ldquoCrioterm reg 190 iscordquo thermocriostat The
93
volume height and width of the cold trap are respectively 125 ml 100 mm
and 40 mm
Fig 47 Cold trap
The cold trap at the end of each kinetic run is opened and the liquid
condensed inside is quantified and analyzed There are two phases the first
one is an organic phase made by hydrocarbons in the range C7-C30 and it is
analyzed by a GC the second one is an aqueous phases with some organic
mainly oxygenated compounds and the quantification of all the present
carbon is made by a TOC analysis The results obtained in this way give an
average value of all the time of kinetics It is not possible to open the cold trap
during the experiment In fact opening the cold trap the pressure and flow
equilibrium of the plant is broken
41a4 Flow totalizers
The calculation of CO conversion and products selectivity of the plant needs to
know exactly the quantity of gas incoming and out coming Moreover adding
those data to the quantity of liquid condensed in the cold trap and to analytical
data it is possible to verify the mass balance on the plant The calculation of the
mass balance is very important to verify the goodness of the experimental data
collected
94
In FT plant it is possible to quantify all flow passed in a fixed time The incoming
flow of H2 N2 and CO is totalized by the same flow meters that regulate the
flow (Brooks reg Instruments) and the out coming flow (mixture of not reacted
CO and H2 N2 and non-condensed FT products) is totalized by a Ritter reg mod
TG01-5 (Fig 48) instrument
Fig 48 Ritter reg totalizer
42a Analytical instruments
FT plant needs three different analysis for the quantification of the composition
of
i) out coming gas (mixture of not reacted CO and H2 N2 and non-
condensed FT products) by a micro-GC Agilent reg mod 3000A
ii) organic phase of condensed liquid in cold trap (hydrocarbons in the
range C7-C30) by a GC ldquoFison Carlo Erba reg Mod 8000 seriesrdquo and
iii) liquid phase of condensed liquid in the cold trap (water with
hydrocarbon mainly oxygenated dissolved inside) by a Total
Organic Carbon ldquoShimadzu reg mod 5000Ardquo
42a1 micro Gas Chromatograph ldquoAgilent reg mod 3000Ardquo
In the micro GC Agilent reg there are two different columns the first one is a
molsieves module by which it is possible to separate in order of retention
time He H2 Ne Ar O2 N2 CH4 and CO the second one is a OV-1 module
(filled with polydymethylsiloxilane) by which it is possible to separate CO2 and
95
all the hydrocarbons in the range C2-C7 In this instrument the gas sample is
splitted in the two modules and then analyzed in the same time For each
sample then we obtain two different analyses In our application using the first
module the CO N2 and CH4 were quantified with a column temperature of
45degC using the second module CO2 and hydrocarbons were quantified with a
column temperature of 100degC Each module is equipped with a TCD detector
The sensibility limit of the analyses is about 50 ppm for each compound and
the carrier gas is helium The instrument scheme is reported in Fig 59 and the
instrument is represented in Fig 410 An example of analyses is reported in
Fig 411
Fig 49 Agilent Micro GC scheme
Fig 410 Micro GC Agilent
96
Fig 411 Example of Agilent micro GC analyses on FT out coming gas
42a2 Gas Chromatograph ldquoFision Carlo Erba reg Mod 8000 seriesrdquo
In this traditional Gas Chromatograph (GC) equipped with a wide bore Varian
(model VF-1ms) (dymethylpolyxolane) column (length = 25 m diameter = 025
mm) it is possible to separate and quantify the hydrocarbons in the range C7-
C30 The GC detector is a FID with a sensibility limit of about 100 ppm for each
compound and the carrier is helium The column temperature is maintained at
60degC for 3 minutes then heated till 260degC at 7degCmin for 15 minutes after that
heated at 280degC for 40 minutes at 5degCmin and then heated till 310degC for 5
minutes In Fig 412 and 413 the gas chromatograph in its column
97
Fig 412 Example of GC analysis for the quantification of heavy FT products
Fig 413 Wide bore Varian VF-1ms column
42a3 Total Organic Carbon ldquoShimadzu reg mod 5000Ardquo
Using this instrument it is possible to quantify the organic carbon dissolved in
water The sample passes through an oxidation catalyst (Pt) at high
temperature (700degC) and then all the organic carbon is converted to CO2 This
CO2 is then exactly quantified by an IR detector In Fig 414 it can be seen the
instrument
Fig 414 SHIMADZU TOC-5000A
98
43a Analytical instruments calibration
43a1 Flow meters calibration
All flow meters have been calibrated comparing the flow measured by these
instruments and that measured using a ldquosoap-bubblerdquo flow meter at the end of
the plant This calibration has been made using the FT plant both in FT work
condition (T=250degC P=20 bar) and at room condition (T=20degC P=1 bar) For
each flow meter some tests at different flow have been made always in the
range between 0 and 40 Nmlmin For each flow meter a diagram has been
made where the real flow (y) is reported in function of the set-up flow (x) The
result for all the instruments is a straight line (y = ax + b) In Tab 43 the results
for all the instruments have been reported in term of ldquoardquo and ldquobrdquo coefficient
and ldquoR2rdquo value
Tab 43 Flow meters calibrations
Flow meter Calibration conditions a b R2 1 CO T = 20degC P = 1 bar 11364 12727 09996
2 H2 T = 20degC P = 1 bar 1008 -1749 0999
3 N2 T = 20degC P = 1 bar 12744 67994 09935
4 Mix CO H2 N2 T = 20degC P = 1 bar 0968 1816 09998
The conclusion is that the instruments give a very good calibration and their
indications of the flow are quite perfect
43a2 micro GC calibration
This calibration has been made in Cernusco sul Naviglio (MI) in the laboratory
of ldquoSRA Instruments Italiardquo Company This company is an Agilent Technologies
Premier Solution Partner directly present in Italy and France and it is
constantly engaged in research and development of solutions based on
portable and ultra-fast Micro Gas chromatograph (wwwsrainstrumentscom)
99
The calibration has been made analyzing two mixture of certified gas and is
reported by [5]
The calibration of CO2 and light hydrocarbon is a direct calibration As the
volume of gas injected in column is always the same it is possible to calibrate
directly (without an internal standard) the peaks area with the concentration of
different compounds ie the concentration is directly proportional to
chromatographic area In ldquoSRA Instruments Italiardquo all calibration factors fci
(chromatographic area compound concentration) and all retention times
have been found and they are reported in table 44
Table 44 Calibration results for CO2 and light hydrocarbons
Module Compound Retention time
(min) Calibration factor
Molsieves
N2 1007 35119
CH4 1203 27027
CO 1402 45799
OV-1
CO2 0592 16722
Ethane 0624 19230
Propane 0745 25706
I-butane 0918 28248
N-butane 1061 27027
I-pentane 1556 32051
N-pentane 1808 32326
N-hexane 3578 33670
CO quantification has been performed using another calibration
Using these data it is possible to calculate the concentration of each compound
using the formula
iiiv fcareacompound (1)
Nevertheless it is important to remember that in FT plant there is N2 as
internal standard for CO quantification and then the equation (1) must be
corrected because the N2 flow is not to be considered as FT gas
100
FT
totaliiiv
flow
flowfcareacompound (2)
Where
2NtotalFT flowflowflow (3)
To better understand this calculation an example is here reported
If we assume to have a real FT flow of 20 Nmlmin with a CO2 v = 2 it
means to have 04 Nmlmin CO2
If we have 10 Nml minmin of N2 as standard and 30 Nmlmin of FT flow and
we calculate the CO2 percentage using the total flow we obtain
233110030
40vCO making a mistake If we use the correction in the
equation (2) we obtain 20220
30100
30
40vCO
the true value
The CO calibration concerns only the CO and N2 flow The CO is the compound
to be quantified and the N2 is the standard gas in fact N2 is not involved in FT
reactions and it pass through the FT plant without any modification then the
incoming and out coming N2 is the same The necessity with CO to have a
calibration with a standard is explained considering that the CO quantification
gives the CO conversion of FT process then a more accurate measure is
convenient Moreover it is not possible to use N2 as internal standard also for
CO2 and light hydrocarbons because they are not analyzed in the same module
(OV-1) of N2 (molsieves) Another important consideration is that in literature
the CO conversion for FT reactor is always calculated using this method
In this calibration method the ratio (flow CO flow N2) is directly proportional
to ratio (area CO area N2) Using FT plant in reaction conditions (T=250degC
P=20 bar CO = 156 Nmlmin H2 = 312 Nmlmin N2 = 100 Nmlmin) obviously
101
without catalyst inside we have calculated these ratios and the co-relation
between them The results are reported in Table 45
Table 45 CO-N2 calibration results
Flow N2
(Nmlmin) Flow CO
(Nmlmin) Flow H2
(Nmlmin) Area
N2 Area CO
R flow CON2
R area CON2
Rarea Rflow
100 156 312 411142 782455 156 19031 12199
100 156 312 390220 793329 156 20330 13032
100 156 312 388002 794913 156 20487 13133
100 156 312 384672 795362 156 20676 13254
The mean value of ratio between area and flow ratios is 12905 and this is the
calibration factor (fc) for the system as reported in the equation (4)
flowN
COflowf
areaN
COareac
22
(4)
then the CO flow out coming from the FT plant is
29051
2
2
flowN
areaN
COareaflowCOout (5)
finally the CO conversion is
100xflowCO
flowCOflowCOonCOconversi
in
outin (6)
The H2 calibration
To optimize the kinetic model of the FT synthesis was necessary to develop a
measurement method to quantify the hydrogen leaving the plant For this it
was performed a calibration of the micro-gas chromatograph using N2 as
standard in different streams of H2
To identify and quantify the hydrogen it is necessary to change the carrier in
the micro-gas chromatograph (from He to Ar)
Using Argon as a carrier the response of the micro-GC is about ten times
smaller than the response compared with He For this reason it has been
102
necessary to modify the injection time for the analysis and set to 40ms instead
of the usual 30ms
In Table 46 and Fig 415 are shown the results relating to the calibration of the
system H2-N2
Table 46 H2-N2 calibration results
Flow N2 (Nmlmin)
Flow H2 (Nmlmin)
F H2 F N2 Area N2 Area H2 A H2 A
N2
20 3 015 31511 33480 1062
20 35 0175 29525 36348 1231
20 41 0205 28420 40995 1442
20 49 0245 26747 45908 1716
20 56 028 20897 41151 1969
20 61 0305 20748 44040 2123
Fig 415 Calibration results for the micro-GC for the system H2 ndashN2
From the equation of the straight line is obtained a correction factor equal to
70018
By this correction factor (Fc) is possible to deduce the flow of the H2 outflowing
from the reactor and its conversion during the reaction using the following
equation
103
1002
222
in
outin
FlowH
FlowHFlowHHconversion
The calculation set to detect the flow of H2 in output is based on the fact that
the ratio between the areas H2N2 is equal to the ratio between the respective
flows multiplied by Fc (correction factor) according to the following equation
2
2
2
2
FlowN
FlowHFc
AreaN
AreaH
So from this equation it is possible to determine the flow of H2 at the out of the
reactor
00187
2
2
22
FlowN
AreaN
AreaHHFlow OUT
In Fig 416 is shown an example of a gas chromatographic analysis of hydrogen
Fig 416 Gas chromatographic analysis of a system H2-N2
43a3 GC calibration
In this instrument as before discussed it is possible to analyze the heavy
hydrocarbons condensed in the cold trap Obviously for their quantification we
need a calibration with some standard compounds because the detector
quantification is not the same for all the species For this reason the equation
j
j
i
i
mol
area
mol
area (7)
it is not correct and we must use
104
j
j
j
i
i
i Fmol
areaF
mol
area
(8)
where Fi and Fj are the calibration factor for the compound i and j respectively
The calibration method used is the ldquointernal standard methodrdquo in which one of
the compounds to be analyzed is chosen as internal standard and his
calibration factor (F) is established equal to 1 N-heptane has been chosen as
internal standard because it is normally present in FT products Analyzing a
calibration hydrocarbon mixture it is possible to calculate the calibration factor
of all the hydrocarbon present inside this mixture using the following
equation
i
i
j
j
jiarea
mol
mol
areaFF
(9)
The composition of the calibration mixture is reported in table 47 and the
calibration results in table 48
In FT runs all hydrocarbons in the range C1-C19 were obtained To find the
calibration factor and the retention times of hydrocarbons not present in the
calibration mixture an interpolation calculation was made In the following
figure are reported the diagram of the calibrations factors (Fig 417) and of the
retention times (Fig 418) in function of carbon number Starting from these
experimental results an interpolation curve were calculated and then the
calibrations factors and retention times for each carbon number was calculated
too The results are reported in Table 49 It is important to outline that for
each single carbon number there is only one calibration factor for all the
isomers as they are not well separated by the GC column and the detector
answer for the isomers is the same
105
Table 47 Composition of GC calibration mixture
Hydrocarbon PM (gmol) Quantity (g) Mol
n-Heptane (C7) 1002 0229 02295
Nonane (C9) 12826 02389 01871
Decane (C10) 14228 01284 00906
Undecane (C11) 15631 01197 00769
Dodecane (C12) 17033 01139 00672
Tridecane (C13) 18436 01202 00655
Tetradecane (C14) 1984 01577 00798
Pentadecane (C15) 21241 01123 00531
Hexadecane(C16) 22644 01817 00806
Octadecane (C18)
2545 00919 00363
Nonadecane (C19) 26852 00895 00335
106
Table 48 GC calibration results
Mix Mol
Chromatographic areas
Fc mean Analysis
1
Analysis
2
Analysis
3
Analysis
4
Analysis
5
C7 0229522 7763 9384 881 9036 8981 100
C9 018706 16343 16475 15226 13896 15051 047
C10 0090631 8463 88707 7902 7588 7856 043
C11 0076907 8716 7627 8235 7916 8239 036
C12 0067157 8485 7313 8137 7709 8168 032
C13 0065478 847 7654 8253 7859 8271 031
C14 0079826 11095 9689 10988 9685 11042 029
C15 0053096 8309 819 8876 8844 8535 024
C16 0080586 12395 11571 12863 12834 13014 025
C18 0036265 6059 6061 6679 6817 659 022
C19 0033474 6134 5958 6527 6663 6549 020
Fig 417 GC calibration factor vs carbon number
107
Fig 418 GC retention time vs carbon number
Table 49 GC Calibration factor and retention times for all the hydrocarbons C7 ndash C30
Carbon number Fi Retention time (min)
7 0997 0975
8 0649 3431
9 0497 5887
10 0412 8343
11 0358 10799
12 0320 13255
13 0293 15711
14 0272 18167
15 0255 20623
16 0241 23079
17 0230 25535
18 0220 27991
19 0212 30447
20 0205 32903
21 0199 35359
22 0194 37815
23 0189 40271
24 0185 42727
25 0181 45183
26 0178 47639
27 0175 50095
28 0172 52551
29 0170 55007
30 0167 57463
108
43a4 TOC calibration
The detector of the instrument (type NDIR) is able to analyze and quantify by
means of infrared spectroscopic technique the CO2 produced by the sample
For this calibration is not necessary to use a standard equal to the analyte (in
the case of the synthesis of FT the carbonaceous species dissolved in water)
but it is necessary to use a stable standard such as potassium hydrogen
phthalate because due to its physical nature (solid) is therefore inherently
more reliable than a liquid and allows the exact correlation between the ppm
of carbon present in solutions of standards and the areas provided by the
instrument after analysis
There were prepared different solutions at known concentrations (200 and 100
ppm) from a stock solution of 300 ppm obtained by dissolving 031895 g in
100ml of distilled water
Standard solutions were corrected by a correction factor f according to the
following equation
masssampleltheoretica
masssamplerealf (10)
The calculated value of f is equal to 1000627 and the table 410 and the Fig
419 show the correct ppm standard and the areas supplied by the instrument
Table 410 calibrationTOC
Corrected
ppm
Area
3002 28679
2001 17261
1001 6568
109
Fig 419 Interpolation of areas obtained in function of the concentration (ppm) of the
standard
44a Experimental procedure
All the kinetic FT runs were made on the plant following the same experimental
procedure
1) Catalyst preparation
2) Catalyst loading on the plant in the FT reactor
3) Catalyst activation
4) FT run
5) When FT finish opening of cold trap and separation of organic from
aqueous phases
6) Catalyst removal from reactor
7) Reactor cleaning and micro-GC column regeneration
44a1 Catalyst preparation
Before the catalyst was loaded in the reactor a standard procedure was
followed on the same catalyst
- Catalyst mesh operation between 106 and 150 micron
- Heating in oven at 120degC for a night
- Mixture catalyst - Al2O3 (inert material ndash diluent) 11
110
In table 411 the main characteristics of -Al2O3 are reported The role of this
material is to help the heating removal from the catalyst (FT reaction is highly
exothermic)
Table 411 Main characteristics of -Al2O3
Superficial area (m2g)
Bulk density (gcm3)
Composition Humidity
07-13 172
996 Al2O3 lt005 SiO2
01 FeO lt001 TiO2
26
44a2 Catalyst loading
The catalyst loading is obviously an essential operation The catalyst must be
charged in the middle of reactor because this is the isothermal zone as it is
possible to observe in Figure 420
Fig 420 Thermic profile of FT reactor
As the height of the mixture catalyst + -Al2O3 is about 7 cm (using a pipe with
an internal diameter of 6 mm) if this material is charged in the middle of the
reactor this work surely at the same temperature in each point The final
arrangement of the reactor is reported in Fig 421
111
Fig 421 FT reactor internal loading arrangement
Finally after the closing the pressure inside the reactor is raised till 4 bar with
the activation gases The gas flow is stopped and then the held of reactor is
checked to control possible gas losses If the reactor pressure is stable the
activation catalyst step will be performed The same procedure for the check of
possible gas loss will be performed when the pressure of the reactor will be
raised till 20 bar for FTS
44a3 Catalyst activation
The catalyst activation is the process in which the catalyst is reduced from the
oxidised state in the reduced or metallic state In the FT reaction the active
form for the Cobalt based catalysts is the Cobalt metallic and for the iron based
catalysts are the carbide iron forms All the catalysts were charged into the
reactor in the oxidised form because the last operation in the catalysts
preparation is the calcination (T=500degC) in air The catalyst activation-reduction
is performed in this PhDrsquos research work at 350degC and using H2 for Co based
112
catalysts and CO+H2 for iron based catalysts always for 4 h at 3 bar of pressure
At the end of this step the FT process start
44a4 Fischer Tropsch runs
After the catalyst activation the plant is raised at standard reactions conditions
Temperature = 220-260degC (depending of the test)
Pressure = 20 bar
Feed ratio H2CO = 21 11 1751 151 (depending on the test were
varied the feed ratio too)
H2 flow = 312 Nmlmin
CO flow = 156 Nmlmin
N2 flow = 50 Nmlmin
These are the ldquostandardrdquo reaction conditions but for some specific studies
they have been changed When the plant reaches the set-up values this is the
ldquozero-timerdquo of the FT runs The first operation is to annul the totalizers both in
the entrance and in the exit of the plant Then every one hour the micro-GC
make one analysis on the out coming flow (also during the night) and the
operator takes the flow out coming from the plant Each data is reported and
elaborate using an excel database The FT run has duration between 48 and 90
hours At the end of run the cold trap is opened (Fig 422) and both the organic
phase (GC) and the aqueous phase (TOC) are separated and then weighed and
analyzed Also these data is collected in the excel database and now it is
possible to calculate the CO conversion the products selectivity the alpha
parameter and to verify the final mass balance
113
Fig 422 Opening cold trap operation
After the reactor cooling the catalyst is unloaded and recovered for possible
characterization after its use The reactor and the cold trap are obviously
cleaned carefully The last operation is the micro-GC column regeneration
using the condition reported in Table 412
Table 412 Micro-GC column regeneration conditions
Parameter Module 1 (molsieves) Module 2 (OV-
1)
Sample Injector temperature (degC) 80 80
Column Injector temperature (degC) 45 60
Column temperature (degC) 160 160
Sampling time (s) -- --
Injection time (ms) -- --
Analysis time (s) -- --
Post-analysis time (s) -- --
Column pressure (kPa) 120 241
Detector sensibility Detector off Detector off
114
b) Second FTS unit (Unit 2) At the end of the second and the beginning of the third year of the PhD there
were performed a serious of catalytic tests in a FT unit at the Universidad
Central de Venezuela in Caracas-Venezuela in order to homologate the results
obtained in the first FTS unit as regard the cobalt based catalysts specifically
the hydrotalcites The experimental tests were performed in a laboratory plant
with a tubular reactor with a fixed bed of catalyst vertically placed They were
then tested in the standard conditions by flowing syngas (H2 CO N2 63325
vv N2 as internal standard) at 156 Nml˙min-1 using a flow meter Then the
feed goes into the catalytic reactor from the top part reacts with the catalyst
and then the reacted flow comes out from the lower part The plant pipes are
heated at 220degC During reaction the reactor effluent passed through a hot
trap kept at 150ordmC and 20 bar to collect waxes and the products leaving this
trap were passed through a second trap kept at 0ordmC and 20 bar to collect the
lighter products (water alcohols and hydrocarbons) The analyses were
performed in various chromatographs according to the nature of the sample to
be analyzed Permanent gases and light hydrocarbons were analyzed on-line in
a PerkinElmer 3000GC Autosystem fitted with TCD detectors using a Carbosieve
SII Supelco column The liquid products (collected at 150ordmC and 0ordmC) were
weighted and analyzed in a PerkinElmer chromatograph fitted with a 50m long
Alumina RT capillary column connected to a FID
In Fig 423 the detailed flow-sheet of FT plant has been reported
115
Fig 423 Laboratory plant flow-sheet
The key for the Fig423 is the following
1 Valve
2 Flow meter for H2 and syngas operating in the range 0-100 Nml min-1
3 Gas mixer
4 Thermocouples for the control of temperature in the catalytic bed in the
reactor and in the heated pipe
5 Tubular reactor
6 Security valve
7 Pressure indicator
8 Pressure control and regulation tool
9 GC ldquoPerkin Elmerrdquo
10 Gas totalizer for the control of the total flow of gas
11 Cold trap operating at 150degC and 20 bar to collect waxes
111 Second cold trap kept at 0ordmC and 20 bar to collect the lighter products
(water alcohols and hydrocarbons)
12 Cooling air for the temperature control of the reactor
13 vent (usually closed)
In figure 424 a photo of the plant is reported
116
Fig 424 FT laboratory plant
In the following paragraphs the main parts of this plant will be described
41b Main parts of the plant
41b1 Apparatus for the regulation and control of temperature pressure and
flow of reagents
In the plant the pressure is controlled by a pneumatic valve that interacts with
a pressure valve able to work till 1000 psi (Fig 425) located after the reactor
and the cold trap
Fig 425 Pressure valve
This system can control the plant pressure with a care of 10 psi respect the set
up
117
The reactor temperature is regulated by a heating jacket and the pipe lines
after the reactor are heated at 220degC to prevent the heavy products
condensation by a heater The CO H2 and N2 flows are regulated by Brooks
Instrument Control and Read out Equipment for Thermal Mass Flow meters
Model 5878 series flow meters (Fig 426)
426 Flow meters for H2 and syngas
41b2 FT reactor
The FT plant reactor is a fixed bed tubular reactor vertically placed It is made
of AISI 316 stainless steel The technical characteristics of reactor are
summarized in Table 413
Table 413 Reactor Characteristics
Volume (cm3)
Max operating pressure
(Bar)
Max operating temperature
(degC)
Internal diameter
(mm)
Height (mm)
850 69 400 95 300
In this reactor it is possible to charge a quantity of catalysts equivalent to
occupy 1 cm of length of the reactor The feed goes into the reactor at the top
and goes out from the lower part
118
Fig 427 FT tubular reactor
The temperature inside the reactor is monitored by one thermocouple inside
the catalyst
41b3 Cold Trap The reactor effluent passed through a hot trap kept at 150degC and 02 MPa to
collect waxes and the products leaving this trap were passed through a second
trap kept at 0degC and 02MPa to collect the lighter products (water alcohols and
hydrocarbons) See Fig 428
Fig 428 Cold trap
The two cold traps can be opened at any time of the reaction and the liquid
condensed inside can be quantified and analyzed
119
The analyses were performed in various chromatographs according to the
nature of the sample to be analyzed Permanent gases and light hydrocarbons
were analyzed on-line in a PerkinElmer 3000GC Autosystem fitted with TCD
detectors using a Carbosieve SII Supelco column The liquid products (collected
at 150degC and 0degC) were weighted and analyzed in a PerkinElmer chromatograph
fitted with a 50m long Alumina RT capillary column connected to a FID
42b Analytical instruments
Two different analysis were made for the quantification of the composition of
i) Out coming gas (mixture of not reacted CO and H2 N2 and non-
condensed FT products) by an on-line in a PerkinElmer 3000GC
Autosystem fitted with TCD detectors using a Carbosieve SII Supelco
column
ii) Organic phase of condensed liquid products (collected in a cold trap at
150ordmC and 0ordmC) hydrocarbons in the range C7-C30 were weighted
and analyzed in a PerkinElmer chromatograph fitted with a 50m
long and 053 mm diameter of Alumina RT capillary column
connected to a FID
An example of analyses of the permanent gases is reported in Fig 429 and an
example of analysis of heavy FT hydrocarbons is reported in Fig 430 and Fig
431
120
Fig 429 Example of analyses of the permanent gases in the TCD
Fig 430 Example of not-condensed products GC analyses on FT out coming gas
121
Fig 431 Example of GC analysis for the quantification of heavy FT products
43b Experimental procedure
All the kinetic FT runs were made on the plant following the same experimental
procedure
1) Catalyst preparation
2) Catalyst loading on the plant in the FT reactor
3) Leak test
4) Catalyst activation
5) FT run
6) Opening of cold trap and separation of organic from aqueous phases
7) Catalyst removal from reactor
8) Reactor cleaning
43b1 Catalyst preparation
Before the catalyst was loaded in the reactor a standard procedure was
followed on the same catalyst
- Catalyst mesh operation between 106 and 150 micron
- Heating in oven at 120degC for a night
122
- Mixture catalyst ndash sea sand (inert material ndash diluent) 11
In table 414 the main characteristics of sea sand are reported The role of this
material is to help the heating removal from the catalyst (FT reaction is highly
exothermic) [5]
Table 414 Main characteristics of sea sand
Particle Size (μm)
Specific Surface
Area (m2g)
Bulk density (Kgm3)
Pore Volume
(mL)
Interstitial Velocity
(md)
Porosity (-) Composition
100-300 074
200-1430
117 26
044 SiO2
43b2 Catalyst loading
As the height of the mixture catalyst + sea sand is about 1 cm (using a pipe with
an internal diameter of 95 mm) if this material is charged in the middle of the
reactor this work surely at the same temperature in each point The final
arrangement of the reactor is reported in Fig 432
Fig 432 FT reactor internal loading arrangement
123
Finally after the closing the pressure inside the reactor is raised till 3 bar with
the activation gases The gas flow is stopped for one night and then the reactor
is checked to control possible gas losses If the reactor pressure is stable the
activation catalyst step will be performed The same procedure for the check of
possible gas loss will be performed when the pressure of the reactor will be
raised till 20 bar for FTS
43b3 Catalyst activation The catalyst activation is the process in which the catalyst is reduced from the
oxidised state in the reduced or metallic state The samples tested in this
reactor were the Co based hydrotalcites In the FT reaction the active form for
the cobalt based catalysts is the cobalt metallic All the catalysts were charged
into the reactor in the oxidised form because the last operation in the catalysts
preparation is the calcination (T=500degC) in air The catalyst activation-reduction
is performed in this part of the PhDrsquos research work at 350degC using H2 always
for 4 h at 3 bar of pressure At the end of this step the FT process start
43b4 Fischer Tropsch runs
After the catalyst activation the plant is raised at standard reactions conditions
Temperature = 220-260degC
Pressure = 20 bar
Feed ratio H2CO = 21
Syngas (H2 + CO + N2) flow = 156 Nmlmin (in order to work with the
same space velocity used for the same samples tested in the Unit 1 in
Italy)
These are the ldquostandardrdquo reaction conditions When the plant reaches the set-
up values this is the ldquozero-timerdquo of the FT runs Every one hour the GC make
124
one analysis of the permanent gases (CO CO2 CH4 N2) on the out coming flow
(also during the night) Each data is reported and elaborate using an excel
database The FT run has a duration between 200-280 hours During the
reaction and before the changes of temperatures the valves of the two cold
trap are opened and both the organic phase (GC) and the aqueous phase are
separated and then weighed and analyzed Also these data is collected in the
excel database and now it is possible to calculate the CO conversion the
products selectivity the alpha parameter and it is possible to verify the final
mass balance
After the reactor cooling the catalyst is unloaded The reactor is cleaned
carefully
42 Experimental data elaboration
The experimental data collected in the laboratory are the gas-chromatographic
area (with micro and traditional GC) the gas flows the temperatures the
pressure the weight of condensed products and the TOC value of organic
compounds in aqueous phase For each run all these data were put in the
excel file where in an automatic way the CO conversion the products
selectivity the molar balance the parameter were calculated
There were used two different file excel for the two different FTS unit
a) First FTS unit (Unit 1)
The file excel is split in nine pages data results heavy hydrocarbons analysis
molar balance (CO hydrogen and oxygen) hydrogen analysis oxygen analysis
and alpha calculation As example the pages of one FT run (made with a Co
base catalyst Co35_2d) are reported in Fig 433a-f
Data page (Fig 433a)
125
This worksheet contains the mathematical elaboration of the experimental
data obtained from the various analyzes and is composed of different parts
Conditions It is referred to the number of tests carried out by the
micro-gas chromatograph the time at which the analysis were made
and the outside temperature at the time of sampling
Flow in It is referred to the flow in (Nmlmin) of the reactants (H2 and
CO) and the internal standard (N2) that remain constant during the
entire kinetic energy
Volumes totalizers It is referred to the values of the three volumes of
gas consumed while the kinetic is in progress (this values are read from
the totalizer just before performing the analysis) and the total volume
of gas output in ml and Nml Furthermore it also evaluates an error in
percentage between the volume of gas out and the gas in
Flow out is measured by a flow meter bubbles and a counter ldquoRitterrdquo
the flow rates are calculated with the output flow measured from the
bubble flow meter and the Ritter counter and then compared
Flow from bubble flow meter (min
ml ) = 60t
V (11)
V[ml] Volume path from the bubble
t[min] Time it takes the bubble to traverse this volume
Flow from Ritter counter (min
ml ) = 100)(
t
VV INOUT (12)
VIN [ml] and VOUT [ml]are the volume of gas in and out
Both values of flow are converted in Nmlmin by the next equation
T273
273ml
min T[degC] (13)
126
CO Conversion It is referred to the quantity of gas reacted or converted
referred to the gas entering inn the plant From the micro-gc analysis
are taken the chromatographic areas of CO and N2 and used to
calculate the flow out-coming of CO from the equation
29121
2
2
OUTNflow
NArea
COAreaCOflow OUT (14)
Where 12912 is the calibration factor As the flow in and the flow out of N2
is the same
29121
025
2
NArea
COAreaCOflow OUT (15)
502 is the flow of the internal standard N2
Now it is possible to calculate the CO conversion using the next formula
IN
OUTIN
COflow
COflowCOflowConversionCO
(16)
Selectivity Concerning the gas flow out-coming from the FT plant made
of not reacted CO CO2 CH4 and light hydrocarbons
CO in reaction mixture 100
2
NTOT
OUT
flowflow
COflowCO (17)
product i in reaction mixture
100
2
NTOT
OUT
i
i
iflowflow
flowcF
area
product (18)
where
flowTOT is the total flow out-coming from the FT plant and concentrationi is
the amount (m) of product i found using the micro-GC
Fci is the calibration factor for each compound
127
Carbon molar flow for the i compound
i
i
C
i
tot
Cnumber
flowmoles
422
100
0010
min (19)
where iCnumber is the number of carbon atom of compound i
0001 transform Nml to Nl and 224 let to transform Nl to moles
Molar balance
CO moles entering in the plant 1000422min x
flowCmolesinin COCO
(20)
CO moles out coming
6
1 min1000422min i
iCOCO molesC
x
flowCmolesoutOUT (21)
128
Fig 433a Example of ldquodata pagerdquo in FT data elaboration excel file
Results page (Fig 433b)
Concerning the products selectivity
Light products (ltC7) j selectivity
129
100
minmin
min
outin
C
j molesCOmolesCO
moles
S
j
(22)
where jCmoles means the moles of carbon atom in the j products
Heavy products (geC7) i selectivity
100
minmin
min
outin
C
i molesCOmolesCO
moles
S
i
(23)
where iCmoles means the moles of carbon atom in the i products
Total light products selectivity jlight SS (24)
Total heavy products selectivity iheavy SS (25)
Fig 433b Example of ldquoresults pagerdquo in FT data elaboration excel file
Concerning the heavy product (organic phase condensed in the cold trap) elaboration (Fig 433c)
moles of i compound 100
CA
fcCAmoles ii
i (26)
where CA is the chromatographic area and fc is the calibration factor
130
Total moles of ldquo-CH2-ldquo unit in organic phase 142
OPCH
weightmoles (27)
Where weightOP means the weight of the organic phase in gram and 14 is the molecular weight of the unit ldquo-CH2-ldquo
Carbon moles of compound i 100
2 i
CH
Cmoles
molesmoles
i
(28)
Moles of carbon per minute of each component
60min
timereaction
CmolesCmoles ii (29)
Fig 433c Example of ldquoheavy hydrocarbons analysis pagerdquo in FT data elaboration excel file
Molar balance page (Fig 433d)
The molar balance is verified using the following equation
outoutoutoutinCwaterCheavyClightCOCO molesmolesmolesmolesmoles (30)
Where
131
inCOmoles and outCOmoles are respectively the moles of CO in entrance and
escape of the FT plant in all the runrsquos time outClightmoles are the carbon
atom moles of light FT products came out from the FT plant in all the runrsquos
time outCheavymoles are the carbon atom moles of the heavy hydrocarbons in
the organic phase condensed in the cold trap and outCwatermoles are the
carbon atom moles inside the water phase condensed in the cold trap In
particular
422
0102 iiNtot
Clight
Cnflowflowmoles out
out (31)
2CH
OPCheavy
PM
weightmoles
out (32)
12106
fdweightppmmoles OPTOC
Cwaterout (33)
where ppmTOC are the ppm of Total Organic Carbon measured by TOC
instrument and fd is a diluting factor (normally 1500) as the aqueous phase
must be diluted before the TOC analysis
Fig 433d Example of ldquomolar balance pagerdquo in FT data elaboration excel file
132
alpha parameter (Fig 433e)
This parameter represents a prediction of the distribution related to the
number of carbon atoms according to the Anderson-Schulz-Flory
distribution
In the excel file of data elaboration it is possible to calculate the alpha
parameter in different range of hydrocarbons C1-C6 C3-C12 C13-C30 C3-C30
The hydrocarbon range is chosen depending of the FT results if as
example the heavy product selectivity is very low it is not convenient to
consider these products in the calculation The equation for the
calculation is
21
logloglog nn
Wn (34)
where Wn is the weight fraction of product with n carbon atom number In
the excel file the equation used are
tot
C
C tmoles
moles i
i 60
min (35)
where ttot is the total time of FT run in hours
iCi PMmolesgi (36)
n
i
i
in
g
gW
1
(37)
The calculation of is then performed making a diagram in which the
n
Wnlog is reported vs the carbon atom number
133
Fig 433e Example of ldquo calculation pagerdquo in FT data elaboration excel file
ldquo calculation pagerdquo
The product distribution can be predicted using the AndersonminusSchulzminusFlory
(ASF) model that depends on the chain growth probability α Different factors
have an influence on the alpha parameter such as process conditions type of
catalyst and chemical promoters [6] The ASF product distribution as a function
of α is depicted in Figure 25 (Chapter 2)
According to ASF distribution ideally the molar fraction (Mn) of the
hydrocarbon product with a carbon number of n is only dependent on the
chain-growth probability (α) which is a function of the rates of chain growth
and chain termination by the following equation
Mn = (1minusα)αnminus1 (38)
In other words the product selectivity is determined by α value in an ideal
case A smaller α value leads to lighter (C1ndashC4) hydrocarbons while larger α
value results in the formation of heavier (C21+) hydrocarbons However the ASF
distribution is unselective for the middle-distillate products which are usually
the target products For examples the maximum selectivity to gasoline-range
(C5ndashC11) hydrocarbons is sim45 and that to diesel-range (C10ndashC20) hydrocarbons
is sim35 The development of selective FT catalysts which can tune the
134
selectivities to desired products is one of the most challenging targets in the
field of FT synthesis [7]
The probability is defined as the speed of growth (rg) divided by the sum of
the speeds of all the possible reactions for the species in growth
The probability to form a product Pn with n carbon atoms is the product of the
probabilities that the adsorbed species are formed in 1 2 n-1 carbon atoms
(precursors of the species Pn) and the probability that the adsorbed species an
carbon atoms desorb Writing a mathematical model leads to the ASF
2n 1
loglognn
Wlog (39)
where Wn is the mass fraction of the product with n carbon atoms
To get the equation of Anderson-Schulz-Flory We define
- as the probability of growth - rt as the rate of chain terminations - rp the speed of chain propagation
For a chain of n carbon atoms is defined another parameter n given by
1n
i
n
n
n
p
tn
1
r
r
(40)
where n is the probability that a chain of n carbon atoms remains on the
catalyst to continue the propagation of the chains n is the number of moles of
product Cn If n is constant throughout the range of products it may simply
indicate with and therefore starting from n = 1 we can write
3
134
2
123
12
So in general
135
1n1n
Starting from a generic molecule with x carbon atoms we can write
xnxn
(41)
Assuming that the monomeric units have the same molecular weight without
regard to their position in the growing chain (these monomer units are CH2
with PM = 14) we can obtain the weight fraction Wn multiplying the equation
(1) by n and dividing it by
1n
nn If we set x = 1 equation (41) remains
1n
1n
1n
1n
1n1
1n1
1n
n
nn
n
n
n
n
n
nW
(42)
The denominator of the last member of equation (42) can be written as
0n
n
(43)
In fact the operators
can be reversed and therefore
0n
1nn
0n0n
n
The series
0n
n for 1 be equal to 1
1
The series in question is of the type n32 arararaS
and the solution is equal to
r1
r1aS
n
Equation (2) can therefore be rewritten as follows
136
2
1n1n
0
n
1n
n1
n
1
1
nnW
or
21nn 1nW (44)
Bringing in logarithmic form the equation (44) we have
2n
n
n
n
1n
n
W
12nn
W
121nn
W
121nnW
)(lnlnln
)ln(lnlnln
)ln(ln)(ln
)ln(ln)(lnln
is identified by the slope of the straight line obtained by plotting the log
(Wnn) as a function of n The quality and the defect of the ASF model is its
simplicity one is in fact arises because of its ease of use across the agreement
with experimental data is not always fully satisfactory in fact the equation
provides undifferentiated products while in reality various species are
summarized
In this file are calculated different values of depending on the range of
carbon atoms C3-C12 C13-C30 C3-C30 Furthermore it was calculated an value
for the range C1-C6 because it is common to all the catalysts in fact the nature
of the tests performed on the various samples kinetics do not guarantee the
of the other range
Mathematically is calculated from
bullthe moles of carbonmin of the various components
bull from the moles of carbonmin it is possible to find the moles of each
component with the formula
137
hreactiontimeh
Cmolcarbontomol i
i
min60
min
From the moles it is possible to get the grams of each component
mol
gPMmolCmolg ii
Wn is calculated (weight fraction) for each component
n
1i
i
in
g
gW
i
calculating the value of Wnn (where n is the number of carbon atoms)
for each component
calculating the ln(Wnn)
By plotting the logarithm of the value of Wnn as a function of the number of
carbon atoms (n) is obtained a straight line whose slope gives the value of
desired
425 Hydrogen
Hydrogen balance (Fig 433f)
This data page allows to calculate the conversion of hydrogen and also the of
H2 in the gas mixture leaving from the reactor
H2 Conversion
Area H2
Area N2
Real Flow mix [Nml min-1]
Flow H2 OUT
[Nml min-1]
CONV H2 ()
() H2
138
As for the CO from the analysis at the micro-GC we get the chromatographic
areas of H2 and N2 that are used to calculate the outlet flow from the Fischer-
Tropsch plant of carbon monoxide by the formula
0017
2
2
22
OUTNflow
NArea
HAreaHflow OUT
where 7001 is the correction factor determined by the calibration of the
micro-gas chromatograph As the output flow of nitrogen is equal to that in the
input will have
0017
025
2
22
NArea
HAreaHflow OUT
At this point we can calculate the conversion of H2 by the formula
IN
OUTIN
Hflow
HflowHflowHConversion
2
222
The H2 is necessary to obtain the number of moles of hydrogen present in the
gaseous stream leaving from the reactor it is calculated through the formula
1002
2 TOT
OUT
flow
HflowH
Hydrogen Balance Also the balance of the hydrogen is performed at the end of the kinetic and it is
calculated with the following formula
2_
_2_
2
22222
Hfrom
waterheavylightMixfromHfrom
IN
OUTOUTOUTOUTIN
Hmoles
HmoliHmolesHmolesHmolesHmoles
where
139
1 18
2
phaseaqueous
OUT
weightwaterHmoles
2 2
2
CHPM
phaseorganicweightphaseorganicfomHmoles
The use of the molecular weight of methylene is because the CH2 is the
segment that grow joining to other segment of CH2 to give the different
hydrocarbons
3 moles of H2OUT light are the moles obtained by the summation of moles
of H2OUT of light hydrocarbons through the formula
2422
0102
jiOUT
OUT
compoundHngasmllightHmoles
Fig 433f Example of ldquohydrogen balancerdquo in FT data elaboration excel file
427 Oxygen Balance As for the other two balances also the oxygen balance is carried out at the end
of the kinetic run and it is calculated using the formula
COfrom
OHfomCOfromCOfromCOfrom
IN
OUTOUTOUTIN
Omoles
OmolesOmolesOmolesOmoles
_
2_2___
Where
140
1 18
phaseaqueous
OUT
weightwaterOmoles
2 422
2010 22
COgasmlCOOmoles OUT
OUT
In the calculation of the oxygen balance are not considered the oxygenated
products while the moles of OIN from CO and the moles of OOUT from CO are
respectively equal to the moles of COIN and COOUT from CO
b) Seconf FTS unit (Unit 2)
The shape of the file excel is presented in a different way but the equations
are the same equations presented before (See First FTS unit in this chapter)
The file is split in eleven pages XCO CH4 CO2 TCD data media paraffins
fractions (1-4) As example the pages of one FT run (made with a Co based
hydrotalcites catalyst Co35_2d) are reported in Fig 434a-d
TCD In Fig 434a-b are shown the conditions related to the number of tests
carried out by the gas chromatograph the time at which the analysis were
made and the outside temperature at the time of sampling the CO Conversion
that is referred to the quantity of gas reacted or converted referred to the gas
entering inn the plant From the gas chromatograph are taken the
chromatographic areas of CO CH4 CO2 and N2 and used to calculate the
selectivity
Fig 434a Example of ldquodata page _ TCDrdquo in FT data elaboration excel file
141
Fig 434b Example of ldquodata page _ TCDrdquo in FT data elaboration excel file
Datos In Fig434 c is shown the information related to the selectivity of light hydrocarbons
Fig 434 c Example of ldquolight hydrocarbons analysis pagerdquo in FT data elaboration
excel file
In Fig 434d the calculation of is then performed making a diagram in
which the
n
Wnlog is reported vs the carbon atom number
Fig 434 d Example of ldquo calculation pagerdquo in FT data elaboration excel file
142
43 Novelties on the FT plant made in this PhD work In the second year of the PhD the reactor used in the laboratory at the
ldquoUniversitagrave degli Studi di Milanordquo was brought in ldquoBrignolerdquo Company
(Legnano ndash MI) for a general control and revision
In this long revision some fundamentals improvements have been made on
the FT plant
all the analytical procedures were optimized verified and calibrated
A new flowmeter was included in the feed verified and calibrate
References
[1] CLBianchi C Pirola V Ragaini Cat Comm 7 (2006) 669
[2] ML Cubeiro Loacutepez A Colmenares L Texeira M Goldwasser M J Peacuterez
F Machado F Gonzaacutelez Applied Catalysis A General 167 (1998) 183-193
[3] C Pirola C L Bianchi A Di Michele P Diodati S Vitali V Ragaini Catal
Lett 131 (2009) 294ndash304
[4] C Pirola CL Bianchi A Di Michele S Vitali V Ragaini Catal Comm 10
(2009) 823ndash827
[5] C Pirola PhD 2007-2008 Novel supported iron based Fischer-Tropsch
catalysts Preparation characterization and applications Chapter 5
[6] Abell S Montan D ChemSusChem 2011 4 1538minus1556]
[7] Qinghong Z Weiping D Ye W Review Recent advances in understanding the key catalyst factors for Fischer-Tropsch synthesis J Ener Chem 2013 2227ndash38
143
Chapter 5 Catalysts preparation and characterization A serious of catalysts were prepared according different method of synthesis
and using cobalt and iron depending on the kind of the study
The catalysts reported in Table 51 are divided in two classes
1) Catalysts of cobalt based divided into two more groups
a Co based hydrotalcites with different amount of cobalt (5-35
wt) prepared with an innovative method of synthesis (urea
method)
b Co based catalysts with 8wt of cobalt with different supports
(SiO2 Al2O3 or TiO2) and the same samples with the addition of
01 of ruthenium carbonyl all of them synthesized with the
help of ultrasound
2) Catalysts of iron (30 wt) with fixed (optimized) loading of promoters
(K=20 Cu=375) and different method of synthesis
The catalysts of the first series (Co) subdivided in two more groups (HTlc and
bimetallic with the help of ultrasound) were studied to verify the activity of
this new kind of catalysts in the CO hydrogenation
More specifically the hydrotalcites were proposed as a new kind of catalysts
in which the active metal is part of the structural core of the HTlc has been
synthesized and tested Activity tests conducted in a fixed bed reactor resulted
in satisfactory catalytic performances as we will discuss later Moreover the
structural and catalytic properties of these materials were verified at FTS
operating conditions and correlations between catalyst features and efficiency
144
towards light and heavy hydrocarbons selectivities were achieved And the
cobalt based catalysts synthesized with the help of ultrasound (US) were
studied to test the effects of sonochemical synthesis to prepare novel
supported materials with particular properties as nanostructured catalysts [1]
The chemical effect of ultrasound arises from acoustic cavitation ie the
formation growth and implosive collapse of bubbles in a liquid Some of the
interesting features resulting from the application of sonication as a synthetic
method are the nanoparticles preparation showing a more uniform size
distribution higher surface area and a more controlled phase composition The
use of high power ultrasound for long time is a difficult procedure because it is
a critical point the control of the thermal stability of the ultrasound horn In
this PhDrsquos work the possibility to use an ultrasound assisted synthesis of Co-
based catalysts by high power ultrasound for a long time has been
investigated using an innovative experimental apparatus equipped with a new
cooling system able to maintain stable the temperature US emitting horn
The catalysts of the second series (Fe) were studied to verify the effect of the
different methods of synthesis and the variation of the H2 CO ratio in order to
simulate a feed with biosyngas and for an ulterior study about the develop of a
kinetic model The selection of this specific amount of Fe (30 wt) and
promoters (Cu and K with 20 wt and 375wt respectively) was taken from
a previous research [2] in which the effect of these amounts was extensively
studied
Promoters influence the bond strength of hydrogen and carbon oxide to metal
Addition of alkali metals (K in particular) to iron catalysts promotes electron
transfer to the iron and inhibits hydrogen adsorption because adsorption of
hydrogen induces electron donation to the iron surface Moreover K promotion
Chapter 5 Catalysts preparation and characterization
145
increases the electron density in iron and will result in an increase of CO
adsorption On Fe stronger metal-carbon bonds will lead to C2+ formation and
then to a low methane selectivity [3] Copper promotes the reduction of iron
oxide phases from hematite (Fe2O3) to magnetite (Fe3O4) and then from
magnetite to iron metal A suggested mechanism for this promotion effect is
the migration of atomic hydrogen from reduced Cu sites to the iron oxide The
copper needs to be very well mixed with iron oxide to provide the most
favourable promoter effect [4]
An innovative preparation procedure with the use of Ultrasound and
Microwave has been used with the iron based catalysts
In Table 51 a general summary of all the prepared catalyst is reported
Table 51 Summary of the catalysts synthesized and tested
Metal Catalysts Samples
Co
HTlc Co5
Co 10
Co 15
Co 35
Bimetallic US CoTiO2
CoSiO2
CoAl2O3
Co-RuTiO2
Co-RuSiO2
Co-RuAl2O3
Fe
Traditional Fe30K20Cu375 SiO2 At different temperature and H2CO ratio 21 15111
Traditional + MW MW1
MW2
Traditional + US
US1
US2
Co-precipitation
FeSiO2-TEOS
Chapter 5 Catalysts preparation and characterization
146
The catalysts were characterized by TPR BET SEM TEM ICP FT-IR micro-
RAMAN techniques in their fresh form (before the use in FT reactor) and in
some cases after different activation procedure or after FT runs
The physical properties of the catalysts (surface area and morphology) were
investigated by BET SEM and TEM analyses The theoretic catalysts
composition has been investigated and verified both qualitatively using SEM-
EDS FT-IR and micro-RAMAN techniques and quantitatively using ICP
characterization The reduction behaviour of metal phase has been
investigated by TPR analyses
51 Catalysts preparation
511 Catalyst preparation procedure
5111 Cobalt based catalysts
Two different types of cobalt based catalysts were prepared during this
research The synthesis is presented in the next paragraphs
Co based Hydrotalcites by a modified urea method
A series of ternary HTlc with general formula [CoxZn(1-x-
y)Aly(OH)2](NO3)y∙05H2O was synthesized by a modified-urea method [5]
Different volumes of the solutions of the metal nitrates all at a concentration
of 05 M were mixed to obtained either a Al(Co+Al) or Al(Co+Al+Zn) molar
ratio of 03
Solid urea was added to the solutions in a molar ratio of 4 vs Al The obtained
solutions were maintained at the reflux temperature in an open flask for 48 h
The precipitates were separated by centrifugation washed with water and
then dried at 80degC
Chapter 5 Catalysts preparation and characterization
147
Co based catalysts with the help of ultrasound
All the catalysts were prepared by a modified impregnation method The metal
precursors (cobalt and ruthenium carbonyl) were dissolved in n-decane
together with the different support (SiO2 Al2O3 or TiO2) The solution was
irradiated by an US horn (Fig 51) for 3 h at 20 kHz at 300 W and then put into
a rotating vacuum oven at 40degC at 36 rpm for 24 h (impregnation step)
Samples have been calcinated at 350 degC for 4 h
Fig 51 Ultrasound horn with a cooling jacket where the coolant has two main
characteristics low viscosity at low temperature and dielectric liquid
5112 Iron based catalysts Four different types of iron based catalysts were prepared during this
research The methods used were the traditional impregnation method the co-
precipitation method and the traditional impregnation method with the help of
microwave and ultrasounds
Fe based catalysts by the Traditional Impregnation method
The iron based supported on silica catalysts were prepared according to the
traditional impregnation method completely described in a previous work [6]
starting from an aqueous solution of precursors and adding in a second time
Chapter 5 Catalysts preparation and characterization
148
the support (silica) The reagents used for the samples preparation are
reported in Table 52
Table 52 Reagents used in the catalysts preparation Fe30K20Cu375 SiO2
Reagent Main characteristics
Support SiO2
Company Fluka (cod 60740) Mesh 70-230 60 Aring Molecular weight 60086 gmol Purity gt 99 Superficial area 500 m2g
Precursors
Fe(NO3)3middot9H2O Company Riedel de Hean Molecular weight 40385 gmol Purity 98
KNO3 Company Merk Molecular weight 10111 gmol Purity gt 99
Cu(CH3COO)2middotH2O Company Fluka Molecular weight 19965 gmol Purity 99
Solvent Extra pure water
The standard methodology for the catalysts preparation is the following
Drying of silica in oven (T=120degC) for a night
Weigh of the calculated amount of iron potassium and copper
precursors
In a pyrex vessel (250 ml) the weighed precursors the water (25 ml)
and silica (5 g) are added
The vessel is put on a rotavapor (36 rpm T=40degC P = 1 bar) for 24 hours
(Fig 52)
The solvent is evaporated (T = 80degC)
The powder is dried in oven (T=120degC) for 4 hours
Calcination (T = 500degC) in air for 4 hours
Chapter 5 Catalysts preparation and characterization
149
The catalyst is sieved to obtain a powder mesh between 100 and 140
Fig 52 Rotavapor used for catalyst preparation
The amount of precursors is calculated starting from the equation (1) to have
the requested iron percentage in the not promoted catalysts
FegSiOgFe
gFe
2
(1)
Then the moles of iron are equal as the moles of his precursor (moles Fe =
moles Fe(NO3)39H2O) The grams of precursors are calculated multiplying the
moles for the molecular weight of Fe(NO3)39H2O This quantity must be divided
for the purity grade of precursor
For the promoted catalysts the amount of precursors is calculated using the
following equations
FegSiOgCugKgFe
gFe
2
(2)
KgSiOgCugKgFe
gK
2
(3)
CugSiOgCugKgFe
gCu
2
(4)
Chapter 5 Catalysts preparation and characterization
150
The equation (2) (3) and (4) must be solved as equations system The moles of
Fe K and Cu are equal as the moles of respective precursors The grams of
precursors are calculated multiplying the moles for the molecular weight of
Fe(NO3)39H2O KNO3 and Cu(CH3COO)2H2O respectively This quantity must be
divided for the purity grade of each precursors
Specifically for the preparation of a catalyst having 30 wt of iron 2wt of
potassium and 375wt of copper on silica
2920037505
15600205
33523005
gCuggCugKgFe
gCu
gKggCugKgFe
gK
gFeggCugKgFe
gFe
moles Fe =molesg
g
84755
3352=00418 moles
moles K =molesg
g
098339
1560= 000398 moles
moles Cu =molesg
g
54663
2920= 00046 moles
g Fe(NO3)3middot9H2O = 00418 molesmiddot40385 gmoles = 16882 g
g KNO3 = 000398 molesmiddot10111gmoles = 04024 g
g Cu(CH3COO)2middotH2O = 00046 molesmiddot19965 gmoles = 09168 g
and the grams required to prepare the catalysts are
980
88216 g=17227 g Fe(NO3)3middot9H2O
Chapter 5 Catalysts preparation and characterization
151
1
40240 g = 04024 g KNO3
990
91680 g= 09261 g Cu(CH3COO)2middotH2O
Fe based catalysts by the Traditional Impregnation method with the help of
microwave (MW)
For the synthesis of the catalysts with the aid of microwave (MW) a final step
where the powder of catalyst already calcined is subjected to a MW
irradiation was added Two different methods for the MW irradiation were
used In the first one (MW1) a sample of catalyst was put into a beaker and
then into a classical microwave oven (Moulinex Micro-Chef 1305E 600W) for
30 min
In the second method (MW2) the catalyst (2 g) was suspended in hexane (400
ml) put into a microwave chemical reactor (ordinary 400 mL round bottom
glass flask filled with the liquid to be heated and activated) and treated for 1 h
at 60W MW were produced by a MW generator and sent to the MW
applicator by an insulated coaxial antenna Details of the MW applicator and of
the associated experimental techniques can be found in [7]
Fig 53 Microwave (MW) Power (35-300 W) Treatment duration (60 min)
Atmosphere (air)
Chapter 5 Catalysts preparation and characterization
152
Fe based catalysts by Traditional Impregnation method with the help of
ultrasound (US)
In this particular preparation method a step using ultrasound (US) has been
added Ultrasound is simply sound pitched above the frequency bond of human
hearing It is a part of sonic spectrum that ranges from 20 kHz to 10 MHz and
corresponds to the wavelengths from 10 to 10-3 cm [8] The application of
ultrasound in connection to chemical reactions is called sonochemistry The
range from 20 kHz to around 1 MHz is used in sonochemistry since acoustic
cavitation in liquids can be efficiently generated within this frequency range
[9] However common laboratory equipment utilizes the range between 20
and 40 kHz The Ultrasound are often used in the preparation of supported
catalysts (some examples are reported in ref [10]) and their useful
contribution concerns for example the dispersion of metal the size of particles
the surface area and the advantage is evident in the performance of catalyst in
many cases both in term of conversion and of process selectivity [11]
The use of ultrasound may be very efficient to optimize the dispersion of high
metal charge as already verified in our laboratory in the past [2 12-13]
US treatment has been performed between the impregnation and the
evaporation step by irradiating the silica-precursors solution using a Sonicator
(W-385 Heat Systems Ultrasonics) with an effective input power of 60 W and a
tip diameter of 13 mm (Fig54 and Fig 55) Silica solution promoters and
water have been sonicated by the US horn for 05 h in air (US1) The same
sample was successively sonicated in a suspension of hexane in argon for 3h
(US2)
Chapter 5 Catalysts preparation and characterization
153
Figura 54 Diagram of sonication step
1 Sonicator US (W-385 of Heat Systems Ultrasonics)
2 Emitter head of US equipped with a titanium tip of 13 mm
3 Beaker with the solution immerse in a bath of waterice
4 Flow meter of Ar
5 Connection with air
6 Argon Cylinder
Fig 55 Detail of the US treatment step 20 kHz 60 W tip diameter of 13 mm US
switched on and off alternatively for 05 seconds (pulsed US) t =30 min
1
4
6 3
2
5
Chapter 5 Catalysts preparation and characterization
154
Fe based catalyst by the co-precipitation method with TEOS
Acidic silica sol (ASS) and tetraethoxysilane (TEOS) are widely used as silica
sources of FeSiO2 catalysts [14-15] which can be incorporated into iron
catalyst matrix during the precipitation of catalyst precursors and have an
obviously dispersive effect on the iron oxide phase It is well known that the
tetraethoxysilane (TEOS) is insolvable in aqueous solutions but can slowly
hydrolyze to hydrophilic silica solgel [16]
In the TEOS- water system acid or basic can catalyze the hydrolysis of TEOS
[17] In the process of the co-precipitation TEOS hydrolyzes into silica
accompanied by the precipitation of ferric ions whereas the silica particles in
ASS may directly interact with ferric ions The different properties of two silica
sources should lead to a great diversity in both the structures and the
physicochemical properties of catalysts such as morphology dispersion
phases chemisorption Fe-SiO2 interactions and so on
As a FeSiO2 catalyst was prepared by a co-precipitation method using TEOS
The detailed process of the co-precipitation method has been described
elsewhere [18] In brief an alcoholic solution of TEOS was mixed with an
aqueous solution of iron nitrate with a FeSi atomic ratio of 10025 The mixed
solution was precipitated using an ammonium solution at 80 degC and a pH value
of 85-90 After precipitation the precipitates were aged for 2 h washed and
filtered Then the filtered cakes were dried at 120 degC overnight and calcined at
500 degC for 5 h The catalyst was denoted as FeSiO2-TEOS
Some calculations have been made to prepare the catalyst
To prepare 50ml 1M of solution of TEOS
To prepare a catalyst with a FeTEOS= 41 ratio and using 1g of Fe are required
Chapter 5 Catalysts preparation and characterization
155
To prepare the catalysts is required a ratio FeTEOS=41 thatrsquos mean 1g of Fe
correspond with 025g of TEOS
molFemolFeg
gFemolFe 01790
84755
1
OHNOgFeOHNOmolFe
OHNOgFe
molFe
OHNOmolFemolFeOHNOgFe 233
233
233233233 9)(387
980
1
9)(
9)(52403
1
9)(1017909)(
mll
ml
mol
Mlsol
gTEOS
molTEOSgTEOSmlTEOS 201
1
1000
1
11
33208
1250
700ml of distillate water was put into a beaker and heated at 77degC
OHNOgFe 233 9)(387 and 120ml of TEOS were added
Measurements of pH was taken until the solution acquired a pH
between 8 and 9
Let stand for 2 hours
The solvent is evaporated (T = 80degC)
The powder is dried in oven (T=120degC) for 4 hours
Calcination (T = 500degC) in air for 4 hours
The catalyst is sieved to obtain a powder mesh between 100 and 140
52 Catalysts characterization 521 Catalysis characterization introduction and theory
According to [19] the basic catalyst characterization involves two main steps
the investigation on the porous nature of the catalyst support (physical
properties) and on the properties of the active sites that are dispersed on the
support surface (table 53)
The complete and accurate knowledge of the properties of a catalyst is
fundamental for evaluating its performance In this work there were used
several techniques to investigate their physical and chemical properties
Chapter 5 Catalysts preparation and characterization
156
The characterization has been made for the fresh catalysts (after the
calcination at 500degC and before their loading and activation or use in FT
reactor) and in some cases after the activation and the FT reaction
Table 53 General scheme of catalysts characterization [19]
Catalyst texture
Physical properties Chemical properties
Result Technique Result Technique Geometry and shape - Optical microscopy Chemical composition -Electron spectroscopy
-Atomic adsorption
Total specific surface area
-Gas physisorption -Mercury porosimetry
Degree of dispersion -Selective chemisorption -X-ray -Electron microscopy -Magnetisation analysis
True density -X-ray analysis -Neutron diffraction
Degree of dispersion -Selective chemisorption -X-Ray -Electron microscopy -Magnetisation analysis
Bulk and apparent density
-Helium pycnometry -Mercury porosimetry -Liquid displacement
Surface Energy -Thermal analysis test -Temperature programmed desorption and reaction calorimetry
-Pore specific volume -Porosity
-Mercury porosimetry -Gas adsorption
Acid-base sites -Selective chemisorption -Temperature programmed desorption
Pore size and mean pore size
-Mercury porosimetry -Gas Adsorption
Redox sites -Spectroscopic methods -Temp programmed reduction -Temp Programmed oxidation
Particle size -Sieves -Laser scattering -Sedimentation -Electrical sensing zone -Etc
-Catalytic properties -Activity -Selectivity
Reactor tests and simulation
Surface structure -Optical microscopy -Electron microscopy -X-Ray analysis
Surface change Z potential
A brief description of the different techniques used in this work will be
presented as follow
Chapter 5 Catalysts preparation and characterization
157
BET (adsorption method for surface area evaluation)
SEM
TEM (electron microscopy)
FT-IR and RAMAN (vibrational spectroscopy for chemistry of surface
groups)
TPR (study of catalyst reduction vs temperature)
TPD
ICP (quantification of element inside the catalyst)
XRD
5211 BET analysis (adsorption method for surface area evaluation)
According to [20] the most widely used method for determining surface area
involves measuring the amount of gas adsorbed on a solid surface at a
temperature close to the boiling point of the gas Nitrogen is most commonly
used as the adsorbate
The interaction between the adsorbate and the adsorbent may be chemical
(chemisorption) or physical (physisorption) in nature and ideally should be a
surface-specific interaction If the adsorption is measured at several gas
pressures the Brunauer- Emmett-Teller (BET) [21] equation can be used to
calculate the amount of adsorbate required to form a monolayer [22] This
technique of characterization of solid has the particular equation that allows to
determine a parameter of great importance in the study of the solid ones that
is the superficial specific area Such parameter expresses the relationship
between the total surface of the catalyst and the weight of the same one and
usually is expressed in m2g Technique BET uses the principle of the physical
inert gas adsorption (nitrogen) to varying of the relationship between the
Chapter 5 Catalysts preparation and characterization
158
partial pressure of nitrogen and its vapor pressure to the temperature of liquid
nitrogen The technique can be carried in static or dynamic conditions
Opportune procedures of calculation allow also to determine the distribution
of the pores in the field of mesoporosity BET theory is a well-known rule for
the physical adsorption of gas molecules on a solid surface that is basis for an
important analysis technique for the measurement of the specific surface area
of a material The concept of the theory is an extension of the Langmuir theory
which is a theory for monolayer molecular adsorption to multilayer adsorption
with the following hypotheses (a) gas molecules physically adsorb on a solid in
layers infinitely (b) there is no interaction between each adsorption layer and
(c) the Langmuir theory can be applied to each layer The resulting BET
equation is the following
p
pc
p
p
p
pc
V
V
m111
(5)
Where
V = volume of adsorbed gas at pressure P
pdeg = gas saturation pressure at temperature T
ppdeg = relative pressure
C = BET constant expressed by the following
RTqqC L exp 1 (6)
Where
q1 = heat of adsorption of the first layer
qL = heat of adsorption of the second and higher layers
For the Vm calculation the (6) must be linearized and the linear relationship of
this equation is maintained only in the range of 005 lt P P0 lt 035
Chapter 5 Catalysts preparation and characterization
159
mm cV
p
pc
CV
p
pV
p
p
1
1
1
(7)
Equation (7) is an adsorption isotherm and can be plotted as a straight line with
1 V[(Pdeg P) minus 1] on the y-axis and P P0 on the x-axis according to
experimental results The specific surface area is determined on the Vm basis
mol
molAVm
V
ANVAS
(8)
Where
NAV = Avogradorsquos number
Amol= adsorption cross section (for N2 = 162 Aring2)
Vmol= molar volume of gas (22414 mlmol)
Experimental The samples have been analyzed using a Costech Sorptometer
1042 ldquoKELVINrdquo using liquid nitrogen Before the analysis the catalyst is put in
oven (T = 110degC for 16 h) to remove the adsorbed water Then a quantity
between 008 g and 02 g in analyzed in the instrument The sample is pre-
treated for 2 h at T = 200degC in a N2 flow to remove all the impurity then a
check with helium is made to calibrate the interspatial volume
5212 Temperature programmed reduction TPR analysis [19]
Some aspects related to catalysts characteristic and behaviour will be treated
as determination of metal surface area and dispersion spillover effect and
synterisation A description of the available techniques will follow taking in
consideration some aspects of the gas-solid interactions mechanisms
(associativedissociative adsorption acid-base interactions etc)
Chapter 5 Catalysts preparation and characterization
160
The thermal analysis methods may be used with different objectives the
reaction or desorption profile may be used qualitatively to fingerprint a given
system and then it is possible to make a quantitative considerations about the
nature of chemical processes the amount of gas involved in the chemical
reaction and finally to calculate the number of the active sites the reducibility
degree of the sample related to the catalytic activity All the methods relating
some characteristic properties of a catalyst to its temperature during a
programmable heating ramp are named commonly in the field of the thermal
analysis
The thermal analyses are often used to investigate surface modifications and
bulk reactivity by varying the surface composition the catalyst preparation
method the pre-treatment for catalyst activation and the analytical conditions
The TPRO involve a bulk reaction
The objectives of the programmed reduction (TPR) are essentially the
following 1) to find the most efficient reduction conditions 2) to identify the
supported precursor phases and their interactions with the support 3) to
characterize complex systems as bimetallic or doped catalyst to determine the
role of the second component ant to establish alloy formation or promotion
effects There are several interesting studies about this technique Robertson
et al [23] first reported TPR profile of nickel and nickel-copper catalysts and
since then many catalysts have been investigated In the TPR technique an
oxided catalyst precursor is submitted to a programmed temperature rise
while a reducing gas mixture is flowed over it (usually hydrogen diluted in
some inert gas as nitrogen or argon) An interesting application of this
technique is that the TPRO analysis may be used to obtain evidence for the
interaction between the atoms of two metallic components in the case of
bimetallic system or alloy as already cited In general TPRTPO studies are
Chapter 5 Catalysts preparation and characterization
161
carried out under low partial pressure of the reactive gas In this way it is
possible to observe the intermediate reactions depending from analytical
conditions as temperature rate flow rate and concentration of reactive gas
Experimental
Conventional temperature-programmed reduction experiments (TPR)
were performed on the calcined catalysts using a TPRDO110
instrument (Thermoquest) The samples were initially pre-treated in
flowing argon at 200degC for 05 h After being cooled to 50degC the H2Ar
(51 vv) reducing mixture flowed through the sample at 30 mlmin
while the temperature was increased from 50 to 900degC at constant rate
of 8 degCmin
5213 SEM and TEM analysis
In electron microscopy as in any field of optics the overall contrast is due to
differential absorption of photons or particles (amplitude contrast) or
diffraction phenomena (phase contrast) The method provides identification of
phases and structural information on crystals direct images of surfaces and
elemental composition and distribution Routine applications however may be
hampered by complexities of image interpretation and by constraints on the
type and preparation of specimens and on the environment within the
microscope
The scanning electron microscope (SEM) is a type of electron microscope that
creates various images by focusing a high energy beam of electrons onto the
surface of a sample and detecting signals from the interaction of the incident
electrons with the samples surface The type of signals gathered in a SEM
varies and can include secondary electrons characteristic x-rays and back
scattered electrons In a SEM these signals come not only from the primary
Chapter 5 Catalysts preparation and characterization
162
beam impinging upon the sample but from other interactions within the
sample near the surface The SEM is capable of producing high-resolution
images of a sample surface in its primary use mode secondary electron
imaging Due to the manner in which this image is created SEM images have
great depth of field yielding a characteristic three-dimensional appearance
useful for understanding the surface structure of a sample This great depth of
field and the wide range of magnifications are the most familiar imaging mode
for specimens in the SEM Characteristic x-rays are emitted when the primary
beam causes the ejection of inner shell electrons from the sample and are used
to tell the elemental composition of the sample The back-scattered electrons
emitted from the sample may be used alone to form an image or in conjunction
with the characteristic x-rays as atomic number contrast clues to the elemental
composition of the sample The SEM was pioneered by Manfred von Ardenne
in 1937 [24] and [25] The instrument was further developed by Charles Oatley
and first commercialized by Cambridge Instruments The spatial resolution of
the SEM depends on the size of the electron spot which in turn depends on
both the wavelength of the electrons and the magnetic electron-optical system
which produces the scanning beam The resolution is also limited by the size of
the interaction volume or the extent to which the material interacts with the
electron beam The spot size and the interaction volume both might be large
compared to the distances between atoms so the resolution of the SEM is not
high enough to image individual atoms as is possible in the shorter wavelength
(ie higher energy) transmission electron microscope (TEM) The SEM has
compensating advantages though including the ability to image a
comparatively large area of the specimen the ability to image bulk materials
(not just thin films or foils) and the variety of analytical mode available for
measuring the composition and nature of the specimen Depending on the
Chapter 5 Catalysts preparation and characterization
163
instrument the resolution can fall somewhere between less than 1 nm and 20
nm In general SEM images are easier to interpret than TEM images
According to [22] topographical images in a SEM are formed from back-
scattered primary or low-energy secondary electrons The best resolution is
about 2-5 nm but many routine studies are satisfied with a lower value and
exploit the case of image interpretation and the extraordinary depth of field to
obtain a comprehensive view of the specimen With non-crystalline catalysts
SEM is especially useful for examining the distribution and sizes of mesopores
An energy dispersive X-ray spectroscopy device is a frequent attachment in the
instrument
Fig 56 Schematic ray path for a scanning electron microscope (SEM) [26]
Transmission electron microscopy (TEM) is a microscopy technique whereby a
beam of electrons is transmitted through an ultra-thin specimen interacting
with the specimen as it passes through it An image is formed from the
electrons transmitted through the specimen magnified and focused by an
objective lens and appears on an imaging screen a fluorescent screen in most
TEMs plus a monitor or on a layer of photographic film or to be detected by a
sensor such as a CCD camera The first practical transmission electron
microscope was built by Albert Prebus and James Hillier at the University of
Chapter 5 Catalysts preparation and characterization
164
Toronto in 1938 using concepts developed earlier by Max Knoll and Ernst
Ruska
Theoretically the maximum resolution that one can obtain with a light
microscope has been limited by the wavelength of the photons that are being
used to probe the sample and the numerical aperture of the system Early
twentieth century scientists theorized ways of getting around the limitations of
the relatively large wavelength of visible light (wavelengths of 400ndash700
nanometers) by using electrons Like all matter electrons have both wave and
particle properties (as theorized by Louis-Victor de Broglie) and their wave-like
properties mean that a beam of electrons can be made to behave like a beam
of electromagnetic radiation Electrons are usually generated in an electron
microscope by a process known as thermionic emission from a filament usually
tungsten in the same manner as a light bulb or by field emission The
electrons are then accelerated by an electric potential (measured in V or volts)
and focused by electrostatic and electromagnetic lenses onto the sample The
beam interacts variously with the sample due to differences in density or
chemistry The beam that is transmitted through the sample contains
information about these differences and this information in the beam of
electrons is used to form an image of the sample The contrast in a TEM image
is not like the contrast in a light microscope image A crystalline material
interacts with the electron beam mostly by diffraction rather than absorption
although the intensity of the transmitted beam is still affected by the volume
and density of the material through which it passes The intensity of the
diffraction depends on the orientation of the planes of atoms in a crystal
relative to the electron beam at certain angles the electron beam is diffracted
strongly from the axis of the incoming beam while at other angles the beam is
largely transmitted
Chapter 5 Catalysts preparation and characterization
165
Just as details of a light microscope sample can be enhanced by the use of
stains staining can be used to enhance differences in a sample for electron
microscopy Compounds of heavy metals such as osmium lead or uranium can
be used to selectively deposit heavy atoms in areas of the sample and to
enhance structural detail by the dense nuclei of the heavy atoms scattering the
electrons out of the optical path The electrons that remain in the beam can be
detected using a photographic film or fluorescent screen among other
technologies So areas where electrons have been scattered in the sample can
appear dark on the screen or on a positive image due to this scattering TEM is
suitable for examination of supported catalysts with particle sizes down to 2-3
nm giving information on particle location over the support on particle-size
distributions in favourable cases on particle and support morphology and on
the nature and distribution of deposits having a thickness of the order of 2-3
nm Surface topography can be examined using replication techniques [22]
Fig57 Schematic ray path for a transmission electron microscope (TEM) [26]
Experimental The SEM analysis have been made in collaboration with Perugia University
SEM images were measured using an electron microscopy Philips XL-30CP with
RBS detector of back-scattered electrons and EDS analyzer was used to
describe the surface and elemental composition of catalysts
Chapter 5 Catalysts preparation and characterization
166
The TEM analysis have been made in collaboration with Perugia University The
morphology of the samples was investigated by a transmission electron
microscope Philips 208 Transmission Electron Microscope (TEM) a drop of the
dispersion was deposited on a copper grid covered with a polymeric film
Formvar subsequently evaporated in air at room temperature
In order to obtain more accurate information concerning the atomic
percentage of the elements on the surface EDX measurements were made
using the high-resolution TEM instrument at the Department of Chemical
Science and Technology and Biosystems studies at the University of Siena This
instrumentation allows to obtain with high precision information on the atomic
percentage in different areas of the sample going to select individual points or
individual areas
5214 FT-IR analysis
This vibrational spectroscopy is used for characterization of high area
supported or unsupported catalysts Information is available either directly or
by study of probe adsorbates on the chemistry of surface groups (particularly
on oxides) It is also used for the study of the behavior of precursor compounds
during catalyst preparation
Infrared spectroscopy is the subset of spectroscopy that deals with the infrared
region of the electromagnetic spectrum It covers a range of techniques the
most common being a form of absorption spectroscopy As with all
spectroscopic techniques it can be used to identify compounds or investigate
sample composition Infrared spectroscopy correlation tables are tabulated in
the literature
The infrared portion of the electromagnetic spectrum is divided into three
regions the near- mid- and far- infrared named for their relation to the visible
spectrum The far-infrared approximately 400-10 cm-1 (1000ndash30 μm) lying
Chapter 5 Catalysts preparation and characterization
167
adjacent to the microwave region has low energy and may be used for
rotational spectroscopy The mid-infrared approximately 4000-400 cm-1 (30ndash
14 μm) may be used to study the fundamental vibrations and associated
rotational-vibrational structure The higher energy near-IR approximately
14000-4000 cm-1 (14ndash08 μm) can excite overtone or harmonic vibrations The
names and classifications of these sub regions are merely conventions They
are neither strict divisions nor based on exact molecular or electromagnetic
properties
Infrared spectroscopy exploits the fact that molecules have specific frequencies
at which they rotate or vibrate corresponding to discrete energy levels These
resonant frequencies are determined by the shape of the molecular potential
energy surfaces the masses of the atoms and by the associated vibronic
coupling In order for a vibrational mode in a molecule to be IR active it must
be associated with changes in the permanent dipole In particular in the Born-
Oppenheimer and harmonic approximations ie when the molecular
Hamiltonian corresponding to the electronic ground state can be approximated
by a harmonic oscillator in the neighbourhood of the equilibrium molecular
geometry the resonant frequencies are determined by the normal modes
corresponding to the molecular electronic ground state potential energy
surface Nevertheless the resonant frequencies can be in a first approach
related to the strength of the bond and the mass of the atoms at either end of
it Thus the frequency of the vibrations can be associated with a particular
bond type
Simple diatomic molecules have only one bond which may stretch More
complex molecules have many bonds and vibrations can be conjugated
leading to infrared absorptions at characteristic frequencies that may be
related to chemical groups For example the atoms in a CH2 group commonly
Chapter 5 Catalysts preparation and characterization
168
found in organic compounds can vibrate in six different ways symmetrical and
antisymmetrical stretching scissoring rocking wagging and twisting
The infrared spectra of a sample are collected by passing a beam of infrared
light through the sample Examination of the transmitted light reveals how
much energy was absorbed at each wavelength This can be done with a
monochromatic beam which changes in wavelength over time or by using a
Fourier transform instrument to measure all wavelengths at once From this a
transmittance or absorbance spectrum can be produced showing at which IR
wavelengths the sample absorbs Analysis of these absorption characteristics
reveals details about the molecular structure of the sample
This technique works almost exclusively on samples with covalent bonds
Simple spectra are obtained from samples with few IR active bonds and high
levels of purity More complex molecular structures lead to more absorption
bands and more complex spectra The technique has been used for the
characterization of very complex mixtures
According to [10] problems in vibrational spectroscopy include low
transmission at high metal loadings and strong oxide scattering Absorption at
lower wavenumbers often prevents observation of modes such as adsorbate-
metal stretching Fourier Transform (FI-IR) spectrometers offer two
pronounced advantages over dispersive instruments higher energy throughput
and faster data acquisition or higher signal-to-noise ratio Data processing is
easy These features are significant when examining very strongly absorbing
and scattering solids and when following dynamic processes Much IR
transmission work however requires examination of only limited frequency
ranges at medium resolution and computerised dispersive spectrometers may
then be preferable
Chapter 5 Catalysts preparation and characterization
169
Experimental The FT-IR analysis have been made in collaboration with Perugia
University Infrared spectra were measured with a FTIR model IFS113V Bruker
spectrometer resolution of 1 cm-1 in the spectral region 370-5000 cm-1
Fig 58 FTIR model IFS113V Bruker spectrometer
5215 micro-Raman analysis
Raman spectroscopy is more versatile for catalysts characterization and in
comparison with IR spectroscopy it presents at least two important
advantages there is no need of sample preparation and the spectra of water-
metal interfaces are obtained easily and quickly
Raman spectroscopy is a spectroscopic technique used in condensed matter
physics and chemistry to study vibrational rotational and other low-frequency
modes in a system [27] It relies on inelastic scattering or Raman scattering of
monochromatic light usually from a laser in the visible near infrared or near
ultraviolet range The laser light interacts with photons or other excitations in
the system resulting in the energy of the laser photons being shifted up or
down The shift in energy gives information about the phonon modes in the
system Infrared spectroscopy yields similar but complementary information
Typically a sample is illuminated with a laser beam Light from the illuminated
spot is collected with a lens and sent through a monochromator Wavelengths
close to the laser line due to elastic Rayleigh scattering are filtered out while
Chapter 5 Catalysts preparation and characterization
170
the rest of the collected light is dispersed onto a detector Spontaneous Raman
scattering is typically very weak and as a result the main difficulty of Raman
spectroscopy is separating the weak inelastically scattered light from the
intense Rayleigh scattered laser light Raman spectrometers typically use
holographic diffraction gratings and multiple dispersion stages to achieve a
high degree of laser rejection In the past PMTs were the detectors of choice
for dispersive Raman setups which resulted in long acquisition times
However the recent uses of CCD detectors have made dispersive Raman
spectral acquisition much more rapid Raman spectroscopy has a stimulated
version analogous to stimulated emission called stimulated Raman scattering
The Raman effect occurs when light impinges upon a molecule and interacts
with the electron cloud of the bonds of that molecule The incident photon
excites one of the electrons into a virtual state For the spontaneous Raman
effect the molecule will be excited from the ground state to a virtual energy
state and relax into a vibrational excited state which generates Stokes Raman
scattering If the molecule was already in an elevated vibrational energy state
the Raman scattering is then called anti-Stokes Raman scattering A molecular
polarizability change or amount of deformation of the electron cloud with
respect to the vibrational coordinate is required for the molecule to exhibit the
Raman effect The amount of the polarizability change will determine the
intensity whereas the Raman shift is equal to the vibrational level that is
involved This technique is widely applicable The large frequency range (50-
4000 cm-1) makes adsorbate-adsorbent stretching modes accessible Problems
include specimen heating high background fluorescence and low signal
strengths Surface enhanced Raman scattering (SERS) however can give
greatly increased signals in favorable cases eg with rough surfaces or small
Chapter 5 Catalysts preparation and characterization
171
particles of certain compounds It is particularly useful in the studies of
supported monolayer catalysts and adsorbed layers [22]
Experimental The Micro-Raman analysis have been made in collaboration with
Perugia University Micro-Raman spectra were made by an Olympus
microscope mod BX40 connected to an ISA Jobin-Yvon model TRIAX320 single
monochromator resolution 1 cm-1 The exciting source was a Melles Griot
25LHP925 He-Ne laser used in single line excitation mode at 6328 nm The
power focused on the samples was always less than 2 mW The scattered
Raman photons were detected by a liquid-nitrogen cooled CCD Jobin Yvon
Mod Spectrum One Samples were not pre-treated but measured as a power
placed on a microscope slide in this way it is possible to analyse the few
microns grain size and not to focus on those regions where the presence of the
support (silica) was predominant The reproducibility of the spectra was always
controlled sampling different points of the catalyst Through the optical
microscope analysis we also verified that no local degradation occur during
laser irradiation
5216 ICP-MS analysis
ICP-MS (Inductively coupled plasma mass spectrometry) is a type of mass
spectrometry that is highly sensitive and capable of the determination of a
range of metals and several non-metals at very low concentrations It is based
on coupling together an inductively coupled plasma as a method of producing
ions (ionization) with a mass spectrometer as a method of separating and
detecting the ions ICP-MS is also capable of monitoring isotopic speciation for
the ions of choice A plasma is a gas that contains a sufficient concentration of
ions and electrons to make the gas electrically conductive The plasmas used in
Chapter 5 Catalysts preparation and characterization
172
spectrochemical analysis are essentially electrically neutral with each positive
charge on an ion balanced by a free electron In these plasmas the positive ions
are almost all singly-charged and there are few negative ions so there are
nearly equal numbers of ions and electrons in each unit volume of plasma
ICP for spectrometry is sustained in a torch that consists of three concentric
tubes usually made of quartz The end of this torch is placed inside an
induction coil supplied with a radio-frequency electric current A flow of argon
gas (usually 14 to 18 lmin) is introduced between the two outermost tubes of
the torch and an electrical spark is applied for a short time to introduce free
electrons into the gas stream These electrons interact with the radio-
frequency magnetic field of the induction coil and are accelerated first in one
direction then the other as the field changes at high frequency (usually 2712
million cycles per second) The accelerated electrons collide with argon atoms
and sometimes a collision causes an argon atom to part with one of its
electrons The released electron is in turn accelerated by the rapidly-changing
magnetic field The process continues until the rate of release of new electrons
in collisions is balanced by the rate of recombination of electrons with argon
ions (atoms that have lost an electron) This produces a lsquofireballrsquo that consists
mostly of argon atoms with a rather small fraction of free electrons and argon
ions The temperature of the plasma is very high of the order of 10000 K The
ICP can be retained in the quartz torch because the flow of gas between the
two outermost tubes keeps the plasma away from the walls of the torch A
second flow of argon (around 1 lmin) is usually introduced between the
central tube and the intermediate tube to keep the plasma away from the end
of the central tube A third flow (again usually around 1 lmin) of gas is
introduced into the central tube of the torch This gas flow passes through the
centre of the plasma where it forms a channel that is cooler than the
Chapter 5 Catalysts preparation and characterization
173
surrounding plasma but still much hotter than a chemical flame Samples to be
analyzed are introduced into this central channel usually as a mist of liquid
formed by passing the liquid sample into a nebulizer As a droplet of nebulised
sample enters the central channel of the ICP it evaporates and any solids that
were dissolved in the liquid vaporize and then break down into atoms At the
temperatures prevailing in the plasma a significant proportion of the atoms of
many chemical elements are ionized each atom losing its most loosely-bound
electron to form a singly charged ion
The ions from the plasma are extracted through a series of cones into a mass
spectrometer usually a quadrupole The ions are separated on the basis of
their mass-to-charge ratio and a detector receives an ion signal proportional to
the concentration
The concentration of a sample can be determined through calibration with
elemental standards ICP-MS also lends itself to quantitative determinations
through Isotope Dilution a single point method based on an isotopically
enriched standard
Experimental ICP measurements were determined by Inductively Coupled
Plasma-Optical Emission Spectrometers (ICP-OES) Varian 700-ES
Fig 59 Instrument Varian Liberty ICP-OES
Chapter 5 Catalysts preparation and characterization
174
Fig 510 scheme of instrument Varian Liberty ICP-OES
5217 XRD
The XRD analysis have been made in collaboration with Perugia University
The obtained materials were characterized by X-ray powder diffraction (XRD
PANalytical XrsquoPert Pro CuKα radiation) operating at 40 kV and 40 mA step scan
1 min_1 and 1 s counting time in the 2ndash40deg range at room temperature
Fig 511 Instrument XRD PANalytical XrsquoPert Pro CuKα radiation
522 Catalysts characterization results The characterization analyses were performed on the fresh and in some cases
on used catalysts ldquoFresh catalystsrdquo indicate the samples as prepared
ldquoActivated catalystsrdquo indicate the samples charged in the FTS reactor and
reduced using the activation procedure and removed from the reactor ldquoUsed
Chapter 5 Catalysts preparation and characterization
175
catalystsrdquo indicate the samples after their use in the Fischer-Tropsch synthesis
reaction
5221 BET characterization results
The BET results are reported in Table 54
Table 54 BET characterization results
CATALYST Specific Surface area
(m2g)
Co-based
HTlc
Co5 1746
Co10 1147
Co15 720
Co35 584
Co
synthesized
with US
CoSiO2 3600
CoAl2O3 1160
CoTiO2 550
Co-RuSiO2 3460
Co-RuAl2O3 1080
Co-RuTiO2 130
Fe-based
Fe30K20Cu375 TR 160
Fe30K20Cu375-MW1 180
Fe30K20Cu375-MW2 224
Fe30K20Cu375-US1 201
Fe30K20Cu375-US2 210
MW1= Catalyst put it into a kitchen MW and processed in powder MW2= Catalyst put it into MW and suspended in hexane US1= Catalyst suspended in aqueous solution in air atmosphere for 05 h US2= Catalyst sonicated and suspended in hexane in Argon atmosphere for 3h
The composition and specific surface area (SSA) of the HTlc are reported
in Table 54 Note that the SSA decreases with the increase of the
amount of cobalt The relatively large dimensions and high crystallinity
of particles reflect a low specific surface area [28] The surface area of
Co15 and Co35 after the reduction procedure was determined by BET
Chapter 5 Catalysts preparation and characterization
176
method The values obtained are 734 m2 g-1 for the sample Co15 and
783 m2 g-1 for the sample Co35 both higher than the untreated
materials
For the Co and Co-Ru based catalysts synthesized with the help of
ultrasound it is clear how the addition of the promoter show a
diminution of the SSA in every case (CoSiO2 3600 higher than the co-
respective Co-RuSiO2 with 3460 550 and 130 for Co and Co-RuTiO2
and 1160 and 1080 for Co and Co-RuAl2O3) The SiO2 acts as the best
support even in presence of the promoter The TiO2 tends to keep lower
the SSA of the catalyst and the Al2O3 represents an intermediate way of
the supports used in this group of catalysts
The surface area of catalysts is influenced by the method of synthesis
as shown in Table 55 and in Fig 512 Fe-based catalysts treated with
MW and US have higher values of SSA than the traditional ones the
effect of MW and US on SSA increases increasing the US or MW
emitting power
According to [1] The samples sonicated in argon (US2) present the
highest SSA indicating that the US effects in argon atmosphere are
more remarkable The use of this gas enhances cavitation effects
because increases the temperatures of the collapsing bubbles
generated by US [29] The change of catalysts morphology due to US
treatment (SEM analyses) could explain the increase of SSA in these
samples Catalysts prepared by MW show a higher SSA than the
traditional ones 180 and 224 m2 g-1 for the samples Fe30-MW1 and
Fe30-MW2 respectively with a similar increase of about 25 respect
the traditional prepared sample Moreover the surface area of these
Chapter 5 Catalysts preparation and characterization
177
samples seems not to be dependent on the power of the MW
treatment
Fig 512 Fe30K20Cu375 surface area vs different methods of synthesis
5222 TPR characterization results
Co-based catalysts HTLc
As discussed previously the active phase in the FTS is the metallic cobalt while
the HTlc materials contain Co(II) ions randomly dispersed inside the brucitic
layers Therefore in order to have an active catalyst a reduction procedure is
required to form the cobalt particles TPR analyses were performed to study
the reduction process and select the best conditions for the catalyst activation
Fig 513 shows the TPR profile of the samples Co5 Co15 Co35 while Table 55
reports the reduction temperature and the percentage of reduced Co All the
profiles exhibit two regions of reduction the first at lower temperatures
(below 400degC) which is due to the reduction of Co3O4 while the second peak
above 700 degC indicates the presence of hardly reducible species These species
are probably spinel-type mixed oxides formed during the thermal treatment
TPR profiles of CoOx mixed oxides is well described in the literature [30-36]
The reduction profile of Co3O4 in the low temperature region consists in two
peaks corresponding to the reduction of Co3+ to Co2+ and Co2+ to Co0
Chapter 5 Catalysts preparation and characterization
178
According to Alvarez et al [37] these two peaks are well separated for samples
with small particle size while an intermediate particle size causes the
overlapping of the two reduction steps resulting in a complete reduction with
only one maximum at an intermediate temperature (328 degC) The TPR profiles
of our HTlc (Fig 513) are consistent with the latter case Based on the TPR
results (Table 55) the tested catalysts were activated at 350degC for 4 hours
under hydrogen atmosphere in order to reduce the Co ions to metallic Co
Fig 513 TPR profile of the fresh samples Co5 Co10 Co15 Co35 The activation
temperature used in the FTS reactor before the catalytic test is indicated with the
dashed line
Chapter 5 Catalysts preparation and characterization
179
Note that the sample Co15 exhibit the lowest reduction temperature that is
significantly lower than the activation temperature adopted in the FT process
(350degC) A low reduction temperature may favour the presence of catalyst in its
reduced state during the catalytic process The of reduced Co evaluated by
TPR is generally high However these values strongly depend on reduction
conditions (pressure temperature ramp gas flow etc) that are different from
those used in the FT reactor as detailed in the experimental section
Table 55 Reduction temperature and of cobalt reduction of the fresh samples Co5
Co15 Co35
Sample TPR
Tmax (degC) Co Red
Co5 328 58
Co15 278 54
Co35 295 83
Co and Co-Ru catalysts synthesized with US
Table 56 shows the TPR profiles of the samples CoAl2O3 CoSiO2 CoTiO2
and Co-RuAl2O3 Co-Ru SiO2 Co-Ru TiO2
Chapter 5 Catalysts preparation and characterization
180
Table 56 TPR diagrams and values summary for Co and Co-Ru catalysts with US
Catalyst TPR Profile
CoAl2O3
Co SiO2
CoTiO2
Co-RuSiO2
Co-RuAl2O3
Co-RuTiO2
Iron catalysts
Chapter 5 Catalysts preparation and characterization
181
For the supported iron based catalysts three stage of phase transformation
could be identified starting from oxidised form of iron hematite (Fe2O3) to
magnetite (Fe3O4) magnetite to metallic iron (-Fe) [39] It is known [39-40]
that copper promotes the reduction to hematite to magnetite and also the
reduction of magnetite to -Fe to a lesser extent but it needs to be very well
mixed with iron to provide the most favourable promoter effect on the
hematite rarr magnetite phase transformation For what concerns the support
(silica) Jin and Datye [38] observed that the most important effect of silica is
an improvement in the thermal stability of the catalysts in fact the silica
support is very effective at inhibiting the sintering of the iron catalyst
The results of TPR characterization for iron catalysts are reported in Table 57
The number the position and the shape of the peaks agree with literature [38]
In many cases the TPR peaks corresponding to transformations of CuO rarr Cu
and Fe2O3 rarr Fe3O4 were found to overlap and this is the first peaks at low
temperature The second broad peak at higher temperature on the TPR profile
corresponds to the phase transformation of Fe3O4 rarr -Fe The large peak
width for this last transformation indicates this is slow process
TPR analyses show that the metal reduction starts at about 230degC for promoted
catalysts According to Pirola [2] it is clear therefore the role of Cu in the
improvement of iron oxide phases reduction as well known in literature a
suggested mechanism for this promotion effect is the migration of atomic
hydrogen from reduced Cu sites to the iron oxide [38 40]
Therefore the different preparation methods do not influence the peaks
temperature of the reduction steps of the catalytic samples in any case
Chapter 5 Catalysts preparation and characterization
182
Table 57 TPR diagrams and values summary for Fe30K20Cu375 catalysts with different
methods of synthesis
Catalysts Diagrams
Fe30K2Cu375SiO2
Fe30K2Cu375SiO2
(MW2)
Fe30K2Cu375SiO2
(MW1)
Fe30K20Cu375 SiO2 (US1)
305133 467463
800
Temperature degC0 200 400 600 800
800
Sig
na
l (
mV
)
0
200
400
600
800
5223 SEM ndash TEM characterization results
Chapter 5 Catalysts preparation and characterization
183
SEM analyses are reported in Fig 514 (for HTlc) Fig 515 (for Co and Co-Ru
with US) and in Fig 516 (for Fe catalysts)
Cobalt Catalysts
o HTlc
The morphology of the synthesized HTlc was investigated by SEM and TEM
Images of Co15 and Co35 selected as representative samples (Fig 514 a-d)
show that they are constituted by homogeneous aggregates of hexagonal and
platy particles of few hundreds nanometers of thickness and with a
dimensional range between 2-5 μm In TEM micrographs the hexagonal
morphology of HTlc microcrystals is clearer The relatively large dimensions and
high crystallinity of particles reflect a low specific surface area in the range of
6-18 m2g-1 (Table 54) Composition maps of Co15 (Fig 515) obtained with
coupled SEM-EDS analysis highlight the homogeneous Co Zn and Al dispersion
over the entire analyzed spot area without creating single-metal domains
indicating good metal distributions in the samples Similar dispersion
characteristics were obtained for all the samples studied although not
reported here for the sake of brevity
Fig5 14 SEM (left) and TEM (right) images of fresh samples Co15 (ab) and Co35 (cd)
Chapter 5 Catalysts preparation and characterization
184
Fig5 15 SEM image of fresh sample Co15 and the corresponding EDS images of the
metals Al (red) Co (white) and Zn (pink)
SEM and TEM images of two activated samples are reported in Fig 16a-d The
results indicate that the material keeps the original morphology with hexagonal
crystals of micrometric dimensions At higher magnification (TEM images) the
segregation of dense particles homogeneously distributed on the surface and
having dimensions of about 8 nm probably due to metallic Co was evident
[41]
Fig 516 SEM (left) and TEM (right) images of activated Co15 (ab) and Co35 (cd)
SEM images of Co5 Co15 and Co35 after the catalytic run at 260degC are shown
in Fig 517 Samples containing Zn (Co5 and Co15) reveal the presence of a
Chapter 5 Catalysts preparation and characterization
185
nanometric phase crystallized on the catalyst surfaces The absence of this
nanometric phase on Co35 surface (which does not contain Zn) may indicate
the presence of ZnO according to the XRD pattern (it will be show later)
Fig517 SEM images of Co5 (ab) Co15 (cd) Co35 (ef) after catalytic run at
260degC and 20 bar and at different magnifications
o Co and Co-Ru synthesized with US The Fig 518 show the SEM
analyses of the samples with and without the presence of Ru
The chemical effect of US arises from acoustic cavitation ie the
formation growth and implosive collapse of bubbles in a liquid
Some of the interesting features resulting from the application
of sonication as a synthetic method are the nanoparticles
Chapter 5 Catalysts preparation and characterization
186
preparation showing a more uniform size distribution higher
surface area and a more controlled phase composition
(Fig518)
Fig 518 SEM analyses for Co based catalysts with US Magnification 2000X
Iron Catalysts
SEM analyses are essential to evaluate the morphology of catalysts with high
loading of iron and to control the metal dispersion The iron covers the surface
of silica in a progressive level with its increase and it is well distributed in the
more loaded catalyst too [40]
Chapter 5 Catalysts preparation and characterization
187
The aggregates of iron with spherical shape are regularly distributed on the
support In the case of the catalysts prepared with the step of ultrasound it
can be seen an uniform layer of iron on SiO2 The spherical shape aggregates
are substituted by this iron layer The catalyst morphology and the metal
dispersion are similar for the two US samples [43]
SEM analyses (Fig 519) have been the key to both evaluate the morphology of
all the prepared catalysts and observe their metal distribution (using EDX
analysis) Notwithstanding this general trend both the morphology and the
shape of iron aggregates strongly depend on preparation method In Fig 519
SEM analysis of samples through different preparation methods are reported
In the traditional prepared sample (Fig 519a) it is possible to observe Fe
spherical shape aggregates on the bare silica surface Iron is present only in
these particles and coverage of the support is not complete The same
morphology is present in the MW prepared sample (Fig 519b) On the
contrary on US prepared ones (Fig 519c (air) and 519d (argon)) there is a
uniform layer of iron on SiO2 The support in fact is not easily visible due to its
complete coverage as confirmed by SEMndashEDX analyses The spherical shape
aggregates are substituted by this iron layer both the catalyst morphology and
the metal dispersion are similar for the two US samples but completely
different with both the traditional and the MW ones
It is even more interesting the comparison between samples prepared by
different sonication time for example Fe30-US2 (Fig 519c) and Fe30-US1 (Fig
519d) when the US treatment is performed for 05 h the surface seems to be
covered by Fe small leafs that are completely faded when sonication is
prolonged for 3 h and in their place only crashed Fe clusters are present [1]
Chapter 5 Catalysts preparation and characterization
188
a) Traditional b) MW2
c) US1 d) US2
Fig 519 SEM analyses for iron catalysts Magnification 2000X
5224 XRD and micro-RAMAN characterization results
Cobalt Catalysts
o For the HTlc the XRD and micro-RAMAN analyses Figure 520
shows the XRD patterns of the samples listed in Table 51 The
interlayer distance of 89 Aring determined from the first XRD
reflection is compatible with the presence of nitrate between
the sheets [43]
Chapter 5 Catalysts preparation and characterization
189
Fig 520 XRD pattern of the fresh samples (a) Co5 (b) Co10 (c) Co15 and (d) Co35
Activated HTlc were first characterized by XRD As an example the XRD pattern
of activated Co15 is reported in Fig 521 The pattern shows the presence of
very poorly crystalline ZnO and a spinel phase such as Co3O4 CoAl2O4 andor
ZnAl2O4 (note that mixed-oxide spinel phases show very similar XRD patterns
irrespective of their composition) Moreover the reflection at 43deg 2has been
assigned to a CoO phase with very low crystallinity and no metal aggregation is
observed The sample after the reduction treatment does not show metallic Co
phases indicating the presence of active metal atoms homogeneously
dispersed at the nanometer level [44] According to Jong et al [45] and Den
Breejenet et al [46] cobalt-based catalysts need large particle size of the active
species to create optimal domains of active sites because the activity drops for
particles smaller than 6 nm
Chapter 5 Catalysts preparation and characterization
190
Fig 521 XRD pattern of activated Co15 ZnO Co3O4 CoAl2O4 ZnAl2O4 sect CoO
In order to better understand the stability of the materials XRD patterns of
sample Co15 after the catalytic tests at two different temperatures (235degC and
260degC) were collected (Fig 522) At the lower temperature (Fig 522 a) the
pattern is close to that recorded just after the reduction process (Fig 521)
Therefore we can hypothesize that the catalyst does not change as a
consequence of the FTS process On the other hand the XRD pattern of the
catalyst recovered after the reaction at 260degC (Fig 522b) shows more
crystalline ZnO and spinel phase and the strong reduction of the peak assigned
to CoO This may indicate that during the FTS process at high temperatures
cobalt ions crystallized into a spinel phase
Chapter 5 Catalysts preparation and characterization
191
Fig522 XRD pattern of used Co15 after catalytic runs a) at 235degC and
20 bar and b) at 260degC and 20 bar ZnO Co3O4 CoAl2O4 ZnAl2O4 sect
CoO
Iron catalysts
The XRD and micro-RAMAN analyses were made to identify the iron phase
after the calcination treatments A Raman spectrum (Fig 523a) and an XRD
pattern (Fig 523b) for Fe30K2Cu375SiO2 are reported
Chapter 5 Catalysts preparation and characterization
192
Fig 523 a) Micro-Raman analysis and b) XRD for the Fe30K2Cu375SiO2 catalyst
Comparing these results with the tables reported in literature [47-48] for the
assignment of the peaks it is possible to conclude that the iron after calcination
is present as hematite Fe2O3 as expected and as reported in literature [39]
5255 ICP characterization results ICP analysis was made to verify the catalysts composition
Cobalt based catalyst
o HTlc In Table 58 the results are reported
Table 58 ICP characterization results for Co catalysts (HTlc)
HTlc
Atomic percentage in solution Basic Formula
Zn Co Al
Co5 55 15 30 [Zn057
Co010
Al033
(OH)2](NO
3)033
middot05 H2O
Co10 45 25 30 [Zn045
Co021
Al034
(OH)2](NO
3)034
middot05 H2O
Co15 35 35 30 [Zn039
Co032
Al029
(OH)2](NO
3)029
middot05 H2O
Co35 - 70 30 [Co067
Al033
(OH)2](NO
3)033
middot05H2O
Chapter 5 Catalysts preparation and characterization
193
o Co and Co-Ru with US In Table 59 the results are reported
Table 59 ICP characterization results for Co catalysts
Sample Co wt Ru wt
Co10 80 -
Co10Ru01 80 008
In general these results indicate the composition of catalysts is in good
agreement with the theoretical values
Iron based catalysts In Table 510 the results are reported
Table 510 ICP characterization results for Fe catalysts
Sample Fe wt K wt Cu wt
Fe30K20Cu375 314 19 40
5226 XRD and micro-RAMAN characterization results
Cobalt Catalysts
o For the HTlc the XRD and micro-RAMAN analyses
In order to better understand the behaviour of the materials after activation
FT-IR spectra of the sample Co15 (as a representative sample) calcined and
activated and Co3O4 have been registered (Fig 526) The spectrum of Co15
showed the typical absorption bands of the nitrate anion at 1377 cm-1 present
in the interlayer region of HTlc After calcination this band disappeared due to
nitrate degradation and the spectrum presented the typical absorptions of
Co3O4 spinel phase at 667 cm-1 and 566 cm-1 The activation process leads to
the formation of a material with very wide bands attributed to the Co3O4
phase
Chapter 5 Catalysts preparation and characterization
194
Fig 524 FT-IR spectra of the fresh and activated Co15 and of the reference Co3O4
References
[1] C Pirola C L Bianchi A Di Michele P Diodati D C Boffito V Ragaini Ultrasonic Sonochem 17610-616 (2010) [2] C Pirola PhD 2007-2008 Novel supported iron based Fischer-Tropsch catalysts Preparation characterization and applications [3] GPVaan Deer Laan AACMBeenackers CatalRev-SciEng41 (3amp4) (1999) 255 [4] YJin AKDatye Journal of catalysis 196 (2000) 8 [5] Costantino U Marmottini F Nocchetti M Vivani R Eur J Inorg Chem 1998 101439 -1446 [6] C Pirola CL Bianchi A Di Michele P Diodati S Vitali V Ragaini Catal Lett 131 (2009)294-304
Chapter 5 Catalysts preparation and characterization
195
[7] G Biffi Gentili M Linari I Longo A Ricci A IEEE Transactions on microwave theory and techniques 57 (9-2009) 2268-2275 [8] BToukoniitty JPMikkola DYuMurzin TSalmi Applied Catalysis A General 279 (2005) 1 [9] KSSuslick Sonocatalysis Handbook of Heterogeneous Catalysis VCH Verlagsgesellschaft mbH Weinheim Germany (1997) 1350 [10] BToukoniitty JPMikkola DYuMurzin TSalmi Applied Catalysis A General 279 (2005) 1 [11] WBonrath Ultrasonics Sonochemistry 12 (2005) 103 [12] CLBianchi VRagaini Catalysis Letters 95 (2004) 61 [13] CLBianchi FMartini VRagaini Ultrasonics Sonochemistry 82 (2001) 131 [14] Zhao R Goodwin JG Jr Jothimurugesan K Gangwal SK Spivey JJ (2001) Ind Eng Chem Res 401065 10 [15] Yang Y Xiang HW Tian L Wang H Zhang CH Zhong B Li YW (2005) Appl Catal A 284105 [16] Suo Haiyun Zhang Chenghua Wu Baoshan Xu Jian Yang Yong Xiang Hongwei Li Yongwang Cat Today Volume 183-1 (2012) 88ndash95 [17] Donatti DA Ruiz AI Vollet DR (2002) Ultrason Sonochem 9133 [18] Yang Y Xiang HW Tian L Wang H Zhang CH Zhong B Li YW (2005) Appl Catal A 284105 [19] Fadoni M and Lucarelli University of Milan and CE Instruments (Thermoques SpA) [20] F M NELSEN and Ff EGGERTSEN Shell Development Co Emeryville Calif ANALYTICAL CHEMISTRY VOL 30 NO 8 AUGUST 1958 1387-1390 [21] 11 S Brunauer P H Emmett and E Teller J Am Chem Soc 60 (1938) 309 [22] JHaber JHBlock and BDelmon Pureampappl Chem 67 Nos 89 (1995) 1257 [23] SDRobertson BDMcNicol JHDe Baas SCKloet JWJenkins JCatal 37 (1975) 424 [24] Von Ardenne Manfred Das Elektronen-Rastermikroskop Theoretische Grundlagen Zeitschrift fur Physik 108 (1938) 553 [25] Von Ardenne Manfred Das Elektronen-Rastermikroskop Praktische Ausfuumlhrung Z Techn Phys 108 (1938) 407 [26] Ludwig Reimer Helmut Kohl Springer Series in Optical Sciences 36 fifth edition 2008 Transmission Electron Microscopy Physics of Image Formation [27] Gardiner DJ (1989) Practical Raman spectroscopy Springer-Verlag ISBN 978-0387502540 [28] A Di Fronzo C Pirola A Comazzi F Galli CL Bianchi A Di Michele R Vivani M Nocchetti M Bastianini DC Boffito Fuel 119 (2014) 62-69
Chapter 5 Catalysts preparation and characterization
196
[29] TJ Mason JP Lorimer Sonochemistry Ellis Horwood Chichester 1988 p 58 [30] Bianchi CL Catal Lett 2001 76(3ndash4)155-159 [31] Lin HY Chen YW Li C Thermochim Acta 2003 40061ndash67 [32] Lin HY Chen YW Mater Chem Phys 2004 85171ndash175 [33] Sexton BA Hughes AE Turney TW J Catal 1986 97(2)390ndash406 [34] Kumar N Payzant EA Jothimurugesan K Spivey JJ Phys Chem Chem Phys 2011 1314735ndash14741 [35] Tsakoumis NE Dehghan R Johnsend RE Voronov A Van Beek W Walmsley JC Borg Oslash Rytter E Chen D Roslashnning M Holmen A Catal Today 2013 20586ndash93 [36] Tsakoumis NE Roslashnning M Borg Oslash Rytter E Holmen A Catal Today 2010 154162ndash182 [37] Alvarez A Ivanova S Centeno MA Odriozola JA Appl Catal A 2012 431-4329-17 [38] YJin AKDatye Journal of catalysis 196 (2000) 8 20 [39] DBBukur KOkabe MPRosynek CPWang DJRao KRPM and GPHuffman JCatal 155 (1995)353 [40] YYang HXiang YXu LBai YLi ApplCatalA 266 (2004) 181 [41] 32 Rudolf C Dragoi B Ungureanu A Chirieac A Royer S Nastro A Dumitriu E Catal Sci Technol DOI 1011039C3CY00611E [42] C Pirola CL Bianchi A Di Michele S Vitali V Ragaini Catal Comm 10 823 (2009) [43] Iyi N Fujii K Okamoto K Sasaki T Appl Clay Sci 2007 35218-227 [44] CL Bianchi C Pirola DC Boffito A Di Fronzo A Di Michele R Vivani M
Nocchetti M Bastianini S Gatto Co-Zn-Al based hydrotalcites as catalysts for
Fischer-Tropsch process Proceeding of DGMK Conference 2011
CatalysisInnovative Applications in Petrochemistry and Refining 4-6 October
2011 Dresden Germany ISBN 978-3-941721-17-3
[45] Leendert G Bitter JH Kuipers HPCE Oosterbeek H Holewijn JE Xu X
Kapteijn F Jos van Dillen A Krijn P J Am Chem Soc 2006 1283956-3964
[46] 31 Den Breejen JP Radstake PB Bezemer GL Bitter JH Froslashseth V Holmen A Krijn P J Am Chem Soc 2009 1317197-7203 [47] Thickett and Oldyha JThermAnalCal 80 (2005) [48] MALegodi Dde WaalDyes and Pigments 74 (2007) 161
197
Chapter 6 High Fe Loaded Supported Catalysts for Biosyngas Fischer ndash Tropsch Conversion experimental and simulation results 6 Development of the kinetic model One of the objectives of this research work was the development of a kinetic
model for the synthesis of FT in collaboration with the Politecnico di Milano
This model based on experimental data obtained in the pilot plant using iron
based catalyst (Fe30K20Cu375) at different temperatures and different H2CO
ratios allows to obtain and simulate the performance of these catalysts at
temperatures and ratios of incoming flows feeding different
The modeling work has not been limited to the laboratory scale since it is
possible to predict the trend of the reaction kinetics using these types of
catalysts in reactors with much greater volumes and integrated in an entire
industrial process such as the use of biosyngas for FT synthesis obtained from
biomass
61 Regression of kinetic constants After obtaining the experimental data it is necessary to regress them With the
regression we could obtain the respective kinetic constants
The model is based on the fact that both reactions the FT reactions and WGS
are active therefore we will need to regress the rate constants of both
reactions which we call kFT (kinetic constant of the FT reaction) and kWGS
(kinetic constant of the WGS reaction)
The equations that express the reaction rate of the two reactions are [1] For the FT reactions
Chapter 6 High Fe Loaded Supported Catalysts for Biosyngas Fischer ndash Tropsch Conversion experimental and simulation results
198
For the WGS reaction
From these equations we note that the reaction rate in both cases is a
function of the partial pressures of the reactants (CO and H2) of the products
(H2O and CO2) of the constants (aFTWGS e bFTWGS) and the equilibrium constant
Kp expressed as
From the regression of the reaction rate constants is obtained the K0i These
values are correlated to the kFTWGS through the equation
The parameter values of the previous reports were obtained with a regression
using the MATLAB software based on the method of least squares from the
experimental data using the original coefficients K0FT k0WGS aFT aWGS bFT bWGS
as values of the first iteration [2] The software allows the regression of k0i
establishing an objective function that must be minimized as much as possible
(10-6 tolerance basis of MATLAB)
There was no regression of the activation energy of the two reactions but kept
constant as reported in literature [2]
The probability of growth of the hydrocarbon chain is instead given by the
correlation developed by Lox and Froment [3-4] or iron based catalysts
Chapter 6 High Fe Loaded Supported Catalysts for Biosyngas Fischer ndash Tropsch Conversion experimental and simulation results
199
For the regression of the data there were not taken into account the energy
balances because we consider an isothermal catalytic bed The drop pressure is
neglected since it can be assumed that in the whole catalytic bed the pressure
is constant at 20 bar and the efficiency of the catalyst was considered unitary
On the contrary these aspects must be taken into account if we are working
with industrial volumes
62 Mass Balance In the kinetic model have been fully taken into account (even on lab-scale) the
mass balances shown in the equations below
Mass balance equations in the gas phase
Where ε degree of vacuum
a catalyst surface per unit volume
(Pis-Pib) pressure difference of the reactants between the bulk and the
solidrsquos surface
ν stoichiometric coefficient
r reaction in homogeneous phase
Chapter 6 High Fe Loaded Supported Catalysts for Biosyngas Fischer ndash Tropsch Conversion experimental and simulation results
200
If it does not consider gas-phase reactions but only on the surface of the
catalyst
Mass balance on the solid
Where ρ density of the catalyst
Mi molecular weight
It gets
Where is the total mass flow and is the mass fraction of i component
63 Energy Balance As previously mentioned in the modeling of laboratory scale is not considered
any heat balance in the catalytic bed because it is considered as isothermal
one however in the case of modeling a reactor in industrial volumes the
energy balance will be addressed in this way
Energy balance equation in the gas phase for a plug-flow reactor (PFR)
Chapter 6 High Fe Loaded Supported Catalysts for Biosyngas Fischer ndash Tropsch Conversion experimental and simulation results
201
Where Cpi Specific heat of the i species
h Laminar coefficient
(Ts-T) the temperature difference between the surface and the bulk
∆Homk entalphy of the K-esimo reaction in gas phase
U overall heat transfer coefficient
If there are no gas-phase reactions
Energy balance on the solid
64 Pressure variation
As for the energy balance also the P has not been taken into account in the
modeling however in the case of simulations of kinetic tests over PFR reactors
in industrial volumes it will be necessary to take them into account because
before and after the catalytic bed there will be a difference of pressure
The equation that allows to calculate the pressure drop in a fixed bed reactor is
the Ergunrsquos equation
Chapter 6 High Fe Loaded Supported Catalysts for Biosyngas Fischer ndash Tropsch Conversion experimental and simulation results
202
With
Where u velocity surface
Re Reynolds number
Dp diffusion coefficient
Ai inlet area of the tube
65 Catalyst Efficiency The efficiency of the catalyst considered unitary to simplify the model on
laboratory scale can not be considered as such in real systems and especially
of large reactors where the problems of diffusion of the reactants on the
catalyst surface are no longer negligible
The efficiency of the catalyst is expressed with the equation
Where T Bulk temperature
Ts surface temperature
Pi pressure of i species in the bulk
Pis pressure of the i species in the surface
Vp volume of the particle catalyst
Chapter 6 High Fe Loaded Supported Catalysts for Biosyngas Fischer ndash Tropsch Conversion experimental and simulation results
203
References
[1] WH Zimmerman DB Bukur Reaction kinetics over iron catalysts used for
Fischer-Tropsch synthesis The Canadian journal of chemical engineering (68)
1990 p 292-301
[2] Ahmad Rafiee Optimal design issues of a gas-to-liquid process Thesis for
the degree of Philosophy Doctor Norwegian University of Science and
Technology Faculty of Natural Sciences and Technology Chemical Engineering
Department2012
[3] ES Lox GF Froment Kinetics of the Fischer-Tropsch reaction on a
precipitated promoted iron catalyst 2 Kinetic modeling Ind Eng Chem Res
(32) 1993 p71-82
[4] ES Lox GF Froment Kinetics of the Fischer-Tropsch reaction on a
precipitated promoted iron catalyst 2 Kinetic modeling Ind Eng Chem Res
(32) 1993 p 61-70
204
Chapter 7 Fischer Tropsch runs results and discussion
In this chapter the experimental results concerning the FT runs will be
presented in term of CO conversion and of products selectivity toward CO2
CH4 light hydrocarbons (lt C7) and heavy hydrocarbons (gt C7) To join all these
data the parameter ldquoyield C2+rdquo will be reported too This parameter is defined
in the following equation
Yield C2+ = CO conversion x (selectivity ltC7 +selectivity gtC7) (1)
then the selectivity to CO2 and CH4 (undelivered products) is not taken into
account by this parameter The data concerning all the products distribution
ie selectivity for each carbon atom number have been collected in this PhDrsquos
research work for all the catalysts and all the experimental conditions but for
practical space of reasons they are not here reported
The results could be divided into two groups The experimental runs with two
kind of catalytical systems it means cobalt based catalysts and iron based
catalyst (kinetic runs) and the development of a kinetic model for the sample
Fe30K2Cu375 The selection is related to the better performance in terms of
stability
More in detail
Kinetic Runs
Cobalt based catalysts
HTlc The activated samples were tested at different temperatures in
the FTS plant following the procedure reported in the experimental
section In Fig 71 the CO conversion vs the reaction temperature is
Chapter 7 Fischer Tropsch runs results and discussion
205
reported for all the catalysts while the products selectivity is displayed in
Table 71
Fig 71 molar CO conversion to Co5 () Co10 () Co15 (diams) Co35 () obtained at
different reactor temperatures after 24 hours of reaction
As expected for each catalyst the activity is strongly influenced by the reaction
temperature the higher the temperature the higher the CO conversion but
also the selectivity towards CO2 CH4 and light hydrocarbons is favored by a
higher temperature The CO conversion is similar for Co5 and Co10 while it is
higher for the two samples with a larger amount of cobalt ie Co15 and Co35
In particular Co15 exhibits the highest CO conversion at all the selected
temperatures In FTS it is fundamental to obtain low quantities of CH4 and CO2
(undesired products) to favor the formation of higher hydrocarbons For this
reason temperatures in the 220-235degC range are more suitable than the higher
ones
Moreover Table 71 shows that Co15 exhibits the highest CO conversion and
the highest C2+ total yield (without considering CH4 and CO2 see note in Table
71) also at the lowest temperature (220degC) which is so important from an
economical point of view This result confirms that Co15 is the best performing
catalyst obtained in this part of the study
Chapter 7 Fischer Tropsch runs results and discussion
206
Table 71 FTS products selectivity at different reactor temperatures
Sample Temperature
(degC)
Products Selectivity C2+
Yield CO2 CH4 leC7 gtC7
Co5 220 03 29 33 934 165
235 03 59 104 834 194
245 11 85 127 776 224
260 19 141 160 679 300
Co10 220 32 26 98 844 155
235 38 49 143 769 178
245 33 60 154 753 218
260 81 163 413 343 262
Co15 220 14 101 17 705 467
235 81 262 473 185 498
250 178 177 443 202 491
Co35 220 14 39 103 844 250
235 18 96 234 651 395
245 51 257 656 105 473
leC7 all the hydrocarbons in the range C2-C7 gtC7 all the hydrocarbons greater than C7 Product lsquolsquoirdquo selectivity = (moles C in product i) (converted moles C) x 100 C2+ yield = CO conversion x (selectivity leC7 + selectivity gtC7) x10-2
The obtained data suggest the possibility of using synthetic hydrotalcites as Co-
based catalysts for FTS and pursuing subsequent studies on the same subject
Similar trends were obtained in ldquoUnit 2rdquo at lower temperatures and lower
amount of cobalt (Co10 and Co15) (Table 72)
Chapter 7 Fischer Tropsch runs results and discussion
207
The stability of these catalysts in the operating conditions adopted in the
catalytic tests (P le 20 MPa and T le 350degC) was evaluated by comparative
analysis between fresh samples and samples discharged from the reactor
maintained at high pressures and temperatures
Table 72 FTS products selectivities at different reactor temperatures Two different
pilot plants with the same flow sheet
Sample Temp
(degC)
CO
Conv
()
Products Selectivity C2+
Yield CO2 CH4 leC7 gtC7
Co10
(Unit 1)
220 170 32 26 98 844 155
235 207 38 49 143 769 178
245 248 33 60 154 753 218
260 358 81 163 413 343 262
Co10
(Unit 2)
220 147 01 12 53 935 145
235 180 15 32 73 880 171
245 891 140 291 393 176 506
Co35
(Unit 1)
220 264 14 39 103 844 250
235 446 18 96 234 651 395
245 621 51 257 656 105 473
Co35
(Unit 2)
220 473 50 224 296 431 343
235 768 162 205 288 345 485
245 998 154 241 322 282 604
leC7 all the hydrocarbons in the range C2-C7gtC7 all the hydrocarbons greater
than C7Product lsquolsquoirdquo selectivity = (moles C in product i) (converted moles C) x
100 C2+ yield = CO conversion x (selectivity leC7 + selectivity gtC7) x10-2
It is important to highlight that the aim of this work was the evaluation of the
possibility to use HTlc as a new kind of catalyst for the Fischer-Tropsch process
rather than a quantitative comparison with other kinds of traditional FTS
catalysts Moreover a reliable comparison between HTlc and traditional cobalt
Chapter 7 Fischer Tropsch runs results and discussion
208
based FTS catalysts is very difficult due to the different structural and
morphological features (surface area metal dispersion morphological
structure reduction properties porosity and so on) which are involved in the
very complex catalytic systems for the FTS Nevertheless from a qualitative
point of view it is possible to conclude that this new kind of catalytic materials
for FTS process give results fully comparable with those obtained by traditional
supported cobalt As general behaviour it is possible to state that cobalt
catalysts are characterized by high CO conversion high heavy hydrocarbons
selectivity and low light hydrocarbons CH4 and CO2 selectivity The wide
literature concerning traditional Co-based catalysts is rich of different examples
that depending on several operative parameters and preparation procedure
give different FTS results but always following the general trends reported by
the previous papers Some exhaustive examples are shown in a recent review
of Qinghong et al [1] and Muthu et al [2]
Co and Co-Ru
The use of ultrasound (US) might be very efficient to optimize the dispersion of
a so high metal charge as already verified in our laboratory in the past [3-4]
This special type of synthesis should give at the catalyst a particular structure
with a high surface area and a high metal dispersion that improves its activity
towards the synthesis of Fischer-Tropsch In the case of cobalt supported
catalysts a simple ultrasound step has been added in the catalyst preparation
As regard the results presented in table 73 it can be seen how all the samples
resulted active in FTS in particular the bimetallic samples give high CO
conversion with a noteworthy selectivity towards heavy hydrocarbons The
Chapter 7 Fischer Tropsch runs results and discussion
209
support plays a crucial role and in particular TiO2 based samples are the most
active
Moreover Table 73 shows that Co-RuSiO2 exhibits the highest selectivity
towards heavy hydrocarbons and the highest C2+ total yield (without
considering CH4 and CO2 see note in Table 73) This result confirms that Co-
RuSiO2 is the best performing catalyst obtained in this part of the study
Table 73 CO Conversion C2+total yield CH4 CO2 light hydrocarbon and heavy
hydrocarbon selectivity of CoCo-Ru based catalyst at T=255degC
Catalyst
CO
Conv
()
C2+
total
yield
Selectivity ()
CH4 CO2 ltC7 gt C7
CoTiO2 28 23 5 14 10 71
CoSiO2 6 5 19 6 23 52
CoAl2O3 8 6 13 7 19 61
Co-RuTiO2 98 73 18 8 14 60
Co-RuSiO2 94 82 9 4 8 79
Co-RuAl2O3 84 73 11 2 12 75
As we have seen from the BET and TPR analysis the support and the promoter
play a key role in the performance of the catalyst because they are responsible
for the modification of some key parameters such as surface area and the
metal dispersion
Iron based Catalysts
With regard to the treatment with the help of US (see table 74) it can be
concluded that the sonication of an aqueous mixture salts and precursors of
support (US1) is preferable instead of to the calcined catalyst suspended in
Chapter 7 Fischer Tropsch runs results and discussion
210
non-polar solvent such as hexane (US2) With regard to treatment with MW
(see table 74) there were obtained better results in term of CO conversion
with the powder catalyst treated directly in the MW (MW1) while the test
conducted by suspending the catalysts in hexane and then treated in a MW
reactor (MW2) for an hour did not give valid results The best FTS results in
term of C2+ yield (41) has been obtained using MW1 while in tem of CO
conversion (58) using US1 All of them gave FTS results better than the
traditional one Itrsquos evident that the use of US or MW optimizes the catalytic
performance in accord with previous similar results [4]
In agreement with [5] the FTS results show that TEOS as silica source is
favorable for the enhancement of the FTS activity
Table 74 Catalytic Results of Fe30K20Cu375 Different preparation techniques Support
SiO2 Diluting Material α-Al2O3 T=220degC
Preparation CO Conv ()
C2+
Total yield
Selectivity ()
CO2
CH4
lt C7
gt C7
TR 49 32 27 7 22 44
MW1 52 41 17 5 18 60
MW2 32 24 17 8 27 48
US1 58 38 29 6 22 43
US2 36 25 22 9 30 39
Co-precipitation
38 32 2 13 28 57
leC7 all the hydrocarbons in the range C2-C7 gtC7 all the hydrocarbons greater than C7 Product lsquolsquoirdquo selectivity = (moles C in product i) (converted moles C) x 100 C2+ yield = CO conversion x (selectivity leC7 + selectivity gtC7) x10-2
The co-precipitation test was made at T=250degC and TEOS as a support
Iron based Catalysts
Chapter 7 Fischer Tropsch runs results and discussion
211
To work with this part it is important to know the effect of the H2 CO ratio in
the feeding gas The FTS for the production of liquid hydrocarbons from
synthesis gas has become important as the planet faces exhaustion of its
petroleum reserves in the near future The use of coal or biomass to
manufacture synthesis gas is attractive in view of its vast reserves However
synthesis gas manufactured from coal or biomass typically has a low H2CO
ratio (about 07) while the stoichiometry of the reaction requires an H2CO
ratio of about 20 Iron catalysts can make up this deficit with their high WGS
activity [6]
This important characteristic of iron based catalysts is essential for their
applications
Fig 72 show that the activity of catalyst is good enough using also feeding
ratio between 10 and 20
Fig 72 CO conversion or selectivity vs H2CO feeding ratio for Fe30K20Cu375
catalyst at T=250degC
Higher the H2 CO ratio is higher the CO conversion becomes but the heavy
hydrocarbons is the highest for the stoichiometric ratio
In the present work there were made some tests with Fe30K20Cu375 catalyst by
feeding mixtures with a ratio H2CO between 05 and 20 in order to optimize
Chapter 7 Fischer Tropsch runs results and discussion
212
the activity selectivity and the lifetime of this kind of FT catalyst in work
conditions of biosyngas feeding
On the basis of the collected data a rigorous simulation of the FT synthesis
reactor has been developed for different purposes (i) to support the
experimentations and their planning (ii) to predict the reactor yield and
conversion (iii) to optimize the performance of the reactor system with
different operating conditions and (iv) to calculate novel reliable kinetic
parameters based on the experimental data fitting by means of model-based
nonlinear regression techniques To do so the FT reactor is modeled as a
catalytic plug-flow reactor using mass and energy balances and reaction
kinetics for Fe-based catalyst defined by Zimmerman and Bukur as explained in
chapter 6 [7] leading to an ordinary differential equation system with
structured Jacobian Lumping techniques have been used to model heavy
hydrocarbons The system is solved by means of dedicated solvers to handle
stiffness and nonlinearities of heterogeneous reactive systems [8]
Typical H2CO ratio of syngas manufactured from coal or biomass are between
07-12 and the Fig 72 show that the activity of catalyst is good enough using
also feeding ratio between 10 and 20
In the table 75 there is the data concerning the carbon monoxide conversion
() and the selectivity towards undesired products (CO2 and CH4) and lighter
and heavy hydrocarbons of Fe-based catalyst The CO conversion increase with
the increase of the H2CO ratio because of the proximity of the stoichiometric
required of the reaction The selectivities are constant with the variations of
H2CO ratio Instead of that the C2+ yield increase with the variations of H2CO
ratio A comparison at T=250degC show that the best performance in terms of CO
conversion C2+ and selectivity towards heavy hydrocarbons is given by working
with a H2CO ratio of 2 (stoichiometric required of the reaction)
Chapter 7 Fischer Tropsch runs results and discussion
213
These data were used to propose a suitable kinetic model for the FTS using a
math program in collaboration with the Politecnico di Milano Some hypothesis
were taken into account to prepare the kinetic model (FT reactor is modeled as
a catalytic plug-flow reactor using mass and energy balances and reaction
kinetics for Fe-based catalyst defined by Zimmerman and Bukur [7-8] ∆P = 0
isothermic catalytic bed FT reaction and WGS are both active on the catalyst)
The kinetic parameters were calculated and compared with the experimental
data The first results show a good fitness of the experimental data
Table 75 FTS products selectivities at different H2CO ratio and reactor
temperatures of Fe30K2Cu375
Selectivity ()
H2CO T(degC) CO
Conversion ()
C2+ total yield
CO2 CH4 ltC7 gtC7
21 220 85 69 11 8 22 59
21 235 211 175 11 6 20 63
21 250 498 393 16 5 19 60
21 260 567 425 19 6 20 55
151 250 388 299 18 5 17 60
151 260 463 338 22 5 17 56
11 250 23 182 17 4 16 63
11 260 389 272 26 4 16 54
leC7 all the hydrocarbons in the range C2-C7 gtC7 all the hydrocarbons greater than C7 Product lsquolsquoirdquo selectivity = (moles C in product i) (converted moles C) x 100 C2+ yield = CO conversion x (selectivity leC7 + selectivity gtC7) x10-2
In Fig 73 is presented a comparison between the experimental data obtained
in the laboratory and the data obtained using the kinetic model The first two
Chapter 7 Fischer Tropsch runs results and discussion
214
columns represent the conversion of hydrogen and carbon monoxide while in
the other columns are represented the molar fraction of hydrogen carbon
monoxide water methane and lump C2 C3-4 C5-10 C11 + As a first
approximation it can be seen that the kinetic model present a good fitness
regard to the experimental data
Fig 73 Comparison between experimental data and kinetic model
References
[1] Qinghong Z Weiping D Ye W Review Recent advances in understanding the key catalyst factors for Fischer-Tropsch synthesis J Ener Chem 2013 2227ndash38
Chapter 7 Fischer Tropsch runs results and discussion
215
[2] Muthu KG Gary J Wilson DS Burtron HD FischerndashTropsch synthesis Activity of metallic phases of cobalt supported on silica Catal Today 2013 21513ndash 17 [3] CLBianchi VRagaini Catalysis Letters 95 (2004) 61-65 [4] C Pirola C L Bianchi A Di Michele P Diodati D C Boffito V Ragaini Ultrasonic Sonochem 17 (2010) 610 [5] Suo Haiyun Zhang Chenghua Wu Baoshan Xu Jian Yang Yong Xiang Hongwei Li Yongwang A comparative study of FeSiO2 FischerndashTropsch synthesis catalysts using tetraethoxysilane and acidic silica sol as silica sources Catalysis Today Volume 183 Issue 1 20 March 2012 Pages 88ndash95 [6] MDShroff AKDatye Catalysis Letters 37 (1996) 101
[7] WH Zimmerman DB Bukur Can J Chem Eng 68 (1990) 292-301 [8] F Manenti I Dones G Buzzi-Ferraris HA Preisig Ind Eng Chem Res 48 (2009) 9979-9984
216
Chapter 8 Final remarks and Conclusions
New kind of cobalt and iron based catalysts were synthetized and used in the
Fischer-Tropsch synthesis Different methods of synthesis different amounts of
cobalt and different process temperatures were investigated All the catalysts
under study were active in the FTS The catalytic activity of the samples strictly
depends on the temperature as expected
Cobalt based hydrotalcites cobalt and cobalt-ruthenium synthesized with the
help of ultrasound and iron supported catalysts with a high loading of iron (30
wt) have been prepared and characterized and both the preparation
procedure and the working conditions were fully optimized
For each catalytic system it can be summarized the following aspects
Cobalt based catalysts
HTLC In the case of Co-based hydrotalcites CO conversion and process
selectivity towards light and heavy hydrocarbons are closely related to the
cobalt amount in the catalysts but not in a linear way
The reduction behavior under a H2 flow of the Co-based hydrotalcites is
achieved in one step at lower temperature and it is not related to its
morphology but is strictly correlated to the particle size In addition the
relatively large dimensions and high cristallinity of these catalysts favor the
creation of optimal domains of active sites that make them more efficient
The obtained data suggest the possibility of using synthetic hydrotalcite as Co-
based catalysts for FTS and open the possibility for subsequent studies on the
same subject
Chapter 8 Final remarks and Conclusions
217
Future studies may involve the investigation of the effects of various
parameters such as morphologysize of crystallites or the addition of small
amounts of promoters such as Ru in the composition of Co based hydrotalcites
Temperatures in the 220-235degC range are more suitable than the higher ones
Cobalt based bimetallic The catalysts show a low selectivity to methane and
carbon dioxide and formation of higher hydrocarbons The more interesting
results are the highest CO conversion at lower temperatures measured with a
catalysts promoted with a Ru Even the support although it is inert it is very
important because it radically alters the surface area of the catalyst
Iron catalysts The samples appears to be highly dependent on the method of
preparation used The catalysts treated with US and MW seem to show
significant improvements over traditional catalysts and the reason is a more
homogeneous and uniform distribution of Fe in the media
The catalyst Fe30K2Cu375 is active with a H2CO ratio le2
Develop of a kinetic model On the basis of the collected data a rigorous
simulation of the FT synthesis reactor has been developed to support the
experimentations and their planning to predict the reactor yield and
conversion to optimize the performance of the reactor system with different
operating conditions and to calculate novel reliable kinetic parameters based
on the experimental data fitting by means of model-based nonlinear regression
techniques For this lumping techniques have been used to model heavy
hydrocarbons the system is solved by means of dedicated solvers to handle
stiffness and nonlinearities of heterogeneous reactive systems and finally the
Chapter 8 Final remarks and Conclusions
218
model made in collaboration with the Politecnico di Milano show a good fit of
the experimental data
Concerning the results obtained in this PhDrsquos research work it is clear that all
the samples tested have given good results The Co-based catalysts
synthesized using the traditional impregnation method with an additional step
of ultrasound have given good results in comparison with the results in the
current literature The hydrotalcites have given lower results if compared with
the Co-based catalysts synthesized with the help of ultrasound but they have
opened an alternative and innovative way that has never been tried before
Iron based catalysts allow a direct conversion of the biosyngas and the results
have shown how our catalysts are active with an H2CO ratio le2 Furthermore
trends have been modeled with success In conclusion the PhDrsquos research
work has given a serious contribution to the current state of the art on
catalysis in the Fischer-Tropsch synthesis either with cobalt and iron based
catalysts With cobalt has been optimized a traditional synthesis procedure
with the introduction of ultrasound furthermore has been created a
completely new kind of catalyst With iron has continued an optimizationrsquos
work of iron supported with high loading metals so to develop a suitable
kinetic model able to work not only with syngas but also with biosyngas
List of Publications and Communications
219
List of publications
Publications
C Pirola DC Boffito G Carvoli A Di Fronzo V Ragaini and CL
Bianchi (2011) Soybean Oil De-Acidification as a First Step Towards
Biodiesel Production Recent Trends for Enhancing the Diversity and
Quality of Soybean Products Prof Dora Krezhova (Ed) ISBN 978-953-
307-533-4 InTech DOI 10577217812 Available from
httpwwwintechopencombooksrecent-trends-for-enhancing-the-
diversity-and-quality-of-soybean-productssoybean-oil-de-acidification-
as-a-first-step-towards-biodiesel-production
CL Bianchi C Pirola DC Boffito A Di Fronzo G Carvoli D Barnab
R Bucchi and A Rispoli (2011) Non Edible Oils Raw Materials for
Sustainable Biodiesel Biodiesel - Feedstocks and Processing
Technologies Dr Margarita Stoytcheva (Ed) ISBN 978-953-307-713-0
InTech DOI 10577225397 Available from
httpwwwintechopencombooksbiodiesel-feedstocks-and-
processing-technologiesnon-edible-oils-raw-materials-for-sustainable-
biodiesel
A Di Fronzo C Pirola A Comazzi F Galli CL Bianchi A Di Michele R
Vivani M Nocchetti M Bastianini DC Boffito Co-based Hydrotalcites
as new Catalysts for the Fischer-Tropsch Synthesis Process Fuel 119
(2014) 62ndash69
Publications in Conference Proceedings (peer reviewed)
CL Bianchi C Pirola DC Boffito A Di Fronzo A Di Michele R Vivani
M Nocchetti M Bastianini S Gatto Co-Zn-Al based hydrotalcites as
catalysts for Fischer-Tropsch process Proceeding of DGMK Conference
2011 Catalysis Innovative Applications in Petrochemistry and Refining
4-6 October 2011 Dresden Germany ISBN 978-3-941721-17-3
C Pirola A Di Fronzo DC Boffito CL Bianchi A Di Michele
Biosyngas Fischer ndash Tropsch Conversion by High Fe Loaded Supported
List of Publications and Communications
220
Catalysts Prepared with ultrasound and Microwave Proceeding of
DGMK Conference 2012 Reducing Carbon Footprint of Fuels and
Petrochemicals October 8 ndash 10 2012 Berlin Germany ISBN 978-3-
941721-26-5
Communications at congress A Di Fronzo C Pirola DC Boffito CL Bianchi A Di Michele R Vivani
M Nocchetti M Bastianini Synthetic Hydrotalcites as suitable Co-
based catalysts for Fischer-Tropsch Process XVIII Congresso Nazionale
della Divisione di Chimica Industriale della SCI LE SFIDE DELLA CHIMICA
INDUSTRIALE PER UNrsquoINNOVAZIONE SOSTENIBILE 11-14 giugno 2012
(Oral presentation)
A Di Fronzo DC Boffito CPirola G Carvoli S Vitali CL Bianchi
Scalable free fatty acids esterification for methyl esters production
XVIII Congresso Nazionale della Divisione di Chimica Industriale della
SCI LE SFIDE DELLA CHIMICA INDUSTRIALE PER UNrsquoINNOVAZIONE
SOSTENIBILE 11-14 giugno 2012 (Poster presentation)
ADi Fronzo C Pirola DC Boffito CL Bianchi A Di Michele R Vivani
M Nocchetti M Bastianini Synthetic Hydrotalcites as suitable Co-
based catalysts for Fischer-Tropsch Process Cat4bio conference
Advances in catalysys for biomass valorization Tesaloacutenica Grecia 2012
(Poster)
CL Bianchi A Di Fronzo C Pirola DC Boffito A Di Michele R Vivani
M Nocchetti M Bastianini Synthetic Hydrotalcites as suitable Co-
based catalysts for Fischer-Tropsch Process 7th edition of the
International Conference on Environmental Catalysis Lion-Francia
(Poster)
A Di Fronzo C Pirola CL Bianchi A Di Michele Ultrasonidos y
microondas en la preparaciograven de catalizadores soportados para la
sigraventesis de Fischer-Tropsch JIFI-EAI 2012 Jornadas de Investigaciograven
Ecuentro acadegravemico industrial Universidad Central de Venezuela
Facultad de Ingenierigravea 26-30 noviembre
C Pirola CL Bianchi A Di Fronzo D Boffito A Di Michele G S
Patience Ultrasound and microwave assisted preparation of high Fe
List of Publications and Communications
221
loaded supported catalysts for biosyngas Fischer-Tropsch conversion
Intervento presentato al 245 convegno ACS National Meeting amp
Exposition tenutosi a New Orleans Louisiana nel 2013
C Pirola C L Bianchi A Di Fronzo F Manenti M Hillestad High Fe
Loaded Supported Catalysts for Biosyngas Fischer ndash Tropsch Conversion
experimental results and detailed simulation XVII National Congress of
Catalysis GIC 2013 and XI National Congress of Zeolites Science and
Technology 15-18092013
F Galli C Pirola A Di Fronzo A Comazzi CLBianchi Di Michele Co
Based Bimetallic Catalysts for Fischer-Tropsch Synthesis Prepared by
High Power Ultrasound XVII National Congress of Catalysis GIC 2013
and XI National Congress of Zeolites Science and Technology 15-
18092013
Di Michele C Pirola A Di Fronzo A Comazzi F Galli and CLBianchi
Co Based Bimetallic Catalysts for Fischer-Tropsch Synthesis Prepared by
High Power Ultrasound AOSS Melbourne 10-12072013
C Pirola A Di Fronzo A Comazzi F Galli A Di Michele CLBianchi Co
based bimetallic catalysts for Fischer-Tropsch synthesis prepared by
high power ultrasound 11th European Congress on Catalysis ndash
EuropaCat-XI Lyon France September 1st-6th 2013
Workshop Clausthal Germany 22-23112013 Fischer-Tropsch Synthesis
from syngas and biomass using Fe or Co based catalysts Experimental
and simulation results (Oral Presentation)
4
5211 BET analysis 157
522 Catalysts characterization results 174
Chapter 6 High Fe Loaded Supported Catalysts for Biosyngas Fischer ndash Tropsch Conversion experimental and simulation results 197
6 Development of the kinetic model 197
61 Regression of kinetic constants 197
62 Mass Balance 199
63 Energy Balance 200
64 Pressure variation 201
65 Catalyst Efficiency 202
Chapter 7 Fischer Tropsch runs results and discussion 204
Chapter 8 Final remarks and Conclusions 216
List of publications 219
Publications in Conference Proceedings (peer reviewed) 219
Communications at congress 220
General abstract
1 Introduction
Nowadays it is imperative to develop economical and energy-efficient
processes for the sustainable production of fuels and chemicals alternative to
the ones deriving from petroleum Climate change and air quality are major
environmental concerns because they directly affect the way we live and
breath In order to meet the present and future threats generated by emissions
to the atmosphere environmental agencies around the world have issued
more stringent regulations One of them is the control of residual sulfur in
diesel fuel and emission standards for particulates from diesel vehicles All
these facts have recently aroused renewed interest in the FischerndashTropsch
Synthesis because it can produce super clean diesel oil fraction with high
cetane number (typically above 70) without any sulfur and aromatic
compounds using syngas (mixture of H2 CO CO2) from natural gas CH4 coal
or as a new tendency from biomass [1 2] The essential target of FTS is to
produce paraffins and olefins with different molecular weight and to limit the
maximum formation of methane and CO2 [3]
The main reactions involved in FTS are reported in the following scheme [4-8]
Irreversible reactions
1) n CO + 2n H2 rarr CnH2n + n H2O for olefins
2) n CO + (1+2n) H2 rarr CnH(2n+2) + n H2O for paraffins
3) 2n CO + n H2 rarr CnH2n + n CO2 for olefins
4) n CO + 2n H2 rarr CnH(2n+1)OH + (n-1) H2O for alcohols
Equilibrium
5) CO + H2O harr CO2 + H2 Water-gas-shift reaction (WGS)
General Abstract
6
6) CO + H2 harr C + H2O Carbon deposition
7) 2 CO harr C + CO2 Boudouard equilibrium
The whole reaction gives an energetic contribution strongly exothermic (about
150 kJmol CO reacted) FTS is a particularly complex system in which a
number of different reactions are combined to a unique mechanism
irreversible Fischer Tropsch (FT) reactions produce hydrocarbons and some
equilibrium reactions between CO CO2 CH4 and C such as the WGS reaction
and the Boudouard equilibrium are present too Nevertheless it is possible to
suppose that FTS can be simplified as a combination of the FT reactions and the
WGS reaction [7] According this hypothesis hydrocarbons are primary
products of FT reaction and CO2 can only be produced by WGS reaction a
reversible parallel-consecutive reaction with respect to CO [9]
FTS usually requires catalysts based on cobalt or iron Co-based catalysts have
been more largely used due to their high selectivity to heavy hydrocarbons and
low activity in the water-gas shift reaction so limiting the CO2 formation
Moreover Co-based catalysts have shown longer life-time and higher CO
conversion compared to the Fe-based ones [10] Iron based catalysts are
recently highly investigated for FTS Compared to cobalt systems iron-based
catalysts are cheaper but less resistant to deactivation due to the oxidizing
effect of water despite activating Water Gas Shift reaction (CO + H2O harr CO2 +
H2) well [5 9] Moreover they are flexible to changes in temperature pressure
and they can work at different H2CO feed ratios (for iron based catalysts this
ratio can be between 05 and 25) [11 12]
2 Aims of the work
Considering very recent research results [13-15] the aim of the PhDrsquos research
was addressed toward the development of three particular kind of catalysts
General Abstract
7
The first group of catalysts tested were the Co-based hydrotalcites (HTlc) with
different amount of Co in two different pilot plants HTlc-based materials have
been recently reported as good catalysts for several processes in the energy
field [16] [17] and [18] Up to now the only study reported in literature on the
use of synthetic HTlc as FTS catalysts concerns their use as inert supports for
the catalytically active metal According to this study hydrotalcite-supported
catalysts result in higher activity than CoAl2O3 even in absence of reduction
promoters [19]
The second group of catalysts tested were the Co-based catalysts and
bimetallic Co-Ru based catalyst synthesized with the help of ultrasound
because the ultrasound are presented in literature as an innovative way to
synthesize new kind of materials
Finally were synthesized and tested samples of Fe-based catalysts supported
on silica with different methods of synthesis (traditional impregnation method
with the help of ultrasound or microwave) and changing the H2CO ratio with
the aim to evaluate the performance of biomass Almost the development of a
kinetic model (modeling parameter regression and simulation) in collaboration
with the Politecnico di Milano
3 Experimental Details
a Preparation of catalysts
i) Cobalt based catalysts ndash Hydrotalcites a series of ternary hydrotalcites with
general formula [CoxZn(1-x-y)Aly(OH)2](NO3)y∙05H2O by a modified-urea method
[20] Different volumes of the solutions of the metals nitrates all at a
concentration of 05 M were mixed to obtain either a Al(Co+Al) or
Al(Co+Al+Zn) molar ratio of 03 as indicated in Table 1
General Abstract
8
Solid urea was added to the solution in a molar ratio of 4 vs Al The obtained
solution was maintained at the reflux temperature in an open flask for 48 hours
The precipitate was separated by centrifugation washed with water and then
dried at 80degC
Table 1 Details of the synthesis composition and specific surface area (SA) of samples
general formula [CoxZn(1-x-y)Aly(OH)2](NO3)y∙05H2O M sol = molar percentage of
metals in the precipitation solution
Sample wt Co M sol
x
y
SSA (m2g-1)
Zn Co Al
Co5 51 55 15 30 010 033 175
Co10 108 45 25 30 021 034 115
Co15 166 35 35 30 032 029 72
Co35 353 - 70 30 067 033 58
ii) Cobalt based catalysts and bimetallic Co-Ru based catalysts synthesized
with the help of ultrasound All the catalysts were prepared by a modified
impregnation method The metal precursors (cobalt and ruthenium
carbonyl) were dissolved in n-decane together with the different support
(SiO2 Al2O3 or TiO2) The solution was irradiated by an ultrasound generator
with a horn type of 750 W a frequency of 20 kHz a diameter tip of 13 mm
and an amplitude of 40-50 for 3 h and then put into a rotating vacuum
oven at 40degC at 36 rpm for 24 h (impregnation step) Samples have been
calcinated at 350 degC for 4 h The ultrasound horn used have a cooling jacket
where the coolant has a low viscosity at low temperature and is a dielectric
liquid [21]
General Abstract
9
iii) Iron catalysts there were prepared the iron based catalysts using different
method of synthesis traditional impregnation (TR) impregnation with the help
of the microwave (MW) impregnation with the help of ultrasound (US) and co-
precipitation method MW and US techniques seem to be promising that offer
many advantages in the catalyst preparation as reported in [22-23] and their
effect was also evaluated
There were prepared according to the traditional impregnation method by
incipient wetness (TR) with 30wt of iron supported on a commercial high
surface area SiO2 (Fluka BET surface area 520 m2g-1 pore volume 122 ml g-1
and pore diameter 87 nm) The catalysts are promoted by K (20wt ) and Cu
(375wt ) The percentages are regarding a previous research [13] where
those compositions result as the most suitable catalyst In this work all the
percentages concerning the catalysts composition are on weight basis while
the percentages about the process conversion and selectivity are on molar
basis The catalysts will be named as Fe30K20Cu375 referring the wt of Fe K
and Cu on catalyst The support after heating treatment at 120degC for 12 h was
impregnated with an aqueous solution of Fe(NO3)3middot9H2O (Riedel de Haen
product) KNO3 (Merk product) and Cu(CH3COO)2middotH2O (Fluka product) and then
put into a vacuum oven at 40 degC at 36 rpm for 24 h The samples were heated
at 100 degC for 12 h and at 500degC for 4 h in air The results were also modeled
with a collaboration with the Politecnico di Milano and presented in this PhDrsquos
work
The synthesis of the catalyst with the aid of microwave is quite similar to the
TR The difference is the addition of a final step where the powder of catalyst
already calcined is subjected to a MW irradiation Two different methods for
the MW irradiation were used In the first one (MW1) it was taken a sample of
catalyst put it into a beaker and then put into a kitchen microwave oven
General Abstract
10
(Moulinex Micro-Chef 1305E 600W) for 30 min In the second method (MW2)
the catalyst (2 g) was suspended in hexane (400 ml) put it into a microwave
chemical reactor (ordinary 400 mL round bottom glass flask filled with the
liquid to be heated and activated) and treated for 1 h at 60W MW were
produced by a MW generator and sent to the MW applicator by an insulated
coaxial antenna Details of the MW applicator and of the associated
experimental techniques can be found in [24]
The US treatment have been used between the impregnation and the
evaporation step by irradiating the silica-precursors solution using a Sonicator
(W-385 Heat Systems Ultrasonics) with an effective input power of 60 W and a
tip diameter of 13 mm Silica solution promoters and water have been
sonicated by the US horn for 05 h in air atmosphere (US1) The same sample of
US1 was successively sonicated in a suspension of hexane in argon atmosphere
(instead of air) for 3h (US2)
b Catalysis Characterization
The obtained materials were characterized by X-ray powder diffraction
(XRD PANalytical XrsquoPert Pro CuKα radiation) operating at 40kV and 40mA
step size 00170 2θ degree and step scan 20s
The metal content of samples was determined by inductively coupled
plasma optical emission spectrometry (ICP-OES) using a Varian Liberty
Series instrument
Field emission scanning electron microscopy (SEM) images were obtained
using a LEO1525 instrument after depositing the samples depositing the
catalysts onto the sample holder and sputter coating with chromium
The elemental mapping of metals was obtained by using energy dispersive
X-ray spectroscopy (EDS) with a Bruker Quantax EDS instrument
General Abstract
11
Transmission electron microscopy (TEM) images were obtained using a
Philips 208 instrument
FT-IR spectra of different samples dispersed in KBr pellets were recorded
at room temperature using a Bruker IFS113V spectrometer Typically each
spectrum was obtained at a resolution of 1 cm-1 in the spectral region 400-
5000 cm-1
Specific surface area (SSA) of all catalysts was determined by
conventional N2 absorption using a Micromeritics ASAP2010 instrument
Before the analysis the samples were pre-treated at 200degC in a He flow
Conventional temperature-programmed reduction experiments (TPR) were
performed using a Thermoquest Mod TPRDO 1100 instrument The
samples were initially pre-treated in a flow of argon at 200degC for 05 h After
being cooled down to 50degC the H2Ar (51 vv) reducing mixture was
flushed through the sample at 30 mL min-1 and the temperature increased
from 50 to 900degC at a constant rate of 10degC min-1
Water and nitrate content of the solids was determined by
thermogravimetric (TG) analysis with a Netzsch STA 449C apparatus in air
flow and 10degCmin heating rate
c Kinetics Run
FT synthesis was performed into a fixed bed reactor using 1 g of fresh
catalyst mixed with 1 g of diluting material (-Al2O3) This diluting material
must be inert for FTS and acts as a good thermal conductor to control the
process temperature [25] The calcined catalysts were initially activated in
situ with the standard conditions of 468 Nml min-1 flow of syngas (H2CO =
21) at 350degC 3 bar for 4 h Then they were tested with the standard
conditions of 468 Nml min-1 flow of syngas (H2CO = 21) plus 50 Nml min-1
of N2 as internal standard at 20 bar at T = 250degC Others reducing activating
General Abstract
12
gases feeding compositions pressures temperatures have been tested in
the work Analyses of the gas-phase products (C1ndashC7) were performed with
an on-line micro gas-chromatograph (Agilent 3000) Liquid products were
collected in a trap at 5 degC and 20 bar and analyzed by a gas-chromatograph
(Fisons Mod 8000 Series) equipped with a Poparak-Q column after the total
time of reaction The aqueous phases collected in the cold trap were
analyzed by a TOC (Schimadzu Mod 5000A) to quantify the amount of
carbonaceous species dissolved in water
In the case of hydrotalcites FTS was performed in two different laboratory
plants with the same flow sheet The first one recently described and
located at the Universitagrave degli Studi di Milano and the second one at the
Universidad Central de Venezuela during a complementary stage in
Venezuela In this case the FTS was performed in a continuous flow system
with a fixed bed stainless-steel reactor (di =32mm l = 30 cm) The reactor
was loaded with 03 g of fresh catalyst mixed with 03 g of see sand as a
diluting material [26] The calcined catalysts were initially reduced in situ by
flowing hydrogen for 4 hours at 900 Nml˙min-1 350degC and 08 MPa After
the reduction step the temperature was lowered to 220degC under H2 They
were then tested in the standard conditions by flowing syngas (H2 CO N2
63325 vv N2 as internal standard) at 156 Nml˙min-1 increasing the
system pressure slowly up to 20 MPa and 220-260degC Once the reaction
temperature was achieved the reaction was led to proceed during a period
of 280 h
During reaction the reactor effluent passed through a hot trap kept at
150ordmC and 02 MPa to collect waxes and the products leaving this trap were
passed through a second trap kept at 0ordmC and 02MPa to collect the lighter
products (water alcohols and hydrocarbons) The analyses were performed
General Abstract
13
in various chromatographs according to the nature of the sample to be
analyzed Permanent gases and light hydrocarbons were analyzed on-line in
a PerkinElmer 3000GC Autosystem fitted with TCD detectors using a
Carbosieve SII Supelco column The liquid products (collected at 150ordmC and
0ordmC) were weighted and analyzed in a PerkinElmer chromatograph fitted
with a 50m long Alumina RT capillary column connected to a FID
A mass molar balance was performed for each FT run resulting in a
maximum error of plusmn 5 on molar basis
4 Results and discussion
a) Catalysts activation
i) Cobalt catalysts The catalytic activity of the samples depends on the
presence of metallic Co centres on the surface and the particle size Many
works have been done on the reducibility by TPR of CoOx mixed oxides The
reduction profile of Co3O4 consists of a low-temperature peak and a high-
temperature peak which correspond to the reduction of Co+3 to Co+2 and Co+2
to Co0 [27-30]
Two kinds of Co based catalysts were tested
The HTlc materials contain Co (II) ions randomly dispersed inside the brucitic
layers then the active phase in the FTS is the metallic cobalt Therefore in
order to have an active catalyst a reduction procedure is requires to maintain
the cobalt dispersion TPR analyses were performed to study the reduction
process and to select the best conditions for the catalyst activation Fig 1
reports the TPR profile of the sample Co5 Co10 Co15 Co35 All the profiles
exhibit two regions of reduction the first at lower temperatures (below 400degC)
which is due to the reduction of Co while the second peak above 700degC
indicates the presence of hardly reducible species These species are probably
spinel-type mixed oxides formed during the thermal treatment According to
General Abstract
14
Alvarez et al [31] these two peaks are well separated for samples with a small
particle size while an intermediate particle size causes the overlapping of the
two reduction steps resulting in a complete reduction with only one maximum
at an intermediate temperature (328degC) The TPR profiles of our HTlc (Fig 1)
are consistent with the latter case
Basing on the TPR results the tested catalysts were activated before FTS at
350degC for 4 hours under hydrogen atmosphere in order to reduce the Co ions
to metallic Co
Fig 1 TPR analysis of the samples Co5 Co10 Co15 Co35 Activation temperature is
indicated with the dashed line
After this treatment XRD analysis detected only mixed metal oxides and no
metallic Co phases so highlighting the presence of active metal atoms
homogeneously dispersed at the nanometer or sub-nanometer level [1432]
The same thing happens with the cobalt catalysts synthesized with ultrasound
The results of TPR confirm the data found in literature [27-30] where the Co
based catalysts need to be activated at 350degC for 4 hours under hydrogen
atmosphere It is important to note in Fig 2 how small amount of Ru decreases
the peak of the reduction temperature
General Abstract
15
100 200 300 400 500 600 700 800
Co-RuSiO2
CoSiO2
TC
D
Temperature (degC) 100 200 300 400 500 600 700 800
TC
D
CoAl2O
3
Co-RuAl2O
3
Temperature (degC) 100 200 300 400 500 600 700 800
CoTiO2
TC
D
Co-RuTiO2
Temperature (degC)
Fig 2 TPR analysis of the samples CoSiO2 and Co-RuSiO2 CoAl2O3 and Co-Ru Al2O3
CoTiO2 and Co-RuTiO2 Activation temperature is indicated with the dashed line
Basing on the TPR results the tested catalysts were activated before FTS at
350degC for 4 hours under hydrogen atmosphere in order to reduce the Co ions
to metallic Co
ii) Iron catalysts
As regard the method of synthesis of the iron based catalysts the main results
of catalysts characterization are reported in Table 2 All the surface areas (SA)
of the prepared catalysts are significantly lower than the SA of the
corresponding support (SiO2) This important decrease can be explained
considering the dilution effect due to the presence of iron on the support The
dilution effect can be easily assessed by considering the surface area of bare
silica support and assuming a negligible contribution of the iron phases to the
surface area The samples treated with MW and US have higher values of SA
than the traditional ones the effect of MW and US on SA is proportional with
the US or MW emitting power
The TPR analysis of these samples treated with MW gave results consistent
with those prepared by TR showing that the method of preparation does not
influence the step of reduction (Fe2O3-gt Fe3O4 -gt-Fe) of the catalyst but only
the peak temperature
General Abstract
16
Table 2 Characterization results of iron based catalysts using different method of synthesis
Sample Prep
Method
BET TPR TPD
Surface Area (m2g-1)
Temp of first
red peak (degC)
Temp of
second red peak (degC)
Temp of the peak (degC)
Bare support
Catalyst
Fe30K2Cu375SiO2 TR 4303 1601 240 600 170
Fe30K2Cu375SiO2 MW1
4303 1800 - - -
MW2 2240 240 580 162
Fe30K2Cu375SiO2 US1
4303 2011 236 572 171
US2 2101 - - - TR= Traditional Impregnation MW1= Catalyst put it into a kitchen MW and processed in powder MW2= Catalyst put it into MW and suspended in hexane US1= Catalyst suspended in aqueous solution in air atmosphere for 05 h US2= Catalyst sonicated and suspended in hexane in Argon atmosphere for 3h
In agreement with the literature [33] all the curves show a single TPDs peak in
the same range (150-170degC) that confirms the fact that only one type of
adsorbing species can exists up on the catalyst (see table 2) for all the catalysts
Before FT runs the catalysts must be activated reducing the hematite phase
(not active for FTS) in iron carbides (in particular Fe22C and Fe25C) and
magnetite (Fe3O4) [34] In literature there is not a uniform procedure for this
operation Many tests were performed by [34] and show that the best FT
results in term of CO conversion have been obtained using the activating
mixture H2CO (21) or pure CO starting from oxidized catalysts and making this
operation at T=350degC The process selectivity is not particularly modified using
the mixture H2CO (21) or pure CO and changing the activation temperature
b) FT results
i) Co based hydrotalcites as catalysts for Fischer-Tropsch synthesis
General Abstract
17
The activated samples were tested at different temperatures in the FTS plant
following the procedure reported in the experimental section In Fig 3 the CO
conversion vs the reaction temperature is reported for all the catalysts while
the products selectivity is displayed in Table 3
Fig 3 molar CO conversion to Co5 () Co10 ( ) Co15 (diams) Co35 () obtained at
different reactor temperatures after 24 hours of reaction
As expected for each catalyst the activity is strongly influenced by the reaction
temperature the higher the temperature the higher the CO conversion but
also the selectivity towards CO2 CH4 and light hydrocarbons is favored by a
higher temperature The CO conversion is similar for Co5 and Co10 while it is
higher for the two samples with a larger amount of cobalt ie Co15 and Co35
In particular Co15 exhibits the highest CO conversion at all the selected
temperatures In FTS it is fundamental to obtain low quantities of CH4 and CO2
(undesired products) to favor the formation of higher hydrocarbons For this
reason temperatures in the 220-235degC range are more suitable than the higher
ones
General Abstract
18
Moreover Table 3 shows that Co15 exhibits the highest CO conversion and the
highest C2+ total yield (without considering CH4 and CO2 see note in Table 3)
also at the lowest temperature (220degC) This result confirms that Co15 is the
best performing catalyst obtained in this study
The obtained data suggest the possibility of using synthetic hydrotalcites as Co-
based catalysts for FTS and pursuing subsequent studies on the same subject
Table 3 FTS products selectivity at different reactor temperatures
Sample Temperature
(degC)
Products Selectivity C2+
Yield CO2 CH4 leC7 gtC7
Co5 220 03 29 33 934 165
235 03 59 104 834 194
245 11 85 127 776 224
260 19 141 160 679 300
Co10 220 32 26 98 844 155
235 38 49 143 769 178
245 33 60 154 753 218
260 81 163 413 343 262
Co15 220 14 101 17 705 467
235 81 262 473 185 498
250 178 177 443 202 491
Co35 220 14 39 103 844 250
235 18 96 234 651 395
245 51 257 656 105 473
leC7 all the hydrocarbons in the range C2-C7 gtC7 all the hydrocarbons greater than C7 Product lsquolsquoirdquo selectivity = (moles C in product i) (converted moles C) x 100 C2+ yield = CO conversion x (selectivity leC7 + selectivity gtC7) x10-2
General Abstract
19
iii) Sonochemical synthesis of Co and Co-Ru based catalysts for Fischer-Tropsch
synthesis
The use of ultrasound might be very efficient to optimize the dispersion of a so
high metal charge as already verified in our laboratory in the past [35-36] This
special type of synthesis should give at the catalyst a particular structure with a
high surface area and a high metal dispersion that improves its activity towards
the synthesis of Fischer-Tropsch In the case of cobalt supported catalysts a
simple US step has been added in the catalyst preparation The precursors
(cobalt and ruthenium carbonyl) were dissolved in n-decane together with the
different support (SiO2 Al2O3 or TiO2) the solution was irradiated with
ultrasound at a frequency of 20 kHz and an output power of 300 W for 3 hours
As seen in table 4 the catalysts show a low selectivity to methane and carbon
dioxide and formation of higher hydrocarbons The more interesting results are
the highest CO conversion at lower temperatures measured with a catalysts
promoted with a Ru
Table 4 CO Conversion C2+total yield CH4 CO2 light hydrocarbon and heavy
hydrocarbon selectivity of CoCo-Ru based catalyst
Catalyst CO
Conversion ()
C2+ total yield
Selectivity ()
CH4 CO2 ltC7 gt C7
CoTiO2 28 23 5 14 10 71
CoSiO2 6 5 19 6 23 52
CoAl2O3 8 6 13 7 19 61
Co-RuTiO2 98 73 18 8 14 60
Co-RuSiO2 94 82 9 4 8 79
Co-RuAl2O3 84 73 11 2 12 75
As we have seen from the BET and TPR analysis the support and the promoter
play a key role in the performance of the catalyst because they are responsible
General Abstract
20
for the modification of some key parameters such as surface area and the
metal dispersion
ii)High Fe Loaded Supported Catalysts for Biosyngas Fischer ndash Tropsch
Conversion experimental results and detailed simulation
With regard to the treatment with the help of US (see table 5) it can be
concluded that the sonication of an aqueous mixture salts and precursors of
support (US1) is preferable instead of to the calcined catalyst suspended in
non-polar solvent such as hexane (US2) With regard to treatment with MW
(see table 3) there were obtained better results in term of CO conversion with
the powder catalyst treated directly in the MW (MW1) while the test
conducted by suspending the catalysts in hexane and then treated in a MW
reactor (MW2) for an hour did not give valid results The best FTS results in
term of C2+ yield (41) has been obtained using MW1 while in tem of CO
conversion (58) using US1 All of them gave FTS results better than the
traditional one Itrsquos evident that the use of US or MW optimizes the catalytic
performance in accord with previous similar results [36]
In agreement with [37] the FTS results show that TEOS as silica source is
favorable for the enhancement of the FTS activity
A very important property of iron based catalysts is their possibility to operate
using feeding gas having a ratio H2CO not stoichiometric (ie 2) In the
present work there were made some tests with Fe30K20Cu375 catalyst by
feeding mixtures with a ratio H2CO between 05 and 20 in order to optimize
the activity selectivity and the lifetime of this kind of FT catalyst in work
conditions of biosyngas feeding
General Abstract
21
Table 5 Catalytic Results of Fe30K20Cu375 Different preparation techniques Support
SiO2 Diluting Material α-Al2O3 T=220degC
Preparation CO Conversion
()
C2+
Total yield
Selectivity ()
CO2
CH4
lt C7
gt C7
TR 49 32 27 7 22 44
MW1 52 41 17 5 18 60
MW2 32 24 17 8 27 48
US1 58 38 29 6 22 43
US2 36 25 22 9 30 39
Co-precipitation 38 32 2 13 28 57 leC7 all the hydrocarbons in the range C2-C7 gtC7 all the hydrocarbons greater than C7 Product lsquolsquoirdquo selectivity = (moles C in product i) (converted moles C) x 100 C2+ yield = CO conversion x (selectivity leC7 + selectivity gtC7) x10-2
The co-precipitation test was made at T=250degC and TEOS as a support
On the basis of the collected data a rigorous simulation of the FT synthesis
reactor has been developed for different purposes (i) to support the
experimentations and their planning (ii) to predict the reactor yield and
conversion (iii) to optimize the performance of the reactor system with
different operating conditions and (iv) to calculate novel reliable kinetic
parameters based on the experimental data fitting by means of model-based
nonlinear regression techniques To do so the FT reactor is modeled as a
catalytic plug-flow reactor using mass and energy balances and reaction
kinetics for Fe-based catalyst defined by Zimmerman and Bukur [38] leading to
an ordinary differential equation system with structured Jacobian Lumping
techniques have been used to model heavy hydrocarbons The system is solved
by means of dedicated solvers to handle stiffness and nonlinearities of
heterogeneous reactive systems [39]
General Abstract
22
Typical H2CO ratio of syngas manufactured from coal or biomass are between
07-12 and the Fig 4 show that the activity of catalyst is good enough using
also feeding ratio between 10 and 20
Fig4 CO conversion or selectivity vs H2CO feeding ratio for Fe30K20Cu375 catalyst
at T=250degC
In Table 6 there is the data concerning the carbon monoxide conversion ()
and the selectivity towards undesired products (CO2 and CH4) and lighter and
heavy hydrocarbons of Fe-based catalyst The data collected using this catalyst
were modeled in collaboration with Politecnico di Milano
The selected model was based on the hypothesis that both FT and WGS
reaction were active on this catalyst The kinetic parameters were calculated
and compared with the experimental data
Table 6 FTS products selectivities at different H2CO ratio and reactor temperatures of
Fe30K20Cu375
Selectivity ()
H2CO T(degC) CO
Conversion ()
C2+ total yield
CO2 CH4 ltC7 gtC7
21 220 85 69 11 8 22 59
21 235 211 175 11 6 20 63
21 250 498 393 16 5 19 60
21 260 567 425 19 6 20 55
151 250 388 299 18 5 17 60
151 260 463 338 22 5 17 56
11 250 23 182 17 4 16 63
11 260 389 272 26 4 16 54
General Abstract
23
leC7 all the hydrocarbons in the range C2-C7 gtC7 all the hydrocarbons greater than C7 Product lsquolsquoirdquo selectivity = (moles C in product i) (converted moles C) x 100 C2+ yield = CO conversion x (selectivity leC7 + selectivity gtC7) x10-2
In Fig 5 is presented a comparison between the experimental data obtained in
the laboratory and the data obtained using the kinetic model The first two
columns represent the conversion of hydrogen and carbon monoxide while in
the other columns are represented the molar fraction of hydrogen carbon
monoxide water methane and lump C2 C3-4 C5-10 C11 + It can be seen that the
kinetic model present a good fitness regard to the experimental data
Fig 5 Comparison between experimental data and kinetic model
5 Conclusions
General Abstract
24
Concerning the results obtained in this PhDrsquos research work it is clear that all
the samples tested have given good results The Co-based catalysts
synthesized using the traditional impregnation method with an additional step
of ultrasound have given good results in comparison with the results in the
current literature The hydrotalcites have given lower results if compared with
the Co-based catalysts synthesized with the help of ultrasound but they have
opened an alternative and innovative way that has never been tried before
Iron based catalysts allow a direct conversion of the biosyngas and the results
have shown how our catalysts are active with an H2CO ratio le2 Furthermore
trends have been modeled with success In conclusion the PhDrsquos research
work has given a serious contribution to the current state of the art on
catalysis in the Fischer-Tropsch synthesis either with cobalt and iron based
catalysts With cobalt has been optimized a traditional synthesis procedure
with the introduction of ultrasound furthermore has been created a
completely new kind of catalyst With iron has continued an optimizationrsquos
work of iron supported with high loading metals so to develop a suitable
kinetic model able to work not only with syngas but also with biosyngas
References
[1] M S Hadnadev-Kostic J Tatjana T Vulic R Marinkovic-Neducin A D Nikolic B Jovic Journal of the Serbian Chemical Society 76 (12) (2011) 1661ndash1671 [2] E Lira C Loacutepez F Oropeza M Bartolini J Alvarez M Goldwasser F Loacutepez J Lamonier J Peacuterez Journal of Molecular Catalysis A Chemical 281 (2008) 146ndash153 [3] Q Zhang J Kang Y Wang ChemCatChem Catalysis 2 (2010) 1030 [4] F Fischer and H Tropsch BrennstChem 4 (1923) 276 [5] M E Dry Enciclopedia of Catalysis New York (2003) 247 [6] Fischer-Tropsch Technology Studies in Surface Science and Catalysis Elsevier (2004)
General Abstract
25
[7] G P Vaan Deer Laan A A C M Beenackers Catalysis Reviews Science and Engineering 41(3amp4) (1999) 255 [8] H Schulz Applied Catalysis A 186 (1999) 3 [9] GP van der Laan AACMBeenackers Applied Catalysis A 193 (2000) 39 [10] A Martinez C Lopez F Marquez IJ Diaz Catalysis 220 (2003) 486 [11] AY Khodakov WChu P Fongarland Chemical Reviews 107 (2007) 1692 [12] BHDavis Catal Today 84 (2003) 83 [13] Pirola C Bianchi CL Di Michele A Diodati P Vitali S Ragaini V Catal Lett 2009 131294ndash304 [14] A Di Fronzo C Pirola A Comazzi F Galli CL Bianchi A Di Michele R Vivani M Nocchetti M Bastianini DC Boffito Fuel 119 (2014) 62-69 [15] C Pirola CL Bianchi A Di Michele S Vitali V Ragaini Catal Comm 10 (2009) 823ndash827 [16] T Montanari M Sisani M Nocchetti R Vivani M C H Delgado G Ramis G Busca U Costantino Catalysis Today 152 (2010) 104 [17] C Resini T Montanari L Barattini G Ramis G Busca S Presto P Riani R Marazza M Sisani F Marmottini U Costantino Applied Catalysis A 355 (2009) 83 [18] Y Lee J H Choi H J Jeon K M Choi J W Lee J K Kang Energy Environment Science 4 (2011) 914 [19] Y Tsai X Mo A Campos J G Goodwin Jr J Spivey Applied Catalysis A General 396 (2011) 91ndash100 [20] M Bastianini D Costenaro C Bisio L Marchese U Costantino R Vivani M Nocchetti Inorg Chem 51 (2012) 2560-2567 [21] Suslick SK ldquoApplications of ultrasound to materials chemistryrdquo MRS Bulletin 1995 [22] S Qi B Yang Methane aromatization using Mo-based catalysts prepared by microwave heating Catal Today 98 (2004) 639-645 [23] Y Liu Y Lu S Liu Y Yin The effect of microwaves on the catalysts preparation and the oxidation of o-xilene over a V2O5SiO2 system Catal Today 51 (1999) 147-151] [24] G Biffi Gentili M Linari I Longo A Ricci IEEE Transactions on microwave theory and techniques Vol 57 (2009) 9 [25] C Bianchi C Pirola V Ragaini Catalysis Communications 7 (2006) 669-672 [26] ML Cubeiro Loacutepez A Colmenares L Texeira M Goldwasser M J Peacuterez F Machado F Gonzaacutelez Applied Catalysis A General 167 (1998) 183-193 [27] C L Bianchi Catalysis Letters Vol 76 No 3ndash4 (2001)155-159 [28] H-Y Lin Y-W Chen C Li Thermochim Acta 400 (2003) 61ndash67 [29] H-Y Lin Y-W Chen Materials Chemistry and Physics 85 (2004) 171ndash175
General Abstract
26
[30] BA Sexton AE Hughes TW Turney Journal of Catalysis 97 (1986) 390ndash406 [31] A Alvarez S Ivanova MA Centeno JA Odriozola Applied Catalysis A General (2012) 431ndash 432 [32] C L Bianchi C Pirola DC Boffito A Di Fronzo A Di Michele R Vivani M Nocchetti M Bastianini S Gatto DGMK Tagungsbericht Volume2011-2 IssuePreprints of the DGMK-Conference Catalysis Innovative Applications in Petrochemistry and Refining 2011 Pages 93-98 Journal 2011 CODEN DGTAF7 ISSN1433-9013 [33] 7 H Wan B Wu C Zhang H Xiang Y Li Promotional effects of Cu and K on precipitated iron-based catalysts for Fischer ndash Tropsch synthesis J molecular Catalysis 283 (2008) 33-42 [34] J Xu CHBartholomew J Phys Chem B 109 (2005) 2392 [35] CLBianchi VRagaini Catalysis Letters 95 (2004) 61-65 [36] C Pirola C L Bianchi A Di Michele P Diodati D C Boffito V Ragaini Ultrasonic Sonochem 17 (2010) 610 [37] Suo Haiyun Zhang Chenghua Wu Baoshan Xu Jian Yang Yong Xiang Hongwei Li Yongwang A comparative study of FeSiO2 FischerndashTropsch synthesis catalysts using tetraethoxysilane and acidic silica sol as silica sources Catalysis Today Volume 183 Issue 1 20 March 2012 Pages 88ndash95 [38] WH Zimmerman DB Bukur Can J Chem Eng 68 (1990) 292-301 [39] F Manenti I Dones G Buzzi-Ferraris HA Preisig Ind Eng Chem Res 48 (2009) 9979-9984
27
Chapter 1 General Introduction The National Renewable Energy Laboratory (NREL) and the Pacific Northwest
National Laboratory (PNNL) [1] are undertaking studies of biomass conversion
technologies to hydrocarbon fuels
Process designs and preliminary economic estimates for each of these pathway
cases were developed using rigorous modeling tools This technology pathway
case investigates the upgrading of woody biomass derived synthesis gas
(syngas) to hydrocarbon biofuels While this specific discussion focuses on the
conversion of syngas via a methanol intermediate to hydrocarbon blend stocks
there are a number of alternative conversion routes for production of
hydrocarbons through a wide array of intermediates from syngas (Fig 11)
Technical barriers and key research needs have been identified that should be
pursued for the syngas-to-hydrocarbon pathway to be competitive with
petroleum-derived gasoline- diesel- and jet-range hydrocarbon blend stocks
Fig 11 Process Block Diagram [1]
At present the development of economical and energy-efficient processes for
the sustainable production of alternative fuels and chemicals is a global
Chapter 1 General Introduction
28
demand and FTS is a crucial technology for this purpose [2] On the one side
the observed climate change particularly global warming is widely held as a
consequence of the increase of atmospheric CO2 concentration due to fossil
fuel combustion On the other side people are increasingly aware that fossil
fuels reserves are huge but not unlimited and the air quality are major
environmental concerns because they directly affect the way we live and
breathe
In order to meet the present and future threats generated by emissions to the
atmosphere environmental agencies around the world have issued more
stringent regulations One of them is the control of residual sulfur in diesel fuel
and emission standards for particulates from diesel vehicles All these facts
have recently aroused renewed interest in the FischerndashTropsch Synthesis
because it can produce super clean diesel oil fraction with high cetane number
(typically above 70) without any sulfur and aromatic compounds using syngas
(mixture of H2 CO CO2) from natural gas CH4 coal landfill gas coal or biomass
through steam reforming partial or auto thermal oxidation gasification
processes or as a new tendency from biomass [3-5] Mineral diesel basically
results from refining and fractional distillation of crude oil between 160 and
380degC at atmospheric pressure and is mostly formed by mixtures of paraffins
containing between 12 and 20 carbon atoms per molecule In these mixtures
linear paraffins are particularly appreciated due to their high cetane number
ie their excellent ignition performances Expansion and social progress is
however boosting a further increase of energy demand particularly in the
transportation sector which in developed countries accounts for most of this
increase This is the reason why carbon-neutral biofuels are largely considered
a possible way to satisfy the energy demand without dramatically increasing
the CO2 content of the atmosphere [6]
Chapter 1 General Introduction
29
In this context the production of hydrocarbons starting from syngas (CO + H2) is
a crucial topic because syngas can be manufactured from natural gas (GTL Gas
to liquid) coal (CTL coal to liquids) or biomass (BTL Biomass to liquid) [7] In
Fig 12 the industrial way to utilize syngas are reported the fuels produced
from syngas include hydrogen by the water-gas-shift (WGS) reaction methanol
by methanol synthesis alkenes by Fischer Tropsch synthesis (FTS) isobutene by
isosynthesis ethanol by fermentation or with homogeneous catalysts and
aldehydes or alcohols by oxosynthesis
Fig 12 Diagram of Syngas Conversion Processes [8]
Fischer-Tropsch Synthesis (FTS) is a well-known industrial process discovered
by Franz Fischer and Hans Tropsch in Germany in 1923 [9] starting from syngas
(H2 + CO) and using iron or cobalt based catalysts it is possible to produce
several hydrocarbons in the range from 1 to 100 carbon atoms Co-based
catalysts have been more largely used due to their high selectivity to heavy
hydrocarbons and low activity in the water-gas shift reaction so limiting the
CO2 formation Moreover Co-based catalysts have shown longer life-time and
higher CO conversion compared to the Fe-based ones [10-11] The essential
target of FTS is to produce paraffins and olefins with different molecular weight
Chapter 1 General Introduction
30
and to limit the maximum formation of methane and CO2 [4 12-15] The main
reactions involved in FTS are reported in the following scheme
Irreversible reactions
1) n CO + 2n H2 rarr CnH2n + n H2O for olefins
2) n CO + (1+2n) H2 rarr CnH(2n+2) + n H2O for paraffins
3) 2n CO + n H2 rarr CnH2n + n CO2 for olefins
4) n CO + 2n H2 rarr CnH(2n+1)OH + (n-1) H2O for alcohols
Equilibria
5) CO + H2O harr CO2 + H2 Water-gas-shift reaction (WGS)
6) CO + 3 H2 harr CH4 + H2O
7) 2 CO harr C + CO2 Boudouard equilibrium
The whole reaction gives an energetic contribution strongly exothermic (about
150 kJmol CO reacted) FTS is a particularly complex system in which a
number of different reactions are combined to a unique mechanism
irreversible FT reactions produce hydrocarbons and some equilibria reactions
between CO CO2 CH4 and C such as the WGS reaction and the Boudouard
equilibrium are present too Nevertheless it is possible to suppose that FTS
can be simplified as a combination of the FT reactions and the WGS reaction
[14] Hydrocarbons are primary products of FT reaction and CO2 can only be
produced by WGS reaction a reversible parallel-consecutive reaction with
respect to CO [16]
At present the marketplace places a premium on FT diesel but not gasoline
thus the current view is that the most attractive option is to produce high
molecular weight FT products and then to hydrocrack them to produce high
quality diesel fuel [17] According to Calderone et al [18] the most important
limitation to the industrialization of FT processes is the availability of cheap oil
Industrial interest in FT reactions always peaks during oil crises (Fig 13) The
Chapter 1 General Introduction
31
Kyoto protocol recognizes the importance of developing and deploying new
technologies with less impact on the environment
Fig 13 The oil price (line) related to the output of peer reviewed FTS research papers and patents (bars) in 1925ndash2007 [19]
Fig 14 Number of papers related to FT synthesis published in the past decade From
ISI Web of Science using the keyword ldquoFischer-Tropschrdquo [20]
Selectivity control remains one of the most important and difficult challenges
in the research area of FTS Development of efficient catalysts with controlled
selectivity or tuned product distribution is a highly desirable goal [5]
Compared to cobalt systems iron-based catalysts are cheaper but less resistant
to deactivation due to the oxidizing effect of water despite activating Water
Gas Shift (WGS) reaction (CO + H2O harr CO2 + H2) [12 16] Moreover they are
flexible to changes in temperature pressure and they can work at different H2
CO feed ratios (for iron based catalysts this ratio can be between 05 and 25)
[21-22] Iron catalysts seem to be more suitable to work with biomass-derived
Chapter 1 General Introduction
32
syngas as outlined by Corma et al [23] that are characterized by a low ratio
H2CO and by the presence of CO2 (the activation of WGS reaction in fact can
produce CO from CO2) They present lower methane selectivity and they are
less deactivated by poisons species [24] The iron based catalysts have different
active site the Fe-carbides sites are active for the formation of hydrocarbons
(FTS) while the magnetite (Fe3O4) sites are the most active phase for the WGS
reaction [16 25-26]
11 Fischer Tropsch Synthesis Historical background
A Short Historical Sketch
Year Ref
1902 P Sabatier and J D Senderens
Hydrogenated CO over Ni to produce CH4 [27]
1910 A M Mittasch C Bosch and F Haber
Developed promoted Fe catalysts for the synthesis of NH3 [28]
1913 Badische Anilin und Soda Fabrik (BASF)
Received patents on the preparation of hydrocarbons and oxygenates by the hydrogenation of CO at high pressure usually on oxide catalysts
1936 Eugene Houdry Developed and installed the first commercial catalytic cracking unit [29]
1943-1944
Kogravelbel KWIK and five companies participated
Initiated and directed the comparative tests I and II held at Schwarzheide to select a Fe catalyst to replace Co in existing reactors Although the results were remarkably good no replacement catalyst was selected probably because of the overall disarray of activity that attended the approach of the end of the war
[30]
1949 Kogravelbel and F Engelhardt
Discovered that H2O and CO react on FTS catalysts to yield typical FTS products
1950 A fluidized-fixed bed process developed by Hydrocarbon Research Trenton New Jersey was installed in Brownsville Texas This plant called Carthage Hydrocol Inc used reformed natural gas Severe operating difficulties required designing a new reactor which was installed in 1953 The new reactor operated properly but the plant was promptly shut down sold and dismantled By the time the plant was operating correctly the price of natural gas had more than doubled Merely selling the gas was more profitable than converting it to gasoline and chemicals At the same time in South Africa the SASOL FTS plant using coal was constructed and opened in 1955 Lurgi gas generators and Rectisol gas-cleaning units were employed Two types of FTS reactors both with Fe catalysts were used a fixed-bed with recycle unit designed by Ruhrchemie in West Germany having long tubes with an internal diameter of 2 inch and an entrained-solids reactor by M W Kellogg in New Jersey After a year or more of start-up problems these units have operated successfully up to the present
[31]
1953 R B Anderson and J F Shultz
Found that Fe nitrides are unique durable catalysts for the FTS that produce large yields of alcohols Anderson developed equations that predict the isomer and carbon-number distributions of FTS products
[32]
1957 G Natta and co-workers
Studied the methanol and higher alcohol syntheses [3334]
1959 Pichler Resumed work on FTS on Ru which led to the polymethylene synthesis
Chapter 1 General Introduction
33
1961 H H Storch He died he was the architect of the useful scientific and engineering research programs on coal-to-oil processes at the US Bureau of Mines in Pittsburgh and Bruceton Pennsylvania
[3235]
1967 US Bureau of Mines workers
Developed methods for flame spraying catalysts onto metals for the platelet assemblies of hot-gas-recycle reactors These techniques led to the development of a new FTS unit the tube-wall reactor
[36]
1975 SASOL II SASOL III
In South Africa the decision was made to build SASOL II scheduled for operation in 1980 and in 1979 plans were made for SASOL III to begin operation in 1982 The new plants are similar to the initial plant except that fixed-bed FTS reactors were not included in the new installations
[31]
1976 Mobil Announced a process for converting methanol to an aromatic gasoline and C to C4 olefins on the shape-selective catalyst ZSM5 This process may be a serious competitor for FTS
1981 New Zealand A methanol plant operating on natural gas plus the Mobil process was planned scheduled for competition in 1985
1982 The worldwide recession
Sharply decreased demand for petroleum OPEC was unable to control the production and price of oil among its members The relatively low cost and abundance of petroleum has discouraged new coal-to-oil ventures
1993 Shell in Bintulu Malaysia
Completed construction and began operating their ldquoShell Middle Distillate Processrdquo The Bintulu Plant produces 12500 BPD and in 2000 increase that capacity to 15000 BPD This F-T plant has effectively captured the world specialty wax market
2000 While Saudi Arabia produced about 8 million barrels of oil per day in 2000 the world flared (burned) or re-injected associated gas equivalent to 72 million barrels per day of clean synthetic fuels Worldwide environmental legislation requiring ultra-low sulphur and aromatic levels in fuel will cost billions in oil refinery upgrading
2002 Nearly every major oil company is either developing their own F-T technology forming joint ventures or scrambling to do so ExxonMobil has spent over $500 MM Chevron formed a joint venture with Sasol Statoil has formed a joint venture with Mossgas Conoco built a $400MM test plant in Oklahoma BP completed its pilottest plant in Alaska Shell has announced 7 new projects
2004 50 new Fischer-Tropsch projects have been announced These projects total over 900000 BPD capacity Some of these projects are pilot plants some are feasibility studies for clients and some have started construction
2005 In South Africa Mossel Bay GTL Expansion operated by PetroSA with a capacity of 15000bpd
2006 In Qatar ORYX GTL Phase 1 operated by SasolQatar Petrol with a capacity of 32400 bpd
2011 In Qatar Pearl GTL Phase 1 operated by Shell with a capacity of 70000 bpd
2011 In Qatar Pearl GTL Phase 2 operated by Shell with a capacity of 70000 bpd
2013 In Nigeria Escravos operated by ChevronNNPC with a capacity of 34000bpd
2017 In Uzbekistan Oltin Yorsquol GTL operated by SasolUNGPetron with a capacity of 38000bpd
2018-19
In USA Sasol Lousiana operated by Sasol with a capacity of 96000bpd
Firm proposed large-scale GTL capacity outlook
Chapter 1 General Introduction
34
Fig 15 The Sasol Synfuels plant at Secunda South Africa
Fig 16 ldquoShell Middle Distillate Processrdquo in Bintulu Malaysia
Fig 17 Franz Fischer and Hans Tropsch
12 Present Situation of Fischer-Tropsch Technology
High energy prices and concerns about the environmental consequences of
greenhouse gases (GHG) emissions lead a number of national governments to
provide incentives in support of the development of alternative energy
Chapter 1 General Introduction
35
sources making renewables the worldrsquos fastest-growing source of energy in
the outlook
According to the Annual Energy Outlook 2013 [37] the aggregate fossil fuel
share of total energy use falls from 82 percent in 2011 to 78 percent in 2040 in
the Reference case while renewable use grows rapidly (Fig 17) The
renewable share of total energy use grows from 9 percent in 2011 to 13
percent in 2040 in response to the federal renewable fuels standard
availability of federal tax credits for renewable electricity generation and
capacity during the early years of the projection and state renewable portfolio
standard (RPS) programs
Increased vehicle fuel economy offsets growth in transportation activity
resulting in a decline in the petroleum and other liquids share of fuel use even
as consumption of liquid biofuels increases Biofuels including biodiesel
blended into diesel E85 and ethanol blended into motor gasoline (up to 15
percent) account for 6 percent of all petroleum and other liquids consumption
by energy content in 2040
Consumption of petroleum and other liquids peaks at 198 million barrels per
day in 2019 in the AEO2013 reference case and then falls to 189 million barrels
per day in 2040 (Figure 18)
Fig 18 Primary energy use by fuel 1980-2040 (quadrillion BTU)
Chapter 1 General Introduction
36
The transportation sector accounts for the largest share of total consumption
throughout the projection although its share falls to 68 percent in 2040 from
72 percent in 2012 as a result of improvements in vehicle efficiency following
the incorporation of CAFE standards for both LDVs and HDVs
An increase in consumption of biodiesel and next-generation biofuels (include
pyrolysis oils biomass derived Fisher-Tropsch liquids and renewable feedstocks
used for on-site production of diesel and gasoline) totaling about 04 million
barrels per day from 2011 to 2040 is attributable to the EISA2007 RFS
mandates The relative competitiveness of CTL and GTL fuels improves over the
projection period as petroleum prices rise In 2040 CTL and GTL together
supply 03 million barrels per day of nonpetroleum liquids
Fig 19 Consumption of petroleum and other liquids by sector 1990-2040 (million
barrels per day)
2 Oil prices and total energy consumption
The importance of the research in FTS is directly dependent of the oil prices
and the total energy consumption So it is so important to meet the
projections of these variables before to make every kind of investments on this
area In AEO2013 oil prices are represented by spot prices for Brent crude
Prices rise in the Reference case from $111 per barrel in 2011 to about $117
Chapter 1 General Introduction
37
per barrel in 2025 and $163 per barrel in 2040 (Table 1) The price rise starts
slowly then accelerates toward the end of the projection period
Market volatility and different assumptions about the future of the world
economy are reflected in the range of oil price projections for both the near
and long term however most projections show oil prices rising over the entire
projection period
Table 1 Comparisons of oil price projections 2025 2035 and 2040 (2011 dollars per
barrel)
As regard the total energy consumption the in table 2 there are four different
projections made by other organizations (INFORUM IHSGI ExxonMobil and
IEA) [37]
Chapter 1 General Introduction
38
Table 2 Comparisons of energy consumption by sector projections 2025 2035 and
2040 (quadrillion BTU)
ExxonMobil includes a cost for carbon dioxide (CO2) emissions in their
projection which helps to explain the lower level of consumption in their
outlook Although the IEArsquos central case also includes a cost for CO2 emissions
its Current Policies Scenario (which assumes that no new policies are added to
those in place in mid-2012) is used for comparison in this analysis because it
corresponds better with the assumptions in the AEO2013 Reference case
ExxonMobil and IEA show lower total energy consumption across all years in
comparison with the AEO2013 Reference case Total energy consumption is
Chapter 1 General Introduction
39
higher in all years of the IHSGI projection than in the AEO2013 Reference case
but starts from a lower level in 2011
For the transportation sector the difference could be related to vehicle
efficiency as the INFORUM projection for motor gasoline consumption (2
quadrillion Btu lower than AEO2013) is comparable with the EIA projection in
AEO2012 which did not include the efficiency standard for vehicle model years
2017 through 2025
IHSGI projects significantly higher electricity consumption for all sectors than in
the AEO2013 Reference case which helps to explain much of the difference in
total energy consumption between the two projections
Then the projections make possible the investment on research in Fischer ndash
Tropsch synthesis
The process known as Gas to Liquid (GTL) was based on two steps
Steam reforming of natural gas into syngas
Fischer Tropsch synthesis from syngas into synthetic liquid fuels
Recently (2004-2006) the massive growth of GPN (Gross National Product) in
China and India has caused crude oil process to rise continuously and FTS
(including both coal and biomass as feedstock BTL) has become once more an
appealing technology Recent interest in FT technology especially in Europe and
South America is driven by a focus on the gasification of biomass into fuel [38]
(BTL)
Biomass to Liquid via FischerndashTropsch (BTL-FT) synthesis is gaining increasing
interests from academia and industry because of its ability to produce carbon
neutral and environmentally friendly clean fuels
In the BTL-FT process biomass such as woodchips and straw stalk is firstly
converted into biomass-derived syngas (bio-syngas) by gasification
Chapter 1 General Introduction
40
Bio-syngas resulting from biomass gasification contains CO H2 CO2 CH4 and
N2 in various proportions [39 40] Then a cleaning process is applied to
remove impurities from the bio-syngas to produce clean bio-syngas which
meets the FischerndashTropsch synthesis requirements Cleaned bio-syngas is then
conducted into a FischerndashTropsch catalytic reactor to produce green gasoline
diesel and other clean biofuels
Generally there are three main steps in the Biomass to Liquid via Fischerndash
Tropsch (BTL-FT) synthesis [41-43] Biomass is firstly converted into biomass-
derived syngas (bio-syngas) by gasification In a second step a cleaning process
is applied to the bio-syngas in order to remove impurities resulting in clean
bio-syngas which meets the FischerndashTropsch synthesis requirements Finally
the cleaned bio-syngas is then conducted into FischerndashTropsch catalytic reactor
to produce green gasoline diesel and other clean biofuels The flow sheet of
the BTL-FT process is depicted in Figure 110
Fig110 Flow sheet of the Biomass to Liquid via FischerndashTropsch Synthesis (BTL-FT)
process [44]
It is difficult to predict the composition of the gas product from a gasifier due
to the complex reactions occurred during the gasification Table 13 shows the
typical composition of gas produced from gasification of wood and charcoal
with low to medium moisture content with ambient air as the gasifying agent
in a downdraft gasifier [45] and composition of bio-syngas from biomass
gasification [46ndash48]
Chapter 1 General Introduction
41
At present the main commercial interest in FTS is the production of high
quality sulphur-free synthetic diesel fuels from natural gas currently being
flared at crude oil production wells [49-52] This renewed interest in FTS has
not just only come about as a result of abundant supply of natural gas but also
because of the global development of fuel supplies and environmental
regulations to improve air quality in cities around the world
All these facts have recently aroused renewed interest in the FischerndashTropsch
Synthesis Synthetic diesel is being promoted by the fuel industry because it
can produce super clean diesel oil fraction with high cetane number (typically
above 70) without any sulfur and aromatic compounds with low particulate
formation and low NOx and CO emission [3-4 53] as the most viable next step
towards the creation of a sustainable transport industry
Table 13 Composition of gas produced from gasification of wood and charcoal in
ambient air [45] and also the composition of typical nitrogen free bio-syngas [46ndash48]
Component Wood gas (air) Charcoal gas (air) Bio-syngas
(nitrogen free)
N2 50ndash60 55ndash65 0
CO 14ndash25 28ndash32 28ndash36
CO2 9ndash15 1ndash3 22ndash32
H2 10ndash20 4ndash10 21ndash30
CH4 2ndash6 0ndash2 8ndash11
C2H4 na na 2ndash4
BTX na na 084ndash096
C2H5 na na 016ndash022
Tar na na 015ndash024
Others na na lt0021
Chapter 1 General Introduction
42
3 Viability of GTL for the gas market
According to Brown [54] between 1950 and 2010 global volumes of GTL
product output capacity had materialized at less than 100000 bd -roughly
equivalent to the output of just one average- sized east European refinery
However the recent confluence of several factors has altered the commercial
viability of the GTL industry suggesting that wide margins and robust revenues
can be earned by converting natural gas into clean-burning liquid fuels and
other high value oil-linked commodities Broadly speaking these factors are
1) Improvements in the lifespan of the catalysts used to derive hydrocarbon
chains from natural gas (methane) and efficiency gains in the Fischer Tropsch
processes
2) The detachment of natural gas markets from oil prices and the subsequent
wide differential between the two prices courtesy of the unconventional gas
boom
3) Long-term global demand trends favouring low-emissions fuels in the
transport sector
Despite these auspicious circumstances however this paper argues that GTL
fuels will have only a limited reach into oil product markets and the transport
sector going forward While downward pressure on natural gas prices and
increasing demand for clean-burning motor fuels have ushered in visions of a
new future of transport fuels (that) will soon go global [55] the transient
conditions that had supported a favourable outlook for the proliferation of GTL
liquid fuels over the period of 2009-12 have more recently shown signs of
deterioration Moreover alternative and less capital-intensive pathways to
natural gas monetization are emerging via small-scale modular GTL plants
whose development has been encouraged by the rapidly increasing supply of
Chapter 1 General Introduction
43
unconventional and associated gas which has necessitated more practical and
localized gas monetization solutions
Commodity prices for transport fuels such as diesel are closely correlated to
crude price movements (see Fig 110) and moreover trade at a premium to
crude benchmarks depending on regional dynamics such as product balances
and cyclical demand conditions GTL products sharing identical physical
characteristics with crude-refined diesel have the potential to exploit not only
the market price differential between gas feedstock and oil prices but in
addition the spread between oil benchmark prices and oil product markets
The confluence of these dynamics leads to significantly wider margin potential
than that experienced by crude-refined alternatives in oil product markets at
least in a context defined by high oil and low gas prices Accordingly the upside
revenue potential of large-capacity GTL builds is dictated by the relatively
straightforward principle that the more capacity dedicated to products trading
at a premium to crude a plant has the higher the plants revenues will be
Fig 111 Correlation between ultra-low sulphur diesel spot prices and Brent crude
Europe offers an ideal destination for GTL-derived diesel A combination of
stringent fuel quality specifications and declining domestic supply supports a
healthy environment for gasoil and diesel imports Moreover the oil product
market is predominately driven by gasoildiesel consumption which accounted
Chapter 1 General Introduction
44
for well over half (56 per cent see Fig 111) of main product demand in 2012
As such the current application and commercialization of GTL diesel in Europe
reflects the potential of GTL diesel to impact global gasoil markets
Fig 112 Europe main oil product demand (2012)
In order to meet supranational carbon emissions targets progressively tighter
EU-wide Fuel Quality Directives have mandated a sharp reduction of sulphur
content in gasoildiesel marketed within the European Union The
specifications for sulphur content in motor fuels (gasoline and diesel) in the
road sector were reduced from 350 parts per million (ppm) in 2000 to just 10
ppm in 2009 The legislation was amended in 2011 to encompass gasoil and
diesel consumed in off-road sectors such as railways and inland navigation
and by 2012 10 ppm gasoil accounted for an estimated 80 per cent of Europe-
wide gasoil demand [54]
The gasoil produced by refineries in Europe has varying physical characteristics
in terms of sulphur content (affecting particulate emissions) cetane index
(influencing ignition quality in combustion engines) and viscosity (affecting
energy content and fuel efficiency) each influencing market value
It has been estimated that FT-GTL should be viable at crude oil prices of about
$20 per barrel The oil price has been well above $70 per barrel (more recently
Chapter 1 General Introduction
45
it has even topped above $100 per barrel) making it a very appealing for
countries that have huge reserves of natural gas but little local market for it
and no major pipeline infrastructure to ship it to larger economies
In Fig 112 it can be seen a geographical representation of the world proved
reserves for 2011
Fig 113 World proved reserves 2011 [37a]
12 Fischer Tropsch GTL Process and Chemistry
According to [56] the basic FT-GTL process consists of three fundamental steps
which require significant supporting infrastructure and a secure feed gas supply
to function effectively (Fig 113)
1 The production of synthesis gas (syngas) The carbon and hydrogen are
initially divided from the methane molecule and reconfigured by steam
reforming andor partial oxidation The syngas produced consists
primarily of carbon monoxide and hydrogen
2 Catalytic Fischer Tropsch synthesis The syngas is processed in Fischer-
Tropsch reactors of various designs depending on technology creating a
wide range of paraffinic hydrocarbons product (synthetic crude or
Chapter 1 General Introduction
46
syncrude) particularly those with long chain molecules (eg those with
as many as 100 carbons in the molecule)
3 Cracking-product workup The syncrude is refined using conventional
refinery cracking processes to produce diesel naphtha and lube oils for
commercial markets [57] By starting with very long chain molecules
the cracking processes can be adjusted to an extent in order to produce
more of the products in demand by the market at any given time In
most applications it is the middle distillate diesel fuel and jet fuels that
represent the highest-value bulk products with lubricants offering high-
margin products for more limited volume markets In modern plants
FT-GTL unit designs and operations tend to be modulated to achieve
desired product distribution and a range of products slates [58]
Fig 114 Large scale FT-GTL projects become more economically robust for the
developer if they involve integrated upstream and downstream components securing
feed gas supplies and additional revenues from NGL and condensate extracted from
the feed gas [56]
Chapter 1 General Introduction
47
The Fischer Tropsch processes are not limited to using gas derived from large
conventional non- associated natural gas as a feedstock coal seam gas
associated gas coal or biomass can all be processed using FT technologies by
changing the catalysts and work conditions (Pressure and temperature) A
secure supply of feed gas from whatever origin is important for the
commercial viability of large-scale FT-GTL plants Integrated upstream and
downstream projects therefore offer GTL project developers lower-risk returns
1) The production of synthesis gas (syngas)
Synthesis gas (ldquosyngasrdquo) is typically produced using either partial oxidation or
steam reforming processes [59] Syngas is an intermediate gas feed for many
different petrochemical processes including a range of GTL alternative
technologies
Partial
Oxidation
CH4 + frac12O2 CO +
2H2 (exothermic)
The key components required for this approach include A combustion chamber operated at high temperatures (1200-1500degC) without catalysts Process designs to impede a competing reaction to syngas formation which involves the decomposition of methane to carbon black (due to high temperature non-catalytic nature of the chemistry) [59]
Steam
Reforming
CH4 + H2O CO + 3H2 (endothermic)
Steam reforming is usually carried out in the presence of catalyst ndasheg nickel dispersed in alumina in operating conditions involving temperatures of 850-940degC and pressure of about 3MPa The process is typically conducted in tubular packed reactors with heat recovery from flue gas used to pre-
Chapter 1 General Introduction
48
heat the feed gas or to raise steam in waste heat boilers Several well-established engineering companies offer their own variants of this process
Other possible reactions are
CO+ H2O CO2 + H2
CH4+ CO2 2CO + 2H2
2) Fischer-Tropsch synthesis
According to [55] Fischer-Tropsch synthesis is one of a several technologies to
polymerise the carbon and hydrogen components into long-chain molecules
CO + 2H2 -CH2- + H2O (very exothermic)
Which in practice operates more typically as
2CO (gas) + H2 (gas) (-CH2-)n (liquid) + CO2 (gas) + H2O
The process involves some carbon dioxide emission and watersteam
production along with the hydrocarbon liquid production
The typical FT reactions compete with the methanation (reverse of steam
reforming) reaction (and reactions that lead to the production of propane and
butane (LPG) which are also highly exothermic
CO + 3H2 CH4 + H2O
In order to promote FT reaction in preference to methanation (or LPG
reactions) the synthesis is run at low temperatures 220-350degC pressure 2-3
MPa with carefully selected catalysts (ie commonly cobalt) in reactors that
encourage the growth of long-chain hydrocarbon molecules Several
companies hold patents associated with XTL catalysts process vessels and
process sequences (eg Conoco Phillips CompactGTL ExxonMobil Rentech
Sasol Shell Syntroleum and others) however it is only Sasol and Shell that
have built large-scale commercial plants (iegt5000 barrelsday of GTL product)
Chapter 1 General Introduction
49
rather than pilot-scale or demonstration plants The industry therefore remains
in its infancy and the many patents held by relatively few companies act as a
costly barrier to entry for resource-rich gas companies and countries wishing to
use GTL as an alternative means of monetizing their gas
There are two major categories of natural gas-based FT process technology the
high-temperature and the low-temperature types
HTFT (High-Temperature Fischer-Tropsch) In HTFT because of the process
conditions and the catalysts involved the syncrude produced includes a high
percentages of short chain (ie lt10 carbon atoms) with significant amounts of
propane and butane mixed with olefins (eg propylene and butylene) These
short-chain hydrocarbons gases are typically extracted from the tail gas stream
utilizing cryogenic separation The resultant lean tail gas is recycled and mixed
with additional lean feed gas for further syngas production [60] The high-
temperature (HT) iron catalysts-based FT GTL process produces fuels such as
gasoline and diesel that are closer to those produced from conventional oil
refining The resultant GTL fuels are sulphur-free but contain some aromatics
[61] Typical process operation conditions for HTFT are temperatures of
approximately 320degC and pressures of approximately 25MPa Conversion in
HTFT can begt85 efficient [62] but not all the products are readily usable or
capable of producing high-quality transport fuels HTFT processes tend to be
conducted in either circulating fluidized bed reactors or fluidized bed reactors
[63]
LTFT (Low-Temperature Fischer-Tropsch) LTFT involves the use of low-
temperature (LT) cobalt-catalyst-based processes either in slurry-phase
bubble-column reactors (eg Sasol) or in multi-tubular fixed bed reactors (eg
Shell) LTFT produces a synthetic fraction of diesel (GTL diesel) that is virtually
free of sulphur and aromatics Typical process operation conditions for LTFT are
Chapter 1 General Introduction
50
temperatures of approximately 220degC to 240degC and pressures of approximately
20 to 25 MPa Conversion in LTFT is typically only about 60 with recycle or
the reactors operating in series to limit catalyst deactivation [62]
The primary focus of most large-scale FT technologies in current market
conditions is to produce high-quality low-emissions GTL diesel jet fuel and
naphtha (for petrochemical feedstock or gasoline blending)
3) Cracking ndash product workup
From [56] FT GTL plants can be configured to produce a wide range of
products from lubricating base oils and waxes through to petrochemical
naphtha and specialty chemicals Most of the already developed and planned
plants target the production of diesel fuels (C14-C20) together with some
kerosenejet fuel (C10-C13) naphtha (C5-C10) lubricants (gtC50) and a little LPG
(C3-C4)- By adjusting operating conditions in the Fischer Tropsch reactor the
mix of products can be altered This enables FT GTL products to be produced in
quantities that enable them to target the high-value product markets of
petroleum products produced by conventional oil refineries
However the yield pattern from a typical FT GTL plant is significantly different
to that rom a catalytic cracking crude oil refinery (Fig 114) Typically the
diesel yield of FT GTL plant is around 70 much higher than for crude oil
refineries which is typically some 40 [64]
From Fig 114 the products derived from upgrading syncrude produced by FT-
GTL differ significantly from those produced by refining barrel of crude oil
Notably FT GTL produces more high-value zero-sulphur products especially
middle distillates On the other hand refining crude oil particularly heavy oil
produces substantial quantities of low-value fuel oil ie more than prevailing
markets can consume Source modified from [65]
Chapter 1 General Introduction
51
Most oil refineries yield some low-value fuel oil the yield depending on the
quality of the fuel processed and the type and capacity of the refineryrsquos fuel-oil
conversion units By contrast the FT GTL plants are configured to yield only
higher-value (relative to crude oil) light and middle distillate products From a
plant with existing technology the yield of middle distillates (gasoildiesel and
kerosene) is nearly a third more of the total product slate than that from a
typical oil refinery [66]
As predicted a decade ago [67] globally diesel demand is growing rapidly at
some 3 a year more quickly than other refinery products Against this
backdrop refiners face significant challenges to meet diesel demand and
quality in the future as crude oil supply becomes heavier and sourer [68]
Fig 115 Refinery Volume Yields versus FT GTL Yields
From [56] for FT-GTL to be commercial at oil prices of less than about
40$barrel plant capital costs operating costs and feed gas costs all have to be
substantially lower on a unit basis than large-scale plants built in recent years
have been able to deliver If the unit capital cost of an FT-GTL plant is close to
100000$barrelday the operating cost of that plant is close to 20$barrel of
Chapter 1 General Introduction
52
product and the feed gas costs in the vicinity of 5$MMBtu the liquid products
would cost in the vicinity of 100$barrel and the economics of such as a plant
do not look so inviting in 2012 market conditions The industry has to achieve
lower plant and feed gas costs to be economically attractive
Fischer- Tropsch Synthesis Opportunities and challenges
GTL technologies offer the potential to reduce global dependency on crude-oil
derived transportation fuels They also offer substantial opportunities for the
owners of stranded gas to diversify the markets into which they deliver their
gas-derived liquid products particularly targeting the large and rapidly growing
global middle distillate markets (See Fig 116)
However the technologies are complex costly and tightly held by a few
companies holding patents for the key process steps which present significant
barriers to entry for building large-scale plants This also renders the building of
large-scale plants challenging for the gas resource holders in terms of capital
costs access to technology and long-term transfer of GTL technologies
At the current time Fischer Tropsch technologies dominate GTL applications for
large scale-plants Technology breakthroughs are required if methane-to-
gasoline or methane-to-olefin plants are to displace traditional refinery and
petrochemical routes to those products On the other hand dimethyl-ether
(DME) has a growing market in Asia particularly in China which is likely to
expand if the one-step process avoiding the production route via methanol is
successfully scaled up as planned and transportation fuel markets are
developed for DME
Chapter 1 General Introduction
53
Fig 116 The GTL Industry Opportunities and Challenges
References
[1] Michael Talmadge Mary Biddy and Abhijit Dutta Syngas Upgrading to Hydrocarbon Fuels Technology Pathway National Renewable Energy Laboratory Technical Report NRELTP-5100-58052 PNNL-22323 March 2013 httpwwwostigovbridge [2] C Pirola C Bianchi A Di Michele P Diodati S Vitali V Ragaini Catal Lett 131 294-304 (2009) [3] M S Hadnadev-Kostic J Tatjana T Vulic R Marinkovic-Neducin A D Nikolic B Jovic Journal of Serbian Chemical Society 76 (12) (2011) 1661ndash1671 [4]E Lira C Loacutepez F Oropeza M Bartolini J Alvarez M Goldwasser F Loacutepez J Lamonier J Peacuterez Journal of Molecular Catalysis A Chemical 281 (2008) 146ndash153 [5] Qinghong Zhang Jincan Kang and Ye Wang ChemCatChem 2 (2010) 1030 ndash 1058 [6] C Perego M Ricci Catalysis Science amp Technology (2012) 2 1776ndash1786 [7] GWHuber SIborra ACorma Chemical Reviews 106 (2006) 4044
Chapter 1 General Introduction
54
[8] PL Spath and DC Dayton Preliminary Screening - Technical and Economic Assessment of Synthesis Gas to Fuels and Chemicals with Emphasis on the Potential for Biomass-Derived Syngas NRELTP-510-34929 December 2003 [9] F Fischer and HTropsch BrennstChem 4 (1923) 276 [10] A Martinez C Lopez F Marquez IJ Diaz Catalysis 220 (2003) 486 [11] John L Casci C Martin Lok Mervyn D Shannon Catalysis Today 145 (2009) 38ndash44 [12] MEDry in Enciclopedia of Catalysis ITHorvarth Ed JWileyampSons New York (2003) 247 [13] Fischer-Tropsch Technology in Studies in Surface Science and Catalysis Elsevier New York (2004) [14] GPVaan Deer Laan AACMBeenackers Catalysis Reviews-SciEng 41(3amp4) (1999) 255 [15] HSchulz Applied Catal A 186 (1999) 3 [16] GP van der Laan AACMBeenackers Applied Catal A 193 (2000) 39 [17] RJOrsquoBrien LXu SBao ARaje BHDavis Applied Catalysis A general 196 (2000) 173 [18] V Roberto Calderone N Raveendran Shiju Daniel Curulla Ferreacute and Gadi Rothenberg Green Chemistry 2011 13 1950ndash1959 [19] E D Smit and B MWeckhuysen Chem Soc Rev 2008 37 2758ndash 2781 [20] Qinghong Z Weiping D Ye W Review Recent advances in understanding the key catalyst factors for Fischer-Tropsch synthesis J Ener Chem 2013 2227ndash38
[21] AY Khodakov WChu P Fongarland Chem Rev 107 (2007) 1692 [22] BHDavis Catal Today 84 (2003) 83 [23] GWHuber SIborra ACorma ChemRev 106 (2006) 4044 [24] J Xu CHBartholomew J Phys Chem B 109 (2005) 2392 [25] HB Zhang GL Schrader JCatal 95 (1985) 325 [26] ES Lox GB Marin E de Graeve P Bussiere Appl Catal A 40 (1988) 197 [27] PSabatier and JDSenderens CRHebdSeance AcadSci 134 514 680 (1902) [28] AMittash AdvCatal 2 (1950) 81 [29] EHoudry WFBurt AEPew WAPeters Pet Refiner 17 (1938) 574 [30] H Pichler AdvCatal 4 (1952) 271 [31] MEDry Chemtech 12 (1982) 744 [32] RBAnderson ACS SympSer 222 (1983) 389 [33] GNatta in ldquoCatalysisrdquo (PH Emmett ed) Vol3 p349 Van Nostrand-Reinhold Priceton New Jersey 1955 [34] GNatta UColombo IPasquon in ldquoCatalysisrdquo (PH Emmet Ed) Vol5 p131 Van Nostrand-Reinhold Princeton New Jersey 1957
Chapter 1 General Introduction
55
[35] RBAnderson Fuel 41 (1962) 295 [36] MJ Baird RRSchehl WPHaynes and JTCobb Ind Eng Chem Prod Res Dev 19 (1980) 175 [37] EIA Annual energy outlook 2013 Available at httpwwweiagovforecastsaeopdf0383(2013)pdf accessed on 16 august 2013 [37a] US Energy Information Administration Available at httpwwweiagovcountriesindexcfmview=reserves accesed on 16 august 2013 [38] MJ Prins KJ Ptasinski FJJG Janssen Fuel Process Technol 86 (2005) 375 [39] Klass DL Biomass for Renewable Energy Fuels and Chemicals Academic Press San Diego CA USA 1998 [40]Beenackers AACM Swaaij WPM Thermochemical Processing of Biomass Butterworth London UK 1984 [41] Demirbas A Energy Educ Sci Technol 17 (2006) 27ndash63 [42] Tijmensen MJA Faaij APC Hamelinck CN van Hardeveld MRM Biomass Bioenergy 23 (2002) 129ndash152 [43]Hamelinck CN Faaij APC den Uil H Boerrigter H Energy 29 (2004) 1743ndash1771 [44] J Hu F Yu Y Lu Catalysts 2 (2012) 303-326 [45] Stassen HEM Knoef HAM Biomass Technology Group University of Twente Enschede The Netherlands 1993 [46] Demirbas A Prog Energy Combust Sci 33 (2007)1ndash18 [47] Demirbas A Energy Sources A 29 (2007) 1507ndash1512 [48] Demirbas A Energy Sources A 30 (2008) 924ndash931 [49] MJPrins KJPtasinski FJJGJanssen Fuel Process Technol 86 (2005) 375 [50] CLIandoli SKjelstrup EnergyampFuels 21 (2007) 2317 [51] JJacometti AEkvall Shell in the Middle East 17 (2002) 1 [52] GCoupe Step on the gas in The Engineer 6 (2004) [53] T Fu Y Jiang J Lv Z Li Fuel Process Technol 110 (2013) 141ndash149 [54] C Brown The Oxford Institute for Energy Studies May 2013 ISBN 978-1-907555-74-9 Available on httpwwwoxfordenergyorgwpcmswp-contentuploads201305WPM-50pdf [55]K MacKenzie Financial Times 30 April 2013 httpftalphavilleftcom201304301473572where-are-all-those-natural-gas-fleet-conversions [56] D Wood C Nwaoha B Towler Journal of natural gas science and engineering 9 (2012) 196-208
Chapter 1 General Introduction
56
[57] Agee K Fundamentals of gas to liquids 2nd ed London Petroleum economist 29 (2005) 30-31 [58] Rahmin II Oil and gas Journal (2005) [59]Rahmin II Gas-to-liquid technologies Recent advances Economics Prospects 26th IAEE Annual International Conference June 2003 Prague Pp 1-36 [60] Minnie R et a 2005 Where it all began In Fundamentals of Gas to Liquids second ed Petroleum Economist London pp 27e29 (Chapter 28) [61] Waddacor M 2005 Converting gas into ultra-clean diesel in three steps In Fundamentals of Gas to Liquids second ed Petroleum Economist London pp 46-49 (Chapter 41) [62] De Klerk A 2012 Gas-to-liquids conversion In Natural Gas Conversion Technologies Workshop of ARPA-E US Department of Energy Houston TX 13 January 2012 [63] Velasco JA Lopez L Velasquez M Boutonnet M Cabrera S Jaras S 2010 Gas to liquids a technology for natural gas industrialization in Bolivia Journal of Natural Gas Science and Engineering 2 (5) 222e228 [64] Pytte T 2005 GTL diesel the way forward In Fundamentals of Gas to Liquids second ed Petroleum Economist London pp 32e35 (Chapter 31) [65] Fleisch TH Sills R Briscoe M Freide JF 2003 GTL-FT in the Emerging Gas Economy Fundamentals of Gas to Liquids Petroleum Economist p 39e41 [66] Corke M 2005 Securing a market In Fundamentals of Gas to Liquids second ed Petroleum Economist London pp 36e38 (Chapter 32) [67] Cherrillo RA Clark RH Virrels IG 2003 Shell Gas to Liquids in the Context of a Future Fuel Strategy e Technical Marketing Aspects 9th Diesel Engine Emissions Reduction Workshop Newport RI 24e28 Aug 2003 [68] Wood DA 2007 Consequences of a heavier and sourer barrel Petroleum Review April ed 30e32
57
Chapter 2 Chemistry of Fischer-Tropsch Synthesis
The FischerndashTropsch (FT) reaction is a heterogeneous catalytic reaction that
converts synthesis gas that is a mixture of carbon monoxide (CO) and
hydrogen (H2) into mainly linear hydrocarbons in the range C1 to C100 It is a
surface polymerization reaction that uses monomers formed by hydrogenation
of adsorbed CO in order to produce hydrocarbons and oxygenated products
with a broad range of chain length and functionality
The chemistry of the process can be described by the set of irreversible and
equilibrium reactions
According to Glasser et al [1] the FischerndashTropsch (FT) reaction mechanism is
still an issue of contention [2 3] Many apparently different mechanisms have
been proposed but common to them all is the concept that a stepwise chain
growth process is involved This is supported by the fact that the carbon
number product distributions calculated on probabilities of chain growth match
the experimentally observed results obtained in different reactor types and
sizes over widely varying process conditions with different catalysts [1]
There are some important aspects related to the FTS that will be discuss in this
chapter to better understand the chemistry of this process
1) FT thermodynamics
2) FT reaction mechanism
3) FT products selectivity
4) FT kinetics
5) Influence of FT process conditions
Chapter 2 Chemistry of Fischer Tropsch Synthesis
58
21 FT Thermodynamics
The Fischer-Tropsch Synthesis is a highly exothermic reaction [4]
n CO + (2n +1) H2 CnH2n+2 + n H2O Hdeg - 40 kcalmol (1)
n CO + 2n H2 CnH2n + n H2O Hdeg - 35 kcalmol (2)
n CO + 2n H2 CnH2n+1 OH + (n-1) H2O Hdeg - 35 kcalmol (3)
Thermodynamically the formation of methane and other hydrocarbons
is energetically favourable that means negative Gibbs energy values for
reaction (1)-(3)
In figure 21 standard Gibbs energy variation for the production of
hydrocarbons and alcohols is reported as a function of temperature
0
80
60
40
20
- 20
- 40
- 60
- 80
- 100
- 120
- 140
500 1000
Temperature K
G
degn
kJ
mol
of
CO
CH3OH
C2H5OH
CH4
C2H6
C2H4
C8H16
C4H8
Figure 21 Standard Gibbs energy of some FTS products [5]
From the diagram reported in figure 21 it can be deduced that methane
formation is highly favoured over that of the alcohols olefins and
hydrocarbons of heavier molecular weight In Fig 21 to keep all of the curves
on the same scale the enthalpy and free energy changes are divided by the
number of carbons atoms in the product Thus the equilibrium constant for
the reaction is given by RTnGnK exp 0
Chapter 2 Chemistry of Fischer Tropsch Synthesis
59
On the basis of thermodynamics a vast variety of molecules can be produced
in synthesis reaction up to 400degC and for some up to 500degC particularly at
elevated pressures including acetaldehyde and higher aldehydes ketones
esters Usually a broad spectrum of types of molecules carbon numbers and
carbon-chains structures is produced and the distribution of molecules
depends on the selectivity of the catalyst employed Generally the reaction
products are not in thermodynamic equilibrium with other product molecules
or reactants
Summarizing it is important to highlight some important aspects of the FT
thermodynamics
It is energetically possible to produce a vast array of hydrocarbons and organic
molecules by the hydrogenation of CO and related process such as the H2 + CO2
and the H2O + 3 CO reactions Most of these reactions are highly exothermic
A variety of reactions of synthesis products are thermodynamically possible
such as dehydration of alcohols hydrogenation of olefins hydrogenolysis of
paraffins and a number of isomerization reactions
On an energetic basis olefins and alcohols can be ldquoincorporatedrdquo into synthesis
reactions to produce higher molecular weight hydrocarbons in any amount
Paraffins element carbon or carbidic carbon can be ldquoincorporatedrdquo into
synthesis reactions to only a limited extent that is part of the carbon of the
hydrocarbon must come from H2 + CO
22 FT Reaction Mechanism
According to [6] FT synthesis follows the polymerization mechanism It is
generally accepted that CO undergoes dissociative or hydrogen-assisted
dissociative chemisorption on the surface of Ru Co or Fe metal or metal
Chapter 2 Chemistry of Fischer Tropsch Synthesis
60
carbide nanoparticles forming CHx (x = 0minus3) intermediates as the monomers
for polymerization The coupling between CHx monomers leads to chain
growth providing CnHm intermediates CnHm intermediates with different
carbon numbers can then undergo hydrogenation or dehydrogenation to
afford paraffins or olefins as the final products An early work pointed out that
the coupling between methylene (CH2) groups mainly accounted for the chain
growth but recent theoretical studies suggested that the situation was more
complicated [7-12] Depending on the identity and the structure of the surface
concerned the monomeric CHx species for polymerization may be different
The calculation of energy barriers suggests that the couplings of (CH+CH)
(C+CH) (C+CH2) or (CHx+HCO) may all be possible [7-12]
Since its discovery many efforts have been made to identify the surface
species that lead to chain initiation and chain growth The FT reaction
mechanism is still an issue of contention
There are some mechanisms like the mechanism proposed by Fischer in 1926
(lsquocarbidersquo theory) but it has a problem he did not explain the production of
relatively large amounts of oxygenated products ie alcohols
According to [13] elementary steps of FTS can be grouped into few basic sets
including
(1) reactant (CO and H2) adsorption
(2) CO activation (or chain initiation)
(3) chain propagation and
(4) chain termination (product formation)
Fig 22 shows possible CO activation steps in the carbide (also referred to as
the alkyl or methylene) and the CO-insertion mechanisms For the classical
carbide mechanism the CO activation step consists of a direct CO dissociation
(ie the C O bond is severed before C is hydrogenated) whereas in the CO-
Chapter 2 Chemistry of Fischer Tropsch Synthesis
61
insertion pathway CO is first hydrogenated and only then is the C O bond
broken to give the chain starter (CH3S) Newer modification of the carbide
mechanism assumes that hydrogen assists in the C O bond scission The
primary difference between the two mechanisms is the type of species being
inserted into the growing chain CHx for the carbide (most often CH2) and
adsorbed CO for the CO-insertion mechanism Storsaeligter et al [14] compared
versions of the two mechanismsndash carbide (including direct and H-assisted CO
dissociation) and CO-insertion ndash using the UBI-QEP (unity bond index ndash
quadratic exponential potential) method [15] and micro-kinetic modeling ofC1
and C2 species formation Their results showed that the chosen CO-insertion
pathway had a lower activation barrier compared to both direct and H-assisted
CO dissociation mechanisms that were utilized Based on these findings they
suggested that the CO-insertion mechanism is likely the main mechanism of
FTS
Fig 22 Examples of CO activation pathways (a) direct CO dissociation (carbide
mechanism) and (b) H-assisted CO dissociation (carbide mechanism) (c) CO hydrogenation (CO-insertion mechanism) [13]
Chapter 2 Chemistry of Fischer Tropsch Synthesis
62
The following Figure (23) [16] shows another representation of the chain
initiation growth and termination deeply find in literature
Chain Initiation
CO C O C O
M M M
+
C
M
H2
CH2
MCH3OH
H2O
INITIATION AND C1 COMPOUNDS
M
+ C
GRAPHITE
OHH
H2
H2
H2CH4
Chain Growth
Chain Termination
Fig 23 Different steps of the reaction mechanism in FTS
Fig 24 shows a simplified scheme for the formation of chain starters and
incorporation into growing chains The CH3 groups formed as a precursor to
methane are assumed to act as chain growth centres Addition of a hydrogen
atom produces methane while insertion of a CH2 group into the metal-carbon
Chapter 2 Chemistry of Fischer Tropsch Synthesis
63
bond of a CH3 group produces an ethyl group and continuation of this type of
reaction gives rise to a spectrum of adsorbed alkyl groups
C CH2CH
H H
CH3H
CH2
R
chain starter
chain growth
(incorporation)
CH3CH3
CH2
H
CH4
R
Fig 24 Simplified kinetic scheme of the successive hydrogenation of surface carbon
yielding chain starters and incorporation into growing chains
The oxygen released by CO dissociation is removed from the catalyst as either
H2O or CO2
As far as hydrogenation process is concerned there is still controversy on the
reaction mechanism first of all it is uncertain if the monomer formation
proceeds via hydrogenation of dissociated or undissociated CO Moreover
methyne methylene and methyl groups are assumed to be in equilibrium by
some authors on the basis of studies with metal clusters containing these as
ligands while others postulate that the hydrogenation of surface carbon and of
CHx species is an irreversible reaction
The nature of primary FT products reflects the nature of the surface bonded
intermediates from which they originate Primary hydrocarbon FT products are
preferentially straight chain terminal olefins and straight chain paraffins The
formation of primary paraffin molecule is represented as
Chapter 2 Chemistry of Fischer Tropsch Synthesis
64
R-CH2-CH2
HR-CH2-CH3
Terminally bonded (alpha) alkyl species on the catalyst surface can be
considered the most common intermediates
Olefin formation is represented as dissociative desorption from the alkyl
species (-elimination)
R-CH2-CH2R-CH=CH2 + H
The ratio probabilities of primary desorption as a paraffin or as an olefin is
commonly 025 That means that the reaction of desorption as a paraffin is
much less probable than the reaction of desorption as an olefin It is suggested
that the chain propagation is favoured against chain termination because of
the principle of lsquoselective inhibitionrsquo ie termination reaction are more
inhibited than propagation reaction by steric hindrance This effect is more
pronounced with paraffin than with olefin formation In fact while paraffin
desorption requiring the reaction between alkyl and H involves two metal
sites olefin desorption need an intermediate ie a transition state with and
bonding at the same metal site
R-CH2-CH2R-CH=CH2
HM M
R-CH=CH2 H
M
+
Chapter 2 Chemistry of Fischer Tropsch Synthesis
65
In both cases however this might not be easily accessible under the condition
of strong competitive chemisorption and strong spatial constraints
Chain termination can also occur by CO insertion into surface alkyls a step that
leads to the formation of predominantly primary alcohols [16]
23 FT Products Selectivity
The products from the FT on Co Fe and Ru show the following characteristics
[17]
1) the carbon-number distributions for hydrocarbons gives the highest
concentration for C1 and decrease monotonically for higher carbons
number although around C3-C4 often a local maximum is observed
2) Monomethyl-substituted hydrocarbons are present in moderate
amounts whereas dimethyl products are present in significantly smaller
amounts than monomethyl None of these branched products contain
quaternary carbons atom on Co Fe and Ru
3) Olefins from iron catalysts exceed 50 of the hydrocarbon products at
low carbon numbers and more than 60 of these -olefins The ethane
selectivity is low in comparison to propene The olefin content decrease
asymptotically to zero with increasing carbon number on Co Ru and Fe
catalysts
4) A change in chain growth parameter in the distribution is only observed
for linear paraffins and not for olefins
5) Yields of alcohols are maximal at C2 and decrease with carbon number
Low yields of methanol are probably the result of thermodynamic
limitations
Chapter 2 Chemistry of Fischer Tropsch Synthesis
66
Investigations of the carbon number spectrum based on the assumption of a
stepwise chain mechanism were carried out in considerable detail by several
authors
Herrington [18] described the distribution of paraffins wax using individual
chain termination probabilities for each chain size and he found that the
probability of chain growth in FT synthesis over a cobalt catalyst did not change
much with the chain length of the hydrocarbon
Anderson investigated the spectrum of a number of different catalysts The
plot of log Wnn against carbon number gave straight line over a fairly large
carbon number range (Wn is the mass fraction and n the carbon number) This
indicated again that the probability of chain growth was fairly constant [18]
Schulz modified and applied to the FT product spectrum the Flory equation
dealing with the product distribution in a polymerization process As pointed
out by Anderson the Schulz-Flory treatment was no different from the earlier
treatment and led to the equation henceforth referred as the Anderson-
Schulz-Flory (ASF) model
Wnn = (1- ) 2
n-1 (1)
where n is the number of carbon atoms in the product Wn is the weight
fraction of product containing n carbon atoms is the chain growth
propagation probability expressed by the equation
= rp (rp + rt) (2)
where rp is the propagation rate constant and rt is the termination rate
constant
The value is independent of carbon number it is estimated by a least-
squares linear regression of the logarithmic form of equation (3) the slope and
intercept both yielding
ln (Wnn) = ln (1-)2 + (n-1) ln (3)
Chapter 2 Chemistry of Fischer Tropsch Synthesis
67
Different factors have an influence on the alpha parameter such as process
conditions type of catalyst and chemical promoters [19 20] The ASF product
distribution as a function of α is depicted in Figure 25
The ASF equation did not distinguish between different product types In
practice a multicomponent product mixture is formed According to the ASF
model the maximum selectivity toward C2minusC4 olefins is achieved with an alpha
value between 04 and 05 One of the most efficient ways of shifting product
selectivity to low alpha values is by increasing reaction temperature However
a decrease on the chain growth probability results in an increase of methane
selectivity as indicated by the ASF product distribution This effect was long
considered a major restriction for the industrial application of the direct
conversion of syngas into lower olefins via the FischerminusTropsch synthesis [21
22] Negative deviations of the ASF model for methane selectivity have been
observed for iron-based catalysts [23 24] Schwab et al [23] proposed that Fe
catalysts possess different catalytic sites some in charge of CminusC coupling for
the growth of the carbon chain and others responsible for methane formation
Fig 25 AndersonminusSchulzminusFlory (ASF) model for the prediction of product distribution
Deviations from ASF Distribution Anderson-Schulz-Flory Distribution is a well-
accepted model for describing product selectivity in FT synthesis especially for
Chapter 2 Chemistry of Fischer Tropsch Synthesis
68
its simplicity nevertheless significant deviations have been noticed and
reported in literature
1) Methane selectivity is in general higher than predicted theoretically by ASF
kinetics Several mechanisms have been postulated to explain these
experimental data [25-26]
2) Anomalies of Ethane and Ethene The maximum C2 selectivity is expected to
be about 30 wt while in practice the maximum found is only about 18 wt It
is commonly observed for iron as well as for cobalt and ruthenium catalysts
that the C2 selectivity is lower than the C1 and C3 selectivity [17]
3) Change in Chain Growth Parameter is defined by ASF model as a
parameter independent of the product carbon number n nevertheless it has
been observed that at a carbon number of about 10 the slope of the
semilogarithmic mole fractions of hydrocarbons against carbon number
increases This phenomenon has been described on iron cobalt and ruthenium
catalysts [27] Suggestions for the increased chain growth parameter or two
probabilities of chain growth are the occurrence of different catalytic sites [28]
or the existence of different chain termination reactions [25] Several attempts
to model hydrocarbon distribution with two different values of have been
reported However the assumption of multiple catalytic sites cannot explain
the decrease of the olefin-to-paraffin ratio with increasing chain length
decreasing space velocity and increasing H2CO ratios in the reactor Kuipers et
al [29] stated that the occurrence of secondary reactions gives the most
reasonable explanation for the deviations from the ASF distribution
24 FT kinetics According to Glasser et al [1] kinetic models of FTS on cobalt iron and
ruthenium catalysts have received considerable attention [30-35] from
Chapter 2 Chemistry of Fischer Tropsch Synthesis
69
researchers in the past but not recently The major problem in describing the
FT reaction kinetics is the apparent complexity of the reaction mechanism and
the large number of species involved When one looks at the kinetic studies in
the literature one finds that there are a variety of rate expressions as well as a
wide range of activation energies for both Co and Fe catalysts This raises
questions about which of these data kinetic parameters and rate expressions
can be relied on for estimating reaction rates andor conducting preliminary
reactor design [36] This strongly suggests that the complex FT reaction
behavior may not be described efficiently by kinetics alone This point is
addressed at a later stage
However the proposed mechanism used a variety of surface species and
different elementary reaction steps resulting in empirical power-law
expressions for the kinetics However also Langmuir-Hinshelwood-Hougen-
Watson (LHHW) and Eley-Rideal type of rate equations have been applied
based on a reaction mechanism for the hydrocarbon-forming reactions In most
cases the rate-determining step was assumed to be the formation of the
monomer These rate expressions for the consumption of synthesis gas mainly
differ in the monomerrsquos nature and in the adsorption of CO H2 and products
(H2O and CO2) on the catalyst surface Ideally the development of kinetic rate
expressions should be based on each possible rate determining process in a
well-defined mechanistic scheme in the hydrocarbon forming reactions Kinetic
studies of the consumption of synthesis gas on cobalt and in particular way
iron catalysts will be discussed in detail in this chapter Kinetic models which
describe the rate of formation of products and the water gas shift reaction will
not be discussed here their studies are reported in [17 37]
1) Overall conversion of synthesis gas
Chapter 2 Chemistry of Fischer Tropsch Synthesis
70
The kinetic rate equations presented for the synthesis-gas consumption do not
present a uniform picture In general the FT synthesis is simplified as a
combination of the FT reaction and the water-gas-shift reaction
CO + (1 + m2n) H2 1n CnHm + H2O (RFT) (4)
CO + H2O CO2 + H2 (RWGS) (5)
where n is the average carbon number and m is the average number of
hydrogen atoms of the hydrocarbon products Water is a primary product of
the FT reaction and CO2 can be produced by the water-gas-shift reaction
(WGS) Iron based catalysts show a high WGS activity unlike Co and Ru based
catalysts That is reflected by the different kinetic expressions
Kinetic equation can be based on the overall synthesis gas consumption (-
RH2+CO = -RCO ndash RH2) which is independent of the WGS equilibrium or based on
CO consumption to hydrocarbon product (RFT = -RCO ndash RWGS) The rate of
synthesis gas consumption only differs from the FT reaction rate by reaction
stoichiometry -RH2+CO = (2 + m2n) RFT The kinetic rate equations presented for
the synthesis gas consumption do not present a uniform picture Table 21 [17]
gives an overview In general catalyst composition as well as reaction
conditions determine the numerical values of the intrinsic rate parameter
Moreover the rate equations are not identical thus k can be decomposed of
different combinations of kinetic and adsorption constant There is
experimental evidence that the FT activity of Fe and Co depends on the
preparation method metal loading of the catalyst and catalyst support
Table 21 Reaction rate equation for overall synthesis gas consumption rate
proposed in Ref [17]
Chapter 2 Chemistry of Fischer Tropsch Synthesis
71
Kinetic
expression
type
Kinetic expression
(a) 2HkP
(b) b
CO
a
H PkP2
(c) OHCO
COH
aPP
PkP
2
2
(d) OHHCO
COH
aPPP
PkP
22
2
2
(e) 2
2
2
2
1 HCO
COH
PaP
PkP
(f) 2
2
COCO
COH
aPP
PkP
(g) 22
2
COOHCO
COH
bPaPP
PkP
(h) 22121
2121
2
2
1 HCO
HCO
bPaP
PkP
(i) 221
21
2
2
1 HCO
HCO
bPaP
PkP
(h) 21
2
CO
HCO
bP
PkP
25 Influence of FT process conditions
A Temperature
Chapter 2 Chemistry of Fischer Tropsch Synthesis
72
The influence of temperature on the selectivity is considerable for all FT
catalysts As the operating temperature is increased the product selectivity
shifts to products with a lower carbon number on iron ruthenium and cobalt
catalysts Increasing the temperature the CO conversion increases but the
WGS reaction increases too mainly with iron based catalysts
B Partial pressure of H2 and CO
Most studies show that the product selectivity shifts to heavier products and to
more oxygenates while increasing total pressure Increasing H2CO ratios in the
reactor results in lighter hydrocarbons and lower olefin content Donnelly and
Satterfield [38] observed a decreased of the olefin to paraffin ratio from 6 to 1
by increasing the H2CO ratio from 03 to 4 Sufficiently high CO pressures
inhibit secondary reactions ie olefin isomerization hydroformilation
hydrogenation and oligomerization
C Space Velocity
The influence of space velocity of the synthesis gas (residence time) on the
selectivity has been investigated The increase of the olefin to paraffin ratio
with increasing space velocity (thus a decrease of the conversion) was
observed The selectivity to methane and olefins decreases with a decrease of
the space velocity whereas the selectivity toward paraffins remains
unchanged These findings can be ascribed by an enhancement of secondary
reactions as the residence time and the concentration of reactive -olefins
increase within bed interstices and catalyst pellets [17]
D Time-on-stream
It is known that catalyst deactivation may occur at reaction conditions and that
may affect the activity and selectivity of a catalytic system An increase of the
Chapter 2 Chemistry of Fischer Tropsch Synthesis
73
methane selectivity and low molecular weight products is observed on iron
catalyst [17] These selectivity changes can be ascribed to carbonaceous
deposits formed on sites with potassium promoters Moreover sintering leads
to a reduction of the surface area hence lowering the catalyst activity High
water pressures enhance agglomeration of initially small crystallites
E Conversion
The influence of CO conversion on the reaction selectivity must be related to
the decrease of CO partial pressure and the increase of water partial pressure
with high levels of conversion Low CO partial pressures (ie high CO
conversion) imply that secondary hydrogenation reaction are less inhibited
hence olefins are hydrogenated to inactive paraffins so that olefin selectivity
decreases Moreover secondary-cracking reactions may occur especially if high
temperature is adopted to increase conversion hence methane selectivity
increases
A schematic view of the general influence of different parameters on the
selectivity is given in Table 22
Table 22 Selectivity control in F-T synthesis by process conditions ( =
increase with increasing parameter = decrease with increasing parameter
= complex relation) From [17]
Parameter Chain Lenght
Chain branching
Olefin Selectivity
Alcohol Selectivity
Carbon deposition
Methane Selectivity
Temperature Pressure H2CO Conversion Space Velocity
Chapter 2 Chemistry of Fischer Tropsch Synthesis
74
References
[1] David Glasser Diane Hildebrandt Xinying Liu Xiaojun Lu and ornelius M Masuku Current Opinion in Chemical Engineering 2012 1296ndash302 [2] Gaube J Klein H-F J Mol Catal A Chem 2008 28360-68 [3] Davis BH Catal Today 2009 14125-33 [4] RBAnderson Academic Press (Harcourt Brace Jovanovich Publishers (1984) Chapter 2 [5] RBAnderson CBLee JCMachiels CanJChemEng 54 (1976) 590 [6] Qinghong Z Weiping D Ye W J Ener Chem 2013 2227ndash38 [7] Ciobıca I M Kramer G J Ge O Neurock M van Santen R A J Catal 2002 212(2) 136 [8] Cheng J Gong X Q Hu P Lok C M Ellis P French S J Catal 2008 254(2) 285 [9] Lo J M H Ziegler T J Phys Chem C 2007 111(35) 13149 [10] Cheng J Hu P Ellis P French S Kelly G Lok C M J Phys Chem C 2008 112(15) 6082 [11] Cao D B Li Y W Wang J G Jiao H J J Mol Catal A 2011 346(1-2) 55 [12] Zhao Y H Sun K J Ma X F Liu J X Sun D P SuH Y Li WX Angew Chem Int Ed 2011 50(23) 5335 [13] B Todic Wenping M G Jacob BH Davis Dragomir B Bukur Catal Today (2013) httpdxdoiorg101016jcattod201308008 [14] S Storsaeligter D Chen A Holmen Surf Sci 600 (2006) 2051ndash2063 [15] E Shustorovich H Sellers Surf Sci Rep 31 (1998) 1ndash119 [16] C Pirola PhD 2007-2008 Novel supported iron based Fischer-Tropsch catalysts Preparation characterization and applications [17] GPVan Der Laan AACM Beenackers CatalRev-SciEng 41 (3amp4) (1999) 255 [18] APSteynberg MEDry (Editors) Fischer Tropsch Technology Studies in surface science and catalysis 152 (2004) p623 [19] Hirsa M Torres Galvis and Krijn P de Jong ACS Catal 2013 3 2130minus2149 [20] Abello S Montane D ChemSusChem 2011 4 1538minus1556 [21] Wang C Xu L Wang Q J Nat Gas Chem 2003 12 10minus16 [22] Janardanarao M Ind Eng Chem Res 1990 29 1735minus1753 [23] Schwab E Weck A Steiner J Bay K Oil Gas Eur Mag 2010 1 44minus47 [24] Torres Galvis HM Bitter JH Khare CB Ruitenbeek M Dugulan AI De Jong KP Science 2012 335 835minus838 [25] Sarup and B W Wojciechowski Can J Chem Eng 66 (1988) 831 [26] C H Bartholomew W Lee Stud Surf Sci Catal 130 (2000) 1151 [27] RBAnderson The Fischer Tropsch Synthesis Academic Press inc (1984)
Chapter 2 Chemistry of Fischer Tropsch Synthesis
75
[28] G A Huff Jr and C N Satterfield Ind Eng Chem Process Des Dev 24 (1985) 407 [29] E W Kuipers I H Vinkenburg and H Oesterbeek J Catal 152 (1995) 137 [30] Dry ME Conversion of Syngas to Fuels and Chemicals Int Conf on Catal amp Catal Proc Cape Town South Africa 199357-66 [31] Dry ME Appl Catal A 1996 138319-344 [32] Maitilis PM Quyoum R Long HC Turner ML Appl Catal A 1999 186363-374 [33] Ribeiro FH von Wittenau AES Bartholemew CH Somorjai GA Catal Rev Sci Eng 1997 3949-76 [34] Huff GA Jr Satterfield CN Ind Eng Chem Process Des Dev 1984 23696-705 [35] Zimmerman WH Bukur DB Can J Chem Eng 1990 68292-301 [36] Bartholomew CH Farrauto RJ New Jersey Wiley 2006 [37] DPinna ETronconi LLietti RZennaro PForzatti La Rivista dei Combustibili 56 fasc2 (2002) 69 [38] TJDonnelly and CNSatterfield ApplCatalA 52 (1989) 93
76
Chapter 3 Catalysts for Fischer Tropsch Synthesis
The core of any FT process is its catalyst Only a few metals show catalytic
activity in the FT synthesis [1] As explained before the reaction is generally
assumed to start with the adsorption of CO on the catalyst surface where it
reacts with adsorbed hydrogen to afford a methylene group which in its turn
is responsible for the CndashC chain growth Probably at least two reaction paths
co-exist for the initial steps of the FT reaction one in which carbon monoxide is
adsorbed in a dissociative way (ie its CndashO bond is cleaved before any possible
reaction with hydrogen) and another in which some hydrogenation by
adsorbed hydrogen atoms precedes the CndashO cleavage [2]
So a good catalyst should adsorb both CO possibly in a dissociative way and
H2 Furthermore since metal oxide formation is always possible under FT
conditions either by dissociative CO absorption or by metal reaction with co-
produced water the metal oxide should be easily reduced under the reaction
conditions With this respect most early transition metals are not good FT
catalysts because despite their favorable CO adsorption they form very stable
oxides that are not reduced under FT conditions Iridium platinum and
palladium adsorb CO in a non-dissociative manner while metals of groups 11
and 12 hardly adsorb it none of them is an effective FT catalyst The specific
activities (ie the reaction rates per unit surface area of metal) of most of the
metals of the former Group VIII (all but osmium) were assessed under
comparable conditions and ruthenium proved to be the most active catalyst
As expected on the basis of the classical work by Sabatier (1902) nickel (and
even to a larger extent palladium) showed very high selectivity towards
Chapter 3 Catalysts for Fischer Tropsch Synthesis
77
methane formation obviously a feature not appreciated in a FT catalyst [2]
Osmium was successively evaluated but turned out to be ca 100 times less
active than ruthenium So the best FT catalysts are based on iron cobalt and
ruthenium with nickel rhodium and osmium (and possibly rhenium) being
moderately active (Fig 31) [3]
Fig 31 Catalytic activity of transition metals in the FT reaction Blue denotes early transition metals able to adsorb CO in a dissociative way they however show poor or no capability to adsorb H2 and their oxides are not reduced under usual FT conditions
accordingly these metals are not active FT catalysts Orange denotes late transition metals and a few main group elements which show poor or no CO adsorption and no FT activity Yellow shaded elements have good H2 adsorption capability and reducible oxides they however adsorb CO in a non-dissociative way and as a matter of fact are poor FT catalysts Brilliant green denotes the best FT catalysts Nickel rhodium
osmium and possibly rhenium (pale green) are moderately active [3]
However FT industrial plants require huge amounts of catalyst and ruthenium
is too rare and expensive to be used on this scale As a matter of fact cobalt
and iron are the only metals of choice for industrial applications Iron is
obviously cheaper than cobalt but to select between them a key issue is the
carbon feedstock Iron is a good water gas shift catalyst and for this reason is
particularly suitable for hydrogen-poor syngas such as those obtained from
coal or biomasses Cobalt performs better with an almost stoichiometric ratio
between hydrogen and carbon monoxide so it is preferred when the carbon
feedstock is natural gas Alternatively cobalt can also be used with hydrogen-
poor syngas provided that the H2CO molar is adjusted by a WGS unit between
the gasification and the FT reactors [1]
Chapter 3 Catalysts for Fischer Tropsch Synthesis
78
Apart from methane (which usually forms in amounts higher than expected)
the FT products distribution follows the AndersonndashSchulzndashFlory model [2] So
the FT output is always a complex mixture of products ranging from methane
to waxes formed by high molecular weight linear paraffins as explained before
A proper choice of catalyst and reaction conditions allows tuning to some
extent the composition of the final mixture but it is impossible to force the
process to produce selectively a well-defined range of products ie middle
distillates So the best strategy to maximize diesel production is to select
conditions which allow obtaining the maximum amount of long chain linear
paraffins that can be then fed to a hydrocracking stage transforming them into
a most valuable fuel
Cobalt and iron are the metals which were proposed by Fischer and Tropsch as
the first catalysts for syngas conversion Both cobalt and iron catalysts have
been used in the industry for hydrocarbon synthesis A brief comparison of
cobalt and iron catalysts [4] is reported in Table 31 Cobalt catalysts are more
expensive but they are more resistant to deactivation Although the activity at
low conversion of two metals is comparable the productivity at higher
conversion is more significant with cobalt catalysts Water generated by FT
synthesis slows the reaction rate on iron to a greater extent than on cobalt
catalysts At relatively low temperatures (200 - 250degC) chain growth
probabilities of about 094 have been reported [5] for cobalt-based catalysts
and about 095 for iron catalysts The water-gas shift reaction is more
significant on iron than on cobalt catalysts [4]
Iron catalysts usually produce more olefins Both iron and cobalt catalysts are
very sensitive to sulphur which could readily contaminate them For iron-
based catalysts the syngas should not contain more than 02 ppm of sulphur
For Co catalysts the amount of sulphur in the feed should be much less than
Chapter 3 Catalysts for Fischer Tropsch Synthesis
79
01 ppm Cobalt catalysts supported on oxide supports are generally more
resistant to attrition than iron co precipitated counterparts they are more
suitable for use in slurry-type reactors Iron catalysts produce hydrocarbons
and oxygenated compounds under different pressures H2CO ratios and
temperatures (up to 340degC) Cobalt catalysts operate at a very narrow range of
temperatures and pressures an increase in temperature leads to a spectacular
increase in methane selectivity Iron catalysts seem to be more appropriate for
conversion of biomass-derived syngas to hydrocarbons than cobalt systems
because they can operate at lower H2CO ratios [4]
Table 31 Comparison of Cobalt and Iron FT catalysts [4]
Parameter Cobalt catalyst Iron Catalyst
Cost More expensive Less expensive
Lifetime
Resistant to deactivation Less resistant to deactivation (coking carbon deposit iron carbide)
Activity at low conversion comparable
Productivity at high conversion
Higher less significant effect of water on the rate of CO conversion
Lower strong negative effect of water on the rate of CO conversion
Maximal chain growth probability
094 095
Water gas shift reaction Not very significant more noticeable at high conversion
Significant
Maximal sulphur content lt 01 ppm lt 02 ppm
Flexibility (temperature and pressure)
Less flexible significant influence of temperature and pressure on hydrocarbon selectivity
Flexible CH4 selectivity is relatively low even at 340degC
H2CO ratio 2 05-25
Attrition resistance Good (always supported) Not very resistant if not
supported
Chapter 3 Catalysts for Fischer Tropsch Synthesis
80
A large number of studies have pointed out that various factors can influence
the catalytic behaviors of a FT catalyst As summarized in Table 32 besides the
engineering factors such as reactor design and operation conditions [6-10]
there exist many catalyst factors which can exert significant influences on the
activity and product selectivity
Table 32 Typical key factors influencing the activity and product selectivity of a FT
catalyst [11]
Engineering factors Catalyst factors
(i) Reactor design
(ii) Operation
conditions
(i) identity of active metal (Ru Co or Fe) (ii) chemical state of active phase (metal oxide or carbide) (iii) support (identity pore structure physicochemical properties) (iv) promoter (typically including noble metals oxides of Mn Zr or rare earth metals alkali metal ions) (v) size of active phase (vi) microenvironment of active phase
31 Iron and Cobalt industrial FT catalysts i) Iron catalysts With iron catalysts two directions of selectivity have been
pursued One direction has aimed at a low molecular weight olefinic
hydrocarbon mixture to be produced in an entrained phase or fluid bed process
(Sasol Synthol process) Due to the relatively high reaction temperature
(340degC) the average molecular weight of the product is so low that no liquid
product phase occurs under reaction conditions The catalyst particles moving
around in the reactor are small (dp =100 mm) [12] and carbon deposition on
the catalyst does not disturb reactor operation Thus low catalyst porosity with
Chapter 3 Catalysts for Fischer Tropsch Synthesis
81
small pore diameters as obtained from fused magnetite (plus promoters) after
reduction with hydrogen is appropriate For maximising the overall gasoline
yield the olefins C3 C4 have been oligomerised at Sasol However recovering
the olefins for use as chemicals in eg polymerisation processes is
advantageous today [13]
The second direction of iron catalyst development has aimed at highest
catalyst activity to be used at low reaction temperature where most of the
hydrocarbon product is in the liquid phase under reaction conditions Typically
such catalysts are obtained through precipitation from nitrate solutions A high
content of a carrier provides mechanical strength and wide pores for easy mass
transfer of the reactants in the liquid product filling the pores The main
product fraction then is a paraffin wax which is refined to marketable wax
materials at Sasol however also can be very selectively hydrocracked to a high
quality Diesel fuel Thus iron catalysts are very flexible Selective FT synthesis of
linear terminal olefins seems only possible with iron catalysts Alkalised iron FT
catalysts exhibit water gas shift activity (in contrast to cobalt catalysts) This is a
favourable feature for FT synthesis with CO-rich syngas as obtained from high
temperature coal- or heavy-oil-gasification through partial oxidation (H2CO
molar ratio =10) however it is undesirable for FT synthesis with hydrogen-rich
syngas as produced from natural gas The activity of iron catalysts decreases
through product inhibition by water [14] This feature restricts the attainable
degree of conversion and leads to gas recycle operation after water removal
together with the organic condensate
ii) Cobalt catalysts Cobalt catalysts have been applied in the first FT plant of
Ruhrchemie in 1935 Present catalyst design makes use of several preparation
techniques however the intention to produce a well-dispersed cobalt phase in
a wide pore support remains the same Today cobalt catalysts for FT Diesel
Chapter 3 Catalysts for Fischer Tropsch Synthesis
82
production from natural gas are designed for a maximum wax selectivity the
waxy product then being the feed for hydrocracking Hydrocracking of FT
paraffins follows the kinetic regime of lsquoideal hydrocrackingrsquo as observed by
Schulz and Weitkamp [15] always the largest molecules are cracked selectively
and no secondary cracking occurs With cobalt catalysts olefin readsorption on
FT sites takes place and this contributes significantly to the desired high wax
selectivity This implies that olefin secondary hydrogenation and double bond
shift should be kept low Diesel fuel selectivity approaching 80 can be
obtained by the process combination FT synthesishydrocracking [15]
32 Chemical State of active phase As explained before the typical active metals used for FT synthesis are Fe Co
and Ru According to [11] the current consensus is that metallic Co and Ru ie
Co0 and Ru0 nanoparticles function as the active phases for CO hydrogenation
to heavier hydrocarbons whereas iron carbides are responsible for CO
hydrogenation [16] However deeper knowledge about the effects of different
chemical states of these active phases on catalytic performances is still needed
for the rational design of an efficient FT catalyst
21 Co-based catalysts
Metallic Co may exist in two different crystalline forms ie fcc and hcp
phases For bulk Co the hcp phase is more stable at lower temperatures but
the fcc phase becomes more stable when the size of Co particles becomes less
than 20 nm [17] However the actual crystalline structure of Co catalyst under
working conditions is not well known The formation of Co2C may cause the
catalyst deactivation Another recent work also demonstrated that the
deactivation of Co-based catalyst was due to the carbide formation and carbon
deposition [18] The prolonging of the time on stream caused the partial
Chapter 3 Catalysts for Fischer Tropsch Synthesis
83
decomposition of the bulk Co2C to Co0 and increased the conversion of CO and
the selectivity to heavier hydrocarbons
22 Fe-based catalysts
Iron carbides are easily formed under FT reaction conditions because of the
lower or similar activation energy for iron carbide formation as compared with
that of CO hydrogenation Many types of iron carbides such as ε-Fe2C ε_ -
Fe22C Fe7C3 χ-Fe5C2 and θ-Fe3C all have been observed in FT synthesis [19-
20] However the true active species under working conditions remains still
unsettled Many studies have been devoted to characterizing the active iron
carbide phase Because the carburized iron catalysts are very sensitive to air
exposures even under controlled passivation [21] the in situ or operando
characterizations under working conditions are quite important
33 Size of active phase According to [11] the size of the active phase is one of the most important
factors determining the catalytic behaviors of a heterogeneous catalyst [23]
For Co-based catalysts Iglesia once analyzed data obtained over different
metal oxide-supported Co catalysts and the results suggested that the
turnover frequency (TOF) for CO conversion ie the amount of CO converted
per surface Co per time was independent of the size of Co particles loaded on
different metal oxides in a Co-size range of 9minus200 nm [24] The selectivity to
CH4 was higher over the catalysts with smaller Co particles and decreased with
increasing Co size particularly in the range of 26minus8 nm C5+ selectivity
increased with the mean size of Co nanoparticles monotonically and the
increase became insignificant when Co size exceeded 6minus8 nm Thus Co-
catalyzed FT synthesis is a structure sensitive reaction in the Co-size range of
lt10 nm Size effect studies for Ru- and Fe-based catalysts are not numerous A
Chapter 3 Catalysts for Fischer Tropsch Synthesis
84
few early studies pointed out the increase in TOF for CO hydrogenation with
increasing the size of Ru or Fe particles (or decreasing the metal dispersion)
[25-27]
In general the results obtained for many Co- and Ru-based catalysts all indicate
that the TOF for CO conversion increases with the size of metal nanoparticles
up to a critical point (6minus10 nm) and then changes slightly For Fe-based
catalysts the results are still inconsistent
References
[1] C Perego MRicci Catalysis Science amp Technology 2012 2 1776ndash1786 [2] P M Maitlis V Zanotti Chem Commun 2009 1619ndash1634 [3] C Perego R Bortolo and R Zennaro Catal Today 2009 142 9ndash16 [4] AY Khodakov W Chu P Fongarland ChemRev 107 (2007) 1692 [5] B Jager Stud Surf Sci Catal 119 (1998) 25 [6] Luque R de la Osa A R Campelo J M Romero A A Valverde J L Sanchez P Energy Environ Sci 2012 5(1) 5186 [7] Hao X Dong G Q Yang Y Xu Y Y Li YW Chem Eng Technol 2007 30(9) 1157 [8] van Steen E Claeys M Chem Eng Technol 2008 31(5) 655 [9] Davis B H Ind Eng Chem Res 2007 46(26) 8938 [10] Gao J H Wu B S Zhou L P Yang Y Hao X Xu Y Y Li Y W Chin J Catal (Cuihua Xuebao) 2011 32(12) 1790 [11] Qinghong Z Weiping D Ye W Review J Ener Chem 2013 2227ndash38 [12] OGMalan JDLouw LCFerreira Brennstoff-Chem 42 (1961) 209 [13] AP Steynberg RL Espinoza B Jager AC Vosloo ApplCatalA 186 (1999) 41 [14] ME Dry JR Anderson M Boudart (Eds) Catalysis Science and Technology M Springer Berlin (1981) 159 [15] HSchulz Appl Catal A 186 (1999) 3 [16] Zhang Q H Kang J C Wang Y ChemCatChem 2010 2(9)1030 [17] Kitakami O Sato H Shimada Y Sato F Tanaka M Phys Rev B 1997 56(21) 13849 [18] Tan K F Xu J Chang J Borgna A Saeys M J Catal 2010 274(2) 121 [19] De Smit E Weckhuysen B M Chem Soc Rev 2008 37(12) 2758
Chapter 3 Catalysts for Fischer Tropsch Synthesis
85
[20] Zhang Q H Kang J C Wang Y ChemCatChem 2010 2(9) 1030 [21] Janbroers S Louwen J N Zandbergen H W Kooyman P J J Catal 2009 268(2) 235 [22] PJ Van Berge J Van de Loosdrecht JCaricato EA Barradas Patent WO 9942214 [23] Zhang Q H Deng W P Wang Y Chem Commun 2011 47(33) 9275 [24] Iglesia E Appl Catal A 1997 161(1-2) 59 [25] Kellner C S Bell A T J Catal 1982 75(2) 251 [26] Jones V K Neubauer L R Bartholomew C H J Phys Chem 1986 90(20) 4832 [27] Boudart M McDonald M A J Phys Chem 1984 88(11) 2185
86
Chapter 4 Experimental FT plant and analytical methods
Two different FTS units were used in this PhDrsquos research work in order to
homologate some results The first one is located at the Universitagrave degli Studi
di Milano in Italy while the second one is located at the Universidad Central de
Venezuela in Venezuela Following there is the description of both FTS unit
First FTS Unit (Unit 1) Universitagrave degli Studi di Milano in Italy
FT reaction tests were performed into a fixed bed reactor (di =06 cm l = 56
cm) using 1 g of fresh catalyst mixed with 1 g of diluting material (-Al2O3
Fluka) This diluting material must be inert for FT and a good thermal conductor
to control the process temperature [1] The catalysts were tested after their
activation in a 468 NmL min-1 flow of syngas with H2CO ratios of 21 (total
flow = 468 Nml min-1) and nitrogen as internal analytical standard (flow = 50
NmL min-1) at P = 20 bar and temperature range between 220-260degC for a
duration between 20 and 90 h in continuous Analyses of the gas-phase
products (C1-C7) were performed with an on-line micro-gaschromatograph
(Agilent) measurements were carried out every 60 min during the reaction
Liquid products were collected in a trap (V=400mL) operating at 5degC and at the
same pressure of the reactor (20 bar) and analyzed by a gas chromatograph
(Agilent) equipped with a Porapack-Q columns (able to separate C7-C30
hydrocarbon fraction) after the reaction duration The aqueous phases
collected in the cold trap were analyzed by a TOC (Schimadzu) for the
quantification of carbonaceous species dissolved in water Using all the data
87
collected for each run a mass molar balance has been verified with a
maximum error of plusmn 5moles
Second FTS Unit (Unit 2) Universidad Central de Venezuela in Caracas-
Venezuela)
FTS was performed in a continuous flow system with a fixed bed stainless-steel
reactor (di =095 cm l = 30 cm) The reactor was loaded with 03 g of fresh
catalyst mixed with 03 g of see sand as a diluting material [2] The calcined
catalysts were initially reduced in situ by flowing hydrogen for 4 hours at 900
Nml˙min-1 350degC and 08 MPa After the reduction step the temperature was
lowered to 220degC under H2 They were then tested in the standard conditions
by flowing syngas (H2 CO N2 63325 vv N2 as internal standard) at 156
Nml˙min-1 increasing the system pressure slowly up to 20 MPa and 220-260degC
Once the reaction temperature was achieved the reaction was led to proceed
during a period of 280 h
During reaction the reactor effluent passed through a hot trap kept at 150degC
and 02 MPa to collect waxes and the products leaving this trap were passed
through a second trap kept at 0degC and 02MPa to collect the lighter products
(water alcohols and hydrocarbons) The analyses were performed in various
chromatographs according to the nature of the sample to be analyzed
Permanent gases and light hydrocarbons were analyzed on-line in a
PerkinElmer 3000GC Autosystem fitted with TCD detectors using a Carbosieve
SII Supelco column The liquid products (collected at 150ordmC and 0ordmC) were
weighted and analyzed in a PerkinElmer chromatograph fitted with a 50m long
Alumina RT capillary column connected to a FID
A mass molar balance was performed for each FT run resulting in a maximum
error of plusmn 5moles
88
41 FT Laboratory plant a) First FTS unit (Unit 1)
As explained by Pirola [3-5] the experimental tests were performed in a
laboratory plant with a tubular reactor (made by ldquoRenato Brignolerdquo Company)
with a fixed bed of catalyst vertically placed The feed (CO H2 and N2 as
internal standard) is prepared in situ mixing three different flow of pure CO
pure H2 and pure N2 using three different flow meters Then the feed goes into
the catalytic reactor from the top part reacts with the catalyst and then the
reacted flow comes out from the lower part The plant pipes are heated till the
cold trap to avoid the heavy products condensation In this cold trap cooled at
5degC the heavy products and the water condense The not reacted gas and the
light hydrocarbons go in a flow meter for their quantification and finally in an
analytical zone where they are analyzed by a micro gaschromatograph In the
condensed liquid in the cold trap there are two phases the first one is an
aqueous phase (in which water and small quantities of light hydrocarbons and
oxygenated compounds are present) and the second one is an organic phase
(in which hydrocarbons in the range C7-C30 are present)
In Fig 41 the detailed flow-sheet of FT plant has been reported
Fig 41 Laboratory plant flow-sheet
89
The key for the Fig41 is the following
1 valve
2 flow meter (Brooks reg mod 5850TR) for H2 and CO operating in the range 0-
100 Nml min-1 for N2 operating in the range 0-20 Nml min-1
3 gas mixer
4 thermocouples for the control of temperature in the catalytic bed in the
reactor and in the heated pipe
5 Tubular reactor
6 Security valve
7 Pressure indicator
8 Pressure control and regulation tool
9 micro GC ldquoAgilent reg 3000 seriesrdquo
10 gas totalizer for the control of the total flow of gas
11 Cold trap operating at 5degC and 20 bar
12 Cooling air for the temperature control of the reactor
13 vent (usually closed)
In figure 42 a photo of the plant is reported
Fig 42 FT laboratory plant
90
In the following paragraphs the main parts of this plant will be described
41a Main parts of the plant 41a1 Apparatus for the regulation and control of temperature pressure and flow of reagents
In the plant the pressure is controlled and regulated by an electronic controller
(Brooksreg) that interacts with a pressure valve able to work till 25 bars (Fig 43)
located after the reactor and the cold trap
Fig 43 Pressure valve
This system can control the plant pressure with a care of 01 bar respect the set
up
The reactor temperature is regulated by a heating oven (Renato Brignole) and
the pipe lines after the reactor are heated at 220degC to prevent the heavy
products condensation by two electrical cables (both with a resistance of 7
m) controlled by a Ascon reg apparatus The CO H2 and N2 flows are regulated
by Brooksreg 5850TR series flow meters (Fig 44)
91
44 Flowmeters for CO H2 N2
In table 41 the main characteristics of these flow meters are reported
Table 41 Flowmeters characteristics
Range
(Nmlmin) IO signal
(vdc) Max Pressure
(Bar)
H2 0-50 0-5 100
CO 0-50 0-5 100
N2 0-20 0-5 100
41a2 FT reactor
The FT plant reactor (Fig 45) has been made by Renato Brignole reg Company
(Legnano Italy) It is a fixed bed tubular reactor with the catalyst vertically
located It is made of AISI 316 stainless steel and in the internal surface of
reactor there is a coaxial copper tube (thickness = 1 mm) to prevent some
catalytic activities of steel and to uniform the heating of reactor The technical
characteristics of reactor are summarized in Table 42
Table 42 Reactor Characteristics
Volume (cm3)
Max operating pressure
(Bar)
Max operating temperature
(degC)
Internal diameter
(mm)
Height (mm)
158 100 400 6 560
92
In this reactor it is possible to charge till 3 g of the mixture catalyst-diluting
material The feed goes into the reactor at the top and goes out from the lower
part The operation of opening and closing of reactor is made using the disks
illustrated in Fig 46 and this is an operation that needs a particular attention
to avoid gases losses or mechanical damage
Fig 45 FT tubular reactor Fig 46 Reactor opening disks
The temperature inside the reactor is monitored by two thermocouples the
first one is vertical and it is inside the catalyst the second one is horizontal and
it is inside the reactor The values of temperatures recorded are quite the same
(max difference = 2degC)
41a3 Cold Trap
The condensation of heavy FT products (mainly hydrocarbons higher than C7
and water) is made using a cold trap in stainless steel able to work at 20 bar
and a T=5degC (Fig 47) The low temperature is maintained by an external
circulation of water coming from a ldquoCrioterm reg 190 iscordquo thermocriostat The
93
volume height and width of the cold trap are respectively 125 ml 100 mm
and 40 mm
Fig 47 Cold trap
The cold trap at the end of each kinetic run is opened and the liquid
condensed inside is quantified and analyzed There are two phases the first
one is an organic phase made by hydrocarbons in the range C7-C30 and it is
analyzed by a GC the second one is an aqueous phases with some organic
mainly oxygenated compounds and the quantification of all the present
carbon is made by a TOC analysis The results obtained in this way give an
average value of all the time of kinetics It is not possible to open the cold trap
during the experiment In fact opening the cold trap the pressure and flow
equilibrium of the plant is broken
41a4 Flow totalizers
The calculation of CO conversion and products selectivity of the plant needs to
know exactly the quantity of gas incoming and out coming Moreover adding
those data to the quantity of liquid condensed in the cold trap and to analytical
data it is possible to verify the mass balance on the plant The calculation of the
mass balance is very important to verify the goodness of the experimental data
collected
94
In FT plant it is possible to quantify all flow passed in a fixed time The incoming
flow of H2 N2 and CO is totalized by the same flow meters that regulate the
flow (Brooks reg Instruments) and the out coming flow (mixture of not reacted
CO and H2 N2 and non-condensed FT products) is totalized by a Ritter reg mod
TG01-5 (Fig 48) instrument
Fig 48 Ritter reg totalizer
42a Analytical instruments
FT plant needs three different analysis for the quantification of the composition
of
i) out coming gas (mixture of not reacted CO and H2 N2 and non-
condensed FT products) by a micro-GC Agilent reg mod 3000A
ii) organic phase of condensed liquid in cold trap (hydrocarbons in the
range C7-C30) by a GC ldquoFison Carlo Erba reg Mod 8000 seriesrdquo and
iii) liquid phase of condensed liquid in the cold trap (water with
hydrocarbon mainly oxygenated dissolved inside) by a Total
Organic Carbon ldquoShimadzu reg mod 5000Ardquo
42a1 micro Gas Chromatograph ldquoAgilent reg mod 3000Ardquo
In the micro GC Agilent reg there are two different columns the first one is a
molsieves module by which it is possible to separate in order of retention
time He H2 Ne Ar O2 N2 CH4 and CO the second one is a OV-1 module
(filled with polydymethylsiloxilane) by which it is possible to separate CO2 and
95
all the hydrocarbons in the range C2-C7 In this instrument the gas sample is
splitted in the two modules and then analyzed in the same time For each
sample then we obtain two different analyses In our application using the first
module the CO N2 and CH4 were quantified with a column temperature of
45degC using the second module CO2 and hydrocarbons were quantified with a
column temperature of 100degC Each module is equipped with a TCD detector
The sensibility limit of the analyses is about 50 ppm for each compound and
the carrier gas is helium The instrument scheme is reported in Fig 59 and the
instrument is represented in Fig 410 An example of analyses is reported in
Fig 411
Fig 49 Agilent Micro GC scheme
Fig 410 Micro GC Agilent
96
Fig 411 Example of Agilent micro GC analyses on FT out coming gas
42a2 Gas Chromatograph ldquoFision Carlo Erba reg Mod 8000 seriesrdquo
In this traditional Gas Chromatograph (GC) equipped with a wide bore Varian
(model VF-1ms) (dymethylpolyxolane) column (length = 25 m diameter = 025
mm) it is possible to separate and quantify the hydrocarbons in the range C7-
C30 The GC detector is a FID with a sensibility limit of about 100 ppm for each
compound and the carrier is helium The column temperature is maintained at
60degC for 3 minutes then heated till 260degC at 7degCmin for 15 minutes after that
heated at 280degC for 40 minutes at 5degCmin and then heated till 310degC for 5
minutes In Fig 412 and 413 the gas chromatograph in its column
97
Fig 412 Example of GC analysis for the quantification of heavy FT products
Fig 413 Wide bore Varian VF-1ms column
42a3 Total Organic Carbon ldquoShimadzu reg mod 5000Ardquo
Using this instrument it is possible to quantify the organic carbon dissolved in
water The sample passes through an oxidation catalyst (Pt) at high
temperature (700degC) and then all the organic carbon is converted to CO2 This
CO2 is then exactly quantified by an IR detector In Fig 414 it can be seen the
instrument
Fig 414 SHIMADZU TOC-5000A
98
43a Analytical instruments calibration
43a1 Flow meters calibration
All flow meters have been calibrated comparing the flow measured by these
instruments and that measured using a ldquosoap-bubblerdquo flow meter at the end of
the plant This calibration has been made using the FT plant both in FT work
condition (T=250degC P=20 bar) and at room condition (T=20degC P=1 bar) For
each flow meter some tests at different flow have been made always in the
range between 0 and 40 Nmlmin For each flow meter a diagram has been
made where the real flow (y) is reported in function of the set-up flow (x) The
result for all the instruments is a straight line (y = ax + b) In Tab 43 the results
for all the instruments have been reported in term of ldquoardquo and ldquobrdquo coefficient
and ldquoR2rdquo value
Tab 43 Flow meters calibrations
Flow meter Calibration conditions a b R2 1 CO T = 20degC P = 1 bar 11364 12727 09996
2 H2 T = 20degC P = 1 bar 1008 -1749 0999
3 N2 T = 20degC P = 1 bar 12744 67994 09935
4 Mix CO H2 N2 T = 20degC P = 1 bar 0968 1816 09998
The conclusion is that the instruments give a very good calibration and their
indications of the flow are quite perfect
43a2 micro GC calibration
This calibration has been made in Cernusco sul Naviglio (MI) in the laboratory
of ldquoSRA Instruments Italiardquo Company This company is an Agilent Technologies
Premier Solution Partner directly present in Italy and France and it is
constantly engaged in research and development of solutions based on
portable and ultra-fast Micro Gas chromatograph (wwwsrainstrumentscom)
99
The calibration has been made analyzing two mixture of certified gas and is
reported by [5]
The calibration of CO2 and light hydrocarbon is a direct calibration As the
volume of gas injected in column is always the same it is possible to calibrate
directly (without an internal standard) the peaks area with the concentration of
different compounds ie the concentration is directly proportional to
chromatographic area In ldquoSRA Instruments Italiardquo all calibration factors fci
(chromatographic area compound concentration) and all retention times
have been found and they are reported in table 44
Table 44 Calibration results for CO2 and light hydrocarbons
Module Compound Retention time
(min) Calibration factor
Molsieves
N2 1007 35119
CH4 1203 27027
CO 1402 45799
OV-1
CO2 0592 16722
Ethane 0624 19230
Propane 0745 25706
I-butane 0918 28248
N-butane 1061 27027
I-pentane 1556 32051
N-pentane 1808 32326
N-hexane 3578 33670
CO quantification has been performed using another calibration
Using these data it is possible to calculate the concentration of each compound
using the formula
iiiv fcareacompound (1)
Nevertheless it is important to remember that in FT plant there is N2 as
internal standard for CO quantification and then the equation (1) must be
corrected because the N2 flow is not to be considered as FT gas
100
FT
totaliiiv
flow
flowfcareacompound (2)
Where
2NtotalFT flowflowflow (3)
To better understand this calculation an example is here reported
If we assume to have a real FT flow of 20 Nmlmin with a CO2 v = 2 it
means to have 04 Nmlmin CO2
If we have 10 Nml minmin of N2 as standard and 30 Nmlmin of FT flow and
we calculate the CO2 percentage using the total flow we obtain
233110030
40vCO making a mistake If we use the correction in the
equation (2) we obtain 20220
30100
30
40vCO
the true value
The CO calibration concerns only the CO and N2 flow The CO is the compound
to be quantified and the N2 is the standard gas in fact N2 is not involved in FT
reactions and it pass through the FT plant without any modification then the
incoming and out coming N2 is the same The necessity with CO to have a
calibration with a standard is explained considering that the CO quantification
gives the CO conversion of FT process then a more accurate measure is
convenient Moreover it is not possible to use N2 as internal standard also for
CO2 and light hydrocarbons because they are not analyzed in the same module
(OV-1) of N2 (molsieves) Another important consideration is that in literature
the CO conversion for FT reactor is always calculated using this method
In this calibration method the ratio (flow CO flow N2) is directly proportional
to ratio (area CO area N2) Using FT plant in reaction conditions (T=250degC
P=20 bar CO = 156 Nmlmin H2 = 312 Nmlmin N2 = 100 Nmlmin) obviously
101
without catalyst inside we have calculated these ratios and the co-relation
between them The results are reported in Table 45
Table 45 CO-N2 calibration results
Flow N2
(Nmlmin) Flow CO
(Nmlmin) Flow H2
(Nmlmin) Area
N2 Area CO
R flow CON2
R area CON2
Rarea Rflow
100 156 312 411142 782455 156 19031 12199
100 156 312 390220 793329 156 20330 13032
100 156 312 388002 794913 156 20487 13133
100 156 312 384672 795362 156 20676 13254
The mean value of ratio between area and flow ratios is 12905 and this is the
calibration factor (fc) for the system as reported in the equation (4)
flowN
COflowf
areaN
COareac
22
(4)
then the CO flow out coming from the FT plant is
29051
2
2
flowN
areaN
COareaflowCOout (5)
finally the CO conversion is
100xflowCO
flowCOflowCOonCOconversi
in
outin (6)
The H2 calibration
To optimize the kinetic model of the FT synthesis was necessary to develop a
measurement method to quantify the hydrogen leaving the plant For this it
was performed a calibration of the micro-gas chromatograph using N2 as
standard in different streams of H2
To identify and quantify the hydrogen it is necessary to change the carrier in
the micro-gas chromatograph (from He to Ar)
Using Argon as a carrier the response of the micro-GC is about ten times
smaller than the response compared with He For this reason it has been
102
necessary to modify the injection time for the analysis and set to 40ms instead
of the usual 30ms
In Table 46 and Fig 415 are shown the results relating to the calibration of the
system H2-N2
Table 46 H2-N2 calibration results
Flow N2 (Nmlmin)
Flow H2 (Nmlmin)
F H2 F N2 Area N2 Area H2 A H2 A
N2
20 3 015 31511 33480 1062
20 35 0175 29525 36348 1231
20 41 0205 28420 40995 1442
20 49 0245 26747 45908 1716
20 56 028 20897 41151 1969
20 61 0305 20748 44040 2123
Fig 415 Calibration results for the micro-GC for the system H2 ndashN2
From the equation of the straight line is obtained a correction factor equal to
70018
By this correction factor (Fc) is possible to deduce the flow of the H2 outflowing
from the reactor and its conversion during the reaction using the following
equation
103
1002
222
in
outin
FlowH
FlowHFlowHHconversion
The calculation set to detect the flow of H2 in output is based on the fact that
the ratio between the areas H2N2 is equal to the ratio between the respective
flows multiplied by Fc (correction factor) according to the following equation
2
2
2
2
FlowN
FlowHFc
AreaN
AreaH
So from this equation it is possible to determine the flow of H2 at the out of the
reactor
00187
2
2
22
FlowN
AreaN
AreaHHFlow OUT
In Fig 416 is shown an example of a gas chromatographic analysis of hydrogen
Fig 416 Gas chromatographic analysis of a system H2-N2
43a3 GC calibration
In this instrument as before discussed it is possible to analyze the heavy
hydrocarbons condensed in the cold trap Obviously for their quantification we
need a calibration with some standard compounds because the detector
quantification is not the same for all the species For this reason the equation
j
j
i
i
mol
area
mol
area (7)
it is not correct and we must use
104
j
j
j
i
i
i Fmol
areaF
mol
area
(8)
where Fi and Fj are the calibration factor for the compound i and j respectively
The calibration method used is the ldquointernal standard methodrdquo in which one of
the compounds to be analyzed is chosen as internal standard and his
calibration factor (F) is established equal to 1 N-heptane has been chosen as
internal standard because it is normally present in FT products Analyzing a
calibration hydrocarbon mixture it is possible to calculate the calibration factor
of all the hydrocarbon present inside this mixture using the following
equation
i
i
j
j
jiarea
mol
mol
areaFF
(9)
The composition of the calibration mixture is reported in table 47 and the
calibration results in table 48
In FT runs all hydrocarbons in the range C1-C19 were obtained To find the
calibration factor and the retention times of hydrocarbons not present in the
calibration mixture an interpolation calculation was made In the following
figure are reported the diagram of the calibrations factors (Fig 417) and of the
retention times (Fig 418) in function of carbon number Starting from these
experimental results an interpolation curve were calculated and then the
calibrations factors and retention times for each carbon number was calculated
too The results are reported in Table 49 It is important to outline that for
each single carbon number there is only one calibration factor for all the
isomers as they are not well separated by the GC column and the detector
answer for the isomers is the same
105
Table 47 Composition of GC calibration mixture
Hydrocarbon PM (gmol) Quantity (g) Mol
n-Heptane (C7) 1002 0229 02295
Nonane (C9) 12826 02389 01871
Decane (C10) 14228 01284 00906
Undecane (C11) 15631 01197 00769
Dodecane (C12) 17033 01139 00672
Tridecane (C13) 18436 01202 00655
Tetradecane (C14) 1984 01577 00798
Pentadecane (C15) 21241 01123 00531
Hexadecane(C16) 22644 01817 00806
Octadecane (C18)
2545 00919 00363
Nonadecane (C19) 26852 00895 00335
106
Table 48 GC calibration results
Mix Mol
Chromatographic areas
Fc mean Analysis
1
Analysis
2
Analysis
3
Analysis
4
Analysis
5
C7 0229522 7763 9384 881 9036 8981 100
C9 018706 16343 16475 15226 13896 15051 047
C10 0090631 8463 88707 7902 7588 7856 043
C11 0076907 8716 7627 8235 7916 8239 036
C12 0067157 8485 7313 8137 7709 8168 032
C13 0065478 847 7654 8253 7859 8271 031
C14 0079826 11095 9689 10988 9685 11042 029
C15 0053096 8309 819 8876 8844 8535 024
C16 0080586 12395 11571 12863 12834 13014 025
C18 0036265 6059 6061 6679 6817 659 022
C19 0033474 6134 5958 6527 6663 6549 020
Fig 417 GC calibration factor vs carbon number
107
Fig 418 GC retention time vs carbon number
Table 49 GC Calibration factor and retention times for all the hydrocarbons C7 ndash C30
Carbon number Fi Retention time (min)
7 0997 0975
8 0649 3431
9 0497 5887
10 0412 8343
11 0358 10799
12 0320 13255
13 0293 15711
14 0272 18167
15 0255 20623
16 0241 23079
17 0230 25535
18 0220 27991
19 0212 30447
20 0205 32903
21 0199 35359
22 0194 37815
23 0189 40271
24 0185 42727
25 0181 45183
26 0178 47639
27 0175 50095
28 0172 52551
29 0170 55007
30 0167 57463
108
43a4 TOC calibration
The detector of the instrument (type NDIR) is able to analyze and quantify by
means of infrared spectroscopic technique the CO2 produced by the sample
For this calibration is not necessary to use a standard equal to the analyte (in
the case of the synthesis of FT the carbonaceous species dissolved in water)
but it is necessary to use a stable standard such as potassium hydrogen
phthalate because due to its physical nature (solid) is therefore inherently
more reliable than a liquid and allows the exact correlation between the ppm
of carbon present in solutions of standards and the areas provided by the
instrument after analysis
There were prepared different solutions at known concentrations (200 and 100
ppm) from a stock solution of 300 ppm obtained by dissolving 031895 g in
100ml of distilled water
Standard solutions were corrected by a correction factor f according to the
following equation
masssampleltheoretica
masssamplerealf (10)
The calculated value of f is equal to 1000627 and the table 410 and the Fig
419 show the correct ppm standard and the areas supplied by the instrument
Table 410 calibrationTOC
Corrected
ppm
Area
3002 28679
2001 17261
1001 6568
109
Fig 419 Interpolation of areas obtained in function of the concentration (ppm) of the
standard
44a Experimental procedure
All the kinetic FT runs were made on the plant following the same experimental
procedure
1) Catalyst preparation
2) Catalyst loading on the plant in the FT reactor
3) Catalyst activation
4) FT run
5) When FT finish opening of cold trap and separation of organic from
aqueous phases
6) Catalyst removal from reactor
7) Reactor cleaning and micro-GC column regeneration
44a1 Catalyst preparation
Before the catalyst was loaded in the reactor a standard procedure was
followed on the same catalyst
- Catalyst mesh operation between 106 and 150 micron
- Heating in oven at 120degC for a night
- Mixture catalyst - Al2O3 (inert material ndash diluent) 11
110
In table 411 the main characteristics of -Al2O3 are reported The role of this
material is to help the heating removal from the catalyst (FT reaction is highly
exothermic)
Table 411 Main characteristics of -Al2O3
Superficial area (m2g)
Bulk density (gcm3)
Composition Humidity
07-13 172
996 Al2O3 lt005 SiO2
01 FeO lt001 TiO2
26
44a2 Catalyst loading
The catalyst loading is obviously an essential operation The catalyst must be
charged in the middle of reactor because this is the isothermal zone as it is
possible to observe in Figure 420
Fig 420 Thermic profile of FT reactor
As the height of the mixture catalyst + -Al2O3 is about 7 cm (using a pipe with
an internal diameter of 6 mm) if this material is charged in the middle of the
reactor this work surely at the same temperature in each point The final
arrangement of the reactor is reported in Fig 421
111
Fig 421 FT reactor internal loading arrangement
Finally after the closing the pressure inside the reactor is raised till 4 bar with
the activation gases The gas flow is stopped and then the held of reactor is
checked to control possible gas losses If the reactor pressure is stable the
activation catalyst step will be performed The same procedure for the check of
possible gas loss will be performed when the pressure of the reactor will be
raised till 20 bar for FTS
44a3 Catalyst activation
The catalyst activation is the process in which the catalyst is reduced from the
oxidised state in the reduced or metallic state In the FT reaction the active
form for the Cobalt based catalysts is the Cobalt metallic and for the iron based
catalysts are the carbide iron forms All the catalysts were charged into the
reactor in the oxidised form because the last operation in the catalysts
preparation is the calcination (T=500degC) in air The catalyst activation-reduction
is performed in this PhDrsquos research work at 350degC and using H2 for Co based
112
catalysts and CO+H2 for iron based catalysts always for 4 h at 3 bar of pressure
At the end of this step the FT process start
44a4 Fischer Tropsch runs
After the catalyst activation the plant is raised at standard reactions conditions
Temperature = 220-260degC (depending of the test)
Pressure = 20 bar
Feed ratio H2CO = 21 11 1751 151 (depending on the test were
varied the feed ratio too)
H2 flow = 312 Nmlmin
CO flow = 156 Nmlmin
N2 flow = 50 Nmlmin
These are the ldquostandardrdquo reaction conditions but for some specific studies
they have been changed When the plant reaches the set-up values this is the
ldquozero-timerdquo of the FT runs The first operation is to annul the totalizers both in
the entrance and in the exit of the plant Then every one hour the micro-GC
make one analysis on the out coming flow (also during the night) and the
operator takes the flow out coming from the plant Each data is reported and
elaborate using an excel database The FT run has duration between 48 and 90
hours At the end of run the cold trap is opened (Fig 422) and both the organic
phase (GC) and the aqueous phase (TOC) are separated and then weighed and
analyzed Also these data is collected in the excel database and now it is
possible to calculate the CO conversion the products selectivity the alpha
parameter and to verify the final mass balance
113
Fig 422 Opening cold trap operation
After the reactor cooling the catalyst is unloaded and recovered for possible
characterization after its use The reactor and the cold trap are obviously
cleaned carefully The last operation is the micro-GC column regeneration
using the condition reported in Table 412
Table 412 Micro-GC column regeneration conditions
Parameter Module 1 (molsieves) Module 2 (OV-
1)
Sample Injector temperature (degC) 80 80
Column Injector temperature (degC) 45 60
Column temperature (degC) 160 160
Sampling time (s) -- --
Injection time (ms) -- --
Analysis time (s) -- --
Post-analysis time (s) -- --
Column pressure (kPa) 120 241
Detector sensibility Detector off Detector off
114
b) Second FTS unit (Unit 2) At the end of the second and the beginning of the third year of the PhD there
were performed a serious of catalytic tests in a FT unit at the Universidad
Central de Venezuela in Caracas-Venezuela in order to homologate the results
obtained in the first FTS unit as regard the cobalt based catalysts specifically
the hydrotalcites The experimental tests were performed in a laboratory plant
with a tubular reactor with a fixed bed of catalyst vertically placed They were
then tested in the standard conditions by flowing syngas (H2 CO N2 63325
vv N2 as internal standard) at 156 Nml˙min-1 using a flow meter Then the
feed goes into the catalytic reactor from the top part reacts with the catalyst
and then the reacted flow comes out from the lower part The plant pipes are
heated at 220degC During reaction the reactor effluent passed through a hot
trap kept at 150ordmC and 20 bar to collect waxes and the products leaving this
trap were passed through a second trap kept at 0ordmC and 20 bar to collect the
lighter products (water alcohols and hydrocarbons) The analyses were
performed in various chromatographs according to the nature of the sample to
be analyzed Permanent gases and light hydrocarbons were analyzed on-line in
a PerkinElmer 3000GC Autosystem fitted with TCD detectors using a Carbosieve
SII Supelco column The liquid products (collected at 150ordmC and 0ordmC) were
weighted and analyzed in a PerkinElmer chromatograph fitted with a 50m long
Alumina RT capillary column connected to a FID
In Fig 423 the detailed flow-sheet of FT plant has been reported
115
Fig 423 Laboratory plant flow-sheet
The key for the Fig423 is the following
1 Valve
2 Flow meter for H2 and syngas operating in the range 0-100 Nml min-1
3 Gas mixer
4 Thermocouples for the control of temperature in the catalytic bed in the
reactor and in the heated pipe
5 Tubular reactor
6 Security valve
7 Pressure indicator
8 Pressure control and regulation tool
9 GC ldquoPerkin Elmerrdquo
10 Gas totalizer for the control of the total flow of gas
11 Cold trap operating at 150degC and 20 bar to collect waxes
111 Second cold trap kept at 0ordmC and 20 bar to collect the lighter products
(water alcohols and hydrocarbons)
12 Cooling air for the temperature control of the reactor
13 vent (usually closed)
In figure 424 a photo of the plant is reported
116
Fig 424 FT laboratory plant
In the following paragraphs the main parts of this plant will be described
41b Main parts of the plant
41b1 Apparatus for the regulation and control of temperature pressure and
flow of reagents
In the plant the pressure is controlled by a pneumatic valve that interacts with
a pressure valve able to work till 1000 psi (Fig 425) located after the reactor
and the cold trap
Fig 425 Pressure valve
This system can control the plant pressure with a care of 10 psi respect the set
up
117
The reactor temperature is regulated by a heating jacket and the pipe lines
after the reactor are heated at 220degC to prevent the heavy products
condensation by a heater The CO H2 and N2 flows are regulated by Brooks
Instrument Control and Read out Equipment for Thermal Mass Flow meters
Model 5878 series flow meters (Fig 426)
426 Flow meters for H2 and syngas
41b2 FT reactor
The FT plant reactor is a fixed bed tubular reactor vertically placed It is made
of AISI 316 stainless steel The technical characteristics of reactor are
summarized in Table 413
Table 413 Reactor Characteristics
Volume (cm3)
Max operating pressure
(Bar)
Max operating temperature
(degC)
Internal diameter
(mm)
Height (mm)
850 69 400 95 300
In this reactor it is possible to charge a quantity of catalysts equivalent to
occupy 1 cm of length of the reactor The feed goes into the reactor at the top
and goes out from the lower part
118
Fig 427 FT tubular reactor
The temperature inside the reactor is monitored by one thermocouple inside
the catalyst
41b3 Cold Trap The reactor effluent passed through a hot trap kept at 150degC and 02 MPa to
collect waxes and the products leaving this trap were passed through a second
trap kept at 0degC and 02MPa to collect the lighter products (water alcohols and
hydrocarbons) See Fig 428
Fig 428 Cold trap
The two cold traps can be opened at any time of the reaction and the liquid
condensed inside can be quantified and analyzed
119
The analyses were performed in various chromatographs according to the
nature of the sample to be analyzed Permanent gases and light hydrocarbons
were analyzed on-line in a PerkinElmer 3000GC Autosystem fitted with TCD
detectors using a Carbosieve SII Supelco column The liquid products (collected
at 150degC and 0degC) were weighted and analyzed in a PerkinElmer chromatograph
fitted with a 50m long Alumina RT capillary column connected to a FID
42b Analytical instruments
Two different analysis were made for the quantification of the composition of
i) Out coming gas (mixture of not reacted CO and H2 N2 and non-
condensed FT products) by an on-line in a PerkinElmer 3000GC
Autosystem fitted with TCD detectors using a Carbosieve SII Supelco
column
ii) Organic phase of condensed liquid products (collected in a cold trap at
150ordmC and 0ordmC) hydrocarbons in the range C7-C30 were weighted
and analyzed in a PerkinElmer chromatograph fitted with a 50m
long and 053 mm diameter of Alumina RT capillary column
connected to a FID
An example of analyses of the permanent gases is reported in Fig 429 and an
example of analysis of heavy FT hydrocarbons is reported in Fig 430 and Fig
431
120
Fig 429 Example of analyses of the permanent gases in the TCD
Fig 430 Example of not-condensed products GC analyses on FT out coming gas
121
Fig 431 Example of GC analysis for the quantification of heavy FT products
43b Experimental procedure
All the kinetic FT runs were made on the plant following the same experimental
procedure
1) Catalyst preparation
2) Catalyst loading on the plant in the FT reactor
3) Leak test
4) Catalyst activation
5) FT run
6) Opening of cold trap and separation of organic from aqueous phases
7) Catalyst removal from reactor
8) Reactor cleaning
43b1 Catalyst preparation
Before the catalyst was loaded in the reactor a standard procedure was
followed on the same catalyst
- Catalyst mesh operation between 106 and 150 micron
- Heating in oven at 120degC for a night
122
- Mixture catalyst ndash sea sand (inert material ndash diluent) 11
In table 414 the main characteristics of sea sand are reported The role of this
material is to help the heating removal from the catalyst (FT reaction is highly
exothermic) [5]
Table 414 Main characteristics of sea sand
Particle Size (μm)
Specific Surface
Area (m2g)
Bulk density (Kgm3)
Pore Volume
(mL)
Interstitial Velocity
(md)
Porosity (-) Composition
100-300 074
200-1430
117 26
044 SiO2
43b2 Catalyst loading
As the height of the mixture catalyst + sea sand is about 1 cm (using a pipe with
an internal diameter of 95 mm) if this material is charged in the middle of the
reactor this work surely at the same temperature in each point The final
arrangement of the reactor is reported in Fig 432
Fig 432 FT reactor internal loading arrangement
123
Finally after the closing the pressure inside the reactor is raised till 3 bar with
the activation gases The gas flow is stopped for one night and then the reactor
is checked to control possible gas losses If the reactor pressure is stable the
activation catalyst step will be performed The same procedure for the check of
possible gas loss will be performed when the pressure of the reactor will be
raised till 20 bar for FTS
43b3 Catalyst activation The catalyst activation is the process in which the catalyst is reduced from the
oxidised state in the reduced or metallic state The samples tested in this
reactor were the Co based hydrotalcites In the FT reaction the active form for
the cobalt based catalysts is the cobalt metallic All the catalysts were charged
into the reactor in the oxidised form because the last operation in the catalysts
preparation is the calcination (T=500degC) in air The catalyst activation-reduction
is performed in this part of the PhDrsquos research work at 350degC using H2 always
for 4 h at 3 bar of pressure At the end of this step the FT process start
43b4 Fischer Tropsch runs
After the catalyst activation the plant is raised at standard reactions conditions
Temperature = 220-260degC
Pressure = 20 bar
Feed ratio H2CO = 21
Syngas (H2 + CO + N2) flow = 156 Nmlmin (in order to work with the
same space velocity used for the same samples tested in the Unit 1 in
Italy)
These are the ldquostandardrdquo reaction conditions When the plant reaches the set-
up values this is the ldquozero-timerdquo of the FT runs Every one hour the GC make
124
one analysis of the permanent gases (CO CO2 CH4 N2) on the out coming flow
(also during the night) Each data is reported and elaborate using an excel
database The FT run has a duration between 200-280 hours During the
reaction and before the changes of temperatures the valves of the two cold
trap are opened and both the organic phase (GC) and the aqueous phase are
separated and then weighed and analyzed Also these data is collected in the
excel database and now it is possible to calculate the CO conversion the
products selectivity the alpha parameter and it is possible to verify the final
mass balance
After the reactor cooling the catalyst is unloaded The reactor is cleaned
carefully
42 Experimental data elaboration
The experimental data collected in the laboratory are the gas-chromatographic
area (with micro and traditional GC) the gas flows the temperatures the
pressure the weight of condensed products and the TOC value of organic
compounds in aqueous phase For each run all these data were put in the
excel file where in an automatic way the CO conversion the products
selectivity the molar balance the parameter were calculated
There were used two different file excel for the two different FTS unit
a) First FTS unit (Unit 1)
The file excel is split in nine pages data results heavy hydrocarbons analysis
molar balance (CO hydrogen and oxygen) hydrogen analysis oxygen analysis
and alpha calculation As example the pages of one FT run (made with a Co
base catalyst Co35_2d) are reported in Fig 433a-f
Data page (Fig 433a)
125
This worksheet contains the mathematical elaboration of the experimental
data obtained from the various analyzes and is composed of different parts
Conditions It is referred to the number of tests carried out by the
micro-gas chromatograph the time at which the analysis were made
and the outside temperature at the time of sampling
Flow in It is referred to the flow in (Nmlmin) of the reactants (H2 and
CO) and the internal standard (N2) that remain constant during the
entire kinetic energy
Volumes totalizers It is referred to the values of the three volumes of
gas consumed while the kinetic is in progress (this values are read from
the totalizer just before performing the analysis) and the total volume
of gas output in ml and Nml Furthermore it also evaluates an error in
percentage between the volume of gas out and the gas in
Flow out is measured by a flow meter bubbles and a counter ldquoRitterrdquo
the flow rates are calculated with the output flow measured from the
bubble flow meter and the Ritter counter and then compared
Flow from bubble flow meter (min
ml ) = 60t
V (11)
V[ml] Volume path from the bubble
t[min] Time it takes the bubble to traverse this volume
Flow from Ritter counter (min
ml ) = 100)(
t
VV INOUT (12)
VIN [ml] and VOUT [ml]are the volume of gas in and out
Both values of flow are converted in Nmlmin by the next equation
T273
273ml
min T[degC] (13)
126
CO Conversion It is referred to the quantity of gas reacted or converted
referred to the gas entering inn the plant From the micro-gc analysis
are taken the chromatographic areas of CO and N2 and used to
calculate the flow out-coming of CO from the equation
29121
2
2
OUTNflow
NArea
COAreaCOflow OUT (14)
Where 12912 is the calibration factor As the flow in and the flow out of N2
is the same
29121
025
2
NArea
COAreaCOflow OUT (15)
502 is the flow of the internal standard N2
Now it is possible to calculate the CO conversion using the next formula
IN
OUTIN
COflow
COflowCOflowConversionCO
(16)
Selectivity Concerning the gas flow out-coming from the FT plant made
of not reacted CO CO2 CH4 and light hydrocarbons
CO in reaction mixture 100
2
NTOT
OUT
flowflow
COflowCO (17)
product i in reaction mixture
100
2
NTOT
OUT
i
i
iflowflow
flowcF
area
product (18)
where
flowTOT is the total flow out-coming from the FT plant and concentrationi is
the amount (m) of product i found using the micro-GC
Fci is the calibration factor for each compound
127
Carbon molar flow for the i compound
i
i
C
i
tot
Cnumber
flowmoles
422
100
0010
min (19)
where iCnumber is the number of carbon atom of compound i
0001 transform Nml to Nl and 224 let to transform Nl to moles
Molar balance
CO moles entering in the plant 1000422min x
flowCmolesinin COCO
(20)
CO moles out coming
6
1 min1000422min i
iCOCO molesC
x
flowCmolesoutOUT (21)
128
Fig 433a Example of ldquodata pagerdquo in FT data elaboration excel file
Results page (Fig 433b)
Concerning the products selectivity
Light products (ltC7) j selectivity
129
100
minmin
min
outin
C
j molesCOmolesCO
moles
S
j
(22)
where jCmoles means the moles of carbon atom in the j products
Heavy products (geC7) i selectivity
100
minmin
min
outin
C
i molesCOmolesCO
moles
S
i
(23)
where iCmoles means the moles of carbon atom in the i products
Total light products selectivity jlight SS (24)
Total heavy products selectivity iheavy SS (25)
Fig 433b Example of ldquoresults pagerdquo in FT data elaboration excel file
Concerning the heavy product (organic phase condensed in the cold trap) elaboration (Fig 433c)
moles of i compound 100
CA
fcCAmoles ii
i (26)
where CA is the chromatographic area and fc is the calibration factor
130
Total moles of ldquo-CH2-ldquo unit in organic phase 142
OPCH
weightmoles (27)
Where weightOP means the weight of the organic phase in gram and 14 is the molecular weight of the unit ldquo-CH2-ldquo
Carbon moles of compound i 100
2 i
CH
Cmoles
molesmoles
i
(28)
Moles of carbon per minute of each component
60min
timereaction
CmolesCmoles ii (29)
Fig 433c Example of ldquoheavy hydrocarbons analysis pagerdquo in FT data elaboration excel file
Molar balance page (Fig 433d)
The molar balance is verified using the following equation
outoutoutoutinCwaterCheavyClightCOCO molesmolesmolesmolesmoles (30)
Where
131
inCOmoles and outCOmoles are respectively the moles of CO in entrance and
escape of the FT plant in all the runrsquos time outClightmoles are the carbon
atom moles of light FT products came out from the FT plant in all the runrsquos
time outCheavymoles are the carbon atom moles of the heavy hydrocarbons in
the organic phase condensed in the cold trap and outCwatermoles are the
carbon atom moles inside the water phase condensed in the cold trap In
particular
422
0102 iiNtot
Clight
Cnflowflowmoles out
out (31)
2CH
OPCheavy
PM
weightmoles
out (32)
12106
fdweightppmmoles OPTOC
Cwaterout (33)
where ppmTOC are the ppm of Total Organic Carbon measured by TOC
instrument and fd is a diluting factor (normally 1500) as the aqueous phase
must be diluted before the TOC analysis
Fig 433d Example of ldquomolar balance pagerdquo in FT data elaboration excel file
132
alpha parameter (Fig 433e)
This parameter represents a prediction of the distribution related to the
number of carbon atoms according to the Anderson-Schulz-Flory
distribution
In the excel file of data elaboration it is possible to calculate the alpha
parameter in different range of hydrocarbons C1-C6 C3-C12 C13-C30 C3-C30
The hydrocarbon range is chosen depending of the FT results if as
example the heavy product selectivity is very low it is not convenient to
consider these products in the calculation The equation for the
calculation is
21
logloglog nn
Wn (34)
where Wn is the weight fraction of product with n carbon atom number In
the excel file the equation used are
tot
C
C tmoles
moles i
i 60
min (35)
where ttot is the total time of FT run in hours
iCi PMmolesgi (36)
n
i
i
in
g
gW
1
(37)
The calculation of is then performed making a diagram in which the
n
Wnlog is reported vs the carbon atom number
133
Fig 433e Example of ldquo calculation pagerdquo in FT data elaboration excel file
ldquo calculation pagerdquo
The product distribution can be predicted using the AndersonminusSchulzminusFlory
(ASF) model that depends on the chain growth probability α Different factors
have an influence on the alpha parameter such as process conditions type of
catalyst and chemical promoters [6] The ASF product distribution as a function
of α is depicted in Figure 25 (Chapter 2)
According to ASF distribution ideally the molar fraction (Mn) of the
hydrocarbon product with a carbon number of n is only dependent on the
chain-growth probability (α) which is a function of the rates of chain growth
and chain termination by the following equation
Mn = (1minusα)αnminus1 (38)
In other words the product selectivity is determined by α value in an ideal
case A smaller α value leads to lighter (C1ndashC4) hydrocarbons while larger α
value results in the formation of heavier (C21+) hydrocarbons However the ASF
distribution is unselective for the middle-distillate products which are usually
the target products For examples the maximum selectivity to gasoline-range
(C5ndashC11) hydrocarbons is sim45 and that to diesel-range (C10ndashC20) hydrocarbons
is sim35 The development of selective FT catalysts which can tune the
134
selectivities to desired products is one of the most challenging targets in the
field of FT synthesis [7]
The probability is defined as the speed of growth (rg) divided by the sum of
the speeds of all the possible reactions for the species in growth
The probability to form a product Pn with n carbon atoms is the product of the
probabilities that the adsorbed species are formed in 1 2 n-1 carbon atoms
(precursors of the species Pn) and the probability that the adsorbed species an
carbon atoms desorb Writing a mathematical model leads to the ASF
2n 1
loglognn
Wlog (39)
where Wn is the mass fraction of the product with n carbon atoms
To get the equation of Anderson-Schulz-Flory We define
- as the probability of growth - rt as the rate of chain terminations - rp the speed of chain propagation
For a chain of n carbon atoms is defined another parameter n given by
1n
i
n
n
n
p
tn
1
r
r
(40)
where n is the probability that a chain of n carbon atoms remains on the
catalyst to continue the propagation of the chains n is the number of moles of
product Cn If n is constant throughout the range of products it may simply
indicate with and therefore starting from n = 1 we can write
3
134
2
123
12
So in general
135
1n1n
Starting from a generic molecule with x carbon atoms we can write
xnxn
(41)
Assuming that the monomeric units have the same molecular weight without
regard to their position in the growing chain (these monomer units are CH2
with PM = 14) we can obtain the weight fraction Wn multiplying the equation
(1) by n and dividing it by
1n
nn If we set x = 1 equation (41) remains
1n
1n
1n
1n
1n1
1n1
1n
n
nn
n
n
n
n
n
nW
(42)
The denominator of the last member of equation (42) can be written as
0n
n
(43)
In fact the operators
can be reversed and therefore
0n
1nn
0n0n
n
The series
0n
n for 1 be equal to 1
1
The series in question is of the type n32 arararaS
and the solution is equal to
r1
r1aS
n
Equation (2) can therefore be rewritten as follows
136
2
1n1n
0
n
1n
n1
n
1
1
nnW
or
21nn 1nW (44)
Bringing in logarithmic form the equation (44) we have
2n
n
n
n
1n
n
W
12nn
W
121nn
W
121nnW
)(lnlnln
)ln(lnlnln
)ln(ln)(ln
)ln(ln)(lnln
is identified by the slope of the straight line obtained by plotting the log
(Wnn) as a function of n The quality and the defect of the ASF model is its
simplicity one is in fact arises because of its ease of use across the agreement
with experimental data is not always fully satisfactory in fact the equation
provides undifferentiated products while in reality various species are
summarized
In this file are calculated different values of depending on the range of
carbon atoms C3-C12 C13-C30 C3-C30 Furthermore it was calculated an value
for the range C1-C6 because it is common to all the catalysts in fact the nature
of the tests performed on the various samples kinetics do not guarantee the
of the other range
Mathematically is calculated from
bullthe moles of carbonmin of the various components
bull from the moles of carbonmin it is possible to find the moles of each
component with the formula
137
hreactiontimeh
Cmolcarbontomol i
i
min60
min
From the moles it is possible to get the grams of each component
mol
gPMmolCmolg ii
Wn is calculated (weight fraction) for each component
n
1i
i
in
g
gW
i
calculating the value of Wnn (where n is the number of carbon atoms)
for each component
calculating the ln(Wnn)
By plotting the logarithm of the value of Wnn as a function of the number of
carbon atoms (n) is obtained a straight line whose slope gives the value of
desired
425 Hydrogen
Hydrogen balance (Fig 433f)
This data page allows to calculate the conversion of hydrogen and also the of
H2 in the gas mixture leaving from the reactor
H2 Conversion
Area H2
Area N2
Real Flow mix [Nml min-1]
Flow H2 OUT
[Nml min-1]
CONV H2 ()
() H2
138
As for the CO from the analysis at the micro-GC we get the chromatographic
areas of H2 and N2 that are used to calculate the outlet flow from the Fischer-
Tropsch plant of carbon monoxide by the formula
0017
2
2
22
OUTNflow
NArea
HAreaHflow OUT
where 7001 is the correction factor determined by the calibration of the
micro-gas chromatograph As the output flow of nitrogen is equal to that in the
input will have
0017
025
2
22
NArea
HAreaHflow OUT
At this point we can calculate the conversion of H2 by the formula
IN
OUTIN
Hflow
HflowHflowHConversion
2
222
The H2 is necessary to obtain the number of moles of hydrogen present in the
gaseous stream leaving from the reactor it is calculated through the formula
1002
2 TOT
OUT
flow
HflowH
Hydrogen Balance Also the balance of the hydrogen is performed at the end of the kinetic and it is
calculated with the following formula
2_
_2_
2
22222
Hfrom
waterheavylightMixfromHfrom
IN
OUTOUTOUTOUTIN
Hmoles
HmoliHmolesHmolesHmolesHmoles
where
139
1 18
2
phaseaqueous
OUT
weightwaterHmoles
2 2
2
CHPM
phaseorganicweightphaseorganicfomHmoles
The use of the molecular weight of methylene is because the CH2 is the
segment that grow joining to other segment of CH2 to give the different
hydrocarbons
3 moles of H2OUT light are the moles obtained by the summation of moles
of H2OUT of light hydrocarbons through the formula
2422
0102
jiOUT
OUT
compoundHngasmllightHmoles
Fig 433f Example of ldquohydrogen balancerdquo in FT data elaboration excel file
427 Oxygen Balance As for the other two balances also the oxygen balance is carried out at the end
of the kinetic run and it is calculated using the formula
COfrom
OHfomCOfromCOfromCOfrom
IN
OUTOUTOUTIN
Omoles
OmolesOmolesOmolesOmoles
_
2_2___
Where
140
1 18
phaseaqueous
OUT
weightwaterOmoles
2 422
2010 22
COgasmlCOOmoles OUT
OUT
In the calculation of the oxygen balance are not considered the oxygenated
products while the moles of OIN from CO and the moles of OOUT from CO are
respectively equal to the moles of COIN and COOUT from CO
b) Seconf FTS unit (Unit 2)
The shape of the file excel is presented in a different way but the equations
are the same equations presented before (See First FTS unit in this chapter)
The file is split in eleven pages XCO CH4 CO2 TCD data media paraffins
fractions (1-4) As example the pages of one FT run (made with a Co based
hydrotalcites catalyst Co35_2d) are reported in Fig 434a-d
TCD In Fig 434a-b are shown the conditions related to the number of tests
carried out by the gas chromatograph the time at which the analysis were
made and the outside temperature at the time of sampling the CO Conversion
that is referred to the quantity of gas reacted or converted referred to the gas
entering inn the plant From the gas chromatograph are taken the
chromatographic areas of CO CH4 CO2 and N2 and used to calculate the
selectivity
Fig 434a Example of ldquodata page _ TCDrdquo in FT data elaboration excel file
141
Fig 434b Example of ldquodata page _ TCDrdquo in FT data elaboration excel file
Datos In Fig434 c is shown the information related to the selectivity of light hydrocarbons
Fig 434 c Example of ldquolight hydrocarbons analysis pagerdquo in FT data elaboration
excel file
In Fig 434d the calculation of is then performed making a diagram in
which the
n
Wnlog is reported vs the carbon atom number
Fig 434 d Example of ldquo calculation pagerdquo in FT data elaboration excel file
142
43 Novelties on the FT plant made in this PhD work In the second year of the PhD the reactor used in the laboratory at the
ldquoUniversitagrave degli Studi di Milanordquo was brought in ldquoBrignolerdquo Company
(Legnano ndash MI) for a general control and revision
In this long revision some fundamentals improvements have been made on
the FT plant
all the analytical procedures were optimized verified and calibrated
A new flowmeter was included in the feed verified and calibrate
References
[1] CLBianchi C Pirola V Ragaini Cat Comm 7 (2006) 669
[2] ML Cubeiro Loacutepez A Colmenares L Texeira M Goldwasser M J Peacuterez
F Machado F Gonzaacutelez Applied Catalysis A General 167 (1998) 183-193
[3] C Pirola C L Bianchi A Di Michele P Diodati S Vitali V Ragaini Catal
Lett 131 (2009) 294ndash304
[4] C Pirola CL Bianchi A Di Michele S Vitali V Ragaini Catal Comm 10
(2009) 823ndash827
[5] C Pirola PhD 2007-2008 Novel supported iron based Fischer-Tropsch
catalysts Preparation characterization and applications Chapter 5
[6] Abell S Montan D ChemSusChem 2011 4 1538minus1556]
[7] Qinghong Z Weiping D Ye W Review Recent advances in understanding the key catalyst factors for Fischer-Tropsch synthesis J Ener Chem 2013 2227ndash38
143
Chapter 5 Catalysts preparation and characterization A serious of catalysts were prepared according different method of synthesis
and using cobalt and iron depending on the kind of the study
The catalysts reported in Table 51 are divided in two classes
1) Catalysts of cobalt based divided into two more groups
a Co based hydrotalcites with different amount of cobalt (5-35
wt) prepared with an innovative method of synthesis (urea
method)
b Co based catalysts with 8wt of cobalt with different supports
(SiO2 Al2O3 or TiO2) and the same samples with the addition of
01 of ruthenium carbonyl all of them synthesized with the
help of ultrasound
2) Catalysts of iron (30 wt) with fixed (optimized) loading of promoters
(K=20 Cu=375) and different method of synthesis
The catalysts of the first series (Co) subdivided in two more groups (HTlc and
bimetallic with the help of ultrasound) were studied to verify the activity of
this new kind of catalysts in the CO hydrogenation
More specifically the hydrotalcites were proposed as a new kind of catalysts
in which the active metal is part of the structural core of the HTlc has been
synthesized and tested Activity tests conducted in a fixed bed reactor resulted
in satisfactory catalytic performances as we will discuss later Moreover the
structural and catalytic properties of these materials were verified at FTS
operating conditions and correlations between catalyst features and efficiency
144
towards light and heavy hydrocarbons selectivities were achieved And the
cobalt based catalysts synthesized with the help of ultrasound (US) were
studied to test the effects of sonochemical synthesis to prepare novel
supported materials with particular properties as nanostructured catalysts [1]
The chemical effect of ultrasound arises from acoustic cavitation ie the
formation growth and implosive collapse of bubbles in a liquid Some of the
interesting features resulting from the application of sonication as a synthetic
method are the nanoparticles preparation showing a more uniform size
distribution higher surface area and a more controlled phase composition The
use of high power ultrasound for long time is a difficult procedure because it is
a critical point the control of the thermal stability of the ultrasound horn In
this PhDrsquos work the possibility to use an ultrasound assisted synthesis of Co-
based catalysts by high power ultrasound for a long time has been
investigated using an innovative experimental apparatus equipped with a new
cooling system able to maintain stable the temperature US emitting horn
The catalysts of the second series (Fe) were studied to verify the effect of the
different methods of synthesis and the variation of the H2 CO ratio in order to
simulate a feed with biosyngas and for an ulterior study about the develop of a
kinetic model The selection of this specific amount of Fe (30 wt) and
promoters (Cu and K with 20 wt and 375wt respectively) was taken from
a previous research [2] in which the effect of these amounts was extensively
studied
Promoters influence the bond strength of hydrogen and carbon oxide to metal
Addition of alkali metals (K in particular) to iron catalysts promotes electron
transfer to the iron and inhibits hydrogen adsorption because adsorption of
hydrogen induces electron donation to the iron surface Moreover K promotion
Chapter 5 Catalysts preparation and characterization
145
increases the electron density in iron and will result in an increase of CO
adsorption On Fe stronger metal-carbon bonds will lead to C2+ formation and
then to a low methane selectivity [3] Copper promotes the reduction of iron
oxide phases from hematite (Fe2O3) to magnetite (Fe3O4) and then from
magnetite to iron metal A suggested mechanism for this promotion effect is
the migration of atomic hydrogen from reduced Cu sites to the iron oxide The
copper needs to be very well mixed with iron oxide to provide the most
favourable promoter effect [4]
An innovative preparation procedure with the use of Ultrasound and
Microwave has been used with the iron based catalysts
In Table 51 a general summary of all the prepared catalyst is reported
Table 51 Summary of the catalysts synthesized and tested
Metal Catalysts Samples
Co
HTlc Co5
Co 10
Co 15
Co 35
Bimetallic US CoTiO2
CoSiO2
CoAl2O3
Co-RuTiO2
Co-RuSiO2
Co-RuAl2O3
Fe
Traditional Fe30K20Cu375 SiO2 At different temperature and H2CO ratio 21 15111
Traditional + MW MW1
MW2
Traditional + US
US1
US2
Co-precipitation
FeSiO2-TEOS
Chapter 5 Catalysts preparation and characterization
146
The catalysts were characterized by TPR BET SEM TEM ICP FT-IR micro-
RAMAN techniques in their fresh form (before the use in FT reactor) and in
some cases after different activation procedure or after FT runs
The physical properties of the catalysts (surface area and morphology) were
investigated by BET SEM and TEM analyses The theoretic catalysts
composition has been investigated and verified both qualitatively using SEM-
EDS FT-IR and micro-RAMAN techniques and quantitatively using ICP
characterization The reduction behaviour of metal phase has been
investigated by TPR analyses
51 Catalysts preparation
511 Catalyst preparation procedure
5111 Cobalt based catalysts
Two different types of cobalt based catalysts were prepared during this
research The synthesis is presented in the next paragraphs
Co based Hydrotalcites by a modified urea method
A series of ternary HTlc with general formula [CoxZn(1-x-
y)Aly(OH)2](NO3)y∙05H2O was synthesized by a modified-urea method [5]
Different volumes of the solutions of the metal nitrates all at a concentration
of 05 M were mixed to obtained either a Al(Co+Al) or Al(Co+Al+Zn) molar
ratio of 03
Solid urea was added to the solutions in a molar ratio of 4 vs Al The obtained
solutions were maintained at the reflux temperature in an open flask for 48 h
The precipitates were separated by centrifugation washed with water and
then dried at 80degC
Chapter 5 Catalysts preparation and characterization
147
Co based catalysts with the help of ultrasound
All the catalysts were prepared by a modified impregnation method The metal
precursors (cobalt and ruthenium carbonyl) were dissolved in n-decane
together with the different support (SiO2 Al2O3 or TiO2) The solution was
irradiated by an US horn (Fig 51) for 3 h at 20 kHz at 300 W and then put into
a rotating vacuum oven at 40degC at 36 rpm for 24 h (impregnation step)
Samples have been calcinated at 350 degC for 4 h
Fig 51 Ultrasound horn with a cooling jacket where the coolant has two main
characteristics low viscosity at low temperature and dielectric liquid
5112 Iron based catalysts Four different types of iron based catalysts were prepared during this
research The methods used were the traditional impregnation method the co-
precipitation method and the traditional impregnation method with the help of
microwave and ultrasounds
Fe based catalysts by the Traditional Impregnation method
The iron based supported on silica catalysts were prepared according to the
traditional impregnation method completely described in a previous work [6]
starting from an aqueous solution of precursors and adding in a second time
Chapter 5 Catalysts preparation and characterization
148
the support (silica) The reagents used for the samples preparation are
reported in Table 52
Table 52 Reagents used in the catalysts preparation Fe30K20Cu375 SiO2
Reagent Main characteristics
Support SiO2
Company Fluka (cod 60740) Mesh 70-230 60 Aring Molecular weight 60086 gmol Purity gt 99 Superficial area 500 m2g
Precursors
Fe(NO3)3middot9H2O Company Riedel de Hean Molecular weight 40385 gmol Purity 98
KNO3 Company Merk Molecular weight 10111 gmol Purity gt 99
Cu(CH3COO)2middotH2O Company Fluka Molecular weight 19965 gmol Purity 99
Solvent Extra pure water
The standard methodology for the catalysts preparation is the following
Drying of silica in oven (T=120degC) for a night
Weigh of the calculated amount of iron potassium and copper
precursors
In a pyrex vessel (250 ml) the weighed precursors the water (25 ml)
and silica (5 g) are added
The vessel is put on a rotavapor (36 rpm T=40degC P = 1 bar) for 24 hours
(Fig 52)
The solvent is evaporated (T = 80degC)
The powder is dried in oven (T=120degC) for 4 hours
Calcination (T = 500degC) in air for 4 hours
Chapter 5 Catalysts preparation and characterization
149
The catalyst is sieved to obtain a powder mesh between 100 and 140
Fig 52 Rotavapor used for catalyst preparation
The amount of precursors is calculated starting from the equation (1) to have
the requested iron percentage in the not promoted catalysts
FegSiOgFe
gFe
2
(1)
Then the moles of iron are equal as the moles of his precursor (moles Fe =
moles Fe(NO3)39H2O) The grams of precursors are calculated multiplying the
moles for the molecular weight of Fe(NO3)39H2O This quantity must be divided
for the purity grade of precursor
For the promoted catalysts the amount of precursors is calculated using the
following equations
FegSiOgCugKgFe
gFe
2
(2)
KgSiOgCugKgFe
gK
2
(3)
CugSiOgCugKgFe
gCu
2
(4)
Chapter 5 Catalysts preparation and characterization
150
The equation (2) (3) and (4) must be solved as equations system The moles of
Fe K and Cu are equal as the moles of respective precursors The grams of
precursors are calculated multiplying the moles for the molecular weight of
Fe(NO3)39H2O KNO3 and Cu(CH3COO)2H2O respectively This quantity must be
divided for the purity grade of each precursors
Specifically for the preparation of a catalyst having 30 wt of iron 2wt of
potassium and 375wt of copper on silica
2920037505
15600205
33523005
gCuggCugKgFe
gCu
gKggCugKgFe
gK
gFeggCugKgFe
gFe
moles Fe =molesg
g
84755
3352=00418 moles
moles K =molesg
g
098339
1560= 000398 moles
moles Cu =molesg
g
54663
2920= 00046 moles
g Fe(NO3)3middot9H2O = 00418 molesmiddot40385 gmoles = 16882 g
g KNO3 = 000398 molesmiddot10111gmoles = 04024 g
g Cu(CH3COO)2middotH2O = 00046 molesmiddot19965 gmoles = 09168 g
and the grams required to prepare the catalysts are
980
88216 g=17227 g Fe(NO3)3middot9H2O
Chapter 5 Catalysts preparation and characterization
151
1
40240 g = 04024 g KNO3
990
91680 g= 09261 g Cu(CH3COO)2middotH2O
Fe based catalysts by the Traditional Impregnation method with the help of
microwave (MW)
For the synthesis of the catalysts with the aid of microwave (MW) a final step
where the powder of catalyst already calcined is subjected to a MW
irradiation was added Two different methods for the MW irradiation were
used In the first one (MW1) a sample of catalyst was put into a beaker and
then into a classical microwave oven (Moulinex Micro-Chef 1305E 600W) for
30 min
In the second method (MW2) the catalyst (2 g) was suspended in hexane (400
ml) put into a microwave chemical reactor (ordinary 400 mL round bottom
glass flask filled with the liquid to be heated and activated) and treated for 1 h
at 60W MW were produced by a MW generator and sent to the MW
applicator by an insulated coaxial antenna Details of the MW applicator and of
the associated experimental techniques can be found in [7]
Fig 53 Microwave (MW) Power (35-300 W) Treatment duration (60 min)
Atmosphere (air)
Chapter 5 Catalysts preparation and characterization
152
Fe based catalysts by Traditional Impregnation method with the help of
ultrasound (US)
In this particular preparation method a step using ultrasound (US) has been
added Ultrasound is simply sound pitched above the frequency bond of human
hearing It is a part of sonic spectrum that ranges from 20 kHz to 10 MHz and
corresponds to the wavelengths from 10 to 10-3 cm [8] The application of
ultrasound in connection to chemical reactions is called sonochemistry The
range from 20 kHz to around 1 MHz is used in sonochemistry since acoustic
cavitation in liquids can be efficiently generated within this frequency range
[9] However common laboratory equipment utilizes the range between 20
and 40 kHz The Ultrasound are often used in the preparation of supported
catalysts (some examples are reported in ref [10]) and their useful
contribution concerns for example the dispersion of metal the size of particles
the surface area and the advantage is evident in the performance of catalyst in
many cases both in term of conversion and of process selectivity [11]
The use of ultrasound may be very efficient to optimize the dispersion of high
metal charge as already verified in our laboratory in the past [2 12-13]
US treatment has been performed between the impregnation and the
evaporation step by irradiating the silica-precursors solution using a Sonicator
(W-385 Heat Systems Ultrasonics) with an effective input power of 60 W and a
tip diameter of 13 mm (Fig54 and Fig 55) Silica solution promoters and
water have been sonicated by the US horn for 05 h in air (US1) The same
sample was successively sonicated in a suspension of hexane in argon for 3h
(US2)
Chapter 5 Catalysts preparation and characterization
153
Figura 54 Diagram of sonication step
1 Sonicator US (W-385 of Heat Systems Ultrasonics)
2 Emitter head of US equipped with a titanium tip of 13 mm
3 Beaker with the solution immerse in a bath of waterice
4 Flow meter of Ar
5 Connection with air
6 Argon Cylinder
Fig 55 Detail of the US treatment step 20 kHz 60 W tip diameter of 13 mm US
switched on and off alternatively for 05 seconds (pulsed US) t =30 min
1
4
6 3
2
5
Chapter 5 Catalysts preparation and characterization
154
Fe based catalyst by the co-precipitation method with TEOS
Acidic silica sol (ASS) and tetraethoxysilane (TEOS) are widely used as silica
sources of FeSiO2 catalysts [14-15] which can be incorporated into iron
catalyst matrix during the precipitation of catalyst precursors and have an
obviously dispersive effect on the iron oxide phase It is well known that the
tetraethoxysilane (TEOS) is insolvable in aqueous solutions but can slowly
hydrolyze to hydrophilic silica solgel [16]
In the TEOS- water system acid or basic can catalyze the hydrolysis of TEOS
[17] In the process of the co-precipitation TEOS hydrolyzes into silica
accompanied by the precipitation of ferric ions whereas the silica particles in
ASS may directly interact with ferric ions The different properties of two silica
sources should lead to a great diversity in both the structures and the
physicochemical properties of catalysts such as morphology dispersion
phases chemisorption Fe-SiO2 interactions and so on
As a FeSiO2 catalyst was prepared by a co-precipitation method using TEOS
The detailed process of the co-precipitation method has been described
elsewhere [18] In brief an alcoholic solution of TEOS was mixed with an
aqueous solution of iron nitrate with a FeSi atomic ratio of 10025 The mixed
solution was precipitated using an ammonium solution at 80 degC and a pH value
of 85-90 After precipitation the precipitates were aged for 2 h washed and
filtered Then the filtered cakes were dried at 120 degC overnight and calcined at
500 degC for 5 h The catalyst was denoted as FeSiO2-TEOS
Some calculations have been made to prepare the catalyst
To prepare 50ml 1M of solution of TEOS
To prepare a catalyst with a FeTEOS= 41 ratio and using 1g of Fe are required
Chapter 5 Catalysts preparation and characterization
155
To prepare the catalysts is required a ratio FeTEOS=41 thatrsquos mean 1g of Fe
correspond with 025g of TEOS
molFemolFeg
gFemolFe 01790
84755
1
OHNOgFeOHNOmolFe
OHNOgFe
molFe
OHNOmolFemolFeOHNOgFe 233
233
233233233 9)(387
980
1
9)(
9)(52403
1
9)(1017909)(
mll
ml
mol
Mlsol
gTEOS
molTEOSgTEOSmlTEOS 201
1
1000
1
11
33208
1250
700ml of distillate water was put into a beaker and heated at 77degC
OHNOgFe 233 9)(387 and 120ml of TEOS were added
Measurements of pH was taken until the solution acquired a pH
between 8 and 9
Let stand for 2 hours
The solvent is evaporated (T = 80degC)
The powder is dried in oven (T=120degC) for 4 hours
Calcination (T = 500degC) in air for 4 hours
The catalyst is sieved to obtain a powder mesh between 100 and 140
52 Catalysts characterization 521 Catalysis characterization introduction and theory
According to [19] the basic catalyst characterization involves two main steps
the investigation on the porous nature of the catalyst support (physical
properties) and on the properties of the active sites that are dispersed on the
support surface (table 53)
The complete and accurate knowledge of the properties of a catalyst is
fundamental for evaluating its performance In this work there were used
several techniques to investigate their physical and chemical properties
Chapter 5 Catalysts preparation and characterization
156
The characterization has been made for the fresh catalysts (after the
calcination at 500degC and before their loading and activation or use in FT
reactor) and in some cases after the activation and the FT reaction
Table 53 General scheme of catalysts characterization [19]
Catalyst texture
Physical properties Chemical properties
Result Technique Result Technique Geometry and shape - Optical microscopy Chemical composition -Electron spectroscopy
-Atomic adsorption
Total specific surface area
-Gas physisorption -Mercury porosimetry
Degree of dispersion -Selective chemisorption -X-ray -Electron microscopy -Magnetisation analysis
True density -X-ray analysis -Neutron diffraction
Degree of dispersion -Selective chemisorption -X-Ray -Electron microscopy -Magnetisation analysis
Bulk and apparent density
-Helium pycnometry -Mercury porosimetry -Liquid displacement
Surface Energy -Thermal analysis test -Temperature programmed desorption and reaction calorimetry
-Pore specific volume -Porosity
-Mercury porosimetry -Gas adsorption
Acid-base sites -Selective chemisorption -Temperature programmed desorption
Pore size and mean pore size
-Mercury porosimetry -Gas Adsorption
Redox sites -Spectroscopic methods -Temp programmed reduction -Temp Programmed oxidation
Particle size -Sieves -Laser scattering -Sedimentation -Electrical sensing zone -Etc
-Catalytic properties -Activity -Selectivity
Reactor tests and simulation
Surface structure -Optical microscopy -Electron microscopy -X-Ray analysis
Surface change Z potential
A brief description of the different techniques used in this work will be
presented as follow
Chapter 5 Catalysts preparation and characterization
157
BET (adsorption method for surface area evaluation)
SEM
TEM (electron microscopy)
FT-IR and RAMAN (vibrational spectroscopy for chemistry of surface
groups)
TPR (study of catalyst reduction vs temperature)
TPD
ICP (quantification of element inside the catalyst)
XRD
5211 BET analysis (adsorption method for surface area evaluation)
According to [20] the most widely used method for determining surface area
involves measuring the amount of gas adsorbed on a solid surface at a
temperature close to the boiling point of the gas Nitrogen is most commonly
used as the adsorbate
The interaction between the adsorbate and the adsorbent may be chemical
(chemisorption) or physical (physisorption) in nature and ideally should be a
surface-specific interaction If the adsorption is measured at several gas
pressures the Brunauer- Emmett-Teller (BET) [21] equation can be used to
calculate the amount of adsorbate required to form a monolayer [22] This
technique of characterization of solid has the particular equation that allows to
determine a parameter of great importance in the study of the solid ones that
is the superficial specific area Such parameter expresses the relationship
between the total surface of the catalyst and the weight of the same one and
usually is expressed in m2g Technique BET uses the principle of the physical
inert gas adsorption (nitrogen) to varying of the relationship between the
Chapter 5 Catalysts preparation and characterization
158
partial pressure of nitrogen and its vapor pressure to the temperature of liquid
nitrogen The technique can be carried in static or dynamic conditions
Opportune procedures of calculation allow also to determine the distribution
of the pores in the field of mesoporosity BET theory is a well-known rule for
the physical adsorption of gas molecules on a solid surface that is basis for an
important analysis technique for the measurement of the specific surface area
of a material The concept of the theory is an extension of the Langmuir theory
which is a theory for monolayer molecular adsorption to multilayer adsorption
with the following hypotheses (a) gas molecules physically adsorb on a solid in
layers infinitely (b) there is no interaction between each adsorption layer and
(c) the Langmuir theory can be applied to each layer The resulting BET
equation is the following
p
pc
p
p
p
pc
V
V
m111
(5)
Where
V = volume of adsorbed gas at pressure P
pdeg = gas saturation pressure at temperature T
ppdeg = relative pressure
C = BET constant expressed by the following
RTqqC L exp 1 (6)
Where
q1 = heat of adsorption of the first layer
qL = heat of adsorption of the second and higher layers
For the Vm calculation the (6) must be linearized and the linear relationship of
this equation is maintained only in the range of 005 lt P P0 lt 035
Chapter 5 Catalysts preparation and characterization
159
mm cV
p
pc
CV
p
pV
p
p
1
1
1
(7)
Equation (7) is an adsorption isotherm and can be plotted as a straight line with
1 V[(Pdeg P) minus 1] on the y-axis and P P0 on the x-axis according to
experimental results The specific surface area is determined on the Vm basis
mol
molAVm
V
ANVAS
(8)
Where
NAV = Avogradorsquos number
Amol= adsorption cross section (for N2 = 162 Aring2)
Vmol= molar volume of gas (22414 mlmol)
Experimental The samples have been analyzed using a Costech Sorptometer
1042 ldquoKELVINrdquo using liquid nitrogen Before the analysis the catalyst is put in
oven (T = 110degC for 16 h) to remove the adsorbed water Then a quantity
between 008 g and 02 g in analyzed in the instrument The sample is pre-
treated for 2 h at T = 200degC in a N2 flow to remove all the impurity then a
check with helium is made to calibrate the interspatial volume
5212 Temperature programmed reduction TPR analysis [19]
Some aspects related to catalysts characteristic and behaviour will be treated
as determination of metal surface area and dispersion spillover effect and
synterisation A description of the available techniques will follow taking in
consideration some aspects of the gas-solid interactions mechanisms
(associativedissociative adsorption acid-base interactions etc)
Chapter 5 Catalysts preparation and characterization
160
The thermal analysis methods may be used with different objectives the
reaction or desorption profile may be used qualitatively to fingerprint a given
system and then it is possible to make a quantitative considerations about the
nature of chemical processes the amount of gas involved in the chemical
reaction and finally to calculate the number of the active sites the reducibility
degree of the sample related to the catalytic activity All the methods relating
some characteristic properties of a catalyst to its temperature during a
programmable heating ramp are named commonly in the field of the thermal
analysis
The thermal analyses are often used to investigate surface modifications and
bulk reactivity by varying the surface composition the catalyst preparation
method the pre-treatment for catalyst activation and the analytical conditions
The TPRO involve a bulk reaction
The objectives of the programmed reduction (TPR) are essentially the
following 1) to find the most efficient reduction conditions 2) to identify the
supported precursor phases and their interactions with the support 3) to
characterize complex systems as bimetallic or doped catalyst to determine the
role of the second component ant to establish alloy formation or promotion
effects There are several interesting studies about this technique Robertson
et al [23] first reported TPR profile of nickel and nickel-copper catalysts and
since then many catalysts have been investigated In the TPR technique an
oxided catalyst precursor is submitted to a programmed temperature rise
while a reducing gas mixture is flowed over it (usually hydrogen diluted in
some inert gas as nitrogen or argon) An interesting application of this
technique is that the TPRO analysis may be used to obtain evidence for the
interaction between the atoms of two metallic components in the case of
bimetallic system or alloy as already cited In general TPRTPO studies are
Chapter 5 Catalysts preparation and characterization
161
carried out under low partial pressure of the reactive gas In this way it is
possible to observe the intermediate reactions depending from analytical
conditions as temperature rate flow rate and concentration of reactive gas
Experimental
Conventional temperature-programmed reduction experiments (TPR)
were performed on the calcined catalysts using a TPRDO110
instrument (Thermoquest) The samples were initially pre-treated in
flowing argon at 200degC for 05 h After being cooled to 50degC the H2Ar
(51 vv) reducing mixture flowed through the sample at 30 mlmin
while the temperature was increased from 50 to 900degC at constant rate
of 8 degCmin
5213 SEM and TEM analysis
In electron microscopy as in any field of optics the overall contrast is due to
differential absorption of photons or particles (amplitude contrast) or
diffraction phenomena (phase contrast) The method provides identification of
phases and structural information on crystals direct images of surfaces and
elemental composition and distribution Routine applications however may be
hampered by complexities of image interpretation and by constraints on the
type and preparation of specimens and on the environment within the
microscope
The scanning electron microscope (SEM) is a type of electron microscope that
creates various images by focusing a high energy beam of electrons onto the
surface of a sample and detecting signals from the interaction of the incident
electrons with the samples surface The type of signals gathered in a SEM
varies and can include secondary electrons characteristic x-rays and back
scattered electrons In a SEM these signals come not only from the primary
Chapter 5 Catalysts preparation and characterization
162
beam impinging upon the sample but from other interactions within the
sample near the surface The SEM is capable of producing high-resolution
images of a sample surface in its primary use mode secondary electron
imaging Due to the manner in which this image is created SEM images have
great depth of field yielding a characteristic three-dimensional appearance
useful for understanding the surface structure of a sample This great depth of
field and the wide range of magnifications are the most familiar imaging mode
for specimens in the SEM Characteristic x-rays are emitted when the primary
beam causes the ejection of inner shell electrons from the sample and are used
to tell the elemental composition of the sample The back-scattered electrons
emitted from the sample may be used alone to form an image or in conjunction
with the characteristic x-rays as atomic number contrast clues to the elemental
composition of the sample The SEM was pioneered by Manfred von Ardenne
in 1937 [24] and [25] The instrument was further developed by Charles Oatley
and first commercialized by Cambridge Instruments The spatial resolution of
the SEM depends on the size of the electron spot which in turn depends on
both the wavelength of the electrons and the magnetic electron-optical system
which produces the scanning beam The resolution is also limited by the size of
the interaction volume or the extent to which the material interacts with the
electron beam The spot size and the interaction volume both might be large
compared to the distances between atoms so the resolution of the SEM is not
high enough to image individual atoms as is possible in the shorter wavelength
(ie higher energy) transmission electron microscope (TEM) The SEM has
compensating advantages though including the ability to image a
comparatively large area of the specimen the ability to image bulk materials
(not just thin films or foils) and the variety of analytical mode available for
measuring the composition and nature of the specimen Depending on the
Chapter 5 Catalysts preparation and characterization
163
instrument the resolution can fall somewhere between less than 1 nm and 20
nm In general SEM images are easier to interpret than TEM images
According to [22] topographical images in a SEM are formed from back-
scattered primary or low-energy secondary electrons The best resolution is
about 2-5 nm but many routine studies are satisfied with a lower value and
exploit the case of image interpretation and the extraordinary depth of field to
obtain a comprehensive view of the specimen With non-crystalline catalysts
SEM is especially useful for examining the distribution and sizes of mesopores
An energy dispersive X-ray spectroscopy device is a frequent attachment in the
instrument
Fig 56 Schematic ray path for a scanning electron microscope (SEM) [26]
Transmission electron microscopy (TEM) is a microscopy technique whereby a
beam of electrons is transmitted through an ultra-thin specimen interacting
with the specimen as it passes through it An image is formed from the
electrons transmitted through the specimen magnified and focused by an
objective lens and appears on an imaging screen a fluorescent screen in most
TEMs plus a monitor or on a layer of photographic film or to be detected by a
sensor such as a CCD camera The first practical transmission electron
microscope was built by Albert Prebus and James Hillier at the University of
Chapter 5 Catalysts preparation and characterization
164
Toronto in 1938 using concepts developed earlier by Max Knoll and Ernst
Ruska
Theoretically the maximum resolution that one can obtain with a light
microscope has been limited by the wavelength of the photons that are being
used to probe the sample and the numerical aperture of the system Early
twentieth century scientists theorized ways of getting around the limitations of
the relatively large wavelength of visible light (wavelengths of 400ndash700
nanometers) by using electrons Like all matter electrons have both wave and
particle properties (as theorized by Louis-Victor de Broglie) and their wave-like
properties mean that a beam of electrons can be made to behave like a beam
of electromagnetic radiation Electrons are usually generated in an electron
microscope by a process known as thermionic emission from a filament usually
tungsten in the same manner as a light bulb or by field emission The
electrons are then accelerated by an electric potential (measured in V or volts)
and focused by electrostatic and electromagnetic lenses onto the sample The
beam interacts variously with the sample due to differences in density or
chemistry The beam that is transmitted through the sample contains
information about these differences and this information in the beam of
electrons is used to form an image of the sample The contrast in a TEM image
is not like the contrast in a light microscope image A crystalline material
interacts with the electron beam mostly by diffraction rather than absorption
although the intensity of the transmitted beam is still affected by the volume
and density of the material through which it passes The intensity of the
diffraction depends on the orientation of the planes of atoms in a crystal
relative to the electron beam at certain angles the electron beam is diffracted
strongly from the axis of the incoming beam while at other angles the beam is
largely transmitted
Chapter 5 Catalysts preparation and characterization
165
Just as details of a light microscope sample can be enhanced by the use of
stains staining can be used to enhance differences in a sample for electron
microscopy Compounds of heavy metals such as osmium lead or uranium can
be used to selectively deposit heavy atoms in areas of the sample and to
enhance structural detail by the dense nuclei of the heavy atoms scattering the
electrons out of the optical path The electrons that remain in the beam can be
detected using a photographic film or fluorescent screen among other
technologies So areas where electrons have been scattered in the sample can
appear dark on the screen or on a positive image due to this scattering TEM is
suitable for examination of supported catalysts with particle sizes down to 2-3
nm giving information on particle location over the support on particle-size
distributions in favourable cases on particle and support morphology and on
the nature and distribution of deposits having a thickness of the order of 2-3
nm Surface topography can be examined using replication techniques [22]
Fig57 Schematic ray path for a transmission electron microscope (TEM) [26]
Experimental The SEM analysis have been made in collaboration with Perugia University
SEM images were measured using an electron microscopy Philips XL-30CP with
RBS detector of back-scattered electrons and EDS analyzer was used to
describe the surface and elemental composition of catalysts
Chapter 5 Catalysts preparation and characterization
166
The TEM analysis have been made in collaboration with Perugia University The
morphology of the samples was investigated by a transmission electron
microscope Philips 208 Transmission Electron Microscope (TEM) a drop of the
dispersion was deposited on a copper grid covered with a polymeric film
Formvar subsequently evaporated in air at room temperature
In order to obtain more accurate information concerning the atomic
percentage of the elements on the surface EDX measurements were made
using the high-resolution TEM instrument at the Department of Chemical
Science and Technology and Biosystems studies at the University of Siena This
instrumentation allows to obtain with high precision information on the atomic
percentage in different areas of the sample going to select individual points or
individual areas
5214 FT-IR analysis
This vibrational spectroscopy is used for characterization of high area
supported or unsupported catalysts Information is available either directly or
by study of probe adsorbates on the chemistry of surface groups (particularly
on oxides) It is also used for the study of the behavior of precursor compounds
during catalyst preparation
Infrared spectroscopy is the subset of spectroscopy that deals with the infrared
region of the electromagnetic spectrum It covers a range of techniques the
most common being a form of absorption spectroscopy As with all
spectroscopic techniques it can be used to identify compounds or investigate
sample composition Infrared spectroscopy correlation tables are tabulated in
the literature
The infrared portion of the electromagnetic spectrum is divided into three
regions the near- mid- and far- infrared named for their relation to the visible
spectrum The far-infrared approximately 400-10 cm-1 (1000ndash30 μm) lying
Chapter 5 Catalysts preparation and characterization
167
adjacent to the microwave region has low energy and may be used for
rotational spectroscopy The mid-infrared approximately 4000-400 cm-1 (30ndash
14 μm) may be used to study the fundamental vibrations and associated
rotational-vibrational structure The higher energy near-IR approximately
14000-4000 cm-1 (14ndash08 μm) can excite overtone or harmonic vibrations The
names and classifications of these sub regions are merely conventions They
are neither strict divisions nor based on exact molecular or electromagnetic
properties
Infrared spectroscopy exploits the fact that molecules have specific frequencies
at which they rotate or vibrate corresponding to discrete energy levels These
resonant frequencies are determined by the shape of the molecular potential
energy surfaces the masses of the atoms and by the associated vibronic
coupling In order for a vibrational mode in a molecule to be IR active it must
be associated with changes in the permanent dipole In particular in the Born-
Oppenheimer and harmonic approximations ie when the molecular
Hamiltonian corresponding to the electronic ground state can be approximated
by a harmonic oscillator in the neighbourhood of the equilibrium molecular
geometry the resonant frequencies are determined by the normal modes
corresponding to the molecular electronic ground state potential energy
surface Nevertheless the resonant frequencies can be in a first approach
related to the strength of the bond and the mass of the atoms at either end of
it Thus the frequency of the vibrations can be associated with a particular
bond type
Simple diatomic molecules have only one bond which may stretch More
complex molecules have many bonds and vibrations can be conjugated
leading to infrared absorptions at characteristic frequencies that may be
related to chemical groups For example the atoms in a CH2 group commonly
Chapter 5 Catalysts preparation and characterization
168
found in organic compounds can vibrate in six different ways symmetrical and
antisymmetrical stretching scissoring rocking wagging and twisting
The infrared spectra of a sample are collected by passing a beam of infrared
light through the sample Examination of the transmitted light reveals how
much energy was absorbed at each wavelength This can be done with a
monochromatic beam which changes in wavelength over time or by using a
Fourier transform instrument to measure all wavelengths at once From this a
transmittance or absorbance spectrum can be produced showing at which IR
wavelengths the sample absorbs Analysis of these absorption characteristics
reveals details about the molecular structure of the sample
This technique works almost exclusively on samples with covalent bonds
Simple spectra are obtained from samples with few IR active bonds and high
levels of purity More complex molecular structures lead to more absorption
bands and more complex spectra The technique has been used for the
characterization of very complex mixtures
According to [10] problems in vibrational spectroscopy include low
transmission at high metal loadings and strong oxide scattering Absorption at
lower wavenumbers often prevents observation of modes such as adsorbate-
metal stretching Fourier Transform (FI-IR) spectrometers offer two
pronounced advantages over dispersive instruments higher energy throughput
and faster data acquisition or higher signal-to-noise ratio Data processing is
easy These features are significant when examining very strongly absorbing
and scattering solids and when following dynamic processes Much IR
transmission work however requires examination of only limited frequency
ranges at medium resolution and computerised dispersive spectrometers may
then be preferable
Chapter 5 Catalysts preparation and characterization
169
Experimental The FT-IR analysis have been made in collaboration with Perugia
University Infrared spectra were measured with a FTIR model IFS113V Bruker
spectrometer resolution of 1 cm-1 in the spectral region 370-5000 cm-1
Fig 58 FTIR model IFS113V Bruker spectrometer
5215 micro-Raman analysis
Raman spectroscopy is more versatile for catalysts characterization and in
comparison with IR spectroscopy it presents at least two important
advantages there is no need of sample preparation and the spectra of water-
metal interfaces are obtained easily and quickly
Raman spectroscopy is a spectroscopic technique used in condensed matter
physics and chemistry to study vibrational rotational and other low-frequency
modes in a system [27] It relies on inelastic scattering or Raman scattering of
monochromatic light usually from a laser in the visible near infrared or near
ultraviolet range The laser light interacts with photons or other excitations in
the system resulting in the energy of the laser photons being shifted up or
down The shift in energy gives information about the phonon modes in the
system Infrared spectroscopy yields similar but complementary information
Typically a sample is illuminated with a laser beam Light from the illuminated
spot is collected with a lens and sent through a monochromator Wavelengths
close to the laser line due to elastic Rayleigh scattering are filtered out while
Chapter 5 Catalysts preparation and characterization
170
the rest of the collected light is dispersed onto a detector Spontaneous Raman
scattering is typically very weak and as a result the main difficulty of Raman
spectroscopy is separating the weak inelastically scattered light from the
intense Rayleigh scattered laser light Raman spectrometers typically use
holographic diffraction gratings and multiple dispersion stages to achieve a
high degree of laser rejection In the past PMTs were the detectors of choice
for dispersive Raman setups which resulted in long acquisition times
However the recent uses of CCD detectors have made dispersive Raman
spectral acquisition much more rapid Raman spectroscopy has a stimulated
version analogous to stimulated emission called stimulated Raman scattering
The Raman effect occurs when light impinges upon a molecule and interacts
with the electron cloud of the bonds of that molecule The incident photon
excites one of the electrons into a virtual state For the spontaneous Raman
effect the molecule will be excited from the ground state to a virtual energy
state and relax into a vibrational excited state which generates Stokes Raman
scattering If the molecule was already in an elevated vibrational energy state
the Raman scattering is then called anti-Stokes Raman scattering A molecular
polarizability change or amount of deformation of the electron cloud with
respect to the vibrational coordinate is required for the molecule to exhibit the
Raman effect The amount of the polarizability change will determine the
intensity whereas the Raman shift is equal to the vibrational level that is
involved This technique is widely applicable The large frequency range (50-
4000 cm-1) makes adsorbate-adsorbent stretching modes accessible Problems
include specimen heating high background fluorescence and low signal
strengths Surface enhanced Raman scattering (SERS) however can give
greatly increased signals in favorable cases eg with rough surfaces or small
Chapter 5 Catalysts preparation and characterization
171
particles of certain compounds It is particularly useful in the studies of
supported monolayer catalysts and adsorbed layers [22]
Experimental The Micro-Raman analysis have been made in collaboration with
Perugia University Micro-Raman spectra were made by an Olympus
microscope mod BX40 connected to an ISA Jobin-Yvon model TRIAX320 single
monochromator resolution 1 cm-1 The exciting source was a Melles Griot
25LHP925 He-Ne laser used in single line excitation mode at 6328 nm The
power focused on the samples was always less than 2 mW The scattered
Raman photons were detected by a liquid-nitrogen cooled CCD Jobin Yvon
Mod Spectrum One Samples were not pre-treated but measured as a power
placed on a microscope slide in this way it is possible to analyse the few
microns grain size and not to focus on those regions where the presence of the
support (silica) was predominant The reproducibility of the spectra was always
controlled sampling different points of the catalyst Through the optical
microscope analysis we also verified that no local degradation occur during
laser irradiation
5216 ICP-MS analysis
ICP-MS (Inductively coupled plasma mass spectrometry) is a type of mass
spectrometry that is highly sensitive and capable of the determination of a
range of metals and several non-metals at very low concentrations It is based
on coupling together an inductively coupled plasma as a method of producing
ions (ionization) with a mass spectrometer as a method of separating and
detecting the ions ICP-MS is also capable of monitoring isotopic speciation for
the ions of choice A plasma is a gas that contains a sufficient concentration of
ions and electrons to make the gas electrically conductive The plasmas used in
Chapter 5 Catalysts preparation and characterization
172
spectrochemical analysis are essentially electrically neutral with each positive
charge on an ion balanced by a free electron In these plasmas the positive ions
are almost all singly-charged and there are few negative ions so there are
nearly equal numbers of ions and electrons in each unit volume of plasma
ICP for spectrometry is sustained in a torch that consists of three concentric
tubes usually made of quartz The end of this torch is placed inside an
induction coil supplied with a radio-frequency electric current A flow of argon
gas (usually 14 to 18 lmin) is introduced between the two outermost tubes of
the torch and an electrical spark is applied for a short time to introduce free
electrons into the gas stream These electrons interact with the radio-
frequency magnetic field of the induction coil and are accelerated first in one
direction then the other as the field changes at high frequency (usually 2712
million cycles per second) The accelerated electrons collide with argon atoms
and sometimes a collision causes an argon atom to part with one of its
electrons The released electron is in turn accelerated by the rapidly-changing
magnetic field The process continues until the rate of release of new electrons
in collisions is balanced by the rate of recombination of electrons with argon
ions (atoms that have lost an electron) This produces a lsquofireballrsquo that consists
mostly of argon atoms with a rather small fraction of free electrons and argon
ions The temperature of the plasma is very high of the order of 10000 K The
ICP can be retained in the quartz torch because the flow of gas between the
two outermost tubes keeps the plasma away from the walls of the torch A
second flow of argon (around 1 lmin) is usually introduced between the
central tube and the intermediate tube to keep the plasma away from the end
of the central tube A third flow (again usually around 1 lmin) of gas is
introduced into the central tube of the torch This gas flow passes through the
centre of the plasma where it forms a channel that is cooler than the
Chapter 5 Catalysts preparation and characterization
173
surrounding plasma but still much hotter than a chemical flame Samples to be
analyzed are introduced into this central channel usually as a mist of liquid
formed by passing the liquid sample into a nebulizer As a droplet of nebulised
sample enters the central channel of the ICP it evaporates and any solids that
were dissolved in the liquid vaporize and then break down into atoms At the
temperatures prevailing in the plasma a significant proportion of the atoms of
many chemical elements are ionized each atom losing its most loosely-bound
electron to form a singly charged ion
The ions from the plasma are extracted through a series of cones into a mass
spectrometer usually a quadrupole The ions are separated on the basis of
their mass-to-charge ratio and a detector receives an ion signal proportional to
the concentration
The concentration of a sample can be determined through calibration with
elemental standards ICP-MS also lends itself to quantitative determinations
through Isotope Dilution a single point method based on an isotopically
enriched standard
Experimental ICP measurements were determined by Inductively Coupled
Plasma-Optical Emission Spectrometers (ICP-OES) Varian 700-ES
Fig 59 Instrument Varian Liberty ICP-OES
Chapter 5 Catalysts preparation and characterization
174
Fig 510 scheme of instrument Varian Liberty ICP-OES
5217 XRD
The XRD analysis have been made in collaboration with Perugia University
The obtained materials were characterized by X-ray powder diffraction (XRD
PANalytical XrsquoPert Pro CuKα radiation) operating at 40 kV and 40 mA step scan
1 min_1 and 1 s counting time in the 2ndash40deg range at room temperature
Fig 511 Instrument XRD PANalytical XrsquoPert Pro CuKα radiation
522 Catalysts characterization results The characterization analyses were performed on the fresh and in some cases
on used catalysts ldquoFresh catalystsrdquo indicate the samples as prepared
ldquoActivated catalystsrdquo indicate the samples charged in the FTS reactor and
reduced using the activation procedure and removed from the reactor ldquoUsed
Chapter 5 Catalysts preparation and characterization
175
catalystsrdquo indicate the samples after their use in the Fischer-Tropsch synthesis
reaction
5221 BET characterization results
The BET results are reported in Table 54
Table 54 BET characterization results
CATALYST Specific Surface area
(m2g)
Co-based
HTlc
Co5 1746
Co10 1147
Co15 720
Co35 584
Co
synthesized
with US
CoSiO2 3600
CoAl2O3 1160
CoTiO2 550
Co-RuSiO2 3460
Co-RuAl2O3 1080
Co-RuTiO2 130
Fe-based
Fe30K20Cu375 TR 160
Fe30K20Cu375-MW1 180
Fe30K20Cu375-MW2 224
Fe30K20Cu375-US1 201
Fe30K20Cu375-US2 210
MW1= Catalyst put it into a kitchen MW and processed in powder MW2= Catalyst put it into MW and suspended in hexane US1= Catalyst suspended in aqueous solution in air atmosphere for 05 h US2= Catalyst sonicated and suspended in hexane in Argon atmosphere for 3h
The composition and specific surface area (SSA) of the HTlc are reported
in Table 54 Note that the SSA decreases with the increase of the
amount of cobalt The relatively large dimensions and high crystallinity
of particles reflect a low specific surface area [28] The surface area of
Co15 and Co35 after the reduction procedure was determined by BET
Chapter 5 Catalysts preparation and characterization
176
method The values obtained are 734 m2 g-1 for the sample Co15 and
783 m2 g-1 for the sample Co35 both higher than the untreated
materials
For the Co and Co-Ru based catalysts synthesized with the help of
ultrasound it is clear how the addition of the promoter show a
diminution of the SSA in every case (CoSiO2 3600 higher than the co-
respective Co-RuSiO2 with 3460 550 and 130 for Co and Co-RuTiO2
and 1160 and 1080 for Co and Co-RuAl2O3) The SiO2 acts as the best
support even in presence of the promoter The TiO2 tends to keep lower
the SSA of the catalyst and the Al2O3 represents an intermediate way of
the supports used in this group of catalysts
The surface area of catalysts is influenced by the method of synthesis
as shown in Table 55 and in Fig 512 Fe-based catalysts treated with
MW and US have higher values of SSA than the traditional ones the
effect of MW and US on SSA increases increasing the US or MW
emitting power
According to [1] The samples sonicated in argon (US2) present the
highest SSA indicating that the US effects in argon atmosphere are
more remarkable The use of this gas enhances cavitation effects
because increases the temperatures of the collapsing bubbles
generated by US [29] The change of catalysts morphology due to US
treatment (SEM analyses) could explain the increase of SSA in these
samples Catalysts prepared by MW show a higher SSA than the
traditional ones 180 and 224 m2 g-1 for the samples Fe30-MW1 and
Fe30-MW2 respectively with a similar increase of about 25 respect
the traditional prepared sample Moreover the surface area of these
Chapter 5 Catalysts preparation and characterization
177
samples seems not to be dependent on the power of the MW
treatment
Fig 512 Fe30K20Cu375 surface area vs different methods of synthesis
5222 TPR characterization results
Co-based catalysts HTLc
As discussed previously the active phase in the FTS is the metallic cobalt while
the HTlc materials contain Co(II) ions randomly dispersed inside the brucitic
layers Therefore in order to have an active catalyst a reduction procedure is
required to form the cobalt particles TPR analyses were performed to study
the reduction process and select the best conditions for the catalyst activation
Fig 513 shows the TPR profile of the samples Co5 Co15 Co35 while Table 55
reports the reduction temperature and the percentage of reduced Co All the
profiles exhibit two regions of reduction the first at lower temperatures
(below 400degC) which is due to the reduction of Co3O4 while the second peak
above 700 degC indicates the presence of hardly reducible species These species
are probably spinel-type mixed oxides formed during the thermal treatment
TPR profiles of CoOx mixed oxides is well described in the literature [30-36]
The reduction profile of Co3O4 in the low temperature region consists in two
peaks corresponding to the reduction of Co3+ to Co2+ and Co2+ to Co0
Chapter 5 Catalysts preparation and characterization
178
According to Alvarez et al [37] these two peaks are well separated for samples
with small particle size while an intermediate particle size causes the
overlapping of the two reduction steps resulting in a complete reduction with
only one maximum at an intermediate temperature (328 degC) The TPR profiles
of our HTlc (Fig 513) are consistent with the latter case Based on the TPR
results (Table 55) the tested catalysts were activated at 350degC for 4 hours
under hydrogen atmosphere in order to reduce the Co ions to metallic Co
Fig 513 TPR profile of the fresh samples Co5 Co10 Co15 Co35 The activation
temperature used in the FTS reactor before the catalytic test is indicated with the
dashed line
Chapter 5 Catalysts preparation and characterization
179
Note that the sample Co15 exhibit the lowest reduction temperature that is
significantly lower than the activation temperature adopted in the FT process
(350degC) A low reduction temperature may favour the presence of catalyst in its
reduced state during the catalytic process The of reduced Co evaluated by
TPR is generally high However these values strongly depend on reduction
conditions (pressure temperature ramp gas flow etc) that are different from
those used in the FT reactor as detailed in the experimental section
Table 55 Reduction temperature and of cobalt reduction of the fresh samples Co5
Co15 Co35
Sample TPR
Tmax (degC) Co Red
Co5 328 58
Co15 278 54
Co35 295 83
Co and Co-Ru catalysts synthesized with US
Table 56 shows the TPR profiles of the samples CoAl2O3 CoSiO2 CoTiO2
and Co-RuAl2O3 Co-Ru SiO2 Co-Ru TiO2
Chapter 5 Catalysts preparation and characterization
180
Table 56 TPR diagrams and values summary for Co and Co-Ru catalysts with US
Catalyst TPR Profile
CoAl2O3
Co SiO2
CoTiO2
Co-RuSiO2
Co-RuAl2O3
Co-RuTiO2
Iron catalysts
Chapter 5 Catalysts preparation and characterization
181
For the supported iron based catalysts three stage of phase transformation
could be identified starting from oxidised form of iron hematite (Fe2O3) to
magnetite (Fe3O4) magnetite to metallic iron (-Fe) [39] It is known [39-40]
that copper promotes the reduction to hematite to magnetite and also the
reduction of magnetite to -Fe to a lesser extent but it needs to be very well
mixed with iron to provide the most favourable promoter effect on the
hematite rarr magnetite phase transformation For what concerns the support
(silica) Jin and Datye [38] observed that the most important effect of silica is
an improvement in the thermal stability of the catalysts in fact the silica
support is very effective at inhibiting the sintering of the iron catalyst
The results of TPR characterization for iron catalysts are reported in Table 57
The number the position and the shape of the peaks agree with literature [38]
In many cases the TPR peaks corresponding to transformations of CuO rarr Cu
and Fe2O3 rarr Fe3O4 were found to overlap and this is the first peaks at low
temperature The second broad peak at higher temperature on the TPR profile
corresponds to the phase transformation of Fe3O4 rarr -Fe The large peak
width for this last transformation indicates this is slow process
TPR analyses show that the metal reduction starts at about 230degC for promoted
catalysts According to Pirola [2] it is clear therefore the role of Cu in the
improvement of iron oxide phases reduction as well known in literature a
suggested mechanism for this promotion effect is the migration of atomic
hydrogen from reduced Cu sites to the iron oxide [38 40]
Therefore the different preparation methods do not influence the peaks
temperature of the reduction steps of the catalytic samples in any case
Chapter 5 Catalysts preparation and characterization
182
Table 57 TPR diagrams and values summary for Fe30K20Cu375 catalysts with different
methods of synthesis
Catalysts Diagrams
Fe30K2Cu375SiO2
Fe30K2Cu375SiO2
(MW2)
Fe30K2Cu375SiO2
(MW1)
Fe30K20Cu375 SiO2 (US1)
305133 467463
800
Temperature degC0 200 400 600 800
800
Sig
na
l (
mV
)
0
200
400
600
800
5223 SEM ndash TEM characterization results
Chapter 5 Catalysts preparation and characterization
183
SEM analyses are reported in Fig 514 (for HTlc) Fig 515 (for Co and Co-Ru
with US) and in Fig 516 (for Fe catalysts)
Cobalt Catalysts
o HTlc
The morphology of the synthesized HTlc was investigated by SEM and TEM
Images of Co15 and Co35 selected as representative samples (Fig 514 a-d)
show that they are constituted by homogeneous aggregates of hexagonal and
platy particles of few hundreds nanometers of thickness and with a
dimensional range between 2-5 μm In TEM micrographs the hexagonal
morphology of HTlc microcrystals is clearer The relatively large dimensions and
high crystallinity of particles reflect a low specific surface area in the range of
6-18 m2g-1 (Table 54) Composition maps of Co15 (Fig 515) obtained with
coupled SEM-EDS analysis highlight the homogeneous Co Zn and Al dispersion
over the entire analyzed spot area without creating single-metal domains
indicating good metal distributions in the samples Similar dispersion
characteristics were obtained for all the samples studied although not
reported here for the sake of brevity
Fig5 14 SEM (left) and TEM (right) images of fresh samples Co15 (ab) and Co35 (cd)
Chapter 5 Catalysts preparation and characterization
184
Fig5 15 SEM image of fresh sample Co15 and the corresponding EDS images of the
metals Al (red) Co (white) and Zn (pink)
SEM and TEM images of two activated samples are reported in Fig 16a-d The
results indicate that the material keeps the original morphology with hexagonal
crystals of micrometric dimensions At higher magnification (TEM images) the
segregation of dense particles homogeneously distributed on the surface and
having dimensions of about 8 nm probably due to metallic Co was evident
[41]
Fig 516 SEM (left) and TEM (right) images of activated Co15 (ab) and Co35 (cd)
SEM images of Co5 Co15 and Co35 after the catalytic run at 260degC are shown
in Fig 517 Samples containing Zn (Co5 and Co15) reveal the presence of a
Chapter 5 Catalysts preparation and characterization
185
nanometric phase crystallized on the catalyst surfaces The absence of this
nanometric phase on Co35 surface (which does not contain Zn) may indicate
the presence of ZnO according to the XRD pattern (it will be show later)
Fig517 SEM images of Co5 (ab) Co15 (cd) Co35 (ef) after catalytic run at
260degC and 20 bar and at different magnifications
o Co and Co-Ru synthesized with US The Fig 518 show the SEM
analyses of the samples with and without the presence of Ru
The chemical effect of US arises from acoustic cavitation ie the
formation growth and implosive collapse of bubbles in a liquid
Some of the interesting features resulting from the application
of sonication as a synthetic method are the nanoparticles
Chapter 5 Catalysts preparation and characterization
186
preparation showing a more uniform size distribution higher
surface area and a more controlled phase composition
(Fig518)
Fig 518 SEM analyses for Co based catalysts with US Magnification 2000X
Iron Catalysts
SEM analyses are essential to evaluate the morphology of catalysts with high
loading of iron and to control the metal dispersion The iron covers the surface
of silica in a progressive level with its increase and it is well distributed in the
more loaded catalyst too [40]
Chapter 5 Catalysts preparation and characterization
187
The aggregates of iron with spherical shape are regularly distributed on the
support In the case of the catalysts prepared with the step of ultrasound it
can be seen an uniform layer of iron on SiO2 The spherical shape aggregates
are substituted by this iron layer The catalyst morphology and the metal
dispersion are similar for the two US samples [43]
SEM analyses (Fig 519) have been the key to both evaluate the morphology of
all the prepared catalysts and observe their metal distribution (using EDX
analysis) Notwithstanding this general trend both the morphology and the
shape of iron aggregates strongly depend on preparation method In Fig 519
SEM analysis of samples through different preparation methods are reported
In the traditional prepared sample (Fig 519a) it is possible to observe Fe
spherical shape aggregates on the bare silica surface Iron is present only in
these particles and coverage of the support is not complete The same
morphology is present in the MW prepared sample (Fig 519b) On the
contrary on US prepared ones (Fig 519c (air) and 519d (argon)) there is a
uniform layer of iron on SiO2 The support in fact is not easily visible due to its
complete coverage as confirmed by SEMndashEDX analyses The spherical shape
aggregates are substituted by this iron layer both the catalyst morphology and
the metal dispersion are similar for the two US samples but completely
different with both the traditional and the MW ones
It is even more interesting the comparison between samples prepared by
different sonication time for example Fe30-US2 (Fig 519c) and Fe30-US1 (Fig
519d) when the US treatment is performed for 05 h the surface seems to be
covered by Fe small leafs that are completely faded when sonication is
prolonged for 3 h and in their place only crashed Fe clusters are present [1]
Chapter 5 Catalysts preparation and characterization
188
a) Traditional b) MW2
c) US1 d) US2
Fig 519 SEM analyses for iron catalysts Magnification 2000X
5224 XRD and micro-RAMAN characterization results
Cobalt Catalysts
o For the HTlc the XRD and micro-RAMAN analyses Figure 520
shows the XRD patterns of the samples listed in Table 51 The
interlayer distance of 89 Aring determined from the first XRD
reflection is compatible with the presence of nitrate between
the sheets [43]
Chapter 5 Catalysts preparation and characterization
189
Fig 520 XRD pattern of the fresh samples (a) Co5 (b) Co10 (c) Co15 and (d) Co35
Activated HTlc were first characterized by XRD As an example the XRD pattern
of activated Co15 is reported in Fig 521 The pattern shows the presence of
very poorly crystalline ZnO and a spinel phase such as Co3O4 CoAl2O4 andor
ZnAl2O4 (note that mixed-oxide spinel phases show very similar XRD patterns
irrespective of their composition) Moreover the reflection at 43deg 2has been
assigned to a CoO phase with very low crystallinity and no metal aggregation is
observed The sample after the reduction treatment does not show metallic Co
phases indicating the presence of active metal atoms homogeneously
dispersed at the nanometer level [44] According to Jong et al [45] and Den
Breejenet et al [46] cobalt-based catalysts need large particle size of the active
species to create optimal domains of active sites because the activity drops for
particles smaller than 6 nm
Chapter 5 Catalysts preparation and characterization
190
Fig 521 XRD pattern of activated Co15 ZnO Co3O4 CoAl2O4 ZnAl2O4 sect CoO
In order to better understand the stability of the materials XRD patterns of
sample Co15 after the catalytic tests at two different temperatures (235degC and
260degC) were collected (Fig 522) At the lower temperature (Fig 522 a) the
pattern is close to that recorded just after the reduction process (Fig 521)
Therefore we can hypothesize that the catalyst does not change as a
consequence of the FTS process On the other hand the XRD pattern of the
catalyst recovered after the reaction at 260degC (Fig 522b) shows more
crystalline ZnO and spinel phase and the strong reduction of the peak assigned
to CoO This may indicate that during the FTS process at high temperatures
cobalt ions crystallized into a spinel phase
Chapter 5 Catalysts preparation and characterization
191
Fig522 XRD pattern of used Co15 after catalytic runs a) at 235degC and
20 bar and b) at 260degC and 20 bar ZnO Co3O4 CoAl2O4 ZnAl2O4 sect
CoO
Iron catalysts
The XRD and micro-RAMAN analyses were made to identify the iron phase
after the calcination treatments A Raman spectrum (Fig 523a) and an XRD
pattern (Fig 523b) for Fe30K2Cu375SiO2 are reported
Chapter 5 Catalysts preparation and characterization
192
Fig 523 a) Micro-Raman analysis and b) XRD for the Fe30K2Cu375SiO2 catalyst
Comparing these results with the tables reported in literature [47-48] for the
assignment of the peaks it is possible to conclude that the iron after calcination
is present as hematite Fe2O3 as expected and as reported in literature [39]
5255 ICP characterization results ICP analysis was made to verify the catalysts composition
Cobalt based catalyst
o HTlc In Table 58 the results are reported
Table 58 ICP characterization results for Co catalysts (HTlc)
HTlc
Atomic percentage in solution Basic Formula
Zn Co Al
Co5 55 15 30 [Zn057
Co010
Al033
(OH)2](NO
3)033
middot05 H2O
Co10 45 25 30 [Zn045
Co021
Al034
(OH)2](NO
3)034
middot05 H2O
Co15 35 35 30 [Zn039
Co032
Al029
(OH)2](NO
3)029
middot05 H2O
Co35 - 70 30 [Co067
Al033
(OH)2](NO
3)033
middot05H2O
Chapter 5 Catalysts preparation and characterization
193
o Co and Co-Ru with US In Table 59 the results are reported
Table 59 ICP characterization results for Co catalysts
Sample Co wt Ru wt
Co10 80 -
Co10Ru01 80 008
In general these results indicate the composition of catalysts is in good
agreement with the theoretical values
Iron based catalysts In Table 510 the results are reported
Table 510 ICP characterization results for Fe catalysts
Sample Fe wt K wt Cu wt
Fe30K20Cu375 314 19 40
5226 XRD and micro-RAMAN characterization results
Cobalt Catalysts
o For the HTlc the XRD and micro-RAMAN analyses
In order to better understand the behaviour of the materials after activation
FT-IR spectra of the sample Co15 (as a representative sample) calcined and
activated and Co3O4 have been registered (Fig 526) The spectrum of Co15
showed the typical absorption bands of the nitrate anion at 1377 cm-1 present
in the interlayer region of HTlc After calcination this band disappeared due to
nitrate degradation and the spectrum presented the typical absorptions of
Co3O4 spinel phase at 667 cm-1 and 566 cm-1 The activation process leads to
the formation of a material with very wide bands attributed to the Co3O4
phase
Chapter 5 Catalysts preparation and characterization
194
Fig 524 FT-IR spectra of the fresh and activated Co15 and of the reference Co3O4
References
[1] C Pirola C L Bianchi A Di Michele P Diodati D C Boffito V Ragaini Ultrasonic Sonochem 17610-616 (2010) [2] C Pirola PhD 2007-2008 Novel supported iron based Fischer-Tropsch catalysts Preparation characterization and applications [3] GPVaan Deer Laan AACMBeenackers CatalRev-SciEng41 (3amp4) (1999) 255 [4] YJin AKDatye Journal of catalysis 196 (2000) 8 [5] Costantino U Marmottini F Nocchetti M Vivani R Eur J Inorg Chem 1998 101439 -1446 [6] C Pirola CL Bianchi A Di Michele P Diodati S Vitali V Ragaini Catal Lett 131 (2009)294-304
Chapter 5 Catalysts preparation and characterization
195
[7] G Biffi Gentili M Linari I Longo A Ricci A IEEE Transactions on microwave theory and techniques 57 (9-2009) 2268-2275 [8] BToukoniitty JPMikkola DYuMurzin TSalmi Applied Catalysis A General 279 (2005) 1 [9] KSSuslick Sonocatalysis Handbook of Heterogeneous Catalysis VCH Verlagsgesellschaft mbH Weinheim Germany (1997) 1350 [10] BToukoniitty JPMikkola DYuMurzin TSalmi Applied Catalysis A General 279 (2005) 1 [11] WBonrath Ultrasonics Sonochemistry 12 (2005) 103 [12] CLBianchi VRagaini Catalysis Letters 95 (2004) 61 [13] CLBianchi FMartini VRagaini Ultrasonics Sonochemistry 82 (2001) 131 [14] Zhao R Goodwin JG Jr Jothimurugesan K Gangwal SK Spivey JJ (2001) Ind Eng Chem Res 401065 10 [15] Yang Y Xiang HW Tian L Wang H Zhang CH Zhong B Li YW (2005) Appl Catal A 284105 [16] Suo Haiyun Zhang Chenghua Wu Baoshan Xu Jian Yang Yong Xiang Hongwei Li Yongwang Cat Today Volume 183-1 (2012) 88ndash95 [17] Donatti DA Ruiz AI Vollet DR (2002) Ultrason Sonochem 9133 [18] Yang Y Xiang HW Tian L Wang H Zhang CH Zhong B Li YW (2005) Appl Catal A 284105 [19] Fadoni M and Lucarelli University of Milan and CE Instruments (Thermoques SpA) [20] F M NELSEN and Ff EGGERTSEN Shell Development Co Emeryville Calif ANALYTICAL CHEMISTRY VOL 30 NO 8 AUGUST 1958 1387-1390 [21] 11 S Brunauer P H Emmett and E Teller J Am Chem Soc 60 (1938) 309 [22] JHaber JHBlock and BDelmon Pureampappl Chem 67 Nos 89 (1995) 1257 [23] SDRobertson BDMcNicol JHDe Baas SCKloet JWJenkins JCatal 37 (1975) 424 [24] Von Ardenne Manfred Das Elektronen-Rastermikroskop Theoretische Grundlagen Zeitschrift fur Physik 108 (1938) 553 [25] Von Ardenne Manfred Das Elektronen-Rastermikroskop Praktische Ausfuumlhrung Z Techn Phys 108 (1938) 407 [26] Ludwig Reimer Helmut Kohl Springer Series in Optical Sciences 36 fifth edition 2008 Transmission Electron Microscopy Physics of Image Formation [27] Gardiner DJ (1989) Practical Raman spectroscopy Springer-Verlag ISBN 978-0387502540 [28] A Di Fronzo C Pirola A Comazzi F Galli CL Bianchi A Di Michele R Vivani M Nocchetti M Bastianini DC Boffito Fuel 119 (2014) 62-69
Chapter 5 Catalysts preparation and characterization
196
[29] TJ Mason JP Lorimer Sonochemistry Ellis Horwood Chichester 1988 p 58 [30] Bianchi CL Catal Lett 2001 76(3ndash4)155-159 [31] Lin HY Chen YW Li C Thermochim Acta 2003 40061ndash67 [32] Lin HY Chen YW Mater Chem Phys 2004 85171ndash175 [33] Sexton BA Hughes AE Turney TW J Catal 1986 97(2)390ndash406 [34] Kumar N Payzant EA Jothimurugesan K Spivey JJ Phys Chem Chem Phys 2011 1314735ndash14741 [35] Tsakoumis NE Dehghan R Johnsend RE Voronov A Van Beek W Walmsley JC Borg Oslash Rytter E Chen D Roslashnning M Holmen A Catal Today 2013 20586ndash93 [36] Tsakoumis NE Roslashnning M Borg Oslash Rytter E Holmen A Catal Today 2010 154162ndash182 [37] Alvarez A Ivanova S Centeno MA Odriozola JA Appl Catal A 2012 431-4329-17 [38] YJin AKDatye Journal of catalysis 196 (2000) 8 20 [39] DBBukur KOkabe MPRosynek CPWang DJRao KRPM and GPHuffman JCatal 155 (1995)353 [40] YYang HXiang YXu LBai YLi ApplCatalA 266 (2004) 181 [41] 32 Rudolf C Dragoi B Ungureanu A Chirieac A Royer S Nastro A Dumitriu E Catal Sci Technol DOI 1011039C3CY00611E [42] C Pirola CL Bianchi A Di Michele S Vitali V Ragaini Catal Comm 10 823 (2009) [43] Iyi N Fujii K Okamoto K Sasaki T Appl Clay Sci 2007 35218-227 [44] CL Bianchi C Pirola DC Boffito A Di Fronzo A Di Michele R Vivani M
Nocchetti M Bastianini S Gatto Co-Zn-Al based hydrotalcites as catalysts for
Fischer-Tropsch process Proceeding of DGMK Conference 2011
CatalysisInnovative Applications in Petrochemistry and Refining 4-6 October
2011 Dresden Germany ISBN 978-3-941721-17-3
[45] Leendert G Bitter JH Kuipers HPCE Oosterbeek H Holewijn JE Xu X
Kapteijn F Jos van Dillen A Krijn P J Am Chem Soc 2006 1283956-3964
[46] 31 Den Breejen JP Radstake PB Bezemer GL Bitter JH Froslashseth V Holmen A Krijn P J Am Chem Soc 2009 1317197-7203 [47] Thickett and Oldyha JThermAnalCal 80 (2005) [48] MALegodi Dde WaalDyes and Pigments 74 (2007) 161
197
Chapter 6 High Fe Loaded Supported Catalysts for Biosyngas Fischer ndash Tropsch Conversion experimental and simulation results 6 Development of the kinetic model One of the objectives of this research work was the development of a kinetic
model for the synthesis of FT in collaboration with the Politecnico di Milano
This model based on experimental data obtained in the pilot plant using iron
based catalyst (Fe30K20Cu375) at different temperatures and different H2CO
ratios allows to obtain and simulate the performance of these catalysts at
temperatures and ratios of incoming flows feeding different
The modeling work has not been limited to the laboratory scale since it is
possible to predict the trend of the reaction kinetics using these types of
catalysts in reactors with much greater volumes and integrated in an entire
industrial process such as the use of biosyngas for FT synthesis obtained from
biomass
61 Regression of kinetic constants After obtaining the experimental data it is necessary to regress them With the
regression we could obtain the respective kinetic constants
The model is based on the fact that both reactions the FT reactions and WGS
are active therefore we will need to regress the rate constants of both
reactions which we call kFT (kinetic constant of the FT reaction) and kWGS
(kinetic constant of the WGS reaction)
The equations that express the reaction rate of the two reactions are [1] For the FT reactions
Chapter 6 High Fe Loaded Supported Catalysts for Biosyngas Fischer ndash Tropsch Conversion experimental and simulation results
198
For the WGS reaction
From these equations we note that the reaction rate in both cases is a
function of the partial pressures of the reactants (CO and H2) of the products
(H2O and CO2) of the constants (aFTWGS e bFTWGS) and the equilibrium constant
Kp expressed as
From the regression of the reaction rate constants is obtained the K0i These
values are correlated to the kFTWGS through the equation
The parameter values of the previous reports were obtained with a regression
using the MATLAB software based on the method of least squares from the
experimental data using the original coefficients K0FT k0WGS aFT aWGS bFT bWGS
as values of the first iteration [2] The software allows the regression of k0i
establishing an objective function that must be minimized as much as possible
(10-6 tolerance basis of MATLAB)
There was no regression of the activation energy of the two reactions but kept
constant as reported in literature [2]
The probability of growth of the hydrocarbon chain is instead given by the
correlation developed by Lox and Froment [3-4] or iron based catalysts
Chapter 6 High Fe Loaded Supported Catalysts for Biosyngas Fischer ndash Tropsch Conversion experimental and simulation results
199
For the regression of the data there were not taken into account the energy
balances because we consider an isothermal catalytic bed The drop pressure is
neglected since it can be assumed that in the whole catalytic bed the pressure
is constant at 20 bar and the efficiency of the catalyst was considered unitary
On the contrary these aspects must be taken into account if we are working
with industrial volumes
62 Mass Balance In the kinetic model have been fully taken into account (even on lab-scale) the
mass balances shown in the equations below
Mass balance equations in the gas phase
Where ε degree of vacuum
a catalyst surface per unit volume
(Pis-Pib) pressure difference of the reactants between the bulk and the
solidrsquos surface
ν stoichiometric coefficient
r reaction in homogeneous phase
Chapter 6 High Fe Loaded Supported Catalysts for Biosyngas Fischer ndash Tropsch Conversion experimental and simulation results
200
If it does not consider gas-phase reactions but only on the surface of the
catalyst
Mass balance on the solid
Where ρ density of the catalyst
Mi molecular weight
It gets
Where is the total mass flow and is the mass fraction of i component
63 Energy Balance As previously mentioned in the modeling of laboratory scale is not considered
any heat balance in the catalytic bed because it is considered as isothermal
one however in the case of modeling a reactor in industrial volumes the
energy balance will be addressed in this way
Energy balance equation in the gas phase for a plug-flow reactor (PFR)
Chapter 6 High Fe Loaded Supported Catalysts for Biosyngas Fischer ndash Tropsch Conversion experimental and simulation results
201
Where Cpi Specific heat of the i species
h Laminar coefficient
(Ts-T) the temperature difference between the surface and the bulk
∆Homk entalphy of the K-esimo reaction in gas phase
U overall heat transfer coefficient
If there are no gas-phase reactions
Energy balance on the solid
64 Pressure variation
As for the energy balance also the P has not been taken into account in the
modeling however in the case of simulations of kinetic tests over PFR reactors
in industrial volumes it will be necessary to take them into account because
before and after the catalytic bed there will be a difference of pressure
The equation that allows to calculate the pressure drop in a fixed bed reactor is
the Ergunrsquos equation
Chapter 6 High Fe Loaded Supported Catalysts for Biosyngas Fischer ndash Tropsch Conversion experimental and simulation results
202
With
Where u velocity surface
Re Reynolds number
Dp diffusion coefficient
Ai inlet area of the tube
65 Catalyst Efficiency The efficiency of the catalyst considered unitary to simplify the model on
laboratory scale can not be considered as such in real systems and especially
of large reactors where the problems of diffusion of the reactants on the
catalyst surface are no longer negligible
The efficiency of the catalyst is expressed with the equation
Where T Bulk temperature
Ts surface temperature
Pi pressure of i species in the bulk
Pis pressure of the i species in the surface
Vp volume of the particle catalyst
Chapter 6 High Fe Loaded Supported Catalysts for Biosyngas Fischer ndash Tropsch Conversion experimental and simulation results
203
References
[1] WH Zimmerman DB Bukur Reaction kinetics over iron catalysts used for
Fischer-Tropsch synthesis The Canadian journal of chemical engineering (68)
1990 p 292-301
[2] Ahmad Rafiee Optimal design issues of a gas-to-liquid process Thesis for
the degree of Philosophy Doctor Norwegian University of Science and
Technology Faculty of Natural Sciences and Technology Chemical Engineering
Department2012
[3] ES Lox GF Froment Kinetics of the Fischer-Tropsch reaction on a
precipitated promoted iron catalyst 2 Kinetic modeling Ind Eng Chem Res
(32) 1993 p71-82
[4] ES Lox GF Froment Kinetics of the Fischer-Tropsch reaction on a
precipitated promoted iron catalyst 2 Kinetic modeling Ind Eng Chem Res
(32) 1993 p 61-70
204
Chapter 7 Fischer Tropsch runs results and discussion
In this chapter the experimental results concerning the FT runs will be
presented in term of CO conversion and of products selectivity toward CO2
CH4 light hydrocarbons (lt C7) and heavy hydrocarbons (gt C7) To join all these
data the parameter ldquoyield C2+rdquo will be reported too This parameter is defined
in the following equation
Yield C2+ = CO conversion x (selectivity ltC7 +selectivity gtC7) (1)
then the selectivity to CO2 and CH4 (undelivered products) is not taken into
account by this parameter The data concerning all the products distribution
ie selectivity for each carbon atom number have been collected in this PhDrsquos
research work for all the catalysts and all the experimental conditions but for
practical space of reasons they are not here reported
The results could be divided into two groups The experimental runs with two
kind of catalytical systems it means cobalt based catalysts and iron based
catalyst (kinetic runs) and the development of a kinetic model for the sample
Fe30K2Cu375 The selection is related to the better performance in terms of
stability
More in detail
Kinetic Runs
Cobalt based catalysts
HTlc The activated samples were tested at different temperatures in
the FTS plant following the procedure reported in the experimental
section In Fig 71 the CO conversion vs the reaction temperature is
Chapter 7 Fischer Tropsch runs results and discussion
205
reported for all the catalysts while the products selectivity is displayed in
Table 71
Fig 71 molar CO conversion to Co5 () Co10 () Co15 (diams) Co35 () obtained at
different reactor temperatures after 24 hours of reaction
As expected for each catalyst the activity is strongly influenced by the reaction
temperature the higher the temperature the higher the CO conversion but
also the selectivity towards CO2 CH4 and light hydrocarbons is favored by a
higher temperature The CO conversion is similar for Co5 and Co10 while it is
higher for the two samples with a larger amount of cobalt ie Co15 and Co35
In particular Co15 exhibits the highest CO conversion at all the selected
temperatures In FTS it is fundamental to obtain low quantities of CH4 and CO2
(undesired products) to favor the formation of higher hydrocarbons For this
reason temperatures in the 220-235degC range are more suitable than the higher
ones
Moreover Table 71 shows that Co15 exhibits the highest CO conversion and
the highest C2+ total yield (without considering CH4 and CO2 see note in Table
71) also at the lowest temperature (220degC) which is so important from an
economical point of view This result confirms that Co15 is the best performing
catalyst obtained in this part of the study
Chapter 7 Fischer Tropsch runs results and discussion
206
Table 71 FTS products selectivity at different reactor temperatures
Sample Temperature
(degC)
Products Selectivity C2+
Yield CO2 CH4 leC7 gtC7
Co5 220 03 29 33 934 165
235 03 59 104 834 194
245 11 85 127 776 224
260 19 141 160 679 300
Co10 220 32 26 98 844 155
235 38 49 143 769 178
245 33 60 154 753 218
260 81 163 413 343 262
Co15 220 14 101 17 705 467
235 81 262 473 185 498
250 178 177 443 202 491
Co35 220 14 39 103 844 250
235 18 96 234 651 395
245 51 257 656 105 473
leC7 all the hydrocarbons in the range C2-C7 gtC7 all the hydrocarbons greater than C7 Product lsquolsquoirdquo selectivity = (moles C in product i) (converted moles C) x 100 C2+ yield = CO conversion x (selectivity leC7 + selectivity gtC7) x10-2
The obtained data suggest the possibility of using synthetic hydrotalcites as Co-
based catalysts for FTS and pursuing subsequent studies on the same subject
Similar trends were obtained in ldquoUnit 2rdquo at lower temperatures and lower
amount of cobalt (Co10 and Co15) (Table 72)
Chapter 7 Fischer Tropsch runs results and discussion
207
The stability of these catalysts in the operating conditions adopted in the
catalytic tests (P le 20 MPa and T le 350degC) was evaluated by comparative
analysis between fresh samples and samples discharged from the reactor
maintained at high pressures and temperatures
Table 72 FTS products selectivities at different reactor temperatures Two different
pilot plants with the same flow sheet
Sample Temp
(degC)
CO
Conv
()
Products Selectivity C2+
Yield CO2 CH4 leC7 gtC7
Co10
(Unit 1)
220 170 32 26 98 844 155
235 207 38 49 143 769 178
245 248 33 60 154 753 218
260 358 81 163 413 343 262
Co10
(Unit 2)
220 147 01 12 53 935 145
235 180 15 32 73 880 171
245 891 140 291 393 176 506
Co35
(Unit 1)
220 264 14 39 103 844 250
235 446 18 96 234 651 395
245 621 51 257 656 105 473
Co35
(Unit 2)
220 473 50 224 296 431 343
235 768 162 205 288 345 485
245 998 154 241 322 282 604
leC7 all the hydrocarbons in the range C2-C7gtC7 all the hydrocarbons greater
than C7Product lsquolsquoirdquo selectivity = (moles C in product i) (converted moles C) x
100 C2+ yield = CO conversion x (selectivity leC7 + selectivity gtC7) x10-2
It is important to highlight that the aim of this work was the evaluation of the
possibility to use HTlc as a new kind of catalyst for the Fischer-Tropsch process
rather than a quantitative comparison with other kinds of traditional FTS
catalysts Moreover a reliable comparison between HTlc and traditional cobalt
Chapter 7 Fischer Tropsch runs results and discussion
208
based FTS catalysts is very difficult due to the different structural and
morphological features (surface area metal dispersion morphological
structure reduction properties porosity and so on) which are involved in the
very complex catalytic systems for the FTS Nevertheless from a qualitative
point of view it is possible to conclude that this new kind of catalytic materials
for FTS process give results fully comparable with those obtained by traditional
supported cobalt As general behaviour it is possible to state that cobalt
catalysts are characterized by high CO conversion high heavy hydrocarbons
selectivity and low light hydrocarbons CH4 and CO2 selectivity The wide
literature concerning traditional Co-based catalysts is rich of different examples
that depending on several operative parameters and preparation procedure
give different FTS results but always following the general trends reported by
the previous papers Some exhaustive examples are shown in a recent review
of Qinghong et al [1] and Muthu et al [2]
Co and Co-Ru
The use of ultrasound (US) might be very efficient to optimize the dispersion of
a so high metal charge as already verified in our laboratory in the past [3-4]
This special type of synthesis should give at the catalyst a particular structure
with a high surface area and a high metal dispersion that improves its activity
towards the synthesis of Fischer-Tropsch In the case of cobalt supported
catalysts a simple ultrasound step has been added in the catalyst preparation
As regard the results presented in table 73 it can be seen how all the samples
resulted active in FTS in particular the bimetallic samples give high CO
conversion with a noteworthy selectivity towards heavy hydrocarbons The
Chapter 7 Fischer Tropsch runs results and discussion
209
support plays a crucial role and in particular TiO2 based samples are the most
active
Moreover Table 73 shows that Co-RuSiO2 exhibits the highest selectivity
towards heavy hydrocarbons and the highest C2+ total yield (without
considering CH4 and CO2 see note in Table 73) This result confirms that Co-
RuSiO2 is the best performing catalyst obtained in this part of the study
Table 73 CO Conversion C2+total yield CH4 CO2 light hydrocarbon and heavy
hydrocarbon selectivity of CoCo-Ru based catalyst at T=255degC
Catalyst
CO
Conv
()
C2+
total
yield
Selectivity ()
CH4 CO2 ltC7 gt C7
CoTiO2 28 23 5 14 10 71
CoSiO2 6 5 19 6 23 52
CoAl2O3 8 6 13 7 19 61
Co-RuTiO2 98 73 18 8 14 60
Co-RuSiO2 94 82 9 4 8 79
Co-RuAl2O3 84 73 11 2 12 75
As we have seen from the BET and TPR analysis the support and the promoter
play a key role in the performance of the catalyst because they are responsible
for the modification of some key parameters such as surface area and the
metal dispersion
Iron based Catalysts
With regard to the treatment with the help of US (see table 74) it can be
concluded that the sonication of an aqueous mixture salts and precursors of
support (US1) is preferable instead of to the calcined catalyst suspended in
Chapter 7 Fischer Tropsch runs results and discussion
210
non-polar solvent such as hexane (US2) With regard to treatment with MW
(see table 74) there were obtained better results in term of CO conversion
with the powder catalyst treated directly in the MW (MW1) while the test
conducted by suspending the catalysts in hexane and then treated in a MW
reactor (MW2) for an hour did not give valid results The best FTS results in
term of C2+ yield (41) has been obtained using MW1 while in tem of CO
conversion (58) using US1 All of them gave FTS results better than the
traditional one Itrsquos evident that the use of US or MW optimizes the catalytic
performance in accord with previous similar results [4]
In agreement with [5] the FTS results show that TEOS as silica source is
favorable for the enhancement of the FTS activity
Table 74 Catalytic Results of Fe30K20Cu375 Different preparation techniques Support
SiO2 Diluting Material α-Al2O3 T=220degC
Preparation CO Conv ()
C2+
Total yield
Selectivity ()
CO2
CH4
lt C7
gt C7
TR 49 32 27 7 22 44
MW1 52 41 17 5 18 60
MW2 32 24 17 8 27 48
US1 58 38 29 6 22 43
US2 36 25 22 9 30 39
Co-precipitation
38 32 2 13 28 57
leC7 all the hydrocarbons in the range C2-C7 gtC7 all the hydrocarbons greater than C7 Product lsquolsquoirdquo selectivity = (moles C in product i) (converted moles C) x 100 C2+ yield = CO conversion x (selectivity leC7 + selectivity gtC7) x10-2
The co-precipitation test was made at T=250degC and TEOS as a support
Iron based Catalysts
Chapter 7 Fischer Tropsch runs results and discussion
211
To work with this part it is important to know the effect of the H2 CO ratio in
the feeding gas The FTS for the production of liquid hydrocarbons from
synthesis gas has become important as the planet faces exhaustion of its
petroleum reserves in the near future The use of coal or biomass to
manufacture synthesis gas is attractive in view of its vast reserves However
synthesis gas manufactured from coal or biomass typically has a low H2CO
ratio (about 07) while the stoichiometry of the reaction requires an H2CO
ratio of about 20 Iron catalysts can make up this deficit with their high WGS
activity [6]
This important characteristic of iron based catalysts is essential for their
applications
Fig 72 show that the activity of catalyst is good enough using also feeding
ratio between 10 and 20
Fig 72 CO conversion or selectivity vs H2CO feeding ratio for Fe30K20Cu375
catalyst at T=250degC
Higher the H2 CO ratio is higher the CO conversion becomes but the heavy
hydrocarbons is the highest for the stoichiometric ratio
In the present work there were made some tests with Fe30K20Cu375 catalyst by
feeding mixtures with a ratio H2CO between 05 and 20 in order to optimize
Chapter 7 Fischer Tropsch runs results and discussion
212
the activity selectivity and the lifetime of this kind of FT catalyst in work
conditions of biosyngas feeding
On the basis of the collected data a rigorous simulation of the FT synthesis
reactor has been developed for different purposes (i) to support the
experimentations and their planning (ii) to predict the reactor yield and
conversion (iii) to optimize the performance of the reactor system with
different operating conditions and (iv) to calculate novel reliable kinetic
parameters based on the experimental data fitting by means of model-based
nonlinear regression techniques To do so the FT reactor is modeled as a
catalytic plug-flow reactor using mass and energy balances and reaction
kinetics for Fe-based catalyst defined by Zimmerman and Bukur as explained in
chapter 6 [7] leading to an ordinary differential equation system with
structured Jacobian Lumping techniques have been used to model heavy
hydrocarbons The system is solved by means of dedicated solvers to handle
stiffness and nonlinearities of heterogeneous reactive systems [8]
Typical H2CO ratio of syngas manufactured from coal or biomass are between
07-12 and the Fig 72 show that the activity of catalyst is good enough using
also feeding ratio between 10 and 20
In the table 75 there is the data concerning the carbon monoxide conversion
() and the selectivity towards undesired products (CO2 and CH4) and lighter
and heavy hydrocarbons of Fe-based catalyst The CO conversion increase with
the increase of the H2CO ratio because of the proximity of the stoichiometric
required of the reaction The selectivities are constant with the variations of
H2CO ratio Instead of that the C2+ yield increase with the variations of H2CO
ratio A comparison at T=250degC show that the best performance in terms of CO
conversion C2+ and selectivity towards heavy hydrocarbons is given by working
with a H2CO ratio of 2 (stoichiometric required of the reaction)
Chapter 7 Fischer Tropsch runs results and discussion
213
These data were used to propose a suitable kinetic model for the FTS using a
math program in collaboration with the Politecnico di Milano Some hypothesis
were taken into account to prepare the kinetic model (FT reactor is modeled as
a catalytic plug-flow reactor using mass and energy balances and reaction
kinetics for Fe-based catalyst defined by Zimmerman and Bukur [7-8] ∆P = 0
isothermic catalytic bed FT reaction and WGS are both active on the catalyst)
The kinetic parameters were calculated and compared with the experimental
data The first results show a good fitness of the experimental data
Table 75 FTS products selectivities at different H2CO ratio and reactor
temperatures of Fe30K2Cu375
Selectivity ()
H2CO T(degC) CO
Conversion ()
C2+ total yield
CO2 CH4 ltC7 gtC7
21 220 85 69 11 8 22 59
21 235 211 175 11 6 20 63
21 250 498 393 16 5 19 60
21 260 567 425 19 6 20 55
151 250 388 299 18 5 17 60
151 260 463 338 22 5 17 56
11 250 23 182 17 4 16 63
11 260 389 272 26 4 16 54
leC7 all the hydrocarbons in the range C2-C7 gtC7 all the hydrocarbons greater than C7 Product lsquolsquoirdquo selectivity = (moles C in product i) (converted moles C) x 100 C2+ yield = CO conversion x (selectivity leC7 + selectivity gtC7) x10-2
In Fig 73 is presented a comparison between the experimental data obtained
in the laboratory and the data obtained using the kinetic model The first two
Chapter 7 Fischer Tropsch runs results and discussion
214
columns represent the conversion of hydrogen and carbon monoxide while in
the other columns are represented the molar fraction of hydrogen carbon
monoxide water methane and lump C2 C3-4 C5-10 C11 + As a first
approximation it can be seen that the kinetic model present a good fitness
regard to the experimental data
Fig 73 Comparison between experimental data and kinetic model
References
[1] Qinghong Z Weiping D Ye W Review Recent advances in understanding the key catalyst factors for Fischer-Tropsch synthesis J Ener Chem 2013 2227ndash38
Chapter 7 Fischer Tropsch runs results and discussion
215
[2] Muthu KG Gary J Wilson DS Burtron HD FischerndashTropsch synthesis Activity of metallic phases of cobalt supported on silica Catal Today 2013 21513ndash 17 [3] CLBianchi VRagaini Catalysis Letters 95 (2004) 61-65 [4] C Pirola C L Bianchi A Di Michele P Diodati D C Boffito V Ragaini Ultrasonic Sonochem 17 (2010) 610 [5] Suo Haiyun Zhang Chenghua Wu Baoshan Xu Jian Yang Yong Xiang Hongwei Li Yongwang A comparative study of FeSiO2 FischerndashTropsch synthesis catalysts using tetraethoxysilane and acidic silica sol as silica sources Catalysis Today Volume 183 Issue 1 20 March 2012 Pages 88ndash95 [6] MDShroff AKDatye Catalysis Letters 37 (1996) 101
[7] WH Zimmerman DB Bukur Can J Chem Eng 68 (1990) 292-301 [8] F Manenti I Dones G Buzzi-Ferraris HA Preisig Ind Eng Chem Res 48 (2009) 9979-9984
216
Chapter 8 Final remarks and Conclusions
New kind of cobalt and iron based catalysts were synthetized and used in the
Fischer-Tropsch synthesis Different methods of synthesis different amounts of
cobalt and different process temperatures were investigated All the catalysts
under study were active in the FTS The catalytic activity of the samples strictly
depends on the temperature as expected
Cobalt based hydrotalcites cobalt and cobalt-ruthenium synthesized with the
help of ultrasound and iron supported catalysts with a high loading of iron (30
wt) have been prepared and characterized and both the preparation
procedure and the working conditions were fully optimized
For each catalytic system it can be summarized the following aspects
Cobalt based catalysts
HTLC In the case of Co-based hydrotalcites CO conversion and process
selectivity towards light and heavy hydrocarbons are closely related to the
cobalt amount in the catalysts but not in a linear way
The reduction behavior under a H2 flow of the Co-based hydrotalcites is
achieved in one step at lower temperature and it is not related to its
morphology but is strictly correlated to the particle size In addition the
relatively large dimensions and high cristallinity of these catalysts favor the
creation of optimal domains of active sites that make them more efficient
The obtained data suggest the possibility of using synthetic hydrotalcite as Co-
based catalysts for FTS and open the possibility for subsequent studies on the
same subject
Chapter 8 Final remarks and Conclusions
217
Future studies may involve the investigation of the effects of various
parameters such as morphologysize of crystallites or the addition of small
amounts of promoters such as Ru in the composition of Co based hydrotalcites
Temperatures in the 220-235degC range are more suitable than the higher ones
Cobalt based bimetallic The catalysts show a low selectivity to methane and
carbon dioxide and formation of higher hydrocarbons The more interesting
results are the highest CO conversion at lower temperatures measured with a
catalysts promoted with a Ru Even the support although it is inert it is very
important because it radically alters the surface area of the catalyst
Iron catalysts The samples appears to be highly dependent on the method of
preparation used The catalysts treated with US and MW seem to show
significant improvements over traditional catalysts and the reason is a more
homogeneous and uniform distribution of Fe in the media
The catalyst Fe30K2Cu375 is active with a H2CO ratio le2
Develop of a kinetic model On the basis of the collected data a rigorous
simulation of the FT synthesis reactor has been developed to support the
experimentations and their planning to predict the reactor yield and
conversion to optimize the performance of the reactor system with different
operating conditions and to calculate novel reliable kinetic parameters based
on the experimental data fitting by means of model-based nonlinear regression
techniques For this lumping techniques have been used to model heavy
hydrocarbons the system is solved by means of dedicated solvers to handle
stiffness and nonlinearities of heterogeneous reactive systems and finally the
Chapter 8 Final remarks and Conclusions
218
model made in collaboration with the Politecnico di Milano show a good fit of
the experimental data
Concerning the results obtained in this PhDrsquos research work it is clear that all
the samples tested have given good results The Co-based catalysts
synthesized using the traditional impregnation method with an additional step
of ultrasound have given good results in comparison with the results in the
current literature The hydrotalcites have given lower results if compared with
the Co-based catalysts synthesized with the help of ultrasound but they have
opened an alternative and innovative way that has never been tried before
Iron based catalysts allow a direct conversion of the biosyngas and the results
have shown how our catalysts are active with an H2CO ratio le2 Furthermore
trends have been modeled with success In conclusion the PhDrsquos research
work has given a serious contribution to the current state of the art on
catalysis in the Fischer-Tropsch synthesis either with cobalt and iron based
catalysts With cobalt has been optimized a traditional synthesis procedure
with the introduction of ultrasound furthermore has been created a
completely new kind of catalyst With iron has continued an optimizationrsquos
work of iron supported with high loading metals so to develop a suitable
kinetic model able to work not only with syngas but also with biosyngas
List of Publications and Communications
219
List of publications
Publications
C Pirola DC Boffito G Carvoli A Di Fronzo V Ragaini and CL
Bianchi (2011) Soybean Oil De-Acidification as a First Step Towards
Biodiesel Production Recent Trends for Enhancing the Diversity and
Quality of Soybean Products Prof Dora Krezhova (Ed) ISBN 978-953-
307-533-4 InTech DOI 10577217812 Available from
httpwwwintechopencombooksrecent-trends-for-enhancing-the-
diversity-and-quality-of-soybean-productssoybean-oil-de-acidification-
as-a-first-step-towards-biodiesel-production
CL Bianchi C Pirola DC Boffito A Di Fronzo G Carvoli D Barnab
R Bucchi and A Rispoli (2011) Non Edible Oils Raw Materials for
Sustainable Biodiesel Biodiesel - Feedstocks and Processing
Technologies Dr Margarita Stoytcheva (Ed) ISBN 978-953-307-713-0
InTech DOI 10577225397 Available from
httpwwwintechopencombooksbiodiesel-feedstocks-and-
processing-technologiesnon-edible-oils-raw-materials-for-sustainable-
biodiesel
A Di Fronzo C Pirola A Comazzi F Galli CL Bianchi A Di Michele R
Vivani M Nocchetti M Bastianini DC Boffito Co-based Hydrotalcites
as new Catalysts for the Fischer-Tropsch Synthesis Process Fuel 119
(2014) 62ndash69
Publications in Conference Proceedings (peer reviewed)
CL Bianchi C Pirola DC Boffito A Di Fronzo A Di Michele R Vivani
M Nocchetti M Bastianini S Gatto Co-Zn-Al based hydrotalcites as
catalysts for Fischer-Tropsch process Proceeding of DGMK Conference
2011 Catalysis Innovative Applications in Petrochemistry and Refining
4-6 October 2011 Dresden Germany ISBN 978-3-941721-17-3
C Pirola A Di Fronzo DC Boffito CL Bianchi A Di Michele
Biosyngas Fischer ndash Tropsch Conversion by High Fe Loaded Supported
List of Publications and Communications
220
Catalysts Prepared with ultrasound and Microwave Proceeding of
DGMK Conference 2012 Reducing Carbon Footprint of Fuels and
Petrochemicals October 8 ndash 10 2012 Berlin Germany ISBN 978-3-
941721-26-5
Communications at congress A Di Fronzo C Pirola DC Boffito CL Bianchi A Di Michele R Vivani
M Nocchetti M Bastianini Synthetic Hydrotalcites as suitable Co-
based catalysts for Fischer-Tropsch Process XVIII Congresso Nazionale
della Divisione di Chimica Industriale della SCI LE SFIDE DELLA CHIMICA
INDUSTRIALE PER UNrsquoINNOVAZIONE SOSTENIBILE 11-14 giugno 2012
(Oral presentation)
A Di Fronzo DC Boffito CPirola G Carvoli S Vitali CL Bianchi
Scalable free fatty acids esterification for methyl esters production
XVIII Congresso Nazionale della Divisione di Chimica Industriale della
SCI LE SFIDE DELLA CHIMICA INDUSTRIALE PER UNrsquoINNOVAZIONE
SOSTENIBILE 11-14 giugno 2012 (Poster presentation)
ADi Fronzo C Pirola DC Boffito CL Bianchi A Di Michele R Vivani
M Nocchetti M Bastianini Synthetic Hydrotalcites as suitable Co-
based catalysts for Fischer-Tropsch Process Cat4bio conference
Advances in catalysys for biomass valorization Tesaloacutenica Grecia 2012
(Poster)
CL Bianchi A Di Fronzo C Pirola DC Boffito A Di Michele R Vivani
M Nocchetti M Bastianini Synthetic Hydrotalcites as suitable Co-
based catalysts for Fischer-Tropsch Process 7th edition of the
International Conference on Environmental Catalysis Lion-Francia
(Poster)
A Di Fronzo C Pirola CL Bianchi A Di Michele Ultrasonidos y
microondas en la preparaciograven de catalizadores soportados para la
sigraventesis de Fischer-Tropsch JIFI-EAI 2012 Jornadas de Investigaciograven
Ecuentro acadegravemico industrial Universidad Central de Venezuela
Facultad de Ingenierigravea 26-30 noviembre
C Pirola CL Bianchi A Di Fronzo D Boffito A Di Michele G S
Patience Ultrasound and microwave assisted preparation of high Fe
List of Publications and Communications
221
loaded supported catalysts for biosyngas Fischer-Tropsch conversion
Intervento presentato al 245 convegno ACS National Meeting amp
Exposition tenutosi a New Orleans Louisiana nel 2013
C Pirola C L Bianchi A Di Fronzo F Manenti M Hillestad High Fe
Loaded Supported Catalysts for Biosyngas Fischer ndash Tropsch Conversion
experimental results and detailed simulation XVII National Congress of
Catalysis GIC 2013 and XI National Congress of Zeolites Science and
Technology 15-18092013
F Galli C Pirola A Di Fronzo A Comazzi CLBianchi Di Michele Co
Based Bimetallic Catalysts for Fischer-Tropsch Synthesis Prepared by
High Power Ultrasound XVII National Congress of Catalysis GIC 2013
and XI National Congress of Zeolites Science and Technology 15-
18092013
Di Michele C Pirola A Di Fronzo A Comazzi F Galli and CLBianchi
Co Based Bimetallic Catalysts for Fischer-Tropsch Synthesis Prepared by
High Power Ultrasound AOSS Melbourne 10-12072013
C Pirola A Di Fronzo A Comazzi F Galli A Di Michele CLBianchi Co
based bimetallic catalysts for Fischer-Tropsch synthesis prepared by
high power ultrasound 11th European Congress on Catalysis ndash
EuropaCat-XI Lyon France September 1st-6th 2013
Workshop Clausthal Germany 22-23112013 Fischer-Tropsch Synthesis
from syngas and biomass using Fe or Co based catalysts Experimental
and simulation results (Oral Presentation)

General Abstract
6
6) CO + H2 harr C + H2O Carbon deposition
7) 2 CO harr C + CO2 Boudouard equilibrium
The whole reaction gives an energetic contribution strongly exothermic (about
150 kJmol CO reacted) FTS is a particularly complex system in which a
number of different reactions are combined to a unique mechanism
irreversible Fischer Tropsch (FT) reactions produce hydrocarbons and some
equilibrium reactions between CO CO2 CH4 and C such as the WGS reaction
and the Boudouard equilibrium are present too Nevertheless it is possible to
suppose that FTS can be simplified as a combination of the FT reactions and the
WGS reaction [7] According this hypothesis hydrocarbons are primary
products of FT reaction and CO2 can only be produced by WGS reaction a
reversible parallel-consecutive reaction with respect to CO [9]
FTS usually requires catalysts based on cobalt or iron Co-based catalysts have
been more largely used due to their high selectivity to heavy hydrocarbons and
low activity in the water-gas shift reaction so limiting the CO2 formation
Moreover Co-based catalysts have shown longer life-time and higher CO
conversion compared to the Fe-based ones [10] Iron based catalysts are
recently highly investigated for FTS Compared to cobalt systems iron-based
catalysts are cheaper but less resistant to deactivation due to the oxidizing
effect of water despite activating Water Gas Shift reaction (CO + H2O harr CO2 +
H2) well [5 9] Moreover they are flexible to changes in temperature pressure
and they can work at different H2CO feed ratios (for iron based catalysts this
ratio can be between 05 and 25) [11 12]
2 Aims of the work
Considering very recent research results [13-15] the aim of the PhDrsquos research
was addressed toward the development of three particular kind of catalysts
General Abstract
7
The first group of catalysts tested were the Co-based hydrotalcites (HTlc) with
different amount of Co in two different pilot plants HTlc-based materials have
been recently reported as good catalysts for several processes in the energy
field [16] [17] and [18] Up to now the only study reported in literature on the
use of synthetic HTlc as FTS catalysts concerns their use as inert supports for
the catalytically active metal According to this study hydrotalcite-supported
catalysts result in higher activity than CoAl2O3 even in absence of reduction
promoters [19]
The second group of catalysts tested were the Co-based catalysts and
bimetallic Co-Ru based catalyst synthesized with the help of ultrasound
because the ultrasound are presented in literature as an innovative way to
synthesize new kind of materials
Finally were synthesized and tested samples of Fe-based catalysts supported
on silica with different methods of synthesis (traditional impregnation method
with the help of ultrasound or microwave) and changing the H2CO ratio with
the aim to evaluate the performance of biomass Almost the development of a
kinetic model (modeling parameter regression and simulation) in collaboration
with the Politecnico di Milano
3 Experimental Details
a Preparation of catalysts
i) Cobalt based catalysts ndash Hydrotalcites a series of ternary hydrotalcites with
general formula [CoxZn(1-x-y)Aly(OH)2](NO3)y∙05H2O by a modified-urea method
[20] Different volumes of the solutions of the metals nitrates all at a
concentration of 05 M were mixed to obtain either a Al(Co+Al) or
Al(Co+Al+Zn) molar ratio of 03 as indicated in Table 1
General Abstract
8
Solid urea was added to the solution in a molar ratio of 4 vs Al The obtained
solution was maintained at the reflux temperature in an open flask for 48 hours
The precipitate was separated by centrifugation washed with water and then
dried at 80degC
Table 1 Details of the synthesis composition and specific surface area (SA) of samples
general formula [CoxZn(1-x-y)Aly(OH)2](NO3)y∙05H2O M sol = molar percentage of
metals in the precipitation solution
Sample wt Co M sol
x
y
SSA (m2g-1)
Zn Co Al
Co5 51 55 15 30 010 033 175
Co10 108 45 25 30 021 034 115
Co15 166 35 35 30 032 029 72
Co35 353 - 70 30 067 033 58
ii) Cobalt based catalysts and bimetallic Co-Ru based catalysts synthesized
with the help of ultrasound All the catalysts were prepared by a modified
impregnation method The metal precursors (cobalt and ruthenium
carbonyl) were dissolved in n-decane together with the different support
(SiO2 Al2O3 or TiO2) The solution was irradiated by an ultrasound generator
with a horn type of 750 W a frequency of 20 kHz a diameter tip of 13 mm
and an amplitude of 40-50 for 3 h and then put into a rotating vacuum
oven at 40degC at 36 rpm for 24 h (impregnation step) Samples have been
calcinated at 350 degC for 4 h The ultrasound horn used have a cooling jacket
where the coolant has a low viscosity at low temperature and is a dielectric
liquid [21]
General Abstract
9
iii) Iron catalysts there were prepared the iron based catalysts using different
method of synthesis traditional impregnation (TR) impregnation with the help
of the microwave (MW) impregnation with the help of ultrasound (US) and co-
precipitation method MW and US techniques seem to be promising that offer
many advantages in the catalyst preparation as reported in [22-23] and their
effect was also evaluated
There were prepared according to the traditional impregnation method by
incipient wetness (TR) with 30wt of iron supported on a commercial high
surface area SiO2 (Fluka BET surface area 520 m2g-1 pore volume 122 ml g-1
and pore diameter 87 nm) The catalysts are promoted by K (20wt ) and Cu
(375wt ) The percentages are regarding a previous research [13] where
those compositions result as the most suitable catalyst In this work all the
percentages concerning the catalysts composition are on weight basis while
the percentages about the process conversion and selectivity are on molar
basis The catalysts will be named as Fe30K20Cu375 referring the wt of Fe K
and Cu on catalyst The support after heating treatment at 120degC for 12 h was
impregnated with an aqueous solution of Fe(NO3)3middot9H2O (Riedel de Haen
product) KNO3 (Merk product) and Cu(CH3COO)2middotH2O (Fluka product) and then
put into a vacuum oven at 40 degC at 36 rpm for 24 h The samples were heated
at 100 degC for 12 h and at 500degC for 4 h in air The results were also modeled
with a collaboration with the Politecnico di Milano and presented in this PhDrsquos
work
The synthesis of the catalyst with the aid of microwave is quite similar to the
TR The difference is the addition of a final step where the powder of catalyst
already calcined is subjected to a MW irradiation Two different methods for
the MW irradiation were used In the first one (MW1) it was taken a sample of
catalyst put it into a beaker and then put into a kitchen microwave oven
General Abstract
10
(Moulinex Micro-Chef 1305E 600W) for 30 min In the second method (MW2)
the catalyst (2 g) was suspended in hexane (400 ml) put it into a microwave
chemical reactor (ordinary 400 mL round bottom glass flask filled with the
liquid to be heated and activated) and treated for 1 h at 60W MW were
produced by a MW generator and sent to the MW applicator by an insulated
coaxial antenna Details of the MW applicator and of the associated
experimental techniques can be found in [24]
The US treatment have been used between the impregnation and the
evaporation step by irradiating the silica-precursors solution using a Sonicator
(W-385 Heat Systems Ultrasonics) with an effective input power of 60 W and a
tip diameter of 13 mm Silica solution promoters and water have been
sonicated by the US horn for 05 h in air atmosphere (US1) The same sample of
US1 was successively sonicated in a suspension of hexane in argon atmosphere
(instead of air) for 3h (US2)
b Catalysis Characterization
The obtained materials were characterized by X-ray powder diffraction
(XRD PANalytical XrsquoPert Pro CuKα radiation) operating at 40kV and 40mA
step size 00170 2θ degree and step scan 20s
The metal content of samples was determined by inductively coupled
plasma optical emission spectrometry (ICP-OES) using a Varian Liberty
Series instrument
Field emission scanning electron microscopy (SEM) images were obtained
using a LEO1525 instrument after depositing the samples depositing the
catalysts onto the sample holder and sputter coating with chromium
The elemental mapping of metals was obtained by using energy dispersive
X-ray spectroscopy (EDS) with a Bruker Quantax EDS instrument
General Abstract
11
Transmission electron microscopy (TEM) images were obtained using a
Philips 208 instrument
FT-IR spectra of different samples dispersed in KBr pellets were recorded
at room temperature using a Bruker IFS113V spectrometer Typically each
spectrum was obtained at a resolution of 1 cm-1 in the spectral region 400-
5000 cm-1
Specific surface area (SSA) of all catalysts was determined by
conventional N2 absorption using a Micromeritics ASAP2010 instrument
Before the analysis the samples were pre-treated at 200degC in a He flow
Conventional temperature-programmed reduction experiments (TPR) were
performed using a Thermoquest Mod TPRDO 1100 instrument The
samples were initially pre-treated in a flow of argon at 200degC for 05 h After
being cooled down to 50degC the H2Ar (51 vv) reducing mixture was
flushed through the sample at 30 mL min-1 and the temperature increased
from 50 to 900degC at a constant rate of 10degC min-1
Water and nitrate content of the solids was determined by
thermogravimetric (TG) analysis with a Netzsch STA 449C apparatus in air
flow and 10degCmin heating rate
c Kinetics Run
FT synthesis was performed into a fixed bed reactor using 1 g of fresh
catalyst mixed with 1 g of diluting material (-Al2O3) This diluting material
must be inert for FTS and acts as a good thermal conductor to control the
process temperature [25] The calcined catalysts were initially activated in
situ with the standard conditions of 468 Nml min-1 flow of syngas (H2CO =
21) at 350degC 3 bar for 4 h Then they were tested with the standard
conditions of 468 Nml min-1 flow of syngas (H2CO = 21) plus 50 Nml min-1
of N2 as internal standard at 20 bar at T = 250degC Others reducing activating
General Abstract
12
gases feeding compositions pressures temperatures have been tested in
the work Analyses of the gas-phase products (C1ndashC7) were performed with
an on-line micro gas-chromatograph (Agilent 3000) Liquid products were
collected in a trap at 5 degC and 20 bar and analyzed by a gas-chromatograph
(Fisons Mod 8000 Series) equipped with a Poparak-Q column after the total
time of reaction The aqueous phases collected in the cold trap were
analyzed by a TOC (Schimadzu Mod 5000A) to quantify the amount of
carbonaceous species dissolved in water
In the case of hydrotalcites FTS was performed in two different laboratory
plants with the same flow sheet The first one recently described and
located at the Universitagrave degli Studi di Milano and the second one at the
Universidad Central de Venezuela during a complementary stage in
Venezuela In this case the FTS was performed in a continuous flow system
with a fixed bed stainless-steel reactor (di =32mm l = 30 cm) The reactor
was loaded with 03 g of fresh catalyst mixed with 03 g of see sand as a
diluting material [26] The calcined catalysts were initially reduced in situ by
flowing hydrogen for 4 hours at 900 Nml˙min-1 350degC and 08 MPa After
the reduction step the temperature was lowered to 220degC under H2 They
were then tested in the standard conditions by flowing syngas (H2 CO N2
63325 vv N2 as internal standard) at 156 Nml˙min-1 increasing the
system pressure slowly up to 20 MPa and 220-260degC Once the reaction
temperature was achieved the reaction was led to proceed during a period
of 280 h
During reaction the reactor effluent passed through a hot trap kept at
150ordmC and 02 MPa to collect waxes and the products leaving this trap were
passed through a second trap kept at 0ordmC and 02MPa to collect the lighter
products (water alcohols and hydrocarbons) The analyses were performed
General Abstract
13
in various chromatographs according to the nature of the sample to be
analyzed Permanent gases and light hydrocarbons were analyzed on-line in
a PerkinElmer 3000GC Autosystem fitted with TCD detectors using a
Carbosieve SII Supelco column The liquid products (collected at 150ordmC and
0ordmC) were weighted and analyzed in a PerkinElmer chromatograph fitted
with a 50m long Alumina RT capillary column connected to a FID
A mass molar balance was performed for each FT run resulting in a
maximum error of plusmn 5 on molar basis
4 Results and discussion
a) Catalysts activation
i) Cobalt catalysts The catalytic activity of the samples depends on the
presence of metallic Co centres on the surface and the particle size Many
works have been done on the reducibility by TPR of CoOx mixed oxides The
reduction profile of Co3O4 consists of a low-temperature peak and a high-
temperature peak which correspond to the reduction of Co+3 to Co+2 and Co+2
to Co0 [27-30]
Two kinds of Co based catalysts were tested
The HTlc materials contain Co (II) ions randomly dispersed inside the brucitic
layers then the active phase in the FTS is the metallic cobalt Therefore in
order to have an active catalyst a reduction procedure is requires to maintain
the cobalt dispersion TPR analyses were performed to study the reduction
process and to select the best conditions for the catalyst activation Fig 1
reports the TPR profile of the sample Co5 Co10 Co15 Co35 All the profiles
exhibit two regions of reduction the first at lower temperatures (below 400degC)
which is due to the reduction of Co while the second peak above 700degC
indicates the presence of hardly reducible species These species are probably
spinel-type mixed oxides formed during the thermal treatment According to
General Abstract
14
Alvarez et al [31] these two peaks are well separated for samples with a small
particle size while an intermediate particle size causes the overlapping of the
two reduction steps resulting in a complete reduction with only one maximum
at an intermediate temperature (328degC) The TPR profiles of our HTlc (Fig 1)
are consistent with the latter case
Basing on the TPR results the tested catalysts were activated before FTS at
350degC for 4 hours under hydrogen atmosphere in order to reduce the Co ions
to metallic Co
Fig 1 TPR analysis of the samples Co5 Co10 Co15 Co35 Activation temperature is
indicated with the dashed line
After this treatment XRD analysis detected only mixed metal oxides and no
metallic Co phases so highlighting the presence of active metal atoms
homogeneously dispersed at the nanometer or sub-nanometer level [1432]
The same thing happens with the cobalt catalysts synthesized with ultrasound
The results of TPR confirm the data found in literature [27-30] where the Co
based catalysts need to be activated at 350degC for 4 hours under hydrogen
atmosphere It is important to note in Fig 2 how small amount of Ru decreases
the peak of the reduction temperature
General Abstract
15
100 200 300 400 500 600 700 800
Co-RuSiO2
CoSiO2
TC
D
Temperature (degC) 100 200 300 400 500 600 700 800
TC
D
CoAl2O
3
Co-RuAl2O
3
Temperature (degC) 100 200 300 400 500 600 700 800
CoTiO2
TC
D
Co-RuTiO2
Temperature (degC)
Fig 2 TPR analysis of the samples CoSiO2 and Co-RuSiO2 CoAl2O3 and Co-Ru Al2O3
CoTiO2 and Co-RuTiO2 Activation temperature is indicated with the dashed line
Basing on the TPR results the tested catalysts were activated before FTS at
350degC for 4 hours under hydrogen atmosphere in order to reduce the Co ions
to metallic Co
ii) Iron catalysts
As regard the method of synthesis of the iron based catalysts the main results
of catalysts characterization are reported in Table 2 All the surface areas (SA)
of the prepared catalysts are significantly lower than the SA of the
corresponding support (SiO2) This important decrease can be explained
considering the dilution effect due to the presence of iron on the support The
dilution effect can be easily assessed by considering the surface area of bare
silica support and assuming a negligible contribution of the iron phases to the
surface area The samples treated with MW and US have higher values of SA
than the traditional ones the effect of MW and US on SA is proportional with
the US or MW emitting power
The TPR analysis of these samples treated with MW gave results consistent
with those prepared by TR showing that the method of preparation does not
influence the step of reduction (Fe2O3-gt Fe3O4 -gt-Fe) of the catalyst but only
the peak temperature
General Abstract
16
Table 2 Characterization results of iron based catalysts using different method of synthesis
Sample Prep
Method
BET TPR TPD
Surface Area (m2g-1)
Temp of first
red peak (degC)
Temp of
second red peak (degC)
Temp of the peak (degC)
Bare support
Catalyst
Fe30K2Cu375SiO2 TR 4303 1601 240 600 170
Fe30K2Cu375SiO2 MW1
4303 1800 - - -
MW2 2240 240 580 162
Fe30K2Cu375SiO2 US1
4303 2011 236 572 171
US2 2101 - - - TR= Traditional Impregnation MW1= Catalyst put it into a kitchen MW and processed in powder MW2= Catalyst put it into MW and suspended in hexane US1= Catalyst suspended in aqueous solution in air atmosphere for 05 h US2= Catalyst sonicated and suspended in hexane in Argon atmosphere for 3h
In agreement with the literature [33] all the curves show a single TPDs peak in
the same range (150-170degC) that confirms the fact that only one type of
adsorbing species can exists up on the catalyst (see table 2) for all the catalysts
Before FT runs the catalysts must be activated reducing the hematite phase
(not active for FTS) in iron carbides (in particular Fe22C and Fe25C) and
magnetite (Fe3O4) [34] In literature there is not a uniform procedure for this
operation Many tests were performed by [34] and show that the best FT
results in term of CO conversion have been obtained using the activating
mixture H2CO (21) or pure CO starting from oxidized catalysts and making this
operation at T=350degC The process selectivity is not particularly modified using
the mixture H2CO (21) or pure CO and changing the activation temperature
b) FT results
i) Co based hydrotalcites as catalysts for Fischer-Tropsch synthesis
General Abstract
17
The activated samples were tested at different temperatures in the FTS plant
following the procedure reported in the experimental section In Fig 3 the CO
conversion vs the reaction temperature is reported for all the catalysts while
the products selectivity is displayed in Table 3
Fig 3 molar CO conversion to Co5 () Co10 ( ) Co15 (diams) Co35 () obtained at
different reactor temperatures after 24 hours of reaction
As expected for each catalyst the activity is strongly influenced by the reaction
temperature the higher the temperature the higher the CO conversion but
also the selectivity towards CO2 CH4 and light hydrocarbons is favored by a
higher temperature The CO conversion is similar for Co5 and Co10 while it is
higher for the two samples with a larger amount of cobalt ie Co15 and Co35
In particular Co15 exhibits the highest CO conversion at all the selected
temperatures In FTS it is fundamental to obtain low quantities of CH4 and CO2
(undesired products) to favor the formation of higher hydrocarbons For this
reason temperatures in the 220-235degC range are more suitable than the higher
ones
General Abstract
18
Moreover Table 3 shows that Co15 exhibits the highest CO conversion and the
highest C2+ total yield (without considering CH4 and CO2 see note in Table 3)
also at the lowest temperature (220degC) This result confirms that Co15 is the
best performing catalyst obtained in this study
The obtained data suggest the possibility of using synthetic hydrotalcites as Co-
based catalysts for FTS and pursuing subsequent studies on the same subject
Table 3 FTS products selectivity at different reactor temperatures
Sample Temperature
(degC)
Products Selectivity C2+
Yield CO2 CH4 leC7 gtC7
Co5 220 03 29 33 934 165
235 03 59 104 834 194
245 11 85 127 776 224
260 19 141 160 679 300
Co10 220 32 26 98 844 155
235 38 49 143 769 178
245 33 60 154 753 218
260 81 163 413 343 262
Co15 220 14 101 17 705 467
235 81 262 473 185 498
250 178 177 443 202 491
Co35 220 14 39 103 844 250
235 18 96 234 651 395
245 51 257 656 105 473
leC7 all the hydrocarbons in the range C2-C7 gtC7 all the hydrocarbons greater than C7 Product lsquolsquoirdquo selectivity = (moles C in product i) (converted moles C) x 100 C2+ yield = CO conversion x (selectivity leC7 + selectivity gtC7) x10-2
General Abstract
19
iii) Sonochemical synthesis of Co and Co-Ru based catalysts for Fischer-Tropsch
synthesis
The use of ultrasound might be very efficient to optimize the dispersion of a so
high metal charge as already verified in our laboratory in the past [35-36] This
special type of synthesis should give at the catalyst a particular structure with a
high surface area and a high metal dispersion that improves its activity towards
the synthesis of Fischer-Tropsch In the case of cobalt supported catalysts a
simple US step has been added in the catalyst preparation The precursors
(cobalt and ruthenium carbonyl) were dissolved in n-decane together with the
different support (SiO2 Al2O3 or TiO2) the solution was irradiated with
ultrasound at a frequency of 20 kHz and an output power of 300 W for 3 hours
As seen in table 4 the catalysts show a low selectivity to methane and carbon
dioxide and formation of higher hydrocarbons The more interesting results are
the highest CO conversion at lower temperatures measured with a catalysts
promoted with a Ru
Table 4 CO Conversion C2+total yield CH4 CO2 light hydrocarbon and heavy
hydrocarbon selectivity of CoCo-Ru based catalyst
Catalyst CO
Conversion ()
C2+ total yield
Selectivity ()
CH4 CO2 ltC7 gt C7
CoTiO2 28 23 5 14 10 71
CoSiO2 6 5 19 6 23 52
CoAl2O3 8 6 13 7 19 61
Co-RuTiO2 98 73 18 8 14 60
Co-RuSiO2 94 82 9 4 8 79
Co-RuAl2O3 84 73 11 2 12 75
As we have seen from the BET and TPR analysis the support and the promoter
play a key role in the performance of the catalyst because they are responsible
General Abstract
20
for the modification of some key parameters such as surface area and the
metal dispersion
ii)High Fe Loaded Supported Catalysts for Biosyngas Fischer ndash Tropsch
Conversion experimental results and detailed simulation
With regard to the treatment with the help of US (see table 5) it can be
concluded that the sonication of an aqueous mixture salts and precursors of
support (US1) is preferable instead of to the calcined catalyst suspended in
non-polar solvent such as hexane (US2) With regard to treatment with MW
(see table 3) there were obtained better results in term of CO conversion with
the powder catalyst treated directly in the MW (MW1) while the test
conducted by suspending the catalysts in hexane and then treated in a MW
reactor (MW2) for an hour did not give valid results The best FTS results in
term of C2+ yield (41) has been obtained using MW1 while in tem of CO
conversion (58) using US1 All of them gave FTS results better than the
traditional one Itrsquos evident that the use of US or MW optimizes the catalytic
performance in accord with previous similar results [36]
In agreement with [37] the FTS results show that TEOS as silica source is
favorable for the enhancement of the FTS activity
A very important property of iron based catalysts is their possibility to operate
using feeding gas having a ratio H2CO not stoichiometric (ie 2) In the
present work there were made some tests with Fe30K20Cu375 catalyst by
feeding mixtures with a ratio H2CO between 05 and 20 in order to optimize
the activity selectivity and the lifetime of this kind of FT catalyst in work
conditions of biosyngas feeding
General Abstract
21
Table 5 Catalytic Results of Fe30K20Cu375 Different preparation techniques Support
SiO2 Diluting Material α-Al2O3 T=220degC
Preparation CO Conversion
()
C2+
Total yield
Selectivity ()
CO2
CH4
lt C7
gt C7
TR 49 32 27 7 22 44
MW1 52 41 17 5 18 60
MW2 32 24 17 8 27 48
US1 58 38 29 6 22 43
US2 36 25 22 9 30 39
Co-precipitation 38 32 2 13 28 57 leC7 all the hydrocarbons in the range C2-C7 gtC7 all the hydrocarbons greater than C7 Product lsquolsquoirdquo selectivity = (moles C in product i) (converted moles C) x 100 C2+ yield = CO conversion x (selectivity leC7 + selectivity gtC7) x10-2
The co-precipitation test was made at T=250degC and TEOS as a support
On the basis of the collected data a rigorous simulation of the FT synthesis
reactor has been developed for different purposes (i) to support the
experimentations and their planning (ii) to predict the reactor yield and
conversion (iii) to optimize the performance of the reactor system with
different operating conditions and (iv) to calculate novel reliable kinetic
parameters based on the experimental data fitting by means of model-based
nonlinear regression techniques To do so the FT reactor is modeled as a
catalytic plug-flow reactor using mass and energy balances and reaction
kinetics for Fe-based catalyst defined by Zimmerman and Bukur [38] leading to
an ordinary differential equation system with structured Jacobian Lumping
techniques have been used to model heavy hydrocarbons The system is solved
by means of dedicated solvers to handle stiffness and nonlinearities of
heterogeneous reactive systems [39]
General Abstract
22
Typical H2CO ratio of syngas manufactured from coal or biomass are between
07-12 and the Fig 4 show that the activity of catalyst is good enough using
also feeding ratio between 10 and 20
Fig4 CO conversion or selectivity vs H2CO feeding ratio for Fe30K20Cu375 catalyst
at T=250degC
In Table 6 there is the data concerning the carbon monoxide conversion ()
and the selectivity towards undesired products (CO2 and CH4) and lighter and
heavy hydrocarbons of Fe-based catalyst The data collected using this catalyst
were modeled in collaboration with Politecnico di Milano
The selected model was based on the hypothesis that both FT and WGS
reaction were active on this catalyst The kinetic parameters were calculated
and compared with the experimental data
Table 6 FTS products selectivities at different H2CO ratio and reactor temperatures of
Fe30K20Cu375
Selectivity ()
H2CO T(degC) CO
Conversion ()
C2+ total yield
CO2 CH4 ltC7 gtC7
21 220 85 69 11 8 22 59
21 235 211 175 11 6 20 63
21 250 498 393 16 5 19 60
21 260 567 425 19 6 20 55
151 250 388 299 18 5 17 60
151 260 463 338 22 5 17 56
11 250 23 182 17 4 16 63
11 260 389 272 26 4 16 54
General Abstract
23
leC7 all the hydrocarbons in the range C2-C7 gtC7 all the hydrocarbons greater than C7 Product lsquolsquoirdquo selectivity = (moles C in product i) (converted moles C) x 100 C2+ yield = CO conversion x (selectivity leC7 + selectivity gtC7) x10-2
In Fig 5 is presented a comparison between the experimental data obtained in
the laboratory and the data obtained using the kinetic model The first two
columns represent the conversion of hydrogen and carbon monoxide while in
the other columns are represented the molar fraction of hydrogen carbon
monoxide water methane and lump C2 C3-4 C5-10 C11 + It can be seen that the
kinetic model present a good fitness regard to the experimental data
Fig 5 Comparison between experimental data and kinetic model
5 Conclusions
General Abstract
24
Concerning the results obtained in this PhDrsquos research work it is clear that all
the samples tested have given good results The Co-based catalysts
synthesized using the traditional impregnation method with an additional step
of ultrasound have given good results in comparison with the results in the
current literature The hydrotalcites have given lower results if compared with
the Co-based catalysts synthesized with the help of ultrasound but they have
opened an alternative and innovative way that has never been tried before
Iron based catalysts allow a direct conversion of the biosyngas and the results
have shown how our catalysts are active with an H2CO ratio le2 Furthermore
trends have been modeled with success In conclusion the PhDrsquos research
work has given a serious contribution to the current state of the art on
catalysis in the Fischer-Tropsch synthesis either with cobalt and iron based
catalysts With cobalt has been optimized a traditional synthesis procedure
with the introduction of ultrasound furthermore has been created a
completely new kind of catalyst With iron has continued an optimizationrsquos
work of iron supported with high loading metals so to develop a suitable
kinetic model able to work not only with syngas but also with biosyngas
References
[1] M S Hadnadev-Kostic J Tatjana T Vulic R Marinkovic-Neducin A D Nikolic B Jovic Journal of the Serbian Chemical Society 76 (12) (2011) 1661ndash1671 [2] E Lira C Loacutepez F Oropeza M Bartolini J Alvarez M Goldwasser F Loacutepez J Lamonier J Peacuterez Journal of Molecular Catalysis A Chemical 281 (2008) 146ndash153 [3] Q Zhang J Kang Y Wang ChemCatChem Catalysis 2 (2010) 1030 [4] F Fischer and H Tropsch BrennstChem 4 (1923) 276 [5] M E Dry Enciclopedia of Catalysis New York (2003) 247 [6] Fischer-Tropsch Technology Studies in Surface Science and Catalysis Elsevier (2004)
General Abstract
25
[7] G P Vaan Deer Laan A A C M Beenackers Catalysis Reviews Science and Engineering 41(3amp4) (1999) 255 [8] H Schulz Applied Catalysis A 186 (1999) 3 [9] GP van der Laan AACMBeenackers Applied Catalysis A 193 (2000) 39 [10] A Martinez C Lopez F Marquez IJ Diaz Catalysis 220 (2003) 486 [11] AY Khodakov WChu P Fongarland Chemical Reviews 107 (2007) 1692 [12] BHDavis Catal Today 84 (2003) 83 [13] Pirola C Bianchi CL Di Michele A Diodati P Vitali S Ragaini V Catal Lett 2009 131294ndash304 [14] A Di Fronzo C Pirola A Comazzi F Galli CL Bianchi A Di Michele R Vivani M Nocchetti M Bastianini DC Boffito Fuel 119 (2014) 62-69 [15] C Pirola CL Bianchi A Di Michele S Vitali V Ragaini Catal Comm 10 (2009) 823ndash827 [16] T Montanari M Sisani M Nocchetti R Vivani M C H Delgado G Ramis G Busca U Costantino Catalysis Today 152 (2010) 104 [17] C Resini T Montanari L Barattini G Ramis G Busca S Presto P Riani R Marazza M Sisani F Marmottini U Costantino Applied Catalysis A 355 (2009) 83 [18] Y Lee J H Choi H J Jeon K M Choi J W Lee J K Kang Energy Environment Science 4 (2011) 914 [19] Y Tsai X Mo A Campos J G Goodwin Jr J Spivey Applied Catalysis A General 396 (2011) 91ndash100 [20] M Bastianini D Costenaro C Bisio L Marchese U Costantino R Vivani M Nocchetti Inorg Chem 51 (2012) 2560-2567 [21] Suslick SK ldquoApplications of ultrasound to materials chemistryrdquo MRS Bulletin 1995 [22] S Qi B Yang Methane aromatization using Mo-based catalysts prepared by microwave heating Catal Today 98 (2004) 639-645 [23] Y Liu Y Lu S Liu Y Yin The effect of microwaves on the catalysts preparation and the oxidation of o-xilene over a V2O5SiO2 system Catal Today 51 (1999) 147-151] [24] G Biffi Gentili M Linari I Longo A Ricci IEEE Transactions on microwave theory and techniques Vol 57 (2009) 9 [25] C Bianchi C Pirola V Ragaini Catalysis Communications 7 (2006) 669-672 [26] ML Cubeiro Loacutepez A Colmenares L Texeira M Goldwasser M J Peacuterez F Machado F Gonzaacutelez Applied Catalysis A General 167 (1998) 183-193 [27] C L Bianchi Catalysis Letters Vol 76 No 3ndash4 (2001)155-159 [28] H-Y Lin Y-W Chen C Li Thermochim Acta 400 (2003) 61ndash67 [29] H-Y Lin Y-W Chen Materials Chemistry and Physics 85 (2004) 171ndash175
General Abstract
26
[30] BA Sexton AE Hughes TW Turney Journal of Catalysis 97 (1986) 390ndash406 [31] A Alvarez S Ivanova MA Centeno JA Odriozola Applied Catalysis A General (2012) 431ndash 432 [32] C L Bianchi C Pirola DC Boffito A Di Fronzo A Di Michele R Vivani M Nocchetti M Bastianini S Gatto DGMK Tagungsbericht Volume2011-2 IssuePreprints of the DGMK-Conference Catalysis Innovative Applications in Petrochemistry and Refining 2011 Pages 93-98 Journal 2011 CODEN DGTAF7 ISSN1433-9013 [33] 7 H Wan B Wu C Zhang H Xiang Y Li Promotional effects of Cu and K on precipitated iron-based catalysts for Fischer ndash Tropsch synthesis J molecular Catalysis 283 (2008) 33-42 [34] J Xu CHBartholomew J Phys Chem B 109 (2005) 2392 [35] CLBianchi VRagaini Catalysis Letters 95 (2004) 61-65 [36] C Pirola C L Bianchi A Di Michele P Diodati D C Boffito V Ragaini Ultrasonic Sonochem 17 (2010) 610 [37] Suo Haiyun Zhang Chenghua Wu Baoshan Xu Jian Yang Yong Xiang Hongwei Li Yongwang A comparative study of FeSiO2 FischerndashTropsch synthesis catalysts using tetraethoxysilane and acidic silica sol as silica sources Catalysis Today Volume 183 Issue 1 20 March 2012 Pages 88ndash95 [38] WH Zimmerman DB Bukur Can J Chem Eng 68 (1990) 292-301 [39] F Manenti I Dones G Buzzi-Ferraris HA Preisig Ind Eng Chem Res 48 (2009) 9979-9984
27
Chapter 1 General Introduction The National Renewable Energy Laboratory (NREL) and the Pacific Northwest
National Laboratory (PNNL) [1] are undertaking studies of biomass conversion
technologies to hydrocarbon fuels
Process designs and preliminary economic estimates for each of these pathway
cases were developed using rigorous modeling tools This technology pathway
case investigates the upgrading of woody biomass derived synthesis gas
(syngas) to hydrocarbon biofuels While this specific discussion focuses on the
conversion of syngas via a methanol intermediate to hydrocarbon blend stocks
there are a number of alternative conversion routes for production of
hydrocarbons through a wide array of intermediates from syngas (Fig 11)
Technical barriers and key research needs have been identified that should be
pursued for the syngas-to-hydrocarbon pathway to be competitive with
petroleum-derived gasoline- diesel- and jet-range hydrocarbon blend stocks
Fig 11 Process Block Diagram [1]
At present the development of economical and energy-efficient processes for
the sustainable production of alternative fuels and chemicals is a global
Chapter 1 General Introduction
28
demand and FTS is a crucial technology for this purpose [2] On the one side
the observed climate change particularly global warming is widely held as a
consequence of the increase of atmospheric CO2 concentration due to fossil
fuel combustion On the other side people are increasingly aware that fossil
fuels reserves are huge but not unlimited and the air quality are major
environmental concerns because they directly affect the way we live and
breathe
In order to meet the present and future threats generated by emissions to the
atmosphere environmental agencies around the world have issued more
stringent regulations One of them is the control of residual sulfur in diesel fuel
and emission standards for particulates from diesel vehicles All these facts
have recently aroused renewed interest in the FischerndashTropsch Synthesis
because it can produce super clean diesel oil fraction with high cetane number
(typically above 70) without any sulfur and aromatic compounds using syngas
(mixture of H2 CO CO2) from natural gas CH4 coal landfill gas coal or biomass
through steam reforming partial or auto thermal oxidation gasification
processes or as a new tendency from biomass [3-5] Mineral diesel basically
results from refining and fractional distillation of crude oil between 160 and
380degC at atmospheric pressure and is mostly formed by mixtures of paraffins
containing between 12 and 20 carbon atoms per molecule In these mixtures
linear paraffins are particularly appreciated due to their high cetane number
ie their excellent ignition performances Expansion and social progress is
however boosting a further increase of energy demand particularly in the
transportation sector which in developed countries accounts for most of this
increase This is the reason why carbon-neutral biofuels are largely considered
a possible way to satisfy the energy demand without dramatically increasing
the CO2 content of the atmosphere [6]
Chapter 1 General Introduction
29
In this context the production of hydrocarbons starting from syngas (CO + H2) is
a crucial topic because syngas can be manufactured from natural gas (GTL Gas
to liquid) coal (CTL coal to liquids) or biomass (BTL Biomass to liquid) [7] In
Fig 12 the industrial way to utilize syngas are reported the fuels produced
from syngas include hydrogen by the water-gas-shift (WGS) reaction methanol
by methanol synthesis alkenes by Fischer Tropsch synthesis (FTS) isobutene by
isosynthesis ethanol by fermentation or with homogeneous catalysts and
aldehydes or alcohols by oxosynthesis
Fig 12 Diagram of Syngas Conversion Processes [8]
Fischer-Tropsch Synthesis (FTS) is a well-known industrial process discovered
by Franz Fischer and Hans Tropsch in Germany in 1923 [9] starting from syngas
(H2 + CO) and using iron or cobalt based catalysts it is possible to produce
several hydrocarbons in the range from 1 to 100 carbon atoms Co-based
catalysts have been more largely used due to their high selectivity to heavy
hydrocarbons and low activity in the water-gas shift reaction so limiting the
CO2 formation Moreover Co-based catalysts have shown longer life-time and
higher CO conversion compared to the Fe-based ones [10-11] The essential
target of FTS is to produce paraffins and olefins with different molecular weight
Chapter 1 General Introduction
30
and to limit the maximum formation of methane and CO2 [4 12-15] The main
reactions involved in FTS are reported in the following scheme
Irreversible reactions
1) n CO + 2n H2 rarr CnH2n + n H2O for olefins
2) n CO + (1+2n) H2 rarr CnH(2n+2) + n H2O for paraffins
3) 2n CO + n H2 rarr CnH2n + n CO2 for olefins
4) n CO + 2n H2 rarr CnH(2n+1)OH + (n-1) H2O for alcohols
Equilibria
5) CO + H2O harr CO2 + H2 Water-gas-shift reaction (WGS)
6) CO + 3 H2 harr CH4 + H2O
7) 2 CO harr C + CO2 Boudouard equilibrium
The whole reaction gives an energetic contribution strongly exothermic (about
150 kJmol CO reacted) FTS is a particularly complex system in which a
number of different reactions are combined to a unique mechanism
irreversible FT reactions produce hydrocarbons and some equilibria reactions
between CO CO2 CH4 and C such as the WGS reaction and the Boudouard
equilibrium are present too Nevertheless it is possible to suppose that FTS
can be simplified as a combination of the FT reactions and the WGS reaction
[14] Hydrocarbons are primary products of FT reaction and CO2 can only be
produced by WGS reaction a reversible parallel-consecutive reaction with
respect to CO [16]
At present the marketplace places a premium on FT diesel but not gasoline
thus the current view is that the most attractive option is to produce high
molecular weight FT products and then to hydrocrack them to produce high
quality diesel fuel [17] According to Calderone et al [18] the most important
limitation to the industrialization of FT processes is the availability of cheap oil
Industrial interest in FT reactions always peaks during oil crises (Fig 13) The
Chapter 1 General Introduction
31
Kyoto protocol recognizes the importance of developing and deploying new
technologies with less impact on the environment
Fig 13 The oil price (line) related to the output of peer reviewed FTS research papers and patents (bars) in 1925ndash2007 [19]
Fig 14 Number of papers related to FT synthesis published in the past decade From
ISI Web of Science using the keyword ldquoFischer-Tropschrdquo [20]
Selectivity control remains one of the most important and difficult challenges
in the research area of FTS Development of efficient catalysts with controlled
selectivity or tuned product distribution is a highly desirable goal [5]
Compared to cobalt systems iron-based catalysts are cheaper but less resistant
to deactivation due to the oxidizing effect of water despite activating Water
Gas Shift (WGS) reaction (CO + H2O harr CO2 + H2) [12 16] Moreover they are
flexible to changes in temperature pressure and they can work at different H2
CO feed ratios (for iron based catalysts this ratio can be between 05 and 25)
[21-22] Iron catalysts seem to be more suitable to work with biomass-derived
Chapter 1 General Introduction
32
syngas as outlined by Corma et al [23] that are characterized by a low ratio
H2CO and by the presence of CO2 (the activation of WGS reaction in fact can
produce CO from CO2) They present lower methane selectivity and they are
less deactivated by poisons species [24] The iron based catalysts have different
active site the Fe-carbides sites are active for the formation of hydrocarbons
(FTS) while the magnetite (Fe3O4) sites are the most active phase for the WGS
reaction [16 25-26]
11 Fischer Tropsch Synthesis Historical background
A Short Historical Sketch
Year Ref
1902 P Sabatier and J D Senderens
Hydrogenated CO over Ni to produce CH4 [27]
1910 A M Mittasch C Bosch and F Haber
Developed promoted Fe catalysts for the synthesis of NH3 [28]
1913 Badische Anilin und Soda Fabrik (BASF)
Received patents on the preparation of hydrocarbons and oxygenates by the hydrogenation of CO at high pressure usually on oxide catalysts
1936 Eugene Houdry Developed and installed the first commercial catalytic cracking unit [29]
1943-1944
Kogravelbel KWIK and five companies participated
Initiated and directed the comparative tests I and II held at Schwarzheide to select a Fe catalyst to replace Co in existing reactors Although the results were remarkably good no replacement catalyst was selected probably because of the overall disarray of activity that attended the approach of the end of the war
[30]
1949 Kogravelbel and F Engelhardt
Discovered that H2O and CO react on FTS catalysts to yield typical FTS products
1950 A fluidized-fixed bed process developed by Hydrocarbon Research Trenton New Jersey was installed in Brownsville Texas This plant called Carthage Hydrocol Inc used reformed natural gas Severe operating difficulties required designing a new reactor which was installed in 1953 The new reactor operated properly but the plant was promptly shut down sold and dismantled By the time the plant was operating correctly the price of natural gas had more than doubled Merely selling the gas was more profitable than converting it to gasoline and chemicals At the same time in South Africa the SASOL FTS plant using coal was constructed and opened in 1955 Lurgi gas generators and Rectisol gas-cleaning units were employed Two types of FTS reactors both with Fe catalysts were used a fixed-bed with recycle unit designed by Ruhrchemie in West Germany having long tubes with an internal diameter of 2 inch and an entrained-solids reactor by M W Kellogg in New Jersey After a year or more of start-up problems these units have operated successfully up to the present
[31]
1953 R B Anderson and J F Shultz
Found that Fe nitrides are unique durable catalysts for the FTS that produce large yields of alcohols Anderson developed equations that predict the isomer and carbon-number distributions of FTS products
[32]
1957 G Natta and co-workers
Studied the methanol and higher alcohol syntheses [3334]
1959 Pichler Resumed work on FTS on Ru which led to the polymethylene synthesis
Chapter 1 General Introduction
33
1961 H H Storch He died he was the architect of the useful scientific and engineering research programs on coal-to-oil processes at the US Bureau of Mines in Pittsburgh and Bruceton Pennsylvania
[3235]
1967 US Bureau of Mines workers
Developed methods for flame spraying catalysts onto metals for the platelet assemblies of hot-gas-recycle reactors These techniques led to the development of a new FTS unit the tube-wall reactor
[36]
1975 SASOL II SASOL III
In South Africa the decision was made to build SASOL II scheduled for operation in 1980 and in 1979 plans were made for SASOL III to begin operation in 1982 The new plants are similar to the initial plant except that fixed-bed FTS reactors were not included in the new installations
[31]
1976 Mobil Announced a process for converting methanol to an aromatic gasoline and C to C4 olefins on the shape-selective catalyst ZSM5 This process may be a serious competitor for FTS
1981 New Zealand A methanol plant operating on natural gas plus the Mobil process was planned scheduled for competition in 1985
1982 The worldwide recession
Sharply decreased demand for petroleum OPEC was unable to control the production and price of oil among its members The relatively low cost and abundance of petroleum has discouraged new coal-to-oil ventures
1993 Shell in Bintulu Malaysia
Completed construction and began operating their ldquoShell Middle Distillate Processrdquo The Bintulu Plant produces 12500 BPD and in 2000 increase that capacity to 15000 BPD This F-T plant has effectively captured the world specialty wax market
2000 While Saudi Arabia produced about 8 million barrels of oil per day in 2000 the world flared (burned) or re-injected associated gas equivalent to 72 million barrels per day of clean synthetic fuels Worldwide environmental legislation requiring ultra-low sulphur and aromatic levels in fuel will cost billions in oil refinery upgrading
2002 Nearly every major oil company is either developing their own F-T technology forming joint ventures or scrambling to do so ExxonMobil has spent over $500 MM Chevron formed a joint venture with Sasol Statoil has formed a joint venture with Mossgas Conoco built a $400MM test plant in Oklahoma BP completed its pilottest plant in Alaska Shell has announced 7 new projects
2004 50 new Fischer-Tropsch projects have been announced These projects total over 900000 BPD capacity Some of these projects are pilot plants some are feasibility studies for clients and some have started construction
2005 In South Africa Mossel Bay GTL Expansion operated by PetroSA with a capacity of 15000bpd
2006 In Qatar ORYX GTL Phase 1 operated by SasolQatar Petrol with a capacity of 32400 bpd
2011 In Qatar Pearl GTL Phase 1 operated by Shell with a capacity of 70000 bpd
2011 In Qatar Pearl GTL Phase 2 operated by Shell with a capacity of 70000 bpd
2013 In Nigeria Escravos operated by ChevronNNPC with a capacity of 34000bpd
2017 In Uzbekistan Oltin Yorsquol GTL operated by SasolUNGPetron with a capacity of 38000bpd
2018-19
In USA Sasol Lousiana operated by Sasol with a capacity of 96000bpd
Firm proposed large-scale GTL capacity outlook
Chapter 1 General Introduction
34
Fig 15 The Sasol Synfuels plant at Secunda South Africa
Fig 16 ldquoShell Middle Distillate Processrdquo in Bintulu Malaysia
Fig 17 Franz Fischer and Hans Tropsch
12 Present Situation of Fischer-Tropsch Technology
High energy prices and concerns about the environmental consequences of
greenhouse gases (GHG) emissions lead a number of national governments to
provide incentives in support of the development of alternative energy
Chapter 1 General Introduction
35
sources making renewables the worldrsquos fastest-growing source of energy in
the outlook
According to the Annual Energy Outlook 2013 [37] the aggregate fossil fuel
share of total energy use falls from 82 percent in 2011 to 78 percent in 2040 in
the Reference case while renewable use grows rapidly (Fig 17) The
renewable share of total energy use grows from 9 percent in 2011 to 13
percent in 2040 in response to the federal renewable fuels standard
availability of federal tax credits for renewable electricity generation and
capacity during the early years of the projection and state renewable portfolio
standard (RPS) programs
Increased vehicle fuel economy offsets growth in transportation activity
resulting in a decline in the petroleum and other liquids share of fuel use even
as consumption of liquid biofuels increases Biofuels including biodiesel
blended into diesel E85 and ethanol blended into motor gasoline (up to 15
percent) account for 6 percent of all petroleum and other liquids consumption
by energy content in 2040
Consumption of petroleum and other liquids peaks at 198 million barrels per
day in 2019 in the AEO2013 reference case and then falls to 189 million barrels
per day in 2040 (Figure 18)
Fig 18 Primary energy use by fuel 1980-2040 (quadrillion BTU)
Chapter 1 General Introduction
36
The transportation sector accounts for the largest share of total consumption
throughout the projection although its share falls to 68 percent in 2040 from
72 percent in 2012 as a result of improvements in vehicle efficiency following
the incorporation of CAFE standards for both LDVs and HDVs
An increase in consumption of biodiesel and next-generation biofuels (include
pyrolysis oils biomass derived Fisher-Tropsch liquids and renewable feedstocks
used for on-site production of diesel and gasoline) totaling about 04 million
barrels per day from 2011 to 2040 is attributable to the EISA2007 RFS
mandates The relative competitiveness of CTL and GTL fuels improves over the
projection period as petroleum prices rise In 2040 CTL and GTL together
supply 03 million barrels per day of nonpetroleum liquids
Fig 19 Consumption of petroleum and other liquids by sector 1990-2040 (million
barrels per day)
2 Oil prices and total energy consumption
The importance of the research in FTS is directly dependent of the oil prices
and the total energy consumption So it is so important to meet the
projections of these variables before to make every kind of investments on this
area In AEO2013 oil prices are represented by spot prices for Brent crude
Prices rise in the Reference case from $111 per barrel in 2011 to about $117
Chapter 1 General Introduction
37
per barrel in 2025 and $163 per barrel in 2040 (Table 1) The price rise starts
slowly then accelerates toward the end of the projection period
Market volatility and different assumptions about the future of the world
economy are reflected in the range of oil price projections for both the near
and long term however most projections show oil prices rising over the entire
projection period
Table 1 Comparisons of oil price projections 2025 2035 and 2040 (2011 dollars per
barrel)
As regard the total energy consumption the in table 2 there are four different
projections made by other organizations (INFORUM IHSGI ExxonMobil and
IEA) [37]
Chapter 1 General Introduction
38
Table 2 Comparisons of energy consumption by sector projections 2025 2035 and
2040 (quadrillion BTU)
ExxonMobil includes a cost for carbon dioxide (CO2) emissions in their
projection which helps to explain the lower level of consumption in their
outlook Although the IEArsquos central case also includes a cost for CO2 emissions
its Current Policies Scenario (which assumes that no new policies are added to
those in place in mid-2012) is used for comparison in this analysis because it
corresponds better with the assumptions in the AEO2013 Reference case
ExxonMobil and IEA show lower total energy consumption across all years in
comparison with the AEO2013 Reference case Total energy consumption is
Chapter 1 General Introduction
39
higher in all years of the IHSGI projection than in the AEO2013 Reference case
but starts from a lower level in 2011
For the transportation sector the difference could be related to vehicle
efficiency as the INFORUM projection for motor gasoline consumption (2
quadrillion Btu lower than AEO2013) is comparable with the EIA projection in
AEO2012 which did not include the efficiency standard for vehicle model years
2017 through 2025
IHSGI projects significantly higher electricity consumption for all sectors than in
the AEO2013 Reference case which helps to explain much of the difference in
total energy consumption between the two projections
Then the projections make possible the investment on research in Fischer ndash
Tropsch synthesis
The process known as Gas to Liquid (GTL) was based on two steps
Steam reforming of natural gas into syngas
Fischer Tropsch synthesis from syngas into synthetic liquid fuels
Recently (2004-2006) the massive growth of GPN (Gross National Product) in
China and India has caused crude oil process to rise continuously and FTS
(including both coal and biomass as feedstock BTL) has become once more an
appealing technology Recent interest in FT technology especially in Europe and
South America is driven by a focus on the gasification of biomass into fuel [38]
(BTL)
Biomass to Liquid via FischerndashTropsch (BTL-FT) synthesis is gaining increasing
interests from academia and industry because of its ability to produce carbon
neutral and environmentally friendly clean fuels
In the BTL-FT process biomass such as woodchips and straw stalk is firstly
converted into biomass-derived syngas (bio-syngas) by gasification
Chapter 1 General Introduction
40
Bio-syngas resulting from biomass gasification contains CO H2 CO2 CH4 and
N2 in various proportions [39 40] Then a cleaning process is applied to
remove impurities from the bio-syngas to produce clean bio-syngas which
meets the FischerndashTropsch synthesis requirements Cleaned bio-syngas is then
conducted into a FischerndashTropsch catalytic reactor to produce green gasoline
diesel and other clean biofuels
Generally there are three main steps in the Biomass to Liquid via Fischerndash
Tropsch (BTL-FT) synthesis [41-43] Biomass is firstly converted into biomass-
derived syngas (bio-syngas) by gasification In a second step a cleaning process
is applied to the bio-syngas in order to remove impurities resulting in clean
bio-syngas which meets the FischerndashTropsch synthesis requirements Finally
the cleaned bio-syngas is then conducted into FischerndashTropsch catalytic reactor
to produce green gasoline diesel and other clean biofuels The flow sheet of
the BTL-FT process is depicted in Figure 110
Fig110 Flow sheet of the Biomass to Liquid via FischerndashTropsch Synthesis (BTL-FT)
process [44]
It is difficult to predict the composition of the gas product from a gasifier due
to the complex reactions occurred during the gasification Table 13 shows the
typical composition of gas produced from gasification of wood and charcoal
with low to medium moisture content with ambient air as the gasifying agent
in a downdraft gasifier [45] and composition of bio-syngas from biomass
gasification [46ndash48]
Chapter 1 General Introduction
41
At present the main commercial interest in FTS is the production of high
quality sulphur-free synthetic diesel fuels from natural gas currently being
flared at crude oil production wells [49-52] This renewed interest in FTS has
not just only come about as a result of abundant supply of natural gas but also
because of the global development of fuel supplies and environmental
regulations to improve air quality in cities around the world
All these facts have recently aroused renewed interest in the FischerndashTropsch
Synthesis Synthetic diesel is being promoted by the fuel industry because it
can produce super clean diesel oil fraction with high cetane number (typically
above 70) without any sulfur and aromatic compounds with low particulate
formation and low NOx and CO emission [3-4 53] as the most viable next step
towards the creation of a sustainable transport industry
Table 13 Composition of gas produced from gasification of wood and charcoal in
ambient air [45] and also the composition of typical nitrogen free bio-syngas [46ndash48]
Component Wood gas (air) Charcoal gas (air) Bio-syngas
(nitrogen free)
N2 50ndash60 55ndash65 0
CO 14ndash25 28ndash32 28ndash36
CO2 9ndash15 1ndash3 22ndash32
H2 10ndash20 4ndash10 21ndash30
CH4 2ndash6 0ndash2 8ndash11
C2H4 na na 2ndash4
BTX na na 084ndash096
C2H5 na na 016ndash022
Tar na na 015ndash024
Others na na lt0021
Chapter 1 General Introduction
42
3 Viability of GTL for the gas market
According to Brown [54] between 1950 and 2010 global volumes of GTL
product output capacity had materialized at less than 100000 bd -roughly
equivalent to the output of just one average- sized east European refinery
However the recent confluence of several factors has altered the commercial
viability of the GTL industry suggesting that wide margins and robust revenues
can be earned by converting natural gas into clean-burning liquid fuels and
other high value oil-linked commodities Broadly speaking these factors are
1) Improvements in the lifespan of the catalysts used to derive hydrocarbon
chains from natural gas (methane) and efficiency gains in the Fischer Tropsch
processes
2) The detachment of natural gas markets from oil prices and the subsequent
wide differential between the two prices courtesy of the unconventional gas
boom
3) Long-term global demand trends favouring low-emissions fuels in the
transport sector
Despite these auspicious circumstances however this paper argues that GTL
fuels will have only a limited reach into oil product markets and the transport
sector going forward While downward pressure on natural gas prices and
increasing demand for clean-burning motor fuels have ushered in visions of a
new future of transport fuels (that) will soon go global [55] the transient
conditions that had supported a favourable outlook for the proliferation of GTL
liquid fuels over the period of 2009-12 have more recently shown signs of
deterioration Moreover alternative and less capital-intensive pathways to
natural gas monetization are emerging via small-scale modular GTL plants
whose development has been encouraged by the rapidly increasing supply of
Chapter 1 General Introduction
43
unconventional and associated gas which has necessitated more practical and
localized gas monetization solutions
Commodity prices for transport fuels such as diesel are closely correlated to
crude price movements (see Fig 110) and moreover trade at a premium to
crude benchmarks depending on regional dynamics such as product balances
and cyclical demand conditions GTL products sharing identical physical
characteristics with crude-refined diesel have the potential to exploit not only
the market price differential between gas feedstock and oil prices but in
addition the spread between oil benchmark prices and oil product markets
The confluence of these dynamics leads to significantly wider margin potential
than that experienced by crude-refined alternatives in oil product markets at
least in a context defined by high oil and low gas prices Accordingly the upside
revenue potential of large-capacity GTL builds is dictated by the relatively
straightforward principle that the more capacity dedicated to products trading
at a premium to crude a plant has the higher the plants revenues will be
Fig 111 Correlation between ultra-low sulphur diesel spot prices and Brent crude
Europe offers an ideal destination for GTL-derived diesel A combination of
stringent fuel quality specifications and declining domestic supply supports a
healthy environment for gasoil and diesel imports Moreover the oil product
market is predominately driven by gasoildiesel consumption which accounted
Chapter 1 General Introduction
44
for well over half (56 per cent see Fig 111) of main product demand in 2012
As such the current application and commercialization of GTL diesel in Europe
reflects the potential of GTL diesel to impact global gasoil markets
Fig 112 Europe main oil product demand (2012)
In order to meet supranational carbon emissions targets progressively tighter
EU-wide Fuel Quality Directives have mandated a sharp reduction of sulphur
content in gasoildiesel marketed within the European Union The
specifications for sulphur content in motor fuels (gasoline and diesel) in the
road sector were reduced from 350 parts per million (ppm) in 2000 to just 10
ppm in 2009 The legislation was amended in 2011 to encompass gasoil and
diesel consumed in off-road sectors such as railways and inland navigation
and by 2012 10 ppm gasoil accounted for an estimated 80 per cent of Europe-
wide gasoil demand [54]
The gasoil produced by refineries in Europe has varying physical characteristics
in terms of sulphur content (affecting particulate emissions) cetane index
(influencing ignition quality in combustion engines) and viscosity (affecting
energy content and fuel efficiency) each influencing market value
It has been estimated that FT-GTL should be viable at crude oil prices of about
$20 per barrel The oil price has been well above $70 per barrel (more recently
Chapter 1 General Introduction
45
it has even topped above $100 per barrel) making it a very appealing for
countries that have huge reserves of natural gas but little local market for it
and no major pipeline infrastructure to ship it to larger economies
In Fig 112 it can be seen a geographical representation of the world proved
reserves for 2011
Fig 113 World proved reserves 2011 [37a]
12 Fischer Tropsch GTL Process and Chemistry
According to [56] the basic FT-GTL process consists of three fundamental steps
which require significant supporting infrastructure and a secure feed gas supply
to function effectively (Fig 113)
1 The production of synthesis gas (syngas) The carbon and hydrogen are
initially divided from the methane molecule and reconfigured by steam
reforming andor partial oxidation The syngas produced consists
primarily of carbon monoxide and hydrogen
2 Catalytic Fischer Tropsch synthesis The syngas is processed in Fischer-
Tropsch reactors of various designs depending on technology creating a
wide range of paraffinic hydrocarbons product (synthetic crude or
Chapter 1 General Introduction
46
syncrude) particularly those with long chain molecules (eg those with
as many as 100 carbons in the molecule)
3 Cracking-product workup The syncrude is refined using conventional
refinery cracking processes to produce diesel naphtha and lube oils for
commercial markets [57] By starting with very long chain molecules
the cracking processes can be adjusted to an extent in order to produce
more of the products in demand by the market at any given time In
most applications it is the middle distillate diesel fuel and jet fuels that
represent the highest-value bulk products with lubricants offering high-
margin products for more limited volume markets In modern plants
FT-GTL unit designs and operations tend to be modulated to achieve
desired product distribution and a range of products slates [58]
Fig 114 Large scale FT-GTL projects become more economically robust for the
developer if they involve integrated upstream and downstream components securing
feed gas supplies and additional revenues from NGL and condensate extracted from
the feed gas [56]
Chapter 1 General Introduction
47
The Fischer Tropsch processes are not limited to using gas derived from large
conventional non- associated natural gas as a feedstock coal seam gas
associated gas coal or biomass can all be processed using FT technologies by
changing the catalysts and work conditions (Pressure and temperature) A
secure supply of feed gas from whatever origin is important for the
commercial viability of large-scale FT-GTL plants Integrated upstream and
downstream projects therefore offer GTL project developers lower-risk returns
1) The production of synthesis gas (syngas)
Synthesis gas (ldquosyngasrdquo) is typically produced using either partial oxidation or
steam reforming processes [59] Syngas is an intermediate gas feed for many
different petrochemical processes including a range of GTL alternative
technologies
Partial
Oxidation
CH4 + frac12O2 CO +
2H2 (exothermic)
The key components required for this approach include A combustion chamber operated at high temperatures (1200-1500degC) without catalysts Process designs to impede a competing reaction to syngas formation which involves the decomposition of methane to carbon black (due to high temperature non-catalytic nature of the chemistry) [59]
Steam
Reforming
CH4 + H2O CO + 3H2 (endothermic)
Steam reforming is usually carried out in the presence of catalyst ndasheg nickel dispersed in alumina in operating conditions involving temperatures of 850-940degC and pressure of about 3MPa The process is typically conducted in tubular packed reactors with heat recovery from flue gas used to pre-
Chapter 1 General Introduction
48
heat the feed gas or to raise steam in waste heat boilers Several well-established engineering companies offer their own variants of this process
Other possible reactions are
CO+ H2O CO2 + H2
CH4+ CO2 2CO + 2H2
2) Fischer-Tropsch synthesis
According to [55] Fischer-Tropsch synthesis is one of a several technologies to
polymerise the carbon and hydrogen components into long-chain molecules
CO + 2H2 -CH2- + H2O (very exothermic)
Which in practice operates more typically as
2CO (gas) + H2 (gas) (-CH2-)n (liquid) + CO2 (gas) + H2O
The process involves some carbon dioxide emission and watersteam
production along with the hydrocarbon liquid production
The typical FT reactions compete with the methanation (reverse of steam
reforming) reaction (and reactions that lead to the production of propane and
butane (LPG) which are also highly exothermic
CO + 3H2 CH4 + H2O
In order to promote FT reaction in preference to methanation (or LPG
reactions) the synthesis is run at low temperatures 220-350degC pressure 2-3
MPa with carefully selected catalysts (ie commonly cobalt) in reactors that
encourage the growth of long-chain hydrocarbon molecules Several
companies hold patents associated with XTL catalysts process vessels and
process sequences (eg Conoco Phillips CompactGTL ExxonMobil Rentech
Sasol Shell Syntroleum and others) however it is only Sasol and Shell that
have built large-scale commercial plants (iegt5000 barrelsday of GTL product)
Chapter 1 General Introduction
49
rather than pilot-scale or demonstration plants The industry therefore remains
in its infancy and the many patents held by relatively few companies act as a
costly barrier to entry for resource-rich gas companies and countries wishing to
use GTL as an alternative means of monetizing their gas
There are two major categories of natural gas-based FT process technology the
high-temperature and the low-temperature types
HTFT (High-Temperature Fischer-Tropsch) In HTFT because of the process
conditions and the catalysts involved the syncrude produced includes a high
percentages of short chain (ie lt10 carbon atoms) with significant amounts of
propane and butane mixed with olefins (eg propylene and butylene) These
short-chain hydrocarbons gases are typically extracted from the tail gas stream
utilizing cryogenic separation The resultant lean tail gas is recycled and mixed
with additional lean feed gas for further syngas production [60] The high-
temperature (HT) iron catalysts-based FT GTL process produces fuels such as
gasoline and diesel that are closer to those produced from conventional oil
refining The resultant GTL fuels are sulphur-free but contain some aromatics
[61] Typical process operation conditions for HTFT are temperatures of
approximately 320degC and pressures of approximately 25MPa Conversion in
HTFT can begt85 efficient [62] but not all the products are readily usable or
capable of producing high-quality transport fuels HTFT processes tend to be
conducted in either circulating fluidized bed reactors or fluidized bed reactors
[63]
LTFT (Low-Temperature Fischer-Tropsch) LTFT involves the use of low-
temperature (LT) cobalt-catalyst-based processes either in slurry-phase
bubble-column reactors (eg Sasol) or in multi-tubular fixed bed reactors (eg
Shell) LTFT produces a synthetic fraction of diesel (GTL diesel) that is virtually
free of sulphur and aromatics Typical process operation conditions for LTFT are
Chapter 1 General Introduction
50
temperatures of approximately 220degC to 240degC and pressures of approximately
20 to 25 MPa Conversion in LTFT is typically only about 60 with recycle or
the reactors operating in series to limit catalyst deactivation [62]
The primary focus of most large-scale FT technologies in current market
conditions is to produce high-quality low-emissions GTL diesel jet fuel and
naphtha (for petrochemical feedstock or gasoline blending)
3) Cracking ndash product workup
From [56] FT GTL plants can be configured to produce a wide range of
products from lubricating base oils and waxes through to petrochemical
naphtha and specialty chemicals Most of the already developed and planned
plants target the production of diesel fuels (C14-C20) together with some
kerosenejet fuel (C10-C13) naphtha (C5-C10) lubricants (gtC50) and a little LPG
(C3-C4)- By adjusting operating conditions in the Fischer Tropsch reactor the
mix of products can be altered This enables FT GTL products to be produced in
quantities that enable them to target the high-value product markets of
petroleum products produced by conventional oil refineries
However the yield pattern from a typical FT GTL plant is significantly different
to that rom a catalytic cracking crude oil refinery (Fig 114) Typically the
diesel yield of FT GTL plant is around 70 much higher than for crude oil
refineries which is typically some 40 [64]
From Fig 114 the products derived from upgrading syncrude produced by FT-
GTL differ significantly from those produced by refining barrel of crude oil
Notably FT GTL produces more high-value zero-sulphur products especially
middle distillates On the other hand refining crude oil particularly heavy oil
produces substantial quantities of low-value fuel oil ie more than prevailing
markets can consume Source modified from [65]
Chapter 1 General Introduction
51
Most oil refineries yield some low-value fuel oil the yield depending on the
quality of the fuel processed and the type and capacity of the refineryrsquos fuel-oil
conversion units By contrast the FT GTL plants are configured to yield only
higher-value (relative to crude oil) light and middle distillate products From a
plant with existing technology the yield of middle distillates (gasoildiesel and
kerosene) is nearly a third more of the total product slate than that from a
typical oil refinery [66]
As predicted a decade ago [67] globally diesel demand is growing rapidly at
some 3 a year more quickly than other refinery products Against this
backdrop refiners face significant challenges to meet diesel demand and
quality in the future as crude oil supply becomes heavier and sourer [68]
Fig 115 Refinery Volume Yields versus FT GTL Yields
From [56] for FT-GTL to be commercial at oil prices of less than about
40$barrel plant capital costs operating costs and feed gas costs all have to be
substantially lower on a unit basis than large-scale plants built in recent years
have been able to deliver If the unit capital cost of an FT-GTL plant is close to
100000$barrelday the operating cost of that plant is close to 20$barrel of
Chapter 1 General Introduction
52
product and the feed gas costs in the vicinity of 5$MMBtu the liquid products
would cost in the vicinity of 100$barrel and the economics of such as a plant
do not look so inviting in 2012 market conditions The industry has to achieve
lower plant and feed gas costs to be economically attractive
Fischer- Tropsch Synthesis Opportunities and challenges
GTL technologies offer the potential to reduce global dependency on crude-oil
derived transportation fuels They also offer substantial opportunities for the
owners of stranded gas to diversify the markets into which they deliver their
gas-derived liquid products particularly targeting the large and rapidly growing
global middle distillate markets (See Fig 116)
However the technologies are complex costly and tightly held by a few
companies holding patents for the key process steps which present significant
barriers to entry for building large-scale plants This also renders the building of
large-scale plants challenging for the gas resource holders in terms of capital
costs access to technology and long-term transfer of GTL technologies
At the current time Fischer Tropsch technologies dominate GTL applications for
large scale-plants Technology breakthroughs are required if methane-to-
gasoline or methane-to-olefin plants are to displace traditional refinery and
petrochemical routes to those products On the other hand dimethyl-ether
(DME) has a growing market in Asia particularly in China which is likely to
expand if the one-step process avoiding the production route via methanol is
successfully scaled up as planned and transportation fuel markets are
developed for DME
Chapter 1 General Introduction
53
Fig 116 The GTL Industry Opportunities and Challenges
References
[1] Michael Talmadge Mary Biddy and Abhijit Dutta Syngas Upgrading to Hydrocarbon Fuels Technology Pathway National Renewable Energy Laboratory Technical Report NRELTP-5100-58052 PNNL-22323 March 2013 httpwwwostigovbridge [2] C Pirola C Bianchi A Di Michele P Diodati S Vitali V Ragaini Catal Lett 131 294-304 (2009) [3] M S Hadnadev-Kostic J Tatjana T Vulic R Marinkovic-Neducin A D Nikolic B Jovic Journal of Serbian Chemical Society 76 (12) (2011) 1661ndash1671 [4]E Lira C Loacutepez F Oropeza M Bartolini J Alvarez M Goldwasser F Loacutepez J Lamonier J Peacuterez Journal of Molecular Catalysis A Chemical 281 (2008) 146ndash153 [5] Qinghong Zhang Jincan Kang and Ye Wang ChemCatChem 2 (2010) 1030 ndash 1058 [6] C Perego M Ricci Catalysis Science amp Technology (2012) 2 1776ndash1786 [7] GWHuber SIborra ACorma Chemical Reviews 106 (2006) 4044
Chapter 1 General Introduction
54
[8] PL Spath and DC Dayton Preliminary Screening - Technical and Economic Assessment of Synthesis Gas to Fuels and Chemicals with Emphasis on the Potential for Biomass-Derived Syngas NRELTP-510-34929 December 2003 [9] F Fischer and HTropsch BrennstChem 4 (1923) 276 [10] A Martinez C Lopez F Marquez IJ Diaz Catalysis 220 (2003) 486 [11] John L Casci C Martin Lok Mervyn D Shannon Catalysis Today 145 (2009) 38ndash44 [12] MEDry in Enciclopedia of Catalysis ITHorvarth Ed JWileyampSons New York (2003) 247 [13] Fischer-Tropsch Technology in Studies in Surface Science and Catalysis Elsevier New York (2004) [14] GPVaan Deer Laan AACMBeenackers Catalysis Reviews-SciEng 41(3amp4) (1999) 255 [15] HSchulz Applied Catal A 186 (1999) 3 [16] GP van der Laan AACMBeenackers Applied Catal A 193 (2000) 39 [17] RJOrsquoBrien LXu SBao ARaje BHDavis Applied Catalysis A general 196 (2000) 173 [18] V Roberto Calderone N Raveendran Shiju Daniel Curulla Ferreacute and Gadi Rothenberg Green Chemistry 2011 13 1950ndash1959 [19] E D Smit and B MWeckhuysen Chem Soc Rev 2008 37 2758ndash 2781 [20] Qinghong Z Weiping D Ye W Review Recent advances in understanding the key catalyst factors for Fischer-Tropsch synthesis J Ener Chem 2013 2227ndash38
[21] AY Khodakov WChu P Fongarland Chem Rev 107 (2007) 1692 [22] BHDavis Catal Today 84 (2003) 83 [23] GWHuber SIborra ACorma ChemRev 106 (2006) 4044 [24] J Xu CHBartholomew J Phys Chem B 109 (2005) 2392 [25] HB Zhang GL Schrader JCatal 95 (1985) 325 [26] ES Lox GB Marin E de Graeve P Bussiere Appl Catal A 40 (1988) 197 [27] PSabatier and JDSenderens CRHebdSeance AcadSci 134 514 680 (1902) [28] AMittash AdvCatal 2 (1950) 81 [29] EHoudry WFBurt AEPew WAPeters Pet Refiner 17 (1938) 574 [30] H Pichler AdvCatal 4 (1952) 271 [31] MEDry Chemtech 12 (1982) 744 [32] RBAnderson ACS SympSer 222 (1983) 389 [33] GNatta in ldquoCatalysisrdquo (PH Emmett ed) Vol3 p349 Van Nostrand-Reinhold Priceton New Jersey 1955 [34] GNatta UColombo IPasquon in ldquoCatalysisrdquo (PH Emmet Ed) Vol5 p131 Van Nostrand-Reinhold Princeton New Jersey 1957
Chapter 1 General Introduction
55
[35] RBAnderson Fuel 41 (1962) 295 [36] MJ Baird RRSchehl WPHaynes and JTCobb Ind Eng Chem Prod Res Dev 19 (1980) 175 [37] EIA Annual energy outlook 2013 Available at httpwwweiagovforecastsaeopdf0383(2013)pdf accessed on 16 august 2013 [37a] US Energy Information Administration Available at httpwwweiagovcountriesindexcfmview=reserves accesed on 16 august 2013 [38] MJ Prins KJ Ptasinski FJJG Janssen Fuel Process Technol 86 (2005) 375 [39] Klass DL Biomass for Renewable Energy Fuels and Chemicals Academic Press San Diego CA USA 1998 [40]Beenackers AACM Swaaij WPM Thermochemical Processing of Biomass Butterworth London UK 1984 [41] Demirbas A Energy Educ Sci Technol 17 (2006) 27ndash63 [42] Tijmensen MJA Faaij APC Hamelinck CN van Hardeveld MRM Biomass Bioenergy 23 (2002) 129ndash152 [43]Hamelinck CN Faaij APC den Uil H Boerrigter H Energy 29 (2004) 1743ndash1771 [44] J Hu F Yu Y Lu Catalysts 2 (2012) 303-326 [45] Stassen HEM Knoef HAM Biomass Technology Group University of Twente Enschede The Netherlands 1993 [46] Demirbas A Prog Energy Combust Sci 33 (2007)1ndash18 [47] Demirbas A Energy Sources A 29 (2007) 1507ndash1512 [48] Demirbas A Energy Sources A 30 (2008) 924ndash931 [49] MJPrins KJPtasinski FJJGJanssen Fuel Process Technol 86 (2005) 375 [50] CLIandoli SKjelstrup EnergyampFuels 21 (2007) 2317 [51] JJacometti AEkvall Shell in the Middle East 17 (2002) 1 [52] GCoupe Step on the gas in The Engineer 6 (2004) [53] T Fu Y Jiang J Lv Z Li Fuel Process Technol 110 (2013) 141ndash149 [54] C Brown The Oxford Institute for Energy Studies May 2013 ISBN 978-1-907555-74-9 Available on httpwwwoxfordenergyorgwpcmswp-contentuploads201305WPM-50pdf [55]K MacKenzie Financial Times 30 April 2013 httpftalphavilleftcom201304301473572where-are-all-those-natural-gas-fleet-conversions [56] D Wood C Nwaoha B Towler Journal of natural gas science and engineering 9 (2012) 196-208
Chapter 1 General Introduction
56
[57] Agee K Fundamentals of gas to liquids 2nd ed London Petroleum economist 29 (2005) 30-31 [58] Rahmin II Oil and gas Journal (2005) [59]Rahmin II Gas-to-liquid technologies Recent advances Economics Prospects 26th IAEE Annual International Conference June 2003 Prague Pp 1-36 [60] Minnie R et a 2005 Where it all began In Fundamentals of Gas to Liquids second ed Petroleum Economist London pp 27e29 (Chapter 28) [61] Waddacor M 2005 Converting gas into ultra-clean diesel in three steps In Fundamentals of Gas to Liquids second ed Petroleum Economist London pp 46-49 (Chapter 41) [62] De Klerk A 2012 Gas-to-liquids conversion In Natural Gas Conversion Technologies Workshop of ARPA-E US Department of Energy Houston TX 13 January 2012 [63] Velasco JA Lopez L Velasquez M Boutonnet M Cabrera S Jaras S 2010 Gas to liquids a technology for natural gas industrialization in Bolivia Journal of Natural Gas Science and Engineering 2 (5) 222e228 [64] Pytte T 2005 GTL diesel the way forward In Fundamentals of Gas to Liquids second ed Petroleum Economist London pp 32e35 (Chapter 31) [65] Fleisch TH Sills R Briscoe M Freide JF 2003 GTL-FT in the Emerging Gas Economy Fundamentals of Gas to Liquids Petroleum Economist p 39e41 [66] Corke M 2005 Securing a market In Fundamentals of Gas to Liquids second ed Petroleum Economist London pp 36e38 (Chapter 32) [67] Cherrillo RA Clark RH Virrels IG 2003 Shell Gas to Liquids in the Context of a Future Fuel Strategy e Technical Marketing Aspects 9th Diesel Engine Emissions Reduction Workshop Newport RI 24e28 Aug 2003 [68] Wood DA 2007 Consequences of a heavier and sourer barrel Petroleum Review April ed 30e32
57
Chapter 2 Chemistry of Fischer-Tropsch Synthesis
The FischerndashTropsch (FT) reaction is a heterogeneous catalytic reaction that
converts synthesis gas that is a mixture of carbon monoxide (CO) and
hydrogen (H2) into mainly linear hydrocarbons in the range C1 to C100 It is a
surface polymerization reaction that uses monomers formed by hydrogenation
of adsorbed CO in order to produce hydrocarbons and oxygenated products
with a broad range of chain length and functionality
The chemistry of the process can be described by the set of irreversible and
equilibrium reactions
According to Glasser et al [1] the FischerndashTropsch (FT) reaction mechanism is
still an issue of contention [2 3] Many apparently different mechanisms have
been proposed but common to them all is the concept that a stepwise chain
growth process is involved This is supported by the fact that the carbon
number product distributions calculated on probabilities of chain growth match
the experimentally observed results obtained in different reactor types and
sizes over widely varying process conditions with different catalysts [1]
There are some important aspects related to the FTS that will be discuss in this
chapter to better understand the chemistry of this process
1) FT thermodynamics
2) FT reaction mechanism
3) FT products selectivity
4) FT kinetics
5) Influence of FT process conditions
Chapter 2 Chemistry of Fischer Tropsch Synthesis
58
21 FT Thermodynamics
The Fischer-Tropsch Synthesis is a highly exothermic reaction [4]
n CO + (2n +1) H2 CnH2n+2 + n H2O Hdeg - 40 kcalmol (1)
n CO + 2n H2 CnH2n + n H2O Hdeg - 35 kcalmol (2)
n CO + 2n H2 CnH2n+1 OH + (n-1) H2O Hdeg - 35 kcalmol (3)
Thermodynamically the formation of methane and other hydrocarbons
is energetically favourable that means negative Gibbs energy values for
reaction (1)-(3)
In figure 21 standard Gibbs energy variation for the production of
hydrocarbons and alcohols is reported as a function of temperature
0
80
60
40
20
- 20
- 40
- 60
- 80
- 100
- 120
- 140
500 1000
Temperature K
G
degn
kJ
mol
of
CO
CH3OH
C2H5OH
CH4
C2H6
C2H4
C8H16
C4H8
Figure 21 Standard Gibbs energy of some FTS products [5]
From the diagram reported in figure 21 it can be deduced that methane
formation is highly favoured over that of the alcohols olefins and
hydrocarbons of heavier molecular weight In Fig 21 to keep all of the curves
on the same scale the enthalpy and free energy changes are divided by the
number of carbons atoms in the product Thus the equilibrium constant for
the reaction is given by RTnGnK exp 0
Chapter 2 Chemistry of Fischer Tropsch Synthesis
59
On the basis of thermodynamics a vast variety of molecules can be produced
in synthesis reaction up to 400degC and for some up to 500degC particularly at
elevated pressures including acetaldehyde and higher aldehydes ketones
esters Usually a broad spectrum of types of molecules carbon numbers and
carbon-chains structures is produced and the distribution of molecules
depends on the selectivity of the catalyst employed Generally the reaction
products are not in thermodynamic equilibrium with other product molecules
or reactants
Summarizing it is important to highlight some important aspects of the FT
thermodynamics
It is energetically possible to produce a vast array of hydrocarbons and organic
molecules by the hydrogenation of CO and related process such as the H2 + CO2
and the H2O + 3 CO reactions Most of these reactions are highly exothermic
A variety of reactions of synthesis products are thermodynamically possible
such as dehydration of alcohols hydrogenation of olefins hydrogenolysis of
paraffins and a number of isomerization reactions
On an energetic basis olefins and alcohols can be ldquoincorporatedrdquo into synthesis
reactions to produce higher molecular weight hydrocarbons in any amount
Paraffins element carbon or carbidic carbon can be ldquoincorporatedrdquo into
synthesis reactions to only a limited extent that is part of the carbon of the
hydrocarbon must come from H2 + CO
22 FT Reaction Mechanism
According to [6] FT synthesis follows the polymerization mechanism It is
generally accepted that CO undergoes dissociative or hydrogen-assisted
dissociative chemisorption on the surface of Ru Co or Fe metal or metal
Chapter 2 Chemistry of Fischer Tropsch Synthesis
60
carbide nanoparticles forming CHx (x = 0minus3) intermediates as the monomers
for polymerization The coupling between CHx monomers leads to chain
growth providing CnHm intermediates CnHm intermediates with different
carbon numbers can then undergo hydrogenation or dehydrogenation to
afford paraffins or olefins as the final products An early work pointed out that
the coupling between methylene (CH2) groups mainly accounted for the chain
growth but recent theoretical studies suggested that the situation was more
complicated [7-12] Depending on the identity and the structure of the surface
concerned the monomeric CHx species for polymerization may be different
The calculation of energy barriers suggests that the couplings of (CH+CH)
(C+CH) (C+CH2) or (CHx+HCO) may all be possible [7-12]
Since its discovery many efforts have been made to identify the surface
species that lead to chain initiation and chain growth The FT reaction
mechanism is still an issue of contention
There are some mechanisms like the mechanism proposed by Fischer in 1926
(lsquocarbidersquo theory) but it has a problem he did not explain the production of
relatively large amounts of oxygenated products ie alcohols
According to [13] elementary steps of FTS can be grouped into few basic sets
including
(1) reactant (CO and H2) adsorption
(2) CO activation (or chain initiation)
(3) chain propagation and
(4) chain termination (product formation)
Fig 22 shows possible CO activation steps in the carbide (also referred to as
the alkyl or methylene) and the CO-insertion mechanisms For the classical
carbide mechanism the CO activation step consists of a direct CO dissociation
(ie the C O bond is severed before C is hydrogenated) whereas in the CO-
Chapter 2 Chemistry of Fischer Tropsch Synthesis
61
insertion pathway CO is first hydrogenated and only then is the C O bond
broken to give the chain starter (CH3S) Newer modification of the carbide
mechanism assumes that hydrogen assists in the C O bond scission The
primary difference between the two mechanisms is the type of species being
inserted into the growing chain CHx for the carbide (most often CH2) and
adsorbed CO for the CO-insertion mechanism Storsaeligter et al [14] compared
versions of the two mechanismsndash carbide (including direct and H-assisted CO
dissociation) and CO-insertion ndash using the UBI-QEP (unity bond index ndash
quadratic exponential potential) method [15] and micro-kinetic modeling ofC1
and C2 species formation Their results showed that the chosen CO-insertion
pathway had a lower activation barrier compared to both direct and H-assisted
CO dissociation mechanisms that were utilized Based on these findings they
suggested that the CO-insertion mechanism is likely the main mechanism of
FTS
Fig 22 Examples of CO activation pathways (a) direct CO dissociation (carbide
mechanism) and (b) H-assisted CO dissociation (carbide mechanism) (c) CO hydrogenation (CO-insertion mechanism) [13]
Chapter 2 Chemistry of Fischer Tropsch Synthesis
62
The following Figure (23) [16] shows another representation of the chain
initiation growth and termination deeply find in literature
Chain Initiation
CO C O C O
M M M
+
C
M
H2
CH2
MCH3OH
H2O
INITIATION AND C1 COMPOUNDS
M
+ C
GRAPHITE
OHH
H2
H2
H2CH4
Chain Growth
Chain Termination
Fig 23 Different steps of the reaction mechanism in FTS
Fig 24 shows a simplified scheme for the formation of chain starters and
incorporation into growing chains The CH3 groups formed as a precursor to
methane are assumed to act as chain growth centres Addition of a hydrogen
atom produces methane while insertion of a CH2 group into the metal-carbon
Chapter 2 Chemistry of Fischer Tropsch Synthesis
63
bond of a CH3 group produces an ethyl group and continuation of this type of
reaction gives rise to a spectrum of adsorbed alkyl groups
C CH2CH
H H
CH3H
CH2
R
chain starter
chain growth
(incorporation)
CH3CH3
CH2
H
CH4
R
Fig 24 Simplified kinetic scheme of the successive hydrogenation of surface carbon
yielding chain starters and incorporation into growing chains
The oxygen released by CO dissociation is removed from the catalyst as either
H2O or CO2
As far as hydrogenation process is concerned there is still controversy on the
reaction mechanism first of all it is uncertain if the monomer formation
proceeds via hydrogenation of dissociated or undissociated CO Moreover
methyne methylene and methyl groups are assumed to be in equilibrium by
some authors on the basis of studies with metal clusters containing these as
ligands while others postulate that the hydrogenation of surface carbon and of
CHx species is an irreversible reaction
The nature of primary FT products reflects the nature of the surface bonded
intermediates from which they originate Primary hydrocarbon FT products are
preferentially straight chain terminal olefins and straight chain paraffins The
formation of primary paraffin molecule is represented as
Chapter 2 Chemistry of Fischer Tropsch Synthesis
64
R-CH2-CH2
HR-CH2-CH3
Terminally bonded (alpha) alkyl species on the catalyst surface can be
considered the most common intermediates
Olefin formation is represented as dissociative desorption from the alkyl
species (-elimination)
R-CH2-CH2R-CH=CH2 + H
The ratio probabilities of primary desorption as a paraffin or as an olefin is
commonly 025 That means that the reaction of desorption as a paraffin is
much less probable than the reaction of desorption as an olefin It is suggested
that the chain propagation is favoured against chain termination because of
the principle of lsquoselective inhibitionrsquo ie termination reaction are more
inhibited than propagation reaction by steric hindrance This effect is more
pronounced with paraffin than with olefin formation In fact while paraffin
desorption requiring the reaction between alkyl and H involves two metal
sites olefin desorption need an intermediate ie a transition state with and
bonding at the same metal site
R-CH2-CH2R-CH=CH2
HM M
R-CH=CH2 H
M
+
Chapter 2 Chemistry of Fischer Tropsch Synthesis
65
In both cases however this might not be easily accessible under the condition
of strong competitive chemisorption and strong spatial constraints
Chain termination can also occur by CO insertion into surface alkyls a step that
leads to the formation of predominantly primary alcohols [16]
23 FT Products Selectivity
The products from the FT on Co Fe and Ru show the following characteristics
[17]
1) the carbon-number distributions for hydrocarbons gives the highest
concentration for C1 and decrease monotonically for higher carbons
number although around C3-C4 often a local maximum is observed
2) Monomethyl-substituted hydrocarbons are present in moderate
amounts whereas dimethyl products are present in significantly smaller
amounts than monomethyl None of these branched products contain
quaternary carbons atom on Co Fe and Ru
3) Olefins from iron catalysts exceed 50 of the hydrocarbon products at
low carbon numbers and more than 60 of these -olefins The ethane
selectivity is low in comparison to propene The olefin content decrease
asymptotically to zero with increasing carbon number on Co Ru and Fe
catalysts
4) A change in chain growth parameter in the distribution is only observed
for linear paraffins and not for olefins
5) Yields of alcohols are maximal at C2 and decrease with carbon number
Low yields of methanol are probably the result of thermodynamic
limitations
Chapter 2 Chemistry of Fischer Tropsch Synthesis
66
Investigations of the carbon number spectrum based on the assumption of a
stepwise chain mechanism were carried out in considerable detail by several
authors
Herrington [18] described the distribution of paraffins wax using individual
chain termination probabilities for each chain size and he found that the
probability of chain growth in FT synthesis over a cobalt catalyst did not change
much with the chain length of the hydrocarbon
Anderson investigated the spectrum of a number of different catalysts The
plot of log Wnn against carbon number gave straight line over a fairly large
carbon number range (Wn is the mass fraction and n the carbon number) This
indicated again that the probability of chain growth was fairly constant [18]
Schulz modified and applied to the FT product spectrum the Flory equation
dealing with the product distribution in a polymerization process As pointed
out by Anderson the Schulz-Flory treatment was no different from the earlier
treatment and led to the equation henceforth referred as the Anderson-
Schulz-Flory (ASF) model
Wnn = (1- ) 2
n-1 (1)
where n is the number of carbon atoms in the product Wn is the weight
fraction of product containing n carbon atoms is the chain growth
propagation probability expressed by the equation
= rp (rp + rt) (2)
where rp is the propagation rate constant and rt is the termination rate
constant
The value is independent of carbon number it is estimated by a least-
squares linear regression of the logarithmic form of equation (3) the slope and
intercept both yielding
ln (Wnn) = ln (1-)2 + (n-1) ln (3)
Chapter 2 Chemistry of Fischer Tropsch Synthesis
67
Different factors have an influence on the alpha parameter such as process
conditions type of catalyst and chemical promoters [19 20] The ASF product
distribution as a function of α is depicted in Figure 25
The ASF equation did not distinguish between different product types In
practice a multicomponent product mixture is formed According to the ASF
model the maximum selectivity toward C2minusC4 olefins is achieved with an alpha
value between 04 and 05 One of the most efficient ways of shifting product
selectivity to low alpha values is by increasing reaction temperature However
a decrease on the chain growth probability results in an increase of methane
selectivity as indicated by the ASF product distribution This effect was long
considered a major restriction for the industrial application of the direct
conversion of syngas into lower olefins via the FischerminusTropsch synthesis [21
22] Negative deviations of the ASF model for methane selectivity have been
observed for iron-based catalysts [23 24] Schwab et al [23] proposed that Fe
catalysts possess different catalytic sites some in charge of CminusC coupling for
the growth of the carbon chain and others responsible for methane formation
Fig 25 AndersonminusSchulzminusFlory (ASF) model for the prediction of product distribution
Deviations from ASF Distribution Anderson-Schulz-Flory Distribution is a well-
accepted model for describing product selectivity in FT synthesis especially for
Chapter 2 Chemistry of Fischer Tropsch Synthesis
68
its simplicity nevertheless significant deviations have been noticed and
reported in literature
1) Methane selectivity is in general higher than predicted theoretically by ASF
kinetics Several mechanisms have been postulated to explain these
experimental data [25-26]
2) Anomalies of Ethane and Ethene The maximum C2 selectivity is expected to
be about 30 wt while in practice the maximum found is only about 18 wt It
is commonly observed for iron as well as for cobalt and ruthenium catalysts
that the C2 selectivity is lower than the C1 and C3 selectivity [17]
3) Change in Chain Growth Parameter is defined by ASF model as a
parameter independent of the product carbon number n nevertheless it has
been observed that at a carbon number of about 10 the slope of the
semilogarithmic mole fractions of hydrocarbons against carbon number
increases This phenomenon has been described on iron cobalt and ruthenium
catalysts [27] Suggestions for the increased chain growth parameter or two
probabilities of chain growth are the occurrence of different catalytic sites [28]
or the existence of different chain termination reactions [25] Several attempts
to model hydrocarbon distribution with two different values of have been
reported However the assumption of multiple catalytic sites cannot explain
the decrease of the olefin-to-paraffin ratio with increasing chain length
decreasing space velocity and increasing H2CO ratios in the reactor Kuipers et
al [29] stated that the occurrence of secondary reactions gives the most
reasonable explanation for the deviations from the ASF distribution
24 FT kinetics According to Glasser et al [1] kinetic models of FTS on cobalt iron and
ruthenium catalysts have received considerable attention [30-35] from
Chapter 2 Chemistry of Fischer Tropsch Synthesis
69
researchers in the past but not recently The major problem in describing the
FT reaction kinetics is the apparent complexity of the reaction mechanism and
the large number of species involved When one looks at the kinetic studies in
the literature one finds that there are a variety of rate expressions as well as a
wide range of activation energies for both Co and Fe catalysts This raises
questions about which of these data kinetic parameters and rate expressions
can be relied on for estimating reaction rates andor conducting preliminary
reactor design [36] This strongly suggests that the complex FT reaction
behavior may not be described efficiently by kinetics alone This point is
addressed at a later stage
However the proposed mechanism used a variety of surface species and
different elementary reaction steps resulting in empirical power-law
expressions for the kinetics However also Langmuir-Hinshelwood-Hougen-
Watson (LHHW) and Eley-Rideal type of rate equations have been applied
based on a reaction mechanism for the hydrocarbon-forming reactions In most
cases the rate-determining step was assumed to be the formation of the
monomer These rate expressions for the consumption of synthesis gas mainly
differ in the monomerrsquos nature and in the adsorption of CO H2 and products
(H2O and CO2) on the catalyst surface Ideally the development of kinetic rate
expressions should be based on each possible rate determining process in a
well-defined mechanistic scheme in the hydrocarbon forming reactions Kinetic
studies of the consumption of synthesis gas on cobalt and in particular way
iron catalysts will be discussed in detail in this chapter Kinetic models which
describe the rate of formation of products and the water gas shift reaction will
not be discussed here their studies are reported in [17 37]
1) Overall conversion of synthesis gas
Chapter 2 Chemistry of Fischer Tropsch Synthesis
70
The kinetic rate equations presented for the synthesis-gas consumption do not
present a uniform picture In general the FT synthesis is simplified as a
combination of the FT reaction and the water-gas-shift reaction
CO + (1 + m2n) H2 1n CnHm + H2O (RFT) (4)
CO + H2O CO2 + H2 (RWGS) (5)
where n is the average carbon number and m is the average number of
hydrogen atoms of the hydrocarbon products Water is a primary product of
the FT reaction and CO2 can be produced by the water-gas-shift reaction
(WGS) Iron based catalysts show a high WGS activity unlike Co and Ru based
catalysts That is reflected by the different kinetic expressions
Kinetic equation can be based on the overall synthesis gas consumption (-
RH2+CO = -RCO ndash RH2) which is independent of the WGS equilibrium or based on
CO consumption to hydrocarbon product (RFT = -RCO ndash RWGS) The rate of
synthesis gas consumption only differs from the FT reaction rate by reaction
stoichiometry -RH2+CO = (2 + m2n) RFT The kinetic rate equations presented for
the synthesis gas consumption do not present a uniform picture Table 21 [17]
gives an overview In general catalyst composition as well as reaction
conditions determine the numerical values of the intrinsic rate parameter
Moreover the rate equations are not identical thus k can be decomposed of
different combinations of kinetic and adsorption constant There is
experimental evidence that the FT activity of Fe and Co depends on the
preparation method metal loading of the catalyst and catalyst support
Table 21 Reaction rate equation for overall synthesis gas consumption rate
proposed in Ref [17]
Chapter 2 Chemistry of Fischer Tropsch Synthesis
71
Kinetic
expression
type
Kinetic expression
(a) 2HkP
(b) b
CO
a
H PkP2
(c) OHCO
COH
aPP
PkP
2
2
(d) OHHCO
COH
aPPP
PkP
22
2
2
(e) 2
2
2
2
1 HCO
COH
PaP
PkP
(f) 2
2
COCO
COH
aPP
PkP
(g) 22
2
COOHCO
COH
bPaPP
PkP
(h) 22121
2121
2
2
1 HCO
HCO
bPaP
PkP
(i) 221
21
2
2
1 HCO
HCO
bPaP
PkP
(h) 21
2
CO
HCO
bP
PkP
25 Influence of FT process conditions
A Temperature
Chapter 2 Chemistry of Fischer Tropsch Synthesis
72
The influence of temperature on the selectivity is considerable for all FT
catalysts As the operating temperature is increased the product selectivity
shifts to products with a lower carbon number on iron ruthenium and cobalt
catalysts Increasing the temperature the CO conversion increases but the
WGS reaction increases too mainly with iron based catalysts
B Partial pressure of H2 and CO
Most studies show that the product selectivity shifts to heavier products and to
more oxygenates while increasing total pressure Increasing H2CO ratios in the
reactor results in lighter hydrocarbons and lower olefin content Donnelly and
Satterfield [38] observed a decreased of the olefin to paraffin ratio from 6 to 1
by increasing the H2CO ratio from 03 to 4 Sufficiently high CO pressures
inhibit secondary reactions ie olefin isomerization hydroformilation
hydrogenation and oligomerization
C Space Velocity
The influence of space velocity of the synthesis gas (residence time) on the
selectivity has been investigated The increase of the olefin to paraffin ratio
with increasing space velocity (thus a decrease of the conversion) was
observed The selectivity to methane and olefins decreases with a decrease of
the space velocity whereas the selectivity toward paraffins remains
unchanged These findings can be ascribed by an enhancement of secondary
reactions as the residence time and the concentration of reactive -olefins
increase within bed interstices and catalyst pellets [17]
D Time-on-stream
It is known that catalyst deactivation may occur at reaction conditions and that
may affect the activity and selectivity of a catalytic system An increase of the
Chapter 2 Chemistry of Fischer Tropsch Synthesis
73
methane selectivity and low molecular weight products is observed on iron
catalyst [17] These selectivity changes can be ascribed to carbonaceous
deposits formed on sites with potassium promoters Moreover sintering leads
to a reduction of the surface area hence lowering the catalyst activity High
water pressures enhance agglomeration of initially small crystallites
E Conversion
The influence of CO conversion on the reaction selectivity must be related to
the decrease of CO partial pressure and the increase of water partial pressure
with high levels of conversion Low CO partial pressures (ie high CO
conversion) imply that secondary hydrogenation reaction are less inhibited
hence olefins are hydrogenated to inactive paraffins so that olefin selectivity
decreases Moreover secondary-cracking reactions may occur especially if high
temperature is adopted to increase conversion hence methane selectivity
increases
A schematic view of the general influence of different parameters on the
selectivity is given in Table 22
Table 22 Selectivity control in F-T synthesis by process conditions ( =
increase with increasing parameter = decrease with increasing parameter
= complex relation) From [17]
Parameter Chain Lenght
Chain branching
Olefin Selectivity
Alcohol Selectivity
Carbon deposition
Methane Selectivity
Temperature Pressure H2CO Conversion Space Velocity
Chapter 2 Chemistry of Fischer Tropsch Synthesis
74
References
[1] David Glasser Diane Hildebrandt Xinying Liu Xiaojun Lu and ornelius M Masuku Current Opinion in Chemical Engineering 2012 1296ndash302 [2] Gaube J Klein H-F J Mol Catal A Chem 2008 28360-68 [3] Davis BH Catal Today 2009 14125-33 [4] RBAnderson Academic Press (Harcourt Brace Jovanovich Publishers (1984) Chapter 2 [5] RBAnderson CBLee JCMachiels CanJChemEng 54 (1976) 590 [6] Qinghong Z Weiping D Ye W J Ener Chem 2013 2227ndash38 [7] Ciobıca I M Kramer G J Ge O Neurock M van Santen R A J Catal 2002 212(2) 136 [8] Cheng J Gong X Q Hu P Lok C M Ellis P French S J Catal 2008 254(2) 285 [9] Lo J M H Ziegler T J Phys Chem C 2007 111(35) 13149 [10] Cheng J Hu P Ellis P French S Kelly G Lok C M J Phys Chem C 2008 112(15) 6082 [11] Cao D B Li Y W Wang J G Jiao H J J Mol Catal A 2011 346(1-2) 55 [12] Zhao Y H Sun K J Ma X F Liu J X Sun D P SuH Y Li WX Angew Chem Int Ed 2011 50(23) 5335 [13] B Todic Wenping M G Jacob BH Davis Dragomir B Bukur Catal Today (2013) httpdxdoiorg101016jcattod201308008 [14] S Storsaeligter D Chen A Holmen Surf Sci 600 (2006) 2051ndash2063 [15] E Shustorovich H Sellers Surf Sci Rep 31 (1998) 1ndash119 [16] C Pirola PhD 2007-2008 Novel supported iron based Fischer-Tropsch catalysts Preparation characterization and applications [17] GPVan Der Laan AACM Beenackers CatalRev-SciEng 41 (3amp4) (1999) 255 [18] APSteynberg MEDry (Editors) Fischer Tropsch Technology Studies in surface science and catalysis 152 (2004) p623 [19] Hirsa M Torres Galvis and Krijn P de Jong ACS Catal 2013 3 2130minus2149 [20] Abello S Montane D ChemSusChem 2011 4 1538minus1556 [21] Wang C Xu L Wang Q J Nat Gas Chem 2003 12 10minus16 [22] Janardanarao M Ind Eng Chem Res 1990 29 1735minus1753 [23] Schwab E Weck A Steiner J Bay K Oil Gas Eur Mag 2010 1 44minus47 [24] Torres Galvis HM Bitter JH Khare CB Ruitenbeek M Dugulan AI De Jong KP Science 2012 335 835minus838 [25] Sarup and B W Wojciechowski Can J Chem Eng 66 (1988) 831 [26] C H Bartholomew W Lee Stud Surf Sci Catal 130 (2000) 1151 [27] RBAnderson The Fischer Tropsch Synthesis Academic Press inc (1984)
Chapter 2 Chemistry of Fischer Tropsch Synthesis
75
[28] G A Huff Jr and C N Satterfield Ind Eng Chem Process Des Dev 24 (1985) 407 [29] E W Kuipers I H Vinkenburg and H Oesterbeek J Catal 152 (1995) 137 [30] Dry ME Conversion of Syngas to Fuels and Chemicals Int Conf on Catal amp Catal Proc Cape Town South Africa 199357-66 [31] Dry ME Appl Catal A 1996 138319-344 [32] Maitilis PM Quyoum R Long HC Turner ML Appl Catal A 1999 186363-374 [33] Ribeiro FH von Wittenau AES Bartholemew CH Somorjai GA Catal Rev Sci Eng 1997 3949-76 [34] Huff GA Jr Satterfield CN Ind Eng Chem Process Des Dev 1984 23696-705 [35] Zimmerman WH Bukur DB Can J Chem Eng 1990 68292-301 [36] Bartholomew CH Farrauto RJ New Jersey Wiley 2006 [37] DPinna ETronconi LLietti RZennaro PForzatti La Rivista dei Combustibili 56 fasc2 (2002) 69 [38] TJDonnelly and CNSatterfield ApplCatalA 52 (1989) 93
76
Chapter 3 Catalysts for Fischer Tropsch Synthesis
The core of any FT process is its catalyst Only a few metals show catalytic
activity in the FT synthesis [1] As explained before the reaction is generally
assumed to start with the adsorption of CO on the catalyst surface where it
reacts with adsorbed hydrogen to afford a methylene group which in its turn
is responsible for the CndashC chain growth Probably at least two reaction paths
co-exist for the initial steps of the FT reaction one in which carbon monoxide is
adsorbed in a dissociative way (ie its CndashO bond is cleaved before any possible
reaction with hydrogen) and another in which some hydrogenation by
adsorbed hydrogen atoms precedes the CndashO cleavage [2]
So a good catalyst should adsorb both CO possibly in a dissociative way and
H2 Furthermore since metal oxide formation is always possible under FT
conditions either by dissociative CO absorption or by metal reaction with co-
produced water the metal oxide should be easily reduced under the reaction
conditions With this respect most early transition metals are not good FT
catalysts because despite their favorable CO adsorption they form very stable
oxides that are not reduced under FT conditions Iridium platinum and
palladium adsorb CO in a non-dissociative manner while metals of groups 11
and 12 hardly adsorb it none of them is an effective FT catalyst The specific
activities (ie the reaction rates per unit surface area of metal) of most of the
metals of the former Group VIII (all but osmium) were assessed under
comparable conditions and ruthenium proved to be the most active catalyst
As expected on the basis of the classical work by Sabatier (1902) nickel (and
even to a larger extent palladium) showed very high selectivity towards
Chapter 3 Catalysts for Fischer Tropsch Synthesis
77
methane formation obviously a feature not appreciated in a FT catalyst [2]
Osmium was successively evaluated but turned out to be ca 100 times less
active than ruthenium So the best FT catalysts are based on iron cobalt and
ruthenium with nickel rhodium and osmium (and possibly rhenium) being
moderately active (Fig 31) [3]
Fig 31 Catalytic activity of transition metals in the FT reaction Blue denotes early transition metals able to adsorb CO in a dissociative way they however show poor or no capability to adsorb H2 and their oxides are not reduced under usual FT conditions
accordingly these metals are not active FT catalysts Orange denotes late transition metals and a few main group elements which show poor or no CO adsorption and no FT activity Yellow shaded elements have good H2 adsorption capability and reducible oxides they however adsorb CO in a non-dissociative way and as a matter of fact are poor FT catalysts Brilliant green denotes the best FT catalysts Nickel rhodium
osmium and possibly rhenium (pale green) are moderately active [3]
However FT industrial plants require huge amounts of catalyst and ruthenium
is too rare and expensive to be used on this scale As a matter of fact cobalt
and iron are the only metals of choice for industrial applications Iron is
obviously cheaper than cobalt but to select between them a key issue is the
carbon feedstock Iron is a good water gas shift catalyst and for this reason is
particularly suitable for hydrogen-poor syngas such as those obtained from
coal or biomasses Cobalt performs better with an almost stoichiometric ratio
between hydrogen and carbon monoxide so it is preferred when the carbon
feedstock is natural gas Alternatively cobalt can also be used with hydrogen-
poor syngas provided that the H2CO molar is adjusted by a WGS unit between
the gasification and the FT reactors [1]
Chapter 3 Catalysts for Fischer Tropsch Synthesis
78
Apart from methane (which usually forms in amounts higher than expected)
the FT products distribution follows the AndersonndashSchulzndashFlory model [2] So
the FT output is always a complex mixture of products ranging from methane
to waxes formed by high molecular weight linear paraffins as explained before
A proper choice of catalyst and reaction conditions allows tuning to some
extent the composition of the final mixture but it is impossible to force the
process to produce selectively a well-defined range of products ie middle
distillates So the best strategy to maximize diesel production is to select
conditions which allow obtaining the maximum amount of long chain linear
paraffins that can be then fed to a hydrocracking stage transforming them into
a most valuable fuel
Cobalt and iron are the metals which were proposed by Fischer and Tropsch as
the first catalysts for syngas conversion Both cobalt and iron catalysts have
been used in the industry for hydrocarbon synthesis A brief comparison of
cobalt and iron catalysts [4] is reported in Table 31 Cobalt catalysts are more
expensive but they are more resistant to deactivation Although the activity at
low conversion of two metals is comparable the productivity at higher
conversion is more significant with cobalt catalysts Water generated by FT
synthesis slows the reaction rate on iron to a greater extent than on cobalt
catalysts At relatively low temperatures (200 - 250degC) chain growth
probabilities of about 094 have been reported [5] for cobalt-based catalysts
and about 095 for iron catalysts The water-gas shift reaction is more
significant on iron than on cobalt catalysts [4]
Iron catalysts usually produce more olefins Both iron and cobalt catalysts are
very sensitive to sulphur which could readily contaminate them For iron-
based catalysts the syngas should not contain more than 02 ppm of sulphur
For Co catalysts the amount of sulphur in the feed should be much less than
Chapter 3 Catalysts for Fischer Tropsch Synthesis
79
01 ppm Cobalt catalysts supported on oxide supports are generally more
resistant to attrition than iron co precipitated counterparts they are more
suitable for use in slurry-type reactors Iron catalysts produce hydrocarbons
and oxygenated compounds under different pressures H2CO ratios and
temperatures (up to 340degC) Cobalt catalysts operate at a very narrow range of
temperatures and pressures an increase in temperature leads to a spectacular
increase in methane selectivity Iron catalysts seem to be more appropriate for
conversion of biomass-derived syngas to hydrocarbons than cobalt systems
because they can operate at lower H2CO ratios [4]
Table 31 Comparison of Cobalt and Iron FT catalysts [4]
Parameter Cobalt catalyst Iron Catalyst
Cost More expensive Less expensive
Lifetime
Resistant to deactivation Less resistant to deactivation (coking carbon deposit iron carbide)
Activity at low conversion comparable
Productivity at high conversion
Higher less significant effect of water on the rate of CO conversion
Lower strong negative effect of water on the rate of CO conversion
Maximal chain growth probability
094 095
Water gas shift reaction Not very significant more noticeable at high conversion
Significant
Maximal sulphur content lt 01 ppm lt 02 ppm
Flexibility (temperature and pressure)
Less flexible significant influence of temperature and pressure on hydrocarbon selectivity
Flexible CH4 selectivity is relatively low even at 340degC
H2CO ratio 2 05-25
Attrition resistance Good (always supported) Not very resistant if not
supported
Chapter 3 Catalysts for Fischer Tropsch Synthesis
80
A large number of studies have pointed out that various factors can influence
the catalytic behaviors of a FT catalyst As summarized in Table 32 besides the
engineering factors such as reactor design and operation conditions [6-10]
there exist many catalyst factors which can exert significant influences on the
activity and product selectivity
Table 32 Typical key factors influencing the activity and product selectivity of a FT
catalyst [11]
Engineering factors Catalyst factors
(i) Reactor design
(ii) Operation
conditions
(i) identity of active metal (Ru Co or Fe) (ii) chemical state of active phase (metal oxide or carbide) (iii) support (identity pore structure physicochemical properties) (iv) promoter (typically including noble metals oxides of Mn Zr or rare earth metals alkali metal ions) (v) size of active phase (vi) microenvironment of active phase
31 Iron and Cobalt industrial FT catalysts i) Iron catalysts With iron catalysts two directions of selectivity have been
pursued One direction has aimed at a low molecular weight olefinic
hydrocarbon mixture to be produced in an entrained phase or fluid bed process
(Sasol Synthol process) Due to the relatively high reaction temperature
(340degC) the average molecular weight of the product is so low that no liquid
product phase occurs under reaction conditions The catalyst particles moving
around in the reactor are small (dp =100 mm) [12] and carbon deposition on
the catalyst does not disturb reactor operation Thus low catalyst porosity with
Chapter 3 Catalysts for Fischer Tropsch Synthesis
81
small pore diameters as obtained from fused magnetite (plus promoters) after
reduction with hydrogen is appropriate For maximising the overall gasoline
yield the olefins C3 C4 have been oligomerised at Sasol However recovering
the olefins for use as chemicals in eg polymerisation processes is
advantageous today [13]
The second direction of iron catalyst development has aimed at highest
catalyst activity to be used at low reaction temperature where most of the
hydrocarbon product is in the liquid phase under reaction conditions Typically
such catalysts are obtained through precipitation from nitrate solutions A high
content of a carrier provides mechanical strength and wide pores for easy mass
transfer of the reactants in the liquid product filling the pores The main
product fraction then is a paraffin wax which is refined to marketable wax
materials at Sasol however also can be very selectively hydrocracked to a high
quality Diesel fuel Thus iron catalysts are very flexible Selective FT synthesis of
linear terminal olefins seems only possible with iron catalysts Alkalised iron FT
catalysts exhibit water gas shift activity (in contrast to cobalt catalysts) This is a
favourable feature for FT synthesis with CO-rich syngas as obtained from high
temperature coal- or heavy-oil-gasification through partial oxidation (H2CO
molar ratio =10) however it is undesirable for FT synthesis with hydrogen-rich
syngas as produced from natural gas The activity of iron catalysts decreases
through product inhibition by water [14] This feature restricts the attainable
degree of conversion and leads to gas recycle operation after water removal
together with the organic condensate
ii) Cobalt catalysts Cobalt catalysts have been applied in the first FT plant of
Ruhrchemie in 1935 Present catalyst design makes use of several preparation
techniques however the intention to produce a well-dispersed cobalt phase in
a wide pore support remains the same Today cobalt catalysts for FT Diesel
Chapter 3 Catalysts for Fischer Tropsch Synthesis
82
production from natural gas are designed for a maximum wax selectivity the
waxy product then being the feed for hydrocracking Hydrocracking of FT
paraffins follows the kinetic regime of lsquoideal hydrocrackingrsquo as observed by
Schulz and Weitkamp [15] always the largest molecules are cracked selectively
and no secondary cracking occurs With cobalt catalysts olefin readsorption on
FT sites takes place and this contributes significantly to the desired high wax
selectivity This implies that olefin secondary hydrogenation and double bond
shift should be kept low Diesel fuel selectivity approaching 80 can be
obtained by the process combination FT synthesishydrocracking [15]
32 Chemical State of active phase As explained before the typical active metals used for FT synthesis are Fe Co
and Ru According to [11] the current consensus is that metallic Co and Ru ie
Co0 and Ru0 nanoparticles function as the active phases for CO hydrogenation
to heavier hydrocarbons whereas iron carbides are responsible for CO
hydrogenation [16] However deeper knowledge about the effects of different
chemical states of these active phases on catalytic performances is still needed
for the rational design of an efficient FT catalyst
21 Co-based catalysts
Metallic Co may exist in two different crystalline forms ie fcc and hcp
phases For bulk Co the hcp phase is more stable at lower temperatures but
the fcc phase becomes more stable when the size of Co particles becomes less
than 20 nm [17] However the actual crystalline structure of Co catalyst under
working conditions is not well known The formation of Co2C may cause the
catalyst deactivation Another recent work also demonstrated that the
deactivation of Co-based catalyst was due to the carbide formation and carbon
deposition [18] The prolonging of the time on stream caused the partial
Chapter 3 Catalysts for Fischer Tropsch Synthesis
83
decomposition of the bulk Co2C to Co0 and increased the conversion of CO and
the selectivity to heavier hydrocarbons
22 Fe-based catalysts
Iron carbides are easily formed under FT reaction conditions because of the
lower or similar activation energy for iron carbide formation as compared with
that of CO hydrogenation Many types of iron carbides such as ε-Fe2C ε_ -
Fe22C Fe7C3 χ-Fe5C2 and θ-Fe3C all have been observed in FT synthesis [19-
20] However the true active species under working conditions remains still
unsettled Many studies have been devoted to characterizing the active iron
carbide phase Because the carburized iron catalysts are very sensitive to air
exposures even under controlled passivation [21] the in situ or operando
characterizations under working conditions are quite important
33 Size of active phase According to [11] the size of the active phase is one of the most important
factors determining the catalytic behaviors of a heterogeneous catalyst [23]
For Co-based catalysts Iglesia once analyzed data obtained over different
metal oxide-supported Co catalysts and the results suggested that the
turnover frequency (TOF) for CO conversion ie the amount of CO converted
per surface Co per time was independent of the size of Co particles loaded on
different metal oxides in a Co-size range of 9minus200 nm [24] The selectivity to
CH4 was higher over the catalysts with smaller Co particles and decreased with
increasing Co size particularly in the range of 26minus8 nm C5+ selectivity
increased with the mean size of Co nanoparticles monotonically and the
increase became insignificant when Co size exceeded 6minus8 nm Thus Co-
catalyzed FT synthesis is a structure sensitive reaction in the Co-size range of
lt10 nm Size effect studies for Ru- and Fe-based catalysts are not numerous A
Chapter 3 Catalysts for Fischer Tropsch Synthesis
84
few early studies pointed out the increase in TOF for CO hydrogenation with
increasing the size of Ru or Fe particles (or decreasing the metal dispersion)
[25-27]
In general the results obtained for many Co- and Ru-based catalysts all indicate
that the TOF for CO conversion increases with the size of metal nanoparticles
up to a critical point (6minus10 nm) and then changes slightly For Fe-based
catalysts the results are still inconsistent
References
[1] C Perego MRicci Catalysis Science amp Technology 2012 2 1776ndash1786 [2] P M Maitlis V Zanotti Chem Commun 2009 1619ndash1634 [3] C Perego R Bortolo and R Zennaro Catal Today 2009 142 9ndash16 [4] AY Khodakov W Chu P Fongarland ChemRev 107 (2007) 1692 [5] B Jager Stud Surf Sci Catal 119 (1998) 25 [6] Luque R de la Osa A R Campelo J M Romero A A Valverde J L Sanchez P Energy Environ Sci 2012 5(1) 5186 [7] Hao X Dong G Q Yang Y Xu Y Y Li YW Chem Eng Technol 2007 30(9) 1157 [8] van Steen E Claeys M Chem Eng Technol 2008 31(5) 655 [9] Davis B H Ind Eng Chem Res 2007 46(26) 8938 [10] Gao J H Wu B S Zhou L P Yang Y Hao X Xu Y Y Li Y W Chin J Catal (Cuihua Xuebao) 2011 32(12) 1790 [11] Qinghong Z Weiping D Ye W Review J Ener Chem 2013 2227ndash38 [12] OGMalan JDLouw LCFerreira Brennstoff-Chem 42 (1961) 209 [13] AP Steynberg RL Espinoza B Jager AC Vosloo ApplCatalA 186 (1999) 41 [14] ME Dry JR Anderson M Boudart (Eds) Catalysis Science and Technology M Springer Berlin (1981) 159 [15] HSchulz Appl Catal A 186 (1999) 3 [16] Zhang Q H Kang J C Wang Y ChemCatChem 2010 2(9)1030 [17] Kitakami O Sato H Shimada Y Sato F Tanaka M Phys Rev B 1997 56(21) 13849 [18] Tan K F Xu J Chang J Borgna A Saeys M J Catal 2010 274(2) 121 [19] De Smit E Weckhuysen B M Chem Soc Rev 2008 37(12) 2758
Chapter 3 Catalysts for Fischer Tropsch Synthesis
85
[20] Zhang Q H Kang J C Wang Y ChemCatChem 2010 2(9) 1030 [21] Janbroers S Louwen J N Zandbergen H W Kooyman P J J Catal 2009 268(2) 235 [22] PJ Van Berge J Van de Loosdrecht JCaricato EA Barradas Patent WO 9942214 [23] Zhang Q H Deng W P Wang Y Chem Commun 2011 47(33) 9275 [24] Iglesia E Appl Catal A 1997 161(1-2) 59 [25] Kellner C S Bell A T J Catal 1982 75(2) 251 [26] Jones V K Neubauer L R Bartholomew C H J Phys Chem 1986 90(20) 4832 [27] Boudart M McDonald M A J Phys Chem 1984 88(11) 2185
86
Chapter 4 Experimental FT plant and analytical methods
Two different FTS units were used in this PhDrsquos research work in order to
homologate some results The first one is located at the Universitagrave degli Studi
di Milano in Italy while the second one is located at the Universidad Central de
Venezuela in Venezuela Following there is the description of both FTS unit
First FTS Unit (Unit 1) Universitagrave degli Studi di Milano in Italy
FT reaction tests were performed into a fixed bed reactor (di =06 cm l = 56
cm) using 1 g of fresh catalyst mixed with 1 g of diluting material (-Al2O3
Fluka) This diluting material must be inert for FT and a good thermal conductor
to control the process temperature [1] The catalysts were tested after their
activation in a 468 NmL min-1 flow of syngas with H2CO ratios of 21 (total
flow = 468 Nml min-1) and nitrogen as internal analytical standard (flow = 50
NmL min-1) at P = 20 bar and temperature range between 220-260degC for a
duration between 20 and 90 h in continuous Analyses of the gas-phase
products (C1-C7) were performed with an on-line micro-gaschromatograph
(Agilent) measurements were carried out every 60 min during the reaction
Liquid products were collected in a trap (V=400mL) operating at 5degC and at the
same pressure of the reactor (20 bar) and analyzed by a gas chromatograph
(Agilent) equipped with a Porapack-Q columns (able to separate C7-C30
hydrocarbon fraction) after the reaction duration The aqueous phases
collected in the cold trap were analyzed by a TOC (Schimadzu) for the
quantification of carbonaceous species dissolved in water Using all the data
87
collected for each run a mass molar balance has been verified with a
maximum error of plusmn 5moles
Second FTS Unit (Unit 2) Universidad Central de Venezuela in Caracas-
Venezuela)
FTS was performed in a continuous flow system with a fixed bed stainless-steel
reactor (di =095 cm l = 30 cm) The reactor was loaded with 03 g of fresh
catalyst mixed with 03 g of see sand as a diluting material [2] The calcined
catalysts were initially reduced in situ by flowing hydrogen for 4 hours at 900
Nml˙min-1 350degC and 08 MPa After the reduction step the temperature was
lowered to 220degC under H2 They were then tested in the standard conditions
by flowing syngas (H2 CO N2 63325 vv N2 as internal standard) at 156
Nml˙min-1 increasing the system pressure slowly up to 20 MPa and 220-260degC
Once the reaction temperature was achieved the reaction was led to proceed
during a period of 280 h
During reaction the reactor effluent passed through a hot trap kept at 150degC
and 02 MPa to collect waxes and the products leaving this trap were passed
through a second trap kept at 0degC and 02MPa to collect the lighter products
(water alcohols and hydrocarbons) The analyses were performed in various
chromatographs according to the nature of the sample to be analyzed
Permanent gases and light hydrocarbons were analyzed on-line in a
PerkinElmer 3000GC Autosystem fitted with TCD detectors using a Carbosieve
SII Supelco column The liquid products (collected at 150ordmC and 0ordmC) were
weighted and analyzed in a PerkinElmer chromatograph fitted with a 50m long
Alumina RT capillary column connected to a FID
A mass molar balance was performed for each FT run resulting in a maximum
error of plusmn 5moles
88
41 FT Laboratory plant a) First FTS unit (Unit 1)
As explained by Pirola [3-5] the experimental tests were performed in a
laboratory plant with a tubular reactor (made by ldquoRenato Brignolerdquo Company)
with a fixed bed of catalyst vertically placed The feed (CO H2 and N2 as
internal standard) is prepared in situ mixing three different flow of pure CO
pure H2 and pure N2 using three different flow meters Then the feed goes into
the catalytic reactor from the top part reacts with the catalyst and then the
reacted flow comes out from the lower part The plant pipes are heated till the
cold trap to avoid the heavy products condensation In this cold trap cooled at
5degC the heavy products and the water condense The not reacted gas and the
light hydrocarbons go in a flow meter for their quantification and finally in an
analytical zone where they are analyzed by a micro gaschromatograph In the
condensed liquid in the cold trap there are two phases the first one is an
aqueous phase (in which water and small quantities of light hydrocarbons and
oxygenated compounds are present) and the second one is an organic phase
(in which hydrocarbons in the range C7-C30 are present)
In Fig 41 the detailed flow-sheet of FT plant has been reported
Fig 41 Laboratory plant flow-sheet
89
The key for the Fig41 is the following
1 valve
2 flow meter (Brooks reg mod 5850TR) for H2 and CO operating in the range 0-
100 Nml min-1 for N2 operating in the range 0-20 Nml min-1
3 gas mixer
4 thermocouples for the control of temperature in the catalytic bed in the
reactor and in the heated pipe
5 Tubular reactor
6 Security valve
7 Pressure indicator
8 Pressure control and regulation tool
9 micro GC ldquoAgilent reg 3000 seriesrdquo
10 gas totalizer for the control of the total flow of gas
11 Cold trap operating at 5degC and 20 bar
12 Cooling air for the temperature control of the reactor
13 vent (usually closed)
In figure 42 a photo of the plant is reported
Fig 42 FT laboratory plant
90
In the following paragraphs the main parts of this plant will be described
41a Main parts of the plant 41a1 Apparatus for the regulation and control of temperature pressure and flow of reagents
In the plant the pressure is controlled and regulated by an electronic controller
(Brooksreg) that interacts with a pressure valve able to work till 25 bars (Fig 43)
located after the reactor and the cold trap
Fig 43 Pressure valve
This system can control the plant pressure with a care of 01 bar respect the set
up
The reactor temperature is regulated by a heating oven (Renato Brignole) and
the pipe lines after the reactor are heated at 220degC to prevent the heavy
products condensation by two electrical cables (both with a resistance of 7
m) controlled by a Ascon reg apparatus The CO H2 and N2 flows are regulated
by Brooksreg 5850TR series flow meters (Fig 44)
91
44 Flowmeters for CO H2 N2
In table 41 the main characteristics of these flow meters are reported
Table 41 Flowmeters characteristics
Range
(Nmlmin) IO signal
(vdc) Max Pressure
(Bar)
H2 0-50 0-5 100
CO 0-50 0-5 100
N2 0-20 0-5 100
41a2 FT reactor
The FT plant reactor (Fig 45) has been made by Renato Brignole reg Company
(Legnano Italy) It is a fixed bed tubular reactor with the catalyst vertically
located It is made of AISI 316 stainless steel and in the internal surface of
reactor there is a coaxial copper tube (thickness = 1 mm) to prevent some
catalytic activities of steel and to uniform the heating of reactor The technical
characteristics of reactor are summarized in Table 42
Table 42 Reactor Characteristics
Volume (cm3)
Max operating pressure
(Bar)
Max operating temperature
(degC)
Internal diameter
(mm)
Height (mm)
158 100 400 6 560
92
In this reactor it is possible to charge till 3 g of the mixture catalyst-diluting
material The feed goes into the reactor at the top and goes out from the lower
part The operation of opening and closing of reactor is made using the disks
illustrated in Fig 46 and this is an operation that needs a particular attention
to avoid gases losses or mechanical damage
Fig 45 FT tubular reactor Fig 46 Reactor opening disks
The temperature inside the reactor is monitored by two thermocouples the
first one is vertical and it is inside the catalyst the second one is horizontal and
it is inside the reactor The values of temperatures recorded are quite the same
(max difference = 2degC)
41a3 Cold Trap
The condensation of heavy FT products (mainly hydrocarbons higher than C7
and water) is made using a cold trap in stainless steel able to work at 20 bar
and a T=5degC (Fig 47) The low temperature is maintained by an external
circulation of water coming from a ldquoCrioterm reg 190 iscordquo thermocriostat The
93
volume height and width of the cold trap are respectively 125 ml 100 mm
and 40 mm
Fig 47 Cold trap
The cold trap at the end of each kinetic run is opened and the liquid
condensed inside is quantified and analyzed There are two phases the first
one is an organic phase made by hydrocarbons in the range C7-C30 and it is
analyzed by a GC the second one is an aqueous phases with some organic
mainly oxygenated compounds and the quantification of all the present
carbon is made by a TOC analysis The results obtained in this way give an
average value of all the time of kinetics It is not possible to open the cold trap
during the experiment In fact opening the cold trap the pressure and flow
equilibrium of the plant is broken
41a4 Flow totalizers
The calculation of CO conversion and products selectivity of the plant needs to
know exactly the quantity of gas incoming and out coming Moreover adding
those data to the quantity of liquid condensed in the cold trap and to analytical
data it is possible to verify the mass balance on the plant The calculation of the
mass balance is very important to verify the goodness of the experimental data
collected
94
In FT plant it is possible to quantify all flow passed in a fixed time The incoming
flow of H2 N2 and CO is totalized by the same flow meters that regulate the
flow (Brooks reg Instruments) and the out coming flow (mixture of not reacted
CO and H2 N2 and non-condensed FT products) is totalized by a Ritter reg mod
TG01-5 (Fig 48) instrument
Fig 48 Ritter reg totalizer
42a Analytical instruments
FT plant needs three different analysis for the quantification of the composition
of
i) out coming gas (mixture of not reacted CO and H2 N2 and non-
condensed FT products) by a micro-GC Agilent reg mod 3000A
ii) organic phase of condensed liquid in cold trap (hydrocarbons in the
range C7-C30) by a GC ldquoFison Carlo Erba reg Mod 8000 seriesrdquo and
iii) liquid phase of condensed liquid in the cold trap (water with
hydrocarbon mainly oxygenated dissolved inside) by a Total
Organic Carbon ldquoShimadzu reg mod 5000Ardquo
42a1 micro Gas Chromatograph ldquoAgilent reg mod 3000Ardquo
In the micro GC Agilent reg there are two different columns the first one is a
molsieves module by which it is possible to separate in order of retention
time He H2 Ne Ar O2 N2 CH4 and CO the second one is a OV-1 module
(filled with polydymethylsiloxilane) by which it is possible to separate CO2 and
95
all the hydrocarbons in the range C2-C7 In this instrument the gas sample is
splitted in the two modules and then analyzed in the same time For each
sample then we obtain two different analyses In our application using the first
module the CO N2 and CH4 were quantified with a column temperature of
45degC using the second module CO2 and hydrocarbons were quantified with a
column temperature of 100degC Each module is equipped with a TCD detector
The sensibility limit of the analyses is about 50 ppm for each compound and
the carrier gas is helium The instrument scheme is reported in Fig 59 and the
instrument is represented in Fig 410 An example of analyses is reported in
Fig 411
Fig 49 Agilent Micro GC scheme
Fig 410 Micro GC Agilent
96
Fig 411 Example of Agilent micro GC analyses on FT out coming gas
42a2 Gas Chromatograph ldquoFision Carlo Erba reg Mod 8000 seriesrdquo
In this traditional Gas Chromatograph (GC) equipped with a wide bore Varian
(model VF-1ms) (dymethylpolyxolane) column (length = 25 m diameter = 025
mm) it is possible to separate and quantify the hydrocarbons in the range C7-
C30 The GC detector is a FID with a sensibility limit of about 100 ppm for each
compound and the carrier is helium The column temperature is maintained at
60degC for 3 minutes then heated till 260degC at 7degCmin for 15 minutes after that
heated at 280degC for 40 minutes at 5degCmin and then heated till 310degC for 5
minutes In Fig 412 and 413 the gas chromatograph in its column
97
Fig 412 Example of GC analysis for the quantification of heavy FT products
Fig 413 Wide bore Varian VF-1ms column
42a3 Total Organic Carbon ldquoShimadzu reg mod 5000Ardquo
Using this instrument it is possible to quantify the organic carbon dissolved in
water The sample passes through an oxidation catalyst (Pt) at high
temperature (700degC) and then all the organic carbon is converted to CO2 This
CO2 is then exactly quantified by an IR detector In Fig 414 it can be seen the
instrument
Fig 414 SHIMADZU TOC-5000A
98
43a Analytical instruments calibration
43a1 Flow meters calibration
All flow meters have been calibrated comparing the flow measured by these
instruments and that measured using a ldquosoap-bubblerdquo flow meter at the end of
the plant This calibration has been made using the FT plant both in FT work
condition (T=250degC P=20 bar) and at room condition (T=20degC P=1 bar) For
each flow meter some tests at different flow have been made always in the
range between 0 and 40 Nmlmin For each flow meter a diagram has been
made where the real flow (y) is reported in function of the set-up flow (x) The
result for all the instruments is a straight line (y = ax + b) In Tab 43 the results
for all the instruments have been reported in term of ldquoardquo and ldquobrdquo coefficient
and ldquoR2rdquo value
Tab 43 Flow meters calibrations
Flow meter Calibration conditions a b R2 1 CO T = 20degC P = 1 bar 11364 12727 09996
2 H2 T = 20degC P = 1 bar 1008 -1749 0999
3 N2 T = 20degC P = 1 bar 12744 67994 09935
4 Mix CO H2 N2 T = 20degC P = 1 bar 0968 1816 09998
The conclusion is that the instruments give a very good calibration and their
indications of the flow are quite perfect
43a2 micro GC calibration
This calibration has been made in Cernusco sul Naviglio (MI) in the laboratory
of ldquoSRA Instruments Italiardquo Company This company is an Agilent Technologies
Premier Solution Partner directly present in Italy and France and it is
constantly engaged in research and development of solutions based on
portable and ultra-fast Micro Gas chromatograph (wwwsrainstrumentscom)
99
The calibration has been made analyzing two mixture of certified gas and is
reported by [5]
The calibration of CO2 and light hydrocarbon is a direct calibration As the
volume of gas injected in column is always the same it is possible to calibrate
directly (without an internal standard) the peaks area with the concentration of
different compounds ie the concentration is directly proportional to
chromatographic area In ldquoSRA Instruments Italiardquo all calibration factors fci
(chromatographic area compound concentration) and all retention times
have been found and they are reported in table 44
Table 44 Calibration results for CO2 and light hydrocarbons
Module Compound Retention time
(min) Calibration factor
Molsieves
N2 1007 35119
CH4 1203 27027
CO 1402 45799
OV-1
CO2 0592 16722
Ethane 0624 19230
Propane 0745 25706
I-butane 0918 28248
N-butane 1061 27027
I-pentane 1556 32051
N-pentane 1808 32326
N-hexane 3578 33670
CO quantification has been performed using another calibration
Using these data it is possible to calculate the concentration of each compound
using the formula
iiiv fcareacompound (1)
Nevertheless it is important to remember that in FT plant there is N2 as
internal standard for CO quantification and then the equation (1) must be
corrected because the N2 flow is not to be considered as FT gas
100
FT
totaliiiv
flow
flowfcareacompound (2)
Where
2NtotalFT flowflowflow (3)
To better understand this calculation an example is here reported
If we assume to have a real FT flow of 20 Nmlmin with a CO2 v = 2 it
means to have 04 Nmlmin CO2
If we have 10 Nml minmin of N2 as standard and 30 Nmlmin of FT flow and
we calculate the CO2 percentage using the total flow we obtain
233110030
40vCO making a mistake If we use the correction in the
equation (2) we obtain 20220
30100
30
40vCO
the true value
The CO calibration concerns only the CO and N2 flow The CO is the compound
to be quantified and the N2 is the standard gas in fact N2 is not involved in FT
reactions and it pass through the FT plant without any modification then the
incoming and out coming N2 is the same The necessity with CO to have a
calibration with a standard is explained considering that the CO quantification
gives the CO conversion of FT process then a more accurate measure is
convenient Moreover it is not possible to use N2 as internal standard also for
CO2 and light hydrocarbons because they are not analyzed in the same module
(OV-1) of N2 (molsieves) Another important consideration is that in literature
the CO conversion for FT reactor is always calculated using this method
In this calibration method the ratio (flow CO flow N2) is directly proportional
to ratio (area CO area N2) Using FT plant in reaction conditions (T=250degC
P=20 bar CO = 156 Nmlmin H2 = 312 Nmlmin N2 = 100 Nmlmin) obviously
101
without catalyst inside we have calculated these ratios and the co-relation
between them The results are reported in Table 45
Table 45 CO-N2 calibration results
Flow N2
(Nmlmin) Flow CO
(Nmlmin) Flow H2
(Nmlmin) Area
N2 Area CO
R flow CON2
R area CON2
Rarea Rflow
100 156 312 411142 782455 156 19031 12199
100 156 312 390220 793329 156 20330 13032
100 156 312 388002 794913 156 20487 13133
100 156 312 384672 795362 156 20676 13254
The mean value of ratio between area and flow ratios is 12905 and this is the
calibration factor (fc) for the system as reported in the equation (4)
flowN
COflowf
areaN
COareac
22
(4)
then the CO flow out coming from the FT plant is
29051
2
2
flowN
areaN
COareaflowCOout (5)
finally the CO conversion is
100xflowCO
flowCOflowCOonCOconversi
in
outin (6)
The H2 calibration
To optimize the kinetic model of the FT synthesis was necessary to develop a
measurement method to quantify the hydrogen leaving the plant For this it
was performed a calibration of the micro-gas chromatograph using N2 as
standard in different streams of H2
To identify and quantify the hydrogen it is necessary to change the carrier in
the micro-gas chromatograph (from He to Ar)
Using Argon as a carrier the response of the micro-GC is about ten times
smaller than the response compared with He For this reason it has been
102
necessary to modify the injection time for the analysis and set to 40ms instead
of the usual 30ms
In Table 46 and Fig 415 are shown the results relating to the calibration of the
system H2-N2
Table 46 H2-N2 calibration results
Flow N2 (Nmlmin)
Flow H2 (Nmlmin)
F H2 F N2 Area N2 Area H2 A H2 A
N2
20 3 015 31511 33480 1062
20 35 0175 29525 36348 1231
20 41 0205 28420 40995 1442
20 49 0245 26747 45908 1716
20 56 028 20897 41151 1969
20 61 0305 20748 44040 2123
Fig 415 Calibration results for the micro-GC for the system H2 ndashN2
From the equation of the straight line is obtained a correction factor equal to
70018
By this correction factor (Fc) is possible to deduce the flow of the H2 outflowing
from the reactor and its conversion during the reaction using the following
equation
103
1002
222
in
outin
FlowH
FlowHFlowHHconversion
The calculation set to detect the flow of H2 in output is based on the fact that
the ratio between the areas H2N2 is equal to the ratio between the respective
flows multiplied by Fc (correction factor) according to the following equation
2
2
2
2
FlowN
FlowHFc
AreaN
AreaH
So from this equation it is possible to determine the flow of H2 at the out of the
reactor
00187
2
2
22
FlowN
AreaN
AreaHHFlow OUT
In Fig 416 is shown an example of a gas chromatographic analysis of hydrogen
Fig 416 Gas chromatographic analysis of a system H2-N2
43a3 GC calibration
In this instrument as before discussed it is possible to analyze the heavy
hydrocarbons condensed in the cold trap Obviously for their quantification we
need a calibration with some standard compounds because the detector
quantification is not the same for all the species For this reason the equation
j
j
i
i
mol
area
mol
area (7)
it is not correct and we must use
104
j
j
j
i
i
i Fmol
areaF
mol
area
(8)
where Fi and Fj are the calibration factor for the compound i and j respectively
The calibration method used is the ldquointernal standard methodrdquo in which one of
the compounds to be analyzed is chosen as internal standard and his
calibration factor (F) is established equal to 1 N-heptane has been chosen as
internal standard because it is normally present in FT products Analyzing a
calibration hydrocarbon mixture it is possible to calculate the calibration factor
of all the hydrocarbon present inside this mixture using the following
equation
i
i
j
j
jiarea
mol
mol
areaFF
(9)
The composition of the calibration mixture is reported in table 47 and the
calibration results in table 48
In FT runs all hydrocarbons in the range C1-C19 were obtained To find the
calibration factor and the retention times of hydrocarbons not present in the
calibration mixture an interpolation calculation was made In the following
figure are reported the diagram of the calibrations factors (Fig 417) and of the
retention times (Fig 418) in function of carbon number Starting from these
experimental results an interpolation curve were calculated and then the
calibrations factors and retention times for each carbon number was calculated
too The results are reported in Table 49 It is important to outline that for
each single carbon number there is only one calibration factor for all the
isomers as they are not well separated by the GC column and the detector
answer for the isomers is the same
105
Table 47 Composition of GC calibration mixture
Hydrocarbon PM (gmol) Quantity (g) Mol
n-Heptane (C7) 1002 0229 02295
Nonane (C9) 12826 02389 01871
Decane (C10) 14228 01284 00906
Undecane (C11) 15631 01197 00769
Dodecane (C12) 17033 01139 00672
Tridecane (C13) 18436 01202 00655
Tetradecane (C14) 1984 01577 00798
Pentadecane (C15) 21241 01123 00531
Hexadecane(C16) 22644 01817 00806
Octadecane (C18)
2545 00919 00363
Nonadecane (C19) 26852 00895 00335
106
Table 48 GC calibration results
Mix Mol
Chromatographic areas
Fc mean Analysis
1
Analysis
2
Analysis
3
Analysis
4
Analysis
5
C7 0229522 7763 9384 881 9036 8981 100
C9 018706 16343 16475 15226 13896 15051 047
C10 0090631 8463 88707 7902 7588 7856 043
C11 0076907 8716 7627 8235 7916 8239 036
C12 0067157 8485 7313 8137 7709 8168 032
C13 0065478 847 7654 8253 7859 8271 031
C14 0079826 11095 9689 10988 9685 11042 029
C15 0053096 8309 819 8876 8844 8535 024
C16 0080586 12395 11571 12863 12834 13014 025
C18 0036265 6059 6061 6679 6817 659 022
C19 0033474 6134 5958 6527 6663 6549 020
Fig 417 GC calibration factor vs carbon number
107
Fig 418 GC retention time vs carbon number
Table 49 GC Calibration factor and retention times for all the hydrocarbons C7 ndash C30
Carbon number Fi Retention time (min)
7 0997 0975
8 0649 3431
9 0497 5887
10 0412 8343
11 0358 10799
12 0320 13255
13 0293 15711
14 0272 18167
15 0255 20623
16 0241 23079
17 0230 25535
18 0220 27991
19 0212 30447
20 0205 32903
21 0199 35359
22 0194 37815
23 0189 40271
24 0185 42727
25 0181 45183
26 0178 47639
27 0175 50095
28 0172 52551
29 0170 55007
30 0167 57463
108
43a4 TOC calibration
The detector of the instrument (type NDIR) is able to analyze and quantify by
means of infrared spectroscopic technique the CO2 produced by the sample
For this calibration is not necessary to use a standard equal to the analyte (in
the case of the synthesis of FT the carbonaceous species dissolved in water)
but it is necessary to use a stable standard such as potassium hydrogen
phthalate because due to its physical nature (solid) is therefore inherently
more reliable than a liquid and allows the exact correlation between the ppm
of carbon present in solutions of standards and the areas provided by the
instrument after analysis
There were prepared different solutions at known concentrations (200 and 100
ppm) from a stock solution of 300 ppm obtained by dissolving 031895 g in
100ml of distilled water
Standard solutions were corrected by a correction factor f according to the
following equation
masssampleltheoretica
masssamplerealf (10)
The calculated value of f is equal to 1000627 and the table 410 and the Fig
419 show the correct ppm standard and the areas supplied by the instrument
Table 410 calibrationTOC
Corrected
ppm
Area
3002 28679
2001 17261
1001 6568
109
Fig 419 Interpolation of areas obtained in function of the concentration (ppm) of the
standard
44a Experimental procedure
All the kinetic FT runs were made on the plant following the same experimental
procedure
1) Catalyst preparation
2) Catalyst loading on the plant in the FT reactor
3) Catalyst activation
4) FT run
5) When FT finish opening of cold trap and separation of organic from
aqueous phases
6) Catalyst removal from reactor
7) Reactor cleaning and micro-GC column regeneration
44a1 Catalyst preparation
Before the catalyst was loaded in the reactor a standard procedure was
followed on the same catalyst
- Catalyst mesh operation between 106 and 150 micron
- Heating in oven at 120degC for a night
- Mixture catalyst - Al2O3 (inert material ndash diluent) 11
110
In table 411 the main characteristics of -Al2O3 are reported The role of this
material is to help the heating removal from the catalyst (FT reaction is highly
exothermic)
Table 411 Main characteristics of -Al2O3
Superficial area (m2g)
Bulk density (gcm3)
Composition Humidity
07-13 172
996 Al2O3 lt005 SiO2
01 FeO lt001 TiO2
26
44a2 Catalyst loading
The catalyst loading is obviously an essential operation The catalyst must be
charged in the middle of reactor because this is the isothermal zone as it is
possible to observe in Figure 420
Fig 420 Thermic profile of FT reactor
As the height of the mixture catalyst + -Al2O3 is about 7 cm (using a pipe with
an internal diameter of 6 mm) if this material is charged in the middle of the
reactor this work surely at the same temperature in each point The final
arrangement of the reactor is reported in Fig 421
111
Fig 421 FT reactor internal loading arrangement
Finally after the closing the pressure inside the reactor is raised till 4 bar with
the activation gases The gas flow is stopped and then the held of reactor is
checked to control possible gas losses If the reactor pressure is stable the
activation catalyst step will be performed The same procedure for the check of
possible gas loss will be performed when the pressure of the reactor will be
raised till 20 bar for FTS
44a3 Catalyst activation
The catalyst activation is the process in which the catalyst is reduced from the
oxidised state in the reduced or metallic state In the FT reaction the active
form for the Cobalt based catalysts is the Cobalt metallic and for the iron based
catalysts are the carbide iron forms All the catalysts were charged into the
reactor in the oxidised form because the last operation in the catalysts
preparation is the calcination (T=500degC) in air The catalyst activation-reduction
is performed in this PhDrsquos research work at 350degC and using H2 for Co based
112
catalysts and CO+H2 for iron based catalysts always for 4 h at 3 bar of pressure
At the end of this step the FT process start
44a4 Fischer Tropsch runs
After the catalyst activation the plant is raised at standard reactions conditions
Temperature = 220-260degC (depending of the test)
Pressure = 20 bar
Feed ratio H2CO = 21 11 1751 151 (depending on the test were
varied the feed ratio too)
H2 flow = 312 Nmlmin
CO flow = 156 Nmlmin
N2 flow = 50 Nmlmin
These are the ldquostandardrdquo reaction conditions but for some specific studies
they have been changed When the plant reaches the set-up values this is the
ldquozero-timerdquo of the FT runs The first operation is to annul the totalizers both in
the entrance and in the exit of the plant Then every one hour the micro-GC
make one analysis on the out coming flow (also during the night) and the
operator takes the flow out coming from the plant Each data is reported and
elaborate using an excel database The FT run has duration between 48 and 90
hours At the end of run the cold trap is opened (Fig 422) and both the organic
phase (GC) and the aqueous phase (TOC) are separated and then weighed and
analyzed Also these data is collected in the excel database and now it is
possible to calculate the CO conversion the products selectivity the alpha
parameter and to verify the final mass balance
113
Fig 422 Opening cold trap operation
After the reactor cooling the catalyst is unloaded and recovered for possible
characterization after its use The reactor and the cold trap are obviously
cleaned carefully The last operation is the micro-GC column regeneration
using the condition reported in Table 412
Table 412 Micro-GC column regeneration conditions
Parameter Module 1 (molsieves) Module 2 (OV-
1)
Sample Injector temperature (degC) 80 80
Column Injector temperature (degC) 45 60
Column temperature (degC) 160 160
Sampling time (s) -- --
Injection time (ms) -- --
Analysis time (s) -- --
Post-analysis time (s) -- --
Column pressure (kPa) 120 241
Detector sensibility Detector off Detector off
114
b) Second FTS unit (Unit 2) At the end of the second and the beginning of the third year of the PhD there
were performed a serious of catalytic tests in a FT unit at the Universidad
Central de Venezuela in Caracas-Venezuela in order to homologate the results
obtained in the first FTS unit as regard the cobalt based catalysts specifically
the hydrotalcites The experimental tests were performed in a laboratory plant
with a tubular reactor with a fixed bed of catalyst vertically placed They were
then tested in the standard conditions by flowing syngas (H2 CO N2 63325
vv N2 as internal standard) at 156 Nml˙min-1 using a flow meter Then the
feed goes into the catalytic reactor from the top part reacts with the catalyst
and then the reacted flow comes out from the lower part The plant pipes are
heated at 220degC During reaction the reactor effluent passed through a hot
trap kept at 150ordmC and 20 bar to collect waxes and the products leaving this
trap were passed through a second trap kept at 0ordmC and 20 bar to collect the
lighter products (water alcohols and hydrocarbons) The analyses were
performed in various chromatographs according to the nature of the sample to
be analyzed Permanent gases and light hydrocarbons were analyzed on-line in
a PerkinElmer 3000GC Autosystem fitted with TCD detectors using a Carbosieve
SII Supelco column The liquid products (collected at 150ordmC and 0ordmC) were
weighted and analyzed in a PerkinElmer chromatograph fitted with a 50m long
Alumina RT capillary column connected to a FID
In Fig 423 the detailed flow-sheet of FT plant has been reported
115
Fig 423 Laboratory plant flow-sheet
The key for the Fig423 is the following
1 Valve
2 Flow meter for H2 and syngas operating in the range 0-100 Nml min-1
3 Gas mixer
4 Thermocouples for the control of temperature in the catalytic bed in the
reactor and in the heated pipe
5 Tubular reactor
6 Security valve
7 Pressure indicator
8 Pressure control and regulation tool
9 GC ldquoPerkin Elmerrdquo
10 Gas totalizer for the control of the total flow of gas
11 Cold trap operating at 150degC and 20 bar to collect waxes
111 Second cold trap kept at 0ordmC and 20 bar to collect the lighter products
(water alcohols and hydrocarbons)
12 Cooling air for the temperature control of the reactor
13 vent (usually closed)
In figure 424 a photo of the plant is reported
116
Fig 424 FT laboratory plant
In the following paragraphs the main parts of this plant will be described
41b Main parts of the plant
41b1 Apparatus for the regulation and control of temperature pressure and
flow of reagents
In the plant the pressure is controlled by a pneumatic valve that interacts with
a pressure valve able to work till 1000 psi (Fig 425) located after the reactor
and the cold trap
Fig 425 Pressure valve
This system can control the plant pressure with a care of 10 psi respect the set
up
117
The reactor temperature is regulated by a heating jacket and the pipe lines
after the reactor are heated at 220degC to prevent the heavy products
condensation by a heater The CO H2 and N2 flows are regulated by Brooks
Instrument Control and Read out Equipment for Thermal Mass Flow meters
Model 5878 series flow meters (Fig 426)
426 Flow meters for H2 and syngas
41b2 FT reactor
The FT plant reactor is a fixed bed tubular reactor vertically placed It is made
of AISI 316 stainless steel The technical characteristics of reactor are
summarized in Table 413
Table 413 Reactor Characteristics
Volume (cm3)
Max operating pressure
(Bar)
Max operating temperature
(degC)
Internal diameter
(mm)
Height (mm)
850 69 400 95 300
In this reactor it is possible to charge a quantity of catalysts equivalent to
occupy 1 cm of length of the reactor The feed goes into the reactor at the top
and goes out from the lower part
118
Fig 427 FT tubular reactor
The temperature inside the reactor is monitored by one thermocouple inside
the catalyst
41b3 Cold Trap The reactor effluent passed through a hot trap kept at 150degC and 02 MPa to
collect waxes and the products leaving this trap were passed through a second
trap kept at 0degC and 02MPa to collect the lighter products (water alcohols and
hydrocarbons) See Fig 428
Fig 428 Cold trap
The two cold traps can be opened at any time of the reaction and the liquid
condensed inside can be quantified and analyzed
119
The analyses were performed in various chromatographs according to the
nature of the sample to be analyzed Permanent gases and light hydrocarbons
were analyzed on-line in a PerkinElmer 3000GC Autosystem fitted with TCD
detectors using a Carbosieve SII Supelco column The liquid products (collected
at 150degC and 0degC) were weighted and analyzed in a PerkinElmer chromatograph
fitted with a 50m long Alumina RT capillary column connected to a FID
42b Analytical instruments
Two different analysis were made for the quantification of the composition of
i) Out coming gas (mixture of not reacted CO and H2 N2 and non-
condensed FT products) by an on-line in a PerkinElmer 3000GC
Autosystem fitted with TCD detectors using a Carbosieve SII Supelco
column
ii) Organic phase of condensed liquid products (collected in a cold trap at
150ordmC and 0ordmC) hydrocarbons in the range C7-C30 were weighted
and analyzed in a PerkinElmer chromatograph fitted with a 50m
long and 053 mm diameter of Alumina RT capillary column
connected to a FID
An example of analyses of the permanent gases is reported in Fig 429 and an
example of analysis of heavy FT hydrocarbons is reported in Fig 430 and Fig
431
120
Fig 429 Example of analyses of the permanent gases in the TCD
Fig 430 Example of not-condensed products GC analyses on FT out coming gas
121
Fig 431 Example of GC analysis for the quantification of heavy FT products
43b Experimental procedure
All the kinetic FT runs were made on the plant following the same experimental
procedure
1) Catalyst preparation
2) Catalyst loading on the plant in the FT reactor
3) Leak test
4) Catalyst activation
5) FT run
6) Opening of cold trap and separation of organic from aqueous phases
7) Catalyst removal from reactor
8) Reactor cleaning
43b1 Catalyst preparation
Before the catalyst was loaded in the reactor a standard procedure was
followed on the same catalyst
- Catalyst mesh operation between 106 and 150 micron
- Heating in oven at 120degC for a night
122
- Mixture catalyst ndash sea sand (inert material ndash diluent) 11
In table 414 the main characteristics of sea sand are reported The role of this
material is to help the heating removal from the catalyst (FT reaction is highly
exothermic) [5]
Table 414 Main characteristics of sea sand
Particle Size (μm)
Specific Surface
Area (m2g)
Bulk density (Kgm3)
Pore Volume
(mL)
Interstitial Velocity
(md)
Porosity (-) Composition
100-300 074
200-1430
117 26
044 SiO2
43b2 Catalyst loading
As the height of the mixture catalyst + sea sand is about 1 cm (using a pipe with
an internal diameter of 95 mm) if this material is charged in the middle of the
reactor this work surely at the same temperature in each point The final
arrangement of the reactor is reported in Fig 432
Fig 432 FT reactor internal loading arrangement
123
Finally after the closing the pressure inside the reactor is raised till 3 bar with
the activation gases The gas flow is stopped for one night and then the reactor
is checked to control possible gas losses If the reactor pressure is stable the
activation catalyst step will be performed The same procedure for the check of
possible gas loss will be performed when the pressure of the reactor will be
raised till 20 bar for FTS
43b3 Catalyst activation The catalyst activation is the process in which the catalyst is reduced from the
oxidised state in the reduced or metallic state The samples tested in this
reactor were the Co based hydrotalcites In the FT reaction the active form for
the cobalt based catalysts is the cobalt metallic All the catalysts were charged
into the reactor in the oxidised form because the last operation in the catalysts
preparation is the calcination (T=500degC) in air The catalyst activation-reduction
is performed in this part of the PhDrsquos research work at 350degC using H2 always
for 4 h at 3 bar of pressure At the end of this step the FT process start
43b4 Fischer Tropsch runs
After the catalyst activation the plant is raised at standard reactions conditions
Temperature = 220-260degC
Pressure = 20 bar
Feed ratio H2CO = 21
Syngas (H2 + CO + N2) flow = 156 Nmlmin (in order to work with the
same space velocity used for the same samples tested in the Unit 1 in
Italy)
These are the ldquostandardrdquo reaction conditions When the plant reaches the set-
up values this is the ldquozero-timerdquo of the FT runs Every one hour the GC make
124
one analysis of the permanent gases (CO CO2 CH4 N2) on the out coming flow
(also during the night) Each data is reported and elaborate using an excel
database The FT run has a duration between 200-280 hours During the
reaction and before the changes of temperatures the valves of the two cold
trap are opened and both the organic phase (GC) and the aqueous phase are
separated and then weighed and analyzed Also these data is collected in the
excel database and now it is possible to calculate the CO conversion the
products selectivity the alpha parameter and it is possible to verify the final
mass balance
After the reactor cooling the catalyst is unloaded The reactor is cleaned
carefully
42 Experimental data elaboration
The experimental data collected in the laboratory are the gas-chromatographic
area (with micro and traditional GC) the gas flows the temperatures the
pressure the weight of condensed products and the TOC value of organic
compounds in aqueous phase For each run all these data were put in the
excel file where in an automatic way the CO conversion the products
selectivity the molar balance the parameter were calculated
There were used two different file excel for the two different FTS unit
a) First FTS unit (Unit 1)
The file excel is split in nine pages data results heavy hydrocarbons analysis
molar balance (CO hydrogen and oxygen) hydrogen analysis oxygen analysis
and alpha calculation As example the pages of one FT run (made with a Co
base catalyst Co35_2d) are reported in Fig 433a-f
Data page (Fig 433a)
125
This worksheet contains the mathematical elaboration of the experimental
data obtained from the various analyzes and is composed of different parts
Conditions It is referred to the number of tests carried out by the
micro-gas chromatograph the time at which the analysis were made
and the outside temperature at the time of sampling
Flow in It is referred to the flow in (Nmlmin) of the reactants (H2 and
CO) and the internal standard (N2) that remain constant during the
entire kinetic energy
Volumes totalizers It is referred to the values of the three volumes of
gas consumed while the kinetic is in progress (this values are read from
the totalizer just before performing the analysis) and the total volume
of gas output in ml and Nml Furthermore it also evaluates an error in
percentage between the volume of gas out and the gas in
Flow out is measured by a flow meter bubbles and a counter ldquoRitterrdquo
the flow rates are calculated with the output flow measured from the
bubble flow meter and the Ritter counter and then compared
Flow from bubble flow meter (min
ml ) = 60t
V (11)
V[ml] Volume path from the bubble
t[min] Time it takes the bubble to traverse this volume
Flow from Ritter counter (min
ml ) = 100)(
t
VV INOUT (12)
VIN [ml] and VOUT [ml]are the volume of gas in and out
Both values of flow are converted in Nmlmin by the next equation
T273
273ml
min T[degC] (13)
126
CO Conversion It is referred to the quantity of gas reacted or converted
referred to the gas entering inn the plant From the micro-gc analysis
are taken the chromatographic areas of CO and N2 and used to
calculate the flow out-coming of CO from the equation
29121
2
2
OUTNflow
NArea
COAreaCOflow OUT (14)
Where 12912 is the calibration factor As the flow in and the flow out of N2
is the same
29121
025
2
NArea
COAreaCOflow OUT (15)
502 is the flow of the internal standard N2
Now it is possible to calculate the CO conversion using the next formula
IN
OUTIN
COflow
COflowCOflowConversionCO
(16)
Selectivity Concerning the gas flow out-coming from the FT plant made
of not reacted CO CO2 CH4 and light hydrocarbons
CO in reaction mixture 100
2
NTOT
OUT
flowflow
COflowCO (17)
product i in reaction mixture
100
2
NTOT
OUT
i
i
iflowflow
flowcF
area
product (18)
where
flowTOT is the total flow out-coming from the FT plant and concentrationi is
the amount (m) of product i found using the micro-GC
Fci is the calibration factor for each compound
127
Carbon molar flow for the i compound
i
i
C
i
tot
Cnumber
flowmoles
422
100
0010
min (19)
where iCnumber is the number of carbon atom of compound i
0001 transform Nml to Nl and 224 let to transform Nl to moles
Molar balance
CO moles entering in the plant 1000422min x
flowCmolesinin COCO
(20)
CO moles out coming
6
1 min1000422min i
iCOCO molesC
x
flowCmolesoutOUT (21)
128
Fig 433a Example of ldquodata pagerdquo in FT data elaboration excel file
Results page (Fig 433b)
Concerning the products selectivity
Light products (ltC7) j selectivity
129
100
minmin
min
outin
C
j molesCOmolesCO
moles
S
j
(22)
where jCmoles means the moles of carbon atom in the j products
Heavy products (geC7) i selectivity
100
minmin
min
outin
C
i molesCOmolesCO
moles
S
i
(23)
where iCmoles means the moles of carbon atom in the i products
Total light products selectivity jlight SS (24)
Total heavy products selectivity iheavy SS (25)
Fig 433b Example of ldquoresults pagerdquo in FT data elaboration excel file
Concerning the heavy product (organic phase condensed in the cold trap) elaboration (Fig 433c)
moles of i compound 100
CA
fcCAmoles ii
i (26)
where CA is the chromatographic area and fc is the calibration factor
130
Total moles of ldquo-CH2-ldquo unit in organic phase 142
OPCH
weightmoles (27)
Where weightOP means the weight of the organic phase in gram and 14 is the molecular weight of the unit ldquo-CH2-ldquo
Carbon moles of compound i 100
2 i
CH
Cmoles
molesmoles
i
(28)
Moles of carbon per minute of each component
60min
timereaction
CmolesCmoles ii (29)
Fig 433c Example of ldquoheavy hydrocarbons analysis pagerdquo in FT data elaboration excel file
Molar balance page (Fig 433d)
The molar balance is verified using the following equation
outoutoutoutinCwaterCheavyClightCOCO molesmolesmolesmolesmoles (30)
Where
131
inCOmoles and outCOmoles are respectively the moles of CO in entrance and
escape of the FT plant in all the runrsquos time outClightmoles are the carbon
atom moles of light FT products came out from the FT plant in all the runrsquos
time outCheavymoles are the carbon atom moles of the heavy hydrocarbons in
the organic phase condensed in the cold trap and outCwatermoles are the
carbon atom moles inside the water phase condensed in the cold trap In
particular
422
0102 iiNtot
Clight
Cnflowflowmoles out
out (31)
2CH
OPCheavy
PM
weightmoles
out (32)
12106
fdweightppmmoles OPTOC
Cwaterout (33)
where ppmTOC are the ppm of Total Organic Carbon measured by TOC
instrument and fd is a diluting factor (normally 1500) as the aqueous phase
must be diluted before the TOC analysis
Fig 433d Example of ldquomolar balance pagerdquo in FT data elaboration excel file
132
alpha parameter (Fig 433e)
This parameter represents a prediction of the distribution related to the
number of carbon atoms according to the Anderson-Schulz-Flory
distribution
In the excel file of data elaboration it is possible to calculate the alpha
parameter in different range of hydrocarbons C1-C6 C3-C12 C13-C30 C3-C30
The hydrocarbon range is chosen depending of the FT results if as
example the heavy product selectivity is very low it is not convenient to
consider these products in the calculation The equation for the
calculation is
21
logloglog nn
Wn (34)
where Wn is the weight fraction of product with n carbon atom number In
the excel file the equation used are
tot
C
C tmoles
moles i
i 60
min (35)
where ttot is the total time of FT run in hours
iCi PMmolesgi (36)
n
i
i
in
g
gW
1
(37)
The calculation of is then performed making a diagram in which the
n
Wnlog is reported vs the carbon atom number
133
Fig 433e Example of ldquo calculation pagerdquo in FT data elaboration excel file
ldquo calculation pagerdquo
The product distribution can be predicted using the AndersonminusSchulzminusFlory
(ASF) model that depends on the chain growth probability α Different factors
have an influence on the alpha parameter such as process conditions type of
catalyst and chemical promoters [6] The ASF product distribution as a function
of α is depicted in Figure 25 (Chapter 2)
According to ASF distribution ideally the molar fraction (Mn) of the
hydrocarbon product with a carbon number of n is only dependent on the
chain-growth probability (α) which is a function of the rates of chain growth
and chain termination by the following equation
Mn = (1minusα)αnminus1 (38)
In other words the product selectivity is determined by α value in an ideal
case A smaller α value leads to lighter (C1ndashC4) hydrocarbons while larger α
value results in the formation of heavier (C21+) hydrocarbons However the ASF
distribution is unselective for the middle-distillate products which are usually
the target products For examples the maximum selectivity to gasoline-range
(C5ndashC11) hydrocarbons is sim45 and that to diesel-range (C10ndashC20) hydrocarbons
is sim35 The development of selective FT catalysts which can tune the
134
selectivities to desired products is one of the most challenging targets in the
field of FT synthesis [7]
The probability is defined as the speed of growth (rg) divided by the sum of
the speeds of all the possible reactions for the species in growth
The probability to form a product Pn with n carbon atoms is the product of the
probabilities that the adsorbed species are formed in 1 2 n-1 carbon atoms
(precursors of the species Pn) and the probability that the adsorbed species an
carbon atoms desorb Writing a mathematical model leads to the ASF
2n 1
loglognn
Wlog (39)
where Wn is the mass fraction of the product with n carbon atoms
To get the equation of Anderson-Schulz-Flory We define
- as the probability of growth - rt as the rate of chain terminations - rp the speed of chain propagation
For a chain of n carbon atoms is defined another parameter n given by
1n
i
n
n
n
p
tn
1
r
r
(40)
where n is the probability that a chain of n carbon atoms remains on the
catalyst to continue the propagation of the chains n is the number of moles of
product Cn If n is constant throughout the range of products it may simply
indicate with and therefore starting from n = 1 we can write
3
134
2
123
12
So in general
135
1n1n
Starting from a generic molecule with x carbon atoms we can write
xnxn
(41)
Assuming that the monomeric units have the same molecular weight without
regard to their position in the growing chain (these monomer units are CH2
with PM = 14) we can obtain the weight fraction Wn multiplying the equation
(1) by n and dividing it by
1n
nn If we set x = 1 equation (41) remains
1n
1n
1n
1n
1n1
1n1
1n
n
nn
n
n
n
n
n
nW
(42)
The denominator of the last member of equation (42) can be written as
0n
n
(43)
In fact the operators
can be reversed and therefore
0n
1nn
0n0n
n
The series
0n
n for 1 be equal to 1
1
The series in question is of the type n32 arararaS
and the solution is equal to
r1
r1aS
n
Equation (2) can therefore be rewritten as follows
136
2
1n1n
0
n
1n
n1
n
1
1
nnW
or
21nn 1nW (44)
Bringing in logarithmic form the equation (44) we have
2n
n
n
n
1n
n
W
12nn
W
121nn
W
121nnW
)(lnlnln
)ln(lnlnln
)ln(ln)(ln
)ln(ln)(lnln
is identified by the slope of the straight line obtained by plotting the log
(Wnn) as a function of n The quality and the defect of the ASF model is its
simplicity one is in fact arises because of its ease of use across the agreement
with experimental data is not always fully satisfactory in fact the equation
provides undifferentiated products while in reality various species are
summarized
In this file are calculated different values of depending on the range of
carbon atoms C3-C12 C13-C30 C3-C30 Furthermore it was calculated an value
for the range C1-C6 because it is common to all the catalysts in fact the nature
of the tests performed on the various samples kinetics do not guarantee the
of the other range
Mathematically is calculated from
bullthe moles of carbonmin of the various components
bull from the moles of carbonmin it is possible to find the moles of each
component with the formula
137
hreactiontimeh
Cmolcarbontomol i
i
min60
min
From the moles it is possible to get the grams of each component
mol
gPMmolCmolg ii
Wn is calculated (weight fraction) for each component
n
1i
i
in
g
gW
i
calculating the value of Wnn (where n is the number of carbon atoms)
for each component
calculating the ln(Wnn)
By plotting the logarithm of the value of Wnn as a function of the number of
carbon atoms (n) is obtained a straight line whose slope gives the value of
desired
425 Hydrogen
Hydrogen balance (Fig 433f)
This data page allows to calculate the conversion of hydrogen and also the of
H2 in the gas mixture leaving from the reactor
H2 Conversion
Area H2
Area N2
Real Flow mix [Nml min-1]
Flow H2 OUT
[Nml min-1]
CONV H2 ()
() H2
138
As for the CO from the analysis at the micro-GC we get the chromatographic
areas of H2 and N2 that are used to calculate the outlet flow from the Fischer-
Tropsch plant of carbon monoxide by the formula
0017
2
2
22
OUTNflow
NArea
HAreaHflow OUT
where 7001 is the correction factor determined by the calibration of the
micro-gas chromatograph As the output flow of nitrogen is equal to that in the
input will have
0017
025
2
22
NArea
HAreaHflow OUT
At this point we can calculate the conversion of H2 by the formula
IN
OUTIN
Hflow
HflowHflowHConversion
2
222
The H2 is necessary to obtain the number of moles of hydrogen present in the
gaseous stream leaving from the reactor it is calculated through the formula
1002
2 TOT
OUT
flow
HflowH
Hydrogen Balance Also the balance of the hydrogen is performed at the end of the kinetic and it is
calculated with the following formula
2_
_2_
2
22222
Hfrom
waterheavylightMixfromHfrom
IN
OUTOUTOUTOUTIN
Hmoles
HmoliHmolesHmolesHmolesHmoles
where
139
1 18
2
phaseaqueous
OUT
weightwaterHmoles
2 2
2
CHPM
phaseorganicweightphaseorganicfomHmoles
The use of the molecular weight of methylene is because the CH2 is the
segment that grow joining to other segment of CH2 to give the different
hydrocarbons
3 moles of H2OUT light are the moles obtained by the summation of moles
of H2OUT of light hydrocarbons through the formula
2422
0102
jiOUT
OUT
compoundHngasmllightHmoles
Fig 433f Example of ldquohydrogen balancerdquo in FT data elaboration excel file
427 Oxygen Balance As for the other two balances also the oxygen balance is carried out at the end
of the kinetic run and it is calculated using the formula
COfrom
OHfomCOfromCOfromCOfrom
IN
OUTOUTOUTIN
Omoles
OmolesOmolesOmolesOmoles
_
2_2___
Where
140
1 18
phaseaqueous
OUT
weightwaterOmoles
2 422
2010 22
COgasmlCOOmoles OUT
OUT
In the calculation of the oxygen balance are not considered the oxygenated
products while the moles of OIN from CO and the moles of OOUT from CO are
respectively equal to the moles of COIN and COOUT from CO
b) Seconf FTS unit (Unit 2)
The shape of the file excel is presented in a different way but the equations
are the same equations presented before (See First FTS unit in this chapter)
The file is split in eleven pages XCO CH4 CO2 TCD data media paraffins
fractions (1-4) As example the pages of one FT run (made with a Co based
hydrotalcites catalyst Co35_2d) are reported in Fig 434a-d
TCD In Fig 434a-b are shown the conditions related to the number of tests
carried out by the gas chromatograph the time at which the analysis were
made and the outside temperature at the time of sampling the CO Conversion
that is referred to the quantity of gas reacted or converted referred to the gas
entering inn the plant From the gas chromatograph are taken the
chromatographic areas of CO CH4 CO2 and N2 and used to calculate the
selectivity
Fig 434a Example of ldquodata page _ TCDrdquo in FT data elaboration excel file
141
Fig 434b Example of ldquodata page _ TCDrdquo in FT data elaboration excel file
Datos In Fig434 c is shown the information related to the selectivity of light hydrocarbons
Fig 434 c Example of ldquolight hydrocarbons analysis pagerdquo in FT data elaboration
excel file
In Fig 434d the calculation of is then performed making a diagram in
which the
n
Wnlog is reported vs the carbon atom number
Fig 434 d Example of ldquo calculation pagerdquo in FT data elaboration excel file
142
43 Novelties on the FT plant made in this PhD work In the second year of the PhD the reactor used in the laboratory at the
ldquoUniversitagrave degli Studi di Milanordquo was brought in ldquoBrignolerdquo Company
(Legnano ndash MI) for a general control and revision
In this long revision some fundamentals improvements have been made on
the FT plant
all the analytical procedures were optimized verified and calibrated
A new flowmeter was included in the feed verified and calibrate
References
[1] CLBianchi C Pirola V Ragaini Cat Comm 7 (2006) 669
[2] ML Cubeiro Loacutepez A Colmenares L Texeira M Goldwasser M J Peacuterez
F Machado F Gonzaacutelez Applied Catalysis A General 167 (1998) 183-193
[3] C Pirola C L Bianchi A Di Michele P Diodati S Vitali V Ragaini Catal
Lett 131 (2009) 294ndash304
[4] C Pirola CL Bianchi A Di Michele S Vitali V Ragaini Catal Comm 10
(2009) 823ndash827
[5] C Pirola PhD 2007-2008 Novel supported iron based Fischer-Tropsch
catalysts Preparation characterization and applications Chapter 5
[6] Abell S Montan D ChemSusChem 2011 4 1538minus1556]
[7] Qinghong Z Weiping D Ye W Review Recent advances in understanding the key catalyst factors for Fischer-Tropsch synthesis J Ener Chem 2013 2227ndash38
143
Chapter 5 Catalysts preparation and characterization A serious of catalysts were prepared according different method of synthesis
and using cobalt and iron depending on the kind of the study
The catalysts reported in Table 51 are divided in two classes
1) Catalysts of cobalt based divided into two more groups
a Co based hydrotalcites with different amount of cobalt (5-35
wt) prepared with an innovative method of synthesis (urea
method)
b Co based catalysts with 8wt of cobalt with different supports
(SiO2 Al2O3 or TiO2) and the same samples with the addition of
01 of ruthenium carbonyl all of them synthesized with the
help of ultrasound
2) Catalysts of iron (30 wt) with fixed (optimized) loading of promoters
(K=20 Cu=375) and different method of synthesis
The catalysts of the first series (Co) subdivided in two more groups (HTlc and
bimetallic with the help of ultrasound) were studied to verify the activity of
this new kind of catalysts in the CO hydrogenation
More specifically the hydrotalcites were proposed as a new kind of catalysts
in which the active metal is part of the structural core of the HTlc has been
synthesized and tested Activity tests conducted in a fixed bed reactor resulted
in satisfactory catalytic performances as we will discuss later Moreover the
structural and catalytic properties of these materials were verified at FTS
operating conditions and correlations between catalyst features and efficiency
144
towards light and heavy hydrocarbons selectivities were achieved And the
cobalt based catalysts synthesized with the help of ultrasound (US) were
studied to test the effects of sonochemical synthesis to prepare novel
supported materials with particular properties as nanostructured catalysts [1]
The chemical effect of ultrasound arises from acoustic cavitation ie the
formation growth and implosive collapse of bubbles in a liquid Some of the
interesting features resulting from the application of sonication as a synthetic
method are the nanoparticles preparation showing a more uniform size
distribution higher surface area and a more controlled phase composition The
use of high power ultrasound for long time is a difficult procedure because it is
a critical point the control of the thermal stability of the ultrasound horn In
this PhDrsquos work the possibility to use an ultrasound assisted synthesis of Co-
based catalysts by high power ultrasound for a long time has been
investigated using an innovative experimental apparatus equipped with a new
cooling system able to maintain stable the temperature US emitting horn
The catalysts of the second series (Fe) were studied to verify the effect of the
different methods of synthesis and the variation of the H2 CO ratio in order to
simulate a feed with biosyngas and for an ulterior study about the develop of a
kinetic model The selection of this specific amount of Fe (30 wt) and
promoters (Cu and K with 20 wt and 375wt respectively) was taken from
a previous research [2] in which the effect of these amounts was extensively
studied
Promoters influence the bond strength of hydrogen and carbon oxide to metal
Addition of alkali metals (K in particular) to iron catalysts promotes electron
transfer to the iron and inhibits hydrogen adsorption because adsorption of
hydrogen induces electron donation to the iron surface Moreover K promotion
Chapter 5 Catalysts preparation and characterization
145
increases the electron density in iron and will result in an increase of CO
adsorption On Fe stronger metal-carbon bonds will lead to C2+ formation and
then to a low methane selectivity [3] Copper promotes the reduction of iron
oxide phases from hematite (Fe2O3) to magnetite (Fe3O4) and then from
magnetite to iron metal A suggested mechanism for this promotion effect is
the migration of atomic hydrogen from reduced Cu sites to the iron oxide The
copper needs to be very well mixed with iron oxide to provide the most
favourable promoter effect [4]
An innovative preparation procedure with the use of Ultrasound and
Microwave has been used with the iron based catalysts
In Table 51 a general summary of all the prepared catalyst is reported
Table 51 Summary of the catalysts synthesized and tested
Metal Catalysts Samples
Co
HTlc Co5
Co 10
Co 15
Co 35
Bimetallic US CoTiO2
CoSiO2
CoAl2O3
Co-RuTiO2
Co-RuSiO2
Co-RuAl2O3
Fe
Traditional Fe30K20Cu375 SiO2 At different temperature and H2CO ratio 21 15111
Traditional + MW MW1
MW2
Traditional + US
US1
US2
Co-precipitation
FeSiO2-TEOS
Chapter 5 Catalysts preparation and characterization
146
The catalysts were characterized by TPR BET SEM TEM ICP FT-IR micro-
RAMAN techniques in their fresh form (before the use in FT reactor) and in
some cases after different activation procedure or after FT runs
The physical properties of the catalysts (surface area and morphology) were
investigated by BET SEM and TEM analyses The theoretic catalysts
composition has been investigated and verified both qualitatively using SEM-
EDS FT-IR and micro-RAMAN techniques and quantitatively using ICP
characterization The reduction behaviour of metal phase has been
investigated by TPR analyses
51 Catalysts preparation
511 Catalyst preparation procedure
5111 Cobalt based catalysts
Two different types of cobalt based catalysts were prepared during this
research The synthesis is presented in the next paragraphs
Co based Hydrotalcites by a modified urea method
A series of ternary HTlc with general formula [CoxZn(1-x-
y)Aly(OH)2](NO3)y∙05H2O was synthesized by a modified-urea method [5]
Different volumes of the solutions of the metal nitrates all at a concentration
of 05 M were mixed to obtained either a Al(Co+Al) or Al(Co+Al+Zn) molar
ratio of 03
Solid urea was added to the solutions in a molar ratio of 4 vs Al The obtained
solutions were maintained at the reflux temperature in an open flask for 48 h
The precipitates were separated by centrifugation washed with water and
then dried at 80degC
Chapter 5 Catalysts preparation and characterization
147
Co based catalysts with the help of ultrasound
All the catalysts were prepared by a modified impregnation method The metal
precursors (cobalt and ruthenium carbonyl) were dissolved in n-decane
together with the different support (SiO2 Al2O3 or TiO2) The solution was
irradiated by an US horn (Fig 51) for 3 h at 20 kHz at 300 W and then put into
a rotating vacuum oven at 40degC at 36 rpm for 24 h (impregnation step)
Samples have been calcinated at 350 degC for 4 h
Fig 51 Ultrasound horn with a cooling jacket where the coolant has two main
characteristics low viscosity at low temperature and dielectric liquid
5112 Iron based catalysts Four different types of iron based catalysts were prepared during this
research The methods used were the traditional impregnation method the co-
precipitation method and the traditional impregnation method with the help of
microwave and ultrasounds
Fe based catalysts by the Traditional Impregnation method
The iron based supported on silica catalysts were prepared according to the
traditional impregnation method completely described in a previous work [6]
starting from an aqueous solution of precursors and adding in a second time
Chapter 5 Catalysts preparation and characterization
148
the support (silica) The reagents used for the samples preparation are
reported in Table 52
Table 52 Reagents used in the catalysts preparation Fe30K20Cu375 SiO2
Reagent Main characteristics
Support SiO2
Company Fluka (cod 60740) Mesh 70-230 60 Aring Molecular weight 60086 gmol Purity gt 99 Superficial area 500 m2g
Precursors
Fe(NO3)3middot9H2O Company Riedel de Hean Molecular weight 40385 gmol Purity 98
KNO3 Company Merk Molecular weight 10111 gmol Purity gt 99
Cu(CH3COO)2middotH2O Company Fluka Molecular weight 19965 gmol Purity 99
Solvent Extra pure water
The standard methodology for the catalysts preparation is the following
Drying of silica in oven (T=120degC) for a night
Weigh of the calculated amount of iron potassium and copper
precursors
In a pyrex vessel (250 ml) the weighed precursors the water (25 ml)
and silica (5 g) are added
The vessel is put on a rotavapor (36 rpm T=40degC P = 1 bar) for 24 hours
(Fig 52)
The solvent is evaporated (T = 80degC)
The powder is dried in oven (T=120degC) for 4 hours
Calcination (T = 500degC) in air for 4 hours
Chapter 5 Catalysts preparation and characterization
149
The catalyst is sieved to obtain a powder mesh between 100 and 140
Fig 52 Rotavapor used for catalyst preparation
The amount of precursors is calculated starting from the equation (1) to have
the requested iron percentage in the not promoted catalysts
FegSiOgFe
gFe
2
(1)
Then the moles of iron are equal as the moles of his precursor (moles Fe =
moles Fe(NO3)39H2O) The grams of precursors are calculated multiplying the
moles for the molecular weight of Fe(NO3)39H2O This quantity must be divided
for the purity grade of precursor
For the promoted catalysts the amount of precursors is calculated using the
following equations
FegSiOgCugKgFe
gFe
2
(2)
KgSiOgCugKgFe
gK
2
(3)
CugSiOgCugKgFe
gCu
2
(4)
Chapter 5 Catalysts preparation and characterization
150
The equation (2) (3) and (4) must be solved as equations system The moles of
Fe K and Cu are equal as the moles of respective precursors The grams of
precursors are calculated multiplying the moles for the molecular weight of
Fe(NO3)39H2O KNO3 and Cu(CH3COO)2H2O respectively This quantity must be
divided for the purity grade of each precursors
Specifically for the preparation of a catalyst having 30 wt of iron 2wt of
potassium and 375wt of copper on silica
2920037505
15600205
33523005
gCuggCugKgFe
gCu
gKggCugKgFe
gK
gFeggCugKgFe
gFe
moles Fe =molesg
g
84755
3352=00418 moles
moles K =molesg
g
098339
1560= 000398 moles
moles Cu =molesg
g
54663
2920= 00046 moles
g Fe(NO3)3middot9H2O = 00418 molesmiddot40385 gmoles = 16882 g
g KNO3 = 000398 molesmiddot10111gmoles = 04024 g
g Cu(CH3COO)2middotH2O = 00046 molesmiddot19965 gmoles = 09168 g
and the grams required to prepare the catalysts are
980
88216 g=17227 g Fe(NO3)3middot9H2O
Chapter 5 Catalysts preparation and characterization
151
1
40240 g = 04024 g KNO3
990
91680 g= 09261 g Cu(CH3COO)2middotH2O
Fe based catalysts by the Traditional Impregnation method with the help of
microwave (MW)
For the synthesis of the catalysts with the aid of microwave (MW) a final step
where the powder of catalyst already calcined is subjected to a MW
irradiation was added Two different methods for the MW irradiation were
used In the first one (MW1) a sample of catalyst was put into a beaker and
then into a classical microwave oven (Moulinex Micro-Chef 1305E 600W) for
30 min
In the second method (MW2) the catalyst (2 g) was suspended in hexane (400
ml) put into a microwave chemical reactor (ordinary 400 mL round bottom
glass flask filled with the liquid to be heated and activated) and treated for 1 h
at 60W MW were produced by a MW generator and sent to the MW
applicator by an insulated coaxial antenna Details of the MW applicator and of
the associated experimental techniques can be found in [7]
Fig 53 Microwave (MW) Power (35-300 W) Treatment duration (60 min)
Atmosphere (air)
Chapter 5 Catalysts preparation and characterization
152
Fe based catalysts by Traditional Impregnation method with the help of
ultrasound (US)
In this particular preparation method a step using ultrasound (US) has been
added Ultrasound is simply sound pitched above the frequency bond of human
hearing It is a part of sonic spectrum that ranges from 20 kHz to 10 MHz and
corresponds to the wavelengths from 10 to 10-3 cm [8] The application of
ultrasound in connection to chemical reactions is called sonochemistry The
range from 20 kHz to around 1 MHz is used in sonochemistry since acoustic
cavitation in liquids can be efficiently generated within this frequency range
[9] However common laboratory equipment utilizes the range between 20
and 40 kHz The Ultrasound are often used in the preparation of supported
catalysts (some examples are reported in ref [10]) and their useful
contribution concerns for example the dispersion of metal the size of particles
the surface area and the advantage is evident in the performance of catalyst in
many cases both in term of conversion and of process selectivity [11]
The use of ultrasound may be very efficient to optimize the dispersion of high
metal charge as already verified in our laboratory in the past [2 12-13]
US treatment has been performed between the impregnation and the
evaporation step by irradiating the silica-precursors solution using a Sonicator
(W-385 Heat Systems Ultrasonics) with an effective input power of 60 W and a
tip diameter of 13 mm (Fig54 and Fig 55) Silica solution promoters and
water have been sonicated by the US horn for 05 h in air (US1) The same
sample was successively sonicated in a suspension of hexane in argon for 3h
(US2)
Chapter 5 Catalysts preparation and characterization
153
Figura 54 Diagram of sonication step
1 Sonicator US (W-385 of Heat Systems Ultrasonics)
2 Emitter head of US equipped with a titanium tip of 13 mm
3 Beaker with the solution immerse in a bath of waterice
4 Flow meter of Ar
5 Connection with air
6 Argon Cylinder
Fig 55 Detail of the US treatment step 20 kHz 60 W tip diameter of 13 mm US
switched on and off alternatively for 05 seconds (pulsed US) t =30 min
1
4
6 3
2
5
Chapter 5 Catalysts preparation and characterization
154
Fe based catalyst by the co-precipitation method with TEOS
Acidic silica sol (ASS) and tetraethoxysilane (TEOS) are widely used as silica
sources of FeSiO2 catalysts [14-15] which can be incorporated into iron
catalyst matrix during the precipitation of catalyst precursors and have an
obviously dispersive effect on the iron oxide phase It is well known that the
tetraethoxysilane (TEOS) is insolvable in aqueous solutions but can slowly
hydrolyze to hydrophilic silica solgel [16]
In the TEOS- water system acid or basic can catalyze the hydrolysis of TEOS
[17] In the process of the co-precipitation TEOS hydrolyzes into silica
accompanied by the precipitation of ferric ions whereas the silica particles in
ASS may directly interact with ferric ions The different properties of two silica
sources should lead to a great diversity in both the structures and the
physicochemical properties of catalysts such as morphology dispersion
phases chemisorption Fe-SiO2 interactions and so on
As a FeSiO2 catalyst was prepared by a co-precipitation method using TEOS
The detailed process of the co-precipitation method has been described
elsewhere [18] In brief an alcoholic solution of TEOS was mixed with an
aqueous solution of iron nitrate with a FeSi atomic ratio of 10025 The mixed
solution was precipitated using an ammonium solution at 80 degC and a pH value
of 85-90 After precipitation the precipitates were aged for 2 h washed and
filtered Then the filtered cakes were dried at 120 degC overnight and calcined at
500 degC for 5 h The catalyst was denoted as FeSiO2-TEOS
Some calculations have been made to prepare the catalyst
To prepare 50ml 1M of solution of TEOS
To prepare a catalyst with a FeTEOS= 41 ratio and using 1g of Fe are required
Chapter 5 Catalysts preparation and characterization
155
To prepare the catalysts is required a ratio FeTEOS=41 thatrsquos mean 1g of Fe
correspond with 025g of TEOS
molFemolFeg
gFemolFe 01790
84755
1
OHNOgFeOHNOmolFe
OHNOgFe
molFe
OHNOmolFemolFeOHNOgFe 233
233
233233233 9)(387
980
1
9)(
9)(52403
1
9)(1017909)(
mll
ml
mol
Mlsol
gTEOS
molTEOSgTEOSmlTEOS 201
1
1000
1
11
33208
1250
700ml of distillate water was put into a beaker and heated at 77degC
OHNOgFe 233 9)(387 and 120ml of TEOS were added
Measurements of pH was taken until the solution acquired a pH
between 8 and 9
Let stand for 2 hours
The solvent is evaporated (T = 80degC)
The powder is dried in oven (T=120degC) for 4 hours
Calcination (T = 500degC) in air for 4 hours
The catalyst is sieved to obtain a powder mesh between 100 and 140
52 Catalysts characterization 521 Catalysis characterization introduction and theory
According to [19] the basic catalyst characterization involves two main steps
the investigation on the porous nature of the catalyst support (physical
properties) and on the properties of the active sites that are dispersed on the
support surface (table 53)
The complete and accurate knowledge of the properties of a catalyst is
fundamental for evaluating its performance In this work there were used
several techniques to investigate their physical and chemical properties
Chapter 5 Catalysts preparation and characterization
156
The characterization has been made for the fresh catalysts (after the
calcination at 500degC and before their loading and activation or use in FT
reactor) and in some cases after the activation and the FT reaction
Table 53 General scheme of catalysts characterization [19]
Catalyst texture
Physical properties Chemical properties
Result Technique Result Technique Geometry and shape - Optical microscopy Chemical composition -Electron spectroscopy
-Atomic adsorption
Total specific surface area
-Gas physisorption -Mercury porosimetry
Degree of dispersion -Selective chemisorption -X-ray -Electron microscopy -Magnetisation analysis
True density -X-ray analysis -Neutron diffraction
Degree of dispersion -Selective chemisorption -X-Ray -Electron microscopy -Magnetisation analysis
Bulk and apparent density
-Helium pycnometry -Mercury porosimetry -Liquid displacement
Surface Energy -Thermal analysis test -Temperature programmed desorption and reaction calorimetry
-Pore specific volume -Porosity
-Mercury porosimetry -Gas adsorption
Acid-base sites -Selective chemisorption -Temperature programmed desorption
Pore size and mean pore size
-Mercury porosimetry -Gas Adsorption
Redox sites -Spectroscopic methods -Temp programmed reduction -Temp Programmed oxidation
Particle size -Sieves -Laser scattering -Sedimentation -Electrical sensing zone -Etc
-Catalytic properties -Activity -Selectivity
Reactor tests and simulation
Surface structure -Optical microscopy -Electron microscopy -X-Ray analysis
Surface change Z potential
A brief description of the different techniques used in this work will be
presented as follow
Chapter 5 Catalysts preparation and characterization
157
BET (adsorption method for surface area evaluation)
SEM
TEM (electron microscopy)
FT-IR and RAMAN (vibrational spectroscopy for chemistry of surface
groups)
TPR (study of catalyst reduction vs temperature)
TPD
ICP (quantification of element inside the catalyst)
XRD
5211 BET analysis (adsorption method for surface area evaluation)
According to [20] the most widely used method for determining surface area
involves measuring the amount of gas adsorbed on a solid surface at a
temperature close to the boiling point of the gas Nitrogen is most commonly
used as the adsorbate
The interaction between the adsorbate and the adsorbent may be chemical
(chemisorption) or physical (physisorption) in nature and ideally should be a
surface-specific interaction If the adsorption is measured at several gas
pressures the Brunauer- Emmett-Teller (BET) [21] equation can be used to
calculate the amount of adsorbate required to form a monolayer [22] This
technique of characterization of solid has the particular equation that allows to
determine a parameter of great importance in the study of the solid ones that
is the superficial specific area Such parameter expresses the relationship
between the total surface of the catalyst and the weight of the same one and
usually is expressed in m2g Technique BET uses the principle of the physical
inert gas adsorption (nitrogen) to varying of the relationship between the
Chapter 5 Catalysts preparation and characterization
158
partial pressure of nitrogen and its vapor pressure to the temperature of liquid
nitrogen The technique can be carried in static or dynamic conditions
Opportune procedures of calculation allow also to determine the distribution
of the pores in the field of mesoporosity BET theory is a well-known rule for
the physical adsorption of gas molecules on a solid surface that is basis for an
important analysis technique for the measurement of the specific surface area
of a material The concept of the theory is an extension of the Langmuir theory
which is a theory for monolayer molecular adsorption to multilayer adsorption
with the following hypotheses (a) gas molecules physically adsorb on a solid in
layers infinitely (b) there is no interaction between each adsorption layer and
(c) the Langmuir theory can be applied to each layer The resulting BET
equation is the following
p
pc
p
p
p
pc
V
V
m111
(5)
Where
V = volume of adsorbed gas at pressure P
pdeg = gas saturation pressure at temperature T
ppdeg = relative pressure
C = BET constant expressed by the following
RTqqC L exp 1 (6)
Where
q1 = heat of adsorption of the first layer
qL = heat of adsorption of the second and higher layers
For the Vm calculation the (6) must be linearized and the linear relationship of
this equation is maintained only in the range of 005 lt P P0 lt 035
Chapter 5 Catalysts preparation and characterization
159
mm cV
p
pc
CV
p
pV
p
p
1
1
1
(7)
Equation (7) is an adsorption isotherm and can be plotted as a straight line with
1 V[(Pdeg P) minus 1] on the y-axis and P P0 on the x-axis according to
experimental results The specific surface area is determined on the Vm basis
mol
molAVm
V
ANVAS
(8)
Where
NAV = Avogradorsquos number
Amol= adsorption cross section (for N2 = 162 Aring2)
Vmol= molar volume of gas (22414 mlmol)
Experimental The samples have been analyzed using a Costech Sorptometer
1042 ldquoKELVINrdquo using liquid nitrogen Before the analysis the catalyst is put in
oven (T = 110degC for 16 h) to remove the adsorbed water Then a quantity
between 008 g and 02 g in analyzed in the instrument The sample is pre-
treated for 2 h at T = 200degC in a N2 flow to remove all the impurity then a
check with helium is made to calibrate the interspatial volume
5212 Temperature programmed reduction TPR analysis [19]
Some aspects related to catalysts characteristic and behaviour will be treated
as determination of metal surface area and dispersion spillover effect and
synterisation A description of the available techniques will follow taking in
consideration some aspects of the gas-solid interactions mechanisms
(associativedissociative adsorption acid-base interactions etc)
Chapter 5 Catalysts preparation and characterization
160
The thermal analysis methods may be used with different objectives the
reaction or desorption profile may be used qualitatively to fingerprint a given
system and then it is possible to make a quantitative considerations about the
nature of chemical processes the amount of gas involved in the chemical
reaction and finally to calculate the number of the active sites the reducibility
degree of the sample related to the catalytic activity All the methods relating
some characteristic properties of a catalyst to its temperature during a
programmable heating ramp are named commonly in the field of the thermal
analysis
The thermal analyses are often used to investigate surface modifications and
bulk reactivity by varying the surface composition the catalyst preparation
method the pre-treatment for catalyst activation and the analytical conditions
The TPRO involve a bulk reaction
The objectives of the programmed reduction (TPR) are essentially the
following 1) to find the most efficient reduction conditions 2) to identify the
supported precursor phases and their interactions with the support 3) to
characterize complex systems as bimetallic or doped catalyst to determine the
role of the second component ant to establish alloy formation or promotion
effects There are several interesting studies about this technique Robertson
et al [23] first reported TPR profile of nickel and nickel-copper catalysts and
since then many catalysts have been investigated In the TPR technique an
oxided catalyst precursor is submitted to a programmed temperature rise
while a reducing gas mixture is flowed over it (usually hydrogen diluted in
some inert gas as nitrogen or argon) An interesting application of this
technique is that the TPRO analysis may be used to obtain evidence for the
interaction between the atoms of two metallic components in the case of
bimetallic system or alloy as already cited In general TPRTPO studies are
Chapter 5 Catalysts preparation and characterization
161
carried out under low partial pressure of the reactive gas In this way it is
possible to observe the intermediate reactions depending from analytical
conditions as temperature rate flow rate and concentration of reactive gas
Experimental
Conventional temperature-programmed reduction experiments (TPR)
were performed on the calcined catalysts using a TPRDO110
instrument (Thermoquest) The samples were initially pre-treated in
flowing argon at 200degC for 05 h After being cooled to 50degC the H2Ar
(51 vv) reducing mixture flowed through the sample at 30 mlmin
while the temperature was increased from 50 to 900degC at constant rate
of 8 degCmin
5213 SEM and TEM analysis
In electron microscopy as in any field of optics the overall contrast is due to
differential absorption of photons or particles (amplitude contrast) or
diffraction phenomena (phase contrast) The method provides identification of
phases and structural information on crystals direct images of surfaces and
elemental composition and distribution Routine applications however may be
hampered by complexities of image interpretation and by constraints on the
type and preparation of specimens and on the environment within the
microscope
The scanning electron microscope (SEM) is a type of electron microscope that
creates various images by focusing a high energy beam of electrons onto the
surface of a sample and detecting signals from the interaction of the incident
electrons with the samples surface The type of signals gathered in a SEM
varies and can include secondary electrons characteristic x-rays and back
scattered electrons In a SEM these signals come not only from the primary
Chapter 5 Catalysts preparation and characterization
162
beam impinging upon the sample but from other interactions within the
sample near the surface The SEM is capable of producing high-resolution
images of a sample surface in its primary use mode secondary electron
imaging Due to the manner in which this image is created SEM images have
great depth of field yielding a characteristic three-dimensional appearance
useful for understanding the surface structure of a sample This great depth of
field and the wide range of magnifications are the most familiar imaging mode
for specimens in the SEM Characteristic x-rays are emitted when the primary
beam causes the ejection of inner shell electrons from the sample and are used
to tell the elemental composition of the sample The back-scattered electrons
emitted from the sample may be used alone to form an image or in conjunction
with the characteristic x-rays as atomic number contrast clues to the elemental
composition of the sample The SEM was pioneered by Manfred von Ardenne
in 1937 [24] and [25] The instrument was further developed by Charles Oatley
and first commercialized by Cambridge Instruments The spatial resolution of
the SEM depends on the size of the electron spot which in turn depends on
both the wavelength of the electrons and the magnetic electron-optical system
which produces the scanning beam The resolution is also limited by the size of
the interaction volume or the extent to which the material interacts with the
electron beam The spot size and the interaction volume both might be large
compared to the distances between atoms so the resolution of the SEM is not
high enough to image individual atoms as is possible in the shorter wavelength
(ie higher energy) transmission electron microscope (TEM) The SEM has
compensating advantages though including the ability to image a
comparatively large area of the specimen the ability to image bulk materials
(not just thin films or foils) and the variety of analytical mode available for
measuring the composition and nature of the specimen Depending on the
Chapter 5 Catalysts preparation and characterization
163
instrument the resolution can fall somewhere between less than 1 nm and 20
nm In general SEM images are easier to interpret than TEM images
According to [22] topographical images in a SEM are formed from back-
scattered primary or low-energy secondary electrons The best resolution is
about 2-5 nm but many routine studies are satisfied with a lower value and
exploit the case of image interpretation and the extraordinary depth of field to
obtain a comprehensive view of the specimen With non-crystalline catalysts
SEM is especially useful for examining the distribution and sizes of mesopores
An energy dispersive X-ray spectroscopy device is a frequent attachment in the
instrument
Fig 56 Schematic ray path for a scanning electron microscope (SEM) [26]
Transmission electron microscopy (TEM) is a microscopy technique whereby a
beam of electrons is transmitted through an ultra-thin specimen interacting
with the specimen as it passes through it An image is formed from the
electrons transmitted through the specimen magnified and focused by an
objective lens and appears on an imaging screen a fluorescent screen in most
TEMs plus a monitor or on a layer of photographic film or to be detected by a
sensor such as a CCD camera The first practical transmission electron
microscope was built by Albert Prebus and James Hillier at the University of
Chapter 5 Catalysts preparation and characterization
164
Toronto in 1938 using concepts developed earlier by Max Knoll and Ernst
Ruska
Theoretically the maximum resolution that one can obtain with a light
microscope has been limited by the wavelength of the photons that are being
used to probe the sample and the numerical aperture of the system Early
twentieth century scientists theorized ways of getting around the limitations of
the relatively large wavelength of visible light (wavelengths of 400ndash700
nanometers) by using electrons Like all matter electrons have both wave and
particle properties (as theorized by Louis-Victor de Broglie) and their wave-like
properties mean that a beam of electrons can be made to behave like a beam
of electromagnetic radiation Electrons are usually generated in an electron
microscope by a process known as thermionic emission from a filament usually
tungsten in the same manner as a light bulb or by field emission The
electrons are then accelerated by an electric potential (measured in V or volts)
and focused by electrostatic and electromagnetic lenses onto the sample The
beam interacts variously with the sample due to differences in density or
chemistry The beam that is transmitted through the sample contains
information about these differences and this information in the beam of
electrons is used to form an image of the sample The contrast in a TEM image
is not like the contrast in a light microscope image A crystalline material
interacts with the electron beam mostly by diffraction rather than absorption
although the intensity of the transmitted beam is still affected by the volume
and density of the material through which it passes The intensity of the
diffraction depends on the orientation of the planes of atoms in a crystal
relative to the electron beam at certain angles the electron beam is diffracted
strongly from the axis of the incoming beam while at other angles the beam is
largely transmitted
Chapter 5 Catalysts preparation and characterization
165
Just as details of a light microscope sample can be enhanced by the use of
stains staining can be used to enhance differences in a sample for electron
microscopy Compounds of heavy metals such as osmium lead or uranium can
be used to selectively deposit heavy atoms in areas of the sample and to
enhance structural detail by the dense nuclei of the heavy atoms scattering the
electrons out of the optical path The electrons that remain in the beam can be
detected using a photographic film or fluorescent screen among other
technologies So areas where electrons have been scattered in the sample can
appear dark on the screen or on a positive image due to this scattering TEM is
suitable for examination of supported catalysts with particle sizes down to 2-3
nm giving information on particle location over the support on particle-size
distributions in favourable cases on particle and support morphology and on
the nature and distribution of deposits having a thickness of the order of 2-3
nm Surface topography can be examined using replication techniques [22]
Fig57 Schematic ray path for a transmission electron microscope (TEM) [26]
Experimental The SEM analysis have been made in collaboration with Perugia University
SEM images were measured using an electron microscopy Philips XL-30CP with
RBS detector of back-scattered electrons and EDS analyzer was used to
describe the surface and elemental composition of catalysts
Chapter 5 Catalysts preparation and characterization
166
The TEM analysis have been made in collaboration with Perugia University The
morphology of the samples was investigated by a transmission electron
microscope Philips 208 Transmission Electron Microscope (TEM) a drop of the
dispersion was deposited on a copper grid covered with a polymeric film
Formvar subsequently evaporated in air at room temperature
In order to obtain more accurate information concerning the atomic
percentage of the elements on the surface EDX measurements were made
using the high-resolution TEM instrument at the Department of Chemical
Science and Technology and Biosystems studies at the University of Siena This
instrumentation allows to obtain with high precision information on the atomic
percentage in different areas of the sample going to select individual points or
individual areas
5214 FT-IR analysis
This vibrational spectroscopy is used for characterization of high area
supported or unsupported catalysts Information is available either directly or
by study of probe adsorbates on the chemistry of surface groups (particularly
on oxides) It is also used for the study of the behavior of precursor compounds
during catalyst preparation
Infrared spectroscopy is the subset of spectroscopy that deals with the infrared
region of the electromagnetic spectrum It covers a range of techniques the
most common being a form of absorption spectroscopy As with all
spectroscopic techniques it can be used to identify compounds or investigate
sample composition Infrared spectroscopy correlation tables are tabulated in
the literature
The infrared portion of the electromagnetic spectrum is divided into three
regions the near- mid- and far- infrared named for their relation to the visible
spectrum The far-infrared approximately 400-10 cm-1 (1000ndash30 μm) lying
Chapter 5 Catalysts preparation and characterization
167
adjacent to the microwave region has low energy and may be used for
rotational spectroscopy The mid-infrared approximately 4000-400 cm-1 (30ndash
14 μm) may be used to study the fundamental vibrations and associated
rotational-vibrational structure The higher energy near-IR approximately
14000-4000 cm-1 (14ndash08 μm) can excite overtone or harmonic vibrations The
names and classifications of these sub regions are merely conventions They
are neither strict divisions nor based on exact molecular or electromagnetic
properties
Infrared spectroscopy exploits the fact that molecules have specific frequencies
at which they rotate or vibrate corresponding to discrete energy levels These
resonant frequencies are determined by the shape of the molecular potential
energy surfaces the masses of the atoms and by the associated vibronic
coupling In order for a vibrational mode in a molecule to be IR active it must
be associated with changes in the permanent dipole In particular in the Born-
Oppenheimer and harmonic approximations ie when the molecular
Hamiltonian corresponding to the electronic ground state can be approximated
by a harmonic oscillator in the neighbourhood of the equilibrium molecular
geometry the resonant frequencies are determined by the normal modes
corresponding to the molecular electronic ground state potential energy
surface Nevertheless the resonant frequencies can be in a first approach
related to the strength of the bond and the mass of the atoms at either end of
it Thus the frequency of the vibrations can be associated with a particular
bond type
Simple diatomic molecules have only one bond which may stretch More
complex molecules have many bonds and vibrations can be conjugated
leading to infrared absorptions at characteristic frequencies that may be
related to chemical groups For example the atoms in a CH2 group commonly
Chapter 5 Catalysts preparation and characterization
168
found in organic compounds can vibrate in six different ways symmetrical and
antisymmetrical stretching scissoring rocking wagging and twisting
The infrared spectra of a sample are collected by passing a beam of infrared
light through the sample Examination of the transmitted light reveals how
much energy was absorbed at each wavelength This can be done with a
monochromatic beam which changes in wavelength over time or by using a
Fourier transform instrument to measure all wavelengths at once From this a
transmittance or absorbance spectrum can be produced showing at which IR
wavelengths the sample absorbs Analysis of these absorption characteristics
reveals details about the molecular structure of the sample
This technique works almost exclusively on samples with covalent bonds
Simple spectra are obtained from samples with few IR active bonds and high
levels of purity More complex molecular structures lead to more absorption
bands and more complex spectra The technique has been used for the
characterization of very complex mixtures
According to [10] problems in vibrational spectroscopy include low
transmission at high metal loadings and strong oxide scattering Absorption at
lower wavenumbers often prevents observation of modes such as adsorbate-
metal stretching Fourier Transform (FI-IR) spectrometers offer two
pronounced advantages over dispersive instruments higher energy throughput
and faster data acquisition or higher signal-to-noise ratio Data processing is
easy These features are significant when examining very strongly absorbing
and scattering solids and when following dynamic processes Much IR
transmission work however requires examination of only limited frequency
ranges at medium resolution and computerised dispersive spectrometers may
then be preferable
Chapter 5 Catalysts preparation and characterization
169
Experimental The FT-IR analysis have been made in collaboration with Perugia
University Infrared spectra were measured with a FTIR model IFS113V Bruker
spectrometer resolution of 1 cm-1 in the spectral region 370-5000 cm-1
Fig 58 FTIR model IFS113V Bruker spectrometer
5215 micro-Raman analysis
Raman spectroscopy is more versatile for catalysts characterization and in
comparison with IR spectroscopy it presents at least two important
advantages there is no need of sample preparation and the spectra of water-
metal interfaces are obtained easily and quickly
Raman spectroscopy is a spectroscopic technique used in condensed matter
physics and chemistry to study vibrational rotational and other low-frequency
modes in a system [27] It relies on inelastic scattering or Raman scattering of
monochromatic light usually from a laser in the visible near infrared or near
ultraviolet range The laser light interacts with photons or other excitations in
the system resulting in the energy of the laser photons being shifted up or
down The shift in energy gives information about the phonon modes in the
system Infrared spectroscopy yields similar but complementary information
Typically a sample is illuminated with a laser beam Light from the illuminated
spot is collected with a lens and sent through a monochromator Wavelengths
close to the laser line due to elastic Rayleigh scattering are filtered out while
Chapter 5 Catalysts preparation and characterization
170
the rest of the collected light is dispersed onto a detector Spontaneous Raman
scattering is typically very weak and as a result the main difficulty of Raman
spectroscopy is separating the weak inelastically scattered light from the
intense Rayleigh scattered laser light Raman spectrometers typically use
holographic diffraction gratings and multiple dispersion stages to achieve a
high degree of laser rejection In the past PMTs were the detectors of choice
for dispersive Raman setups which resulted in long acquisition times
However the recent uses of CCD detectors have made dispersive Raman
spectral acquisition much more rapid Raman spectroscopy has a stimulated
version analogous to stimulated emission called stimulated Raman scattering
The Raman effect occurs when light impinges upon a molecule and interacts
with the electron cloud of the bonds of that molecule The incident photon
excites one of the electrons into a virtual state For the spontaneous Raman
effect the molecule will be excited from the ground state to a virtual energy
state and relax into a vibrational excited state which generates Stokes Raman
scattering If the molecule was already in an elevated vibrational energy state
the Raman scattering is then called anti-Stokes Raman scattering A molecular
polarizability change or amount of deformation of the electron cloud with
respect to the vibrational coordinate is required for the molecule to exhibit the
Raman effect The amount of the polarizability change will determine the
intensity whereas the Raman shift is equal to the vibrational level that is
involved This technique is widely applicable The large frequency range (50-
4000 cm-1) makes adsorbate-adsorbent stretching modes accessible Problems
include specimen heating high background fluorescence and low signal
strengths Surface enhanced Raman scattering (SERS) however can give
greatly increased signals in favorable cases eg with rough surfaces or small
Chapter 5 Catalysts preparation and characterization
171
particles of certain compounds It is particularly useful in the studies of
supported monolayer catalysts and adsorbed layers [22]
Experimental The Micro-Raman analysis have been made in collaboration with
Perugia University Micro-Raman spectra were made by an Olympus
microscope mod BX40 connected to an ISA Jobin-Yvon model TRIAX320 single
monochromator resolution 1 cm-1 The exciting source was a Melles Griot
25LHP925 He-Ne laser used in single line excitation mode at 6328 nm The
power focused on the samples was always less than 2 mW The scattered
Raman photons were detected by a liquid-nitrogen cooled CCD Jobin Yvon
Mod Spectrum One Samples were not pre-treated but measured as a power
placed on a microscope slide in this way it is possible to analyse the few
microns grain size and not to focus on those regions where the presence of the
support (silica) was predominant The reproducibility of the spectra was always
controlled sampling different points of the catalyst Through the optical
microscope analysis we also verified that no local degradation occur during
laser irradiation
5216 ICP-MS analysis
ICP-MS (Inductively coupled plasma mass spectrometry) is a type of mass
spectrometry that is highly sensitive and capable of the determination of a
range of metals and several non-metals at very low concentrations It is based
on coupling together an inductively coupled plasma as a method of producing
ions (ionization) with a mass spectrometer as a method of separating and
detecting the ions ICP-MS is also capable of monitoring isotopic speciation for
the ions of choice A plasma is a gas that contains a sufficient concentration of
ions and electrons to make the gas electrically conductive The plasmas used in
Chapter 5 Catalysts preparation and characterization
172
spectrochemical analysis are essentially electrically neutral with each positive
charge on an ion balanced by a free electron In these plasmas the positive ions
are almost all singly-charged and there are few negative ions so there are
nearly equal numbers of ions and electrons in each unit volume of plasma
ICP for spectrometry is sustained in a torch that consists of three concentric
tubes usually made of quartz The end of this torch is placed inside an
induction coil supplied with a radio-frequency electric current A flow of argon
gas (usually 14 to 18 lmin) is introduced between the two outermost tubes of
the torch and an electrical spark is applied for a short time to introduce free
electrons into the gas stream These electrons interact with the radio-
frequency magnetic field of the induction coil and are accelerated first in one
direction then the other as the field changes at high frequency (usually 2712
million cycles per second) The accelerated electrons collide with argon atoms
and sometimes a collision causes an argon atom to part with one of its
electrons The released electron is in turn accelerated by the rapidly-changing
magnetic field The process continues until the rate of release of new electrons
in collisions is balanced by the rate of recombination of electrons with argon
ions (atoms that have lost an electron) This produces a lsquofireballrsquo that consists
mostly of argon atoms with a rather small fraction of free electrons and argon
ions The temperature of the plasma is very high of the order of 10000 K The
ICP can be retained in the quartz torch because the flow of gas between the
two outermost tubes keeps the plasma away from the walls of the torch A
second flow of argon (around 1 lmin) is usually introduced between the
central tube and the intermediate tube to keep the plasma away from the end
of the central tube A third flow (again usually around 1 lmin) of gas is
introduced into the central tube of the torch This gas flow passes through the
centre of the plasma where it forms a channel that is cooler than the
Chapter 5 Catalysts preparation and characterization
173
surrounding plasma but still much hotter than a chemical flame Samples to be
analyzed are introduced into this central channel usually as a mist of liquid
formed by passing the liquid sample into a nebulizer As a droplet of nebulised
sample enters the central channel of the ICP it evaporates and any solids that
were dissolved in the liquid vaporize and then break down into atoms At the
temperatures prevailing in the plasma a significant proportion of the atoms of
many chemical elements are ionized each atom losing its most loosely-bound
electron to form a singly charged ion
The ions from the plasma are extracted through a series of cones into a mass
spectrometer usually a quadrupole The ions are separated on the basis of
their mass-to-charge ratio and a detector receives an ion signal proportional to
the concentration
The concentration of a sample can be determined through calibration with
elemental standards ICP-MS also lends itself to quantitative determinations
through Isotope Dilution a single point method based on an isotopically
enriched standard
Experimental ICP measurements were determined by Inductively Coupled
Plasma-Optical Emission Spectrometers (ICP-OES) Varian 700-ES
Fig 59 Instrument Varian Liberty ICP-OES
Chapter 5 Catalysts preparation and characterization
174
Fig 510 scheme of instrument Varian Liberty ICP-OES
5217 XRD
The XRD analysis have been made in collaboration with Perugia University
The obtained materials were characterized by X-ray powder diffraction (XRD
PANalytical XrsquoPert Pro CuKα radiation) operating at 40 kV and 40 mA step scan
1 min_1 and 1 s counting time in the 2ndash40deg range at room temperature
Fig 511 Instrument XRD PANalytical XrsquoPert Pro CuKα radiation
522 Catalysts characterization results The characterization analyses were performed on the fresh and in some cases
on used catalysts ldquoFresh catalystsrdquo indicate the samples as prepared
ldquoActivated catalystsrdquo indicate the samples charged in the FTS reactor and
reduced using the activation procedure and removed from the reactor ldquoUsed
Chapter 5 Catalysts preparation and characterization
175
catalystsrdquo indicate the samples after their use in the Fischer-Tropsch synthesis
reaction
5221 BET characterization results
The BET results are reported in Table 54
Table 54 BET characterization results
CATALYST Specific Surface area
(m2g)
Co-based
HTlc
Co5 1746
Co10 1147
Co15 720
Co35 584
Co
synthesized
with US
CoSiO2 3600
CoAl2O3 1160
CoTiO2 550
Co-RuSiO2 3460
Co-RuAl2O3 1080
Co-RuTiO2 130
Fe-based
Fe30K20Cu375 TR 160
Fe30K20Cu375-MW1 180
Fe30K20Cu375-MW2 224
Fe30K20Cu375-US1 201
Fe30K20Cu375-US2 210
MW1= Catalyst put it into a kitchen MW and processed in powder MW2= Catalyst put it into MW and suspended in hexane US1= Catalyst suspended in aqueous solution in air atmosphere for 05 h US2= Catalyst sonicated and suspended in hexane in Argon atmosphere for 3h
The composition and specific surface area (SSA) of the HTlc are reported
in Table 54 Note that the SSA decreases with the increase of the
amount of cobalt The relatively large dimensions and high crystallinity
of particles reflect a low specific surface area [28] The surface area of
Co15 and Co35 after the reduction procedure was determined by BET
Chapter 5 Catalysts preparation and characterization
176
method The values obtained are 734 m2 g-1 for the sample Co15 and
783 m2 g-1 for the sample Co35 both higher than the untreated
materials
For the Co and Co-Ru based catalysts synthesized with the help of
ultrasound it is clear how the addition of the promoter show a
diminution of the SSA in every case (CoSiO2 3600 higher than the co-
respective Co-RuSiO2 with 3460 550 and 130 for Co and Co-RuTiO2
and 1160 and 1080 for Co and Co-RuAl2O3) The SiO2 acts as the best
support even in presence of the promoter The TiO2 tends to keep lower
the SSA of the catalyst and the Al2O3 represents an intermediate way of
the supports used in this group of catalysts
The surface area of catalysts is influenced by the method of synthesis
as shown in Table 55 and in Fig 512 Fe-based catalysts treated with
MW and US have higher values of SSA than the traditional ones the
effect of MW and US on SSA increases increasing the US or MW
emitting power
According to [1] The samples sonicated in argon (US2) present the
highest SSA indicating that the US effects in argon atmosphere are
more remarkable The use of this gas enhances cavitation effects
because increases the temperatures of the collapsing bubbles
generated by US [29] The change of catalysts morphology due to US
treatment (SEM analyses) could explain the increase of SSA in these
samples Catalysts prepared by MW show a higher SSA than the
traditional ones 180 and 224 m2 g-1 for the samples Fe30-MW1 and
Fe30-MW2 respectively with a similar increase of about 25 respect
the traditional prepared sample Moreover the surface area of these
Chapter 5 Catalysts preparation and characterization
177
samples seems not to be dependent on the power of the MW
treatment
Fig 512 Fe30K20Cu375 surface area vs different methods of synthesis
5222 TPR characterization results
Co-based catalysts HTLc
As discussed previously the active phase in the FTS is the metallic cobalt while
the HTlc materials contain Co(II) ions randomly dispersed inside the brucitic
layers Therefore in order to have an active catalyst a reduction procedure is
required to form the cobalt particles TPR analyses were performed to study
the reduction process and select the best conditions for the catalyst activation
Fig 513 shows the TPR profile of the samples Co5 Co15 Co35 while Table 55
reports the reduction temperature and the percentage of reduced Co All the
profiles exhibit two regions of reduction the first at lower temperatures
(below 400degC) which is due to the reduction of Co3O4 while the second peak
above 700 degC indicates the presence of hardly reducible species These species
are probably spinel-type mixed oxides formed during the thermal treatment
TPR profiles of CoOx mixed oxides is well described in the literature [30-36]
The reduction profile of Co3O4 in the low temperature region consists in two
peaks corresponding to the reduction of Co3+ to Co2+ and Co2+ to Co0
Chapter 5 Catalysts preparation and characterization
178
According to Alvarez et al [37] these two peaks are well separated for samples
with small particle size while an intermediate particle size causes the
overlapping of the two reduction steps resulting in a complete reduction with
only one maximum at an intermediate temperature (328 degC) The TPR profiles
of our HTlc (Fig 513) are consistent with the latter case Based on the TPR
results (Table 55) the tested catalysts were activated at 350degC for 4 hours
under hydrogen atmosphere in order to reduce the Co ions to metallic Co
Fig 513 TPR profile of the fresh samples Co5 Co10 Co15 Co35 The activation
temperature used in the FTS reactor before the catalytic test is indicated with the
dashed line
Chapter 5 Catalysts preparation and characterization
179
Note that the sample Co15 exhibit the lowest reduction temperature that is
significantly lower than the activation temperature adopted in the FT process
(350degC) A low reduction temperature may favour the presence of catalyst in its
reduced state during the catalytic process The of reduced Co evaluated by
TPR is generally high However these values strongly depend on reduction
conditions (pressure temperature ramp gas flow etc) that are different from
those used in the FT reactor as detailed in the experimental section
Table 55 Reduction temperature and of cobalt reduction of the fresh samples Co5
Co15 Co35
Sample TPR
Tmax (degC) Co Red
Co5 328 58
Co15 278 54
Co35 295 83
Co and Co-Ru catalysts synthesized with US
Table 56 shows the TPR profiles of the samples CoAl2O3 CoSiO2 CoTiO2
and Co-RuAl2O3 Co-Ru SiO2 Co-Ru TiO2
Chapter 5 Catalysts preparation and characterization
180
Table 56 TPR diagrams and values summary for Co and Co-Ru catalysts with US
Catalyst TPR Profile
CoAl2O3
Co SiO2
CoTiO2
Co-RuSiO2
Co-RuAl2O3
Co-RuTiO2
Iron catalysts
Chapter 5 Catalysts preparation and characterization
181
For the supported iron based catalysts three stage of phase transformation
could be identified starting from oxidised form of iron hematite (Fe2O3) to
magnetite (Fe3O4) magnetite to metallic iron (-Fe) [39] It is known [39-40]
that copper promotes the reduction to hematite to magnetite and also the
reduction of magnetite to -Fe to a lesser extent but it needs to be very well
mixed with iron to provide the most favourable promoter effect on the
hematite rarr magnetite phase transformation For what concerns the support
(silica) Jin and Datye [38] observed that the most important effect of silica is
an improvement in the thermal stability of the catalysts in fact the silica
support is very effective at inhibiting the sintering of the iron catalyst
The results of TPR characterization for iron catalysts are reported in Table 57
The number the position and the shape of the peaks agree with literature [38]
In many cases the TPR peaks corresponding to transformations of CuO rarr Cu
and Fe2O3 rarr Fe3O4 were found to overlap and this is the first peaks at low
temperature The second broad peak at higher temperature on the TPR profile
corresponds to the phase transformation of Fe3O4 rarr -Fe The large peak
width for this last transformation indicates this is slow process
TPR analyses show that the metal reduction starts at about 230degC for promoted
catalysts According to Pirola [2] it is clear therefore the role of Cu in the
improvement of iron oxide phases reduction as well known in literature a
suggested mechanism for this promotion effect is the migration of atomic
hydrogen from reduced Cu sites to the iron oxide [38 40]
Therefore the different preparation methods do not influence the peaks
temperature of the reduction steps of the catalytic samples in any case
Chapter 5 Catalysts preparation and characterization
182
Table 57 TPR diagrams and values summary for Fe30K20Cu375 catalysts with different
methods of synthesis
Catalysts Diagrams
Fe30K2Cu375SiO2
Fe30K2Cu375SiO2
(MW2)
Fe30K2Cu375SiO2
(MW1)
Fe30K20Cu375 SiO2 (US1)
305133 467463
800
Temperature degC0 200 400 600 800
800
Sig
na
l (
mV
)
0
200
400
600
800
5223 SEM ndash TEM characterization results
Chapter 5 Catalysts preparation and characterization
183
SEM analyses are reported in Fig 514 (for HTlc) Fig 515 (for Co and Co-Ru
with US) and in Fig 516 (for Fe catalysts)
Cobalt Catalysts
o HTlc
The morphology of the synthesized HTlc was investigated by SEM and TEM
Images of Co15 and Co35 selected as representative samples (Fig 514 a-d)
show that they are constituted by homogeneous aggregates of hexagonal and
platy particles of few hundreds nanometers of thickness and with a
dimensional range between 2-5 μm In TEM micrographs the hexagonal
morphology of HTlc microcrystals is clearer The relatively large dimensions and
high crystallinity of particles reflect a low specific surface area in the range of
6-18 m2g-1 (Table 54) Composition maps of Co15 (Fig 515) obtained with
coupled SEM-EDS analysis highlight the homogeneous Co Zn and Al dispersion
over the entire analyzed spot area without creating single-metal domains
indicating good metal distributions in the samples Similar dispersion
characteristics were obtained for all the samples studied although not
reported here for the sake of brevity
Fig5 14 SEM (left) and TEM (right) images of fresh samples Co15 (ab) and Co35 (cd)
Chapter 5 Catalysts preparation and characterization
184
Fig5 15 SEM image of fresh sample Co15 and the corresponding EDS images of the
metals Al (red) Co (white) and Zn (pink)
SEM and TEM images of two activated samples are reported in Fig 16a-d The
results indicate that the material keeps the original morphology with hexagonal
crystals of micrometric dimensions At higher magnification (TEM images) the
segregation of dense particles homogeneously distributed on the surface and
having dimensions of about 8 nm probably due to metallic Co was evident
[41]
Fig 516 SEM (left) and TEM (right) images of activated Co15 (ab) and Co35 (cd)
SEM images of Co5 Co15 and Co35 after the catalytic run at 260degC are shown
in Fig 517 Samples containing Zn (Co5 and Co15) reveal the presence of a
Chapter 5 Catalysts preparation and characterization
185
nanometric phase crystallized on the catalyst surfaces The absence of this
nanometric phase on Co35 surface (which does not contain Zn) may indicate
the presence of ZnO according to the XRD pattern (it will be show later)
Fig517 SEM images of Co5 (ab) Co15 (cd) Co35 (ef) after catalytic run at
260degC and 20 bar and at different magnifications
o Co and Co-Ru synthesized with US The Fig 518 show the SEM
analyses of the samples with and without the presence of Ru
The chemical effect of US arises from acoustic cavitation ie the
formation growth and implosive collapse of bubbles in a liquid
Some of the interesting features resulting from the application
of sonication as a synthetic method are the nanoparticles
Chapter 5 Catalysts preparation and characterization
186
preparation showing a more uniform size distribution higher
surface area and a more controlled phase composition
(Fig518)
Fig 518 SEM analyses for Co based catalysts with US Magnification 2000X
Iron Catalysts
SEM analyses are essential to evaluate the morphology of catalysts with high
loading of iron and to control the metal dispersion The iron covers the surface
of silica in a progressive level with its increase and it is well distributed in the
more loaded catalyst too [40]
Chapter 5 Catalysts preparation and characterization
187
The aggregates of iron with spherical shape are regularly distributed on the
support In the case of the catalysts prepared with the step of ultrasound it
can be seen an uniform layer of iron on SiO2 The spherical shape aggregates
are substituted by this iron layer The catalyst morphology and the metal
dispersion are similar for the two US samples [43]
SEM analyses (Fig 519) have been the key to both evaluate the morphology of
all the prepared catalysts and observe their metal distribution (using EDX
analysis) Notwithstanding this general trend both the morphology and the
shape of iron aggregates strongly depend on preparation method In Fig 519
SEM analysis of samples through different preparation methods are reported
In the traditional prepared sample (Fig 519a) it is possible to observe Fe
spherical shape aggregates on the bare silica surface Iron is present only in
these particles and coverage of the support is not complete The same
morphology is present in the MW prepared sample (Fig 519b) On the
contrary on US prepared ones (Fig 519c (air) and 519d (argon)) there is a
uniform layer of iron on SiO2 The support in fact is not easily visible due to its
complete coverage as confirmed by SEMndashEDX analyses The spherical shape
aggregates are substituted by this iron layer both the catalyst morphology and
the metal dispersion are similar for the two US samples but completely
different with both the traditional and the MW ones
It is even more interesting the comparison between samples prepared by
different sonication time for example Fe30-US2 (Fig 519c) and Fe30-US1 (Fig
519d) when the US treatment is performed for 05 h the surface seems to be
covered by Fe small leafs that are completely faded when sonication is
prolonged for 3 h and in their place only crashed Fe clusters are present [1]
Chapter 5 Catalysts preparation and characterization
188
a) Traditional b) MW2
c) US1 d) US2
Fig 519 SEM analyses for iron catalysts Magnification 2000X
5224 XRD and micro-RAMAN characterization results
Cobalt Catalysts
o For the HTlc the XRD and micro-RAMAN analyses Figure 520
shows the XRD patterns of the samples listed in Table 51 The
interlayer distance of 89 Aring determined from the first XRD
reflection is compatible with the presence of nitrate between
the sheets [43]
Chapter 5 Catalysts preparation and characterization
189
Fig 520 XRD pattern of the fresh samples (a) Co5 (b) Co10 (c) Co15 and (d) Co35
Activated HTlc were first characterized by XRD As an example the XRD pattern
of activated Co15 is reported in Fig 521 The pattern shows the presence of
very poorly crystalline ZnO and a spinel phase such as Co3O4 CoAl2O4 andor
ZnAl2O4 (note that mixed-oxide spinel phases show very similar XRD patterns
irrespective of their composition) Moreover the reflection at 43deg 2has been
assigned to a CoO phase with very low crystallinity and no metal aggregation is
observed The sample after the reduction treatment does not show metallic Co
phases indicating the presence of active metal atoms homogeneously
dispersed at the nanometer level [44] According to Jong et al [45] and Den
Breejenet et al [46] cobalt-based catalysts need large particle size of the active
species to create optimal domains of active sites because the activity drops for
particles smaller than 6 nm
Chapter 5 Catalysts preparation and characterization
190
Fig 521 XRD pattern of activated Co15 ZnO Co3O4 CoAl2O4 ZnAl2O4 sect CoO
In order to better understand the stability of the materials XRD patterns of
sample Co15 after the catalytic tests at two different temperatures (235degC and
260degC) were collected (Fig 522) At the lower temperature (Fig 522 a) the
pattern is close to that recorded just after the reduction process (Fig 521)
Therefore we can hypothesize that the catalyst does not change as a
consequence of the FTS process On the other hand the XRD pattern of the
catalyst recovered after the reaction at 260degC (Fig 522b) shows more
crystalline ZnO and spinel phase and the strong reduction of the peak assigned
to CoO This may indicate that during the FTS process at high temperatures
cobalt ions crystallized into a spinel phase
Chapter 5 Catalysts preparation and characterization
191
Fig522 XRD pattern of used Co15 after catalytic runs a) at 235degC and
20 bar and b) at 260degC and 20 bar ZnO Co3O4 CoAl2O4 ZnAl2O4 sect
CoO
Iron catalysts
The XRD and micro-RAMAN analyses were made to identify the iron phase
after the calcination treatments A Raman spectrum (Fig 523a) and an XRD
pattern (Fig 523b) for Fe30K2Cu375SiO2 are reported
Chapter 5 Catalysts preparation and characterization
192
Fig 523 a) Micro-Raman analysis and b) XRD for the Fe30K2Cu375SiO2 catalyst
Comparing these results with the tables reported in literature [47-48] for the
assignment of the peaks it is possible to conclude that the iron after calcination
is present as hematite Fe2O3 as expected and as reported in literature [39]
5255 ICP characterization results ICP analysis was made to verify the catalysts composition
Cobalt based catalyst
o HTlc In Table 58 the results are reported
Table 58 ICP characterization results for Co catalysts (HTlc)
HTlc
Atomic percentage in solution Basic Formula
Zn Co Al
Co5 55 15 30 [Zn057
Co010
Al033
(OH)2](NO
3)033
middot05 H2O
Co10 45 25 30 [Zn045
Co021
Al034
(OH)2](NO
3)034
middot05 H2O
Co15 35 35 30 [Zn039
Co032
Al029
(OH)2](NO
3)029
middot05 H2O
Co35 - 70 30 [Co067
Al033
(OH)2](NO
3)033
middot05H2O
Chapter 5 Catalysts preparation and characterization
193
o Co and Co-Ru with US In Table 59 the results are reported
Table 59 ICP characterization results for Co catalysts
Sample Co wt Ru wt
Co10 80 -
Co10Ru01 80 008
In general these results indicate the composition of catalysts is in good
agreement with the theoretical values
Iron based catalysts In Table 510 the results are reported
Table 510 ICP characterization results for Fe catalysts
Sample Fe wt K wt Cu wt
Fe30K20Cu375 314 19 40
5226 XRD and micro-RAMAN characterization results
Cobalt Catalysts
o For the HTlc the XRD and micro-RAMAN analyses
In order to better understand the behaviour of the materials after activation
FT-IR spectra of the sample Co15 (as a representative sample) calcined and
activated and Co3O4 have been registered (Fig 526) The spectrum of Co15
showed the typical absorption bands of the nitrate anion at 1377 cm-1 present
in the interlayer region of HTlc After calcination this band disappeared due to
nitrate degradation and the spectrum presented the typical absorptions of
Co3O4 spinel phase at 667 cm-1 and 566 cm-1 The activation process leads to
the formation of a material with very wide bands attributed to the Co3O4
phase
Chapter 5 Catalysts preparation and characterization
194
Fig 524 FT-IR spectra of the fresh and activated Co15 and of the reference Co3O4
References
[1] C Pirola C L Bianchi A Di Michele P Diodati D C Boffito V Ragaini Ultrasonic Sonochem 17610-616 (2010) [2] C Pirola PhD 2007-2008 Novel supported iron based Fischer-Tropsch catalysts Preparation characterization and applications [3] GPVaan Deer Laan AACMBeenackers CatalRev-SciEng41 (3amp4) (1999) 255 [4] YJin AKDatye Journal of catalysis 196 (2000) 8 [5] Costantino U Marmottini F Nocchetti M Vivani R Eur J Inorg Chem 1998 101439 -1446 [6] C Pirola CL Bianchi A Di Michele P Diodati S Vitali V Ragaini Catal Lett 131 (2009)294-304
Chapter 5 Catalysts preparation and characterization
195
[7] G Biffi Gentili M Linari I Longo A Ricci A IEEE Transactions on microwave theory and techniques 57 (9-2009) 2268-2275 [8] BToukoniitty JPMikkola DYuMurzin TSalmi Applied Catalysis A General 279 (2005) 1 [9] KSSuslick Sonocatalysis Handbook of Heterogeneous Catalysis VCH Verlagsgesellschaft mbH Weinheim Germany (1997) 1350 [10] BToukoniitty JPMikkola DYuMurzin TSalmi Applied Catalysis A General 279 (2005) 1 [11] WBonrath Ultrasonics Sonochemistry 12 (2005) 103 [12] CLBianchi VRagaini Catalysis Letters 95 (2004) 61 [13] CLBianchi FMartini VRagaini Ultrasonics Sonochemistry 82 (2001) 131 [14] Zhao R Goodwin JG Jr Jothimurugesan K Gangwal SK Spivey JJ (2001) Ind Eng Chem Res 401065 10 [15] Yang Y Xiang HW Tian L Wang H Zhang CH Zhong B Li YW (2005) Appl Catal A 284105 [16] Suo Haiyun Zhang Chenghua Wu Baoshan Xu Jian Yang Yong Xiang Hongwei Li Yongwang Cat Today Volume 183-1 (2012) 88ndash95 [17] Donatti DA Ruiz AI Vollet DR (2002) Ultrason Sonochem 9133 [18] Yang Y Xiang HW Tian L Wang H Zhang CH Zhong B Li YW (2005) Appl Catal A 284105 [19] Fadoni M and Lucarelli University of Milan and CE Instruments (Thermoques SpA) [20] F M NELSEN and Ff EGGERTSEN Shell Development Co Emeryville Calif ANALYTICAL CHEMISTRY VOL 30 NO 8 AUGUST 1958 1387-1390 [21] 11 S Brunauer P H Emmett and E Teller J Am Chem Soc 60 (1938) 309 [22] JHaber JHBlock and BDelmon Pureampappl Chem 67 Nos 89 (1995) 1257 [23] SDRobertson BDMcNicol JHDe Baas SCKloet JWJenkins JCatal 37 (1975) 424 [24] Von Ardenne Manfred Das Elektronen-Rastermikroskop Theoretische Grundlagen Zeitschrift fur Physik 108 (1938) 553 [25] Von Ardenne Manfred Das Elektronen-Rastermikroskop Praktische Ausfuumlhrung Z Techn Phys 108 (1938) 407 [26] Ludwig Reimer Helmut Kohl Springer Series in Optical Sciences 36 fifth edition 2008 Transmission Electron Microscopy Physics of Image Formation [27] Gardiner DJ (1989) Practical Raman spectroscopy Springer-Verlag ISBN 978-0387502540 [28] A Di Fronzo C Pirola A Comazzi F Galli CL Bianchi A Di Michele R Vivani M Nocchetti M Bastianini DC Boffito Fuel 119 (2014) 62-69
Chapter 5 Catalysts preparation and characterization
196
[29] TJ Mason JP Lorimer Sonochemistry Ellis Horwood Chichester 1988 p 58 [30] Bianchi CL Catal Lett 2001 76(3ndash4)155-159 [31] Lin HY Chen YW Li C Thermochim Acta 2003 40061ndash67 [32] Lin HY Chen YW Mater Chem Phys 2004 85171ndash175 [33] Sexton BA Hughes AE Turney TW J Catal 1986 97(2)390ndash406 [34] Kumar N Payzant EA Jothimurugesan K Spivey JJ Phys Chem Chem Phys 2011 1314735ndash14741 [35] Tsakoumis NE Dehghan R Johnsend RE Voronov A Van Beek W Walmsley JC Borg Oslash Rytter E Chen D Roslashnning M Holmen A Catal Today 2013 20586ndash93 [36] Tsakoumis NE Roslashnning M Borg Oslash Rytter E Holmen A Catal Today 2010 154162ndash182 [37] Alvarez A Ivanova S Centeno MA Odriozola JA Appl Catal A 2012 431-4329-17 [38] YJin AKDatye Journal of catalysis 196 (2000) 8 20 [39] DBBukur KOkabe MPRosynek CPWang DJRao KRPM and GPHuffman JCatal 155 (1995)353 [40] YYang HXiang YXu LBai YLi ApplCatalA 266 (2004) 181 [41] 32 Rudolf C Dragoi B Ungureanu A Chirieac A Royer S Nastro A Dumitriu E Catal Sci Technol DOI 1011039C3CY00611E [42] C Pirola CL Bianchi A Di Michele S Vitali V Ragaini Catal Comm 10 823 (2009) [43] Iyi N Fujii K Okamoto K Sasaki T Appl Clay Sci 2007 35218-227 [44] CL Bianchi C Pirola DC Boffito A Di Fronzo A Di Michele R Vivani M
Nocchetti M Bastianini S Gatto Co-Zn-Al based hydrotalcites as catalysts for
Fischer-Tropsch process Proceeding of DGMK Conference 2011
CatalysisInnovative Applications in Petrochemistry and Refining 4-6 October
2011 Dresden Germany ISBN 978-3-941721-17-3
[45] Leendert G Bitter JH Kuipers HPCE Oosterbeek H Holewijn JE Xu X
Kapteijn F Jos van Dillen A Krijn P J Am Chem Soc 2006 1283956-3964
[46] 31 Den Breejen JP Radstake PB Bezemer GL Bitter JH Froslashseth V Holmen A Krijn P J Am Chem Soc 2009 1317197-7203 [47] Thickett and Oldyha JThermAnalCal 80 (2005) [48] MALegodi Dde WaalDyes and Pigments 74 (2007) 161
197
Chapter 6 High Fe Loaded Supported Catalysts for Biosyngas Fischer ndash Tropsch Conversion experimental and simulation results 6 Development of the kinetic model One of the objectives of this research work was the development of a kinetic
model for the synthesis of FT in collaboration with the Politecnico di Milano
This model based on experimental data obtained in the pilot plant using iron
based catalyst (Fe30K20Cu375) at different temperatures and different H2CO
ratios allows to obtain and simulate the performance of these catalysts at
temperatures and ratios of incoming flows feeding different
The modeling work has not been limited to the laboratory scale since it is
possible to predict the trend of the reaction kinetics using these types of
catalysts in reactors with much greater volumes and integrated in an entire
industrial process such as the use of biosyngas for FT synthesis obtained from
biomass
61 Regression of kinetic constants After obtaining the experimental data it is necessary to regress them With the
regression we could obtain the respective kinetic constants
The model is based on the fact that both reactions the FT reactions and WGS
are active therefore we will need to regress the rate constants of both
reactions which we call kFT (kinetic constant of the FT reaction) and kWGS
(kinetic constant of the WGS reaction)
The equations that express the reaction rate of the two reactions are [1] For the FT reactions
Chapter 6 High Fe Loaded Supported Catalysts for Biosyngas Fischer ndash Tropsch Conversion experimental and simulation results
198
For the WGS reaction
From these equations we note that the reaction rate in both cases is a
function of the partial pressures of the reactants (CO and H2) of the products
(H2O and CO2) of the constants (aFTWGS e bFTWGS) and the equilibrium constant
Kp expressed as
From the regression of the reaction rate constants is obtained the K0i These
values are correlated to the kFTWGS through the equation
The parameter values of the previous reports were obtained with a regression
using the MATLAB software based on the method of least squares from the
experimental data using the original coefficients K0FT k0WGS aFT aWGS bFT bWGS
as values of the first iteration [2] The software allows the regression of k0i
establishing an objective function that must be minimized as much as possible
(10-6 tolerance basis of MATLAB)
There was no regression of the activation energy of the two reactions but kept
constant as reported in literature [2]
The probability of growth of the hydrocarbon chain is instead given by the
correlation developed by Lox and Froment [3-4] or iron based catalysts
Chapter 6 High Fe Loaded Supported Catalysts for Biosyngas Fischer ndash Tropsch Conversion experimental and simulation results
199
For the regression of the data there were not taken into account the energy
balances because we consider an isothermal catalytic bed The drop pressure is
neglected since it can be assumed that in the whole catalytic bed the pressure
is constant at 20 bar and the efficiency of the catalyst was considered unitary
On the contrary these aspects must be taken into account if we are working
with industrial volumes
62 Mass Balance In the kinetic model have been fully taken into account (even on lab-scale) the
mass balances shown in the equations below
Mass balance equations in the gas phase
Where ε degree of vacuum
a catalyst surface per unit volume
(Pis-Pib) pressure difference of the reactants between the bulk and the
solidrsquos surface
ν stoichiometric coefficient
r reaction in homogeneous phase
Chapter 6 High Fe Loaded Supported Catalysts for Biosyngas Fischer ndash Tropsch Conversion experimental and simulation results
200
If it does not consider gas-phase reactions but only on the surface of the
catalyst
Mass balance on the solid
Where ρ density of the catalyst
Mi molecular weight
It gets
Where is the total mass flow and is the mass fraction of i component
63 Energy Balance As previously mentioned in the modeling of laboratory scale is not considered
any heat balance in the catalytic bed because it is considered as isothermal
one however in the case of modeling a reactor in industrial volumes the
energy balance will be addressed in this way
Energy balance equation in the gas phase for a plug-flow reactor (PFR)
Chapter 6 High Fe Loaded Supported Catalysts for Biosyngas Fischer ndash Tropsch Conversion experimental and simulation results
201
Where Cpi Specific heat of the i species
h Laminar coefficient
(Ts-T) the temperature difference between the surface and the bulk
∆Homk entalphy of the K-esimo reaction in gas phase
U overall heat transfer coefficient
If there are no gas-phase reactions
Energy balance on the solid
64 Pressure variation
As for the energy balance also the P has not been taken into account in the
modeling however in the case of simulations of kinetic tests over PFR reactors
in industrial volumes it will be necessary to take them into account because
before and after the catalytic bed there will be a difference of pressure
The equation that allows to calculate the pressure drop in a fixed bed reactor is
the Ergunrsquos equation
Chapter 6 High Fe Loaded Supported Catalysts for Biosyngas Fischer ndash Tropsch Conversion experimental and simulation results
202
With
Where u velocity surface
Re Reynolds number
Dp diffusion coefficient
Ai inlet area of the tube
65 Catalyst Efficiency The efficiency of the catalyst considered unitary to simplify the model on
laboratory scale can not be considered as such in real systems and especially
of large reactors where the problems of diffusion of the reactants on the
catalyst surface are no longer negligible
The efficiency of the catalyst is expressed with the equation
Where T Bulk temperature
Ts surface temperature
Pi pressure of i species in the bulk
Pis pressure of the i species in the surface
Vp volume of the particle catalyst
Chapter 6 High Fe Loaded Supported Catalysts for Biosyngas Fischer ndash Tropsch Conversion experimental and simulation results
203
References
[1] WH Zimmerman DB Bukur Reaction kinetics over iron catalysts used for
Fischer-Tropsch synthesis The Canadian journal of chemical engineering (68)
1990 p 292-301
[2] Ahmad Rafiee Optimal design issues of a gas-to-liquid process Thesis for
the degree of Philosophy Doctor Norwegian University of Science and
Technology Faculty of Natural Sciences and Technology Chemical Engineering
Department2012
[3] ES Lox GF Froment Kinetics of the Fischer-Tropsch reaction on a
precipitated promoted iron catalyst 2 Kinetic modeling Ind Eng Chem Res
(32) 1993 p71-82
[4] ES Lox GF Froment Kinetics of the Fischer-Tropsch reaction on a
precipitated promoted iron catalyst 2 Kinetic modeling Ind Eng Chem Res
(32) 1993 p 61-70
204
Chapter 7 Fischer Tropsch runs results and discussion
In this chapter the experimental results concerning the FT runs will be
presented in term of CO conversion and of products selectivity toward CO2
CH4 light hydrocarbons (lt C7) and heavy hydrocarbons (gt C7) To join all these
data the parameter ldquoyield C2+rdquo will be reported too This parameter is defined
in the following equation
Yield C2+ = CO conversion x (selectivity ltC7 +selectivity gtC7) (1)
then the selectivity to CO2 and CH4 (undelivered products) is not taken into
account by this parameter The data concerning all the products distribution
ie selectivity for each carbon atom number have been collected in this PhDrsquos
research work for all the catalysts and all the experimental conditions but for
practical space of reasons they are not here reported
The results could be divided into two groups The experimental runs with two
kind of catalytical systems it means cobalt based catalysts and iron based
catalyst (kinetic runs) and the development of a kinetic model for the sample
Fe30K2Cu375 The selection is related to the better performance in terms of
stability
More in detail
Kinetic Runs
Cobalt based catalysts
HTlc The activated samples were tested at different temperatures in
the FTS plant following the procedure reported in the experimental
section In Fig 71 the CO conversion vs the reaction temperature is
Chapter 7 Fischer Tropsch runs results and discussion
205
reported for all the catalysts while the products selectivity is displayed in
Table 71
Fig 71 molar CO conversion to Co5 () Co10 () Co15 (diams) Co35 () obtained at
different reactor temperatures after 24 hours of reaction
As expected for each catalyst the activity is strongly influenced by the reaction
temperature the higher the temperature the higher the CO conversion but
also the selectivity towards CO2 CH4 and light hydrocarbons is favored by a
higher temperature The CO conversion is similar for Co5 and Co10 while it is
higher for the two samples with a larger amount of cobalt ie Co15 and Co35
In particular Co15 exhibits the highest CO conversion at all the selected
temperatures In FTS it is fundamental to obtain low quantities of CH4 and CO2
(undesired products) to favor the formation of higher hydrocarbons For this
reason temperatures in the 220-235degC range are more suitable than the higher
ones
Moreover Table 71 shows that Co15 exhibits the highest CO conversion and
the highest C2+ total yield (without considering CH4 and CO2 see note in Table
71) also at the lowest temperature (220degC) which is so important from an
economical point of view This result confirms that Co15 is the best performing
catalyst obtained in this part of the study
Chapter 7 Fischer Tropsch runs results and discussion
206
Table 71 FTS products selectivity at different reactor temperatures
Sample Temperature
(degC)
Products Selectivity C2+
Yield CO2 CH4 leC7 gtC7
Co5 220 03 29 33 934 165
235 03 59 104 834 194
245 11 85 127 776 224
260 19 141 160 679 300
Co10 220 32 26 98 844 155
235 38 49 143 769 178
245 33 60 154 753 218
260 81 163 413 343 262
Co15 220 14 101 17 705 467
235 81 262 473 185 498
250 178 177 443 202 491
Co35 220 14 39 103 844 250
235 18 96 234 651 395
245 51 257 656 105 473
leC7 all the hydrocarbons in the range C2-C7 gtC7 all the hydrocarbons greater than C7 Product lsquolsquoirdquo selectivity = (moles C in product i) (converted moles C) x 100 C2+ yield = CO conversion x (selectivity leC7 + selectivity gtC7) x10-2
The obtained data suggest the possibility of using synthetic hydrotalcites as Co-
based catalysts for FTS and pursuing subsequent studies on the same subject
Similar trends were obtained in ldquoUnit 2rdquo at lower temperatures and lower
amount of cobalt (Co10 and Co15) (Table 72)
Chapter 7 Fischer Tropsch runs results and discussion
207
The stability of these catalysts in the operating conditions adopted in the
catalytic tests (P le 20 MPa and T le 350degC) was evaluated by comparative
analysis between fresh samples and samples discharged from the reactor
maintained at high pressures and temperatures
Table 72 FTS products selectivities at different reactor temperatures Two different
pilot plants with the same flow sheet
Sample Temp
(degC)
CO
Conv
()
Products Selectivity C2+
Yield CO2 CH4 leC7 gtC7
Co10
(Unit 1)
220 170 32 26 98 844 155
235 207 38 49 143 769 178
245 248 33 60 154 753 218
260 358 81 163 413 343 262
Co10
(Unit 2)
220 147 01 12 53 935 145
235 180 15 32 73 880 171
245 891 140 291 393 176 506
Co35
(Unit 1)
220 264 14 39 103 844 250
235 446 18 96 234 651 395
245 621 51 257 656 105 473
Co35
(Unit 2)
220 473 50 224 296 431 343
235 768 162 205 288 345 485
245 998 154 241 322 282 604
leC7 all the hydrocarbons in the range C2-C7gtC7 all the hydrocarbons greater
than C7Product lsquolsquoirdquo selectivity = (moles C in product i) (converted moles C) x
100 C2+ yield = CO conversion x (selectivity leC7 + selectivity gtC7) x10-2
It is important to highlight that the aim of this work was the evaluation of the
possibility to use HTlc as a new kind of catalyst for the Fischer-Tropsch process
rather than a quantitative comparison with other kinds of traditional FTS
catalysts Moreover a reliable comparison between HTlc and traditional cobalt
Chapter 7 Fischer Tropsch runs results and discussion
208
based FTS catalysts is very difficult due to the different structural and
morphological features (surface area metal dispersion morphological
structure reduction properties porosity and so on) which are involved in the
very complex catalytic systems for the FTS Nevertheless from a qualitative
point of view it is possible to conclude that this new kind of catalytic materials
for FTS process give results fully comparable with those obtained by traditional
supported cobalt As general behaviour it is possible to state that cobalt
catalysts are characterized by high CO conversion high heavy hydrocarbons
selectivity and low light hydrocarbons CH4 and CO2 selectivity The wide
literature concerning traditional Co-based catalysts is rich of different examples
that depending on several operative parameters and preparation procedure
give different FTS results but always following the general trends reported by
the previous papers Some exhaustive examples are shown in a recent review
of Qinghong et al [1] and Muthu et al [2]
Co and Co-Ru
The use of ultrasound (US) might be very efficient to optimize the dispersion of
a so high metal charge as already verified in our laboratory in the past [3-4]
This special type of synthesis should give at the catalyst a particular structure
with a high surface area and a high metal dispersion that improves its activity
towards the synthesis of Fischer-Tropsch In the case of cobalt supported
catalysts a simple ultrasound step has been added in the catalyst preparation
As regard the results presented in table 73 it can be seen how all the samples
resulted active in FTS in particular the bimetallic samples give high CO
conversion with a noteworthy selectivity towards heavy hydrocarbons The
Chapter 7 Fischer Tropsch runs results and discussion
209
support plays a crucial role and in particular TiO2 based samples are the most
active
Moreover Table 73 shows that Co-RuSiO2 exhibits the highest selectivity
towards heavy hydrocarbons and the highest C2+ total yield (without
considering CH4 and CO2 see note in Table 73) This result confirms that Co-
RuSiO2 is the best performing catalyst obtained in this part of the study
Table 73 CO Conversion C2+total yield CH4 CO2 light hydrocarbon and heavy
hydrocarbon selectivity of CoCo-Ru based catalyst at T=255degC
Catalyst
CO
Conv
()
C2+
total
yield
Selectivity ()
CH4 CO2 ltC7 gt C7
CoTiO2 28 23 5 14 10 71
CoSiO2 6 5 19 6 23 52
CoAl2O3 8 6 13 7 19 61
Co-RuTiO2 98 73 18 8 14 60
Co-RuSiO2 94 82 9 4 8 79
Co-RuAl2O3 84 73 11 2 12 75
As we have seen from the BET and TPR analysis the support and the promoter
play a key role in the performance of the catalyst because they are responsible
for the modification of some key parameters such as surface area and the
metal dispersion
Iron based Catalysts
With regard to the treatment with the help of US (see table 74) it can be
concluded that the sonication of an aqueous mixture salts and precursors of
support (US1) is preferable instead of to the calcined catalyst suspended in
Chapter 7 Fischer Tropsch runs results and discussion
210
non-polar solvent such as hexane (US2) With regard to treatment with MW
(see table 74) there were obtained better results in term of CO conversion
with the powder catalyst treated directly in the MW (MW1) while the test
conducted by suspending the catalysts in hexane and then treated in a MW
reactor (MW2) for an hour did not give valid results The best FTS results in
term of C2+ yield (41) has been obtained using MW1 while in tem of CO
conversion (58) using US1 All of them gave FTS results better than the
traditional one Itrsquos evident that the use of US or MW optimizes the catalytic
performance in accord with previous similar results [4]
In agreement with [5] the FTS results show that TEOS as silica source is
favorable for the enhancement of the FTS activity
Table 74 Catalytic Results of Fe30K20Cu375 Different preparation techniques Support
SiO2 Diluting Material α-Al2O3 T=220degC
Preparation CO Conv ()
C2+
Total yield
Selectivity ()
CO2
CH4
lt C7
gt C7
TR 49 32 27 7 22 44
MW1 52 41 17 5 18 60
MW2 32 24 17 8 27 48
US1 58 38 29 6 22 43
US2 36 25 22 9 30 39
Co-precipitation
38 32 2 13 28 57
leC7 all the hydrocarbons in the range C2-C7 gtC7 all the hydrocarbons greater than C7 Product lsquolsquoirdquo selectivity = (moles C in product i) (converted moles C) x 100 C2+ yield = CO conversion x (selectivity leC7 + selectivity gtC7) x10-2
The co-precipitation test was made at T=250degC and TEOS as a support
Iron based Catalysts
Chapter 7 Fischer Tropsch runs results and discussion
211
To work with this part it is important to know the effect of the H2 CO ratio in
the feeding gas The FTS for the production of liquid hydrocarbons from
synthesis gas has become important as the planet faces exhaustion of its
petroleum reserves in the near future The use of coal or biomass to
manufacture synthesis gas is attractive in view of its vast reserves However
synthesis gas manufactured from coal or biomass typically has a low H2CO
ratio (about 07) while the stoichiometry of the reaction requires an H2CO
ratio of about 20 Iron catalysts can make up this deficit with their high WGS
activity [6]
This important characteristic of iron based catalysts is essential for their
applications
Fig 72 show that the activity of catalyst is good enough using also feeding
ratio between 10 and 20
Fig 72 CO conversion or selectivity vs H2CO feeding ratio for Fe30K20Cu375
catalyst at T=250degC
Higher the H2 CO ratio is higher the CO conversion becomes but the heavy
hydrocarbons is the highest for the stoichiometric ratio
In the present work there were made some tests with Fe30K20Cu375 catalyst by
feeding mixtures with a ratio H2CO between 05 and 20 in order to optimize
Chapter 7 Fischer Tropsch runs results and discussion
212
the activity selectivity and the lifetime of this kind of FT catalyst in work
conditions of biosyngas feeding
On the basis of the collected data a rigorous simulation of the FT synthesis
reactor has been developed for different purposes (i) to support the
experimentations and their planning (ii) to predict the reactor yield and
conversion (iii) to optimize the performance of the reactor system with
different operating conditions and (iv) to calculate novel reliable kinetic
parameters based on the experimental data fitting by means of model-based
nonlinear regression techniques To do so the FT reactor is modeled as a
catalytic plug-flow reactor using mass and energy balances and reaction
kinetics for Fe-based catalyst defined by Zimmerman and Bukur as explained in
chapter 6 [7] leading to an ordinary differential equation system with
structured Jacobian Lumping techniques have been used to model heavy
hydrocarbons The system is solved by means of dedicated solvers to handle
stiffness and nonlinearities of heterogeneous reactive systems [8]
Typical H2CO ratio of syngas manufactured from coal or biomass are between
07-12 and the Fig 72 show that the activity of catalyst is good enough using
also feeding ratio between 10 and 20
In the table 75 there is the data concerning the carbon monoxide conversion
() and the selectivity towards undesired products (CO2 and CH4) and lighter
and heavy hydrocarbons of Fe-based catalyst The CO conversion increase with
the increase of the H2CO ratio because of the proximity of the stoichiometric
required of the reaction The selectivities are constant with the variations of
H2CO ratio Instead of that the C2+ yield increase with the variations of H2CO
ratio A comparison at T=250degC show that the best performance in terms of CO
conversion C2+ and selectivity towards heavy hydrocarbons is given by working
with a H2CO ratio of 2 (stoichiometric required of the reaction)
Chapter 7 Fischer Tropsch runs results and discussion
213
These data were used to propose a suitable kinetic model for the FTS using a
math program in collaboration with the Politecnico di Milano Some hypothesis
were taken into account to prepare the kinetic model (FT reactor is modeled as
a catalytic plug-flow reactor using mass and energy balances and reaction
kinetics for Fe-based catalyst defined by Zimmerman and Bukur [7-8] ∆P = 0
isothermic catalytic bed FT reaction and WGS are both active on the catalyst)
The kinetic parameters were calculated and compared with the experimental
data The first results show a good fitness of the experimental data
Table 75 FTS products selectivities at different H2CO ratio and reactor
temperatures of Fe30K2Cu375
Selectivity ()
H2CO T(degC) CO
Conversion ()
C2+ total yield
CO2 CH4 ltC7 gtC7
21 220 85 69 11 8 22 59
21 235 211 175 11 6 20 63
21 250 498 393 16 5 19 60
21 260 567 425 19 6 20 55
151 250 388 299 18 5 17 60
151 260 463 338 22 5 17 56
11 250 23 182 17 4 16 63
11 260 389 272 26 4 16 54
leC7 all the hydrocarbons in the range C2-C7 gtC7 all the hydrocarbons greater than C7 Product lsquolsquoirdquo selectivity = (moles C in product i) (converted moles C) x 100 C2+ yield = CO conversion x (selectivity leC7 + selectivity gtC7) x10-2
In Fig 73 is presented a comparison between the experimental data obtained
in the laboratory and the data obtained using the kinetic model The first two
Chapter 7 Fischer Tropsch runs results and discussion
214
columns represent the conversion of hydrogen and carbon monoxide while in
the other columns are represented the molar fraction of hydrogen carbon
monoxide water methane and lump C2 C3-4 C5-10 C11 + As a first
approximation it can be seen that the kinetic model present a good fitness
regard to the experimental data
Fig 73 Comparison between experimental data and kinetic model
References
[1] Qinghong Z Weiping D Ye W Review Recent advances in understanding the key catalyst factors for Fischer-Tropsch synthesis J Ener Chem 2013 2227ndash38
Chapter 7 Fischer Tropsch runs results and discussion
215
[2] Muthu KG Gary J Wilson DS Burtron HD FischerndashTropsch synthesis Activity of metallic phases of cobalt supported on silica Catal Today 2013 21513ndash 17 [3] CLBianchi VRagaini Catalysis Letters 95 (2004) 61-65 [4] C Pirola C L Bianchi A Di Michele P Diodati D C Boffito V Ragaini Ultrasonic Sonochem 17 (2010) 610 [5] Suo Haiyun Zhang Chenghua Wu Baoshan Xu Jian Yang Yong Xiang Hongwei Li Yongwang A comparative study of FeSiO2 FischerndashTropsch synthesis catalysts using tetraethoxysilane and acidic silica sol as silica sources Catalysis Today Volume 183 Issue 1 20 March 2012 Pages 88ndash95 [6] MDShroff AKDatye Catalysis Letters 37 (1996) 101
[7] WH Zimmerman DB Bukur Can J Chem Eng 68 (1990) 292-301 [8] F Manenti I Dones G Buzzi-Ferraris HA Preisig Ind Eng Chem Res 48 (2009) 9979-9984
216
Chapter 8 Final remarks and Conclusions
New kind of cobalt and iron based catalysts were synthetized and used in the
Fischer-Tropsch synthesis Different methods of synthesis different amounts of
cobalt and different process temperatures were investigated All the catalysts
under study were active in the FTS The catalytic activity of the samples strictly
depends on the temperature as expected
Cobalt based hydrotalcites cobalt and cobalt-ruthenium synthesized with the
help of ultrasound and iron supported catalysts with a high loading of iron (30
wt) have been prepared and characterized and both the preparation
procedure and the working conditions were fully optimized
For each catalytic system it can be summarized the following aspects
Cobalt based catalysts
HTLC In the case of Co-based hydrotalcites CO conversion and process
selectivity towards light and heavy hydrocarbons are closely related to the
cobalt amount in the catalysts but not in a linear way
The reduction behavior under a H2 flow of the Co-based hydrotalcites is
achieved in one step at lower temperature and it is not related to its
morphology but is strictly correlated to the particle size In addition the
relatively large dimensions and high cristallinity of these catalysts favor the
creation of optimal domains of active sites that make them more efficient
The obtained data suggest the possibility of using synthetic hydrotalcite as Co-
based catalysts for FTS and open the possibility for subsequent studies on the
same subject
Chapter 8 Final remarks and Conclusions
217
Future studies may involve the investigation of the effects of various
parameters such as morphologysize of crystallites or the addition of small
amounts of promoters such as Ru in the composition of Co based hydrotalcites
Temperatures in the 220-235degC range are more suitable than the higher ones
Cobalt based bimetallic The catalysts show a low selectivity to methane and
carbon dioxide and formation of higher hydrocarbons The more interesting
results are the highest CO conversion at lower temperatures measured with a
catalysts promoted with a Ru Even the support although it is inert it is very
important because it radically alters the surface area of the catalyst
Iron catalysts The samples appears to be highly dependent on the method of
preparation used The catalysts treated with US and MW seem to show
significant improvements over traditional catalysts and the reason is a more
homogeneous and uniform distribution of Fe in the media
The catalyst Fe30K2Cu375 is active with a H2CO ratio le2
Develop of a kinetic model On the basis of the collected data a rigorous
simulation of the FT synthesis reactor has been developed to support the
experimentations and their planning to predict the reactor yield and
conversion to optimize the performance of the reactor system with different
operating conditions and to calculate novel reliable kinetic parameters based
on the experimental data fitting by means of model-based nonlinear regression
techniques For this lumping techniques have been used to model heavy
hydrocarbons the system is solved by means of dedicated solvers to handle
stiffness and nonlinearities of heterogeneous reactive systems and finally the
Chapter 8 Final remarks and Conclusions
218
model made in collaboration with the Politecnico di Milano show a good fit of
the experimental data
Concerning the results obtained in this PhDrsquos research work it is clear that all
the samples tested have given good results The Co-based catalysts
synthesized using the traditional impregnation method with an additional step
of ultrasound have given good results in comparison with the results in the
current literature The hydrotalcites have given lower results if compared with
the Co-based catalysts synthesized with the help of ultrasound but they have
opened an alternative and innovative way that has never been tried before
Iron based catalysts allow a direct conversion of the biosyngas and the results
have shown how our catalysts are active with an H2CO ratio le2 Furthermore
trends have been modeled with success In conclusion the PhDrsquos research
work has given a serious contribution to the current state of the art on
catalysis in the Fischer-Tropsch synthesis either with cobalt and iron based
catalysts With cobalt has been optimized a traditional synthesis procedure
with the introduction of ultrasound furthermore has been created a
completely new kind of catalyst With iron has continued an optimizationrsquos
work of iron supported with high loading metals so to develop a suitable
kinetic model able to work not only with syngas but also with biosyngas
List of Publications and Communications
219
List of publications
Publications
C Pirola DC Boffito G Carvoli A Di Fronzo V Ragaini and CL
Bianchi (2011) Soybean Oil De-Acidification as a First Step Towards
Biodiesel Production Recent Trends for Enhancing the Diversity and
Quality of Soybean Products Prof Dora Krezhova (Ed) ISBN 978-953-
307-533-4 InTech DOI 10577217812 Available from
httpwwwintechopencombooksrecent-trends-for-enhancing-the-
diversity-and-quality-of-soybean-productssoybean-oil-de-acidification-
as-a-first-step-towards-biodiesel-production
CL Bianchi C Pirola DC Boffito A Di Fronzo G Carvoli D Barnab
R Bucchi and A Rispoli (2011) Non Edible Oils Raw Materials for
Sustainable Biodiesel Biodiesel - Feedstocks and Processing
Technologies Dr Margarita Stoytcheva (Ed) ISBN 978-953-307-713-0
InTech DOI 10577225397 Available from
httpwwwintechopencombooksbiodiesel-feedstocks-and-
processing-technologiesnon-edible-oils-raw-materials-for-sustainable-
biodiesel
A Di Fronzo C Pirola A Comazzi F Galli CL Bianchi A Di Michele R
Vivani M Nocchetti M Bastianini DC Boffito Co-based Hydrotalcites
as new Catalysts for the Fischer-Tropsch Synthesis Process Fuel 119
(2014) 62ndash69
Publications in Conference Proceedings (peer reviewed)
CL Bianchi C Pirola DC Boffito A Di Fronzo A Di Michele R Vivani
M Nocchetti M Bastianini S Gatto Co-Zn-Al based hydrotalcites as
catalysts for Fischer-Tropsch process Proceeding of DGMK Conference
2011 Catalysis Innovative Applications in Petrochemistry and Refining
4-6 October 2011 Dresden Germany ISBN 978-3-941721-17-3
C Pirola A Di Fronzo DC Boffito CL Bianchi A Di Michele
Biosyngas Fischer ndash Tropsch Conversion by High Fe Loaded Supported
List of Publications and Communications
220
Catalysts Prepared with ultrasound and Microwave Proceeding of
DGMK Conference 2012 Reducing Carbon Footprint of Fuels and
Petrochemicals October 8 ndash 10 2012 Berlin Germany ISBN 978-3-
941721-26-5
Communications at congress A Di Fronzo C Pirola DC Boffito CL Bianchi A Di Michele R Vivani
M Nocchetti M Bastianini Synthetic Hydrotalcites as suitable Co-
based catalysts for Fischer-Tropsch Process XVIII Congresso Nazionale
della Divisione di Chimica Industriale della SCI LE SFIDE DELLA CHIMICA
INDUSTRIALE PER UNrsquoINNOVAZIONE SOSTENIBILE 11-14 giugno 2012
(Oral presentation)
A Di Fronzo DC Boffito CPirola G Carvoli S Vitali CL Bianchi
Scalable free fatty acids esterification for methyl esters production
XVIII Congresso Nazionale della Divisione di Chimica Industriale della
SCI LE SFIDE DELLA CHIMICA INDUSTRIALE PER UNrsquoINNOVAZIONE
SOSTENIBILE 11-14 giugno 2012 (Poster presentation)
ADi Fronzo C Pirola DC Boffito CL Bianchi A Di Michele R Vivani
M Nocchetti M Bastianini Synthetic Hydrotalcites as suitable Co-
based catalysts for Fischer-Tropsch Process Cat4bio conference
Advances in catalysys for biomass valorization Tesaloacutenica Grecia 2012
(Poster)
CL Bianchi A Di Fronzo C Pirola DC Boffito A Di Michele R Vivani
M Nocchetti M Bastianini Synthetic Hydrotalcites as suitable Co-
based catalysts for Fischer-Tropsch Process 7th edition of the
International Conference on Environmental Catalysis Lion-Francia
(Poster)
A Di Fronzo C Pirola CL Bianchi A Di Michele Ultrasonidos y
microondas en la preparaciograven de catalizadores soportados para la
sigraventesis de Fischer-Tropsch JIFI-EAI 2012 Jornadas de Investigaciograven
Ecuentro acadegravemico industrial Universidad Central de Venezuela
Facultad de Ingenierigravea 26-30 noviembre
C Pirola CL Bianchi A Di Fronzo D Boffito A Di Michele G S
Patience Ultrasound and microwave assisted preparation of high Fe
List of Publications and Communications
221
loaded supported catalysts for biosyngas Fischer-Tropsch conversion
Intervento presentato al 245 convegno ACS National Meeting amp
Exposition tenutosi a New Orleans Louisiana nel 2013
C Pirola C L Bianchi A Di Fronzo F Manenti M Hillestad High Fe
Loaded Supported Catalysts for Biosyngas Fischer ndash Tropsch Conversion
experimental results and detailed simulation XVII National Congress of
Catalysis GIC 2013 and XI National Congress of Zeolites Science and
Technology 15-18092013
F Galli C Pirola A Di Fronzo A Comazzi CLBianchi Di Michele Co
Based Bimetallic Catalysts for Fischer-Tropsch Synthesis Prepared by
High Power Ultrasound XVII National Congress of Catalysis GIC 2013
and XI National Congress of Zeolites Science and Technology 15-
18092013
Di Michele C Pirola A Di Fronzo A Comazzi F Galli and CLBianchi
Co Based Bimetallic Catalysts for Fischer-Tropsch Synthesis Prepared by
High Power Ultrasound AOSS Melbourne 10-12072013
C Pirola A Di Fronzo A Comazzi F Galli A Di Michele CLBianchi Co
based bimetallic catalysts for Fischer-Tropsch synthesis prepared by
high power ultrasound 11th European Congress on Catalysis ndash
EuropaCat-XI Lyon France September 1st-6th 2013
Workshop Clausthal Germany 22-23112013 Fischer-Tropsch Synthesis
from syngas and biomass using Fe or Co based catalysts Experimental
and simulation results (Oral Presentation)

General Abstract
7
The first group of catalysts tested were the Co-based hydrotalcites (HTlc) with
different amount of Co in two different pilot plants HTlc-based materials have
been recently reported as good catalysts for several processes in the energy
field [16] [17] and [18] Up to now the only study reported in literature on the
use of synthetic HTlc as FTS catalysts concerns their use as inert supports for
the catalytically active metal According to this study hydrotalcite-supported
catalysts result in higher activity than CoAl2O3 even in absence of reduction
promoters [19]
The second group of catalysts tested were the Co-based catalysts and
bimetallic Co-Ru based catalyst synthesized with the help of ultrasound
because the ultrasound are presented in literature as an innovative way to
synthesize new kind of materials
Finally were synthesized and tested samples of Fe-based catalysts supported
on silica with different methods of synthesis (traditional impregnation method
with the help of ultrasound or microwave) and changing the H2CO ratio with
the aim to evaluate the performance of biomass Almost the development of a
kinetic model (modeling parameter regression and simulation) in collaboration
with the Politecnico di Milano
3 Experimental Details
a Preparation of catalysts
i) Cobalt based catalysts ndash Hydrotalcites a series of ternary hydrotalcites with
general formula [CoxZn(1-x-y)Aly(OH)2](NO3)y∙05H2O by a modified-urea method
[20] Different volumes of the solutions of the metals nitrates all at a
concentration of 05 M were mixed to obtain either a Al(Co+Al) or
Al(Co+Al+Zn) molar ratio of 03 as indicated in Table 1
General Abstract
8
Solid urea was added to the solution in a molar ratio of 4 vs Al The obtained
solution was maintained at the reflux temperature in an open flask for 48 hours
The precipitate was separated by centrifugation washed with water and then
dried at 80degC
Table 1 Details of the synthesis composition and specific surface area (SA) of samples
general formula [CoxZn(1-x-y)Aly(OH)2](NO3)y∙05H2O M sol = molar percentage of
metals in the precipitation solution
Sample wt Co M sol
x
y
SSA (m2g-1)
Zn Co Al
Co5 51 55 15 30 010 033 175
Co10 108 45 25 30 021 034 115
Co15 166 35 35 30 032 029 72
Co35 353 - 70 30 067 033 58
ii) Cobalt based catalysts and bimetallic Co-Ru based catalysts synthesized
with the help of ultrasound All the catalysts were prepared by a modified
impregnation method The metal precursors (cobalt and ruthenium
carbonyl) were dissolved in n-decane together with the different support
(SiO2 Al2O3 or TiO2) The solution was irradiated by an ultrasound generator
with a horn type of 750 W a frequency of 20 kHz a diameter tip of 13 mm
and an amplitude of 40-50 for 3 h and then put into a rotating vacuum
oven at 40degC at 36 rpm for 24 h (impregnation step) Samples have been
calcinated at 350 degC for 4 h The ultrasound horn used have a cooling jacket
where the coolant has a low viscosity at low temperature and is a dielectric
liquid [21]
General Abstract
9
iii) Iron catalysts there were prepared the iron based catalysts using different
method of synthesis traditional impregnation (TR) impregnation with the help
of the microwave (MW) impregnation with the help of ultrasound (US) and co-
precipitation method MW and US techniques seem to be promising that offer
many advantages in the catalyst preparation as reported in [22-23] and their
effect was also evaluated
There were prepared according to the traditional impregnation method by
incipient wetness (TR) with 30wt of iron supported on a commercial high
surface area SiO2 (Fluka BET surface area 520 m2g-1 pore volume 122 ml g-1
and pore diameter 87 nm) The catalysts are promoted by K (20wt ) and Cu
(375wt ) The percentages are regarding a previous research [13] where
those compositions result as the most suitable catalyst In this work all the
percentages concerning the catalysts composition are on weight basis while
the percentages about the process conversion and selectivity are on molar
basis The catalysts will be named as Fe30K20Cu375 referring the wt of Fe K
and Cu on catalyst The support after heating treatment at 120degC for 12 h was
impregnated with an aqueous solution of Fe(NO3)3middot9H2O (Riedel de Haen
product) KNO3 (Merk product) and Cu(CH3COO)2middotH2O (Fluka product) and then
put into a vacuum oven at 40 degC at 36 rpm for 24 h The samples were heated
at 100 degC for 12 h and at 500degC for 4 h in air The results were also modeled
with a collaboration with the Politecnico di Milano and presented in this PhDrsquos
work
The synthesis of the catalyst with the aid of microwave is quite similar to the
TR The difference is the addition of a final step where the powder of catalyst
already calcined is subjected to a MW irradiation Two different methods for
the MW irradiation were used In the first one (MW1) it was taken a sample of
catalyst put it into a beaker and then put into a kitchen microwave oven
General Abstract
10
(Moulinex Micro-Chef 1305E 600W) for 30 min In the second method (MW2)
the catalyst (2 g) was suspended in hexane (400 ml) put it into a microwave
chemical reactor (ordinary 400 mL round bottom glass flask filled with the
liquid to be heated and activated) and treated for 1 h at 60W MW were
produced by a MW generator and sent to the MW applicator by an insulated
coaxial antenna Details of the MW applicator and of the associated
experimental techniques can be found in [24]
The US treatment have been used between the impregnation and the
evaporation step by irradiating the silica-precursors solution using a Sonicator
(W-385 Heat Systems Ultrasonics) with an effective input power of 60 W and a
tip diameter of 13 mm Silica solution promoters and water have been
sonicated by the US horn for 05 h in air atmosphere (US1) The same sample of
US1 was successively sonicated in a suspension of hexane in argon atmosphere
(instead of air) for 3h (US2)
b Catalysis Characterization
The obtained materials were characterized by X-ray powder diffraction
(XRD PANalytical XrsquoPert Pro CuKα radiation) operating at 40kV and 40mA
step size 00170 2θ degree and step scan 20s
The metal content of samples was determined by inductively coupled
plasma optical emission spectrometry (ICP-OES) using a Varian Liberty
Series instrument
Field emission scanning electron microscopy (SEM) images were obtained
using a LEO1525 instrument after depositing the samples depositing the
catalysts onto the sample holder and sputter coating with chromium
The elemental mapping of metals was obtained by using energy dispersive
X-ray spectroscopy (EDS) with a Bruker Quantax EDS instrument
General Abstract
11
Transmission electron microscopy (TEM) images were obtained using a
Philips 208 instrument
FT-IR spectra of different samples dispersed in KBr pellets were recorded
at room temperature using a Bruker IFS113V spectrometer Typically each
spectrum was obtained at a resolution of 1 cm-1 in the spectral region 400-
5000 cm-1
Specific surface area (SSA) of all catalysts was determined by
conventional N2 absorption using a Micromeritics ASAP2010 instrument
Before the analysis the samples were pre-treated at 200degC in a He flow
Conventional temperature-programmed reduction experiments (TPR) were
performed using a Thermoquest Mod TPRDO 1100 instrument The
samples were initially pre-treated in a flow of argon at 200degC for 05 h After
being cooled down to 50degC the H2Ar (51 vv) reducing mixture was
flushed through the sample at 30 mL min-1 and the temperature increased
from 50 to 900degC at a constant rate of 10degC min-1
Water and nitrate content of the solids was determined by
thermogravimetric (TG) analysis with a Netzsch STA 449C apparatus in air
flow and 10degCmin heating rate
c Kinetics Run
FT synthesis was performed into a fixed bed reactor using 1 g of fresh
catalyst mixed with 1 g of diluting material (-Al2O3) This diluting material
must be inert for FTS and acts as a good thermal conductor to control the
process temperature [25] The calcined catalysts were initially activated in
situ with the standard conditions of 468 Nml min-1 flow of syngas (H2CO =
21) at 350degC 3 bar for 4 h Then they were tested with the standard
conditions of 468 Nml min-1 flow of syngas (H2CO = 21) plus 50 Nml min-1
of N2 as internal standard at 20 bar at T = 250degC Others reducing activating
General Abstract
12
gases feeding compositions pressures temperatures have been tested in
the work Analyses of the gas-phase products (C1ndashC7) were performed with
an on-line micro gas-chromatograph (Agilent 3000) Liquid products were
collected in a trap at 5 degC and 20 bar and analyzed by a gas-chromatograph
(Fisons Mod 8000 Series) equipped with a Poparak-Q column after the total
time of reaction The aqueous phases collected in the cold trap were
analyzed by a TOC (Schimadzu Mod 5000A) to quantify the amount of
carbonaceous species dissolved in water
In the case of hydrotalcites FTS was performed in two different laboratory
plants with the same flow sheet The first one recently described and
located at the Universitagrave degli Studi di Milano and the second one at the
Universidad Central de Venezuela during a complementary stage in
Venezuela In this case the FTS was performed in a continuous flow system
with a fixed bed stainless-steel reactor (di =32mm l = 30 cm) The reactor
was loaded with 03 g of fresh catalyst mixed with 03 g of see sand as a
diluting material [26] The calcined catalysts were initially reduced in situ by
flowing hydrogen for 4 hours at 900 Nml˙min-1 350degC and 08 MPa After
the reduction step the temperature was lowered to 220degC under H2 They
were then tested in the standard conditions by flowing syngas (H2 CO N2
63325 vv N2 as internal standard) at 156 Nml˙min-1 increasing the
system pressure slowly up to 20 MPa and 220-260degC Once the reaction
temperature was achieved the reaction was led to proceed during a period
of 280 h
During reaction the reactor effluent passed through a hot trap kept at
150ordmC and 02 MPa to collect waxes and the products leaving this trap were
passed through a second trap kept at 0ordmC and 02MPa to collect the lighter
products (water alcohols and hydrocarbons) The analyses were performed
General Abstract
13
in various chromatographs according to the nature of the sample to be
analyzed Permanent gases and light hydrocarbons were analyzed on-line in
a PerkinElmer 3000GC Autosystem fitted with TCD detectors using a
Carbosieve SII Supelco column The liquid products (collected at 150ordmC and
0ordmC) were weighted and analyzed in a PerkinElmer chromatograph fitted
with a 50m long Alumina RT capillary column connected to a FID
A mass molar balance was performed for each FT run resulting in a
maximum error of plusmn 5 on molar basis
4 Results and discussion
a) Catalysts activation
i) Cobalt catalysts The catalytic activity of the samples depends on the
presence of metallic Co centres on the surface and the particle size Many
works have been done on the reducibility by TPR of CoOx mixed oxides The
reduction profile of Co3O4 consists of a low-temperature peak and a high-
temperature peak which correspond to the reduction of Co+3 to Co+2 and Co+2
to Co0 [27-30]
Two kinds of Co based catalysts were tested
The HTlc materials contain Co (II) ions randomly dispersed inside the brucitic
layers then the active phase in the FTS is the metallic cobalt Therefore in
order to have an active catalyst a reduction procedure is requires to maintain
the cobalt dispersion TPR analyses were performed to study the reduction
process and to select the best conditions for the catalyst activation Fig 1
reports the TPR profile of the sample Co5 Co10 Co15 Co35 All the profiles
exhibit two regions of reduction the first at lower temperatures (below 400degC)
which is due to the reduction of Co while the second peak above 700degC
indicates the presence of hardly reducible species These species are probably
spinel-type mixed oxides formed during the thermal treatment According to
General Abstract
14
Alvarez et al [31] these two peaks are well separated for samples with a small
particle size while an intermediate particle size causes the overlapping of the
two reduction steps resulting in a complete reduction with only one maximum
at an intermediate temperature (328degC) The TPR profiles of our HTlc (Fig 1)
are consistent with the latter case
Basing on the TPR results the tested catalysts were activated before FTS at
350degC for 4 hours under hydrogen atmosphere in order to reduce the Co ions
to metallic Co
Fig 1 TPR analysis of the samples Co5 Co10 Co15 Co35 Activation temperature is
indicated with the dashed line
After this treatment XRD analysis detected only mixed metal oxides and no
metallic Co phases so highlighting the presence of active metal atoms
homogeneously dispersed at the nanometer or sub-nanometer level [1432]
The same thing happens with the cobalt catalysts synthesized with ultrasound
The results of TPR confirm the data found in literature [27-30] where the Co
based catalysts need to be activated at 350degC for 4 hours under hydrogen
atmosphere It is important to note in Fig 2 how small amount of Ru decreases
the peak of the reduction temperature
General Abstract
15
100 200 300 400 500 600 700 800
Co-RuSiO2
CoSiO2
TC
D
Temperature (degC) 100 200 300 400 500 600 700 800
TC
D
CoAl2O
3
Co-RuAl2O
3
Temperature (degC) 100 200 300 400 500 600 700 800
CoTiO2
TC
D
Co-RuTiO2
Temperature (degC)
Fig 2 TPR analysis of the samples CoSiO2 and Co-RuSiO2 CoAl2O3 and Co-Ru Al2O3
CoTiO2 and Co-RuTiO2 Activation temperature is indicated with the dashed line
Basing on the TPR results the tested catalysts were activated before FTS at
350degC for 4 hours under hydrogen atmosphere in order to reduce the Co ions
to metallic Co
ii) Iron catalysts
As regard the method of synthesis of the iron based catalysts the main results
of catalysts characterization are reported in Table 2 All the surface areas (SA)
of the prepared catalysts are significantly lower than the SA of the
corresponding support (SiO2) This important decrease can be explained
considering the dilution effect due to the presence of iron on the support The
dilution effect can be easily assessed by considering the surface area of bare
silica support and assuming a negligible contribution of the iron phases to the
surface area The samples treated with MW and US have higher values of SA
than the traditional ones the effect of MW and US on SA is proportional with
the US or MW emitting power
The TPR analysis of these samples treated with MW gave results consistent
with those prepared by TR showing that the method of preparation does not
influence the step of reduction (Fe2O3-gt Fe3O4 -gt-Fe) of the catalyst but only
the peak temperature
General Abstract
16
Table 2 Characterization results of iron based catalysts using different method of synthesis
Sample Prep
Method
BET TPR TPD
Surface Area (m2g-1)
Temp of first
red peak (degC)
Temp of
second red peak (degC)
Temp of the peak (degC)
Bare support
Catalyst
Fe30K2Cu375SiO2 TR 4303 1601 240 600 170
Fe30K2Cu375SiO2 MW1
4303 1800 - - -
MW2 2240 240 580 162
Fe30K2Cu375SiO2 US1
4303 2011 236 572 171
US2 2101 - - - TR= Traditional Impregnation MW1= Catalyst put it into a kitchen MW and processed in powder MW2= Catalyst put it into MW and suspended in hexane US1= Catalyst suspended in aqueous solution in air atmosphere for 05 h US2= Catalyst sonicated and suspended in hexane in Argon atmosphere for 3h
In agreement with the literature [33] all the curves show a single TPDs peak in
the same range (150-170degC) that confirms the fact that only one type of
adsorbing species can exists up on the catalyst (see table 2) for all the catalysts
Before FT runs the catalysts must be activated reducing the hematite phase
(not active for FTS) in iron carbides (in particular Fe22C and Fe25C) and
magnetite (Fe3O4) [34] In literature there is not a uniform procedure for this
operation Many tests were performed by [34] and show that the best FT
results in term of CO conversion have been obtained using the activating
mixture H2CO (21) or pure CO starting from oxidized catalysts and making this
operation at T=350degC The process selectivity is not particularly modified using
the mixture H2CO (21) or pure CO and changing the activation temperature
b) FT results
i) Co based hydrotalcites as catalysts for Fischer-Tropsch synthesis
General Abstract
17
The activated samples were tested at different temperatures in the FTS plant
following the procedure reported in the experimental section In Fig 3 the CO
conversion vs the reaction temperature is reported for all the catalysts while
the products selectivity is displayed in Table 3
Fig 3 molar CO conversion to Co5 () Co10 ( ) Co15 (diams) Co35 () obtained at
different reactor temperatures after 24 hours of reaction
As expected for each catalyst the activity is strongly influenced by the reaction
temperature the higher the temperature the higher the CO conversion but
also the selectivity towards CO2 CH4 and light hydrocarbons is favored by a
higher temperature The CO conversion is similar for Co5 and Co10 while it is
higher for the two samples with a larger amount of cobalt ie Co15 and Co35
In particular Co15 exhibits the highest CO conversion at all the selected
temperatures In FTS it is fundamental to obtain low quantities of CH4 and CO2
(undesired products) to favor the formation of higher hydrocarbons For this
reason temperatures in the 220-235degC range are more suitable than the higher
ones
General Abstract
18
Moreover Table 3 shows that Co15 exhibits the highest CO conversion and the
highest C2+ total yield (without considering CH4 and CO2 see note in Table 3)
also at the lowest temperature (220degC) This result confirms that Co15 is the
best performing catalyst obtained in this study
The obtained data suggest the possibility of using synthetic hydrotalcites as Co-
based catalysts for FTS and pursuing subsequent studies on the same subject
Table 3 FTS products selectivity at different reactor temperatures
Sample Temperature
(degC)
Products Selectivity C2+
Yield CO2 CH4 leC7 gtC7
Co5 220 03 29 33 934 165
235 03 59 104 834 194
245 11 85 127 776 224
260 19 141 160 679 300
Co10 220 32 26 98 844 155
235 38 49 143 769 178
245 33 60 154 753 218
260 81 163 413 343 262
Co15 220 14 101 17 705 467
235 81 262 473 185 498
250 178 177 443 202 491
Co35 220 14 39 103 844 250
235 18 96 234 651 395
245 51 257 656 105 473
leC7 all the hydrocarbons in the range C2-C7 gtC7 all the hydrocarbons greater than C7 Product lsquolsquoirdquo selectivity = (moles C in product i) (converted moles C) x 100 C2+ yield = CO conversion x (selectivity leC7 + selectivity gtC7) x10-2
General Abstract
19
iii) Sonochemical synthesis of Co and Co-Ru based catalysts for Fischer-Tropsch
synthesis
The use of ultrasound might be very efficient to optimize the dispersion of a so
high metal charge as already verified in our laboratory in the past [35-36] This
special type of synthesis should give at the catalyst a particular structure with a
high surface area and a high metal dispersion that improves its activity towards
the synthesis of Fischer-Tropsch In the case of cobalt supported catalysts a
simple US step has been added in the catalyst preparation The precursors
(cobalt and ruthenium carbonyl) were dissolved in n-decane together with the
different support (SiO2 Al2O3 or TiO2) the solution was irradiated with
ultrasound at a frequency of 20 kHz and an output power of 300 W for 3 hours
As seen in table 4 the catalysts show a low selectivity to methane and carbon
dioxide and formation of higher hydrocarbons The more interesting results are
the highest CO conversion at lower temperatures measured with a catalysts
promoted with a Ru
Table 4 CO Conversion C2+total yield CH4 CO2 light hydrocarbon and heavy
hydrocarbon selectivity of CoCo-Ru based catalyst
Catalyst CO
Conversion ()
C2+ total yield
Selectivity ()
CH4 CO2 ltC7 gt C7
CoTiO2 28 23 5 14 10 71
CoSiO2 6 5 19 6 23 52
CoAl2O3 8 6 13 7 19 61
Co-RuTiO2 98 73 18 8 14 60
Co-RuSiO2 94 82 9 4 8 79
Co-RuAl2O3 84 73 11 2 12 75
As we have seen from the BET and TPR analysis the support and the promoter
play a key role in the performance of the catalyst because they are responsible
General Abstract
20
for the modification of some key parameters such as surface area and the
metal dispersion
ii)High Fe Loaded Supported Catalysts for Biosyngas Fischer ndash Tropsch
Conversion experimental results and detailed simulation
With regard to the treatment with the help of US (see table 5) it can be
concluded that the sonication of an aqueous mixture salts and precursors of
support (US1) is preferable instead of to the calcined catalyst suspended in
non-polar solvent such as hexane (US2) With regard to treatment with MW
(see table 3) there were obtained better results in term of CO conversion with
the powder catalyst treated directly in the MW (MW1) while the test
conducted by suspending the catalysts in hexane and then treated in a MW
reactor (MW2) for an hour did not give valid results The best FTS results in
term of C2+ yield (41) has been obtained using MW1 while in tem of CO
conversion (58) using US1 All of them gave FTS results better than the
traditional one Itrsquos evident that the use of US or MW optimizes the catalytic
performance in accord with previous similar results [36]
In agreement with [37] the FTS results show that TEOS as silica source is
favorable for the enhancement of the FTS activity
A very important property of iron based catalysts is their possibility to operate
using feeding gas having a ratio H2CO not stoichiometric (ie 2) In the
present work there were made some tests with Fe30K20Cu375 catalyst by
feeding mixtures with a ratio H2CO between 05 and 20 in order to optimize
the activity selectivity and the lifetime of this kind of FT catalyst in work
conditions of biosyngas feeding
General Abstract
21
Table 5 Catalytic Results of Fe30K20Cu375 Different preparation techniques Support
SiO2 Diluting Material α-Al2O3 T=220degC
Preparation CO Conversion
()
C2+
Total yield
Selectivity ()
CO2
CH4
lt C7
gt C7
TR 49 32 27 7 22 44
MW1 52 41 17 5 18 60
MW2 32 24 17 8 27 48
US1 58 38 29 6 22 43
US2 36 25 22 9 30 39
Co-precipitation 38 32 2 13 28 57 leC7 all the hydrocarbons in the range C2-C7 gtC7 all the hydrocarbons greater than C7 Product lsquolsquoirdquo selectivity = (moles C in product i) (converted moles C) x 100 C2+ yield = CO conversion x (selectivity leC7 + selectivity gtC7) x10-2
The co-precipitation test was made at T=250degC and TEOS as a support
On the basis of the collected data a rigorous simulation of the FT synthesis
reactor has been developed for different purposes (i) to support the
experimentations and their planning (ii) to predict the reactor yield and
conversion (iii) to optimize the performance of the reactor system with
different operating conditions and (iv) to calculate novel reliable kinetic
parameters based on the experimental data fitting by means of model-based
nonlinear regression techniques To do so the FT reactor is modeled as a
catalytic plug-flow reactor using mass and energy balances and reaction
kinetics for Fe-based catalyst defined by Zimmerman and Bukur [38] leading to
an ordinary differential equation system with structured Jacobian Lumping
techniques have been used to model heavy hydrocarbons The system is solved
by means of dedicated solvers to handle stiffness and nonlinearities of
heterogeneous reactive systems [39]
General Abstract
22
Typical H2CO ratio of syngas manufactured from coal or biomass are between
07-12 and the Fig 4 show that the activity of catalyst is good enough using
also feeding ratio between 10 and 20
Fig4 CO conversion or selectivity vs H2CO feeding ratio for Fe30K20Cu375 catalyst
at T=250degC
In Table 6 there is the data concerning the carbon monoxide conversion ()
and the selectivity towards undesired products (CO2 and CH4) and lighter and
heavy hydrocarbons of Fe-based catalyst The data collected using this catalyst
were modeled in collaboration with Politecnico di Milano
The selected model was based on the hypothesis that both FT and WGS
reaction were active on this catalyst The kinetic parameters were calculated
and compared with the experimental data
Table 6 FTS products selectivities at different H2CO ratio and reactor temperatures of
Fe30K20Cu375
Selectivity ()
H2CO T(degC) CO
Conversion ()
C2+ total yield
CO2 CH4 ltC7 gtC7
21 220 85 69 11 8 22 59
21 235 211 175 11 6 20 63
21 250 498 393 16 5 19 60
21 260 567 425 19 6 20 55
151 250 388 299 18 5 17 60
151 260 463 338 22 5 17 56
11 250 23 182 17 4 16 63
11 260 389 272 26 4 16 54
General Abstract
23
leC7 all the hydrocarbons in the range C2-C7 gtC7 all the hydrocarbons greater than C7 Product lsquolsquoirdquo selectivity = (moles C in product i) (converted moles C) x 100 C2+ yield = CO conversion x (selectivity leC7 + selectivity gtC7) x10-2
In Fig 5 is presented a comparison between the experimental data obtained in
the laboratory and the data obtained using the kinetic model The first two
columns represent the conversion of hydrogen and carbon monoxide while in
the other columns are represented the molar fraction of hydrogen carbon
monoxide water methane and lump C2 C3-4 C5-10 C11 + It can be seen that the
kinetic model present a good fitness regard to the experimental data
Fig 5 Comparison between experimental data and kinetic model
5 Conclusions
General Abstract
24
Concerning the results obtained in this PhDrsquos research work it is clear that all
the samples tested have given good results The Co-based catalysts
synthesized using the traditional impregnation method with an additional step
of ultrasound have given good results in comparison with the results in the
current literature The hydrotalcites have given lower results if compared with
the Co-based catalysts synthesized with the help of ultrasound but they have
opened an alternative and innovative way that has never been tried before
Iron based catalysts allow a direct conversion of the biosyngas and the results
have shown how our catalysts are active with an H2CO ratio le2 Furthermore
trends have been modeled with success In conclusion the PhDrsquos research
work has given a serious contribution to the current state of the art on
catalysis in the Fischer-Tropsch synthesis either with cobalt and iron based
catalysts With cobalt has been optimized a traditional synthesis procedure
with the introduction of ultrasound furthermore has been created a
completely new kind of catalyst With iron has continued an optimizationrsquos
work of iron supported with high loading metals so to develop a suitable
kinetic model able to work not only with syngas but also with biosyngas
References
[1] M S Hadnadev-Kostic J Tatjana T Vulic R Marinkovic-Neducin A D Nikolic B Jovic Journal of the Serbian Chemical Society 76 (12) (2011) 1661ndash1671 [2] E Lira C Loacutepez F Oropeza M Bartolini J Alvarez M Goldwasser F Loacutepez J Lamonier J Peacuterez Journal of Molecular Catalysis A Chemical 281 (2008) 146ndash153 [3] Q Zhang J Kang Y Wang ChemCatChem Catalysis 2 (2010) 1030 [4] F Fischer and H Tropsch BrennstChem 4 (1923) 276 [5] M E Dry Enciclopedia of Catalysis New York (2003) 247 [6] Fischer-Tropsch Technology Studies in Surface Science and Catalysis Elsevier (2004)
General Abstract
25
[7] G P Vaan Deer Laan A A C M Beenackers Catalysis Reviews Science and Engineering 41(3amp4) (1999) 255 [8] H Schulz Applied Catalysis A 186 (1999) 3 [9] GP van der Laan AACMBeenackers Applied Catalysis A 193 (2000) 39 [10] A Martinez C Lopez F Marquez IJ Diaz Catalysis 220 (2003) 486 [11] AY Khodakov WChu P Fongarland Chemical Reviews 107 (2007) 1692 [12] BHDavis Catal Today 84 (2003) 83 [13] Pirola C Bianchi CL Di Michele A Diodati P Vitali S Ragaini V Catal Lett 2009 131294ndash304 [14] A Di Fronzo C Pirola A Comazzi F Galli CL Bianchi A Di Michele R Vivani M Nocchetti M Bastianini DC Boffito Fuel 119 (2014) 62-69 [15] C Pirola CL Bianchi A Di Michele S Vitali V Ragaini Catal Comm 10 (2009) 823ndash827 [16] T Montanari M Sisani M Nocchetti R Vivani M C H Delgado G Ramis G Busca U Costantino Catalysis Today 152 (2010) 104 [17] C Resini T Montanari L Barattini G Ramis G Busca S Presto P Riani R Marazza M Sisani F Marmottini U Costantino Applied Catalysis A 355 (2009) 83 [18] Y Lee J H Choi H J Jeon K M Choi J W Lee J K Kang Energy Environment Science 4 (2011) 914 [19] Y Tsai X Mo A Campos J G Goodwin Jr J Spivey Applied Catalysis A General 396 (2011) 91ndash100 [20] M Bastianini D Costenaro C Bisio L Marchese U Costantino R Vivani M Nocchetti Inorg Chem 51 (2012) 2560-2567 [21] Suslick SK ldquoApplications of ultrasound to materials chemistryrdquo MRS Bulletin 1995 [22] S Qi B Yang Methane aromatization using Mo-based catalysts prepared by microwave heating Catal Today 98 (2004) 639-645 [23] Y Liu Y Lu S Liu Y Yin The effect of microwaves on the catalysts preparation and the oxidation of o-xilene over a V2O5SiO2 system Catal Today 51 (1999) 147-151] [24] G Biffi Gentili M Linari I Longo A Ricci IEEE Transactions on microwave theory and techniques Vol 57 (2009) 9 [25] C Bianchi C Pirola V Ragaini Catalysis Communications 7 (2006) 669-672 [26] ML Cubeiro Loacutepez A Colmenares L Texeira M Goldwasser M J Peacuterez F Machado F Gonzaacutelez Applied Catalysis A General 167 (1998) 183-193 [27] C L Bianchi Catalysis Letters Vol 76 No 3ndash4 (2001)155-159 [28] H-Y Lin Y-W Chen C Li Thermochim Acta 400 (2003) 61ndash67 [29] H-Y Lin Y-W Chen Materials Chemistry and Physics 85 (2004) 171ndash175
General Abstract
26
[30] BA Sexton AE Hughes TW Turney Journal of Catalysis 97 (1986) 390ndash406 [31] A Alvarez S Ivanova MA Centeno JA Odriozola Applied Catalysis A General (2012) 431ndash 432 [32] C L Bianchi C Pirola DC Boffito A Di Fronzo A Di Michele R Vivani M Nocchetti M Bastianini S Gatto DGMK Tagungsbericht Volume2011-2 IssuePreprints of the DGMK-Conference Catalysis Innovative Applications in Petrochemistry and Refining 2011 Pages 93-98 Journal 2011 CODEN DGTAF7 ISSN1433-9013 [33] 7 H Wan B Wu C Zhang H Xiang Y Li Promotional effects of Cu and K on precipitated iron-based catalysts for Fischer ndash Tropsch synthesis J molecular Catalysis 283 (2008) 33-42 [34] J Xu CHBartholomew J Phys Chem B 109 (2005) 2392 [35] CLBianchi VRagaini Catalysis Letters 95 (2004) 61-65 [36] C Pirola C L Bianchi A Di Michele P Diodati D C Boffito V Ragaini Ultrasonic Sonochem 17 (2010) 610 [37] Suo Haiyun Zhang Chenghua Wu Baoshan Xu Jian Yang Yong Xiang Hongwei Li Yongwang A comparative study of FeSiO2 FischerndashTropsch synthesis catalysts using tetraethoxysilane and acidic silica sol as silica sources Catalysis Today Volume 183 Issue 1 20 March 2012 Pages 88ndash95 [38] WH Zimmerman DB Bukur Can J Chem Eng 68 (1990) 292-301 [39] F Manenti I Dones G Buzzi-Ferraris HA Preisig Ind Eng Chem Res 48 (2009) 9979-9984
27
Chapter 1 General Introduction The National Renewable Energy Laboratory (NREL) and the Pacific Northwest
National Laboratory (PNNL) [1] are undertaking studies of biomass conversion
technologies to hydrocarbon fuels
Process designs and preliminary economic estimates for each of these pathway
cases were developed using rigorous modeling tools This technology pathway
case investigates the upgrading of woody biomass derived synthesis gas
(syngas) to hydrocarbon biofuels While this specific discussion focuses on the
conversion of syngas via a methanol intermediate to hydrocarbon blend stocks
there are a number of alternative conversion routes for production of
hydrocarbons through a wide array of intermediates from syngas (Fig 11)
Technical barriers and key research needs have been identified that should be
pursued for the syngas-to-hydrocarbon pathway to be competitive with
petroleum-derived gasoline- diesel- and jet-range hydrocarbon blend stocks
Fig 11 Process Block Diagram [1]
At present the development of economical and energy-efficient processes for
the sustainable production of alternative fuels and chemicals is a global
Chapter 1 General Introduction
28
demand and FTS is a crucial technology for this purpose [2] On the one side
the observed climate change particularly global warming is widely held as a
consequence of the increase of atmospheric CO2 concentration due to fossil
fuel combustion On the other side people are increasingly aware that fossil
fuels reserves are huge but not unlimited and the air quality are major
environmental concerns because they directly affect the way we live and
breathe
In order to meet the present and future threats generated by emissions to the
atmosphere environmental agencies around the world have issued more
stringent regulations One of them is the control of residual sulfur in diesel fuel
and emission standards for particulates from diesel vehicles All these facts
have recently aroused renewed interest in the FischerndashTropsch Synthesis
because it can produce super clean diesel oil fraction with high cetane number
(typically above 70) without any sulfur and aromatic compounds using syngas
(mixture of H2 CO CO2) from natural gas CH4 coal landfill gas coal or biomass
through steam reforming partial or auto thermal oxidation gasification
processes or as a new tendency from biomass [3-5] Mineral diesel basically
results from refining and fractional distillation of crude oil between 160 and
380degC at atmospheric pressure and is mostly formed by mixtures of paraffins
containing between 12 and 20 carbon atoms per molecule In these mixtures
linear paraffins are particularly appreciated due to their high cetane number
ie their excellent ignition performances Expansion and social progress is
however boosting a further increase of energy demand particularly in the
transportation sector which in developed countries accounts for most of this
increase This is the reason why carbon-neutral biofuels are largely considered
a possible way to satisfy the energy demand without dramatically increasing
the CO2 content of the atmosphere [6]
Chapter 1 General Introduction
29
In this context the production of hydrocarbons starting from syngas (CO + H2) is
a crucial topic because syngas can be manufactured from natural gas (GTL Gas
to liquid) coal (CTL coal to liquids) or biomass (BTL Biomass to liquid) [7] In
Fig 12 the industrial way to utilize syngas are reported the fuels produced
from syngas include hydrogen by the water-gas-shift (WGS) reaction methanol
by methanol synthesis alkenes by Fischer Tropsch synthesis (FTS) isobutene by
isosynthesis ethanol by fermentation or with homogeneous catalysts and
aldehydes or alcohols by oxosynthesis
Fig 12 Diagram of Syngas Conversion Processes [8]
Fischer-Tropsch Synthesis (FTS) is a well-known industrial process discovered
by Franz Fischer and Hans Tropsch in Germany in 1923 [9] starting from syngas
(H2 + CO) and using iron or cobalt based catalysts it is possible to produce
several hydrocarbons in the range from 1 to 100 carbon atoms Co-based
catalysts have been more largely used due to their high selectivity to heavy
hydrocarbons and low activity in the water-gas shift reaction so limiting the
CO2 formation Moreover Co-based catalysts have shown longer life-time and
higher CO conversion compared to the Fe-based ones [10-11] The essential
target of FTS is to produce paraffins and olefins with different molecular weight
Chapter 1 General Introduction
30
and to limit the maximum formation of methane and CO2 [4 12-15] The main
reactions involved in FTS are reported in the following scheme
Irreversible reactions
1) n CO + 2n H2 rarr CnH2n + n H2O for olefins
2) n CO + (1+2n) H2 rarr CnH(2n+2) + n H2O for paraffins
3) 2n CO + n H2 rarr CnH2n + n CO2 for olefins
4) n CO + 2n H2 rarr CnH(2n+1)OH + (n-1) H2O for alcohols
Equilibria
5) CO + H2O harr CO2 + H2 Water-gas-shift reaction (WGS)
6) CO + 3 H2 harr CH4 + H2O
7) 2 CO harr C + CO2 Boudouard equilibrium
The whole reaction gives an energetic contribution strongly exothermic (about
150 kJmol CO reacted) FTS is a particularly complex system in which a
number of different reactions are combined to a unique mechanism
irreversible FT reactions produce hydrocarbons and some equilibria reactions
between CO CO2 CH4 and C such as the WGS reaction and the Boudouard
equilibrium are present too Nevertheless it is possible to suppose that FTS
can be simplified as a combination of the FT reactions and the WGS reaction
[14] Hydrocarbons are primary products of FT reaction and CO2 can only be
produced by WGS reaction a reversible parallel-consecutive reaction with
respect to CO [16]
At present the marketplace places a premium on FT diesel but not gasoline
thus the current view is that the most attractive option is to produce high
molecular weight FT products and then to hydrocrack them to produce high
quality diesel fuel [17] According to Calderone et al [18] the most important
limitation to the industrialization of FT processes is the availability of cheap oil
Industrial interest in FT reactions always peaks during oil crises (Fig 13) The
Chapter 1 General Introduction
31
Kyoto protocol recognizes the importance of developing and deploying new
technologies with less impact on the environment
Fig 13 The oil price (line) related to the output of peer reviewed FTS research papers and patents (bars) in 1925ndash2007 [19]
Fig 14 Number of papers related to FT synthesis published in the past decade From
ISI Web of Science using the keyword ldquoFischer-Tropschrdquo [20]
Selectivity control remains one of the most important and difficult challenges
in the research area of FTS Development of efficient catalysts with controlled
selectivity or tuned product distribution is a highly desirable goal [5]
Compared to cobalt systems iron-based catalysts are cheaper but less resistant
to deactivation due to the oxidizing effect of water despite activating Water
Gas Shift (WGS) reaction (CO + H2O harr CO2 + H2) [12 16] Moreover they are
flexible to changes in temperature pressure and they can work at different H2
CO feed ratios (for iron based catalysts this ratio can be between 05 and 25)
[21-22] Iron catalysts seem to be more suitable to work with biomass-derived
Chapter 1 General Introduction
32
syngas as outlined by Corma et al [23] that are characterized by a low ratio
H2CO and by the presence of CO2 (the activation of WGS reaction in fact can
produce CO from CO2) They present lower methane selectivity and they are
less deactivated by poisons species [24] The iron based catalysts have different
active site the Fe-carbides sites are active for the formation of hydrocarbons
(FTS) while the magnetite (Fe3O4) sites are the most active phase for the WGS
reaction [16 25-26]
11 Fischer Tropsch Synthesis Historical background
A Short Historical Sketch
Year Ref
1902 P Sabatier and J D Senderens
Hydrogenated CO over Ni to produce CH4 [27]
1910 A M Mittasch C Bosch and F Haber
Developed promoted Fe catalysts for the synthesis of NH3 [28]
1913 Badische Anilin und Soda Fabrik (BASF)
Received patents on the preparation of hydrocarbons and oxygenates by the hydrogenation of CO at high pressure usually on oxide catalysts
1936 Eugene Houdry Developed and installed the first commercial catalytic cracking unit [29]
1943-1944
Kogravelbel KWIK and five companies participated
Initiated and directed the comparative tests I and II held at Schwarzheide to select a Fe catalyst to replace Co in existing reactors Although the results were remarkably good no replacement catalyst was selected probably because of the overall disarray of activity that attended the approach of the end of the war
[30]
1949 Kogravelbel and F Engelhardt
Discovered that H2O and CO react on FTS catalysts to yield typical FTS products
1950 A fluidized-fixed bed process developed by Hydrocarbon Research Trenton New Jersey was installed in Brownsville Texas This plant called Carthage Hydrocol Inc used reformed natural gas Severe operating difficulties required designing a new reactor which was installed in 1953 The new reactor operated properly but the plant was promptly shut down sold and dismantled By the time the plant was operating correctly the price of natural gas had more than doubled Merely selling the gas was more profitable than converting it to gasoline and chemicals At the same time in South Africa the SASOL FTS plant using coal was constructed and opened in 1955 Lurgi gas generators and Rectisol gas-cleaning units were employed Two types of FTS reactors both with Fe catalysts were used a fixed-bed with recycle unit designed by Ruhrchemie in West Germany having long tubes with an internal diameter of 2 inch and an entrained-solids reactor by M W Kellogg in New Jersey After a year or more of start-up problems these units have operated successfully up to the present
[31]
1953 R B Anderson and J F Shultz
Found that Fe nitrides are unique durable catalysts for the FTS that produce large yields of alcohols Anderson developed equations that predict the isomer and carbon-number distributions of FTS products
[32]
1957 G Natta and co-workers
Studied the methanol and higher alcohol syntheses [3334]
1959 Pichler Resumed work on FTS on Ru which led to the polymethylene synthesis
Chapter 1 General Introduction
33
1961 H H Storch He died he was the architect of the useful scientific and engineering research programs on coal-to-oil processes at the US Bureau of Mines in Pittsburgh and Bruceton Pennsylvania
[3235]
1967 US Bureau of Mines workers
Developed methods for flame spraying catalysts onto metals for the platelet assemblies of hot-gas-recycle reactors These techniques led to the development of a new FTS unit the tube-wall reactor
[36]
1975 SASOL II SASOL III
In South Africa the decision was made to build SASOL II scheduled for operation in 1980 and in 1979 plans were made for SASOL III to begin operation in 1982 The new plants are similar to the initial plant except that fixed-bed FTS reactors were not included in the new installations
[31]
1976 Mobil Announced a process for converting methanol to an aromatic gasoline and C to C4 olefins on the shape-selective catalyst ZSM5 This process may be a serious competitor for FTS
1981 New Zealand A methanol plant operating on natural gas plus the Mobil process was planned scheduled for competition in 1985
1982 The worldwide recession
Sharply decreased demand for petroleum OPEC was unable to control the production and price of oil among its members The relatively low cost and abundance of petroleum has discouraged new coal-to-oil ventures
1993 Shell in Bintulu Malaysia
Completed construction and began operating their ldquoShell Middle Distillate Processrdquo The Bintulu Plant produces 12500 BPD and in 2000 increase that capacity to 15000 BPD This F-T plant has effectively captured the world specialty wax market
2000 While Saudi Arabia produced about 8 million barrels of oil per day in 2000 the world flared (burned) or re-injected associated gas equivalent to 72 million barrels per day of clean synthetic fuels Worldwide environmental legislation requiring ultra-low sulphur and aromatic levels in fuel will cost billions in oil refinery upgrading
2002 Nearly every major oil company is either developing their own F-T technology forming joint ventures or scrambling to do so ExxonMobil has spent over $500 MM Chevron formed a joint venture with Sasol Statoil has formed a joint venture with Mossgas Conoco built a $400MM test plant in Oklahoma BP completed its pilottest plant in Alaska Shell has announced 7 new projects
2004 50 new Fischer-Tropsch projects have been announced These projects total over 900000 BPD capacity Some of these projects are pilot plants some are feasibility studies for clients and some have started construction
2005 In South Africa Mossel Bay GTL Expansion operated by PetroSA with a capacity of 15000bpd
2006 In Qatar ORYX GTL Phase 1 operated by SasolQatar Petrol with a capacity of 32400 bpd
2011 In Qatar Pearl GTL Phase 1 operated by Shell with a capacity of 70000 bpd
2011 In Qatar Pearl GTL Phase 2 operated by Shell with a capacity of 70000 bpd
2013 In Nigeria Escravos operated by ChevronNNPC with a capacity of 34000bpd
2017 In Uzbekistan Oltin Yorsquol GTL operated by SasolUNGPetron with a capacity of 38000bpd
2018-19
In USA Sasol Lousiana operated by Sasol with a capacity of 96000bpd
Firm proposed large-scale GTL capacity outlook
Chapter 1 General Introduction
34
Fig 15 The Sasol Synfuels plant at Secunda South Africa
Fig 16 ldquoShell Middle Distillate Processrdquo in Bintulu Malaysia
Fig 17 Franz Fischer and Hans Tropsch
12 Present Situation of Fischer-Tropsch Technology
High energy prices and concerns about the environmental consequences of
greenhouse gases (GHG) emissions lead a number of national governments to
provide incentives in support of the development of alternative energy
Chapter 1 General Introduction
35
sources making renewables the worldrsquos fastest-growing source of energy in
the outlook
According to the Annual Energy Outlook 2013 [37] the aggregate fossil fuel
share of total energy use falls from 82 percent in 2011 to 78 percent in 2040 in
the Reference case while renewable use grows rapidly (Fig 17) The
renewable share of total energy use grows from 9 percent in 2011 to 13
percent in 2040 in response to the federal renewable fuels standard
availability of federal tax credits for renewable electricity generation and
capacity during the early years of the projection and state renewable portfolio
standard (RPS) programs
Increased vehicle fuel economy offsets growth in transportation activity
resulting in a decline in the petroleum and other liquids share of fuel use even
as consumption of liquid biofuels increases Biofuels including biodiesel
blended into diesel E85 and ethanol blended into motor gasoline (up to 15
percent) account for 6 percent of all petroleum and other liquids consumption
by energy content in 2040
Consumption of petroleum and other liquids peaks at 198 million barrels per
day in 2019 in the AEO2013 reference case and then falls to 189 million barrels
per day in 2040 (Figure 18)
Fig 18 Primary energy use by fuel 1980-2040 (quadrillion BTU)
Chapter 1 General Introduction
36
The transportation sector accounts for the largest share of total consumption
throughout the projection although its share falls to 68 percent in 2040 from
72 percent in 2012 as a result of improvements in vehicle efficiency following
the incorporation of CAFE standards for both LDVs and HDVs
An increase in consumption of biodiesel and next-generation biofuels (include
pyrolysis oils biomass derived Fisher-Tropsch liquids and renewable feedstocks
used for on-site production of diesel and gasoline) totaling about 04 million
barrels per day from 2011 to 2040 is attributable to the EISA2007 RFS
mandates The relative competitiveness of CTL and GTL fuels improves over the
projection period as petroleum prices rise In 2040 CTL and GTL together
supply 03 million barrels per day of nonpetroleum liquids
Fig 19 Consumption of petroleum and other liquids by sector 1990-2040 (million
barrels per day)
2 Oil prices and total energy consumption
The importance of the research in FTS is directly dependent of the oil prices
and the total energy consumption So it is so important to meet the
projections of these variables before to make every kind of investments on this
area In AEO2013 oil prices are represented by spot prices for Brent crude
Prices rise in the Reference case from $111 per barrel in 2011 to about $117
Chapter 1 General Introduction
37
per barrel in 2025 and $163 per barrel in 2040 (Table 1) The price rise starts
slowly then accelerates toward the end of the projection period
Market volatility and different assumptions about the future of the world
economy are reflected in the range of oil price projections for both the near
and long term however most projections show oil prices rising over the entire
projection period
Table 1 Comparisons of oil price projections 2025 2035 and 2040 (2011 dollars per
barrel)
As regard the total energy consumption the in table 2 there are four different
projections made by other organizations (INFORUM IHSGI ExxonMobil and
IEA) [37]
Chapter 1 General Introduction
38
Table 2 Comparisons of energy consumption by sector projections 2025 2035 and
2040 (quadrillion BTU)
ExxonMobil includes a cost for carbon dioxide (CO2) emissions in their
projection which helps to explain the lower level of consumption in their
outlook Although the IEArsquos central case also includes a cost for CO2 emissions
its Current Policies Scenario (which assumes that no new policies are added to
those in place in mid-2012) is used for comparison in this analysis because it
corresponds better with the assumptions in the AEO2013 Reference case
ExxonMobil and IEA show lower total energy consumption across all years in
comparison with the AEO2013 Reference case Total energy consumption is
Chapter 1 General Introduction
39
higher in all years of the IHSGI projection than in the AEO2013 Reference case
but starts from a lower level in 2011
For the transportation sector the difference could be related to vehicle
efficiency as the INFORUM projection for motor gasoline consumption (2
quadrillion Btu lower than AEO2013) is comparable with the EIA projection in
AEO2012 which did not include the efficiency standard for vehicle model years
2017 through 2025
IHSGI projects significantly higher electricity consumption for all sectors than in
the AEO2013 Reference case which helps to explain much of the difference in
total energy consumption between the two projections
Then the projections make possible the investment on research in Fischer ndash
Tropsch synthesis
The process known as Gas to Liquid (GTL) was based on two steps
Steam reforming of natural gas into syngas
Fischer Tropsch synthesis from syngas into synthetic liquid fuels
Recently (2004-2006) the massive growth of GPN (Gross National Product) in
China and India has caused crude oil process to rise continuously and FTS
(including both coal and biomass as feedstock BTL) has become once more an
appealing technology Recent interest in FT technology especially in Europe and
South America is driven by a focus on the gasification of biomass into fuel [38]
(BTL)
Biomass to Liquid via FischerndashTropsch (BTL-FT) synthesis is gaining increasing
interests from academia and industry because of its ability to produce carbon
neutral and environmentally friendly clean fuels
In the BTL-FT process biomass such as woodchips and straw stalk is firstly
converted into biomass-derived syngas (bio-syngas) by gasification
Chapter 1 General Introduction
40
Bio-syngas resulting from biomass gasification contains CO H2 CO2 CH4 and
N2 in various proportions [39 40] Then a cleaning process is applied to
remove impurities from the bio-syngas to produce clean bio-syngas which
meets the FischerndashTropsch synthesis requirements Cleaned bio-syngas is then
conducted into a FischerndashTropsch catalytic reactor to produce green gasoline
diesel and other clean biofuels
Generally there are three main steps in the Biomass to Liquid via Fischerndash
Tropsch (BTL-FT) synthesis [41-43] Biomass is firstly converted into biomass-
derived syngas (bio-syngas) by gasification In a second step a cleaning process
is applied to the bio-syngas in order to remove impurities resulting in clean
bio-syngas which meets the FischerndashTropsch synthesis requirements Finally
the cleaned bio-syngas is then conducted into FischerndashTropsch catalytic reactor
to produce green gasoline diesel and other clean biofuels The flow sheet of
the BTL-FT process is depicted in Figure 110
Fig110 Flow sheet of the Biomass to Liquid via FischerndashTropsch Synthesis (BTL-FT)
process [44]
It is difficult to predict the composition of the gas product from a gasifier due
to the complex reactions occurred during the gasification Table 13 shows the
typical composition of gas produced from gasification of wood and charcoal
with low to medium moisture content with ambient air as the gasifying agent
in a downdraft gasifier [45] and composition of bio-syngas from biomass
gasification [46ndash48]
Chapter 1 General Introduction
41
At present the main commercial interest in FTS is the production of high
quality sulphur-free synthetic diesel fuels from natural gas currently being
flared at crude oil production wells [49-52] This renewed interest in FTS has
not just only come about as a result of abundant supply of natural gas but also
because of the global development of fuel supplies and environmental
regulations to improve air quality in cities around the world
All these facts have recently aroused renewed interest in the FischerndashTropsch
Synthesis Synthetic diesel is being promoted by the fuel industry because it
can produce super clean diesel oil fraction with high cetane number (typically
above 70) without any sulfur and aromatic compounds with low particulate
formation and low NOx and CO emission [3-4 53] as the most viable next step
towards the creation of a sustainable transport industry
Table 13 Composition of gas produced from gasification of wood and charcoal in
ambient air [45] and also the composition of typical nitrogen free bio-syngas [46ndash48]
Component Wood gas (air) Charcoal gas (air) Bio-syngas
(nitrogen free)
N2 50ndash60 55ndash65 0
CO 14ndash25 28ndash32 28ndash36
CO2 9ndash15 1ndash3 22ndash32
H2 10ndash20 4ndash10 21ndash30
CH4 2ndash6 0ndash2 8ndash11
C2H4 na na 2ndash4
BTX na na 084ndash096
C2H5 na na 016ndash022
Tar na na 015ndash024
Others na na lt0021
Chapter 1 General Introduction
42
3 Viability of GTL for the gas market
According to Brown [54] between 1950 and 2010 global volumes of GTL
product output capacity had materialized at less than 100000 bd -roughly
equivalent to the output of just one average- sized east European refinery
However the recent confluence of several factors has altered the commercial
viability of the GTL industry suggesting that wide margins and robust revenues
can be earned by converting natural gas into clean-burning liquid fuels and
other high value oil-linked commodities Broadly speaking these factors are
1) Improvements in the lifespan of the catalysts used to derive hydrocarbon
chains from natural gas (methane) and efficiency gains in the Fischer Tropsch
processes
2) The detachment of natural gas markets from oil prices and the subsequent
wide differential between the two prices courtesy of the unconventional gas
boom
3) Long-term global demand trends favouring low-emissions fuels in the
transport sector
Despite these auspicious circumstances however this paper argues that GTL
fuels will have only a limited reach into oil product markets and the transport
sector going forward While downward pressure on natural gas prices and
increasing demand for clean-burning motor fuels have ushered in visions of a
new future of transport fuels (that) will soon go global [55] the transient
conditions that had supported a favourable outlook for the proliferation of GTL
liquid fuels over the period of 2009-12 have more recently shown signs of
deterioration Moreover alternative and less capital-intensive pathways to
natural gas monetization are emerging via small-scale modular GTL plants
whose development has been encouraged by the rapidly increasing supply of
Chapter 1 General Introduction
43
unconventional and associated gas which has necessitated more practical and
localized gas monetization solutions
Commodity prices for transport fuels such as diesel are closely correlated to
crude price movements (see Fig 110) and moreover trade at a premium to
crude benchmarks depending on regional dynamics such as product balances
and cyclical demand conditions GTL products sharing identical physical
characteristics with crude-refined diesel have the potential to exploit not only
the market price differential between gas feedstock and oil prices but in
addition the spread between oil benchmark prices and oil product markets
The confluence of these dynamics leads to significantly wider margin potential
than that experienced by crude-refined alternatives in oil product markets at
least in a context defined by high oil and low gas prices Accordingly the upside
revenue potential of large-capacity GTL builds is dictated by the relatively
straightforward principle that the more capacity dedicated to products trading
at a premium to crude a plant has the higher the plants revenues will be
Fig 111 Correlation between ultra-low sulphur diesel spot prices and Brent crude
Europe offers an ideal destination for GTL-derived diesel A combination of
stringent fuel quality specifications and declining domestic supply supports a
healthy environment for gasoil and diesel imports Moreover the oil product
market is predominately driven by gasoildiesel consumption which accounted
Chapter 1 General Introduction
44
for well over half (56 per cent see Fig 111) of main product demand in 2012
As such the current application and commercialization of GTL diesel in Europe
reflects the potential of GTL diesel to impact global gasoil markets
Fig 112 Europe main oil product demand (2012)
In order to meet supranational carbon emissions targets progressively tighter
EU-wide Fuel Quality Directives have mandated a sharp reduction of sulphur
content in gasoildiesel marketed within the European Union The
specifications for sulphur content in motor fuels (gasoline and diesel) in the
road sector were reduced from 350 parts per million (ppm) in 2000 to just 10
ppm in 2009 The legislation was amended in 2011 to encompass gasoil and
diesel consumed in off-road sectors such as railways and inland navigation
and by 2012 10 ppm gasoil accounted for an estimated 80 per cent of Europe-
wide gasoil demand [54]
The gasoil produced by refineries in Europe has varying physical characteristics
in terms of sulphur content (affecting particulate emissions) cetane index
(influencing ignition quality in combustion engines) and viscosity (affecting
energy content and fuel efficiency) each influencing market value
It has been estimated that FT-GTL should be viable at crude oil prices of about
$20 per barrel The oil price has been well above $70 per barrel (more recently
Chapter 1 General Introduction
45
it has even topped above $100 per barrel) making it a very appealing for
countries that have huge reserves of natural gas but little local market for it
and no major pipeline infrastructure to ship it to larger economies
In Fig 112 it can be seen a geographical representation of the world proved
reserves for 2011
Fig 113 World proved reserves 2011 [37a]
12 Fischer Tropsch GTL Process and Chemistry
According to [56] the basic FT-GTL process consists of three fundamental steps
which require significant supporting infrastructure and a secure feed gas supply
to function effectively (Fig 113)
1 The production of synthesis gas (syngas) The carbon and hydrogen are
initially divided from the methane molecule and reconfigured by steam
reforming andor partial oxidation The syngas produced consists
primarily of carbon monoxide and hydrogen
2 Catalytic Fischer Tropsch synthesis The syngas is processed in Fischer-
Tropsch reactors of various designs depending on technology creating a
wide range of paraffinic hydrocarbons product (synthetic crude or
Chapter 1 General Introduction
46
syncrude) particularly those with long chain molecules (eg those with
as many as 100 carbons in the molecule)
3 Cracking-product workup The syncrude is refined using conventional
refinery cracking processes to produce diesel naphtha and lube oils for
commercial markets [57] By starting with very long chain molecules
the cracking processes can be adjusted to an extent in order to produce
more of the products in demand by the market at any given time In
most applications it is the middle distillate diesel fuel and jet fuels that
represent the highest-value bulk products with lubricants offering high-
margin products for more limited volume markets In modern plants
FT-GTL unit designs and operations tend to be modulated to achieve
desired product distribution and a range of products slates [58]
Fig 114 Large scale FT-GTL projects become more economically robust for the
developer if they involve integrated upstream and downstream components securing
feed gas supplies and additional revenues from NGL and condensate extracted from
the feed gas [56]
Chapter 1 General Introduction
47
The Fischer Tropsch processes are not limited to using gas derived from large
conventional non- associated natural gas as a feedstock coal seam gas
associated gas coal or biomass can all be processed using FT technologies by
changing the catalysts and work conditions (Pressure and temperature) A
secure supply of feed gas from whatever origin is important for the
commercial viability of large-scale FT-GTL plants Integrated upstream and
downstream projects therefore offer GTL project developers lower-risk returns
1) The production of synthesis gas (syngas)
Synthesis gas (ldquosyngasrdquo) is typically produced using either partial oxidation or
steam reforming processes [59] Syngas is an intermediate gas feed for many
different petrochemical processes including a range of GTL alternative
technologies
Partial
Oxidation
CH4 + frac12O2 CO +
2H2 (exothermic)
The key components required for this approach include A combustion chamber operated at high temperatures (1200-1500degC) without catalysts Process designs to impede a competing reaction to syngas formation which involves the decomposition of methane to carbon black (due to high temperature non-catalytic nature of the chemistry) [59]
Steam
Reforming
CH4 + H2O CO + 3H2 (endothermic)
Steam reforming is usually carried out in the presence of catalyst ndasheg nickel dispersed in alumina in operating conditions involving temperatures of 850-940degC and pressure of about 3MPa The process is typically conducted in tubular packed reactors with heat recovery from flue gas used to pre-
Chapter 1 General Introduction
48
heat the feed gas or to raise steam in waste heat boilers Several well-established engineering companies offer their own variants of this process
Other possible reactions are
CO+ H2O CO2 + H2
CH4+ CO2 2CO + 2H2
2) Fischer-Tropsch synthesis
According to [55] Fischer-Tropsch synthesis is one of a several technologies to
polymerise the carbon and hydrogen components into long-chain molecules
CO + 2H2 -CH2- + H2O (very exothermic)
Which in practice operates more typically as
2CO (gas) + H2 (gas) (-CH2-)n (liquid) + CO2 (gas) + H2O
The process involves some carbon dioxide emission and watersteam
production along with the hydrocarbon liquid production
The typical FT reactions compete with the methanation (reverse of steam
reforming) reaction (and reactions that lead to the production of propane and
butane (LPG) which are also highly exothermic
CO + 3H2 CH4 + H2O
In order to promote FT reaction in preference to methanation (or LPG
reactions) the synthesis is run at low temperatures 220-350degC pressure 2-3
MPa with carefully selected catalysts (ie commonly cobalt) in reactors that
encourage the growth of long-chain hydrocarbon molecules Several
companies hold patents associated with XTL catalysts process vessels and
process sequences (eg Conoco Phillips CompactGTL ExxonMobil Rentech
Sasol Shell Syntroleum and others) however it is only Sasol and Shell that
have built large-scale commercial plants (iegt5000 barrelsday of GTL product)
Chapter 1 General Introduction
49
rather than pilot-scale or demonstration plants The industry therefore remains
in its infancy and the many patents held by relatively few companies act as a
costly barrier to entry for resource-rich gas companies and countries wishing to
use GTL as an alternative means of monetizing their gas
There are two major categories of natural gas-based FT process technology the
high-temperature and the low-temperature types
HTFT (High-Temperature Fischer-Tropsch) In HTFT because of the process
conditions and the catalysts involved the syncrude produced includes a high
percentages of short chain (ie lt10 carbon atoms) with significant amounts of
propane and butane mixed with olefins (eg propylene and butylene) These
short-chain hydrocarbons gases are typically extracted from the tail gas stream
utilizing cryogenic separation The resultant lean tail gas is recycled and mixed
with additional lean feed gas for further syngas production [60] The high-
temperature (HT) iron catalysts-based FT GTL process produces fuels such as
gasoline and diesel that are closer to those produced from conventional oil
refining The resultant GTL fuels are sulphur-free but contain some aromatics
[61] Typical process operation conditions for HTFT are temperatures of
approximately 320degC and pressures of approximately 25MPa Conversion in
HTFT can begt85 efficient [62] but not all the products are readily usable or
capable of producing high-quality transport fuels HTFT processes tend to be
conducted in either circulating fluidized bed reactors or fluidized bed reactors
[63]
LTFT (Low-Temperature Fischer-Tropsch) LTFT involves the use of low-
temperature (LT) cobalt-catalyst-based processes either in slurry-phase
bubble-column reactors (eg Sasol) or in multi-tubular fixed bed reactors (eg
Shell) LTFT produces a synthetic fraction of diesel (GTL diesel) that is virtually
free of sulphur and aromatics Typical process operation conditions for LTFT are
Chapter 1 General Introduction
50
temperatures of approximately 220degC to 240degC and pressures of approximately
20 to 25 MPa Conversion in LTFT is typically only about 60 with recycle or
the reactors operating in series to limit catalyst deactivation [62]
The primary focus of most large-scale FT technologies in current market
conditions is to produce high-quality low-emissions GTL diesel jet fuel and
naphtha (for petrochemical feedstock or gasoline blending)
3) Cracking ndash product workup
From [56] FT GTL plants can be configured to produce a wide range of
products from lubricating base oils and waxes through to petrochemical
naphtha and specialty chemicals Most of the already developed and planned
plants target the production of diesel fuels (C14-C20) together with some
kerosenejet fuel (C10-C13) naphtha (C5-C10) lubricants (gtC50) and a little LPG
(C3-C4)- By adjusting operating conditions in the Fischer Tropsch reactor the
mix of products can be altered This enables FT GTL products to be produced in
quantities that enable them to target the high-value product markets of
petroleum products produced by conventional oil refineries
However the yield pattern from a typical FT GTL plant is significantly different
to that rom a catalytic cracking crude oil refinery (Fig 114) Typically the
diesel yield of FT GTL plant is around 70 much higher than for crude oil
refineries which is typically some 40 [64]
From Fig 114 the products derived from upgrading syncrude produced by FT-
GTL differ significantly from those produced by refining barrel of crude oil
Notably FT GTL produces more high-value zero-sulphur products especially
middle distillates On the other hand refining crude oil particularly heavy oil
produces substantial quantities of low-value fuel oil ie more than prevailing
markets can consume Source modified from [65]
Chapter 1 General Introduction
51
Most oil refineries yield some low-value fuel oil the yield depending on the
quality of the fuel processed and the type and capacity of the refineryrsquos fuel-oil
conversion units By contrast the FT GTL plants are configured to yield only
higher-value (relative to crude oil) light and middle distillate products From a
plant with existing technology the yield of middle distillates (gasoildiesel and
kerosene) is nearly a third more of the total product slate than that from a
typical oil refinery [66]
As predicted a decade ago [67] globally diesel demand is growing rapidly at
some 3 a year more quickly than other refinery products Against this
backdrop refiners face significant challenges to meet diesel demand and
quality in the future as crude oil supply becomes heavier and sourer [68]
Fig 115 Refinery Volume Yields versus FT GTL Yields
From [56] for FT-GTL to be commercial at oil prices of less than about
40$barrel plant capital costs operating costs and feed gas costs all have to be
substantially lower on a unit basis than large-scale plants built in recent years
have been able to deliver If the unit capital cost of an FT-GTL plant is close to
100000$barrelday the operating cost of that plant is close to 20$barrel of
Chapter 1 General Introduction
52
product and the feed gas costs in the vicinity of 5$MMBtu the liquid products
would cost in the vicinity of 100$barrel and the economics of such as a plant
do not look so inviting in 2012 market conditions The industry has to achieve
lower plant and feed gas costs to be economically attractive
Fischer- Tropsch Synthesis Opportunities and challenges
GTL technologies offer the potential to reduce global dependency on crude-oil
derived transportation fuels They also offer substantial opportunities for the
owners of stranded gas to diversify the markets into which they deliver their
gas-derived liquid products particularly targeting the large and rapidly growing
global middle distillate markets (See Fig 116)
However the technologies are complex costly and tightly held by a few
companies holding patents for the key process steps which present significant
barriers to entry for building large-scale plants This also renders the building of
large-scale plants challenging for the gas resource holders in terms of capital
costs access to technology and long-term transfer of GTL technologies
At the current time Fischer Tropsch technologies dominate GTL applications for
large scale-plants Technology breakthroughs are required if methane-to-
gasoline or methane-to-olefin plants are to displace traditional refinery and
petrochemical routes to those products On the other hand dimethyl-ether
(DME) has a growing market in Asia particularly in China which is likely to
expand if the one-step process avoiding the production route via methanol is
successfully scaled up as planned and transportation fuel markets are
developed for DME
Chapter 1 General Introduction
53
Fig 116 The GTL Industry Opportunities and Challenges
References
[1] Michael Talmadge Mary Biddy and Abhijit Dutta Syngas Upgrading to Hydrocarbon Fuels Technology Pathway National Renewable Energy Laboratory Technical Report NRELTP-5100-58052 PNNL-22323 March 2013 httpwwwostigovbridge [2] C Pirola C Bianchi A Di Michele P Diodati S Vitali V Ragaini Catal Lett 131 294-304 (2009) [3] M S Hadnadev-Kostic J Tatjana T Vulic R Marinkovic-Neducin A D Nikolic B Jovic Journal of Serbian Chemical Society 76 (12) (2011) 1661ndash1671 [4]E Lira C Loacutepez F Oropeza M Bartolini J Alvarez M Goldwasser F Loacutepez J Lamonier J Peacuterez Journal of Molecular Catalysis A Chemical 281 (2008) 146ndash153 [5] Qinghong Zhang Jincan Kang and Ye Wang ChemCatChem 2 (2010) 1030 ndash 1058 [6] C Perego M Ricci Catalysis Science amp Technology (2012) 2 1776ndash1786 [7] GWHuber SIborra ACorma Chemical Reviews 106 (2006) 4044
Chapter 1 General Introduction
54
[8] PL Spath and DC Dayton Preliminary Screening - Technical and Economic Assessment of Synthesis Gas to Fuels and Chemicals with Emphasis on the Potential for Biomass-Derived Syngas NRELTP-510-34929 December 2003 [9] F Fischer and HTropsch BrennstChem 4 (1923) 276 [10] A Martinez C Lopez F Marquez IJ Diaz Catalysis 220 (2003) 486 [11] John L Casci C Martin Lok Mervyn D Shannon Catalysis Today 145 (2009) 38ndash44 [12] MEDry in Enciclopedia of Catalysis ITHorvarth Ed JWileyampSons New York (2003) 247 [13] Fischer-Tropsch Technology in Studies in Surface Science and Catalysis Elsevier New York (2004) [14] GPVaan Deer Laan AACMBeenackers Catalysis Reviews-SciEng 41(3amp4) (1999) 255 [15] HSchulz Applied Catal A 186 (1999) 3 [16] GP van der Laan AACMBeenackers Applied Catal A 193 (2000) 39 [17] RJOrsquoBrien LXu SBao ARaje BHDavis Applied Catalysis A general 196 (2000) 173 [18] V Roberto Calderone N Raveendran Shiju Daniel Curulla Ferreacute and Gadi Rothenberg Green Chemistry 2011 13 1950ndash1959 [19] E D Smit and B MWeckhuysen Chem Soc Rev 2008 37 2758ndash 2781 [20] Qinghong Z Weiping D Ye W Review Recent advances in understanding the key catalyst factors for Fischer-Tropsch synthesis J Ener Chem 2013 2227ndash38
[21] AY Khodakov WChu P Fongarland Chem Rev 107 (2007) 1692 [22] BHDavis Catal Today 84 (2003) 83 [23] GWHuber SIborra ACorma ChemRev 106 (2006) 4044 [24] J Xu CHBartholomew J Phys Chem B 109 (2005) 2392 [25] HB Zhang GL Schrader JCatal 95 (1985) 325 [26] ES Lox GB Marin E de Graeve P Bussiere Appl Catal A 40 (1988) 197 [27] PSabatier and JDSenderens CRHebdSeance AcadSci 134 514 680 (1902) [28] AMittash AdvCatal 2 (1950) 81 [29] EHoudry WFBurt AEPew WAPeters Pet Refiner 17 (1938) 574 [30] H Pichler AdvCatal 4 (1952) 271 [31] MEDry Chemtech 12 (1982) 744 [32] RBAnderson ACS SympSer 222 (1983) 389 [33] GNatta in ldquoCatalysisrdquo (PH Emmett ed) Vol3 p349 Van Nostrand-Reinhold Priceton New Jersey 1955 [34] GNatta UColombo IPasquon in ldquoCatalysisrdquo (PH Emmet Ed) Vol5 p131 Van Nostrand-Reinhold Princeton New Jersey 1957
Chapter 1 General Introduction
55
[35] RBAnderson Fuel 41 (1962) 295 [36] MJ Baird RRSchehl WPHaynes and JTCobb Ind Eng Chem Prod Res Dev 19 (1980) 175 [37] EIA Annual energy outlook 2013 Available at httpwwweiagovforecastsaeopdf0383(2013)pdf accessed on 16 august 2013 [37a] US Energy Information Administration Available at httpwwweiagovcountriesindexcfmview=reserves accesed on 16 august 2013 [38] MJ Prins KJ Ptasinski FJJG Janssen Fuel Process Technol 86 (2005) 375 [39] Klass DL Biomass for Renewable Energy Fuels and Chemicals Academic Press San Diego CA USA 1998 [40]Beenackers AACM Swaaij WPM Thermochemical Processing of Biomass Butterworth London UK 1984 [41] Demirbas A Energy Educ Sci Technol 17 (2006) 27ndash63 [42] Tijmensen MJA Faaij APC Hamelinck CN van Hardeveld MRM Biomass Bioenergy 23 (2002) 129ndash152 [43]Hamelinck CN Faaij APC den Uil H Boerrigter H Energy 29 (2004) 1743ndash1771 [44] J Hu F Yu Y Lu Catalysts 2 (2012) 303-326 [45] Stassen HEM Knoef HAM Biomass Technology Group University of Twente Enschede The Netherlands 1993 [46] Demirbas A Prog Energy Combust Sci 33 (2007)1ndash18 [47] Demirbas A Energy Sources A 29 (2007) 1507ndash1512 [48] Demirbas A Energy Sources A 30 (2008) 924ndash931 [49] MJPrins KJPtasinski FJJGJanssen Fuel Process Technol 86 (2005) 375 [50] CLIandoli SKjelstrup EnergyampFuels 21 (2007) 2317 [51] JJacometti AEkvall Shell in the Middle East 17 (2002) 1 [52] GCoupe Step on the gas in The Engineer 6 (2004) [53] T Fu Y Jiang J Lv Z Li Fuel Process Technol 110 (2013) 141ndash149 [54] C Brown The Oxford Institute for Energy Studies May 2013 ISBN 978-1-907555-74-9 Available on httpwwwoxfordenergyorgwpcmswp-contentuploads201305WPM-50pdf [55]K MacKenzie Financial Times 30 April 2013 httpftalphavilleftcom201304301473572where-are-all-those-natural-gas-fleet-conversions [56] D Wood C Nwaoha B Towler Journal of natural gas science and engineering 9 (2012) 196-208
Chapter 1 General Introduction
56
[57] Agee K Fundamentals of gas to liquids 2nd ed London Petroleum economist 29 (2005) 30-31 [58] Rahmin II Oil and gas Journal (2005) [59]Rahmin II Gas-to-liquid technologies Recent advances Economics Prospects 26th IAEE Annual International Conference June 2003 Prague Pp 1-36 [60] Minnie R et a 2005 Where it all began In Fundamentals of Gas to Liquids second ed Petroleum Economist London pp 27e29 (Chapter 28) [61] Waddacor M 2005 Converting gas into ultra-clean diesel in three steps In Fundamentals of Gas to Liquids second ed Petroleum Economist London pp 46-49 (Chapter 41) [62] De Klerk A 2012 Gas-to-liquids conversion In Natural Gas Conversion Technologies Workshop of ARPA-E US Department of Energy Houston TX 13 January 2012 [63] Velasco JA Lopez L Velasquez M Boutonnet M Cabrera S Jaras S 2010 Gas to liquids a technology for natural gas industrialization in Bolivia Journal of Natural Gas Science and Engineering 2 (5) 222e228 [64] Pytte T 2005 GTL diesel the way forward In Fundamentals of Gas to Liquids second ed Petroleum Economist London pp 32e35 (Chapter 31) [65] Fleisch TH Sills R Briscoe M Freide JF 2003 GTL-FT in the Emerging Gas Economy Fundamentals of Gas to Liquids Petroleum Economist p 39e41 [66] Corke M 2005 Securing a market In Fundamentals of Gas to Liquids second ed Petroleum Economist London pp 36e38 (Chapter 32) [67] Cherrillo RA Clark RH Virrels IG 2003 Shell Gas to Liquids in the Context of a Future Fuel Strategy e Technical Marketing Aspects 9th Diesel Engine Emissions Reduction Workshop Newport RI 24e28 Aug 2003 [68] Wood DA 2007 Consequences of a heavier and sourer barrel Petroleum Review April ed 30e32
57
Chapter 2 Chemistry of Fischer-Tropsch Synthesis
The FischerndashTropsch (FT) reaction is a heterogeneous catalytic reaction that
converts synthesis gas that is a mixture of carbon monoxide (CO) and
hydrogen (H2) into mainly linear hydrocarbons in the range C1 to C100 It is a
surface polymerization reaction that uses monomers formed by hydrogenation
of adsorbed CO in order to produce hydrocarbons and oxygenated products
with a broad range of chain length and functionality
The chemistry of the process can be described by the set of irreversible and
equilibrium reactions
According to Glasser et al [1] the FischerndashTropsch (FT) reaction mechanism is
still an issue of contention [2 3] Many apparently different mechanisms have
been proposed but common to them all is the concept that a stepwise chain
growth process is involved This is supported by the fact that the carbon
number product distributions calculated on probabilities of chain growth match
the experimentally observed results obtained in different reactor types and
sizes over widely varying process conditions with different catalysts [1]
There are some important aspects related to the FTS that will be discuss in this
chapter to better understand the chemistry of this process
1) FT thermodynamics
2) FT reaction mechanism
3) FT products selectivity
4) FT kinetics
5) Influence of FT process conditions
Chapter 2 Chemistry of Fischer Tropsch Synthesis
58
21 FT Thermodynamics
The Fischer-Tropsch Synthesis is a highly exothermic reaction [4]
n CO + (2n +1) H2 CnH2n+2 + n H2O Hdeg - 40 kcalmol (1)
n CO + 2n H2 CnH2n + n H2O Hdeg - 35 kcalmol (2)
n CO + 2n H2 CnH2n+1 OH + (n-1) H2O Hdeg - 35 kcalmol (3)
Thermodynamically the formation of methane and other hydrocarbons
is energetically favourable that means negative Gibbs energy values for
reaction (1)-(3)
In figure 21 standard Gibbs energy variation for the production of
hydrocarbons and alcohols is reported as a function of temperature
0
80
60
40
20
- 20
- 40
- 60
- 80
- 100
- 120
- 140
500 1000
Temperature K
G
degn
kJ
mol
of
CO
CH3OH
C2H5OH
CH4
C2H6
C2H4
C8H16
C4H8
Figure 21 Standard Gibbs energy of some FTS products [5]
From the diagram reported in figure 21 it can be deduced that methane
formation is highly favoured over that of the alcohols olefins and
hydrocarbons of heavier molecular weight In Fig 21 to keep all of the curves
on the same scale the enthalpy and free energy changes are divided by the
number of carbons atoms in the product Thus the equilibrium constant for
the reaction is given by RTnGnK exp 0
Chapter 2 Chemistry of Fischer Tropsch Synthesis
59
On the basis of thermodynamics a vast variety of molecules can be produced
in synthesis reaction up to 400degC and for some up to 500degC particularly at
elevated pressures including acetaldehyde and higher aldehydes ketones
esters Usually a broad spectrum of types of molecules carbon numbers and
carbon-chains structures is produced and the distribution of molecules
depends on the selectivity of the catalyst employed Generally the reaction
products are not in thermodynamic equilibrium with other product molecules
or reactants
Summarizing it is important to highlight some important aspects of the FT
thermodynamics
It is energetically possible to produce a vast array of hydrocarbons and organic
molecules by the hydrogenation of CO and related process such as the H2 + CO2
and the H2O + 3 CO reactions Most of these reactions are highly exothermic
A variety of reactions of synthesis products are thermodynamically possible
such as dehydration of alcohols hydrogenation of olefins hydrogenolysis of
paraffins and a number of isomerization reactions
On an energetic basis olefins and alcohols can be ldquoincorporatedrdquo into synthesis
reactions to produce higher molecular weight hydrocarbons in any amount
Paraffins element carbon or carbidic carbon can be ldquoincorporatedrdquo into
synthesis reactions to only a limited extent that is part of the carbon of the
hydrocarbon must come from H2 + CO
22 FT Reaction Mechanism
According to [6] FT synthesis follows the polymerization mechanism It is
generally accepted that CO undergoes dissociative or hydrogen-assisted
dissociative chemisorption on the surface of Ru Co or Fe metal or metal
Chapter 2 Chemistry of Fischer Tropsch Synthesis
60
carbide nanoparticles forming CHx (x = 0minus3) intermediates as the monomers
for polymerization The coupling between CHx monomers leads to chain
growth providing CnHm intermediates CnHm intermediates with different
carbon numbers can then undergo hydrogenation or dehydrogenation to
afford paraffins or olefins as the final products An early work pointed out that
the coupling between methylene (CH2) groups mainly accounted for the chain
growth but recent theoretical studies suggested that the situation was more
complicated [7-12] Depending on the identity and the structure of the surface
concerned the monomeric CHx species for polymerization may be different
The calculation of energy barriers suggests that the couplings of (CH+CH)
(C+CH) (C+CH2) or (CHx+HCO) may all be possible [7-12]
Since its discovery many efforts have been made to identify the surface
species that lead to chain initiation and chain growth The FT reaction
mechanism is still an issue of contention
There are some mechanisms like the mechanism proposed by Fischer in 1926
(lsquocarbidersquo theory) but it has a problem he did not explain the production of
relatively large amounts of oxygenated products ie alcohols
According to [13] elementary steps of FTS can be grouped into few basic sets
including
(1) reactant (CO and H2) adsorption
(2) CO activation (or chain initiation)
(3) chain propagation and
(4) chain termination (product formation)
Fig 22 shows possible CO activation steps in the carbide (also referred to as
the alkyl or methylene) and the CO-insertion mechanisms For the classical
carbide mechanism the CO activation step consists of a direct CO dissociation
(ie the C O bond is severed before C is hydrogenated) whereas in the CO-
Chapter 2 Chemistry of Fischer Tropsch Synthesis
61
insertion pathway CO is first hydrogenated and only then is the C O bond
broken to give the chain starter (CH3S) Newer modification of the carbide
mechanism assumes that hydrogen assists in the C O bond scission The
primary difference between the two mechanisms is the type of species being
inserted into the growing chain CHx for the carbide (most often CH2) and
adsorbed CO for the CO-insertion mechanism Storsaeligter et al [14] compared
versions of the two mechanismsndash carbide (including direct and H-assisted CO
dissociation) and CO-insertion ndash using the UBI-QEP (unity bond index ndash
quadratic exponential potential) method [15] and micro-kinetic modeling ofC1
and C2 species formation Their results showed that the chosen CO-insertion
pathway had a lower activation barrier compared to both direct and H-assisted
CO dissociation mechanisms that were utilized Based on these findings they
suggested that the CO-insertion mechanism is likely the main mechanism of
FTS
Fig 22 Examples of CO activation pathways (a) direct CO dissociation (carbide
mechanism) and (b) H-assisted CO dissociation (carbide mechanism) (c) CO hydrogenation (CO-insertion mechanism) [13]
Chapter 2 Chemistry of Fischer Tropsch Synthesis
62
The following Figure (23) [16] shows another representation of the chain
initiation growth and termination deeply find in literature
Chain Initiation
CO C O C O
M M M
+
C
M
H2
CH2
MCH3OH
H2O
INITIATION AND C1 COMPOUNDS
M
+ C
GRAPHITE
OHH
H2
H2
H2CH4
Chain Growth
Chain Termination
Fig 23 Different steps of the reaction mechanism in FTS
Fig 24 shows a simplified scheme for the formation of chain starters and
incorporation into growing chains The CH3 groups formed as a precursor to
methane are assumed to act as chain growth centres Addition of a hydrogen
atom produces methane while insertion of a CH2 group into the metal-carbon
Chapter 2 Chemistry of Fischer Tropsch Synthesis
63
bond of a CH3 group produces an ethyl group and continuation of this type of
reaction gives rise to a spectrum of adsorbed alkyl groups
C CH2CH
H H
CH3H
CH2
R
chain starter
chain growth
(incorporation)
CH3CH3
CH2
H
CH4
R
Fig 24 Simplified kinetic scheme of the successive hydrogenation of surface carbon
yielding chain starters and incorporation into growing chains
The oxygen released by CO dissociation is removed from the catalyst as either
H2O or CO2
As far as hydrogenation process is concerned there is still controversy on the
reaction mechanism first of all it is uncertain if the monomer formation
proceeds via hydrogenation of dissociated or undissociated CO Moreover
methyne methylene and methyl groups are assumed to be in equilibrium by
some authors on the basis of studies with metal clusters containing these as
ligands while others postulate that the hydrogenation of surface carbon and of
CHx species is an irreversible reaction
The nature of primary FT products reflects the nature of the surface bonded
intermediates from which they originate Primary hydrocarbon FT products are
preferentially straight chain terminal olefins and straight chain paraffins The
formation of primary paraffin molecule is represented as
Chapter 2 Chemistry of Fischer Tropsch Synthesis
64
R-CH2-CH2
HR-CH2-CH3
Terminally bonded (alpha) alkyl species on the catalyst surface can be
considered the most common intermediates
Olefin formation is represented as dissociative desorption from the alkyl
species (-elimination)
R-CH2-CH2R-CH=CH2 + H
The ratio probabilities of primary desorption as a paraffin or as an olefin is
commonly 025 That means that the reaction of desorption as a paraffin is
much less probable than the reaction of desorption as an olefin It is suggested
that the chain propagation is favoured against chain termination because of
the principle of lsquoselective inhibitionrsquo ie termination reaction are more
inhibited than propagation reaction by steric hindrance This effect is more
pronounced with paraffin than with olefin formation In fact while paraffin
desorption requiring the reaction between alkyl and H involves two metal
sites olefin desorption need an intermediate ie a transition state with and
bonding at the same metal site
R-CH2-CH2R-CH=CH2
HM M
R-CH=CH2 H
M
+
Chapter 2 Chemistry of Fischer Tropsch Synthesis
65
In both cases however this might not be easily accessible under the condition
of strong competitive chemisorption and strong spatial constraints
Chain termination can also occur by CO insertion into surface alkyls a step that
leads to the formation of predominantly primary alcohols [16]
23 FT Products Selectivity
The products from the FT on Co Fe and Ru show the following characteristics
[17]
1) the carbon-number distributions for hydrocarbons gives the highest
concentration for C1 and decrease monotonically for higher carbons
number although around C3-C4 often a local maximum is observed
2) Monomethyl-substituted hydrocarbons are present in moderate
amounts whereas dimethyl products are present in significantly smaller
amounts than monomethyl None of these branched products contain
quaternary carbons atom on Co Fe and Ru
3) Olefins from iron catalysts exceed 50 of the hydrocarbon products at
low carbon numbers and more than 60 of these -olefins The ethane
selectivity is low in comparison to propene The olefin content decrease
asymptotically to zero with increasing carbon number on Co Ru and Fe
catalysts
4) A change in chain growth parameter in the distribution is only observed
for linear paraffins and not for olefins
5) Yields of alcohols are maximal at C2 and decrease with carbon number
Low yields of methanol are probably the result of thermodynamic
limitations
Chapter 2 Chemistry of Fischer Tropsch Synthesis
66
Investigations of the carbon number spectrum based on the assumption of a
stepwise chain mechanism were carried out in considerable detail by several
authors
Herrington [18] described the distribution of paraffins wax using individual
chain termination probabilities for each chain size and he found that the
probability of chain growth in FT synthesis over a cobalt catalyst did not change
much with the chain length of the hydrocarbon
Anderson investigated the spectrum of a number of different catalysts The
plot of log Wnn against carbon number gave straight line over a fairly large
carbon number range (Wn is the mass fraction and n the carbon number) This
indicated again that the probability of chain growth was fairly constant [18]
Schulz modified and applied to the FT product spectrum the Flory equation
dealing with the product distribution in a polymerization process As pointed
out by Anderson the Schulz-Flory treatment was no different from the earlier
treatment and led to the equation henceforth referred as the Anderson-
Schulz-Flory (ASF) model
Wnn = (1- ) 2
n-1 (1)
where n is the number of carbon atoms in the product Wn is the weight
fraction of product containing n carbon atoms is the chain growth
propagation probability expressed by the equation
= rp (rp + rt) (2)
where rp is the propagation rate constant and rt is the termination rate
constant
The value is independent of carbon number it is estimated by a least-
squares linear regression of the logarithmic form of equation (3) the slope and
intercept both yielding
ln (Wnn) = ln (1-)2 + (n-1) ln (3)
Chapter 2 Chemistry of Fischer Tropsch Synthesis
67
Different factors have an influence on the alpha parameter such as process
conditions type of catalyst and chemical promoters [19 20] The ASF product
distribution as a function of α is depicted in Figure 25
The ASF equation did not distinguish between different product types In
practice a multicomponent product mixture is formed According to the ASF
model the maximum selectivity toward C2minusC4 olefins is achieved with an alpha
value between 04 and 05 One of the most efficient ways of shifting product
selectivity to low alpha values is by increasing reaction temperature However
a decrease on the chain growth probability results in an increase of methane
selectivity as indicated by the ASF product distribution This effect was long
considered a major restriction for the industrial application of the direct
conversion of syngas into lower olefins via the FischerminusTropsch synthesis [21
22] Negative deviations of the ASF model for methane selectivity have been
observed for iron-based catalysts [23 24] Schwab et al [23] proposed that Fe
catalysts possess different catalytic sites some in charge of CminusC coupling for
the growth of the carbon chain and others responsible for methane formation
Fig 25 AndersonminusSchulzminusFlory (ASF) model for the prediction of product distribution
Deviations from ASF Distribution Anderson-Schulz-Flory Distribution is a well-
accepted model for describing product selectivity in FT synthesis especially for
Chapter 2 Chemistry of Fischer Tropsch Synthesis
68
its simplicity nevertheless significant deviations have been noticed and
reported in literature
1) Methane selectivity is in general higher than predicted theoretically by ASF
kinetics Several mechanisms have been postulated to explain these
experimental data [25-26]
2) Anomalies of Ethane and Ethene The maximum C2 selectivity is expected to
be about 30 wt while in practice the maximum found is only about 18 wt It
is commonly observed for iron as well as for cobalt and ruthenium catalysts
that the C2 selectivity is lower than the C1 and C3 selectivity [17]
3) Change in Chain Growth Parameter is defined by ASF model as a
parameter independent of the product carbon number n nevertheless it has
been observed that at a carbon number of about 10 the slope of the
semilogarithmic mole fractions of hydrocarbons against carbon number
increases This phenomenon has been described on iron cobalt and ruthenium
catalysts [27] Suggestions for the increased chain growth parameter or two
probabilities of chain growth are the occurrence of different catalytic sites [28]
or the existence of different chain termination reactions [25] Several attempts
to model hydrocarbon distribution with two different values of have been
reported However the assumption of multiple catalytic sites cannot explain
the decrease of the olefin-to-paraffin ratio with increasing chain length
decreasing space velocity and increasing H2CO ratios in the reactor Kuipers et
al [29] stated that the occurrence of secondary reactions gives the most
reasonable explanation for the deviations from the ASF distribution
24 FT kinetics According to Glasser et al [1] kinetic models of FTS on cobalt iron and
ruthenium catalysts have received considerable attention [30-35] from
Chapter 2 Chemistry of Fischer Tropsch Synthesis
69
researchers in the past but not recently The major problem in describing the
FT reaction kinetics is the apparent complexity of the reaction mechanism and
the large number of species involved When one looks at the kinetic studies in
the literature one finds that there are a variety of rate expressions as well as a
wide range of activation energies for both Co and Fe catalysts This raises
questions about which of these data kinetic parameters and rate expressions
can be relied on for estimating reaction rates andor conducting preliminary
reactor design [36] This strongly suggests that the complex FT reaction
behavior may not be described efficiently by kinetics alone This point is
addressed at a later stage
However the proposed mechanism used a variety of surface species and
different elementary reaction steps resulting in empirical power-law
expressions for the kinetics However also Langmuir-Hinshelwood-Hougen-
Watson (LHHW) and Eley-Rideal type of rate equations have been applied
based on a reaction mechanism for the hydrocarbon-forming reactions In most
cases the rate-determining step was assumed to be the formation of the
monomer These rate expressions for the consumption of synthesis gas mainly
differ in the monomerrsquos nature and in the adsorption of CO H2 and products
(H2O and CO2) on the catalyst surface Ideally the development of kinetic rate
expressions should be based on each possible rate determining process in a
well-defined mechanistic scheme in the hydrocarbon forming reactions Kinetic
studies of the consumption of synthesis gas on cobalt and in particular way
iron catalysts will be discussed in detail in this chapter Kinetic models which
describe the rate of formation of products and the water gas shift reaction will
not be discussed here their studies are reported in [17 37]
1) Overall conversion of synthesis gas
Chapter 2 Chemistry of Fischer Tropsch Synthesis
70
The kinetic rate equations presented for the synthesis-gas consumption do not
present a uniform picture In general the FT synthesis is simplified as a
combination of the FT reaction and the water-gas-shift reaction
CO + (1 + m2n) H2 1n CnHm + H2O (RFT) (4)
CO + H2O CO2 + H2 (RWGS) (5)
where n is the average carbon number and m is the average number of
hydrogen atoms of the hydrocarbon products Water is a primary product of
the FT reaction and CO2 can be produced by the water-gas-shift reaction
(WGS) Iron based catalysts show a high WGS activity unlike Co and Ru based
catalysts That is reflected by the different kinetic expressions
Kinetic equation can be based on the overall synthesis gas consumption (-
RH2+CO = -RCO ndash RH2) which is independent of the WGS equilibrium or based on
CO consumption to hydrocarbon product (RFT = -RCO ndash RWGS) The rate of
synthesis gas consumption only differs from the FT reaction rate by reaction
stoichiometry -RH2+CO = (2 + m2n) RFT The kinetic rate equations presented for
the synthesis gas consumption do not present a uniform picture Table 21 [17]
gives an overview In general catalyst composition as well as reaction
conditions determine the numerical values of the intrinsic rate parameter
Moreover the rate equations are not identical thus k can be decomposed of
different combinations of kinetic and adsorption constant There is
experimental evidence that the FT activity of Fe and Co depends on the
preparation method metal loading of the catalyst and catalyst support
Table 21 Reaction rate equation for overall synthesis gas consumption rate
proposed in Ref [17]
Chapter 2 Chemistry of Fischer Tropsch Synthesis
71
Kinetic
expression
type
Kinetic expression
(a) 2HkP
(b) b
CO
a
H PkP2
(c) OHCO
COH
aPP
PkP
2
2
(d) OHHCO
COH
aPPP
PkP
22
2
2
(e) 2
2
2
2
1 HCO
COH
PaP
PkP
(f) 2
2
COCO
COH
aPP
PkP
(g) 22
2
COOHCO
COH
bPaPP
PkP
(h) 22121
2121
2
2
1 HCO
HCO
bPaP
PkP
(i) 221
21
2
2
1 HCO
HCO
bPaP
PkP
(h) 21
2
CO
HCO
bP
PkP
25 Influence of FT process conditions
A Temperature
Chapter 2 Chemistry of Fischer Tropsch Synthesis
72
The influence of temperature on the selectivity is considerable for all FT
catalysts As the operating temperature is increased the product selectivity
shifts to products with a lower carbon number on iron ruthenium and cobalt
catalysts Increasing the temperature the CO conversion increases but the
WGS reaction increases too mainly with iron based catalysts
B Partial pressure of H2 and CO
Most studies show that the product selectivity shifts to heavier products and to
more oxygenates while increasing total pressure Increasing H2CO ratios in the
reactor results in lighter hydrocarbons and lower olefin content Donnelly and
Satterfield [38] observed a decreased of the olefin to paraffin ratio from 6 to 1
by increasing the H2CO ratio from 03 to 4 Sufficiently high CO pressures
inhibit secondary reactions ie olefin isomerization hydroformilation
hydrogenation and oligomerization
C Space Velocity
The influence of space velocity of the synthesis gas (residence time) on the
selectivity has been investigated The increase of the olefin to paraffin ratio
with increasing space velocity (thus a decrease of the conversion) was
observed The selectivity to methane and olefins decreases with a decrease of
the space velocity whereas the selectivity toward paraffins remains
unchanged These findings can be ascribed by an enhancement of secondary
reactions as the residence time and the concentration of reactive -olefins
increase within bed interstices and catalyst pellets [17]
D Time-on-stream
It is known that catalyst deactivation may occur at reaction conditions and that
may affect the activity and selectivity of a catalytic system An increase of the
Chapter 2 Chemistry of Fischer Tropsch Synthesis
73
methane selectivity and low molecular weight products is observed on iron
catalyst [17] These selectivity changes can be ascribed to carbonaceous
deposits formed on sites with potassium promoters Moreover sintering leads
to a reduction of the surface area hence lowering the catalyst activity High
water pressures enhance agglomeration of initially small crystallites
E Conversion
The influence of CO conversion on the reaction selectivity must be related to
the decrease of CO partial pressure and the increase of water partial pressure
with high levels of conversion Low CO partial pressures (ie high CO
conversion) imply that secondary hydrogenation reaction are less inhibited
hence olefins are hydrogenated to inactive paraffins so that olefin selectivity
decreases Moreover secondary-cracking reactions may occur especially if high
temperature is adopted to increase conversion hence methane selectivity
increases
A schematic view of the general influence of different parameters on the
selectivity is given in Table 22
Table 22 Selectivity control in F-T synthesis by process conditions ( =
increase with increasing parameter = decrease with increasing parameter
= complex relation) From [17]
Parameter Chain Lenght
Chain branching
Olefin Selectivity
Alcohol Selectivity
Carbon deposition
Methane Selectivity
Temperature Pressure H2CO Conversion Space Velocity
Chapter 2 Chemistry of Fischer Tropsch Synthesis
74
References
[1] David Glasser Diane Hildebrandt Xinying Liu Xiaojun Lu and ornelius M Masuku Current Opinion in Chemical Engineering 2012 1296ndash302 [2] Gaube J Klein H-F J Mol Catal A Chem 2008 28360-68 [3] Davis BH Catal Today 2009 14125-33 [4] RBAnderson Academic Press (Harcourt Brace Jovanovich Publishers (1984) Chapter 2 [5] RBAnderson CBLee JCMachiels CanJChemEng 54 (1976) 590 [6] Qinghong Z Weiping D Ye W J Ener Chem 2013 2227ndash38 [7] Ciobıca I M Kramer G J Ge O Neurock M van Santen R A J Catal 2002 212(2) 136 [8] Cheng J Gong X Q Hu P Lok C M Ellis P French S J Catal 2008 254(2) 285 [9] Lo J M H Ziegler T J Phys Chem C 2007 111(35) 13149 [10] Cheng J Hu P Ellis P French S Kelly G Lok C M J Phys Chem C 2008 112(15) 6082 [11] Cao D B Li Y W Wang J G Jiao H J J Mol Catal A 2011 346(1-2) 55 [12] Zhao Y H Sun K J Ma X F Liu J X Sun D P SuH Y Li WX Angew Chem Int Ed 2011 50(23) 5335 [13] B Todic Wenping M G Jacob BH Davis Dragomir B Bukur Catal Today (2013) httpdxdoiorg101016jcattod201308008 [14] S Storsaeligter D Chen A Holmen Surf Sci 600 (2006) 2051ndash2063 [15] E Shustorovich H Sellers Surf Sci Rep 31 (1998) 1ndash119 [16] C Pirola PhD 2007-2008 Novel supported iron based Fischer-Tropsch catalysts Preparation characterization and applications [17] GPVan Der Laan AACM Beenackers CatalRev-SciEng 41 (3amp4) (1999) 255 [18] APSteynberg MEDry (Editors) Fischer Tropsch Technology Studies in surface science and catalysis 152 (2004) p623 [19] Hirsa M Torres Galvis and Krijn P de Jong ACS Catal 2013 3 2130minus2149 [20] Abello S Montane D ChemSusChem 2011 4 1538minus1556 [21] Wang C Xu L Wang Q J Nat Gas Chem 2003 12 10minus16 [22] Janardanarao M Ind Eng Chem Res 1990 29 1735minus1753 [23] Schwab E Weck A Steiner J Bay K Oil Gas Eur Mag 2010 1 44minus47 [24] Torres Galvis HM Bitter JH Khare CB Ruitenbeek M Dugulan AI De Jong KP Science 2012 335 835minus838 [25] Sarup and B W Wojciechowski Can J Chem Eng 66 (1988) 831 [26] C H Bartholomew W Lee Stud Surf Sci Catal 130 (2000) 1151 [27] RBAnderson The Fischer Tropsch Synthesis Academic Press inc (1984)
Chapter 2 Chemistry of Fischer Tropsch Synthesis
75
[28] G A Huff Jr and C N Satterfield Ind Eng Chem Process Des Dev 24 (1985) 407 [29] E W Kuipers I H Vinkenburg and H Oesterbeek J Catal 152 (1995) 137 [30] Dry ME Conversion of Syngas to Fuels and Chemicals Int Conf on Catal amp Catal Proc Cape Town South Africa 199357-66 [31] Dry ME Appl Catal A 1996 138319-344 [32] Maitilis PM Quyoum R Long HC Turner ML Appl Catal A 1999 186363-374 [33] Ribeiro FH von Wittenau AES Bartholemew CH Somorjai GA Catal Rev Sci Eng 1997 3949-76 [34] Huff GA Jr Satterfield CN Ind Eng Chem Process Des Dev 1984 23696-705 [35] Zimmerman WH Bukur DB Can J Chem Eng 1990 68292-301 [36] Bartholomew CH Farrauto RJ New Jersey Wiley 2006 [37] DPinna ETronconi LLietti RZennaro PForzatti La Rivista dei Combustibili 56 fasc2 (2002) 69 [38] TJDonnelly and CNSatterfield ApplCatalA 52 (1989) 93
76
Chapter 3 Catalysts for Fischer Tropsch Synthesis
The core of any FT process is its catalyst Only a few metals show catalytic
activity in the FT synthesis [1] As explained before the reaction is generally
assumed to start with the adsorption of CO on the catalyst surface where it
reacts with adsorbed hydrogen to afford a methylene group which in its turn
is responsible for the CndashC chain growth Probably at least two reaction paths
co-exist for the initial steps of the FT reaction one in which carbon monoxide is
adsorbed in a dissociative way (ie its CndashO bond is cleaved before any possible
reaction with hydrogen) and another in which some hydrogenation by
adsorbed hydrogen atoms precedes the CndashO cleavage [2]
So a good catalyst should adsorb both CO possibly in a dissociative way and
H2 Furthermore since metal oxide formation is always possible under FT
conditions either by dissociative CO absorption or by metal reaction with co-
produced water the metal oxide should be easily reduced under the reaction
conditions With this respect most early transition metals are not good FT
catalysts because despite their favorable CO adsorption they form very stable
oxides that are not reduced under FT conditions Iridium platinum and
palladium adsorb CO in a non-dissociative manner while metals of groups 11
and 12 hardly adsorb it none of them is an effective FT catalyst The specific
activities (ie the reaction rates per unit surface area of metal) of most of the
metals of the former Group VIII (all but osmium) were assessed under
comparable conditions and ruthenium proved to be the most active catalyst
As expected on the basis of the classical work by Sabatier (1902) nickel (and
even to a larger extent palladium) showed very high selectivity towards
Chapter 3 Catalysts for Fischer Tropsch Synthesis
77
methane formation obviously a feature not appreciated in a FT catalyst [2]
Osmium was successively evaluated but turned out to be ca 100 times less
active than ruthenium So the best FT catalysts are based on iron cobalt and
ruthenium with nickel rhodium and osmium (and possibly rhenium) being
moderately active (Fig 31) [3]
Fig 31 Catalytic activity of transition metals in the FT reaction Blue denotes early transition metals able to adsorb CO in a dissociative way they however show poor or no capability to adsorb H2 and their oxides are not reduced under usual FT conditions
accordingly these metals are not active FT catalysts Orange denotes late transition metals and a few main group elements which show poor or no CO adsorption and no FT activity Yellow shaded elements have good H2 adsorption capability and reducible oxides they however adsorb CO in a non-dissociative way and as a matter of fact are poor FT catalysts Brilliant green denotes the best FT catalysts Nickel rhodium
osmium and possibly rhenium (pale green) are moderately active [3]
However FT industrial plants require huge amounts of catalyst and ruthenium
is too rare and expensive to be used on this scale As a matter of fact cobalt
and iron are the only metals of choice for industrial applications Iron is
obviously cheaper than cobalt but to select between them a key issue is the
carbon feedstock Iron is a good water gas shift catalyst and for this reason is
particularly suitable for hydrogen-poor syngas such as those obtained from
coal or biomasses Cobalt performs better with an almost stoichiometric ratio
between hydrogen and carbon monoxide so it is preferred when the carbon
feedstock is natural gas Alternatively cobalt can also be used with hydrogen-
poor syngas provided that the H2CO molar is adjusted by a WGS unit between
the gasification and the FT reactors [1]
Chapter 3 Catalysts for Fischer Tropsch Synthesis
78
Apart from methane (which usually forms in amounts higher than expected)
the FT products distribution follows the AndersonndashSchulzndashFlory model [2] So
the FT output is always a complex mixture of products ranging from methane
to waxes formed by high molecular weight linear paraffins as explained before
A proper choice of catalyst and reaction conditions allows tuning to some
extent the composition of the final mixture but it is impossible to force the
process to produce selectively a well-defined range of products ie middle
distillates So the best strategy to maximize diesel production is to select
conditions which allow obtaining the maximum amount of long chain linear
paraffins that can be then fed to a hydrocracking stage transforming them into
a most valuable fuel
Cobalt and iron are the metals which were proposed by Fischer and Tropsch as
the first catalysts for syngas conversion Both cobalt and iron catalysts have
been used in the industry for hydrocarbon synthesis A brief comparison of
cobalt and iron catalysts [4] is reported in Table 31 Cobalt catalysts are more
expensive but they are more resistant to deactivation Although the activity at
low conversion of two metals is comparable the productivity at higher
conversion is more significant with cobalt catalysts Water generated by FT
synthesis slows the reaction rate on iron to a greater extent than on cobalt
catalysts At relatively low temperatures (200 - 250degC) chain growth
probabilities of about 094 have been reported [5] for cobalt-based catalysts
and about 095 for iron catalysts The water-gas shift reaction is more
significant on iron than on cobalt catalysts [4]
Iron catalysts usually produce more olefins Both iron and cobalt catalysts are
very sensitive to sulphur which could readily contaminate them For iron-
based catalysts the syngas should not contain more than 02 ppm of sulphur
For Co catalysts the amount of sulphur in the feed should be much less than
Chapter 3 Catalysts for Fischer Tropsch Synthesis
79
01 ppm Cobalt catalysts supported on oxide supports are generally more
resistant to attrition than iron co precipitated counterparts they are more
suitable for use in slurry-type reactors Iron catalysts produce hydrocarbons
and oxygenated compounds under different pressures H2CO ratios and
temperatures (up to 340degC) Cobalt catalysts operate at a very narrow range of
temperatures and pressures an increase in temperature leads to a spectacular
increase in methane selectivity Iron catalysts seem to be more appropriate for
conversion of biomass-derived syngas to hydrocarbons than cobalt systems
because they can operate at lower H2CO ratios [4]
Table 31 Comparison of Cobalt and Iron FT catalysts [4]
Parameter Cobalt catalyst Iron Catalyst
Cost More expensive Less expensive
Lifetime
Resistant to deactivation Less resistant to deactivation (coking carbon deposit iron carbide)
Activity at low conversion comparable
Productivity at high conversion
Higher less significant effect of water on the rate of CO conversion
Lower strong negative effect of water on the rate of CO conversion
Maximal chain growth probability
094 095
Water gas shift reaction Not very significant more noticeable at high conversion
Significant
Maximal sulphur content lt 01 ppm lt 02 ppm
Flexibility (temperature and pressure)
Less flexible significant influence of temperature and pressure on hydrocarbon selectivity
Flexible CH4 selectivity is relatively low even at 340degC
H2CO ratio 2 05-25
Attrition resistance Good (always supported) Not very resistant if not
supported
Chapter 3 Catalysts for Fischer Tropsch Synthesis
80
A large number of studies have pointed out that various factors can influence
the catalytic behaviors of a FT catalyst As summarized in Table 32 besides the
engineering factors such as reactor design and operation conditions [6-10]
there exist many catalyst factors which can exert significant influences on the
activity and product selectivity
Table 32 Typical key factors influencing the activity and product selectivity of a FT
catalyst [11]
Engineering factors Catalyst factors
(i) Reactor design
(ii) Operation
conditions
(i) identity of active metal (Ru Co or Fe) (ii) chemical state of active phase (metal oxide or carbide) (iii) support (identity pore structure physicochemical properties) (iv) promoter (typically including noble metals oxides of Mn Zr or rare earth metals alkali metal ions) (v) size of active phase (vi) microenvironment of active phase
31 Iron and Cobalt industrial FT catalysts i) Iron catalysts With iron catalysts two directions of selectivity have been
pursued One direction has aimed at a low molecular weight olefinic
hydrocarbon mixture to be produced in an entrained phase or fluid bed process
(Sasol Synthol process) Due to the relatively high reaction temperature
(340degC) the average molecular weight of the product is so low that no liquid
product phase occurs under reaction conditions The catalyst particles moving
around in the reactor are small (dp =100 mm) [12] and carbon deposition on
the catalyst does not disturb reactor operation Thus low catalyst porosity with
Chapter 3 Catalysts for Fischer Tropsch Synthesis
81
small pore diameters as obtained from fused magnetite (plus promoters) after
reduction with hydrogen is appropriate For maximising the overall gasoline
yield the olefins C3 C4 have been oligomerised at Sasol However recovering
the olefins for use as chemicals in eg polymerisation processes is
advantageous today [13]
The second direction of iron catalyst development has aimed at highest
catalyst activity to be used at low reaction temperature where most of the
hydrocarbon product is in the liquid phase under reaction conditions Typically
such catalysts are obtained through precipitation from nitrate solutions A high
content of a carrier provides mechanical strength and wide pores for easy mass
transfer of the reactants in the liquid product filling the pores The main
product fraction then is a paraffin wax which is refined to marketable wax
materials at Sasol however also can be very selectively hydrocracked to a high
quality Diesel fuel Thus iron catalysts are very flexible Selective FT synthesis of
linear terminal olefins seems only possible with iron catalysts Alkalised iron FT
catalysts exhibit water gas shift activity (in contrast to cobalt catalysts) This is a
favourable feature for FT synthesis with CO-rich syngas as obtained from high
temperature coal- or heavy-oil-gasification through partial oxidation (H2CO
molar ratio =10) however it is undesirable for FT synthesis with hydrogen-rich
syngas as produced from natural gas The activity of iron catalysts decreases
through product inhibition by water [14] This feature restricts the attainable
degree of conversion and leads to gas recycle operation after water removal
together with the organic condensate
ii) Cobalt catalysts Cobalt catalysts have been applied in the first FT plant of
Ruhrchemie in 1935 Present catalyst design makes use of several preparation
techniques however the intention to produce a well-dispersed cobalt phase in
a wide pore support remains the same Today cobalt catalysts for FT Diesel
Chapter 3 Catalysts for Fischer Tropsch Synthesis
82
production from natural gas are designed for a maximum wax selectivity the
waxy product then being the feed for hydrocracking Hydrocracking of FT
paraffins follows the kinetic regime of lsquoideal hydrocrackingrsquo as observed by
Schulz and Weitkamp [15] always the largest molecules are cracked selectively
and no secondary cracking occurs With cobalt catalysts olefin readsorption on
FT sites takes place and this contributes significantly to the desired high wax
selectivity This implies that olefin secondary hydrogenation and double bond
shift should be kept low Diesel fuel selectivity approaching 80 can be
obtained by the process combination FT synthesishydrocracking [15]
32 Chemical State of active phase As explained before the typical active metals used for FT synthesis are Fe Co
and Ru According to [11] the current consensus is that metallic Co and Ru ie
Co0 and Ru0 nanoparticles function as the active phases for CO hydrogenation
to heavier hydrocarbons whereas iron carbides are responsible for CO
hydrogenation [16] However deeper knowledge about the effects of different
chemical states of these active phases on catalytic performances is still needed
for the rational design of an efficient FT catalyst
21 Co-based catalysts
Metallic Co may exist in two different crystalline forms ie fcc and hcp
phases For bulk Co the hcp phase is more stable at lower temperatures but
the fcc phase becomes more stable when the size of Co particles becomes less
than 20 nm [17] However the actual crystalline structure of Co catalyst under
working conditions is not well known The formation of Co2C may cause the
catalyst deactivation Another recent work also demonstrated that the
deactivation of Co-based catalyst was due to the carbide formation and carbon
deposition [18] The prolonging of the time on stream caused the partial
Chapter 3 Catalysts for Fischer Tropsch Synthesis
83
decomposition of the bulk Co2C to Co0 and increased the conversion of CO and
the selectivity to heavier hydrocarbons
22 Fe-based catalysts
Iron carbides are easily formed under FT reaction conditions because of the
lower or similar activation energy for iron carbide formation as compared with
that of CO hydrogenation Many types of iron carbides such as ε-Fe2C ε_ -
Fe22C Fe7C3 χ-Fe5C2 and θ-Fe3C all have been observed in FT synthesis [19-
20] However the true active species under working conditions remains still
unsettled Many studies have been devoted to characterizing the active iron
carbide phase Because the carburized iron catalysts are very sensitive to air
exposures even under controlled passivation [21] the in situ or operando
characterizations under working conditions are quite important
33 Size of active phase According to [11] the size of the active phase is one of the most important
factors determining the catalytic behaviors of a heterogeneous catalyst [23]
For Co-based catalysts Iglesia once analyzed data obtained over different
metal oxide-supported Co catalysts and the results suggested that the
turnover frequency (TOF) for CO conversion ie the amount of CO converted
per surface Co per time was independent of the size of Co particles loaded on
different metal oxides in a Co-size range of 9minus200 nm [24] The selectivity to
CH4 was higher over the catalysts with smaller Co particles and decreased with
increasing Co size particularly in the range of 26minus8 nm C5+ selectivity
increased with the mean size of Co nanoparticles monotonically and the
increase became insignificant when Co size exceeded 6minus8 nm Thus Co-
catalyzed FT synthesis is a structure sensitive reaction in the Co-size range of
lt10 nm Size effect studies for Ru- and Fe-based catalysts are not numerous A
Chapter 3 Catalysts for Fischer Tropsch Synthesis
84
few early studies pointed out the increase in TOF for CO hydrogenation with
increasing the size of Ru or Fe particles (or decreasing the metal dispersion)
[25-27]
In general the results obtained for many Co- and Ru-based catalysts all indicate
that the TOF for CO conversion increases with the size of metal nanoparticles
up to a critical point (6minus10 nm) and then changes slightly For Fe-based
catalysts the results are still inconsistent
References
[1] C Perego MRicci Catalysis Science amp Technology 2012 2 1776ndash1786 [2] P M Maitlis V Zanotti Chem Commun 2009 1619ndash1634 [3] C Perego R Bortolo and R Zennaro Catal Today 2009 142 9ndash16 [4] AY Khodakov W Chu P Fongarland ChemRev 107 (2007) 1692 [5] B Jager Stud Surf Sci Catal 119 (1998) 25 [6] Luque R de la Osa A R Campelo J M Romero A A Valverde J L Sanchez P Energy Environ Sci 2012 5(1) 5186 [7] Hao X Dong G Q Yang Y Xu Y Y Li YW Chem Eng Technol 2007 30(9) 1157 [8] van Steen E Claeys M Chem Eng Technol 2008 31(5) 655 [9] Davis B H Ind Eng Chem Res 2007 46(26) 8938 [10] Gao J H Wu B S Zhou L P Yang Y Hao X Xu Y Y Li Y W Chin J Catal (Cuihua Xuebao) 2011 32(12) 1790 [11] Qinghong Z Weiping D Ye W Review J Ener Chem 2013 2227ndash38 [12] OGMalan JDLouw LCFerreira Brennstoff-Chem 42 (1961) 209 [13] AP Steynberg RL Espinoza B Jager AC Vosloo ApplCatalA 186 (1999) 41 [14] ME Dry JR Anderson M Boudart (Eds) Catalysis Science and Technology M Springer Berlin (1981) 159 [15] HSchulz Appl Catal A 186 (1999) 3 [16] Zhang Q H Kang J C Wang Y ChemCatChem 2010 2(9)1030 [17] Kitakami O Sato H Shimada Y Sato F Tanaka M Phys Rev B 1997 56(21) 13849 [18] Tan K F Xu J Chang J Borgna A Saeys M J Catal 2010 274(2) 121 [19] De Smit E Weckhuysen B M Chem Soc Rev 2008 37(12) 2758
Chapter 3 Catalysts for Fischer Tropsch Synthesis
85
[20] Zhang Q H Kang J C Wang Y ChemCatChem 2010 2(9) 1030 [21] Janbroers S Louwen J N Zandbergen H W Kooyman P J J Catal 2009 268(2) 235 [22] PJ Van Berge J Van de Loosdrecht JCaricato EA Barradas Patent WO 9942214 [23] Zhang Q H Deng W P Wang Y Chem Commun 2011 47(33) 9275 [24] Iglesia E Appl Catal A 1997 161(1-2) 59 [25] Kellner C S Bell A T J Catal 1982 75(2) 251 [26] Jones V K Neubauer L R Bartholomew C H J Phys Chem 1986 90(20) 4832 [27] Boudart M McDonald M A J Phys Chem 1984 88(11) 2185
86
Chapter 4 Experimental FT plant and analytical methods
Two different FTS units were used in this PhDrsquos research work in order to
homologate some results The first one is located at the Universitagrave degli Studi
di Milano in Italy while the second one is located at the Universidad Central de
Venezuela in Venezuela Following there is the description of both FTS unit
First FTS Unit (Unit 1) Universitagrave degli Studi di Milano in Italy
FT reaction tests were performed into a fixed bed reactor (di =06 cm l = 56
cm) using 1 g of fresh catalyst mixed with 1 g of diluting material (-Al2O3
Fluka) This diluting material must be inert for FT and a good thermal conductor
to control the process temperature [1] The catalysts were tested after their
activation in a 468 NmL min-1 flow of syngas with H2CO ratios of 21 (total
flow = 468 Nml min-1) and nitrogen as internal analytical standard (flow = 50
NmL min-1) at P = 20 bar and temperature range between 220-260degC for a
duration between 20 and 90 h in continuous Analyses of the gas-phase
products (C1-C7) were performed with an on-line micro-gaschromatograph
(Agilent) measurements were carried out every 60 min during the reaction
Liquid products were collected in a trap (V=400mL) operating at 5degC and at the
same pressure of the reactor (20 bar) and analyzed by a gas chromatograph
(Agilent) equipped with a Porapack-Q columns (able to separate C7-C30
hydrocarbon fraction) after the reaction duration The aqueous phases
collected in the cold trap were analyzed by a TOC (Schimadzu) for the
quantification of carbonaceous species dissolved in water Using all the data
87
collected for each run a mass molar balance has been verified with a
maximum error of plusmn 5moles
Second FTS Unit (Unit 2) Universidad Central de Venezuela in Caracas-
Venezuela)
FTS was performed in a continuous flow system with a fixed bed stainless-steel
reactor (di =095 cm l = 30 cm) The reactor was loaded with 03 g of fresh
catalyst mixed with 03 g of see sand as a diluting material [2] The calcined
catalysts were initially reduced in situ by flowing hydrogen for 4 hours at 900
Nml˙min-1 350degC and 08 MPa After the reduction step the temperature was
lowered to 220degC under H2 They were then tested in the standard conditions
by flowing syngas (H2 CO N2 63325 vv N2 as internal standard) at 156
Nml˙min-1 increasing the system pressure slowly up to 20 MPa and 220-260degC
Once the reaction temperature was achieved the reaction was led to proceed
during a period of 280 h
During reaction the reactor effluent passed through a hot trap kept at 150degC
and 02 MPa to collect waxes and the products leaving this trap were passed
through a second trap kept at 0degC and 02MPa to collect the lighter products
(water alcohols and hydrocarbons) The analyses were performed in various
chromatographs according to the nature of the sample to be analyzed
Permanent gases and light hydrocarbons were analyzed on-line in a
PerkinElmer 3000GC Autosystem fitted with TCD detectors using a Carbosieve
SII Supelco column The liquid products (collected at 150ordmC and 0ordmC) were
weighted and analyzed in a PerkinElmer chromatograph fitted with a 50m long
Alumina RT capillary column connected to a FID
A mass molar balance was performed for each FT run resulting in a maximum
error of plusmn 5moles
88
41 FT Laboratory plant a) First FTS unit (Unit 1)
As explained by Pirola [3-5] the experimental tests were performed in a
laboratory plant with a tubular reactor (made by ldquoRenato Brignolerdquo Company)
with a fixed bed of catalyst vertically placed The feed (CO H2 and N2 as
internal standard) is prepared in situ mixing three different flow of pure CO
pure H2 and pure N2 using three different flow meters Then the feed goes into
the catalytic reactor from the top part reacts with the catalyst and then the
reacted flow comes out from the lower part The plant pipes are heated till the
cold trap to avoid the heavy products condensation In this cold trap cooled at
5degC the heavy products and the water condense The not reacted gas and the
light hydrocarbons go in a flow meter for their quantification and finally in an
analytical zone where they are analyzed by a micro gaschromatograph In the
condensed liquid in the cold trap there are two phases the first one is an
aqueous phase (in which water and small quantities of light hydrocarbons and
oxygenated compounds are present) and the second one is an organic phase
(in which hydrocarbons in the range C7-C30 are present)
In Fig 41 the detailed flow-sheet of FT plant has been reported
Fig 41 Laboratory plant flow-sheet
89
The key for the Fig41 is the following
1 valve
2 flow meter (Brooks reg mod 5850TR) for H2 and CO operating in the range 0-
100 Nml min-1 for N2 operating in the range 0-20 Nml min-1
3 gas mixer
4 thermocouples for the control of temperature in the catalytic bed in the
reactor and in the heated pipe
5 Tubular reactor
6 Security valve
7 Pressure indicator
8 Pressure control and regulation tool
9 micro GC ldquoAgilent reg 3000 seriesrdquo
10 gas totalizer for the control of the total flow of gas
11 Cold trap operating at 5degC and 20 bar
12 Cooling air for the temperature control of the reactor
13 vent (usually closed)
In figure 42 a photo of the plant is reported
Fig 42 FT laboratory plant
90
In the following paragraphs the main parts of this plant will be described
41a Main parts of the plant 41a1 Apparatus for the regulation and control of temperature pressure and flow of reagents
In the plant the pressure is controlled and regulated by an electronic controller
(Brooksreg) that interacts with a pressure valve able to work till 25 bars (Fig 43)
located after the reactor and the cold trap
Fig 43 Pressure valve
This system can control the plant pressure with a care of 01 bar respect the set
up
The reactor temperature is regulated by a heating oven (Renato Brignole) and
the pipe lines after the reactor are heated at 220degC to prevent the heavy
products condensation by two electrical cables (both with a resistance of 7
m) controlled by a Ascon reg apparatus The CO H2 and N2 flows are regulated
by Brooksreg 5850TR series flow meters (Fig 44)
91
44 Flowmeters for CO H2 N2
In table 41 the main characteristics of these flow meters are reported
Table 41 Flowmeters characteristics
Range
(Nmlmin) IO signal
(vdc) Max Pressure
(Bar)
H2 0-50 0-5 100
CO 0-50 0-5 100
N2 0-20 0-5 100
41a2 FT reactor
The FT plant reactor (Fig 45) has been made by Renato Brignole reg Company
(Legnano Italy) It is a fixed bed tubular reactor with the catalyst vertically
located It is made of AISI 316 stainless steel and in the internal surface of
reactor there is a coaxial copper tube (thickness = 1 mm) to prevent some
catalytic activities of steel and to uniform the heating of reactor The technical
characteristics of reactor are summarized in Table 42
Table 42 Reactor Characteristics
Volume (cm3)
Max operating pressure
(Bar)
Max operating temperature
(degC)
Internal diameter
(mm)
Height (mm)
158 100 400 6 560
92
In this reactor it is possible to charge till 3 g of the mixture catalyst-diluting
material The feed goes into the reactor at the top and goes out from the lower
part The operation of opening and closing of reactor is made using the disks
illustrated in Fig 46 and this is an operation that needs a particular attention
to avoid gases losses or mechanical damage
Fig 45 FT tubular reactor Fig 46 Reactor opening disks
The temperature inside the reactor is monitored by two thermocouples the
first one is vertical and it is inside the catalyst the second one is horizontal and
it is inside the reactor The values of temperatures recorded are quite the same
(max difference = 2degC)
41a3 Cold Trap
The condensation of heavy FT products (mainly hydrocarbons higher than C7
and water) is made using a cold trap in stainless steel able to work at 20 bar
and a T=5degC (Fig 47) The low temperature is maintained by an external
circulation of water coming from a ldquoCrioterm reg 190 iscordquo thermocriostat The
93
volume height and width of the cold trap are respectively 125 ml 100 mm
and 40 mm
Fig 47 Cold trap
The cold trap at the end of each kinetic run is opened and the liquid
condensed inside is quantified and analyzed There are two phases the first
one is an organic phase made by hydrocarbons in the range C7-C30 and it is
analyzed by a GC the second one is an aqueous phases with some organic
mainly oxygenated compounds and the quantification of all the present
carbon is made by a TOC analysis The results obtained in this way give an
average value of all the time of kinetics It is not possible to open the cold trap
during the experiment In fact opening the cold trap the pressure and flow
equilibrium of the plant is broken
41a4 Flow totalizers
The calculation of CO conversion and products selectivity of the plant needs to
know exactly the quantity of gas incoming and out coming Moreover adding
those data to the quantity of liquid condensed in the cold trap and to analytical
data it is possible to verify the mass balance on the plant The calculation of the
mass balance is very important to verify the goodness of the experimental data
collected
94
In FT plant it is possible to quantify all flow passed in a fixed time The incoming
flow of H2 N2 and CO is totalized by the same flow meters that regulate the
flow (Brooks reg Instruments) and the out coming flow (mixture of not reacted
CO and H2 N2 and non-condensed FT products) is totalized by a Ritter reg mod
TG01-5 (Fig 48) instrument
Fig 48 Ritter reg totalizer
42a Analytical instruments
FT plant needs three different analysis for the quantification of the composition
of
i) out coming gas (mixture of not reacted CO and H2 N2 and non-
condensed FT products) by a micro-GC Agilent reg mod 3000A
ii) organic phase of condensed liquid in cold trap (hydrocarbons in the
range C7-C30) by a GC ldquoFison Carlo Erba reg Mod 8000 seriesrdquo and
iii) liquid phase of condensed liquid in the cold trap (water with
hydrocarbon mainly oxygenated dissolved inside) by a Total
Organic Carbon ldquoShimadzu reg mod 5000Ardquo
42a1 micro Gas Chromatograph ldquoAgilent reg mod 3000Ardquo
In the micro GC Agilent reg there are two different columns the first one is a
molsieves module by which it is possible to separate in order of retention
time He H2 Ne Ar O2 N2 CH4 and CO the second one is a OV-1 module
(filled with polydymethylsiloxilane) by which it is possible to separate CO2 and
95
all the hydrocarbons in the range C2-C7 In this instrument the gas sample is
splitted in the two modules and then analyzed in the same time For each
sample then we obtain two different analyses In our application using the first
module the CO N2 and CH4 were quantified with a column temperature of
45degC using the second module CO2 and hydrocarbons were quantified with a
column temperature of 100degC Each module is equipped with a TCD detector
The sensibility limit of the analyses is about 50 ppm for each compound and
the carrier gas is helium The instrument scheme is reported in Fig 59 and the
instrument is represented in Fig 410 An example of analyses is reported in
Fig 411
Fig 49 Agilent Micro GC scheme
Fig 410 Micro GC Agilent
96
Fig 411 Example of Agilent micro GC analyses on FT out coming gas
42a2 Gas Chromatograph ldquoFision Carlo Erba reg Mod 8000 seriesrdquo
In this traditional Gas Chromatograph (GC) equipped with a wide bore Varian
(model VF-1ms) (dymethylpolyxolane) column (length = 25 m diameter = 025
mm) it is possible to separate and quantify the hydrocarbons in the range C7-
C30 The GC detector is a FID with a sensibility limit of about 100 ppm for each
compound and the carrier is helium The column temperature is maintained at
60degC for 3 minutes then heated till 260degC at 7degCmin for 15 minutes after that
heated at 280degC for 40 minutes at 5degCmin and then heated till 310degC for 5
minutes In Fig 412 and 413 the gas chromatograph in its column
97
Fig 412 Example of GC analysis for the quantification of heavy FT products
Fig 413 Wide bore Varian VF-1ms column
42a3 Total Organic Carbon ldquoShimadzu reg mod 5000Ardquo
Using this instrument it is possible to quantify the organic carbon dissolved in
water The sample passes through an oxidation catalyst (Pt) at high
temperature (700degC) and then all the organic carbon is converted to CO2 This
CO2 is then exactly quantified by an IR detector In Fig 414 it can be seen the
instrument
Fig 414 SHIMADZU TOC-5000A
98
43a Analytical instruments calibration
43a1 Flow meters calibration
All flow meters have been calibrated comparing the flow measured by these
instruments and that measured using a ldquosoap-bubblerdquo flow meter at the end of
the plant This calibration has been made using the FT plant both in FT work
condition (T=250degC P=20 bar) and at room condition (T=20degC P=1 bar) For
each flow meter some tests at different flow have been made always in the
range between 0 and 40 Nmlmin For each flow meter a diagram has been
made where the real flow (y) is reported in function of the set-up flow (x) The
result for all the instruments is a straight line (y = ax + b) In Tab 43 the results
for all the instruments have been reported in term of ldquoardquo and ldquobrdquo coefficient
and ldquoR2rdquo value
Tab 43 Flow meters calibrations
Flow meter Calibration conditions a b R2 1 CO T = 20degC P = 1 bar 11364 12727 09996
2 H2 T = 20degC P = 1 bar 1008 -1749 0999
3 N2 T = 20degC P = 1 bar 12744 67994 09935
4 Mix CO H2 N2 T = 20degC P = 1 bar 0968 1816 09998
The conclusion is that the instruments give a very good calibration and their
indications of the flow are quite perfect
43a2 micro GC calibration
This calibration has been made in Cernusco sul Naviglio (MI) in the laboratory
of ldquoSRA Instruments Italiardquo Company This company is an Agilent Technologies
Premier Solution Partner directly present in Italy and France and it is
constantly engaged in research and development of solutions based on
portable and ultra-fast Micro Gas chromatograph (wwwsrainstrumentscom)
99
The calibration has been made analyzing two mixture of certified gas and is
reported by [5]
The calibration of CO2 and light hydrocarbon is a direct calibration As the
volume of gas injected in column is always the same it is possible to calibrate
directly (without an internal standard) the peaks area with the concentration of
different compounds ie the concentration is directly proportional to
chromatographic area In ldquoSRA Instruments Italiardquo all calibration factors fci
(chromatographic area compound concentration) and all retention times
have been found and they are reported in table 44
Table 44 Calibration results for CO2 and light hydrocarbons
Module Compound Retention time
(min) Calibration factor
Molsieves
N2 1007 35119
CH4 1203 27027
CO 1402 45799
OV-1
CO2 0592 16722
Ethane 0624 19230
Propane 0745 25706
I-butane 0918 28248
N-butane 1061 27027
I-pentane 1556 32051
N-pentane 1808 32326
N-hexane 3578 33670
CO quantification has been performed using another calibration
Using these data it is possible to calculate the concentration of each compound
using the formula
iiiv fcareacompound (1)
Nevertheless it is important to remember that in FT plant there is N2 as
internal standard for CO quantification and then the equation (1) must be
corrected because the N2 flow is not to be considered as FT gas
100
FT
totaliiiv
flow
flowfcareacompound (2)
Where
2NtotalFT flowflowflow (3)
To better understand this calculation an example is here reported
If we assume to have a real FT flow of 20 Nmlmin with a CO2 v = 2 it
means to have 04 Nmlmin CO2
If we have 10 Nml minmin of N2 as standard and 30 Nmlmin of FT flow and
we calculate the CO2 percentage using the total flow we obtain
233110030
40vCO making a mistake If we use the correction in the
equation (2) we obtain 20220
30100
30
40vCO
the true value
The CO calibration concerns only the CO and N2 flow The CO is the compound
to be quantified and the N2 is the standard gas in fact N2 is not involved in FT
reactions and it pass through the FT plant without any modification then the
incoming and out coming N2 is the same The necessity with CO to have a
calibration with a standard is explained considering that the CO quantification
gives the CO conversion of FT process then a more accurate measure is
convenient Moreover it is not possible to use N2 as internal standard also for
CO2 and light hydrocarbons because they are not analyzed in the same module
(OV-1) of N2 (molsieves) Another important consideration is that in literature
the CO conversion for FT reactor is always calculated using this method
In this calibration method the ratio (flow CO flow N2) is directly proportional
to ratio (area CO area N2) Using FT plant in reaction conditions (T=250degC
P=20 bar CO = 156 Nmlmin H2 = 312 Nmlmin N2 = 100 Nmlmin) obviously
101
without catalyst inside we have calculated these ratios and the co-relation
between them The results are reported in Table 45
Table 45 CO-N2 calibration results
Flow N2
(Nmlmin) Flow CO
(Nmlmin) Flow H2
(Nmlmin) Area
N2 Area CO
R flow CON2
R area CON2
Rarea Rflow
100 156 312 411142 782455 156 19031 12199
100 156 312 390220 793329 156 20330 13032
100 156 312 388002 794913 156 20487 13133
100 156 312 384672 795362 156 20676 13254
The mean value of ratio between area and flow ratios is 12905 and this is the
calibration factor (fc) for the system as reported in the equation (4)
flowN
COflowf
areaN
COareac
22
(4)
then the CO flow out coming from the FT plant is
29051
2
2
flowN
areaN
COareaflowCOout (5)
finally the CO conversion is
100xflowCO
flowCOflowCOonCOconversi
in
outin (6)
The H2 calibration
To optimize the kinetic model of the FT synthesis was necessary to develop a
measurement method to quantify the hydrogen leaving the plant For this it
was performed a calibration of the micro-gas chromatograph using N2 as
standard in different streams of H2
To identify and quantify the hydrogen it is necessary to change the carrier in
the micro-gas chromatograph (from He to Ar)
Using Argon as a carrier the response of the micro-GC is about ten times
smaller than the response compared with He For this reason it has been
102
necessary to modify the injection time for the analysis and set to 40ms instead
of the usual 30ms
In Table 46 and Fig 415 are shown the results relating to the calibration of the
system H2-N2
Table 46 H2-N2 calibration results
Flow N2 (Nmlmin)
Flow H2 (Nmlmin)
F H2 F N2 Area N2 Area H2 A H2 A
N2
20 3 015 31511 33480 1062
20 35 0175 29525 36348 1231
20 41 0205 28420 40995 1442
20 49 0245 26747 45908 1716
20 56 028 20897 41151 1969
20 61 0305 20748 44040 2123
Fig 415 Calibration results for the micro-GC for the system H2 ndashN2
From the equation of the straight line is obtained a correction factor equal to
70018
By this correction factor (Fc) is possible to deduce the flow of the H2 outflowing
from the reactor and its conversion during the reaction using the following
equation
103
1002
222
in
outin
FlowH
FlowHFlowHHconversion
The calculation set to detect the flow of H2 in output is based on the fact that
the ratio between the areas H2N2 is equal to the ratio between the respective
flows multiplied by Fc (correction factor) according to the following equation
2
2
2
2
FlowN
FlowHFc
AreaN
AreaH
So from this equation it is possible to determine the flow of H2 at the out of the
reactor
00187
2
2
22
FlowN
AreaN
AreaHHFlow OUT
In Fig 416 is shown an example of a gas chromatographic analysis of hydrogen
Fig 416 Gas chromatographic analysis of a system H2-N2
43a3 GC calibration
In this instrument as before discussed it is possible to analyze the heavy
hydrocarbons condensed in the cold trap Obviously for their quantification we
need a calibration with some standard compounds because the detector
quantification is not the same for all the species For this reason the equation
j
j
i
i
mol
area
mol
area (7)
it is not correct and we must use
104
j
j
j
i
i
i Fmol
areaF
mol
area
(8)
where Fi and Fj are the calibration factor for the compound i and j respectively
The calibration method used is the ldquointernal standard methodrdquo in which one of
the compounds to be analyzed is chosen as internal standard and his
calibration factor (F) is established equal to 1 N-heptane has been chosen as
internal standard because it is normally present in FT products Analyzing a
calibration hydrocarbon mixture it is possible to calculate the calibration factor
of all the hydrocarbon present inside this mixture using the following
equation
i
i
j
j
jiarea
mol
mol
areaFF
(9)
The composition of the calibration mixture is reported in table 47 and the
calibration results in table 48
In FT runs all hydrocarbons in the range C1-C19 were obtained To find the
calibration factor and the retention times of hydrocarbons not present in the
calibration mixture an interpolation calculation was made In the following
figure are reported the diagram of the calibrations factors (Fig 417) and of the
retention times (Fig 418) in function of carbon number Starting from these
experimental results an interpolation curve were calculated and then the
calibrations factors and retention times for each carbon number was calculated
too The results are reported in Table 49 It is important to outline that for
each single carbon number there is only one calibration factor for all the
isomers as they are not well separated by the GC column and the detector
answer for the isomers is the same
105
Table 47 Composition of GC calibration mixture
Hydrocarbon PM (gmol) Quantity (g) Mol
n-Heptane (C7) 1002 0229 02295
Nonane (C9) 12826 02389 01871
Decane (C10) 14228 01284 00906
Undecane (C11) 15631 01197 00769
Dodecane (C12) 17033 01139 00672
Tridecane (C13) 18436 01202 00655
Tetradecane (C14) 1984 01577 00798
Pentadecane (C15) 21241 01123 00531
Hexadecane(C16) 22644 01817 00806
Octadecane (C18)
2545 00919 00363
Nonadecane (C19) 26852 00895 00335
106
Table 48 GC calibration results
Mix Mol
Chromatographic areas
Fc mean Analysis
1
Analysis
2
Analysis
3
Analysis
4
Analysis
5
C7 0229522 7763 9384 881 9036 8981 100
C9 018706 16343 16475 15226 13896 15051 047
C10 0090631 8463 88707 7902 7588 7856 043
C11 0076907 8716 7627 8235 7916 8239 036
C12 0067157 8485 7313 8137 7709 8168 032
C13 0065478 847 7654 8253 7859 8271 031
C14 0079826 11095 9689 10988 9685 11042 029
C15 0053096 8309 819 8876 8844 8535 024
C16 0080586 12395 11571 12863 12834 13014 025
C18 0036265 6059 6061 6679 6817 659 022
C19 0033474 6134 5958 6527 6663 6549 020
Fig 417 GC calibration factor vs carbon number
107
Fig 418 GC retention time vs carbon number
Table 49 GC Calibration factor and retention times for all the hydrocarbons C7 ndash C30
Carbon number Fi Retention time (min)
7 0997 0975
8 0649 3431
9 0497 5887
10 0412 8343
11 0358 10799
12 0320 13255
13 0293 15711
14 0272 18167
15 0255 20623
16 0241 23079
17 0230 25535
18 0220 27991
19 0212 30447
20 0205 32903
21 0199 35359
22 0194 37815
23 0189 40271
24 0185 42727
25 0181 45183
26 0178 47639
27 0175 50095
28 0172 52551
29 0170 55007
30 0167 57463
108
43a4 TOC calibration
The detector of the instrument (type NDIR) is able to analyze and quantify by
means of infrared spectroscopic technique the CO2 produced by the sample
For this calibration is not necessary to use a standard equal to the analyte (in
the case of the synthesis of FT the carbonaceous species dissolved in water)
but it is necessary to use a stable standard such as potassium hydrogen
phthalate because due to its physical nature (solid) is therefore inherently
more reliable than a liquid and allows the exact correlation between the ppm
of carbon present in solutions of standards and the areas provided by the
instrument after analysis
There were prepared different solutions at known concentrations (200 and 100
ppm) from a stock solution of 300 ppm obtained by dissolving 031895 g in
100ml of distilled water
Standard solutions were corrected by a correction factor f according to the
following equation
masssampleltheoretica
masssamplerealf (10)
The calculated value of f is equal to 1000627 and the table 410 and the Fig
419 show the correct ppm standard and the areas supplied by the instrument
Table 410 calibrationTOC
Corrected
ppm
Area
3002 28679
2001 17261
1001 6568
109
Fig 419 Interpolation of areas obtained in function of the concentration (ppm) of the
standard
44a Experimental procedure
All the kinetic FT runs were made on the plant following the same experimental
procedure
1) Catalyst preparation
2) Catalyst loading on the plant in the FT reactor
3) Catalyst activation
4) FT run
5) When FT finish opening of cold trap and separation of organic from
aqueous phases
6) Catalyst removal from reactor
7) Reactor cleaning and micro-GC column regeneration
44a1 Catalyst preparation
Before the catalyst was loaded in the reactor a standard procedure was
followed on the same catalyst
- Catalyst mesh operation between 106 and 150 micron
- Heating in oven at 120degC for a night
- Mixture catalyst - Al2O3 (inert material ndash diluent) 11
110
In table 411 the main characteristics of -Al2O3 are reported The role of this
material is to help the heating removal from the catalyst (FT reaction is highly
exothermic)
Table 411 Main characteristics of -Al2O3
Superficial area (m2g)
Bulk density (gcm3)
Composition Humidity
07-13 172
996 Al2O3 lt005 SiO2
01 FeO lt001 TiO2
26
44a2 Catalyst loading
The catalyst loading is obviously an essential operation The catalyst must be
charged in the middle of reactor because this is the isothermal zone as it is
possible to observe in Figure 420
Fig 420 Thermic profile of FT reactor
As the height of the mixture catalyst + -Al2O3 is about 7 cm (using a pipe with
an internal diameter of 6 mm) if this material is charged in the middle of the
reactor this work surely at the same temperature in each point The final
arrangement of the reactor is reported in Fig 421
111
Fig 421 FT reactor internal loading arrangement
Finally after the closing the pressure inside the reactor is raised till 4 bar with
the activation gases The gas flow is stopped and then the held of reactor is
checked to control possible gas losses If the reactor pressure is stable the
activation catalyst step will be performed The same procedure for the check of
possible gas loss will be performed when the pressure of the reactor will be
raised till 20 bar for FTS
44a3 Catalyst activation
The catalyst activation is the process in which the catalyst is reduced from the
oxidised state in the reduced or metallic state In the FT reaction the active
form for the Cobalt based catalysts is the Cobalt metallic and for the iron based
catalysts are the carbide iron forms All the catalysts were charged into the
reactor in the oxidised form because the last operation in the catalysts
preparation is the calcination (T=500degC) in air The catalyst activation-reduction
is performed in this PhDrsquos research work at 350degC and using H2 for Co based
112
catalysts and CO+H2 for iron based catalysts always for 4 h at 3 bar of pressure
At the end of this step the FT process start
44a4 Fischer Tropsch runs
After the catalyst activation the plant is raised at standard reactions conditions
Temperature = 220-260degC (depending of the test)
Pressure = 20 bar
Feed ratio H2CO = 21 11 1751 151 (depending on the test were
varied the feed ratio too)
H2 flow = 312 Nmlmin
CO flow = 156 Nmlmin
N2 flow = 50 Nmlmin
These are the ldquostandardrdquo reaction conditions but for some specific studies
they have been changed When the plant reaches the set-up values this is the
ldquozero-timerdquo of the FT runs The first operation is to annul the totalizers both in
the entrance and in the exit of the plant Then every one hour the micro-GC
make one analysis on the out coming flow (also during the night) and the
operator takes the flow out coming from the plant Each data is reported and
elaborate using an excel database The FT run has duration between 48 and 90
hours At the end of run the cold trap is opened (Fig 422) and both the organic
phase (GC) and the aqueous phase (TOC) are separated and then weighed and
analyzed Also these data is collected in the excel database and now it is
possible to calculate the CO conversion the products selectivity the alpha
parameter and to verify the final mass balance
113
Fig 422 Opening cold trap operation
After the reactor cooling the catalyst is unloaded and recovered for possible
characterization after its use The reactor and the cold trap are obviously
cleaned carefully The last operation is the micro-GC column regeneration
using the condition reported in Table 412
Table 412 Micro-GC column regeneration conditions
Parameter Module 1 (molsieves) Module 2 (OV-
1)
Sample Injector temperature (degC) 80 80
Column Injector temperature (degC) 45 60
Column temperature (degC) 160 160
Sampling time (s) -- --
Injection time (ms) -- --
Analysis time (s) -- --
Post-analysis time (s) -- --
Column pressure (kPa) 120 241
Detector sensibility Detector off Detector off
114
b) Second FTS unit (Unit 2) At the end of the second and the beginning of the third year of the PhD there
were performed a serious of catalytic tests in a FT unit at the Universidad
Central de Venezuela in Caracas-Venezuela in order to homologate the results
obtained in the first FTS unit as regard the cobalt based catalysts specifically
the hydrotalcites The experimental tests were performed in a laboratory plant
with a tubular reactor with a fixed bed of catalyst vertically placed They were
then tested in the standard conditions by flowing syngas (H2 CO N2 63325
vv N2 as internal standard) at 156 Nml˙min-1 using a flow meter Then the
feed goes into the catalytic reactor from the top part reacts with the catalyst
and then the reacted flow comes out from the lower part The plant pipes are
heated at 220degC During reaction the reactor effluent passed through a hot
trap kept at 150ordmC and 20 bar to collect waxes and the products leaving this
trap were passed through a second trap kept at 0ordmC and 20 bar to collect the
lighter products (water alcohols and hydrocarbons) The analyses were
performed in various chromatographs according to the nature of the sample to
be analyzed Permanent gases and light hydrocarbons were analyzed on-line in
a PerkinElmer 3000GC Autosystem fitted with TCD detectors using a Carbosieve
SII Supelco column The liquid products (collected at 150ordmC and 0ordmC) were
weighted and analyzed in a PerkinElmer chromatograph fitted with a 50m long
Alumina RT capillary column connected to a FID
In Fig 423 the detailed flow-sheet of FT plant has been reported
115
Fig 423 Laboratory plant flow-sheet
The key for the Fig423 is the following
1 Valve
2 Flow meter for H2 and syngas operating in the range 0-100 Nml min-1
3 Gas mixer
4 Thermocouples for the control of temperature in the catalytic bed in the
reactor and in the heated pipe
5 Tubular reactor
6 Security valve
7 Pressure indicator
8 Pressure control and regulation tool
9 GC ldquoPerkin Elmerrdquo
10 Gas totalizer for the control of the total flow of gas
11 Cold trap operating at 150degC and 20 bar to collect waxes
111 Second cold trap kept at 0ordmC and 20 bar to collect the lighter products
(water alcohols and hydrocarbons)
12 Cooling air for the temperature control of the reactor
13 vent (usually closed)
In figure 424 a photo of the plant is reported
116
Fig 424 FT laboratory plant
In the following paragraphs the main parts of this plant will be described
41b Main parts of the plant
41b1 Apparatus for the regulation and control of temperature pressure and
flow of reagents
In the plant the pressure is controlled by a pneumatic valve that interacts with
a pressure valve able to work till 1000 psi (Fig 425) located after the reactor
and the cold trap
Fig 425 Pressure valve
This system can control the plant pressure with a care of 10 psi respect the set
up
117
The reactor temperature is regulated by a heating jacket and the pipe lines
after the reactor are heated at 220degC to prevent the heavy products
condensation by a heater The CO H2 and N2 flows are regulated by Brooks
Instrument Control and Read out Equipment for Thermal Mass Flow meters
Model 5878 series flow meters (Fig 426)
426 Flow meters for H2 and syngas
41b2 FT reactor
The FT plant reactor is a fixed bed tubular reactor vertically placed It is made
of AISI 316 stainless steel The technical characteristics of reactor are
summarized in Table 413
Table 413 Reactor Characteristics
Volume (cm3)
Max operating pressure
(Bar)
Max operating temperature
(degC)
Internal diameter
(mm)
Height (mm)
850 69 400 95 300
In this reactor it is possible to charge a quantity of catalysts equivalent to
occupy 1 cm of length of the reactor The feed goes into the reactor at the top
and goes out from the lower part
118
Fig 427 FT tubular reactor
The temperature inside the reactor is monitored by one thermocouple inside
the catalyst
41b3 Cold Trap The reactor effluent passed through a hot trap kept at 150degC and 02 MPa to
collect waxes and the products leaving this trap were passed through a second
trap kept at 0degC and 02MPa to collect the lighter products (water alcohols and
hydrocarbons) See Fig 428
Fig 428 Cold trap
The two cold traps can be opened at any time of the reaction and the liquid
condensed inside can be quantified and analyzed
119
The analyses were performed in various chromatographs according to the
nature of the sample to be analyzed Permanent gases and light hydrocarbons
were analyzed on-line in a PerkinElmer 3000GC Autosystem fitted with TCD
detectors using a Carbosieve SII Supelco column The liquid products (collected
at 150degC and 0degC) were weighted and analyzed in a PerkinElmer chromatograph
fitted with a 50m long Alumina RT capillary column connected to a FID
42b Analytical instruments
Two different analysis were made for the quantification of the composition of
i) Out coming gas (mixture of not reacted CO and H2 N2 and non-
condensed FT products) by an on-line in a PerkinElmer 3000GC
Autosystem fitted with TCD detectors using a Carbosieve SII Supelco
column
ii) Organic phase of condensed liquid products (collected in a cold trap at
150ordmC and 0ordmC) hydrocarbons in the range C7-C30 were weighted
and analyzed in a PerkinElmer chromatograph fitted with a 50m
long and 053 mm diameter of Alumina RT capillary column
connected to a FID
An example of analyses of the permanent gases is reported in Fig 429 and an
example of analysis of heavy FT hydrocarbons is reported in Fig 430 and Fig
431
120
Fig 429 Example of analyses of the permanent gases in the TCD
Fig 430 Example of not-condensed products GC analyses on FT out coming gas
121
Fig 431 Example of GC analysis for the quantification of heavy FT products
43b Experimental procedure
All the kinetic FT runs were made on the plant following the same experimental
procedure
1) Catalyst preparation
2) Catalyst loading on the plant in the FT reactor
3) Leak test
4) Catalyst activation
5) FT run
6) Opening of cold trap and separation of organic from aqueous phases
7) Catalyst removal from reactor
8) Reactor cleaning
43b1 Catalyst preparation
Before the catalyst was loaded in the reactor a standard procedure was
followed on the same catalyst
- Catalyst mesh operation between 106 and 150 micron
- Heating in oven at 120degC for a night
122
- Mixture catalyst ndash sea sand (inert material ndash diluent) 11
In table 414 the main characteristics of sea sand are reported The role of this
material is to help the heating removal from the catalyst (FT reaction is highly
exothermic) [5]
Table 414 Main characteristics of sea sand
Particle Size (μm)
Specific Surface
Area (m2g)
Bulk density (Kgm3)
Pore Volume
(mL)
Interstitial Velocity
(md)
Porosity (-) Composition
100-300 074
200-1430
117 26
044 SiO2
43b2 Catalyst loading
As the height of the mixture catalyst + sea sand is about 1 cm (using a pipe with
an internal diameter of 95 mm) if this material is charged in the middle of the
reactor this work surely at the same temperature in each point The final
arrangement of the reactor is reported in Fig 432
Fig 432 FT reactor internal loading arrangement
123
Finally after the closing the pressure inside the reactor is raised till 3 bar with
the activation gases The gas flow is stopped for one night and then the reactor
is checked to control possible gas losses If the reactor pressure is stable the
activation catalyst step will be performed The same procedure for the check of
possible gas loss will be performed when the pressure of the reactor will be
raised till 20 bar for FTS
43b3 Catalyst activation The catalyst activation is the process in which the catalyst is reduced from the
oxidised state in the reduced or metallic state The samples tested in this
reactor were the Co based hydrotalcites In the FT reaction the active form for
the cobalt based catalysts is the cobalt metallic All the catalysts were charged
into the reactor in the oxidised form because the last operation in the catalysts
preparation is the calcination (T=500degC) in air The catalyst activation-reduction
is performed in this part of the PhDrsquos research work at 350degC using H2 always
for 4 h at 3 bar of pressure At the end of this step the FT process start
43b4 Fischer Tropsch runs
After the catalyst activation the plant is raised at standard reactions conditions
Temperature = 220-260degC
Pressure = 20 bar
Feed ratio H2CO = 21
Syngas (H2 + CO + N2) flow = 156 Nmlmin (in order to work with the
same space velocity used for the same samples tested in the Unit 1 in
Italy)
These are the ldquostandardrdquo reaction conditions When the plant reaches the set-
up values this is the ldquozero-timerdquo of the FT runs Every one hour the GC make
124
one analysis of the permanent gases (CO CO2 CH4 N2) on the out coming flow
(also during the night) Each data is reported and elaborate using an excel
database The FT run has a duration between 200-280 hours During the
reaction and before the changes of temperatures the valves of the two cold
trap are opened and both the organic phase (GC) and the aqueous phase are
separated and then weighed and analyzed Also these data is collected in the
excel database and now it is possible to calculate the CO conversion the
products selectivity the alpha parameter and it is possible to verify the final
mass balance
After the reactor cooling the catalyst is unloaded The reactor is cleaned
carefully
42 Experimental data elaboration
The experimental data collected in the laboratory are the gas-chromatographic
area (with micro and traditional GC) the gas flows the temperatures the
pressure the weight of condensed products and the TOC value of organic
compounds in aqueous phase For each run all these data were put in the
excel file where in an automatic way the CO conversion the products
selectivity the molar balance the parameter were calculated
There were used two different file excel for the two different FTS unit
a) First FTS unit (Unit 1)
The file excel is split in nine pages data results heavy hydrocarbons analysis
molar balance (CO hydrogen and oxygen) hydrogen analysis oxygen analysis
and alpha calculation As example the pages of one FT run (made with a Co
base catalyst Co35_2d) are reported in Fig 433a-f
Data page (Fig 433a)
125
This worksheet contains the mathematical elaboration of the experimental
data obtained from the various analyzes and is composed of different parts
Conditions It is referred to the number of tests carried out by the
micro-gas chromatograph the time at which the analysis were made
and the outside temperature at the time of sampling
Flow in It is referred to the flow in (Nmlmin) of the reactants (H2 and
CO) and the internal standard (N2) that remain constant during the
entire kinetic energy
Volumes totalizers It is referred to the values of the three volumes of
gas consumed while the kinetic is in progress (this values are read from
the totalizer just before performing the analysis) and the total volume
of gas output in ml and Nml Furthermore it also evaluates an error in
percentage between the volume of gas out and the gas in
Flow out is measured by a flow meter bubbles and a counter ldquoRitterrdquo
the flow rates are calculated with the output flow measured from the
bubble flow meter and the Ritter counter and then compared
Flow from bubble flow meter (min
ml ) = 60t
V (11)
V[ml] Volume path from the bubble
t[min] Time it takes the bubble to traverse this volume
Flow from Ritter counter (min
ml ) = 100)(
t
VV INOUT (12)
VIN [ml] and VOUT [ml]are the volume of gas in and out
Both values of flow are converted in Nmlmin by the next equation
T273
273ml
min T[degC] (13)
126
CO Conversion It is referred to the quantity of gas reacted or converted
referred to the gas entering inn the plant From the micro-gc analysis
are taken the chromatographic areas of CO and N2 and used to
calculate the flow out-coming of CO from the equation
29121
2
2
OUTNflow
NArea
COAreaCOflow OUT (14)
Where 12912 is the calibration factor As the flow in and the flow out of N2
is the same
29121
025
2
NArea
COAreaCOflow OUT (15)
502 is the flow of the internal standard N2
Now it is possible to calculate the CO conversion using the next formula
IN
OUTIN
COflow
COflowCOflowConversionCO
(16)
Selectivity Concerning the gas flow out-coming from the FT plant made
of not reacted CO CO2 CH4 and light hydrocarbons
CO in reaction mixture 100
2
NTOT
OUT
flowflow
COflowCO (17)
product i in reaction mixture
100
2
NTOT
OUT
i
i
iflowflow
flowcF
area
product (18)
where
flowTOT is the total flow out-coming from the FT plant and concentrationi is
the amount (m) of product i found using the micro-GC
Fci is the calibration factor for each compound
127
Carbon molar flow for the i compound
i
i
C
i
tot
Cnumber
flowmoles
422
100
0010
min (19)
where iCnumber is the number of carbon atom of compound i
0001 transform Nml to Nl and 224 let to transform Nl to moles
Molar balance
CO moles entering in the plant 1000422min x
flowCmolesinin COCO
(20)
CO moles out coming
6
1 min1000422min i
iCOCO molesC
x
flowCmolesoutOUT (21)
128
Fig 433a Example of ldquodata pagerdquo in FT data elaboration excel file
Results page (Fig 433b)
Concerning the products selectivity
Light products (ltC7) j selectivity
129
100
minmin
min
outin
C
j molesCOmolesCO
moles
S
j
(22)
where jCmoles means the moles of carbon atom in the j products
Heavy products (geC7) i selectivity
100
minmin
min
outin
C
i molesCOmolesCO
moles
S
i
(23)
where iCmoles means the moles of carbon atom in the i products
Total light products selectivity jlight SS (24)
Total heavy products selectivity iheavy SS (25)
Fig 433b Example of ldquoresults pagerdquo in FT data elaboration excel file
Concerning the heavy product (organic phase condensed in the cold trap) elaboration (Fig 433c)
moles of i compound 100
CA
fcCAmoles ii
i (26)
where CA is the chromatographic area and fc is the calibration factor
130
Total moles of ldquo-CH2-ldquo unit in organic phase 142
OPCH
weightmoles (27)
Where weightOP means the weight of the organic phase in gram and 14 is the molecular weight of the unit ldquo-CH2-ldquo
Carbon moles of compound i 100
2 i
CH
Cmoles
molesmoles
i
(28)
Moles of carbon per minute of each component
60min
timereaction
CmolesCmoles ii (29)
Fig 433c Example of ldquoheavy hydrocarbons analysis pagerdquo in FT data elaboration excel file
Molar balance page (Fig 433d)
The molar balance is verified using the following equation
outoutoutoutinCwaterCheavyClightCOCO molesmolesmolesmolesmoles (30)
Where
131
inCOmoles and outCOmoles are respectively the moles of CO in entrance and
escape of the FT plant in all the runrsquos time outClightmoles are the carbon
atom moles of light FT products came out from the FT plant in all the runrsquos
time outCheavymoles are the carbon atom moles of the heavy hydrocarbons in
the organic phase condensed in the cold trap and outCwatermoles are the
carbon atom moles inside the water phase condensed in the cold trap In
particular
422
0102 iiNtot
Clight
Cnflowflowmoles out
out (31)
2CH
OPCheavy
PM
weightmoles
out (32)
12106
fdweightppmmoles OPTOC
Cwaterout (33)
where ppmTOC are the ppm of Total Organic Carbon measured by TOC
instrument and fd is a diluting factor (normally 1500) as the aqueous phase
must be diluted before the TOC analysis
Fig 433d Example of ldquomolar balance pagerdquo in FT data elaboration excel file
132
alpha parameter (Fig 433e)
This parameter represents a prediction of the distribution related to the
number of carbon atoms according to the Anderson-Schulz-Flory
distribution
In the excel file of data elaboration it is possible to calculate the alpha
parameter in different range of hydrocarbons C1-C6 C3-C12 C13-C30 C3-C30
The hydrocarbon range is chosen depending of the FT results if as
example the heavy product selectivity is very low it is not convenient to
consider these products in the calculation The equation for the
calculation is
21
logloglog nn
Wn (34)
where Wn is the weight fraction of product with n carbon atom number In
the excel file the equation used are
tot
C
C tmoles
moles i
i 60
min (35)
where ttot is the total time of FT run in hours
iCi PMmolesgi (36)
n
i
i
in
g
gW
1
(37)
The calculation of is then performed making a diagram in which the
n
Wnlog is reported vs the carbon atom number
133
Fig 433e Example of ldquo calculation pagerdquo in FT data elaboration excel file
ldquo calculation pagerdquo
The product distribution can be predicted using the AndersonminusSchulzminusFlory
(ASF) model that depends on the chain growth probability α Different factors
have an influence on the alpha parameter such as process conditions type of
catalyst and chemical promoters [6] The ASF product distribution as a function
of α is depicted in Figure 25 (Chapter 2)
According to ASF distribution ideally the molar fraction (Mn) of the
hydrocarbon product with a carbon number of n is only dependent on the
chain-growth probability (α) which is a function of the rates of chain growth
and chain termination by the following equation
Mn = (1minusα)αnminus1 (38)
In other words the product selectivity is determined by α value in an ideal
case A smaller α value leads to lighter (C1ndashC4) hydrocarbons while larger α
value results in the formation of heavier (C21+) hydrocarbons However the ASF
distribution is unselective for the middle-distillate products which are usually
the target products For examples the maximum selectivity to gasoline-range
(C5ndashC11) hydrocarbons is sim45 and that to diesel-range (C10ndashC20) hydrocarbons
is sim35 The development of selective FT catalysts which can tune the
134
selectivities to desired products is one of the most challenging targets in the
field of FT synthesis [7]
The probability is defined as the speed of growth (rg) divided by the sum of
the speeds of all the possible reactions for the species in growth
The probability to form a product Pn with n carbon atoms is the product of the
probabilities that the adsorbed species are formed in 1 2 n-1 carbon atoms
(precursors of the species Pn) and the probability that the adsorbed species an
carbon atoms desorb Writing a mathematical model leads to the ASF
2n 1
loglognn
Wlog (39)
where Wn is the mass fraction of the product with n carbon atoms
To get the equation of Anderson-Schulz-Flory We define
- as the probability of growth - rt as the rate of chain terminations - rp the speed of chain propagation
For a chain of n carbon atoms is defined another parameter n given by
1n
i
n
n
n
p
tn
1
r
r
(40)
where n is the probability that a chain of n carbon atoms remains on the
catalyst to continue the propagation of the chains n is the number of moles of
product Cn If n is constant throughout the range of products it may simply
indicate with and therefore starting from n = 1 we can write
3
134
2
123
12
So in general
135
1n1n
Starting from a generic molecule with x carbon atoms we can write
xnxn
(41)
Assuming that the monomeric units have the same molecular weight without
regard to their position in the growing chain (these monomer units are CH2
with PM = 14) we can obtain the weight fraction Wn multiplying the equation
(1) by n and dividing it by
1n
nn If we set x = 1 equation (41) remains
1n
1n
1n
1n
1n1
1n1
1n
n
nn
n
n
n
n
n
nW
(42)
The denominator of the last member of equation (42) can be written as
0n
n
(43)
In fact the operators
can be reversed and therefore
0n
1nn
0n0n
n
The series
0n
n for 1 be equal to 1
1
The series in question is of the type n32 arararaS
and the solution is equal to
r1
r1aS
n
Equation (2) can therefore be rewritten as follows
136
2
1n1n
0
n
1n
n1
n
1
1
nnW
or
21nn 1nW (44)
Bringing in logarithmic form the equation (44) we have
2n
n
n
n
1n
n
W
12nn
W
121nn
W
121nnW
)(lnlnln
)ln(lnlnln
)ln(ln)(ln
)ln(ln)(lnln
is identified by the slope of the straight line obtained by plotting the log
(Wnn) as a function of n The quality and the defect of the ASF model is its
simplicity one is in fact arises because of its ease of use across the agreement
with experimental data is not always fully satisfactory in fact the equation
provides undifferentiated products while in reality various species are
summarized
In this file are calculated different values of depending on the range of
carbon atoms C3-C12 C13-C30 C3-C30 Furthermore it was calculated an value
for the range C1-C6 because it is common to all the catalysts in fact the nature
of the tests performed on the various samples kinetics do not guarantee the
of the other range
Mathematically is calculated from
bullthe moles of carbonmin of the various components
bull from the moles of carbonmin it is possible to find the moles of each
component with the formula
137
hreactiontimeh
Cmolcarbontomol i
i
min60
min
From the moles it is possible to get the grams of each component
mol
gPMmolCmolg ii
Wn is calculated (weight fraction) for each component
n
1i
i
in
g
gW
i
calculating the value of Wnn (where n is the number of carbon atoms)
for each component
calculating the ln(Wnn)
By plotting the logarithm of the value of Wnn as a function of the number of
carbon atoms (n) is obtained a straight line whose slope gives the value of
desired
425 Hydrogen
Hydrogen balance (Fig 433f)
This data page allows to calculate the conversion of hydrogen and also the of
H2 in the gas mixture leaving from the reactor
H2 Conversion
Area H2
Area N2
Real Flow mix [Nml min-1]
Flow H2 OUT
[Nml min-1]
CONV H2 ()
() H2
138
As for the CO from the analysis at the micro-GC we get the chromatographic
areas of H2 and N2 that are used to calculate the outlet flow from the Fischer-
Tropsch plant of carbon monoxide by the formula
0017
2
2
22
OUTNflow
NArea
HAreaHflow OUT
where 7001 is the correction factor determined by the calibration of the
micro-gas chromatograph As the output flow of nitrogen is equal to that in the
input will have
0017
025
2
22
NArea
HAreaHflow OUT
At this point we can calculate the conversion of H2 by the formula
IN
OUTIN
Hflow
HflowHflowHConversion
2
222
The H2 is necessary to obtain the number of moles of hydrogen present in the
gaseous stream leaving from the reactor it is calculated through the formula
1002
2 TOT
OUT
flow
HflowH
Hydrogen Balance Also the balance of the hydrogen is performed at the end of the kinetic and it is
calculated with the following formula
2_
_2_
2
22222
Hfrom
waterheavylightMixfromHfrom
IN
OUTOUTOUTOUTIN
Hmoles
HmoliHmolesHmolesHmolesHmoles
where
139
1 18
2
phaseaqueous
OUT
weightwaterHmoles
2 2
2
CHPM
phaseorganicweightphaseorganicfomHmoles
The use of the molecular weight of methylene is because the CH2 is the
segment that grow joining to other segment of CH2 to give the different
hydrocarbons
3 moles of H2OUT light are the moles obtained by the summation of moles
of H2OUT of light hydrocarbons through the formula
2422
0102
jiOUT
OUT
compoundHngasmllightHmoles
Fig 433f Example of ldquohydrogen balancerdquo in FT data elaboration excel file
427 Oxygen Balance As for the other two balances also the oxygen balance is carried out at the end
of the kinetic run and it is calculated using the formula
COfrom
OHfomCOfromCOfromCOfrom
IN
OUTOUTOUTIN
Omoles
OmolesOmolesOmolesOmoles
_
2_2___
Where
140
1 18
phaseaqueous
OUT
weightwaterOmoles
2 422
2010 22
COgasmlCOOmoles OUT
OUT
In the calculation of the oxygen balance are not considered the oxygenated
products while the moles of OIN from CO and the moles of OOUT from CO are
respectively equal to the moles of COIN and COOUT from CO
b) Seconf FTS unit (Unit 2)
The shape of the file excel is presented in a different way but the equations
are the same equations presented before (See First FTS unit in this chapter)
The file is split in eleven pages XCO CH4 CO2 TCD data media paraffins
fractions (1-4) As example the pages of one FT run (made with a Co based
hydrotalcites catalyst Co35_2d) are reported in Fig 434a-d
TCD In Fig 434a-b are shown the conditions related to the number of tests
carried out by the gas chromatograph the time at which the analysis were
made and the outside temperature at the time of sampling the CO Conversion
that is referred to the quantity of gas reacted or converted referred to the gas
entering inn the plant From the gas chromatograph are taken the
chromatographic areas of CO CH4 CO2 and N2 and used to calculate the
selectivity
Fig 434a Example of ldquodata page _ TCDrdquo in FT data elaboration excel file
141
Fig 434b Example of ldquodata page _ TCDrdquo in FT data elaboration excel file
Datos In Fig434 c is shown the information related to the selectivity of light hydrocarbons
Fig 434 c Example of ldquolight hydrocarbons analysis pagerdquo in FT data elaboration
excel file
In Fig 434d the calculation of is then performed making a diagram in
which the
n
Wnlog is reported vs the carbon atom number
Fig 434 d Example of ldquo calculation pagerdquo in FT data elaboration excel file
142
43 Novelties on the FT plant made in this PhD work In the second year of the PhD the reactor used in the laboratory at the
ldquoUniversitagrave degli Studi di Milanordquo was brought in ldquoBrignolerdquo Company
(Legnano ndash MI) for a general control and revision
In this long revision some fundamentals improvements have been made on
the FT plant
all the analytical procedures were optimized verified and calibrated
A new flowmeter was included in the feed verified and calibrate
References
[1] CLBianchi C Pirola V Ragaini Cat Comm 7 (2006) 669
[2] ML Cubeiro Loacutepez A Colmenares L Texeira M Goldwasser M J Peacuterez
F Machado F Gonzaacutelez Applied Catalysis A General 167 (1998) 183-193
[3] C Pirola C L Bianchi A Di Michele P Diodati S Vitali V Ragaini Catal
Lett 131 (2009) 294ndash304
[4] C Pirola CL Bianchi A Di Michele S Vitali V Ragaini Catal Comm 10
(2009) 823ndash827
[5] C Pirola PhD 2007-2008 Novel supported iron based Fischer-Tropsch
catalysts Preparation characterization and applications Chapter 5
[6] Abell S Montan D ChemSusChem 2011 4 1538minus1556]
[7] Qinghong Z Weiping D Ye W Review Recent advances in understanding the key catalyst factors for Fischer-Tropsch synthesis J Ener Chem 2013 2227ndash38
143
Chapter 5 Catalysts preparation and characterization A serious of catalysts were prepared according different method of synthesis
and using cobalt and iron depending on the kind of the study
The catalysts reported in Table 51 are divided in two classes
1) Catalysts of cobalt based divided into two more groups
a Co based hydrotalcites with different amount of cobalt (5-35
wt) prepared with an innovative method of synthesis (urea
method)
b Co based catalysts with 8wt of cobalt with different supports
(SiO2 Al2O3 or TiO2) and the same samples with the addition of
01 of ruthenium carbonyl all of them synthesized with the
help of ultrasound
2) Catalysts of iron (30 wt) with fixed (optimized) loading of promoters
(K=20 Cu=375) and different method of synthesis
The catalysts of the first series (Co) subdivided in two more groups (HTlc and
bimetallic with the help of ultrasound) were studied to verify the activity of
this new kind of catalysts in the CO hydrogenation
More specifically the hydrotalcites were proposed as a new kind of catalysts
in which the active metal is part of the structural core of the HTlc has been
synthesized and tested Activity tests conducted in a fixed bed reactor resulted
in satisfactory catalytic performances as we will discuss later Moreover the
structural and catalytic properties of these materials were verified at FTS
operating conditions and correlations between catalyst features and efficiency
144
towards light and heavy hydrocarbons selectivities were achieved And the
cobalt based catalysts synthesized with the help of ultrasound (US) were
studied to test the effects of sonochemical synthesis to prepare novel
supported materials with particular properties as nanostructured catalysts [1]
The chemical effect of ultrasound arises from acoustic cavitation ie the
formation growth and implosive collapse of bubbles in a liquid Some of the
interesting features resulting from the application of sonication as a synthetic
method are the nanoparticles preparation showing a more uniform size
distribution higher surface area and a more controlled phase composition The
use of high power ultrasound for long time is a difficult procedure because it is
a critical point the control of the thermal stability of the ultrasound horn In
this PhDrsquos work the possibility to use an ultrasound assisted synthesis of Co-
based catalysts by high power ultrasound for a long time has been
investigated using an innovative experimental apparatus equipped with a new
cooling system able to maintain stable the temperature US emitting horn
The catalysts of the second series (Fe) were studied to verify the effect of the
different methods of synthesis and the variation of the H2 CO ratio in order to
simulate a feed with biosyngas and for an ulterior study about the develop of a
kinetic model The selection of this specific amount of Fe (30 wt) and
promoters (Cu and K with 20 wt and 375wt respectively) was taken from
a previous research [2] in which the effect of these amounts was extensively
studied
Promoters influence the bond strength of hydrogen and carbon oxide to metal
Addition of alkali metals (K in particular) to iron catalysts promotes electron
transfer to the iron and inhibits hydrogen adsorption because adsorption of
hydrogen induces electron donation to the iron surface Moreover K promotion
Chapter 5 Catalysts preparation and characterization
145
increases the electron density in iron and will result in an increase of CO
adsorption On Fe stronger metal-carbon bonds will lead to C2+ formation and
then to a low methane selectivity [3] Copper promotes the reduction of iron
oxide phases from hematite (Fe2O3) to magnetite (Fe3O4) and then from
magnetite to iron metal A suggested mechanism for this promotion effect is
the migration of atomic hydrogen from reduced Cu sites to the iron oxide The
copper needs to be very well mixed with iron oxide to provide the most
favourable promoter effect [4]
An innovative preparation procedure with the use of Ultrasound and
Microwave has been used with the iron based catalysts
In Table 51 a general summary of all the prepared catalyst is reported
Table 51 Summary of the catalysts synthesized and tested
Metal Catalysts Samples
Co
HTlc Co5
Co 10
Co 15
Co 35
Bimetallic US CoTiO2
CoSiO2
CoAl2O3
Co-RuTiO2
Co-RuSiO2
Co-RuAl2O3
Fe
Traditional Fe30K20Cu375 SiO2 At different temperature and H2CO ratio 21 15111
Traditional + MW MW1
MW2
Traditional + US
US1
US2
Co-precipitation
FeSiO2-TEOS
Chapter 5 Catalysts preparation and characterization
146
The catalysts were characterized by TPR BET SEM TEM ICP FT-IR micro-
RAMAN techniques in their fresh form (before the use in FT reactor) and in
some cases after different activation procedure or after FT runs
The physical properties of the catalysts (surface area and morphology) were
investigated by BET SEM and TEM analyses The theoretic catalysts
composition has been investigated and verified both qualitatively using SEM-
EDS FT-IR and micro-RAMAN techniques and quantitatively using ICP
characterization The reduction behaviour of metal phase has been
investigated by TPR analyses
51 Catalysts preparation
511 Catalyst preparation procedure
5111 Cobalt based catalysts
Two different types of cobalt based catalysts were prepared during this
research The synthesis is presented in the next paragraphs
Co based Hydrotalcites by a modified urea method
A series of ternary HTlc with general formula [CoxZn(1-x-
y)Aly(OH)2](NO3)y∙05H2O was synthesized by a modified-urea method [5]
Different volumes of the solutions of the metal nitrates all at a concentration
of 05 M were mixed to obtained either a Al(Co+Al) or Al(Co+Al+Zn) molar
ratio of 03
Solid urea was added to the solutions in a molar ratio of 4 vs Al The obtained
solutions were maintained at the reflux temperature in an open flask for 48 h
The precipitates were separated by centrifugation washed with water and
then dried at 80degC
Chapter 5 Catalysts preparation and characterization
147
Co based catalysts with the help of ultrasound
All the catalysts were prepared by a modified impregnation method The metal
precursors (cobalt and ruthenium carbonyl) were dissolved in n-decane
together with the different support (SiO2 Al2O3 or TiO2) The solution was
irradiated by an US horn (Fig 51) for 3 h at 20 kHz at 300 W and then put into
a rotating vacuum oven at 40degC at 36 rpm for 24 h (impregnation step)
Samples have been calcinated at 350 degC for 4 h
Fig 51 Ultrasound horn with a cooling jacket where the coolant has two main
characteristics low viscosity at low temperature and dielectric liquid
5112 Iron based catalysts Four different types of iron based catalysts were prepared during this
research The methods used were the traditional impregnation method the co-
precipitation method and the traditional impregnation method with the help of
microwave and ultrasounds
Fe based catalysts by the Traditional Impregnation method
The iron based supported on silica catalysts were prepared according to the
traditional impregnation method completely described in a previous work [6]
starting from an aqueous solution of precursors and adding in a second time
Chapter 5 Catalysts preparation and characterization
148
the support (silica) The reagents used for the samples preparation are
reported in Table 52
Table 52 Reagents used in the catalysts preparation Fe30K20Cu375 SiO2
Reagent Main characteristics
Support SiO2
Company Fluka (cod 60740) Mesh 70-230 60 Aring Molecular weight 60086 gmol Purity gt 99 Superficial area 500 m2g
Precursors
Fe(NO3)3middot9H2O Company Riedel de Hean Molecular weight 40385 gmol Purity 98
KNO3 Company Merk Molecular weight 10111 gmol Purity gt 99
Cu(CH3COO)2middotH2O Company Fluka Molecular weight 19965 gmol Purity 99
Solvent Extra pure water
The standard methodology for the catalysts preparation is the following
Drying of silica in oven (T=120degC) for a night
Weigh of the calculated amount of iron potassium and copper
precursors
In a pyrex vessel (250 ml) the weighed precursors the water (25 ml)
and silica (5 g) are added
The vessel is put on a rotavapor (36 rpm T=40degC P = 1 bar) for 24 hours
(Fig 52)
The solvent is evaporated (T = 80degC)
The powder is dried in oven (T=120degC) for 4 hours
Calcination (T = 500degC) in air for 4 hours
Chapter 5 Catalysts preparation and characterization
149
The catalyst is sieved to obtain a powder mesh between 100 and 140
Fig 52 Rotavapor used for catalyst preparation
The amount of precursors is calculated starting from the equation (1) to have
the requested iron percentage in the not promoted catalysts
FegSiOgFe
gFe
2
(1)
Then the moles of iron are equal as the moles of his precursor (moles Fe =
moles Fe(NO3)39H2O) The grams of precursors are calculated multiplying the
moles for the molecular weight of Fe(NO3)39H2O This quantity must be divided
for the purity grade of precursor
For the promoted catalysts the amount of precursors is calculated using the
following equations
FegSiOgCugKgFe
gFe
2
(2)
KgSiOgCugKgFe
gK
2
(3)
CugSiOgCugKgFe
gCu
2
(4)
Chapter 5 Catalysts preparation and characterization
150
The equation (2) (3) and (4) must be solved as equations system The moles of
Fe K and Cu are equal as the moles of respective precursors The grams of
precursors are calculated multiplying the moles for the molecular weight of
Fe(NO3)39H2O KNO3 and Cu(CH3COO)2H2O respectively This quantity must be
divided for the purity grade of each precursors
Specifically for the preparation of a catalyst having 30 wt of iron 2wt of
potassium and 375wt of copper on silica
2920037505
15600205
33523005
gCuggCugKgFe
gCu
gKggCugKgFe
gK
gFeggCugKgFe
gFe
moles Fe =molesg
g
84755
3352=00418 moles
moles K =molesg
g
098339
1560= 000398 moles
moles Cu =molesg
g
54663
2920= 00046 moles
g Fe(NO3)3middot9H2O = 00418 molesmiddot40385 gmoles = 16882 g
g KNO3 = 000398 molesmiddot10111gmoles = 04024 g
g Cu(CH3COO)2middotH2O = 00046 molesmiddot19965 gmoles = 09168 g
and the grams required to prepare the catalysts are
980
88216 g=17227 g Fe(NO3)3middot9H2O
Chapter 5 Catalysts preparation and characterization
151
1
40240 g = 04024 g KNO3
990
91680 g= 09261 g Cu(CH3COO)2middotH2O
Fe based catalysts by the Traditional Impregnation method with the help of
microwave (MW)
For the synthesis of the catalysts with the aid of microwave (MW) a final step
where the powder of catalyst already calcined is subjected to a MW
irradiation was added Two different methods for the MW irradiation were
used In the first one (MW1) a sample of catalyst was put into a beaker and
then into a classical microwave oven (Moulinex Micro-Chef 1305E 600W) for
30 min
In the second method (MW2) the catalyst (2 g) was suspended in hexane (400
ml) put into a microwave chemical reactor (ordinary 400 mL round bottom
glass flask filled with the liquid to be heated and activated) and treated for 1 h
at 60W MW were produced by a MW generator and sent to the MW
applicator by an insulated coaxial antenna Details of the MW applicator and of
the associated experimental techniques can be found in [7]
Fig 53 Microwave (MW) Power (35-300 W) Treatment duration (60 min)
Atmosphere (air)
Chapter 5 Catalysts preparation and characterization
152
Fe based catalysts by Traditional Impregnation method with the help of
ultrasound (US)
In this particular preparation method a step using ultrasound (US) has been
added Ultrasound is simply sound pitched above the frequency bond of human
hearing It is a part of sonic spectrum that ranges from 20 kHz to 10 MHz and
corresponds to the wavelengths from 10 to 10-3 cm [8] The application of
ultrasound in connection to chemical reactions is called sonochemistry The
range from 20 kHz to around 1 MHz is used in sonochemistry since acoustic
cavitation in liquids can be efficiently generated within this frequency range
[9] However common laboratory equipment utilizes the range between 20
and 40 kHz The Ultrasound are often used in the preparation of supported
catalysts (some examples are reported in ref [10]) and their useful
contribution concerns for example the dispersion of metal the size of particles
the surface area and the advantage is evident in the performance of catalyst in
many cases both in term of conversion and of process selectivity [11]
The use of ultrasound may be very efficient to optimize the dispersion of high
metal charge as already verified in our laboratory in the past [2 12-13]
US treatment has been performed between the impregnation and the
evaporation step by irradiating the silica-precursors solution using a Sonicator
(W-385 Heat Systems Ultrasonics) with an effective input power of 60 W and a
tip diameter of 13 mm (Fig54 and Fig 55) Silica solution promoters and
water have been sonicated by the US horn for 05 h in air (US1) The same
sample was successively sonicated in a suspension of hexane in argon for 3h
(US2)
Chapter 5 Catalysts preparation and characterization
153
Figura 54 Diagram of sonication step
1 Sonicator US (W-385 of Heat Systems Ultrasonics)
2 Emitter head of US equipped with a titanium tip of 13 mm
3 Beaker with the solution immerse in a bath of waterice
4 Flow meter of Ar
5 Connection with air
6 Argon Cylinder
Fig 55 Detail of the US treatment step 20 kHz 60 W tip diameter of 13 mm US
switched on and off alternatively for 05 seconds (pulsed US) t =30 min
1
4
6 3
2
5
Chapter 5 Catalysts preparation and characterization
154
Fe based catalyst by the co-precipitation method with TEOS
Acidic silica sol (ASS) and tetraethoxysilane (TEOS) are widely used as silica
sources of FeSiO2 catalysts [14-15] which can be incorporated into iron
catalyst matrix during the precipitation of catalyst precursors and have an
obviously dispersive effect on the iron oxide phase It is well known that the
tetraethoxysilane (TEOS) is insolvable in aqueous solutions but can slowly
hydrolyze to hydrophilic silica solgel [16]
In the TEOS- water system acid or basic can catalyze the hydrolysis of TEOS
[17] In the process of the co-precipitation TEOS hydrolyzes into silica
accompanied by the precipitation of ferric ions whereas the silica particles in
ASS may directly interact with ferric ions The different properties of two silica
sources should lead to a great diversity in both the structures and the
physicochemical properties of catalysts such as morphology dispersion
phases chemisorption Fe-SiO2 interactions and so on
As a FeSiO2 catalyst was prepared by a co-precipitation method using TEOS
The detailed process of the co-precipitation method has been described
elsewhere [18] In brief an alcoholic solution of TEOS was mixed with an
aqueous solution of iron nitrate with a FeSi atomic ratio of 10025 The mixed
solution was precipitated using an ammonium solution at 80 degC and a pH value
of 85-90 After precipitation the precipitates were aged for 2 h washed and
filtered Then the filtered cakes were dried at 120 degC overnight and calcined at
500 degC for 5 h The catalyst was denoted as FeSiO2-TEOS
Some calculations have been made to prepare the catalyst
To prepare 50ml 1M of solution of TEOS
To prepare a catalyst with a FeTEOS= 41 ratio and using 1g of Fe are required
Chapter 5 Catalysts preparation and characterization
155
To prepare the catalysts is required a ratio FeTEOS=41 thatrsquos mean 1g of Fe
correspond with 025g of TEOS
molFemolFeg
gFemolFe 01790
84755
1
OHNOgFeOHNOmolFe
OHNOgFe
molFe
OHNOmolFemolFeOHNOgFe 233
233
233233233 9)(387
980
1
9)(
9)(52403
1
9)(1017909)(
mll
ml
mol
Mlsol
gTEOS
molTEOSgTEOSmlTEOS 201
1
1000
1
11
33208
1250
700ml of distillate water was put into a beaker and heated at 77degC
OHNOgFe 233 9)(387 and 120ml of TEOS were added
Measurements of pH was taken until the solution acquired a pH
between 8 and 9
Let stand for 2 hours
The solvent is evaporated (T = 80degC)
The powder is dried in oven (T=120degC) for 4 hours
Calcination (T = 500degC) in air for 4 hours
The catalyst is sieved to obtain a powder mesh between 100 and 140
52 Catalysts characterization 521 Catalysis characterization introduction and theory
According to [19] the basic catalyst characterization involves two main steps
the investigation on the porous nature of the catalyst support (physical
properties) and on the properties of the active sites that are dispersed on the
support surface (table 53)
The complete and accurate knowledge of the properties of a catalyst is
fundamental for evaluating its performance In this work there were used
several techniques to investigate their physical and chemical properties
Chapter 5 Catalysts preparation and characterization
156
The characterization has been made for the fresh catalysts (after the
calcination at 500degC and before their loading and activation or use in FT
reactor) and in some cases after the activation and the FT reaction
Table 53 General scheme of catalysts characterization [19]
Catalyst texture
Physical properties Chemical properties
Result Technique Result Technique Geometry and shape - Optical microscopy Chemical composition -Electron spectroscopy
-Atomic adsorption
Total specific surface area
-Gas physisorption -Mercury porosimetry
Degree of dispersion -Selective chemisorption -X-ray -Electron microscopy -Magnetisation analysis
True density -X-ray analysis -Neutron diffraction
Degree of dispersion -Selective chemisorption -X-Ray -Electron microscopy -Magnetisation analysis
Bulk and apparent density
-Helium pycnometry -Mercury porosimetry -Liquid displacement
Surface Energy -Thermal analysis test -Temperature programmed desorption and reaction calorimetry
-Pore specific volume -Porosity
-Mercury porosimetry -Gas adsorption
Acid-base sites -Selective chemisorption -Temperature programmed desorption
Pore size and mean pore size
-Mercury porosimetry -Gas Adsorption
Redox sites -Spectroscopic methods -Temp programmed reduction -Temp Programmed oxidation
Particle size -Sieves -Laser scattering -Sedimentation -Electrical sensing zone -Etc
-Catalytic properties -Activity -Selectivity
Reactor tests and simulation
Surface structure -Optical microscopy -Electron microscopy -X-Ray analysis
Surface change Z potential
A brief description of the different techniques used in this work will be
presented as follow
Chapter 5 Catalysts preparation and characterization
157
BET (adsorption method for surface area evaluation)
SEM
TEM (electron microscopy)
FT-IR and RAMAN (vibrational spectroscopy for chemistry of surface
groups)
TPR (study of catalyst reduction vs temperature)
TPD
ICP (quantification of element inside the catalyst)
XRD
5211 BET analysis (adsorption method for surface area evaluation)
According to [20] the most widely used method for determining surface area
involves measuring the amount of gas adsorbed on a solid surface at a
temperature close to the boiling point of the gas Nitrogen is most commonly
used as the adsorbate
The interaction between the adsorbate and the adsorbent may be chemical
(chemisorption) or physical (physisorption) in nature and ideally should be a
surface-specific interaction If the adsorption is measured at several gas
pressures the Brunauer- Emmett-Teller (BET) [21] equation can be used to
calculate the amount of adsorbate required to form a monolayer [22] This
technique of characterization of solid has the particular equation that allows to
determine a parameter of great importance in the study of the solid ones that
is the superficial specific area Such parameter expresses the relationship
between the total surface of the catalyst and the weight of the same one and
usually is expressed in m2g Technique BET uses the principle of the physical
inert gas adsorption (nitrogen) to varying of the relationship between the
Chapter 5 Catalysts preparation and characterization
158
partial pressure of nitrogen and its vapor pressure to the temperature of liquid
nitrogen The technique can be carried in static or dynamic conditions
Opportune procedures of calculation allow also to determine the distribution
of the pores in the field of mesoporosity BET theory is a well-known rule for
the physical adsorption of gas molecules on a solid surface that is basis for an
important analysis technique for the measurement of the specific surface area
of a material The concept of the theory is an extension of the Langmuir theory
which is a theory for monolayer molecular adsorption to multilayer adsorption
with the following hypotheses (a) gas molecules physically adsorb on a solid in
layers infinitely (b) there is no interaction between each adsorption layer and
(c) the Langmuir theory can be applied to each layer The resulting BET
equation is the following
p
pc
p
p
p
pc
V
V
m111
(5)
Where
V = volume of adsorbed gas at pressure P
pdeg = gas saturation pressure at temperature T
ppdeg = relative pressure
C = BET constant expressed by the following
RTqqC L exp 1 (6)
Where
q1 = heat of adsorption of the first layer
qL = heat of adsorption of the second and higher layers
For the Vm calculation the (6) must be linearized and the linear relationship of
this equation is maintained only in the range of 005 lt P P0 lt 035
Chapter 5 Catalysts preparation and characterization
159
mm cV
p
pc
CV
p
pV
p
p
1
1
1
(7)
Equation (7) is an adsorption isotherm and can be plotted as a straight line with
1 V[(Pdeg P) minus 1] on the y-axis and P P0 on the x-axis according to
experimental results The specific surface area is determined on the Vm basis
mol
molAVm
V
ANVAS
(8)
Where
NAV = Avogradorsquos number
Amol= adsorption cross section (for N2 = 162 Aring2)
Vmol= molar volume of gas (22414 mlmol)
Experimental The samples have been analyzed using a Costech Sorptometer
1042 ldquoKELVINrdquo using liquid nitrogen Before the analysis the catalyst is put in
oven (T = 110degC for 16 h) to remove the adsorbed water Then a quantity
between 008 g and 02 g in analyzed in the instrument The sample is pre-
treated for 2 h at T = 200degC in a N2 flow to remove all the impurity then a
check with helium is made to calibrate the interspatial volume
5212 Temperature programmed reduction TPR analysis [19]
Some aspects related to catalysts characteristic and behaviour will be treated
as determination of metal surface area and dispersion spillover effect and
synterisation A description of the available techniques will follow taking in
consideration some aspects of the gas-solid interactions mechanisms
(associativedissociative adsorption acid-base interactions etc)
Chapter 5 Catalysts preparation and characterization
160
The thermal analysis methods may be used with different objectives the
reaction or desorption profile may be used qualitatively to fingerprint a given
system and then it is possible to make a quantitative considerations about the
nature of chemical processes the amount of gas involved in the chemical
reaction and finally to calculate the number of the active sites the reducibility
degree of the sample related to the catalytic activity All the methods relating
some characteristic properties of a catalyst to its temperature during a
programmable heating ramp are named commonly in the field of the thermal
analysis
The thermal analyses are often used to investigate surface modifications and
bulk reactivity by varying the surface composition the catalyst preparation
method the pre-treatment for catalyst activation and the analytical conditions
The TPRO involve a bulk reaction
The objectives of the programmed reduction (TPR) are essentially the
following 1) to find the most efficient reduction conditions 2) to identify the
supported precursor phases and their interactions with the support 3) to
characterize complex systems as bimetallic or doped catalyst to determine the
role of the second component ant to establish alloy formation or promotion
effects There are several interesting studies about this technique Robertson
et al [23] first reported TPR profile of nickel and nickel-copper catalysts and
since then many catalysts have been investigated In the TPR technique an
oxided catalyst precursor is submitted to a programmed temperature rise
while a reducing gas mixture is flowed over it (usually hydrogen diluted in
some inert gas as nitrogen or argon) An interesting application of this
technique is that the TPRO analysis may be used to obtain evidence for the
interaction between the atoms of two metallic components in the case of
bimetallic system or alloy as already cited In general TPRTPO studies are
Chapter 5 Catalysts preparation and characterization
161
carried out under low partial pressure of the reactive gas In this way it is
possible to observe the intermediate reactions depending from analytical
conditions as temperature rate flow rate and concentration of reactive gas
Experimental
Conventional temperature-programmed reduction experiments (TPR)
were performed on the calcined catalysts using a TPRDO110
instrument (Thermoquest) The samples were initially pre-treated in
flowing argon at 200degC for 05 h After being cooled to 50degC the H2Ar
(51 vv) reducing mixture flowed through the sample at 30 mlmin
while the temperature was increased from 50 to 900degC at constant rate
of 8 degCmin
5213 SEM and TEM analysis
In electron microscopy as in any field of optics the overall contrast is due to
differential absorption of photons or particles (amplitude contrast) or
diffraction phenomena (phase contrast) The method provides identification of
phases and structural information on crystals direct images of surfaces and
elemental composition and distribution Routine applications however may be
hampered by complexities of image interpretation and by constraints on the
type and preparation of specimens and on the environment within the
microscope
The scanning electron microscope (SEM) is a type of electron microscope that
creates various images by focusing a high energy beam of electrons onto the
surface of a sample and detecting signals from the interaction of the incident
electrons with the samples surface The type of signals gathered in a SEM
varies and can include secondary electrons characteristic x-rays and back
scattered electrons In a SEM these signals come not only from the primary
Chapter 5 Catalysts preparation and characterization
162
beam impinging upon the sample but from other interactions within the
sample near the surface The SEM is capable of producing high-resolution
images of a sample surface in its primary use mode secondary electron
imaging Due to the manner in which this image is created SEM images have
great depth of field yielding a characteristic three-dimensional appearance
useful for understanding the surface structure of a sample This great depth of
field and the wide range of magnifications are the most familiar imaging mode
for specimens in the SEM Characteristic x-rays are emitted when the primary
beam causes the ejection of inner shell electrons from the sample and are used
to tell the elemental composition of the sample The back-scattered electrons
emitted from the sample may be used alone to form an image or in conjunction
with the characteristic x-rays as atomic number contrast clues to the elemental
composition of the sample The SEM was pioneered by Manfred von Ardenne
in 1937 [24] and [25] The instrument was further developed by Charles Oatley
and first commercialized by Cambridge Instruments The spatial resolution of
the SEM depends on the size of the electron spot which in turn depends on
both the wavelength of the electrons and the magnetic electron-optical system
which produces the scanning beam The resolution is also limited by the size of
the interaction volume or the extent to which the material interacts with the
electron beam The spot size and the interaction volume both might be large
compared to the distances between atoms so the resolution of the SEM is not
high enough to image individual atoms as is possible in the shorter wavelength
(ie higher energy) transmission electron microscope (TEM) The SEM has
compensating advantages though including the ability to image a
comparatively large area of the specimen the ability to image bulk materials
(not just thin films or foils) and the variety of analytical mode available for
measuring the composition and nature of the specimen Depending on the
Chapter 5 Catalysts preparation and characterization
163
instrument the resolution can fall somewhere between less than 1 nm and 20
nm In general SEM images are easier to interpret than TEM images
According to [22] topographical images in a SEM are formed from back-
scattered primary or low-energy secondary electrons The best resolution is
about 2-5 nm but many routine studies are satisfied with a lower value and
exploit the case of image interpretation and the extraordinary depth of field to
obtain a comprehensive view of the specimen With non-crystalline catalysts
SEM is especially useful for examining the distribution and sizes of mesopores
An energy dispersive X-ray spectroscopy device is a frequent attachment in the
instrument
Fig 56 Schematic ray path for a scanning electron microscope (SEM) [26]
Transmission electron microscopy (TEM) is a microscopy technique whereby a
beam of electrons is transmitted through an ultra-thin specimen interacting
with the specimen as it passes through it An image is formed from the
electrons transmitted through the specimen magnified and focused by an
objective lens and appears on an imaging screen a fluorescent screen in most
TEMs plus a monitor or on a layer of photographic film or to be detected by a
sensor such as a CCD camera The first practical transmission electron
microscope was built by Albert Prebus and James Hillier at the University of
Chapter 5 Catalysts preparation and characterization
164
Toronto in 1938 using concepts developed earlier by Max Knoll and Ernst
Ruska
Theoretically the maximum resolution that one can obtain with a light
microscope has been limited by the wavelength of the photons that are being
used to probe the sample and the numerical aperture of the system Early
twentieth century scientists theorized ways of getting around the limitations of
the relatively large wavelength of visible light (wavelengths of 400ndash700
nanometers) by using electrons Like all matter electrons have both wave and
particle properties (as theorized by Louis-Victor de Broglie) and their wave-like
properties mean that a beam of electrons can be made to behave like a beam
of electromagnetic radiation Electrons are usually generated in an electron
microscope by a process known as thermionic emission from a filament usually
tungsten in the same manner as a light bulb or by field emission The
electrons are then accelerated by an electric potential (measured in V or volts)
and focused by electrostatic and electromagnetic lenses onto the sample The
beam interacts variously with the sample due to differences in density or
chemistry The beam that is transmitted through the sample contains
information about these differences and this information in the beam of
electrons is used to form an image of the sample The contrast in a TEM image
is not like the contrast in a light microscope image A crystalline material
interacts with the electron beam mostly by diffraction rather than absorption
although the intensity of the transmitted beam is still affected by the volume
and density of the material through which it passes The intensity of the
diffraction depends on the orientation of the planes of atoms in a crystal
relative to the electron beam at certain angles the electron beam is diffracted
strongly from the axis of the incoming beam while at other angles the beam is
largely transmitted
Chapter 5 Catalysts preparation and characterization
165
Just as details of a light microscope sample can be enhanced by the use of
stains staining can be used to enhance differences in a sample for electron
microscopy Compounds of heavy metals such as osmium lead or uranium can
be used to selectively deposit heavy atoms in areas of the sample and to
enhance structural detail by the dense nuclei of the heavy atoms scattering the
electrons out of the optical path The electrons that remain in the beam can be
detected using a photographic film or fluorescent screen among other
technologies So areas where electrons have been scattered in the sample can
appear dark on the screen or on a positive image due to this scattering TEM is
suitable for examination of supported catalysts with particle sizes down to 2-3
nm giving information on particle location over the support on particle-size
distributions in favourable cases on particle and support morphology and on
the nature and distribution of deposits having a thickness of the order of 2-3
nm Surface topography can be examined using replication techniques [22]
Fig57 Schematic ray path for a transmission electron microscope (TEM) [26]
Experimental The SEM analysis have been made in collaboration with Perugia University
SEM images were measured using an electron microscopy Philips XL-30CP with
RBS detector of back-scattered electrons and EDS analyzer was used to
describe the surface and elemental composition of catalysts
Chapter 5 Catalysts preparation and characterization
166
The TEM analysis have been made in collaboration with Perugia University The
morphology of the samples was investigated by a transmission electron
microscope Philips 208 Transmission Electron Microscope (TEM) a drop of the
dispersion was deposited on a copper grid covered with a polymeric film
Formvar subsequently evaporated in air at room temperature
In order to obtain more accurate information concerning the atomic
percentage of the elements on the surface EDX measurements were made
using the high-resolution TEM instrument at the Department of Chemical
Science and Technology and Biosystems studies at the University of Siena This
instrumentation allows to obtain with high precision information on the atomic
percentage in different areas of the sample going to select individual points or
individual areas
5214 FT-IR analysis
This vibrational spectroscopy is used for characterization of high area
supported or unsupported catalysts Information is available either directly or
by study of probe adsorbates on the chemistry of surface groups (particularly
on oxides) It is also used for the study of the behavior of precursor compounds
during catalyst preparation
Infrared spectroscopy is the subset of spectroscopy that deals with the infrared
region of the electromagnetic spectrum It covers a range of techniques the
most common being a form of absorption spectroscopy As with all
spectroscopic techniques it can be used to identify compounds or investigate
sample composition Infrared spectroscopy correlation tables are tabulated in
the literature
The infrared portion of the electromagnetic spectrum is divided into three
regions the near- mid- and far- infrared named for their relation to the visible
spectrum The far-infrared approximately 400-10 cm-1 (1000ndash30 μm) lying
Chapter 5 Catalysts preparation and characterization
167
adjacent to the microwave region has low energy and may be used for
rotational spectroscopy The mid-infrared approximately 4000-400 cm-1 (30ndash
14 μm) may be used to study the fundamental vibrations and associated
rotational-vibrational structure The higher energy near-IR approximately
14000-4000 cm-1 (14ndash08 μm) can excite overtone or harmonic vibrations The
names and classifications of these sub regions are merely conventions They
are neither strict divisions nor based on exact molecular or electromagnetic
properties
Infrared spectroscopy exploits the fact that molecules have specific frequencies
at which they rotate or vibrate corresponding to discrete energy levels These
resonant frequencies are determined by the shape of the molecular potential
energy surfaces the masses of the atoms and by the associated vibronic
coupling In order for a vibrational mode in a molecule to be IR active it must
be associated with changes in the permanent dipole In particular in the Born-
Oppenheimer and harmonic approximations ie when the molecular
Hamiltonian corresponding to the electronic ground state can be approximated
by a harmonic oscillator in the neighbourhood of the equilibrium molecular
geometry the resonant frequencies are determined by the normal modes
corresponding to the molecular electronic ground state potential energy
surface Nevertheless the resonant frequencies can be in a first approach
related to the strength of the bond and the mass of the atoms at either end of
it Thus the frequency of the vibrations can be associated with a particular
bond type
Simple diatomic molecules have only one bond which may stretch More
complex molecules have many bonds and vibrations can be conjugated
leading to infrared absorptions at characteristic frequencies that may be
related to chemical groups For example the atoms in a CH2 group commonly
Chapter 5 Catalysts preparation and characterization
168
found in organic compounds can vibrate in six different ways symmetrical and
antisymmetrical stretching scissoring rocking wagging and twisting
The infrared spectra of a sample are collected by passing a beam of infrared
light through the sample Examination of the transmitted light reveals how
much energy was absorbed at each wavelength This can be done with a
monochromatic beam which changes in wavelength over time or by using a
Fourier transform instrument to measure all wavelengths at once From this a
transmittance or absorbance spectrum can be produced showing at which IR
wavelengths the sample absorbs Analysis of these absorption characteristics
reveals details about the molecular structure of the sample
This technique works almost exclusively on samples with covalent bonds
Simple spectra are obtained from samples with few IR active bonds and high
levels of purity More complex molecular structures lead to more absorption
bands and more complex spectra The technique has been used for the
characterization of very complex mixtures
According to [10] problems in vibrational spectroscopy include low
transmission at high metal loadings and strong oxide scattering Absorption at
lower wavenumbers often prevents observation of modes such as adsorbate-
metal stretching Fourier Transform (FI-IR) spectrometers offer two
pronounced advantages over dispersive instruments higher energy throughput
and faster data acquisition or higher signal-to-noise ratio Data processing is
easy These features are significant when examining very strongly absorbing
and scattering solids and when following dynamic processes Much IR
transmission work however requires examination of only limited frequency
ranges at medium resolution and computerised dispersive spectrometers may
then be preferable
Chapter 5 Catalysts preparation and characterization
169
Experimental The FT-IR analysis have been made in collaboration with Perugia
University Infrared spectra were measured with a FTIR model IFS113V Bruker
spectrometer resolution of 1 cm-1 in the spectral region 370-5000 cm-1
Fig 58 FTIR model IFS113V Bruker spectrometer
5215 micro-Raman analysis
Raman spectroscopy is more versatile for catalysts characterization and in
comparison with IR spectroscopy it presents at least two important
advantages there is no need of sample preparation and the spectra of water-
metal interfaces are obtained easily and quickly
Raman spectroscopy is a spectroscopic technique used in condensed matter
physics and chemistry to study vibrational rotational and other low-frequency
modes in a system [27] It relies on inelastic scattering or Raman scattering of
monochromatic light usually from a laser in the visible near infrared or near
ultraviolet range The laser light interacts with photons or other excitations in
the system resulting in the energy of the laser photons being shifted up or
down The shift in energy gives information about the phonon modes in the
system Infrared spectroscopy yields similar but complementary information
Typically a sample is illuminated with a laser beam Light from the illuminated
spot is collected with a lens and sent through a monochromator Wavelengths
close to the laser line due to elastic Rayleigh scattering are filtered out while
Chapter 5 Catalysts preparation and characterization
170
the rest of the collected light is dispersed onto a detector Spontaneous Raman
scattering is typically very weak and as a result the main difficulty of Raman
spectroscopy is separating the weak inelastically scattered light from the
intense Rayleigh scattered laser light Raman spectrometers typically use
holographic diffraction gratings and multiple dispersion stages to achieve a
high degree of laser rejection In the past PMTs were the detectors of choice
for dispersive Raman setups which resulted in long acquisition times
However the recent uses of CCD detectors have made dispersive Raman
spectral acquisition much more rapid Raman spectroscopy has a stimulated
version analogous to stimulated emission called stimulated Raman scattering
The Raman effect occurs when light impinges upon a molecule and interacts
with the electron cloud of the bonds of that molecule The incident photon
excites one of the electrons into a virtual state For the spontaneous Raman
effect the molecule will be excited from the ground state to a virtual energy
state and relax into a vibrational excited state which generates Stokes Raman
scattering If the molecule was already in an elevated vibrational energy state
the Raman scattering is then called anti-Stokes Raman scattering A molecular
polarizability change or amount of deformation of the electron cloud with
respect to the vibrational coordinate is required for the molecule to exhibit the
Raman effect The amount of the polarizability change will determine the
intensity whereas the Raman shift is equal to the vibrational level that is
involved This technique is widely applicable The large frequency range (50-
4000 cm-1) makes adsorbate-adsorbent stretching modes accessible Problems
include specimen heating high background fluorescence and low signal
strengths Surface enhanced Raman scattering (SERS) however can give
greatly increased signals in favorable cases eg with rough surfaces or small
Chapter 5 Catalysts preparation and characterization
171
particles of certain compounds It is particularly useful in the studies of
supported monolayer catalysts and adsorbed layers [22]
Experimental The Micro-Raman analysis have been made in collaboration with
Perugia University Micro-Raman spectra were made by an Olympus
microscope mod BX40 connected to an ISA Jobin-Yvon model TRIAX320 single
monochromator resolution 1 cm-1 The exciting source was a Melles Griot
25LHP925 He-Ne laser used in single line excitation mode at 6328 nm The
power focused on the samples was always less than 2 mW The scattered
Raman photons were detected by a liquid-nitrogen cooled CCD Jobin Yvon
Mod Spectrum One Samples were not pre-treated but measured as a power
placed on a microscope slide in this way it is possible to analyse the few
microns grain size and not to focus on those regions where the presence of the
support (silica) was predominant The reproducibility of the spectra was always
controlled sampling different points of the catalyst Through the optical
microscope analysis we also verified that no local degradation occur during
laser irradiation
5216 ICP-MS analysis
ICP-MS (Inductively coupled plasma mass spectrometry) is a type of mass
spectrometry that is highly sensitive and capable of the determination of a
range of metals and several non-metals at very low concentrations It is based
on coupling together an inductively coupled plasma as a method of producing
ions (ionization) with a mass spectrometer as a method of separating and
detecting the ions ICP-MS is also capable of monitoring isotopic speciation for
the ions of choice A plasma is a gas that contains a sufficient concentration of
ions and electrons to make the gas electrically conductive The plasmas used in
Chapter 5 Catalysts preparation and characterization
172
spectrochemical analysis are essentially electrically neutral with each positive
charge on an ion balanced by a free electron In these plasmas the positive ions
are almost all singly-charged and there are few negative ions so there are
nearly equal numbers of ions and electrons in each unit volume of plasma
ICP for spectrometry is sustained in a torch that consists of three concentric
tubes usually made of quartz The end of this torch is placed inside an
induction coil supplied with a radio-frequency electric current A flow of argon
gas (usually 14 to 18 lmin) is introduced between the two outermost tubes of
the torch and an electrical spark is applied for a short time to introduce free
electrons into the gas stream These electrons interact with the radio-
frequency magnetic field of the induction coil and are accelerated first in one
direction then the other as the field changes at high frequency (usually 2712
million cycles per second) The accelerated electrons collide with argon atoms
and sometimes a collision causes an argon atom to part with one of its
electrons The released electron is in turn accelerated by the rapidly-changing
magnetic field The process continues until the rate of release of new electrons
in collisions is balanced by the rate of recombination of electrons with argon
ions (atoms that have lost an electron) This produces a lsquofireballrsquo that consists
mostly of argon atoms with a rather small fraction of free electrons and argon
ions The temperature of the plasma is very high of the order of 10000 K The
ICP can be retained in the quartz torch because the flow of gas between the
two outermost tubes keeps the plasma away from the walls of the torch A
second flow of argon (around 1 lmin) is usually introduced between the
central tube and the intermediate tube to keep the plasma away from the end
of the central tube A third flow (again usually around 1 lmin) of gas is
introduced into the central tube of the torch This gas flow passes through the
centre of the plasma where it forms a channel that is cooler than the
Chapter 5 Catalysts preparation and characterization
173
surrounding plasma but still much hotter than a chemical flame Samples to be
analyzed are introduced into this central channel usually as a mist of liquid
formed by passing the liquid sample into a nebulizer As a droplet of nebulised
sample enters the central channel of the ICP it evaporates and any solids that
were dissolved in the liquid vaporize and then break down into atoms At the
temperatures prevailing in the plasma a significant proportion of the atoms of
many chemical elements are ionized each atom losing its most loosely-bound
electron to form a singly charged ion
The ions from the plasma are extracted through a series of cones into a mass
spectrometer usually a quadrupole The ions are separated on the basis of
their mass-to-charge ratio and a detector receives an ion signal proportional to
the concentration
The concentration of a sample can be determined through calibration with
elemental standards ICP-MS also lends itself to quantitative determinations
through Isotope Dilution a single point method based on an isotopically
enriched standard
Experimental ICP measurements were determined by Inductively Coupled
Plasma-Optical Emission Spectrometers (ICP-OES) Varian 700-ES
Fig 59 Instrument Varian Liberty ICP-OES
Chapter 5 Catalysts preparation and characterization
174
Fig 510 scheme of instrument Varian Liberty ICP-OES
5217 XRD
The XRD analysis have been made in collaboration with Perugia University
The obtained materials were characterized by X-ray powder diffraction (XRD
PANalytical XrsquoPert Pro CuKα radiation) operating at 40 kV and 40 mA step scan
1 min_1 and 1 s counting time in the 2ndash40deg range at room temperature
Fig 511 Instrument XRD PANalytical XrsquoPert Pro CuKα radiation
522 Catalysts characterization results The characterization analyses were performed on the fresh and in some cases
on used catalysts ldquoFresh catalystsrdquo indicate the samples as prepared
ldquoActivated catalystsrdquo indicate the samples charged in the FTS reactor and
reduced using the activation procedure and removed from the reactor ldquoUsed
Chapter 5 Catalysts preparation and characterization
175
catalystsrdquo indicate the samples after their use in the Fischer-Tropsch synthesis
reaction
5221 BET characterization results
The BET results are reported in Table 54
Table 54 BET characterization results
CATALYST Specific Surface area
(m2g)
Co-based
HTlc
Co5 1746
Co10 1147
Co15 720
Co35 584
Co
synthesized
with US
CoSiO2 3600
CoAl2O3 1160
CoTiO2 550
Co-RuSiO2 3460
Co-RuAl2O3 1080
Co-RuTiO2 130
Fe-based
Fe30K20Cu375 TR 160
Fe30K20Cu375-MW1 180
Fe30K20Cu375-MW2 224
Fe30K20Cu375-US1 201
Fe30K20Cu375-US2 210
MW1= Catalyst put it into a kitchen MW and processed in powder MW2= Catalyst put it into MW and suspended in hexane US1= Catalyst suspended in aqueous solution in air atmosphere for 05 h US2= Catalyst sonicated and suspended in hexane in Argon atmosphere for 3h
The composition and specific surface area (SSA) of the HTlc are reported
in Table 54 Note that the SSA decreases with the increase of the
amount of cobalt The relatively large dimensions and high crystallinity
of particles reflect a low specific surface area [28] The surface area of
Co15 and Co35 after the reduction procedure was determined by BET
Chapter 5 Catalysts preparation and characterization
176
method The values obtained are 734 m2 g-1 for the sample Co15 and
783 m2 g-1 for the sample Co35 both higher than the untreated
materials
For the Co and Co-Ru based catalysts synthesized with the help of
ultrasound it is clear how the addition of the promoter show a
diminution of the SSA in every case (CoSiO2 3600 higher than the co-
respective Co-RuSiO2 with 3460 550 and 130 for Co and Co-RuTiO2
and 1160 and 1080 for Co and Co-RuAl2O3) The SiO2 acts as the best
support even in presence of the promoter The TiO2 tends to keep lower
the SSA of the catalyst and the Al2O3 represents an intermediate way of
the supports used in this group of catalysts
The surface area of catalysts is influenced by the method of synthesis
as shown in Table 55 and in Fig 512 Fe-based catalysts treated with
MW and US have higher values of SSA than the traditional ones the
effect of MW and US on SSA increases increasing the US or MW
emitting power
According to [1] The samples sonicated in argon (US2) present the
highest SSA indicating that the US effects in argon atmosphere are
more remarkable The use of this gas enhances cavitation effects
because increases the temperatures of the collapsing bubbles
generated by US [29] The change of catalysts morphology due to US
treatment (SEM analyses) could explain the increase of SSA in these
samples Catalysts prepared by MW show a higher SSA than the
traditional ones 180 and 224 m2 g-1 for the samples Fe30-MW1 and
Fe30-MW2 respectively with a similar increase of about 25 respect
the traditional prepared sample Moreover the surface area of these
Chapter 5 Catalysts preparation and characterization
177
samples seems not to be dependent on the power of the MW
treatment
Fig 512 Fe30K20Cu375 surface area vs different methods of synthesis
5222 TPR characterization results
Co-based catalysts HTLc
As discussed previously the active phase in the FTS is the metallic cobalt while
the HTlc materials contain Co(II) ions randomly dispersed inside the brucitic
layers Therefore in order to have an active catalyst a reduction procedure is
required to form the cobalt particles TPR analyses were performed to study
the reduction process and select the best conditions for the catalyst activation
Fig 513 shows the TPR profile of the samples Co5 Co15 Co35 while Table 55
reports the reduction temperature and the percentage of reduced Co All the
profiles exhibit two regions of reduction the first at lower temperatures
(below 400degC) which is due to the reduction of Co3O4 while the second peak
above 700 degC indicates the presence of hardly reducible species These species
are probably spinel-type mixed oxides formed during the thermal treatment
TPR profiles of CoOx mixed oxides is well described in the literature [30-36]
The reduction profile of Co3O4 in the low temperature region consists in two
peaks corresponding to the reduction of Co3+ to Co2+ and Co2+ to Co0
Chapter 5 Catalysts preparation and characterization
178
According to Alvarez et al [37] these two peaks are well separated for samples
with small particle size while an intermediate particle size causes the
overlapping of the two reduction steps resulting in a complete reduction with
only one maximum at an intermediate temperature (328 degC) The TPR profiles
of our HTlc (Fig 513) are consistent with the latter case Based on the TPR
results (Table 55) the tested catalysts were activated at 350degC for 4 hours
under hydrogen atmosphere in order to reduce the Co ions to metallic Co
Fig 513 TPR profile of the fresh samples Co5 Co10 Co15 Co35 The activation
temperature used in the FTS reactor before the catalytic test is indicated with the
dashed line
Chapter 5 Catalysts preparation and characterization
179
Note that the sample Co15 exhibit the lowest reduction temperature that is
significantly lower than the activation temperature adopted in the FT process
(350degC) A low reduction temperature may favour the presence of catalyst in its
reduced state during the catalytic process The of reduced Co evaluated by
TPR is generally high However these values strongly depend on reduction
conditions (pressure temperature ramp gas flow etc) that are different from
those used in the FT reactor as detailed in the experimental section
Table 55 Reduction temperature and of cobalt reduction of the fresh samples Co5
Co15 Co35
Sample TPR
Tmax (degC) Co Red
Co5 328 58
Co15 278 54
Co35 295 83
Co and Co-Ru catalysts synthesized with US
Table 56 shows the TPR profiles of the samples CoAl2O3 CoSiO2 CoTiO2
and Co-RuAl2O3 Co-Ru SiO2 Co-Ru TiO2
Chapter 5 Catalysts preparation and characterization
180
Table 56 TPR diagrams and values summary for Co and Co-Ru catalysts with US
Catalyst TPR Profile
CoAl2O3
Co SiO2
CoTiO2
Co-RuSiO2
Co-RuAl2O3
Co-RuTiO2
Iron catalysts
Chapter 5 Catalysts preparation and characterization
181
For the supported iron based catalysts three stage of phase transformation
could be identified starting from oxidised form of iron hematite (Fe2O3) to
magnetite (Fe3O4) magnetite to metallic iron (-Fe) [39] It is known [39-40]
that copper promotes the reduction to hematite to magnetite and also the
reduction of magnetite to -Fe to a lesser extent but it needs to be very well
mixed with iron to provide the most favourable promoter effect on the
hematite rarr magnetite phase transformation For what concerns the support
(silica) Jin and Datye [38] observed that the most important effect of silica is
an improvement in the thermal stability of the catalysts in fact the silica
support is very effective at inhibiting the sintering of the iron catalyst
The results of TPR characterization for iron catalysts are reported in Table 57
The number the position and the shape of the peaks agree with literature [38]
In many cases the TPR peaks corresponding to transformations of CuO rarr Cu
and Fe2O3 rarr Fe3O4 were found to overlap and this is the first peaks at low
temperature The second broad peak at higher temperature on the TPR profile
corresponds to the phase transformation of Fe3O4 rarr -Fe The large peak
width for this last transformation indicates this is slow process
TPR analyses show that the metal reduction starts at about 230degC for promoted
catalysts According to Pirola [2] it is clear therefore the role of Cu in the
improvement of iron oxide phases reduction as well known in literature a
suggested mechanism for this promotion effect is the migration of atomic
hydrogen from reduced Cu sites to the iron oxide [38 40]
Therefore the different preparation methods do not influence the peaks
temperature of the reduction steps of the catalytic samples in any case
Chapter 5 Catalysts preparation and characterization
182
Table 57 TPR diagrams and values summary for Fe30K20Cu375 catalysts with different
methods of synthesis
Catalysts Diagrams
Fe30K2Cu375SiO2
Fe30K2Cu375SiO2
(MW2)
Fe30K2Cu375SiO2
(MW1)
Fe30K20Cu375 SiO2 (US1)
305133 467463
800
Temperature degC0 200 400 600 800
800
Sig
na
l (
mV
)
0
200
400
600
800
5223 SEM ndash TEM characterization results
Chapter 5 Catalysts preparation and characterization
183
SEM analyses are reported in Fig 514 (for HTlc) Fig 515 (for Co and Co-Ru
with US) and in Fig 516 (for Fe catalysts)
Cobalt Catalysts
o HTlc
The morphology of the synthesized HTlc was investigated by SEM and TEM
Images of Co15 and Co35 selected as representative samples (Fig 514 a-d)
show that they are constituted by homogeneous aggregates of hexagonal and
platy particles of few hundreds nanometers of thickness and with a
dimensional range between 2-5 μm In TEM micrographs the hexagonal
morphology of HTlc microcrystals is clearer The relatively large dimensions and
high crystallinity of particles reflect a low specific surface area in the range of
6-18 m2g-1 (Table 54) Composition maps of Co15 (Fig 515) obtained with
coupled SEM-EDS analysis highlight the homogeneous Co Zn and Al dispersion
over the entire analyzed spot area without creating single-metal domains
indicating good metal distributions in the samples Similar dispersion
characteristics were obtained for all the samples studied although not
reported here for the sake of brevity
Fig5 14 SEM (left) and TEM (right) images of fresh samples Co15 (ab) and Co35 (cd)
Chapter 5 Catalysts preparation and characterization
184
Fig5 15 SEM image of fresh sample Co15 and the corresponding EDS images of the
metals Al (red) Co (white) and Zn (pink)
SEM and TEM images of two activated samples are reported in Fig 16a-d The
results indicate that the material keeps the original morphology with hexagonal
crystals of micrometric dimensions At higher magnification (TEM images) the
segregation of dense particles homogeneously distributed on the surface and
having dimensions of about 8 nm probably due to metallic Co was evident
[41]
Fig 516 SEM (left) and TEM (right) images of activated Co15 (ab) and Co35 (cd)
SEM images of Co5 Co15 and Co35 after the catalytic run at 260degC are shown
in Fig 517 Samples containing Zn (Co5 and Co15) reveal the presence of a
Chapter 5 Catalysts preparation and characterization
185
nanometric phase crystallized on the catalyst surfaces The absence of this
nanometric phase on Co35 surface (which does not contain Zn) may indicate
the presence of ZnO according to the XRD pattern (it will be show later)
Fig517 SEM images of Co5 (ab) Co15 (cd) Co35 (ef) after catalytic run at
260degC and 20 bar and at different magnifications
o Co and Co-Ru synthesized with US The Fig 518 show the SEM
analyses of the samples with and without the presence of Ru
The chemical effect of US arises from acoustic cavitation ie the
formation growth and implosive collapse of bubbles in a liquid
Some of the interesting features resulting from the application
of sonication as a synthetic method are the nanoparticles
Chapter 5 Catalysts preparation and characterization
186
preparation showing a more uniform size distribution higher
surface area and a more controlled phase composition
(Fig518)
Fig 518 SEM analyses for Co based catalysts with US Magnification 2000X
Iron Catalysts
SEM analyses are essential to evaluate the morphology of catalysts with high
loading of iron and to control the metal dispersion The iron covers the surface
of silica in a progressive level with its increase and it is well distributed in the
more loaded catalyst too [40]
Chapter 5 Catalysts preparation and characterization
187
The aggregates of iron with spherical shape are regularly distributed on the
support In the case of the catalysts prepared with the step of ultrasound it
can be seen an uniform layer of iron on SiO2 The spherical shape aggregates
are substituted by this iron layer The catalyst morphology and the metal
dispersion are similar for the two US samples [43]
SEM analyses (Fig 519) have been the key to both evaluate the morphology of
all the prepared catalysts and observe their metal distribution (using EDX
analysis) Notwithstanding this general trend both the morphology and the
shape of iron aggregates strongly depend on preparation method In Fig 519
SEM analysis of samples through different preparation methods are reported
In the traditional prepared sample (Fig 519a) it is possible to observe Fe
spherical shape aggregates on the bare silica surface Iron is present only in
these particles and coverage of the support is not complete The same
morphology is present in the MW prepared sample (Fig 519b) On the
contrary on US prepared ones (Fig 519c (air) and 519d (argon)) there is a
uniform layer of iron on SiO2 The support in fact is not easily visible due to its
complete coverage as confirmed by SEMndashEDX analyses The spherical shape
aggregates are substituted by this iron layer both the catalyst morphology and
the metal dispersion are similar for the two US samples but completely
different with both the traditional and the MW ones
It is even more interesting the comparison between samples prepared by
different sonication time for example Fe30-US2 (Fig 519c) and Fe30-US1 (Fig
519d) when the US treatment is performed for 05 h the surface seems to be
covered by Fe small leafs that are completely faded when sonication is
prolonged for 3 h and in their place only crashed Fe clusters are present [1]
Chapter 5 Catalysts preparation and characterization
188
a) Traditional b) MW2
c) US1 d) US2
Fig 519 SEM analyses for iron catalysts Magnification 2000X
5224 XRD and micro-RAMAN characterization results
Cobalt Catalysts
o For the HTlc the XRD and micro-RAMAN analyses Figure 520
shows the XRD patterns of the samples listed in Table 51 The
interlayer distance of 89 Aring determined from the first XRD
reflection is compatible with the presence of nitrate between
the sheets [43]
Chapter 5 Catalysts preparation and characterization
189
Fig 520 XRD pattern of the fresh samples (a) Co5 (b) Co10 (c) Co15 and (d) Co35
Activated HTlc were first characterized by XRD As an example the XRD pattern
of activated Co15 is reported in Fig 521 The pattern shows the presence of
very poorly crystalline ZnO and a spinel phase such as Co3O4 CoAl2O4 andor
ZnAl2O4 (note that mixed-oxide spinel phases show very similar XRD patterns
irrespective of their composition) Moreover the reflection at 43deg 2has been
assigned to a CoO phase with very low crystallinity and no metal aggregation is
observed The sample after the reduction treatment does not show metallic Co
phases indicating the presence of active metal atoms homogeneously
dispersed at the nanometer level [44] According to Jong et al [45] and Den
Breejenet et al [46] cobalt-based catalysts need large particle size of the active
species to create optimal domains of active sites because the activity drops for
particles smaller than 6 nm
Chapter 5 Catalysts preparation and characterization
190
Fig 521 XRD pattern of activated Co15 ZnO Co3O4 CoAl2O4 ZnAl2O4 sect CoO
In order to better understand the stability of the materials XRD patterns of
sample Co15 after the catalytic tests at two different temperatures (235degC and
260degC) were collected (Fig 522) At the lower temperature (Fig 522 a) the
pattern is close to that recorded just after the reduction process (Fig 521)
Therefore we can hypothesize that the catalyst does not change as a
consequence of the FTS process On the other hand the XRD pattern of the
catalyst recovered after the reaction at 260degC (Fig 522b) shows more
crystalline ZnO and spinel phase and the strong reduction of the peak assigned
to CoO This may indicate that during the FTS process at high temperatures
cobalt ions crystallized into a spinel phase
Chapter 5 Catalysts preparation and characterization
191
Fig522 XRD pattern of used Co15 after catalytic runs a) at 235degC and
20 bar and b) at 260degC and 20 bar ZnO Co3O4 CoAl2O4 ZnAl2O4 sect
CoO
Iron catalysts
The XRD and micro-RAMAN analyses were made to identify the iron phase
after the calcination treatments A Raman spectrum (Fig 523a) and an XRD
pattern (Fig 523b) for Fe30K2Cu375SiO2 are reported
Chapter 5 Catalysts preparation and characterization
192
Fig 523 a) Micro-Raman analysis and b) XRD for the Fe30K2Cu375SiO2 catalyst
Comparing these results with the tables reported in literature [47-48] for the
assignment of the peaks it is possible to conclude that the iron after calcination
is present as hematite Fe2O3 as expected and as reported in literature [39]
5255 ICP characterization results ICP analysis was made to verify the catalysts composition
Cobalt based catalyst
o HTlc In Table 58 the results are reported
Table 58 ICP characterization results for Co catalysts (HTlc)
HTlc
Atomic percentage in solution Basic Formula
Zn Co Al
Co5 55 15 30 [Zn057
Co010
Al033
(OH)2](NO
3)033
middot05 H2O
Co10 45 25 30 [Zn045
Co021
Al034
(OH)2](NO
3)034
middot05 H2O
Co15 35 35 30 [Zn039
Co032
Al029
(OH)2](NO
3)029
middot05 H2O
Co35 - 70 30 [Co067
Al033
(OH)2](NO
3)033
middot05H2O
Chapter 5 Catalysts preparation and characterization
193
o Co and Co-Ru with US In Table 59 the results are reported
Table 59 ICP characterization results for Co catalysts
Sample Co wt Ru wt
Co10 80 -
Co10Ru01 80 008
In general these results indicate the composition of catalysts is in good
agreement with the theoretical values
Iron based catalysts In Table 510 the results are reported
Table 510 ICP characterization results for Fe catalysts
Sample Fe wt K wt Cu wt
Fe30K20Cu375 314 19 40
5226 XRD and micro-RAMAN characterization results
Cobalt Catalysts
o For the HTlc the XRD and micro-RAMAN analyses
In order to better understand the behaviour of the materials after activation
FT-IR spectra of the sample Co15 (as a representative sample) calcined and
activated and Co3O4 have been registered (Fig 526) The spectrum of Co15
showed the typical absorption bands of the nitrate anion at 1377 cm-1 present
in the interlayer region of HTlc After calcination this band disappeared due to
nitrate degradation and the spectrum presented the typical absorptions of
Co3O4 spinel phase at 667 cm-1 and 566 cm-1 The activation process leads to
the formation of a material with very wide bands attributed to the Co3O4
phase
Chapter 5 Catalysts preparation and characterization
194
Fig 524 FT-IR spectra of the fresh and activated Co15 and of the reference Co3O4
References
[1] C Pirola C L Bianchi A Di Michele P Diodati D C Boffito V Ragaini Ultrasonic Sonochem 17610-616 (2010) [2] C Pirola PhD 2007-2008 Novel supported iron based Fischer-Tropsch catalysts Preparation characterization and applications [3] GPVaan Deer Laan AACMBeenackers CatalRev-SciEng41 (3amp4) (1999) 255 [4] YJin AKDatye Journal of catalysis 196 (2000) 8 [5] Costantino U Marmottini F Nocchetti M Vivani R Eur J Inorg Chem 1998 101439 -1446 [6] C Pirola CL Bianchi A Di Michele P Diodati S Vitali V Ragaini Catal Lett 131 (2009)294-304
Chapter 5 Catalysts preparation and characterization
195
[7] G Biffi Gentili M Linari I Longo A Ricci A IEEE Transactions on microwave theory and techniques 57 (9-2009) 2268-2275 [8] BToukoniitty JPMikkola DYuMurzin TSalmi Applied Catalysis A General 279 (2005) 1 [9] KSSuslick Sonocatalysis Handbook of Heterogeneous Catalysis VCH Verlagsgesellschaft mbH Weinheim Germany (1997) 1350 [10] BToukoniitty JPMikkola DYuMurzin TSalmi Applied Catalysis A General 279 (2005) 1 [11] WBonrath Ultrasonics Sonochemistry 12 (2005) 103 [12] CLBianchi VRagaini Catalysis Letters 95 (2004) 61 [13] CLBianchi FMartini VRagaini Ultrasonics Sonochemistry 82 (2001) 131 [14] Zhao R Goodwin JG Jr Jothimurugesan K Gangwal SK Spivey JJ (2001) Ind Eng Chem Res 401065 10 [15] Yang Y Xiang HW Tian L Wang H Zhang CH Zhong B Li YW (2005) Appl Catal A 284105 [16] Suo Haiyun Zhang Chenghua Wu Baoshan Xu Jian Yang Yong Xiang Hongwei Li Yongwang Cat Today Volume 183-1 (2012) 88ndash95 [17] Donatti DA Ruiz AI Vollet DR (2002) Ultrason Sonochem 9133 [18] Yang Y Xiang HW Tian L Wang H Zhang CH Zhong B Li YW (2005) Appl Catal A 284105 [19] Fadoni M and Lucarelli University of Milan and CE Instruments (Thermoques SpA) [20] F M NELSEN and Ff EGGERTSEN Shell Development Co Emeryville Calif ANALYTICAL CHEMISTRY VOL 30 NO 8 AUGUST 1958 1387-1390 [21] 11 S Brunauer P H Emmett and E Teller J Am Chem Soc 60 (1938) 309 [22] JHaber JHBlock and BDelmon Pureampappl Chem 67 Nos 89 (1995) 1257 [23] SDRobertson BDMcNicol JHDe Baas SCKloet JWJenkins JCatal 37 (1975) 424 [24] Von Ardenne Manfred Das Elektronen-Rastermikroskop Theoretische Grundlagen Zeitschrift fur Physik 108 (1938) 553 [25] Von Ardenne Manfred Das Elektronen-Rastermikroskop Praktische Ausfuumlhrung Z Techn Phys 108 (1938) 407 [26] Ludwig Reimer Helmut Kohl Springer Series in Optical Sciences 36 fifth edition 2008 Transmission Electron Microscopy Physics of Image Formation [27] Gardiner DJ (1989) Practical Raman spectroscopy Springer-Verlag ISBN 978-0387502540 [28] A Di Fronzo C Pirola A Comazzi F Galli CL Bianchi A Di Michele R Vivani M Nocchetti M Bastianini DC Boffito Fuel 119 (2014) 62-69
Chapter 5 Catalysts preparation and characterization
196
[29] TJ Mason JP Lorimer Sonochemistry Ellis Horwood Chichester 1988 p 58 [30] Bianchi CL Catal Lett 2001 76(3ndash4)155-159 [31] Lin HY Chen YW Li C Thermochim Acta 2003 40061ndash67 [32] Lin HY Chen YW Mater Chem Phys 2004 85171ndash175 [33] Sexton BA Hughes AE Turney TW J Catal 1986 97(2)390ndash406 [34] Kumar N Payzant EA Jothimurugesan K Spivey JJ Phys Chem Chem Phys 2011 1314735ndash14741 [35] Tsakoumis NE Dehghan R Johnsend RE Voronov A Van Beek W Walmsley JC Borg Oslash Rytter E Chen D Roslashnning M Holmen A Catal Today 2013 20586ndash93 [36] Tsakoumis NE Roslashnning M Borg Oslash Rytter E Holmen A Catal Today 2010 154162ndash182 [37] Alvarez A Ivanova S Centeno MA Odriozola JA Appl Catal A 2012 431-4329-17 [38] YJin AKDatye Journal of catalysis 196 (2000) 8 20 [39] DBBukur KOkabe MPRosynek CPWang DJRao KRPM and GPHuffman JCatal 155 (1995)353 [40] YYang HXiang YXu LBai YLi ApplCatalA 266 (2004) 181 [41] 32 Rudolf C Dragoi B Ungureanu A Chirieac A Royer S Nastro A Dumitriu E Catal Sci Technol DOI 1011039C3CY00611E [42] C Pirola CL Bianchi A Di Michele S Vitali V Ragaini Catal Comm 10 823 (2009) [43] Iyi N Fujii K Okamoto K Sasaki T Appl Clay Sci 2007 35218-227 [44] CL Bianchi C Pirola DC Boffito A Di Fronzo A Di Michele R Vivani M
Nocchetti M Bastianini S Gatto Co-Zn-Al based hydrotalcites as catalysts for
Fischer-Tropsch process Proceeding of DGMK Conference 2011
CatalysisInnovative Applications in Petrochemistry and Refining 4-6 October
2011 Dresden Germany ISBN 978-3-941721-17-3
[45] Leendert G Bitter JH Kuipers HPCE Oosterbeek H Holewijn JE Xu X
Kapteijn F Jos van Dillen A Krijn P J Am Chem Soc 2006 1283956-3964
[46] 31 Den Breejen JP Radstake PB Bezemer GL Bitter JH Froslashseth V Holmen A Krijn P J Am Chem Soc 2009 1317197-7203 [47] Thickett and Oldyha JThermAnalCal 80 (2005) [48] MALegodi Dde WaalDyes and Pigments 74 (2007) 161
197
Chapter 6 High Fe Loaded Supported Catalysts for Biosyngas Fischer ndash Tropsch Conversion experimental and simulation results 6 Development of the kinetic model One of the objectives of this research work was the development of a kinetic
model for the synthesis of FT in collaboration with the Politecnico di Milano
This model based on experimental data obtained in the pilot plant using iron
based catalyst (Fe30K20Cu375) at different temperatures and different H2CO
ratios allows to obtain and simulate the performance of these catalysts at
temperatures and ratios of incoming flows feeding different
The modeling work has not been limited to the laboratory scale since it is
possible to predict the trend of the reaction kinetics using these types of
catalysts in reactors with much greater volumes and integrated in an entire
industrial process such as the use of biosyngas for FT synthesis obtained from
biomass
61 Regression of kinetic constants After obtaining the experimental data it is necessary to regress them With the
regression we could obtain the respective kinetic constants
The model is based on the fact that both reactions the FT reactions and WGS
are active therefore we will need to regress the rate constants of both
reactions which we call kFT (kinetic constant of the FT reaction) and kWGS
(kinetic constant of the WGS reaction)
The equations that express the reaction rate of the two reactions are [1] For the FT reactions
Chapter 6 High Fe Loaded Supported Catalysts for Biosyngas Fischer ndash Tropsch Conversion experimental and simulation results
198
For the WGS reaction
From these equations we note that the reaction rate in both cases is a
function of the partial pressures of the reactants (CO and H2) of the products
(H2O and CO2) of the constants (aFTWGS e bFTWGS) and the equilibrium constant
Kp expressed as
From the regression of the reaction rate constants is obtained the K0i These
values are correlated to the kFTWGS through the equation
The parameter values of the previous reports were obtained with a regression
using the MATLAB software based on the method of least squares from the
experimental data using the original coefficients K0FT k0WGS aFT aWGS bFT bWGS
as values of the first iteration [2] The software allows the regression of k0i
establishing an objective function that must be minimized as much as possible
(10-6 tolerance basis of MATLAB)
There was no regression of the activation energy of the two reactions but kept
constant as reported in literature [2]
The probability of growth of the hydrocarbon chain is instead given by the
correlation developed by Lox and Froment [3-4] or iron based catalysts
Chapter 6 High Fe Loaded Supported Catalysts for Biosyngas Fischer ndash Tropsch Conversion experimental and simulation results
199
For the regression of the data there were not taken into account the energy
balances because we consider an isothermal catalytic bed The drop pressure is
neglected since it can be assumed that in the whole catalytic bed the pressure
is constant at 20 bar and the efficiency of the catalyst was considered unitary
On the contrary these aspects must be taken into account if we are working
with industrial volumes
62 Mass Balance In the kinetic model have been fully taken into account (even on lab-scale) the
mass balances shown in the equations below
Mass balance equations in the gas phase
Where ε degree of vacuum
a catalyst surface per unit volume
(Pis-Pib) pressure difference of the reactants between the bulk and the
solidrsquos surface
ν stoichiometric coefficient
r reaction in homogeneous phase
Chapter 6 High Fe Loaded Supported Catalysts for Biosyngas Fischer ndash Tropsch Conversion experimental and simulation results
200
If it does not consider gas-phase reactions but only on the surface of the
catalyst
Mass balance on the solid
Where ρ density of the catalyst
Mi molecular weight
It gets
Where is the total mass flow and is the mass fraction of i component
63 Energy Balance As previously mentioned in the modeling of laboratory scale is not considered
any heat balance in the catalytic bed because it is considered as isothermal
one however in the case of modeling a reactor in industrial volumes the
energy balance will be addressed in this way
Energy balance equation in the gas phase for a plug-flow reactor (PFR)
Chapter 6 High Fe Loaded Supported Catalysts for Biosyngas Fischer ndash Tropsch Conversion experimental and simulation results
201
Where Cpi Specific heat of the i species
h Laminar coefficient
(Ts-T) the temperature difference between the surface and the bulk
∆Homk entalphy of the K-esimo reaction in gas phase
U overall heat transfer coefficient
If there are no gas-phase reactions
Energy balance on the solid
64 Pressure variation
As for the energy balance also the P has not been taken into account in the
modeling however in the case of simulations of kinetic tests over PFR reactors
in industrial volumes it will be necessary to take them into account because
before and after the catalytic bed there will be a difference of pressure
The equation that allows to calculate the pressure drop in a fixed bed reactor is
the Ergunrsquos equation
Chapter 6 High Fe Loaded Supported Catalysts for Biosyngas Fischer ndash Tropsch Conversion experimental and simulation results
202
With
Where u velocity surface
Re Reynolds number
Dp diffusion coefficient
Ai inlet area of the tube
65 Catalyst Efficiency The efficiency of the catalyst considered unitary to simplify the model on
laboratory scale can not be considered as such in real systems and especially
of large reactors where the problems of diffusion of the reactants on the
catalyst surface are no longer negligible
The efficiency of the catalyst is expressed with the equation
Where T Bulk temperature
Ts surface temperature
Pi pressure of i species in the bulk
Pis pressure of the i species in the surface
Vp volume of the particle catalyst
Chapter 6 High Fe Loaded Supported Catalysts for Biosyngas Fischer ndash Tropsch Conversion experimental and simulation results
203
References
[1] WH Zimmerman DB Bukur Reaction kinetics over iron catalysts used for
Fischer-Tropsch synthesis The Canadian journal of chemical engineering (68)
1990 p 292-301
[2] Ahmad Rafiee Optimal design issues of a gas-to-liquid process Thesis for
the degree of Philosophy Doctor Norwegian University of Science and
Technology Faculty of Natural Sciences and Technology Chemical Engineering
Department2012
[3] ES Lox GF Froment Kinetics of the Fischer-Tropsch reaction on a
precipitated promoted iron catalyst 2 Kinetic modeling Ind Eng Chem Res
(32) 1993 p71-82
[4] ES Lox GF Froment Kinetics of the Fischer-Tropsch reaction on a
precipitated promoted iron catalyst 2 Kinetic modeling Ind Eng Chem Res
(32) 1993 p 61-70
204
Chapter 7 Fischer Tropsch runs results and discussion
In this chapter the experimental results concerning the FT runs will be
presented in term of CO conversion and of products selectivity toward CO2
CH4 light hydrocarbons (lt C7) and heavy hydrocarbons (gt C7) To join all these
data the parameter ldquoyield C2+rdquo will be reported too This parameter is defined
in the following equation
Yield C2+ = CO conversion x (selectivity ltC7 +selectivity gtC7) (1)
then the selectivity to CO2 and CH4 (undelivered products) is not taken into
account by this parameter The data concerning all the products distribution
ie selectivity for each carbon atom number have been collected in this PhDrsquos
research work for all the catalysts and all the experimental conditions but for
practical space of reasons they are not here reported
The results could be divided into two groups The experimental runs with two
kind of catalytical systems it means cobalt based catalysts and iron based
catalyst (kinetic runs) and the development of a kinetic model for the sample
Fe30K2Cu375 The selection is related to the better performance in terms of
stability
More in detail
Kinetic Runs
Cobalt based catalysts
HTlc The activated samples were tested at different temperatures in
the FTS plant following the procedure reported in the experimental
section In Fig 71 the CO conversion vs the reaction temperature is
Chapter 7 Fischer Tropsch runs results and discussion
205
reported for all the catalysts while the products selectivity is displayed in
Table 71
Fig 71 molar CO conversion to Co5 () Co10 () Co15 (diams) Co35 () obtained at
different reactor temperatures after 24 hours of reaction
As expected for each catalyst the activity is strongly influenced by the reaction
temperature the higher the temperature the higher the CO conversion but
also the selectivity towards CO2 CH4 and light hydrocarbons is favored by a
higher temperature The CO conversion is similar for Co5 and Co10 while it is
higher for the two samples with a larger amount of cobalt ie Co15 and Co35
In particular Co15 exhibits the highest CO conversion at all the selected
temperatures In FTS it is fundamental to obtain low quantities of CH4 and CO2
(undesired products) to favor the formation of higher hydrocarbons For this
reason temperatures in the 220-235degC range are more suitable than the higher
ones
Moreover Table 71 shows that Co15 exhibits the highest CO conversion and
the highest C2+ total yield (without considering CH4 and CO2 see note in Table
71) also at the lowest temperature (220degC) which is so important from an
economical point of view This result confirms that Co15 is the best performing
catalyst obtained in this part of the study
Chapter 7 Fischer Tropsch runs results and discussion
206
Table 71 FTS products selectivity at different reactor temperatures
Sample Temperature
(degC)
Products Selectivity C2+
Yield CO2 CH4 leC7 gtC7
Co5 220 03 29 33 934 165
235 03 59 104 834 194
245 11 85 127 776 224
260 19 141 160 679 300
Co10 220 32 26 98 844 155
235 38 49 143 769 178
245 33 60 154 753 218
260 81 163 413 343 262
Co15 220 14 101 17 705 467
235 81 262 473 185 498
250 178 177 443 202 491
Co35 220 14 39 103 844 250
235 18 96 234 651 395
245 51 257 656 105 473
leC7 all the hydrocarbons in the range C2-C7 gtC7 all the hydrocarbons greater than C7 Product lsquolsquoirdquo selectivity = (moles C in product i) (converted moles C) x 100 C2+ yield = CO conversion x (selectivity leC7 + selectivity gtC7) x10-2
The obtained data suggest the possibility of using synthetic hydrotalcites as Co-
based catalysts for FTS and pursuing subsequent studies on the same subject
Similar trends were obtained in ldquoUnit 2rdquo at lower temperatures and lower
amount of cobalt (Co10 and Co15) (Table 72)
Chapter 7 Fischer Tropsch runs results and discussion
207
The stability of these catalysts in the operating conditions adopted in the
catalytic tests (P le 20 MPa and T le 350degC) was evaluated by comparative
analysis between fresh samples and samples discharged from the reactor
maintained at high pressures and temperatures
Table 72 FTS products selectivities at different reactor temperatures Two different
pilot plants with the same flow sheet
Sample Temp
(degC)
CO
Conv
()
Products Selectivity C2+
Yield CO2 CH4 leC7 gtC7
Co10
(Unit 1)
220 170 32 26 98 844 155
235 207 38 49 143 769 178
245 248 33 60 154 753 218
260 358 81 163 413 343 262
Co10
(Unit 2)
220 147 01 12 53 935 145
235 180 15 32 73 880 171
245 891 140 291 393 176 506
Co35
(Unit 1)
220 264 14 39 103 844 250
235 446 18 96 234 651 395
245 621 51 257 656 105 473
Co35
(Unit 2)
220 473 50 224 296 431 343
235 768 162 205 288 345 485
245 998 154 241 322 282 604
leC7 all the hydrocarbons in the range C2-C7gtC7 all the hydrocarbons greater
than C7Product lsquolsquoirdquo selectivity = (moles C in product i) (converted moles C) x
100 C2+ yield = CO conversion x (selectivity leC7 + selectivity gtC7) x10-2
It is important to highlight that the aim of this work was the evaluation of the
possibility to use HTlc as a new kind of catalyst for the Fischer-Tropsch process
rather than a quantitative comparison with other kinds of traditional FTS
catalysts Moreover a reliable comparison between HTlc and traditional cobalt
Chapter 7 Fischer Tropsch runs results and discussion
208
based FTS catalysts is very difficult due to the different structural and
morphological features (surface area metal dispersion morphological
structure reduction properties porosity and so on) which are involved in the
very complex catalytic systems for the FTS Nevertheless from a qualitative
point of view it is possible to conclude that this new kind of catalytic materials
for FTS process give results fully comparable with those obtained by traditional
supported cobalt As general behaviour it is possible to state that cobalt
catalysts are characterized by high CO conversion high heavy hydrocarbons
selectivity and low light hydrocarbons CH4 and CO2 selectivity The wide
literature concerning traditional Co-based catalysts is rich of different examples
that depending on several operative parameters and preparation procedure
give different FTS results but always following the general trends reported by
the previous papers Some exhaustive examples are shown in a recent review
of Qinghong et al [1] and Muthu et al [2]
Co and Co-Ru
The use of ultrasound (US) might be very efficient to optimize the dispersion of
a so high metal charge as already verified in our laboratory in the past [3-4]
This special type of synthesis should give at the catalyst a particular structure
with a high surface area and a high metal dispersion that improves its activity
towards the synthesis of Fischer-Tropsch In the case of cobalt supported
catalysts a simple ultrasound step has been added in the catalyst preparation
As regard the results presented in table 73 it can be seen how all the samples
resulted active in FTS in particular the bimetallic samples give high CO
conversion with a noteworthy selectivity towards heavy hydrocarbons The
Chapter 7 Fischer Tropsch runs results and discussion
209
support plays a crucial role and in particular TiO2 based samples are the most
active
Moreover Table 73 shows that Co-RuSiO2 exhibits the highest selectivity
towards heavy hydrocarbons and the highest C2+ total yield (without
considering CH4 and CO2 see note in Table 73) This result confirms that Co-
RuSiO2 is the best performing catalyst obtained in this part of the study
Table 73 CO Conversion C2+total yield CH4 CO2 light hydrocarbon and heavy
hydrocarbon selectivity of CoCo-Ru based catalyst at T=255degC
Catalyst
CO
Conv
()
C2+
total
yield
Selectivity ()
CH4 CO2 ltC7 gt C7
CoTiO2 28 23 5 14 10 71
CoSiO2 6 5 19 6 23 52
CoAl2O3 8 6 13 7 19 61
Co-RuTiO2 98 73 18 8 14 60
Co-RuSiO2 94 82 9 4 8 79
Co-RuAl2O3 84 73 11 2 12 75
As we have seen from the BET and TPR analysis the support and the promoter
play a key role in the performance of the catalyst because they are responsible
for the modification of some key parameters such as surface area and the
metal dispersion
Iron based Catalysts
With regard to the treatment with the help of US (see table 74) it can be
concluded that the sonication of an aqueous mixture salts and precursors of
support (US1) is preferable instead of to the calcined catalyst suspended in
Chapter 7 Fischer Tropsch runs results and discussion
210
non-polar solvent such as hexane (US2) With regard to treatment with MW
(see table 74) there were obtained better results in term of CO conversion
with the powder catalyst treated directly in the MW (MW1) while the test
conducted by suspending the catalysts in hexane and then treated in a MW
reactor (MW2) for an hour did not give valid results The best FTS results in
term of C2+ yield (41) has been obtained using MW1 while in tem of CO
conversion (58) using US1 All of them gave FTS results better than the
traditional one Itrsquos evident that the use of US or MW optimizes the catalytic
performance in accord with previous similar results [4]
In agreement with [5] the FTS results show that TEOS as silica source is
favorable for the enhancement of the FTS activity
Table 74 Catalytic Results of Fe30K20Cu375 Different preparation techniques Support
SiO2 Diluting Material α-Al2O3 T=220degC
Preparation CO Conv ()
C2+
Total yield
Selectivity ()
CO2
CH4
lt C7
gt C7
TR 49 32 27 7 22 44
MW1 52 41 17 5 18 60
MW2 32 24 17 8 27 48
US1 58 38 29 6 22 43
US2 36 25 22 9 30 39
Co-precipitation
38 32 2 13 28 57
leC7 all the hydrocarbons in the range C2-C7 gtC7 all the hydrocarbons greater than C7 Product lsquolsquoirdquo selectivity = (moles C in product i) (converted moles C) x 100 C2+ yield = CO conversion x (selectivity leC7 + selectivity gtC7) x10-2
The co-precipitation test was made at T=250degC and TEOS as a support
Iron based Catalysts
Chapter 7 Fischer Tropsch runs results and discussion
211
To work with this part it is important to know the effect of the H2 CO ratio in
the feeding gas The FTS for the production of liquid hydrocarbons from
synthesis gas has become important as the planet faces exhaustion of its
petroleum reserves in the near future The use of coal or biomass to
manufacture synthesis gas is attractive in view of its vast reserves However
synthesis gas manufactured from coal or biomass typically has a low H2CO
ratio (about 07) while the stoichiometry of the reaction requires an H2CO
ratio of about 20 Iron catalysts can make up this deficit with their high WGS
activity [6]
This important characteristic of iron based catalysts is essential for their
applications
Fig 72 show that the activity of catalyst is good enough using also feeding
ratio between 10 and 20
Fig 72 CO conversion or selectivity vs H2CO feeding ratio for Fe30K20Cu375
catalyst at T=250degC
Higher the H2 CO ratio is higher the CO conversion becomes but the heavy
hydrocarbons is the highest for the stoichiometric ratio
In the present work there were made some tests with Fe30K20Cu375 catalyst by
feeding mixtures with a ratio H2CO between 05 and 20 in order to optimize
Chapter 7 Fischer Tropsch runs results and discussion
212
the activity selectivity and the lifetime of this kind of FT catalyst in work
conditions of biosyngas feeding
On the basis of the collected data a rigorous simulation of the FT synthesis
reactor has been developed for different purposes (i) to support the
experimentations and their planning (ii) to predict the reactor yield and
conversion (iii) to optimize the performance of the reactor system with
different operating conditions and (iv) to calculate novel reliable kinetic
parameters based on the experimental data fitting by means of model-based
nonlinear regression techniques To do so the FT reactor is modeled as a
catalytic plug-flow reactor using mass and energy balances and reaction
kinetics for Fe-based catalyst defined by Zimmerman and Bukur as explained in
chapter 6 [7] leading to an ordinary differential equation system with
structured Jacobian Lumping techniques have been used to model heavy
hydrocarbons The system is solved by means of dedicated solvers to handle
stiffness and nonlinearities of heterogeneous reactive systems [8]
Typical H2CO ratio of syngas manufactured from coal or biomass are between
07-12 and the Fig 72 show that the activity of catalyst is good enough using
also feeding ratio between 10 and 20
In the table 75 there is the data concerning the carbon monoxide conversion
() and the selectivity towards undesired products (CO2 and CH4) and lighter
and heavy hydrocarbons of Fe-based catalyst The CO conversion increase with
the increase of the H2CO ratio because of the proximity of the stoichiometric
required of the reaction The selectivities are constant with the variations of
H2CO ratio Instead of that the C2+ yield increase with the variations of H2CO
ratio A comparison at T=250degC show that the best performance in terms of CO
conversion C2+ and selectivity towards heavy hydrocarbons is given by working
with a H2CO ratio of 2 (stoichiometric required of the reaction)
Chapter 7 Fischer Tropsch runs results and discussion
213
These data were used to propose a suitable kinetic model for the FTS using a
math program in collaboration with the Politecnico di Milano Some hypothesis
were taken into account to prepare the kinetic model (FT reactor is modeled as
a catalytic plug-flow reactor using mass and energy balances and reaction
kinetics for Fe-based catalyst defined by Zimmerman and Bukur [7-8] ∆P = 0
isothermic catalytic bed FT reaction and WGS are both active on the catalyst)
The kinetic parameters were calculated and compared with the experimental
data The first results show a good fitness of the experimental data
Table 75 FTS products selectivities at different H2CO ratio and reactor
temperatures of Fe30K2Cu375
Selectivity ()
H2CO T(degC) CO
Conversion ()
C2+ total yield
CO2 CH4 ltC7 gtC7
21 220 85 69 11 8 22 59
21 235 211 175 11 6 20 63
21 250 498 393 16 5 19 60
21 260 567 425 19 6 20 55
151 250 388 299 18 5 17 60
151 260 463 338 22 5 17 56
11 250 23 182 17 4 16 63
11 260 389 272 26 4 16 54
leC7 all the hydrocarbons in the range C2-C7 gtC7 all the hydrocarbons greater than C7 Product lsquolsquoirdquo selectivity = (moles C in product i) (converted moles C) x 100 C2+ yield = CO conversion x (selectivity leC7 + selectivity gtC7) x10-2
In Fig 73 is presented a comparison between the experimental data obtained
in the laboratory and the data obtained using the kinetic model The first two
Chapter 7 Fischer Tropsch runs results and discussion
214
columns represent the conversion of hydrogen and carbon monoxide while in
the other columns are represented the molar fraction of hydrogen carbon
monoxide water methane and lump C2 C3-4 C5-10 C11 + As a first
approximation it can be seen that the kinetic model present a good fitness
regard to the experimental data
Fig 73 Comparison between experimental data and kinetic model
References
[1] Qinghong Z Weiping D Ye W Review Recent advances in understanding the key catalyst factors for Fischer-Tropsch synthesis J Ener Chem 2013 2227ndash38
Chapter 7 Fischer Tropsch runs results and discussion
215
[2] Muthu KG Gary J Wilson DS Burtron HD FischerndashTropsch synthesis Activity of metallic phases of cobalt supported on silica Catal Today 2013 21513ndash 17 [3] CLBianchi VRagaini Catalysis Letters 95 (2004) 61-65 [4] C Pirola C L Bianchi A Di Michele P Diodati D C Boffito V Ragaini Ultrasonic Sonochem 17 (2010) 610 [5] Suo Haiyun Zhang Chenghua Wu Baoshan Xu Jian Yang Yong Xiang Hongwei Li Yongwang A comparative study of FeSiO2 FischerndashTropsch synthesis catalysts using tetraethoxysilane and acidic silica sol as silica sources Catalysis Today Volume 183 Issue 1 20 March 2012 Pages 88ndash95 [6] MDShroff AKDatye Catalysis Letters 37 (1996) 101
[7] WH Zimmerman DB Bukur Can J Chem Eng 68 (1990) 292-301 [8] F Manenti I Dones G Buzzi-Ferraris HA Preisig Ind Eng Chem Res 48 (2009) 9979-9984
216
Chapter 8 Final remarks and Conclusions
New kind of cobalt and iron based catalysts were synthetized and used in the
Fischer-Tropsch synthesis Different methods of synthesis different amounts of
cobalt and different process temperatures were investigated All the catalysts
under study were active in the FTS The catalytic activity of the samples strictly
depends on the temperature as expected
Cobalt based hydrotalcites cobalt and cobalt-ruthenium synthesized with the
help of ultrasound and iron supported catalysts with a high loading of iron (30
wt) have been prepared and characterized and both the preparation
procedure and the working conditions were fully optimized
For each catalytic system it can be summarized the following aspects
Cobalt based catalysts
HTLC In the case of Co-based hydrotalcites CO conversion and process
selectivity towards light and heavy hydrocarbons are closely related to the
cobalt amount in the catalysts but not in a linear way
The reduction behavior under a H2 flow of the Co-based hydrotalcites is
achieved in one step at lower temperature and it is not related to its
morphology but is strictly correlated to the particle size In addition the
relatively large dimensions and high cristallinity of these catalysts favor the
creation of optimal domains of active sites that make them more efficient
The obtained data suggest the possibility of using synthetic hydrotalcite as Co-
based catalysts for FTS and open the possibility for subsequent studies on the
same subject
Chapter 8 Final remarks and Conclusions
217
Future studies may involve the investigation of the effects of various
parameters such as morphologysize of crystallites or the addition of small
amounts of promoters such as Ru in the composition of Co based hydrotalcites
Temperatures in the 220-235degC range are more suitable than the higher ones
Cobalt based bimetallic The catalysts show a low selectivity to methane and
carbon dioxide and formation of higher hydrocarbons The more interesting
results are the highest CO conversion at lower temperatures measured with a
catalysts promoted with a Ru Even the support although it is inert it is very
important because it radically alters the surface area of the catalyst
Iron catalysts The samples appears to be highly dependent on the method of
preparation used The catalysts treated with US and MW seem to show
significant improvements over traditional catalysts and the reason is a more
homogeneous and uniform distribution of Fe in the media
The catalyst Fe30K2Cu375 is active with a H2CO ratio le2
Develop of a kinetic model On the basis of the collected data a rigorous
simulation of the FT synthesis reactor has been developed to support the
experimentations and their planning to predict the reactor yield and
conversion to optimize the performance of the reactor system with different
operating conditions and to calculate novel reliable kinetic parameters based
on the experimental data fitting by means of model-based nonlinear regression
techniques For this lumping techniques have been used to model heavy
hydrocarbons the system is solved by means of dedicated solvers to handle
stiffness and nonlinearities of heterogeneous reactive systems and finally the
Chapter 8 Final remarks and Conclusions
218
model made in collaboration with the Politecnico di Milano show a good fit of
the experimental data
Concerning the results obtained in this PhDrsquos research work it is clear that all
the samples tested have given good results The Co-based catalysts
synthesized using the traditional impregnation method with an additional step
of ultrasound have given good results in comparison with the results in the
current literature The hydrotalcites have given lower results if compared with
the Co-based catalysts synthesized with the help of ultrasound but they have
opened an alternative and innovative way that has never been tried before
Iron based catalysts allow a direct conversion of the biosyngas and the results
have shown how our catalysts are active with an H2CO ratio le2 Furthermore
trends have been modeled with success In conclusion the PhDrsquos research
work has given a serious contribution to the current state of the art on
catalysis in the Fischer-Tropsch synthesis either with cobalt and iron based
catalysts With cobalt has been optimized a traditional synthesis procedure
with the introduction of ultrasound furthermore has been created a
completely new kind of catalyst With iron has continued an optimizationrsquos
work of iron supported with high loading metals so to develop a suitable
kinetic model able to work not only with syngas but also with biosyngas
List of Publications and Communications
219
List of publications
Publications
C Pirola DC Boffito G Carvoli A Di Fronzo V Ragaini and CL
Bianchi (2011) Soybean Oil De-Acidification as a First Step Towards
Biodiesel Production Recent Trends for Enhancing the Diversity and
Quality of Soybean Products Prof Dora Krezhova (Ed) ISBN 978-953-
307-533-4 InTech DOI 10577217812 Available from
httpwwwintechopencombooksrecent-trends-for-enhancing-the-
diversity-and-quality-of-soybean-productssoybean-oil-de-acidification-
as-a-first-step-towards-biodiesel-production
CL Bianchi C Pirola DC Boffito A Di Fronzo G Carvoli D Barnab
R Bucchi and A Rispoli (2011) Non Edible Oils Raw Materials for
Sustainable Biodiesel Biodiesel - Feedstocks and Processing
Technologies Dr Margarita Stoytcheva (Ed) ISBN 978-953-307-713-0
InTech DOI 10577225397 Available from
httpwwwintechopencombooksbiodiesel-feedstocks-and-
processing-technologiesnon-edible-oils-raw-materials-for-sustainable-
biodiesel
A Di Fronzo C Pirola A Comazzi F Galli CL Bianchi A Di Michele R
Vivani M Nocchetti M Bastianini DC Boffito Co-based Hydrotalcites
as new Catalysts for the Fischer-Tropsch Synthesis Process Fuel 119
(2014) 62ndash69
Publications in Conference Proceedings (peer reviewed)
CL Bianchi C Pirola DC Boffito A Di Fronzo A Di Michele R Vivani
M Nocchetti M Bastianini S Gatto Co-Zn-Al based hydrotalcites as
catalysts for Fischer-Tropsch process Proceeding of DGMK Conference
2011 Catalysis Innovative Applications in Petrochemistry and Refining
4-6 October 2011 Dresden Germany ISBN 978-3-941721-17-3
C Pirola A Di Fronzo DC Boffito CL Bianchi A Di Michele
Biosyngas Fischer ndash Tropsch Conversion by High Fe Loaded Supported
List of Publications and Communications
220
Catalysts Prepared with ultrasound and Microwave Proceeding of
DGMK Conference 2012 Reducing Carbon Footprint of Fuels and
Petrochemicals October 8 ndash 10 2012 Berlin Germany ISBN 978-3-
941721-26-5
Communications at congress A Di Fronzo C Pirola DC Boffito CL Bianchi A Di Michele R Vivani
M Nocchetti M Bastianini Synthetic Hydrotalcites as suitable Co-
based catalysts for Fischer-Tropsch Process XVIII Congresso Nazionale
della Divisione di Chimica Industriale della SCI LE SFIDE DELLA CHIMICA
INDUSTRIALE PER UNrsquoINNOVAZIONE SOSTENIBILE 11-14 giugno 2012
(Oral presentation)
A Di Fronzo DC Boffito CPirola G Carvoli S Vitali CL Bianchi
Scalable free fatty acids esterification for methyl esters production
XVIII Congresso Nazionale della Divisione di Chimica Industriale della
SCI LE SFIDE DELLA CHIMICA INDUSTRIALE PER UNrsquoINNOVAZIONE
SOSTENIBILE 11-14 giugno 2012 (Poster presentation)
ADi Fronzo C Pirola DC Boffito CL Bianchi A Di Michele R Vivani
M Nocchetti M Bastianini Synthetic Hydrotalcites as suitable Co-
based catalysts for Fischer-Tropsch Process Cat4bio conference
Advances in catalysys for biomass valorization Tesaloacutenica Grecia 2012
(Poster)
CL Bianchi A Di Fronzo C Pirola DC Boffito A Di Michele R Vivani
M Nocchetti M Bastianini Synthetic Hydrotalcites as suitable Co-
based catalysts for Fischer-Tropsch Process 7th edition of the
International Conference on Environmental Catalysis Lion-Francia
(Poster)
A Di Fronzo C Pirola CL Bianchi A Di Michele Ultrasonidos y
microondas en la preparaciograven de catalizadores soportados para la
sigraventesis de Fischer-Tropsch JIFI-EAI 2012 Jornadas de Investigaciograven
Ecuentro acadegravemico industrial Universidad Central de Venezuela
Facultad de Ingenierigravea 26-30 noviembre
C Pirola CL Bianchi A Di Fronzo D Boffito A Di Michele G S
Patience Ultrasound and microwave assisted preparation of high Fe
List of Publications and Communications
221
loaded supported catalysts for biosyngas Fischer-Tropsch conversion
Intervento presentato al 245 convegno ACS National Meeting amp
Exposition tenutosi a New Orleans Louisiana nel 2013
C Pirola C L Bianchi A Di Fronzo F Manenti M Hillestad High Fe
Loaded Supported Catalysts for Biosyngas Fischer ndash Tropsch Conversion
experimental results and detailed simulation XVII National Congress of
Catalysis GIC 2013 and XI National Congress of Zeolites Science and
Technology 15-18092013
F Galli C Pirola A Di Fronzo A Comazzi CLBianchi Di Michele Co
Based Bimetallic Catalysts for Fischer-Tropsch Synthesis Prepared by
High Power Ultrasound XVII National Congress of Catalysis GIC 2013
and XI National Congress of Zeolites Science and Technology 15-
18092013
Di Michele C Pirola A Di Fronzo A Comazzi F Galli and CLBianchi
Co Based Bimetallic Catalysts for Fischer-Tropsch Synthesis Prepared by
High Power Ultrasound AOSS Melbourne 10-12072013
C Pirola A Di Fronzo A Comazzi F Galli A Di Michele CLBianchi Co
based bimetallic catalysts for Fischer-Tropsch synthesis prepared by
high power ultrasound 11th European Congress on Catalysis ndash
EuropaCat-XI Lyon France September 1st-6th 2013
Workshop Clausthal Germany 22-23112013 Fischer-Tropsch Synthesis
from syngas and biomass using Fe or Co based catalysts Experimental
and simulation results (Oral Presentation)