Biomass fuel:Biomass fuel - North Dakota State University · Comparative pricesComparative prices...
47
Biomass fuel: Biomass fuel: Which comes first - Which comes first the market or the supply? Sandra Broekema
Transcript of Biomass fuel:Biomass fuel - North Dakota State University · Comparative pricesComparative prices...

Biomass fuel:Biomass fuel: Which comes first -Which comes first
the market or the supply?pp ySandra Broekema
Feasibility study teamFeasibility study team
• Sponsoring partners • Contractors• Sponsoring partners– Great Plains Institute– Natural Resources Trust
• Contractors– UND Energy &
Environmental Natural Resources Trust– NDRECA– ND Farmers Union
Research Center– NDSU
NDSU E t i– ND Dept of Agriculture– ND Game & Fish Dept
– NDSU Extension
Grant funding provided byNDIC Renewable Energy CouncilNDIC Renewable Energy Council

North Dakota locationNorth Dakota location
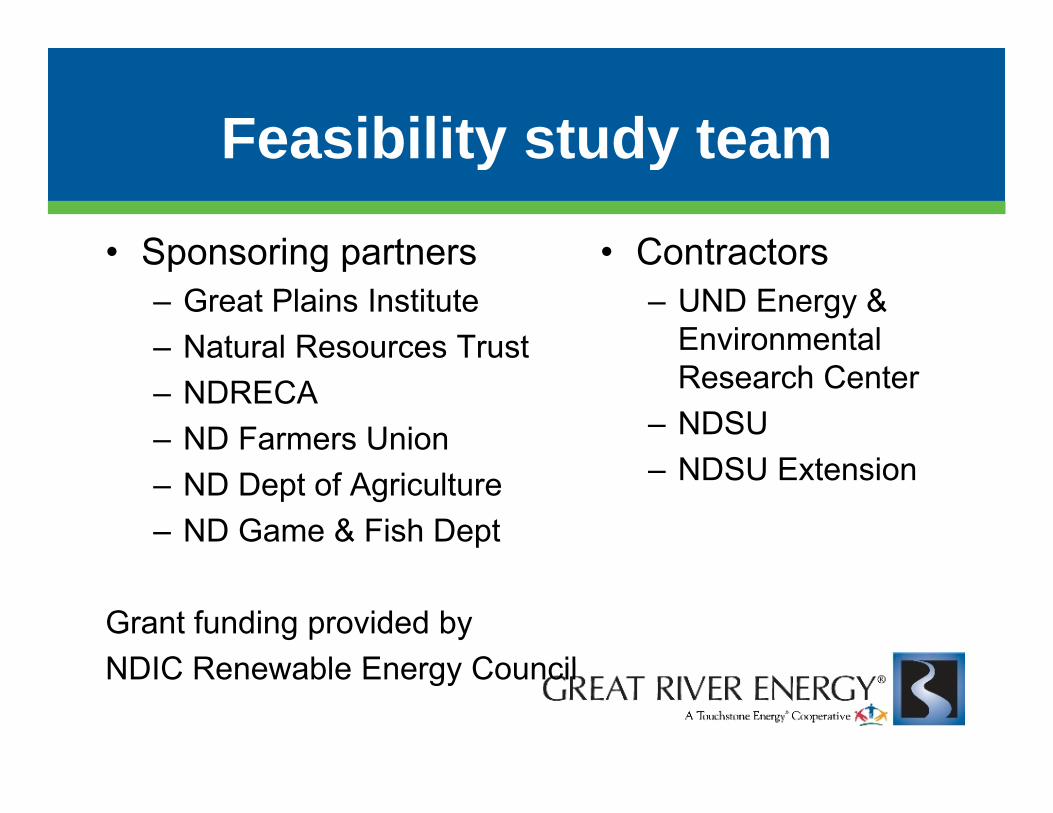
SiteSite
BNSF
Future C ill M l
BNSF
Future
Development
Site
Cargill Malt
JSDC Industrial Park
94

Spiritwood StationSpiritwood Station
January ‘09

Current StatusCurrent Status
• 62 MW Baseload + 37 MW Peaking CHP• 62 MW Baseload + 37 MW Peaking CHP • Construction started Oct 2007 with COD 2010• Fueled with DryFineTM a refined ND lignite y g• JSDC is planning 100 acre multi-tenant
industrial parkGRE i ti l ki dditi l t• GRE is actively seeking additional steam partner(s)
• Studying feasibility of co-firing up to 10 percent y g y g p pbiomass
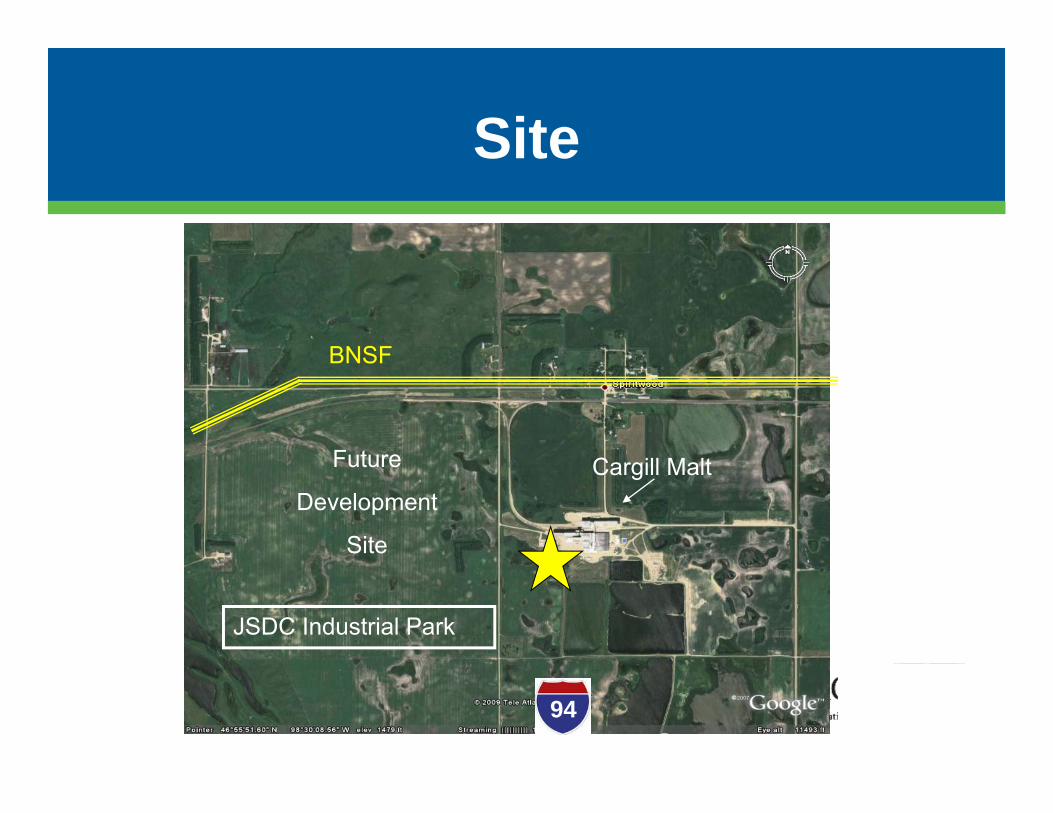
Why biomass co-firing?Why biomass co firing?
L i f t t f COLooming future cost of CO2
Closed Loop Biomass – CO2p 2released during combustion is absorbed from the atmosphere over the next growing season resulting in carbon neutral energycarbon neutral energy.
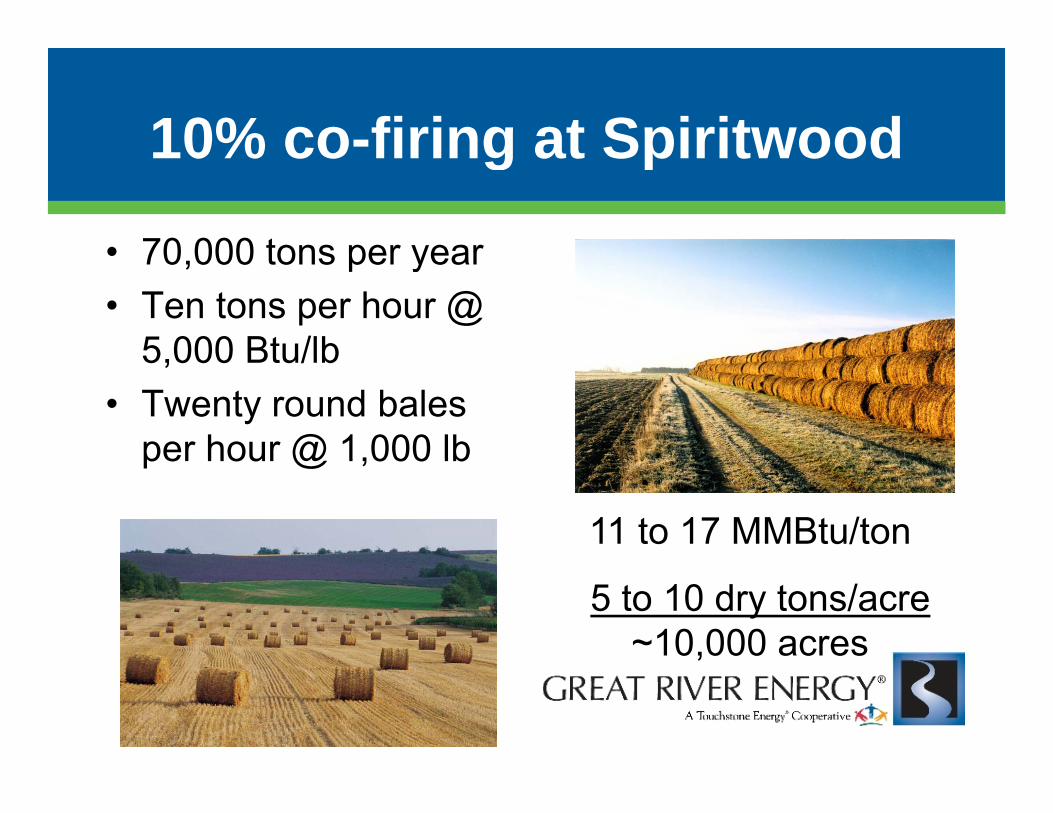
10% co-firing at Spiritwood10% co firing at Spiritwood
• 70 000 tons per year• 70,000 tons per year • Ten tons per hour @
5 000 Btu/lb5,000 Btu/lb• Twenty round bales
per hour @ 1,000 lbper hour @ 1,000 lb
11 to 17 MMBtu/ton
5 to 10 dry tons/acre~10,000 acres

Feasibility Study of a Biomass Supply for theBiomass Supply for the
Spiritwood Industrial Park

TasksTasks
1) Biomass inventory EERC1) Biomass inventory EERC2) Top 5 fuel suitability matrix EERC3) Densification options EERC3) Densification options EERC4) Business model(s) NDSU5) P t f iti d NDSU5) Prospects for recruiting producers NDSU6) Producer Economic Model NDSU

Tasks 1,2 & 3: Biomass inventory, fuel suitability matrix andfuel suitability matrix and
densification options
ENERGY & ENVIRONMENTAL RESEARCH CENTERKerryanne LerouxySheila HansonKyle MartinJoshua StregeW l P kWesley Peck
EERC
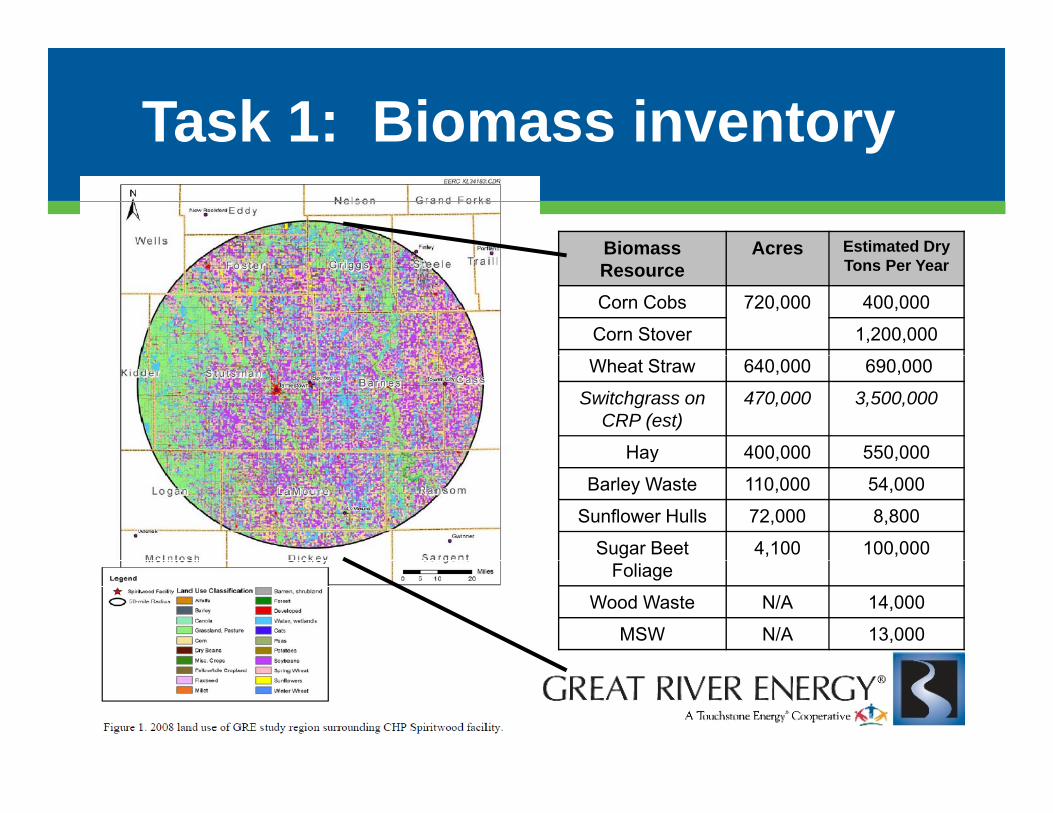
Task 1: Biomass inventory
Biomass Acres Estimated Dry
y
Biomass Resource
Acres yTons Per Year
Corn Cobs 720,000 400,000
Corn Stover 1,200,000
Wheat Straw 640,000 690,000
Switchgrass on CRP (est)
470,000 3,500,000
Hay 400,000 550,000Hay 400,000 550,000
Barley Waste 110,000 54,000
Sunflower Hulls 72,000 8,800
Sugar Beet 4,100 100,000Foliage
Wood Waste N/A 14,000
MSW N/A 13,000
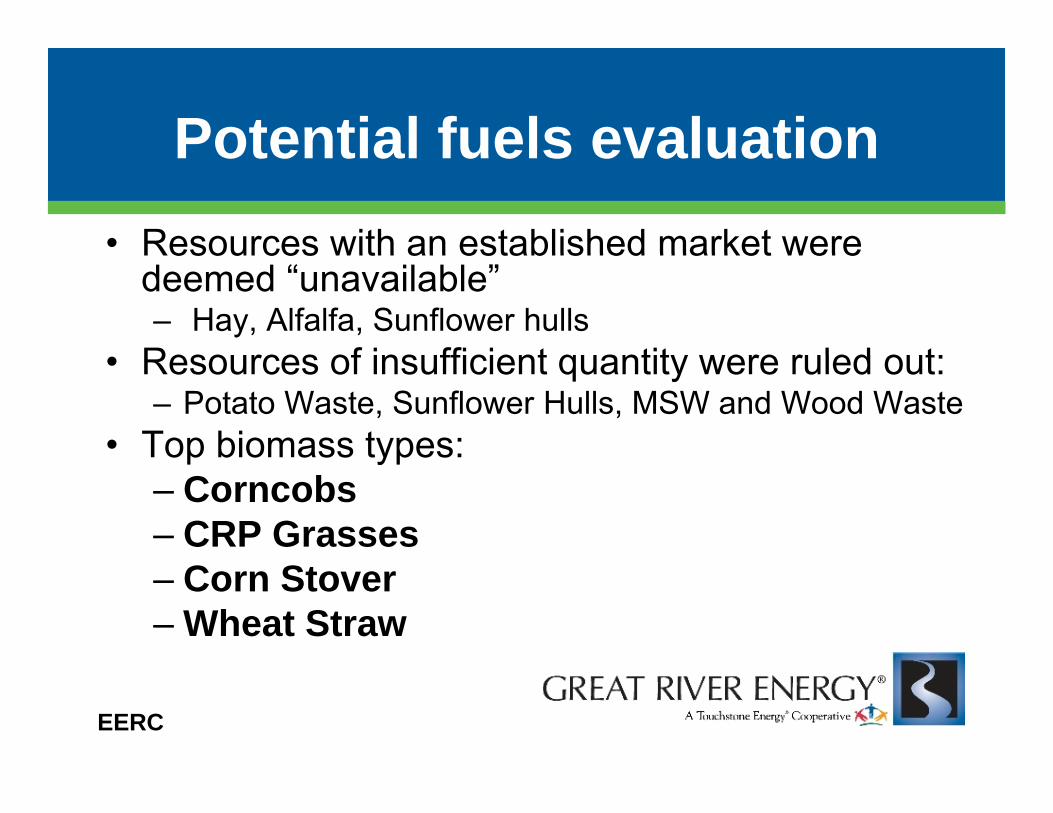
Potential fuels evaluationPotential fuels evaluation• Resources with an established market wereResources with an established market were
deemed “unavailable”– Hay, Alfalfa, Sunflower hulls
Resources of insufficient quantity were ruled out:• Resources of insufficient quantity were ruled out: – Potato Waste, Sunflower Hulls, MSW and Wood Waste
• Top biomass types: p yp– Corncobs– CRP Grasses – Corn Stover– Wheat Straw
EERC
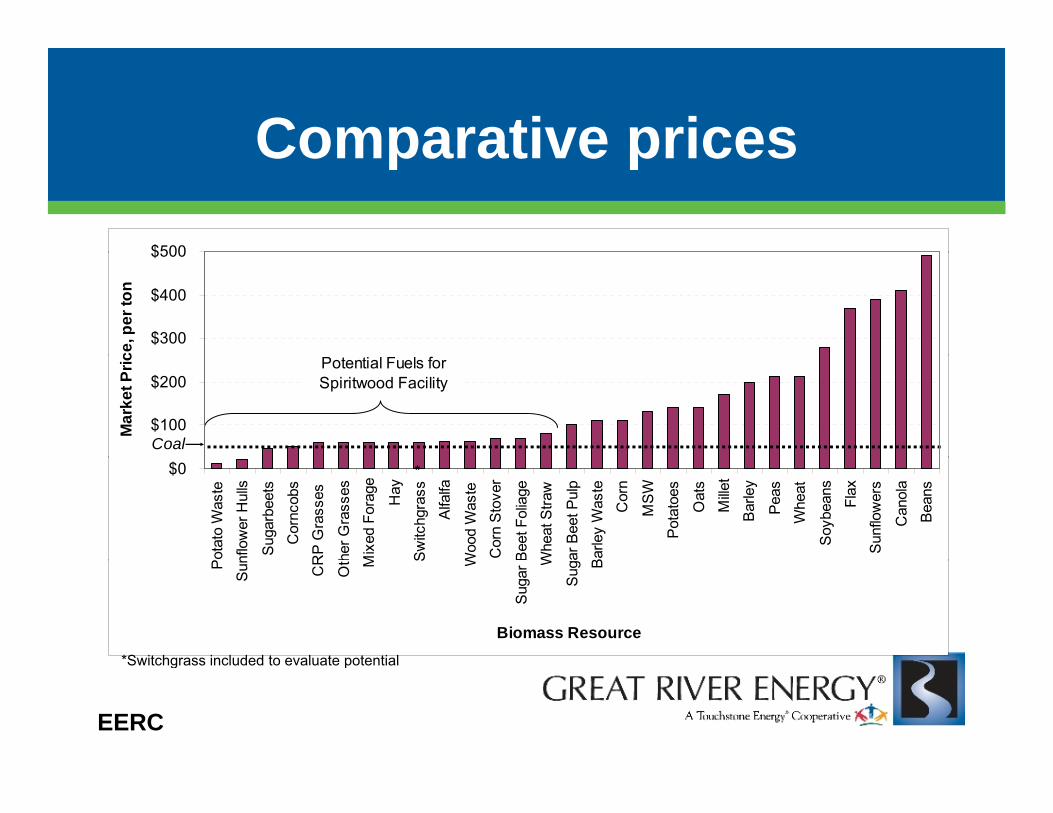
Comparative pricesComparative prices$500
$300
$400
$500
ce, p
er to
n
$100
$200
Mar
ket P
ric
Coal
Potential Fuels for Spiritwood Facility
$0
Pot
ato
Was
te
nflo
wer
Hul
ls
Sug
arbe
ets
Cor
ncob
s
RP
Gra
sses
her G
rass
es
Mix
ed F
orag
e
Hay
Sw
itchg
rass
Alfa
lfa
Woo
d W
aste
Cor
n S
tove
r
Bee
t Fol
iage
Whe
at S
traw
ar B
eet P
ulp
Bar
ley
Was
te
Cor
n
MS
W
Pot
atoe
s
Oat
s
Mille
t
Bar
ley
Pea
s
Whe
at
Soy
bean
s
Flax
Sun
flow
ers
Can
ola
Bea
ns
*
P
Sun CR
Ot M S W
Sug
ar W
Sug B
Biomass Resource*Switchgrass included to evaluate potentialSwitchgrass included to evaluate potential
EERC

Key issues for biomass co-firingKey issues for biomass co firing
• High variability in feedstockg y– Variability by season, soil, rainfall, and speciation– Data not readily available on many emerging grasses – Alkali & moisture vary by more than 100% between samples.
• Potential corrosion and emission issues– Sulfur and chlorine
• High alkali content can cause slaggingg gg g– Sodium and potassium – Mitigated by low co-firing or low total ash content
• High silica content can cause erosion & agglomerationsg gg– Potassium reacts with silica or aluminum– Silica content can be managed by timing and location of harvest
EERC

“Top 5” fuel suitabilityTop 5 fuel suitabilityCorn Switch- Corn Wheat ND LigniteFuel Properties* Corn Cobs Grasses Switch
grassCorn
StoverWheat Straw
ND Lignite Coal
Proximate, % dryMoisture 15 4.7 6.2 10 8.8 26Volatile Matter 80 75 77 76 79 41Volatile Matter 80 75 77 76 79 41Fixed Carbon 19 15 17 15 14 46Ash 1.4 11 5.4 8.5 7.3 13Heating Value (Btu/lb)
Gross 8100 7500 7900 7400 7600 9100Net 6900 7100 7500 6600 7000 6800
Ash Oxides (wt%)Silica-Agglomeration 40 47 69 51 69 41Alkalinity-Slagging 3.2 28 10 16 15 7.4Corrosion/Emissions 8.7 10 2.2 3.6 4.2 19*Average values for resources given; data for sugar beet foliage not available, average of grasses and residues used when necessary
EERC

Task 2. Total Delivered CostsTask 2. Total Delivered Costs
• Determine steps and costs needed for each• Determine steps and costs needed for each biomass type from field to utilization, such as– Commodity payments to producersCommodity payments to producers– Harvest and in-field handling– Drying, baling, loading– Unloading, processing– Storage– Transportation
• Compare steps and costs for each type of biomass
EERC
AssumptionsAssumptions
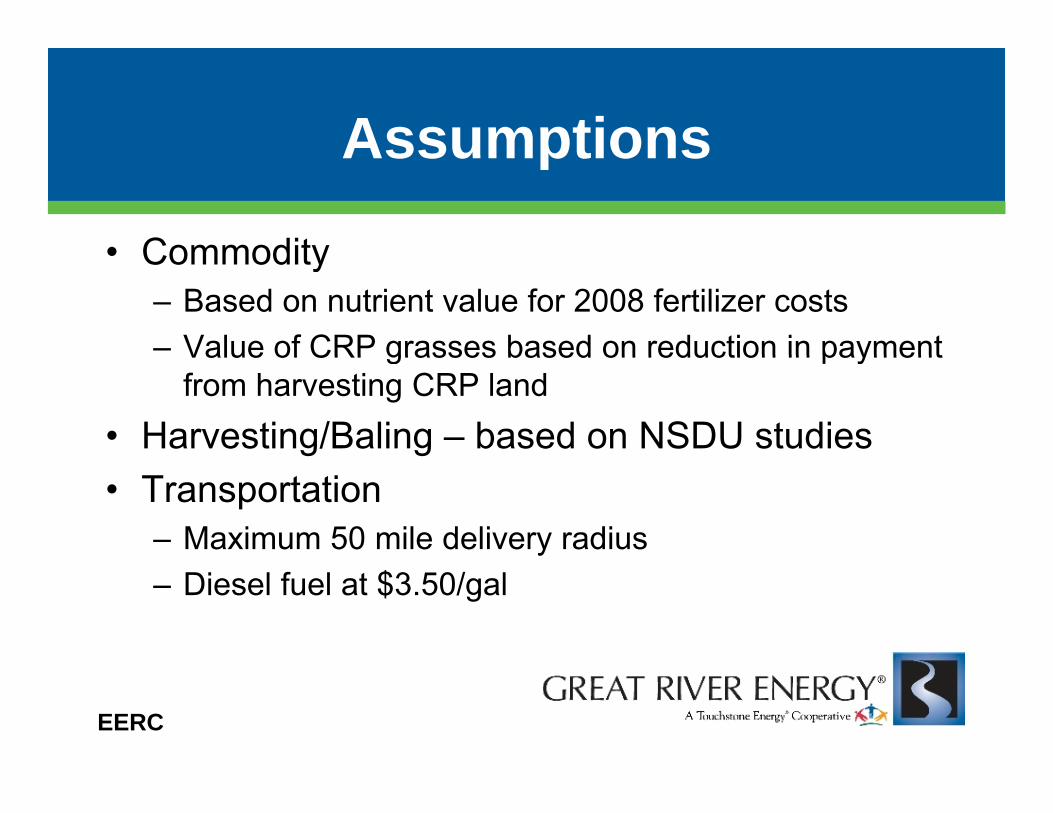
• Commodity• Commodity – Based on nutrient value for 2008 fertilizer costs – Value of CRP grasses based on reduction in paymentValue of CRP grasses based on reduction in payment
from harvesting CRP land• Harvesting/Baling – based on NSDU studies• Transportation
– Maximum 50 mile delivery radius– Diesel fuel at $3.50/gal
EERC

Task 3. Densification optionsTask 3. Densification options
• Perform a cost benefit analysis• Perform a cost-benefit analysis – Determine densification opportunities and
requirements for “Top 5”requirements for Top 5– Identify densification strategies
• Grinding• Grinding• Pelletizing• GasificationGasification
– Determine capital and operating costs– Identify benefits and drawbacksIdentify benefits and drawbacks
EERC

GrindingGrinding
• Electrical stationary • Benefits• Electrical, stationary recommended
• Capital $250 000-
• Benefits– Reduces operating
costs and shut-down Capital $250,000$400,000
• Operating $2-5/ton
to break bridging– Reduces maintenance
costs on feed systemOperating $2 5/ton [40 kWh/ton]
costs on feed system– Form value $50/ton
EERC
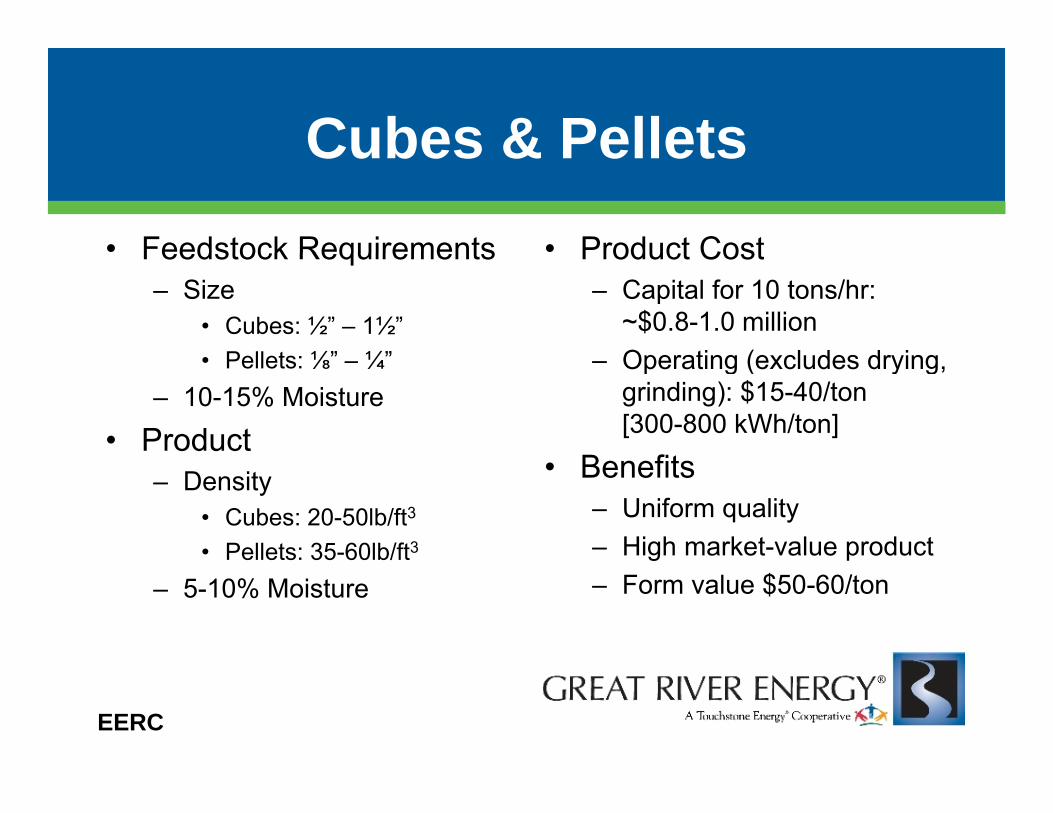
Cubes & PelletsCubes & Pellets• Feedstock Requirements • Product CostFeedstock Requirements
– Size• Cubes: ½” – 1½”
P ll t ⅛” ¼”
Product Cost– Capital for 10 tons/hr:
~$0.8-1.0 millionOperating (excludes drying• Pellets: ⅛” – ¼”
– 10-15% Moisture
• Product
– Operating (excludes drying, grinding): $15-40/ton [300-800 kWh/ton]
B fit– Density• Cubes: 20-50lb/ft3
• Pellets: 35-60lb/ft3
• Benefits– Uniform quality– High market-value product
– 5-10% Moistureg p
– Form value $50-60/ton
EERC
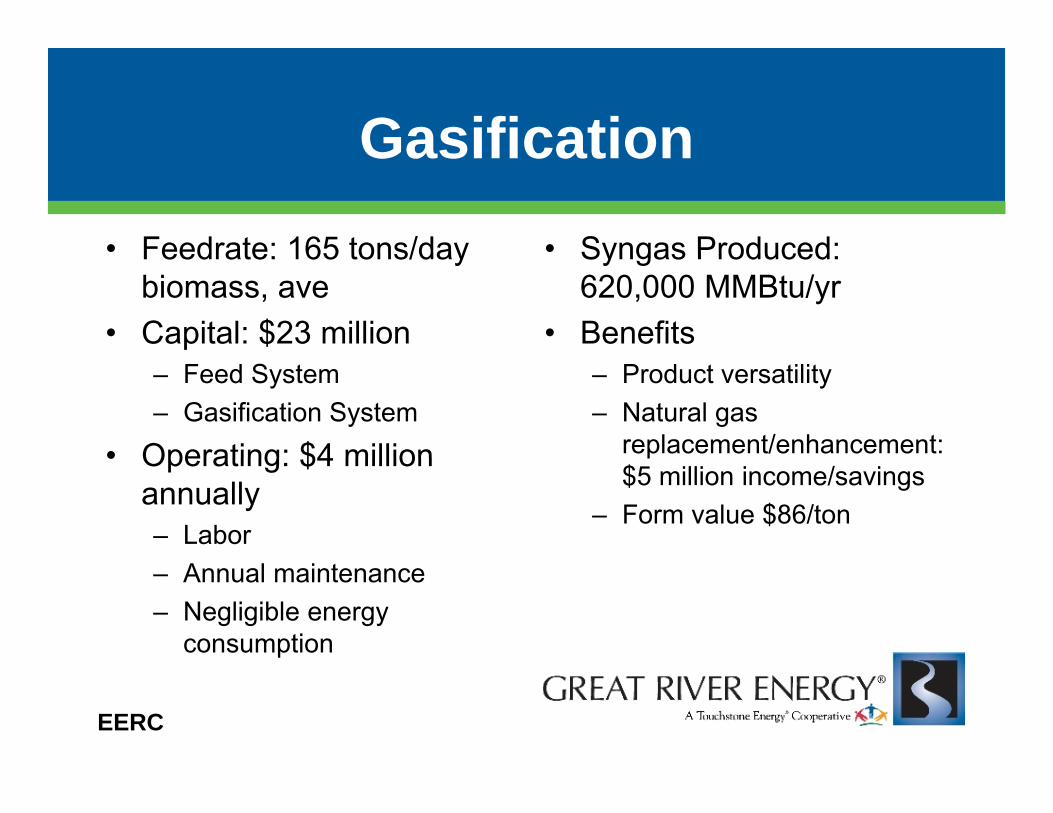
GasificationGasification• Feedrate: 165 tons/day • Syngas Produced:Feedrate: 165 tons/day
biomass, ave• Capital: $23 million
Syngas Produced: 620,000 MMBtu/yr
• Benefits– Feed System– Gasification System
• Operating: $4 million
– Product versatility– Natural gas
replacement/enhancement: • Operating: $4 million annually– Labor
p$5 million income/savings
– Form value $86/ton
– Annual maintenance– Negligible energy
consumption
EERC

Cost-Benefit comparisonCost Benefit comparison
(per ton, avg) Grinding Cubes/Pellets Gasification Base Price $40 $40 $40
[plus] + + +[p us]Density Cost $4 $29 $74
[equals] = = = Feedstock Cost $44 $69 $114Feedstock Cost $44 $69 $114
[minus] – – – Feedstock Value $50 $55 $86
[equals] = = =[equals] = = =Benefit $6 ($14) ($28)
EERC

SummarySummaryPrice/ tons/ Price/
Rank Biomass tonc Moisture Btu/lb yrd MMBtu Resourcee Alkalinity1 Grassesa $49 5% 7300 57,000 $3.40 740,000 192 Sugar Beet Foliageb $42 7% 7000 60,000 $3.00 100,000 173 Corn Stover $50 10% 6600 64 000 $3 80 1 200 000 163 Corn Stover $50 10% 6600 64,000 $3.80 1,200,000 164 Wheat Straw $50 9% 7000 60,000 $3.60 690,000 155 Corncobs $49 15% 6900 61,000 $3.60 400,000 3
Coal Comparison $50 26% 6800 62,000 $3.70 – 7a CRP grasses switchgrassCRP grasses, switchgrass.b Characterization data averaged from values above.c Includes grinding costs.d Estimation required to meet 10% cofire rate.e Estimated annual tonnage available.g
EERC

Tasks 4 & 5: Business Models andTasks 4 & 5: Business Models and Prospects for recruiting existing f l d d CRP i t bifarmland and CRP into biomass
productionNORTH DAKOTA STATE UNIVERSITYF. Larry Leistritz
p
F. Larry LeistritzDean BangsundNancy HodurDon SenechalDon Senechal
NDSU
March 2009
NDSU

Parties in supply chain
RoleRoleRoleRole• Producer • Contract to supply
biomassS h d l /• Supply entity • Schedule/arrange for harvest and transportation delivery of biomassdelivery of biomass
• Contract withsupply entity for• End User supply entity for required volume and specifications of biomass
NDSU

Process Schematic
NDSUNDSU
Business models
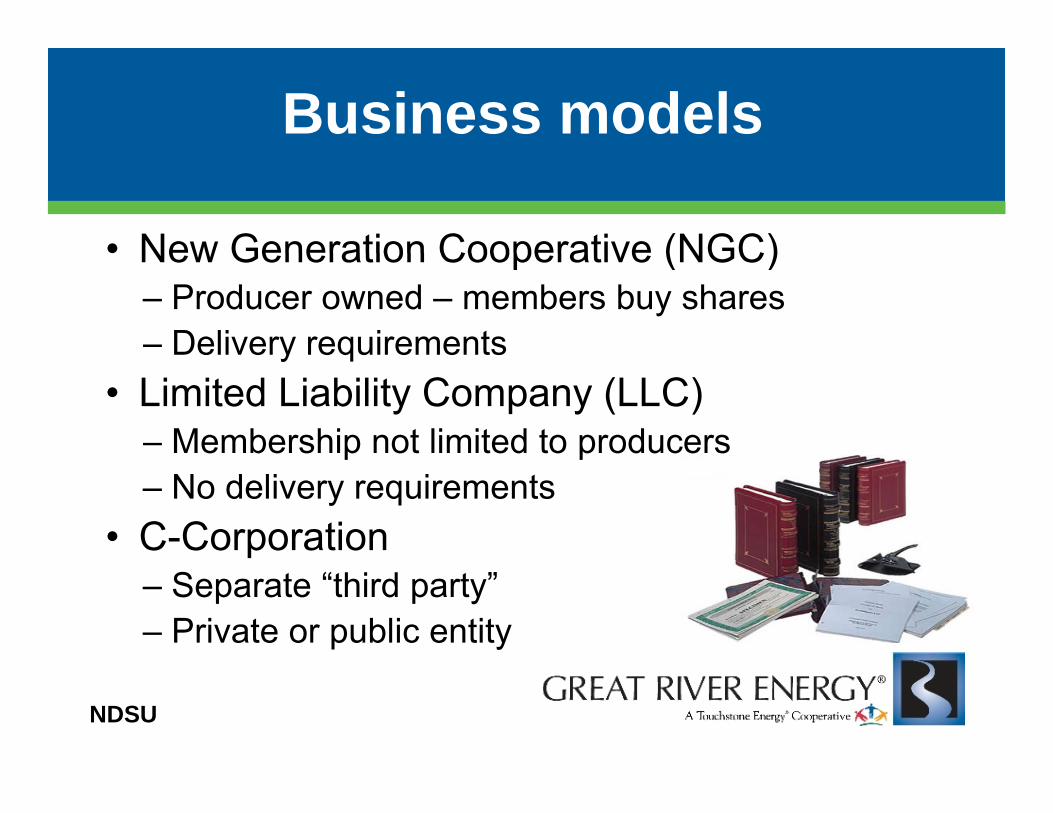
• New Generation Cooperative (NGC)• New Generation Cooperative (NGC)– Producer owned – members buy shares– Delivery requirementsy q
• Limited Liability Company (LLC)– Membership not limited to producersp p– No delivery requirements
• C-Corporation– Separate “third party” – Private or public entity
NDSU

Contract considerations
• Purchasers prefer long termPurchasers prefer long term contracts based on energy content (MMBtu)
• Producers prefer annual contractsProducers prefer annual contracts based on tonnage delivered
• Producers of dedicated energy crops prefer multi year contractscrops prefer multi-year contracts based on acreage, perhaps adjustments to reflect yield variability and lack of alternativevariability and lack of alternative market for biomass.
NDSU
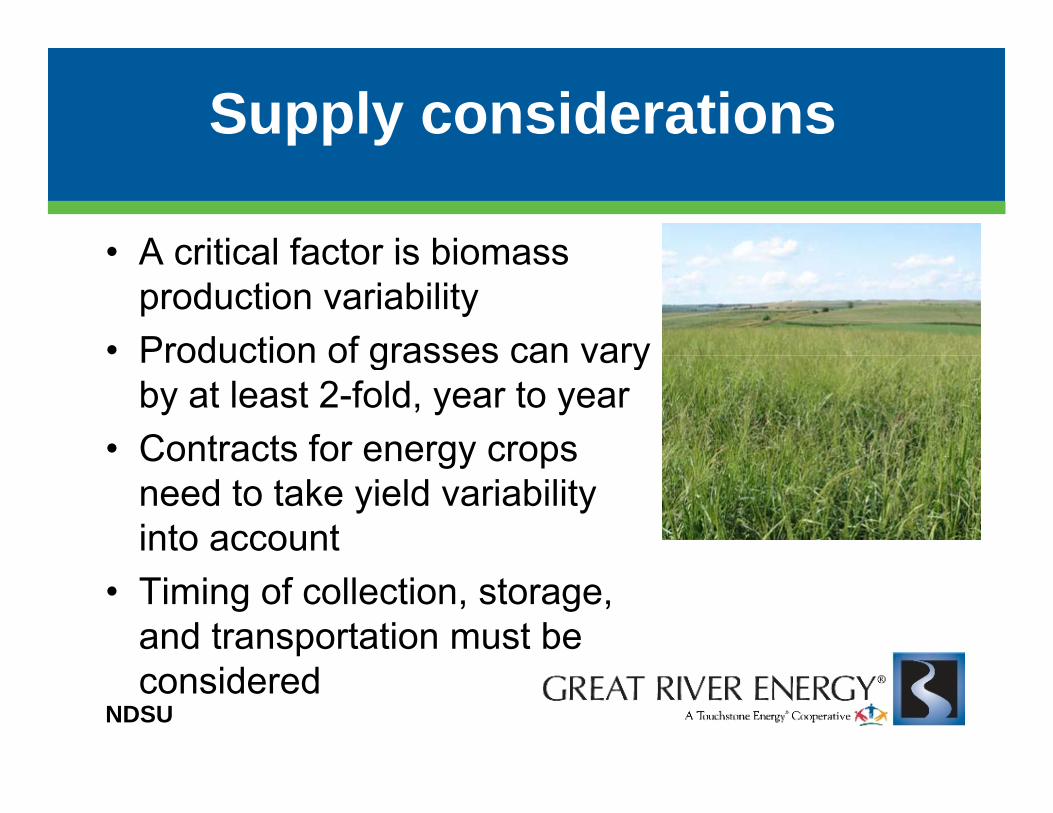
Supply considerations
• A critical factor is biomass• A critical factor is biomass production variability
• Production of grasses can varyProduction of grasses can vary by at least 2-fold, year to year
• Contracts for energy cropsContracts for energy crops need to take yield variability into account
• Timing of collection, storage, and transportation must be considered
NDSU

Supply entity role
• Contract with producers for biomass
pp y y
p– Ag residues – annual contracts– Energy crops – multi-year contracts
• Arrange/schedule harvestArrange/schedule harvest– Some producers may do their own baling, while others will prefercustom balingcustom baling
• Arrange/schedule gathering & transportation/delivery to user
Some producers may haul– Some producers may haul their own, while others may use custom haulers
NDSU

Biomass incentives
• Biomass Crop Assistance Program (BCAP)Biomass Crop Assistance Program (BCAP)– Provision of 2008 Farm Bill– Farmers in designated project
areas can receive payments up toareas can receive payments up to 75% of establishment costs for energy crops
– Farmers may also be eligible for– Farmers may also be eligible for annual payments to compensate for opportunity costs
– Persons collecting and selling biomass crops or agricultural wastes are eligible for payments that match the amountwastes are eligible for payments that match the amount received from the user, up to $45 per dry ton
– Two year term
NDSU
Biomass incentives
• ND Renewable Energy Council• ND Renewable Energy Council– $1.2 million earmarked t t d t tito support demonstration program to deliver biomass
NDSU
Focus Group Meetings
• Conducted March 2 & 3 2009• Conducted March 2 & 3, 2009• Meetings held in
– Carrington– Jamestown– Streeter
• 21 producers attendedp
NDSUNDSU
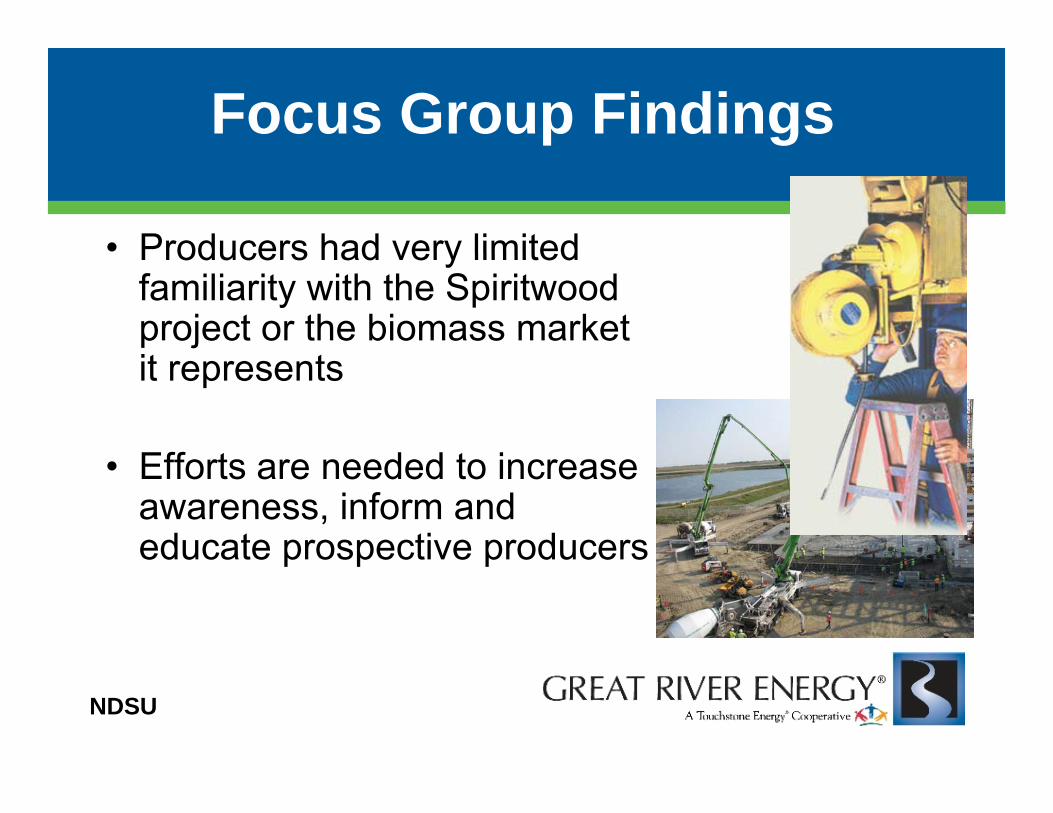
Focus Group Findings
• Producers had very limitedProducers had very limited familiarity with the Spiritwood project or the biomass market it tit represents
Eff t d d t i• Efforts are needed to increase awareness, inform and educate prospective producersp p p
NDSU

Focus Group Findings
• Producers are aware of the nutrient and
p g
Producers are aware of the nutrient and organic matter value of crop residues– especially in areas withl d i illess productive soils
• Livestock producers were• Livestock producers were concerned that the new market for biomass wouldmarket for biomass would put upward pressure on feed & bedding pricesfeed & bedding prices
NDSU
Focus Group Findings
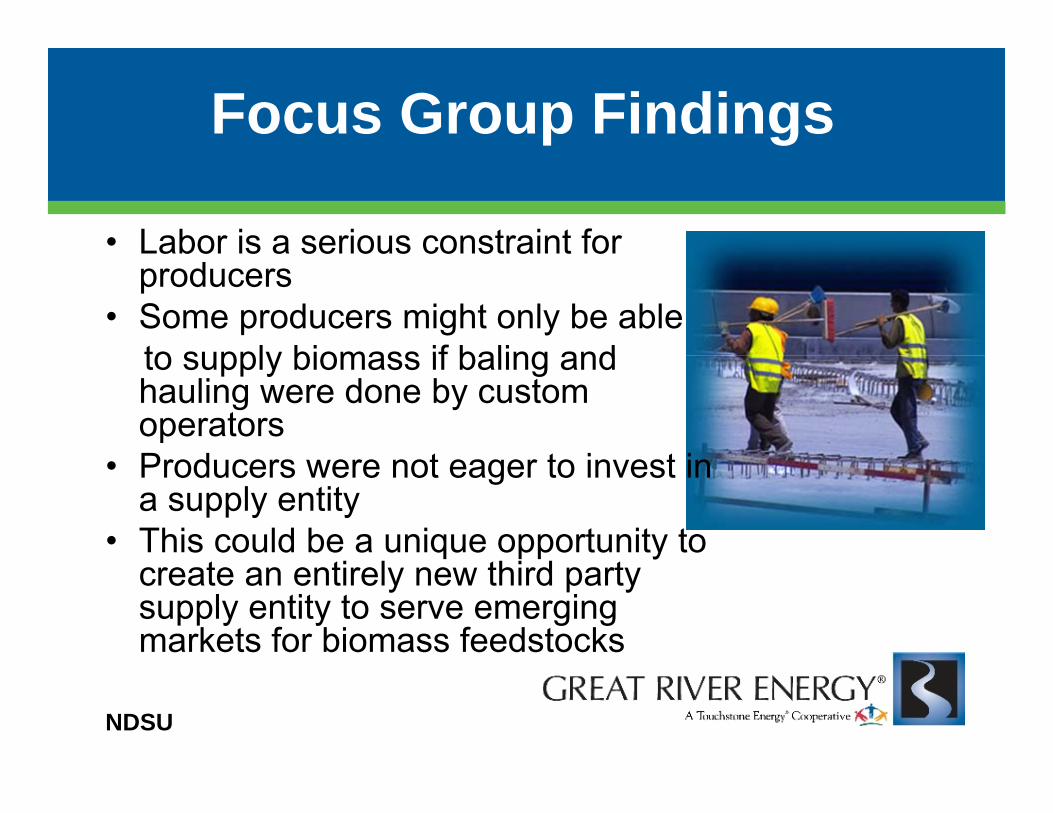
• Labor is a serious constraint forLabor is a serious constraint for producers
• Some producers might only be able to supply biomass if baling andto supply biomass if baling and hauling were done by custom operatorsP d t t i t i• Producers were not eager to invest in a supply entity
• This could be a unique opportunity to create an entirely new third party supply entity to serve emerging markets for biomass feedstocks
NDSU
Focus Group Findings
• Producers would likely require long term
p g
• Producers would likely require long-term contracts with attractive terms to participate in a supply entitypp y y
External financial assistance inExternal financial assistance in formation of a supply entity would be desirable, perhaps necessary to induce producer investment
NDSU
Focus Group Findings
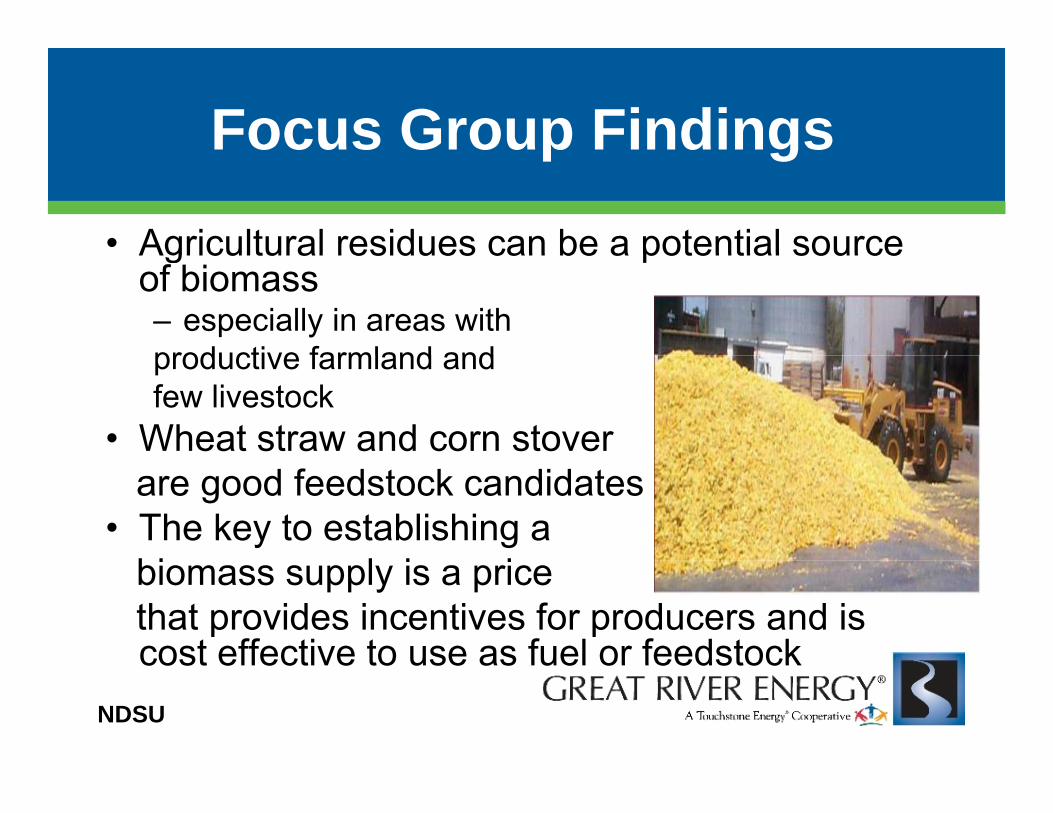
• Agricultural residues can be a potential source
p g
Agricultural residues can be a potential source of biomass– especially in areas with productive farmland andproductive farmland andfew livestock
• Wheat straw and corn stover are good feedstock candidates
• The key to establishing abi l i ibiomass supply is a price that provides incentives for producers and is cost effective to use as fuel or feedstockcost effective to use as fuel or feedstock
NDSU

Focus Group Findings
• Dedicated energy crops
p g
• Dedicated energy crops could appeal to producers as an alternative for marginal gcropland (highly erodible, saline, etc.)
• Producers were concerned whether the biomass market
ld b t i bl f thwould be sustainable for the long term, if it is based solely on policy mandateson policy mandates
NDSU
Prospects for land conversion
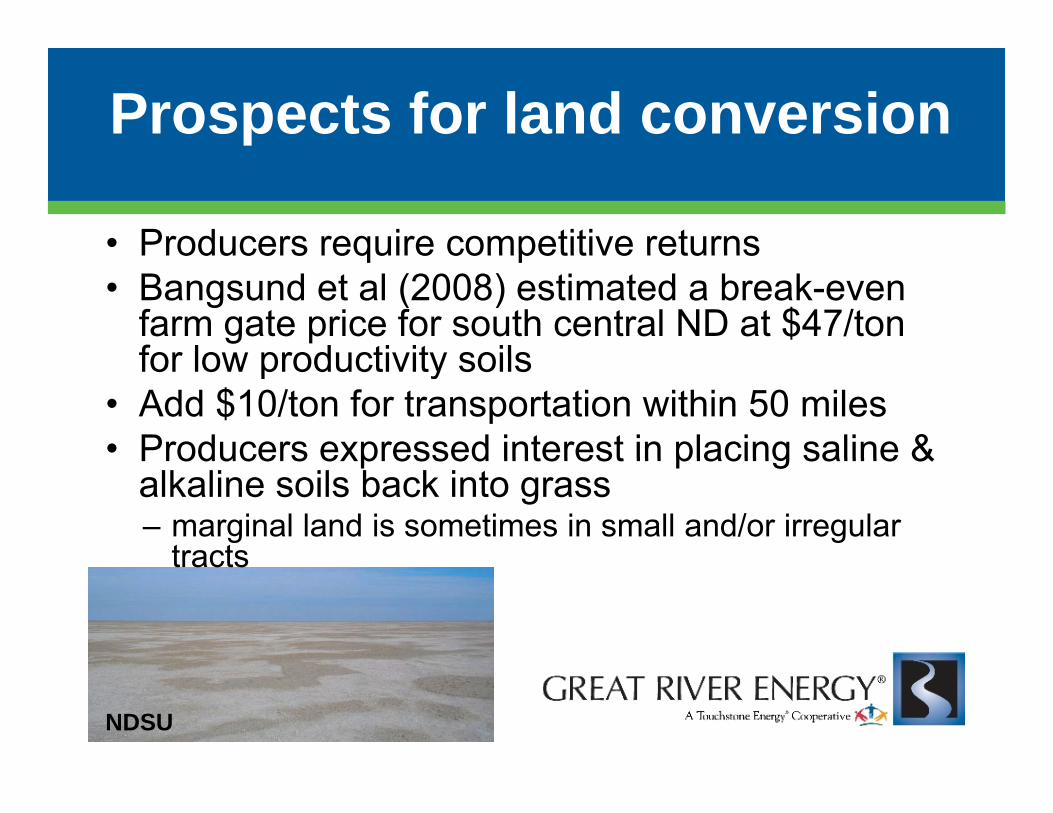
• Producers require competitive returnsProducers require competitive returns • Bangsund et al (2008) estimated a break-even
farm gate price for south central ND at $47/ton for low productivity soilsfor low productivity soils
• Add $10/ton for transportation within 50 miles• Producers expressed interest in placing saline &Producers expressed interest in placing saline &
alkaline soils back into grass– marginal land is sometimes in small and/or irregular
tractstracts
NDSU

Task 6: Producer Economic ModelNORTH DAKOTA STATE UNIVERSITY
Task 6: Producer Economic Model
Cole GustafsonRon HaugenDwight AakreA d S
Prices which provide the same Return over Variable Costs between crops Example from East Central N.D.
Select reference crop S. WhtEnter the S. Wht futures price $6.50Enter expected local basis (cash-futures) usually negative -$0.50Expected S. Wht local cash price $6.00 ----------Bio Mass----------
S. Wht Barley Corn Soybean Drybeans Oil Snflr Conf Snflr Canola Field Pea W.Wht Flax Switchgrass Corn StoverYield 39 58 101 31 1360 1420 1260 1000 34 44 18 4 4Relative Price $6.00 $3.69 $3.46 $6.89 $0.19 $0.16 $0.20 $0.26 $6.03 $5.59 $10.00 $50.93 $50.16Income $234.00 $213.82 $349.25 $213.50 $255.33 $234.30 $256.27 $258.02 $205.02 $246.07 $180.08 $203.73 $200.63
Variable costs:Andrew SwensonDoug Tiffany
Variable costs: Seed $14.10 $11.40 $62.65 $46.56 $42.00 $23.54 $37.05 $39.50 $33.00 $8.75 $9.80 $9.80 $9.80 Herbicide 17.00 14.00 17.00 17.00 33.30 22.00 22.00 18.00 20.40 17.00 17.00 8.00 17.00 Fungicide 5.50 1.50 0.00 0.00 0.00 0.00 0.00 0.00 0.00 9.00 0.00 0.00 0.00 Insecticide 0.00 0.00 0.00 8.00 0.00 6.00 12.00 0.00 0.00 0.00 0.00 0.00 0.00 Fertilizer 67.45 61.33 96.34 11.44 30.09 44.71 37.54 69.93 14.53 78.52 28.06 30.00 28.06 Crop Insurance 13.40 6.70 23.00 10.80 19.70 10.70 14.70 13.00 14.50 13.40 9.90 0.00 9.90 Fuel & Lube 11.78 13.48 17.51 10.67 13.86 13.12 12.88 11.96 12.56 10.61 11.73 17.00 11.73 Repairs 13.35 14.53 18.05 13.66 16.14 14.21 14.06 13.57 14.64 12.55 13.61 10.00 13.61 Drying 0.00 0.00 20.20 0.00 0.00 2.84 2.52 0.00 0.00 0.00 0.00 0.00 0.00 Hauling* 0.00 0.00 0.00 0.00 0.00 0.00 0.00 0.00 0.00 0.00 0.00 20.00 20.00 Misc 1.50 1.50 1.50 6.00 9.75 7.25 13.00 1.50 6.25 6.00 1.50 8.50 1.50 Operating Int. 3.96 3.42 7.05 3.41 4.53 3.97 4.56 4.61 3.19 4.29 2.52 2.84 3.07Establishment na na na na na na na na na na na 11.63 0.00Total Var.Costs $148.04 $127.86 $263.30 $127.54 $169.37 $148.34 $170.31 $172.07 $119.07 $160.12 $94.12 $117.77 $114.67
Return Over $85 96 $85 96 $85 96 $85 96 $85 96 $85 96 $85 96 $85 96 $85 96 $85 96 $85 96 $85 96 $85 96
NDSU Ext
Return Over $85.96 $85.96 $85.96 $85.96 $85.96 $85.96 $85.96 $85.96 $85.96 $85.96 $85.96 $85.96 $85.96Variable Costs
Note: - Only variable costs are considered in this comparison. You can include an amount under "misc." to account for any differences between crops in fixed costs, labor, management and risk.
NDSU - Ext

Producer economic model inputsProducer economic model inputs
• Alternative crops • Custom inputs• Alternative crops– Spring wheat– Barley
• Custom inputs– Yield– SeedBarley
– Corn – Soybean
Seed – Fertilizer, herbicide,
fungicide, insecticide
– Sunflowers– Canola
– Crop insurance– Fuel & repairs
D i & h li– Flax– Etc.
– Drying & hauling expense
NDSU Ext

Biomass Compare 2009Biomass Compare 2009Prices which provide the same Return over Variable Costs between crops Example from East Central N.D.
Select reference crop S WhtSelect reference crop S. WhtEnter the S. Wht futures price $6.50Enter expected local basis (cash-futures) usually negative -$0.50Expected S. Wht local cash price $6.00 ----------Bio Mass----------
S. Wht Barley Corn Soybean Drybeans Oil Snflr Conf Snflr Canola Field Pea W.Wht Flax Switchgrass Corn StoverYield 39 58 101 31 1360 1420 1260 1000 34 44 18 4 4Relative Price $6.00 $3.69 $3.46 $6.89 $0.19 $0.16 $0.20 $0.26 $6.03 $5.59 $10.00 $50.93 $50.16Income $234 00 $213 82 $349 25 $213 50 $255 33 $234 30 $256 27 $258 02 $205 02 $246 07 $180 08 $203 73 $200 63Income $234.00 $213.82 $349.25 $213.50 $255.33 $234.30 $256.27 $258.02 $205.02 $246.07 $180.08 $203.73 $200.63
Variable costs: Seed $14.10 $11.40 $62.65 $46.56 $42.00 $23.54 $37.05 $39.50 $33.00 $8.75 $9.80 $9.80 $9.80 Herbicide 17.00 14.00 17.00 17.00 33.30 22.00 22.00 18.00 20.40 17.00 17.00 8.00 17.00 Fungicide 5.50 1.50 0.00 0.00 0.00 0.00 0.00 0.00 0.00 9.00 0.00 0.00 0.00 Insecticide 0.00 0.00 0.00 8.00 0.00 6.00 12.00 0.00 0.00 0.00 0.00 0.00 0.00 Fertilizer 67.45 61.33 96.34 11.44 30.09 44.71 37.54 69.93 14.53 78.52 28.06 30.00 28.06 Crop Insurance 13.40 6.70 23.00 10.80 19.70 10.70 14.70 13.00 14.50 13.40 9.90 0.00 9.90 Fuel & Lube 11.78 13.48 17.51 10.67 13.86 13.12 12.88 11.96 12.56 10.61 11.73 17.00 11.73 Repairs 13.35 14.53 18.05 13.66 16.14 14.21 14.06 13.57 14.64 12.55 13.61 10.00 13.61 Drying 0.00 0.00 20.20 0.00 0.00 2.84 2.52 0.00 0.00 0.00 0.00 0.00 0.00 Hauling* 0.00 0.00 0.00 0.00 0.00 0.00 0.00 0.00 0.00 0.00 0.00 20.00 20.00 Misc 1.50 1.50 1.50 6.00 9.75 7.25 13.00 1.50 6.25 6.00 1.50 8.50 1.50 Operating Int. 3.96 3.42 7.05 3.41 4.53 3.97 4.56 4.61 3.19 4.29 2.52 2.84 3.07Establishment na na na na na na na na na na na 11.63 0.00Total Var.Costs $148.04 $127.86 $263.30 $127.54 $169.37 $148.34 $170.31 $172.07 $119.07 $160.12 $94.12 $117.77 $114.67
Return Over $85.96 $85.96 $85.96 $85.96 $85.96 $85.96 $85.96 $85.96 $85.96 $85.96 $85.96 $85.96 $85.96Variable Costs
Note: - Only variable costs are considered in this comparison. You can include an amount under "misc." to account for any differences between crops in fixed costs, labor, management and risk.
NDSU Ext
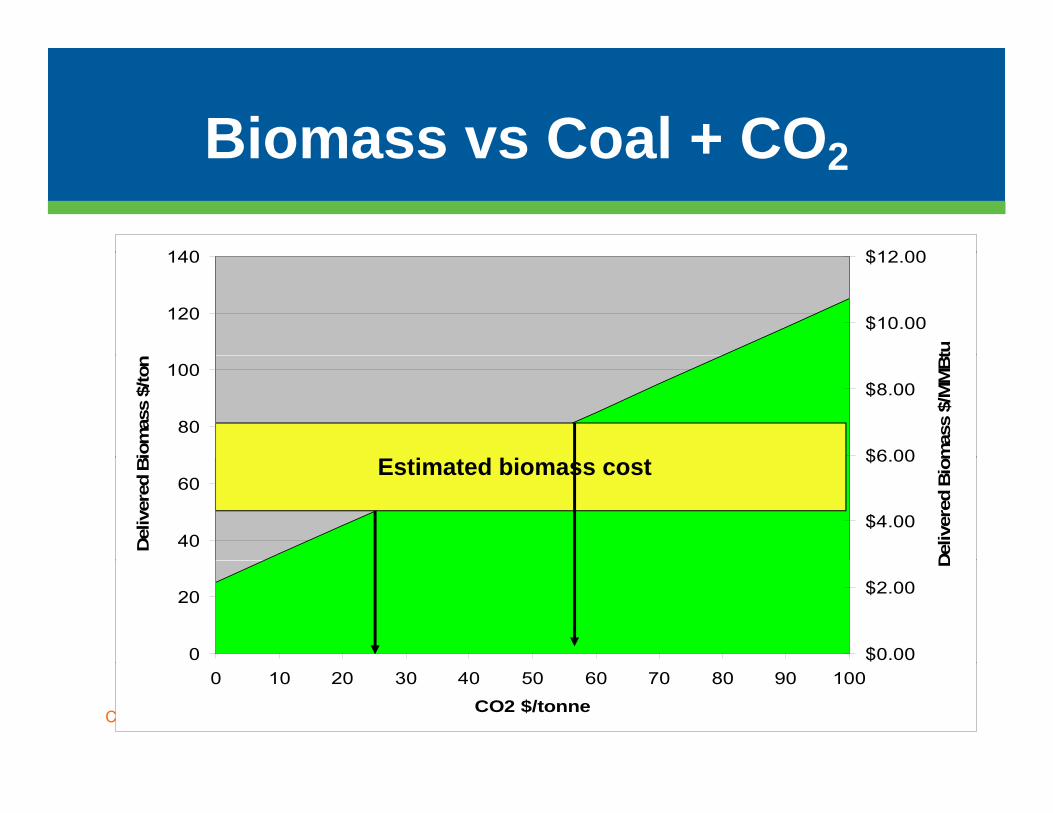
Biomass vs Coal + CO2Biomass vs Coal + CO2
140 $12 00
120
140
$10.00
$12.00
tu
80
100
Bio
mas
s $/
ton
$6 00
$8.00
mas
s $/
MM
Bt
E i d bi
40
60
Del
iver
ed B
$4.00
$6.00
Del
iver
ed B
iomEstimated biomass cost
Confidential0
20
$0.00
$2.00
D
CONFIDENTIAL
0 10 20 30 40 50 60 70 80 90 100
CO2 $/tonne
ConclusionsConclusions
• Biomass can play an important role in helpingBiomass can play an important role in helping utilities offset future CO2 emissions and costs.
• For long term sustainability, g ybiomass must be a cost effective fuel or feedstock and producers must earn a fair return on their investment.
• An emerging biomass feedstock market will create new business opportunities throughout the supply chainthe supply chain.

Thank you!Complete study is posted at :
http://www.greatriverenergy.com/projects/plants/biomass_feasibility_rpt.pdf
For more information, please contact:
Sandra Broekema, Great River EnergyLola Schoenrich, Great Plains Institute
Kerryanne Leroux, EERCF. Larry Leistritz, NDSUC l G t f NDSUCole Gustafson, NDSU