BIOMARKERS OF TEA AND COFFEE-DERIVED POLYPHENOL EXPOSURE ...
91
BIOMARKERS OF TEA AND COFFEE-DERIVED POLYPHENOL EXPOSURE IN HUMAN SUBJECTS SHIN YEE CHAN Bachelor of Science (HONS) Department of Medicine University of Western Australia Perth, Western Australia This thesis is presented for the Degree of Mater of Medical Science from the School of Medicine and Pharmacology, University of Western Australia, 2004.
Transcript of BIOMARKERS OF TEA AND COFFEE-DERIVED POLYPHENOL EXPOSURE ...

BIOMARKERS OF TEA AND COFFEE-DERIVED POLYPHENOL EXPOSURE IN HUMAN SUBJECTS
SHIN YEE CHAN
Bachelor of Science (HONS)
Department of Medicine
University of Western Australia
Perth, Western Australia
This thesis is presented for the Degree of Mater of Medical Science from the School of Medicine and Pharmacology, University of Western Australia, 2004.

ABSTRACT
Tea and coffee are rich in polyphenols with a variety of biological activities.
Polyphenols found in tea are predominantly flavonoids, of which up to 15% are
present as free or esterified gallic acid. Coffee polyphenols are almost wholly
comprised of chlorogenic acids. Many of the demonstrated activities of polyphenols
are consistent with favourable effects on the risk of chronic diseases.
In investigating the relationships between intake and exposure to such
compounds and chronic disease-related endpoints, it is important to be able to identify
biomarkers that are specific to the compounds of interest. 4-O-methyl gallic acid
(4OMGA) and isoferulic acid have been identified as potential biomarkers of intake
and exposure to polyphenols derived from tea and coffee, respectively. 4OMGA is
derived from gallic acid in tea, and isoferulic acid from chlorogenic acid in coffee.
The major objectives of the research which is the subject of this thesis were (1)
to establish a dose-response relationship of 24h urinary excretions of 4OMGA and
isoferulic acid following ingestions of black tea and coffee of different strengths, and
(2) to explore relationships of tea and coffee intake with 24h urinary excretion of
4OMGA and isoferulic acid in human populations.
It was found that there was rapid excretion of both 4OMGA and isoferulic
acid in the first 6h after tea and coffee ingestion, respectively. Approximately 60 –
80% of the ingested dose was excreted during the first 6h after ingestion. Urinary
excretion of 4OMGA and isoferulic acid was directly related to the dose of tea and
coffee, respectively. That is, higher intake resulted in increased urinary excretion of
the metabolites.
The relationships of 24h urinary excretion of 4OMGA and isoferulic acid with
long-term usual (111 participants) and contemporary recorded current (344
participants) tea and coffee intake were assessed. 4OMGA was strongly related to
usual (r = 0.50, P < 0.001) and current (r = 0.57, P < 0.001) tea intake. Isoferulic acid
was less strongly, but significantly associated with usual (r = 0.26, P = 0.008) and
current (r = 0.18, P < 0.001) coffee intake.
i

Overall, the results are consistent with the proposal that 4OMGA is a good
biomarker for black tea derived polyphenol intake and exposure, but isoferulic acid
may have only limited use as a biomarker for coffee-derived polyphenol exposure.
ii

TABLE OF CONTENTS
Abstract i
Table of Contents iii
Abbreviations vi
Lists of Figures vii
Lists of Tables x
Publications xi
Acknowledgements xii
Chapter 1 – Background and Hypothesis 1.1 Background 1
1.2 Hypotheses 2
Chapter 2 – A Review of Literature2.1 Introduction 3
2.1.1 Tea: A Short Story 3
2.1.2 Coffee: A Short Story 3
2.2 Types of Tea and Tea Manufacturing 5
2.3 Types of Coffee and Coffee Manufacturing 6
2.4 Chemistry of Tea 8
2.5 Chemistry of Coffee 14
2.6 Biochemistry of Tea and Coffee 16
2.7 Pharmacokinetics and Bioavailability of Polyphenols 20
2.8 Biomarkers of Exposure to Tea and Coffee-Derived Polyphenols 30
Chapter 3 – Materials and Methods3.1 Materials 34
3.1.1 Chemicals 34
3.1.2 Equipment 34
3.2 Methods 35
3.2.1 Synthesis of Standard Isoferulic Acid 35
iii

3.2.2 Measurement of Polyphenol Metabolite 4-O-Methyl
Gallic Acid and Isoferulic Acid in Urine Samples 36
Chapter 4 – Dose-Response Study 4.1 Introduction 37
4.2 Methods 38
4.2.1 Study Participants 38
4.2.2 Study Design 38
4.2.3 Preparation of Tea and Coffee 38
4.2.4 Urine Sample Collection 39
4.2.5 Recovery Assay 39
4.2.6 Analysis of Urinary 4-O-Methyl Gallic Acid and
Isoferulic Acid 40
4.3 Results 40
4.3.1 Identification and Measurement of 4-O-Methyl Gallic
Acid and Isoferulic Acid by GCMS 40
4.3.2 Results of GCMS Recovery Assay 44
4.3.3 Urinary Excretion of 4-O-Methyl Gallic Acid and
Isoferulic Acid 44
4.4 Discussion 45
Chapter 5 – Population Studies5.1 Introduction 49
5.2 Methods 50
5.2.1 Study Participants 50
5.2.1.1 Population 1 – Relationship of 4-O-Methyl Gallic
Acid and Isoferulic Acid with Usual Tea and
Coffee Intake 51
5.2.1.2 Population 2 – Relationship of 4-O-Methyl Gallic
Acid and Isoferulic Acid with Current Tea and
Coffee Intake 51
iv
5.2.2 Analysis of Urinary 4-O-Methyl Gallic Acid and
Isofeulic Acid 52
5.2.3 Statistics 52
5.3 Results 52
5.4 Discussion 58
Chapter 6 – Final Discussion and Further Directions 61
References 63
v

ABBREVIATIONS
4OMGA 4-O-methyl gallic acid
AUC Area under curve
BSTFA 2, 2, 2,-Trifluro-N-O-Bis(Trimethylsilyl) Acetamide
CH3CO2Na Sodium Acetate
CVD Cardiovascular disease
DDI Double deionised water
ECD Electro chemical detector
GCMS Gas chromatography mass spectrometry
HCl Hydrochloric acid
Me-4OMGA Methylated 4-O-methyl gallic acid
NaHCO3 Sodium Bicarbonate
vi

LIST OF FIGURES
Chapter 2Figure 2.1 World Map Showing Regions of Tea Cultivation 4
Figure 2.2 History of Dissemination and Early Cultivation of Coffee 4
Figure 2.3 The Tea Manufacturing Process 6
Figure 2.4 Coffee Manufacturing 7
Figure 2.5 Structures of a Typical Polyphenol 9
Figure 2.6 Structures of Principle Tea Catechins 10
Figure 2.7 Structures of Flavonol Glycosides 11
Figure 2.8 Structures of Theaflavins 12
Figure 2.9 The Gallic Acid and 4-O-Methyl Gallic Acid Molecules 13
Figure 2.10 The Caffeine Molecule 14
Figure 2.11 The Chlorogenic Acid Molecule 15
Figure 2.12 Structure of Isoferulic Acid 15
Figure 2.13 Graph Showing Plasma Caffeine Concentrations Over 24h
After Oral Ingestion of 1 Standard Cup of Coffee 19
Figure 2.14 Graph Showing Plasma Levels of Tea Catechins after
Ingestion of Decaffeinated Green Tea 21
Figure 2.15 Metabolic Reactions of Flavanoids in Body Tissues and
Colon, with Catechin Shown as an Example 25
Figure 2.16 Metabolic Reactions of Flavonols in Body Tissues and
Colon, with Quercetin Shown as an Example 26
Figure 2.17 Structure of B2 and B5 Procyanidin Dimers 28
Figure 2.18 Metabolism Pathway of Chlorogenic Acids in Body Tissue
and Colon, with Caffeoyl Quinic Acid as an Example 28
Figure 2.19 Graph Showing Total Catechins in Blood after
Consumption of Green Tea, Black Tea and Black Tea with
Milk 29
Figure 2.20 Graph Showing the Effects of Milk on the Antioxidant
Activity of Coffee, Cocoa and Black Tea 29
vii

Figure 2.21 Graphs Showing the Effects of Acute Dark Chocolate
(100g), Dark Chocolate with Milk (100g), and Milk
Chocolate (200g) Ingestions on the Total Antioxidant
Capacity (A) and Human Plasma (-)-Epicatechin
Concentration (B) 30
Figure 2.22 Graph Showing Time vs. Plasma Concentrations of (A)
Gallic Acid, and (B) 4-O-Methyl Gallic Acid after a Single
Dose of Acidum Gallicum Tablets and Assam Black Tea,
respectively 32
Figure 2.23 Schematic Representation of Chlorogenic Acid Metabolism
into Caffeic Acid after Coffee Ingestion 33
Chapter 4Figure 4.1 Chromatographic Details of Isoferulic Acid 41
Figure 4.2 Chromatographic Details of 4-O-Methyl Gallic Acid 42
Figure 4.3 Chromatographic Details of Internal Standard, 2-Hydroxy-
3-Napthoic Acid 43
Figure 4.4 Individual Urinary Excretion of 4-O-Methyl Gallic Acid
from (A) 0 – 6h and (B) 6 – 24h after Ingesting 0g, 2g and
4g of Black Tea 46
Figure 4.5 Individual Urinary Excretion of Isoferulic Acid from (A)
0 – 6h an (B) 6 – 24h after Ingesting 0g, 2g and 4g of
Coffee 47
Chapter 5Figure 5.1 Graphs Showing the Relationship of Urinary 4-O-Methyl
Gallic Acid with (A) Usual Tea Intake and (B) Actual Tea
Intake 54
Figure 5.2 Graphs Showing the Relationship of Urinary Isoferulic
Acid with (A) Usual Coffee Intake and (B) Actual Coffee
Intake 55
viii

Figure 5.3 Mean (A) 4-O-Methyl Gallic Acid Excreted by Cups of
Current Tea Intake and (B) Isoferulic Acid Excreted by
Cups of Current Coffee Intake in Population 2 56
Figure 5.4 Mean (A) 4-O-Methyl Gallic Acid Excreted by Cups of
Usual Tea Intake and (B) Isoferulic Acid Excreted by Cups
of Usual Coffee Intake in Population 1 57
ix
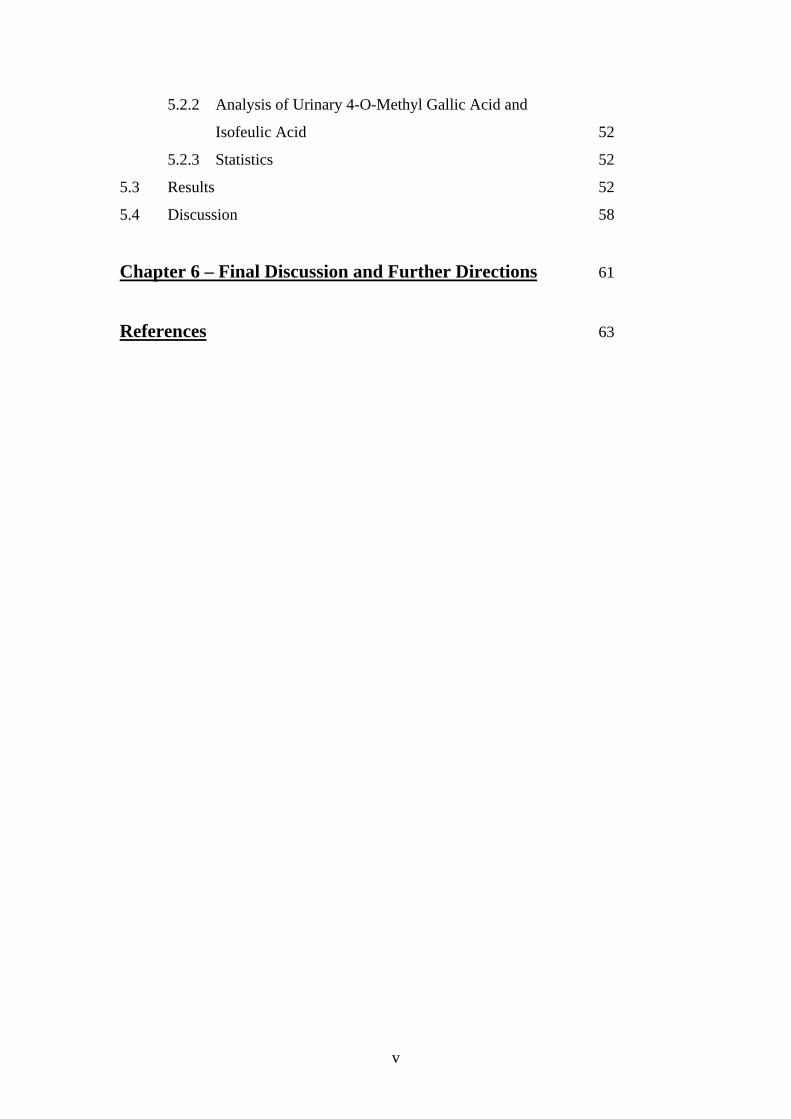
LIST OF TABLES
Chapter 2 Table 2.1 Principal Components of Green and Black Tea (%
wt/wt Solids) 10
Table 2.2 Principal Chemical Compounds Found in Coffee 16
Table 2.3 Caffeine Content in a Standard Cup of Coffee Based on
Preparation Mode 16
Table 2.4 Summaries of Conclusions on the Pharmacokinetics of Tea
Polyphenols by Various Research Groups 22
Chapter 4Table 4.1 Sample Preparations for Standard 4-O-Methyl Gallic Acid
Recovery Assay 40
Table 4.2 Comparisons of Areas Under the Curves of Recovery
Assay Samples 45
Table 4.3 Mean 24h Urinary Excretion of 4-O-Methyl Gallic Acid
and Isoferulic Acid Following the Ingestion of Different
Doses of Tea and Coffee, respectively 45
Chapter 5Table 5.1 Tea and Coffee Intake, and Mean 24-hour Urinary
Excretion of 4-O-Methyl Gallic Acid and Isoferulic Acid
for Two Populations: Usual Tea and Coffee
Intake was Assessed in Population One and Current Tea and
Coffee Intake was Assessed in Population Two 53
x

PUBLICATIONS
Hodgson, J. M., Chan, S. Y., Puddey, I. B., Devine, A., Wattanapenpaiboon, N.,
Wahlqvist, M. L., Lukito, W., Burke, V., Ward, N. C., Prince, R. L., Croft, K. D.
(2004). Phenolic Acid Metabolites as Biomarkers for Tea- and Coffee-Derived
Polyphenol Exposure in Human Subjects. British Journal of Nutrition in press.
xi

ACKNOWLEDGEMENTS
I would like to take this opportunity to express my thanks and appreciation to Doctor
Jonathan Hodgson for his supervision and guidance throughout this project and thesis.
He has always been keen to encourage me at all stages of work.
A special thank you also goes out to Associate Professor Kevin Croft who has always
been generous to help me with my work when needed, especially on the chemistry
and experimental aspects of my work.
In addition, I would like to thank all the laboratory staff in the Department of
Medicine, who have provided me with vast amount of assistance when I needed,
especially Miss Kitiya Dufall and Ms Jennifer Rivera who have been great friends to
me as well.
Furthermore, I would also like to thank all the administrative staff of the Department
of Medicine who are always willing to provide me with help when I needed.
Others to be thanked are my parents and my friends who have always shown me great
support over the course of my degree, and have always encouraged me during this
time.
xii

CHAPTER 1
BACKGROUND AND HYPOTHESES
1.1 Background
Apart from water, tea and coffee are the most widely consumed beverages
(Astill, C. et al., 2001; Balentine, D. A. et al., 1997; Dalluge, J. J. and Nelson, B. C.,
2000; Das, S. K. and Tewari, V. K., 2002; Harbowy, M. E. and Balentine, D. A.,
1997; Lakenbrink, C. L. et al., 2000; Nehlig, A., 1999; Olthof, M. R. et al., 2001b).
Both contain chemical substances that may impact on human health. These
substances include caffeine and polyphenols (Nehlig, A., 1999; Rechner, A. R. et al.,
2001).
Polyphenols are of intense research interest because they exhibit potent
antioxidant activity (Olthof, M. R., Hollman, P. C. H. and Katan, M. B., 2001a;
Olthof, M. F. et al., 2001b; Rechner, A. R. et al., 2001). Further, polyphenols found
in tea have several other demonstrated in vitro activities, which may translate into
benefits relating to lowered risk of cardiovascular disease (CVD) and cancer (Ahmad,
N., Gupta, S. and Mukhtar, H., 2000; Cao, J. et al., 1996; Chou, T. M. and Benowitz,
N. L., 1994; Duffy, S. J. et al., 2001; Folts, J. D., 1998; Folts, J. D., 2002; Gao, Y. T.
et al., 1994; Hakim, I. A. et al., 2003; Hertog, M. G. L. et al., 1993a; Hertog, M. G. L.
et al., 1993b; Hertog, M. G. L. et al., 1995; Zhan, H. et al., 1999; Zhao, W. and Chen,
J., 2001). A standard cup of tea contains approximately 200 to 400mg of polyphenols
(Balentine, D. A., Wiseman, S. A. and Bouwens, L. C. M., 1997; Rice-Evans, C. A. et
al., 1996). Coffee also contains high concentrations of a specific polyphenol,
chlorogenic acid. Chlorogenic acid and its derivative, caffeic acid, have activities in
vitro consistent with benefits to health (Olthof, M. R., Hollman, P. C. H. and Katan,
M. B., 2001a; Rechner, A. R. et al., 2001).
Population studies investigating the relationships of tea and coffee intake with
various chronic disease-related endpoints have used consumption levels to quantify
tea and coffee intake. The identification of biomarkers of tea and coffee-derived
polyphenol intake and exposure would provide an additional tool to investigate such
1

relationships. The biomarkers may have several advantages over the assessment of
intake:
1. Tea and coffee intake may be poorly quantified using estimation of cups
consumed.
2. The strength of tea and coffee, and therefore polyphenol content, can vary
considerably.
3. There are individual differences in absorption of polyphenols, and therefore
exposure.
1.2 Hypotheses
4-O-methyl gallic acid (4OMGA) and isoferulic acid have previously been
identified as possible biomarkers of intake and exposure to polyphenols derived from
tea and coffee, respectively. Therefore, the hypotheses being addressed are:
1. The measurement of 4OMGA in 24h urine samples provides a sensitive and
specific marker of black tea intake and exposure to black tea-derived polyphenols.
2. The measurement of isoferulic acid in 24h urine samples provides a sensitive and
specific marker of coffee intake and exposure to coffee-derived polyphenols.
Two studies were performed to address these hypotheses. In the first study,
dose-response relationships of 24h urinary concentrations of 4OMGA and isoferulic
acid following ingestion of black tea and coffee of different strengths were established.
In the second study, the relationships of tea and coffee intake with 24h urinary
excretion of 4OMGA and isoferulic acid in human populations were investigated.
2

3
CHAPTER 2
A REVIEW OF LITERATURE
2.1 Introduction
2.1.1 Tea: A Short Story
The tea beverage is made from processed leaves of the plant Camellia sinensis.
Based on the Ch’a Ching (Classic of Tea), tea was discovered in 2723BC by Emperor
Shen Nung of China and was used exclusively for medicinal purposes before the Tang
Dynasty (618 – 906AD). Tea was consumed as soup with onions, ginger or orange
peel and salt. In the Song Dynasty (906 – 1279AD), traditional tea leaves were
powdered to produce a bright green and low astringency frothy drink, which is known
as Mattcha in Japan today. It was not until the Ming Dynasty (1369 – 1644AD) that
tea leaves were brewed in hot water. This coincided with the arrival of westerners in
China. Today, various tea brewing techniques are used across cultures (Harbowy, M.
E. and Balentine, D. A., 1997).
The earliest tea plantations were in China, and spread to India between 1818
and 1834. Tea cultivation then spread to the rest of the world; to tropical areas of
Africa, South American and Russia, where localised practices and tea products
developed. Today, tea is one of the most important agricultural products throughout
the world, especially in the equatorial region where the conditions are most
favourable for tea growth. The larger tea plantations are predominantly found in
China, Sri Lanka, India, and parts of Europe and South America.
2.1.2 Coffee: A Short Story
Coffee is made from the beans of ripe berries of a tropical evergreen shrub,
Coffea. There are three varieties of beans – Arabica, Liberica and Robusta. Coffee
was introduced to Europe from the Arab world in the sixteenth century. Its
consumption increased and spread rapidly throughout Europe in the seventeenth
century. Before this, coffee was limited to the Arab world (Berthaud, J. and Charrier,
A., 1988).

Figure 2.1 – World Map Showing Regions of Tea Cultivation (Harbowy, M. E. and Balentine, D. A., 1997)
Tea plantations in South America 1900’s
Tea plantations develop in Africa 1850 – 1878 AD
Modern tea plantation develop India 1818 – 1834 AD
Tea cultivation spread through pacific islands 1824 – 1909 AD
Tea spread to Japan 600 – 800 AD?
Tea originates in China or North India 2737 BC? 350AD?
Figure 2.2 – History of Dissemination and Early Cultivation of Coffee (NB: Cross-hatched area = centre of origin) (Berthaud, J. and Charrier, A., 1998)
Coffee marketed throughout the world is made from the beans of ripe coffee
berries. Today, most consumed coffee is either of the Arabica or Robusta variety.
However, it is the Arabica that predominates, representing more than 70% of coffee
consumed in most countries (100% in Finland and Sweden) (Berthaud, J. and Charrier,
A., 1988; Nehlig, A., 1999; Spiller, M. A., 1984).
4

5
2.2 Types of Tea and Tea Manufacturing
In general, there are three types of manufactured tea: black tea, oolong tea and
green tea. The type of tea manufactured depends on the degree of oxidation of leaves.
Oxidation is an exogenous process: i.e. the natural browning of leaves catalysed by
enzymes within the tea leaf (Harbowy, M. E. and Balentine, D. A., 1997; Unno, T.
and Takeo, K., 1995; Unno, T. et al., 1996). Black teas are produced by promoting
the enzymatic oxidation of polyphenols present in the tea leaf. Enzymes involved in
polyphenol oxidation are inactivated to produce green tea.
Rapid steaming or pan firing of fresh leaves inactivates both endogenous and
exogenous oxidative enzymes, stopping the oxidation of leaves and producing a dry,
stable product. This is known as green tea. Green tea is further classified as either
white or yellow green tea. Yellow green tea derives from naturally withered leaves,
with a small degree of oxidation. White green tea derives from the unwithered but
machine-dried leaves and is not subjected to any oxidation processes.
Oolong and black teas, on the other hand, are fresh leaves withered until their
weight decreases to 55 – 72% of the fresh leaf weight (Harbowy, M. E. and Balentine,
D. A., 1997). The withering process is an important element of the aromatic quality
of the tea product. Withered leaves are rolled and crushed (releasing oxidative
enzymes), initiating the oxidation process of the tea polyphenols. The final grade of
tea is determined by the maceration of the tea leaves. Firing the tea leaves shortly
after rolling to terminate the oxidation and drying processes produces oolong teas
(Balentine, D. A. et al., 1997; Hampton, M. G., 1992; Harbowy, M. E. and Balentine,
D. A., 1997). Cool air is circulated through the rolled and crushed leaves to moderate
the oxidation reactions. The onset of the oxidation is directly coupled to the
temperature from the exogenous reaction. Therefore, the oxidation starts from simple
tea polyphenols to give more complex and condensed polyphenols, resulting in the
bright red colour and brisk astringency of black teas. The oxidised leaves are fired
and dried to stop further oxidation by the enzymes (Balentine, D. A. et al., 1997;
Harbowy, M. E. and Balentine, D. A., 1997).
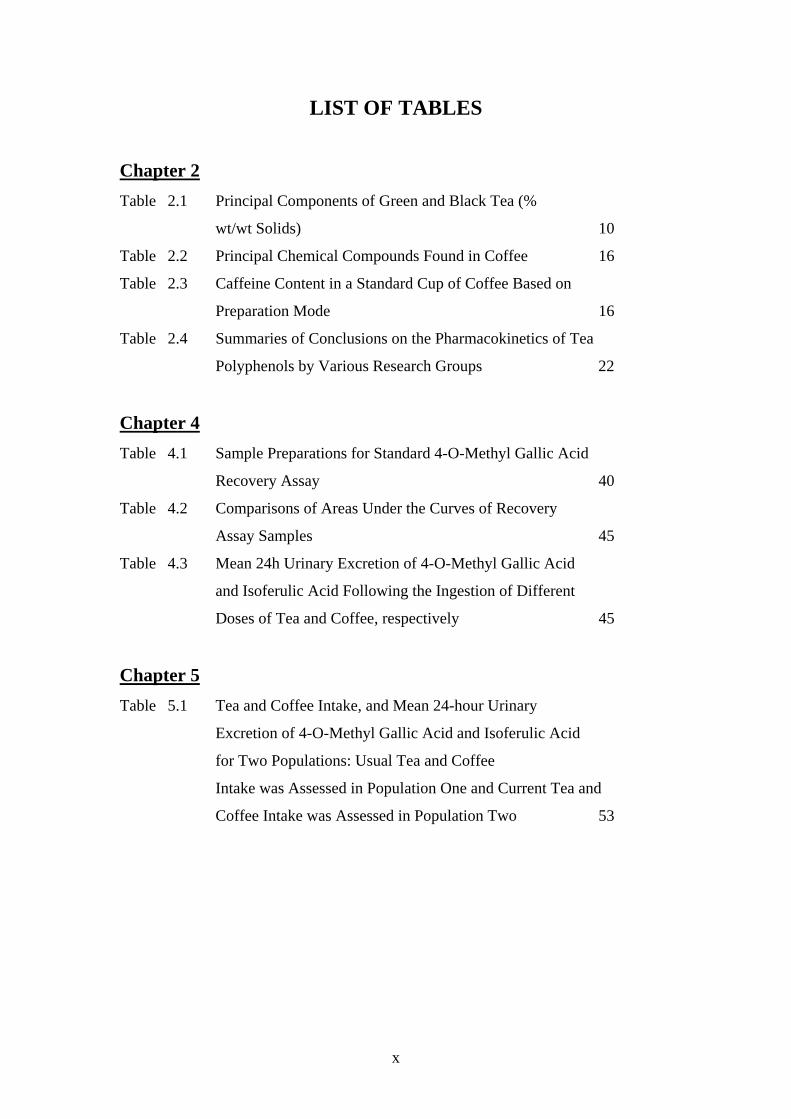
The final step in tea manufacturing is the sizing, grading and evaluation of the
tea by professional tea tasters. The tea leaves are then packaged in sacks or wooden
chests, which are auctioned at warehouses throughout the world. Steps in tea
manufacturing are outlined in Fig. 2.3.
Fresh Tea Leaves
Green Tea Oolong Tea Black Tea
Withering Rolling Oxidation
Firing Firing Firing
White or Yellow Green Tea Sized, graded, evaluated, packed for auction on world
markets
Figure 2.3 – The Tea Manufacturing Process
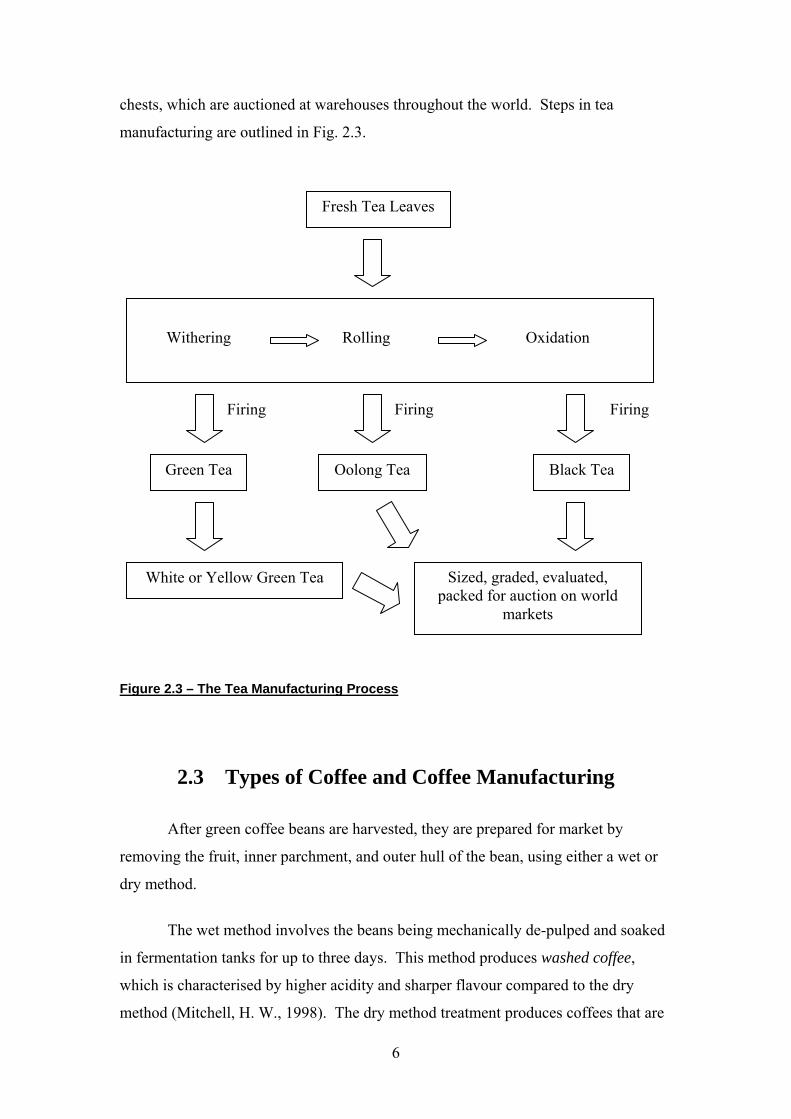
2.3 Types of Coffee and Coffee Manufacturing
After green coffee beans are harvested, they are prepared for market by
removing the fruit, inner parchment, and outer hull of the bean, using either a wet or
dry method.
The wet method involves the beans being mechanically de-pulped and soaked
in fermentation tanks for up to three days. This method produces washed coffee,
which is characterised by higher acidity and sharper flavour compared to the dry
method (Mitchell, H. W., 1998). The dry method treatment produces coffees that are
6
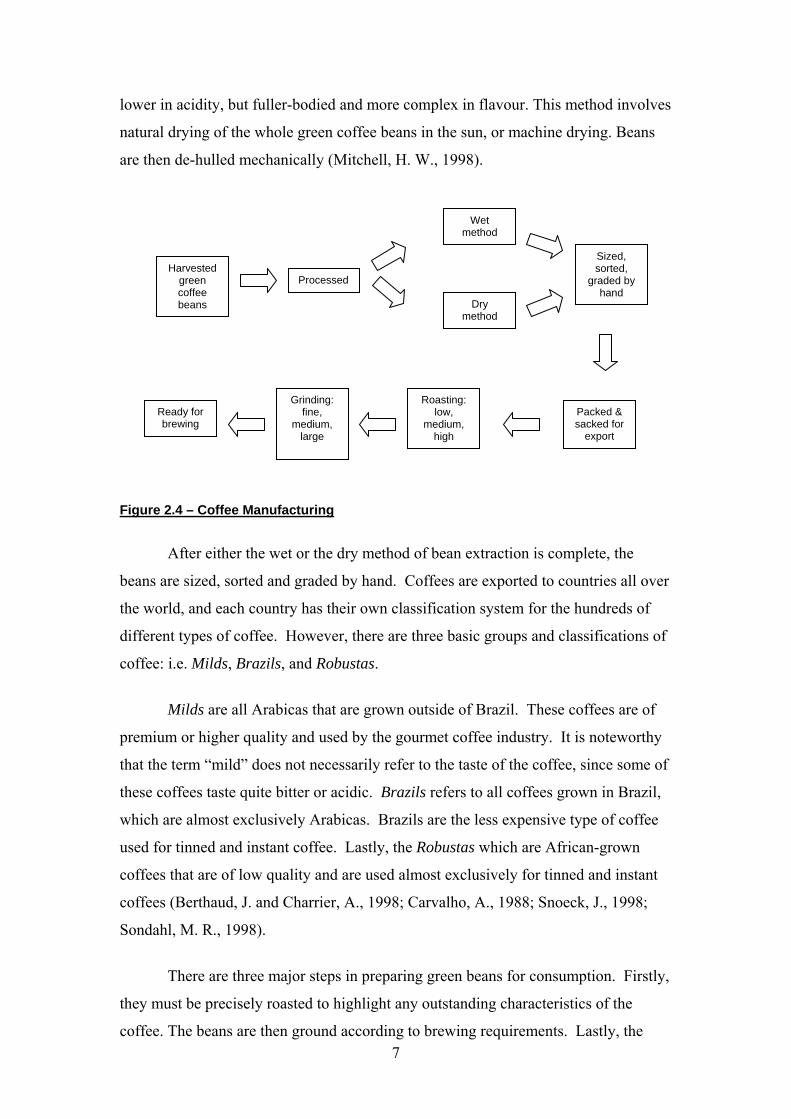
lower in acidity, but fuller-bodied and more complex in flavour. This method involves
natural drying of the whole green coffee beans in the sun, or machine drying. Beans
are then de-hulled mechanically (Mitchell, H. W., 1998).
Harvested green coffee beans
Processed
Wet method
Dry method
Sized, sorted,
graded by hand
Packed & sacked for
export
Roasting: low,
medium, high
Grinding: fine,
medium, large
Ready for brewing
Figure 2.4 – Coffee Manufacturing
After either the wet or the dry method of bean extraction is complete, the
beans are sized, sorted and graded by hand. Coffees are exported to countries all over
the world, and each country has their own classification system for the hundreds of
different types of coffee. However, there are three basic groups and classifications of
coffee: i.e. Milds, Brazils, and Robustas.
Milds are all Arabicas that are grown outside of Brazil. These coffees are of
premium or higher quality and used by the gourmet coffee industry. It is noteworthy
that the term “mild” does not necessarily refer to the taste of the coffee, since some of
these coffees taste quite bitter or acidic. Brazils refers to all coffees grown in Brazil,
which are almost exclusively Arabicas. Brazils are the less expensive type of coffee
used for tinned and instant coffee. Lastly, the Robustas which are African-grown
coffees that are of low quality and are used almost exclusively for tinned and instant
coffees (Berthaud, J. and Charrier, A., 1998; Carvalho, A., 1988; Snoeck, J., 1998;
Sondahl, M. R., 1998).
There are three major steps in preparing green beans for consumption. Firstly,
they must be precisely roasted to highlight any outstanding characteristics of the
coffee. The beans are then ground according to brewing requirements. Lastly, the 7

8
freshly roasted and ground coffee must be brewed at the right temperature for the
correct amount of time to bring out its best quality and flavour. The extent of the
roasting determines the chemical composition of the resulting coffee. The higher the
degree of roasting, the lower the content of polyphenols, specifically chlorogenic acid
(Richelle, M. et al., 2001).
2.4 Chemistry of Tea
Polyphenolic compounds are secondary plant metabolites. They are aromatic
molecules substituted with multiple hydroxyl (OH) groups (Figure 2.5) and have
potent antioxidant properties. Whilst hydroxycinnamic acids are the main
polyphenolic compounds in coffee, they also exist in tea, albeit at considerably lower
concentrations. The dominating polyphenolic compounds found in tea are the
flavonoids and the flavonols or flavones. They are commonly divided into five major
groups: flavonoids, flavonols or flavones, flavanones, flavan-3-ols, and
hydroxycinnamic acids (Balentine, D. A., Wiseman, S. A., and Bouwens, L. C. M.,
1997; Beecher, G. R., Warden, B. A., and Merken, H., 1999; Dalluge, J. J. and Nelson,
B. C., 2000; Finger, A., Kuhr, S. and Engelhardt, U. H., 1992; Harborne, J. B. and
Williams, C. A., 2001; Harbowy, M. E. and Balentine, D. A., 1997; Knaggs, A. R.,
2001; Lakenbrink, C. L. et al., 2000; Rechner, A. R. et al., 2001; Spiller, M. A., 1984;
Yu, J., Vasanthan, T. and Temelli, F., 2001).
Polyphenol composition in tea is of primary interest to research on health
benefits. The interest in these compounds is largely due to their antioxidant properties
(Hanasaki, Y., Ogawa, S. and Fukui, S., 1994; Harborne, J. G., 2001; Hu, J. P. et al.,
1995; Husain, S. R., Cillard, J. and Collard, P, 1987; Jovanovic, S. V. et al., 1994;
Kanner, J. et al., 1997; Keli, S. O. et al., 1996; Kimura, M. et al., 2002; Kondo, K. et
al., 1999; Torel, J., Cillard, J. and Collard, P., 1986; Valcic, S. et al., 2000; Vinson, J.
A., et al., 1995; Waterhouse, A. L., Shirley, J. R., Donovan, J. L., 1996; Wiseman, S.
A., Balentine, D. A. and Frie, B., 1997; Xie, B. et al., 1993). Antioxidants have the
ability to scavenge reactive oxygen species (ROS), which are thought to play a
causative role in diseases involving oxidative damage. Examples of such diseases are
atherosclerosis and some cancers. While there are a large number of natural and
synthetic polyphenols found in many dietary sources, tea can provide a major
contribution to total polyphenol intake in the diet.

Fig. 2.5 – Structure of a Typical Polyphenol (Finger, A., Kuhr, S. and Engelhardt, U. H., 1992)
R1 = H or OH; R2 = OH or gallate ester; R3 = H or OH
The main difference between black and green tea is in the polyphenol
composition. The major classes of polyphenols identified in tea are the catechins,
flavanols, flavonol glycosides and theaflavins (Table 2.1). Polyphenols are classified
by the degree of oxidation to which they are subjected. Catechins are the raw or
original polyphenols found in fresh leaves and theaflavins are the oxidised and more
complex form of the catechins found in black teas.
Green teas contain both simple and complex polyphenols. The majority of the
green tea polyphenols are flavanoid monomers (i.e. catechins) (Table 2.1). These
compounds are synthesised from simple polyphenols and have 15 or more carbon
atoms in their basic chemical structure. The catechins are a general class of flavanoid.
The sub-groupings of these compounds differ in the degree of B-ring hydroxylation
(Fig. 2.5). Catechins and gallocatechins are the dominant forms; their epi-isomers
make up to 20 – 30% wt/wt of dissolved solids in tea (Rice-Evans, C. A. et al., 1996;
Stagg, G. V. and Millin, D. J., 1975).
The majority of green tea catechins are gallic acid esters, with the gallation
found principally at the 3-position. Other gallated species such as epigallocatechin
digallate and epicatechin digallates are also found. The four most common gallic acid
esters are the epigallocatechin gallate (EGCG), epigallocatechin (EGC), epicatechin
gallate (ECG) and epicatechin (EC) (Fig. 2.6). Catechin (C) and gallocatechins (GC)
exist in small quantities, whereas gallocatechins gallate (GCG) and catechin gallate
(CG) are racemization products that are not native to the tea plant (Balentine, D. A. et
al., 1997; Harbowy, M. E. and Balentine, D. A., 1997; Rice-Evans, C. A. et al., 1996;
9
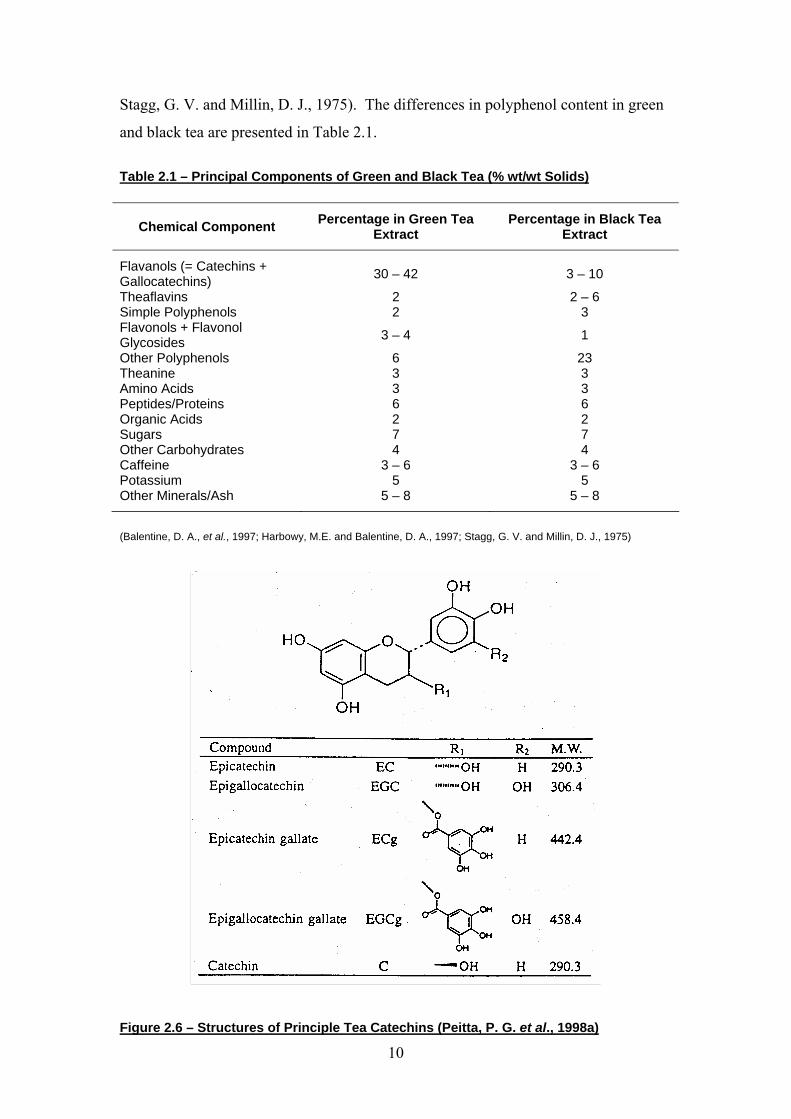
Stagg, G. V. and Millin, D. J., 1975). The differences in polyphenol content in green
and black tea are presented in Table 2.1.
Table 2.1 – Principal Components of Green and Black Tea (% wt/wt Solids)
Chemical Component Percentage in Green Tea Extract
Percentage in Black Tea Extract
Flavanols (= Catechins + Gallocatechins) 30 – 42 3 – 10
Theaflavins 2 2 – 6 Simple Polyphenols 2 3 Flavonols + Flavonol Glycosides 3 – 4 1
Other Polyphenols 6 23 Theanine 3 3 Amino Acids 3 3 Peptides/Proteins 6 6 Organic Acids 2 2 Sugars 7 7 Other Carbohydrates 4 4 Caffeine 3 – 6 3 – 6 Potassium 5 5 Other Minerals/Ash 5 – 8 5 – 8
(Balentine, D. A., et al., 1997; Harbowy, M.E. and Balentine, D. A., 1997; Stagg, G. V. and Millin, D. J., 1975)
Figure 2.6 – Structures of Principle Tea Catechins (Peitta, P. G. et al., 1998a)
10

Flavonols and their glycosides (Fig 2.7) are also a significant component of
green tea (Table 2.1). Chemical analyses have shown that in leaves, these compounds
exist as flavonol-glycosides, flavonol-diglycosides and flavonol-triglycosides. The
overall flavonol content of tea can be determined by following the hydrolysis of these
compounds. The products of the hydrolysis reactions are flavonol aglycones, a
compound that can be detected easily and used to represent the overall concentrations
of flavonol in the beverage (approximately 0.5 – 2.5% wt/wt extract).
Green tea also contains simple and other polyphenols. High Pressure Liquid
Chromatography (HPLC) analysis of green tea has indicated the presence of simple
polyphenols such as gallic acid and its quinic acid esters, theogallin and other
flavonol-glycosides such as apigenin.
Figure 2.7 – Structures of Flavonol Glycosides (Harbowy, M. E. and Balentine, D. A., 1997)
Black tea polyphenols are produced from controlled enzymatic oxidation of
polyphenols present in tea leaves. This produces some polyphenols that are unique to
black tea. These compounds are more complex and difficult to characterise
chemically. The majority of black tea polyphenols are unidentified. However, those
that have been identified are classified as thearubigens (Table 2.1)
Catechins are the main “building blocks” of black tea polyphenols. As a result
of the oxidation and thermal conditions during black tea production, some catechins
are epimerized and degallated, which accounts for the presence of free gallic acid
(FGA) and an increase in non-epi-isomers of catechins.
11

The majority of flavonols (kaempferol, quercetin and myricitine – see Fig. 2.7)
including their glycosides in fresh leaves, are unoxidised during oolong tea and black
tea production. Therefore, these are detectable in both green and black teas (Table
2.1) at similar concentrations. This is also the case for oolong teas. Unconverted
polyphenols remain as the catechins and flavanols (Balentine, D. A. et al., 1997;
Harbowy, M. E. and Balentine, D. A., 1997).
Theaflavins (Fig. 2.8) are polyphenols unique to black teas and typically make
up 3 – 5% wt/wt of total extracted solids. The increase in oxidation time during
manufacturing results in an increase in the concentration of theaflavins, which are
responsible for the bright red-orange colour of black tea, and also decrease the
astringency of black tea. Thus, theaflavins have a positive effect on the market value
of tea.
Benzotropolene Ring
Figure 2.8 – Structures of Theaflavins (Harbowy, M. E. and Balentine, D. A., 1997)
The benzotropolene ring is unique to theaflavins. This part of the structure is
accountable for the molecule’s red colour, and thus makes theaflavins easily
distinguishable amongst other polyphenols.
12

Thearubigens are a group of high molecular weight compounds that exhibit a
bright orange-red colour, resulting from the oxidation of green tea polyphenols. They
are a diverse range of compounds that are yet to be characterised.
The majority of polyphenols contained in tea are present as gallic acid esters.
Gallic acid (3, 4, 5-trihydroxybenzoic acid, Fig. 2.11) is present at trace levels in fresh
green leaf. It is accumulated during oxidation, most likely through the breakdown of
3-galloyl substituted catechins and gallocatechins, such as EGCG and ECG.
(Harbowy, M. E. and Balentine, D. A., 1997; Hodgson, J. M. et al., 2000a; Hollman,
P. C. H. et al., 1997). Therefore, levels of free gallic acid present in black tea will
depend on the extent to which oxidation occurs. 4-O-methyl gallic acid (Fig. 2.9) is
the 4-O-methylation product of gallic acid.
OCH3
Figure 2.9 – The Gallic Acid and 4-O-Methyl Gallic Acid Molecules (Hodgson, J. M. et al., 2000a)
Caffeine (Fig. 2.10) is another important compound present in tea (Hindmarch,
I. et al., 1998). The tea leaf contains 3.6% (Table 2.1) of caffeine on a dry weight
basis. A consumer of a typical cup of tea (180ml), will ingest approximately 40 –
50mg of caffeine. There is little difference in caffeine concentration between green,
oolong and black teas. The caffeine content of a tea beverage is determined by the
brewing conditions (i.e. time, temperature, leaf size, and the amount of tea used to
prepare the drink). Decaffeinated teas, on the other hand, yielde approximately 5mg
of caffeine per 180ml serving (Balentine, D. A. et al., 1997; Drewnowski, A., 2001;
Finger, A. et al., 1992; Groisser, D. S., 1978; Harbowy, M. E. and Balentine, D. A.,
1997; Lakenbrink, C. et al., 2000; Unno, T. and Takeo, T., 1995).
13

Caffeine is synthesised from the adenosine molecule. Adenosine is converted
into hypoxanthine, then xanthine or xanthosine. These xanthines are then converted
to the final intermediate theobromine before caffeine is produced.
Figure 2.10 – The Caffeine Molecule (Taylor, D. A., 1994)
2.5 Chemistry of Coffee
There are five groups of compounds in coffee chemistry. These are the
carbohydrates, nitrogenous components (caffeine), chlorogenic acid (polyphenols),
volatile components and carboxylic acid (Ky, C. L. et al., 2001; McCamey, D. A.,
Thorpe, T. M., and McCarthy, J.P., 1990). Coffee represents one of the richest
sources of dietary caffeine. Concentrations of caffeine vary with the variety of coffee.
Polyphenols are also significant components of coffee, and contribute to aroma, an
importantly quality of coffee as a beverage. To date, more than 800 aromatic
compounds, including polyphenols, have been identified in coffee (Table 2.2)
(Vitzthum, O. G., 1999). The majority of polyphenols found in coffee are present as
chlorogenic acids, which are hydroxycinnamic acids (Fig. 2.11). The most common
hydroxycinnamic aid derivatives are the esters of caffeic acid with quinic acid (i.e. 5-
caffeoyl quinic acid). Chlorogenic acid makes up approximately 7 – 15% of the total
dry weight of coffee (i.e. approximately 100 – 300mg/cup) (Cambrony, H. R., 1998;
Poisson, J., 1998; del Castillo, M. D., Ames, J. M. and Gordon, M. H., 2002). These
compounds are 100% soluble in water and contribute to the acidity of coffees,
imparting the slightly sour and sharp taste characteristic.
14

Hydroxycinnamates are central compounds in polyphenol synthesis through
the shikimate pathways, involving the metabolism of phenylalanine. The conversion
of phenylalanine to trans-cinnamic acid is followed by a hydroxylation of the
aromatic ring at the 4-position, which gives 4-hydroxycinnamic acid or p-coumaric
acid. The aromatic ring is further hydrolysed at the 3-position giving caffeic acid, and
subsequent O-methylation gives ferulic acid. Isoferulic acid (Fig. 2.12) is the 4-O-
methylation product of caffeic acid (Rechner, A. R. et al., 2001).
Figure 2.11 – The Chlorogenic Acid Molecule (Olthof, M. R., Hollman, P. C. H. and Katan, M. B., 2001a)
Figure 2.12 – Structure of Isoferulic Acid (Rechner, A. R. et al., 2001)
The concentration of caffeine in coffee varies with coffee variety. The
average content of caffeine in Robusta coffee is approximately twice that of Arabica
coffee (i.e. a standard cup of Arabica will contain 71 – 120mg of caffeine, whilst the
Robusta will contain 131 – 220mg of caffeine) (Nehlig, A., 1999). Caffeine (Fig.
2.10) has a distinctly bitter taste, but it only accounts for approximately 10% of the
perceived bitterness in coffee (Drewnowski, A., 2001). It is documented that the
bitterness of caffeine is weakened when polyphenols are introduced, and the
astringent taste of polyphenols is diminished by caffeine.
15

16
Table 2.2 – Principle Chemical Compounds Found in Coffee
Compound Concentration in Roasted Coffee (mg L-1) Carbohydrates Sucrose + Cellulose 4000 – 6000 Volatile Compounds 5-hydroxymethylfurfural 10 – 35 2-Methyl Furan 0.05 Furfuryl Alcohol 300 Chlorogenic Acid 20 – 100 Carboxylic Acids Caffeic Acid + Citric Acid 1800 – 8700 Malic Acid 1900 – 3900 Lactic Acid 0 – 3200 Pyruvic Acid 400 – 1700 Acetic Acid 900 – 4000 Nitrogenous Compounds Trigonelline 3000 – 10000 Pyrazine, Thiazole, Quinoline, and Phenyl Pyridine 17 – 40
Caffeine 10000 – 20000 Peptides + Proteins + Alicyclic Ketones 5 – 80 Aromatic Ketones Inorganic Compound Quinic 3200 – 8700
(McCamey, D. A., Thorpe, T. M., and McCarthy, J.P., 1990)
2.6 Biochemistry of Tea and Coffee
In a standard cup of tea, approximately 80% of caffeine will be extracted.
Based on consumption of 5 – 6 cups/day, caffeine intake will be about 0.24g
(~0.04g/cup) (Stagg, G. V. and Millin, D. J., 1975). However, in coffees, the caffeine
content varies between coffee types and is dependent on the brewing procedure.
Table 2.5 – Caffeine Content in a Standard Cup of Coffee Based on Preparation Mode
Mode of Preparation Volume of Serving (ml) Caffeine Content (mg/cup)
Boiled 150 – 190 111 – 177 Filter 50 – 190 28 – 161 Espresso 50 – 150 74 – 99 Percolated 150 – 190 55 – 88 Instant 50 – 190 19 – 34
(Nehlig, A., 1999)
Once ingested, caffeine absorption from the gastrointestinal tract is complete
and rapid, and 99% of total absorption can be achieved after 45min. The peak plasma
concentration occurs between 15 – 120 minutes after oral ingestion (Fig. 2.13), with
concentrations ranging from 41 – 52mM in adults, for doses of 5 – 8mg/kg.

17
Polyphenols in tea and coffee have been shown to exhibited antioxidant
properties, free radical scavenging, and chelation abilities (del Castillo, M. D., Ames,
J. M. and Gordon, M. H., 2002; Facino, R. M. et al., 1994; Hanasaki, Y., Ogawa, S.
and Fukui, S., 1994; Harborne, J. G., 2001; Hu, J. P. et al., 1995; Husain, S. R.,
Cillard, J. and Collard, P, 1987; Jovanovic, S. V. et al., 1994; Kanner, J. et al., 1997;
Keli, S. O. et al., 1996; Kimura, M. et al., 2002; Kondo, K. et al., 1999; Manzocco, L.,
Anese, M. and Nicoli, M. C., 1998; Morel, I. et al., 1994; Rice-Evans, C. A. et al.,
1995; Young, J. F. et al., 2002). These compounds have also been reported to exert
anti-inflammatory actions and modulate immune functions. Flavonoids may exert a
cholesterol-lowering effect by enhancing reverse cholesterol transport and bile acid
excretion, and decreasing the intestinal absorption of dietary cholesterol (Abe, I. et al.,
2000; Abe, I., Seki, T. and Noguchi, H., 2000; Chugh, A., Ray, A. and Gupta, J. B.,
2003; Fukuyo, M., Hara, Y. and Muramatsu, K., 1986; Kuhnau, J, 1976; Maron, D. J.
et al., 2003; Stensvold, I. et al., 1992; Tebib, K., Besancon, P. and Rounat, J. M.,
1994; Tokunaga, S. et al., 2002; Watkins, T. R. and Bierenbaum, M. L., 1998;
Weisburger, J. H. and Chung, F. L., 2002; Yang, T. T. C. and Koo, M. W. L., 1997;
Yee, W. L. et al., 2002; Younes, M. and Siegers, C. P., 1982). Anti-carcinogenic
properties of flavonoids associated with cytotoxicity to cancer cells have also been
suggested (Ahmad, N. Gupta, S. and Mukhtar, H., 2000; Bagchi, D. et al., 1997;
Banks, B. A. et al., 1999; Cao, J. et al., 1996; Chatterjee, M. L., Agarwal, R. and
Mukhtar, H., 1998; Gao, Y. et al., 1994; Imai, K. et al., 1997; Islam, S. et al., 2000;
Jankun, J. et al, 1997; Katiyar, S. K., Ahmad, N. and Mukhtar, H., 2000; Krul, C. et
al., 2001; Kono, S. et al., 1998; Kubo, I., Xiao, P. and Fujita, K., 2002; Mukhtar, H.
and Ahmad, N., 2000; Naasani, I., Seimiya, H. and Tsuruo, T., 1998; Takasaki, M. et
al., 2001; Vaidya, S. G. et al., 1997; Yang, C. S. and Wang, Z. Y., 1993). In addition,
various epidemiological studies have observed an inverse relationship between
flavonoid consumption and coronary heart disease and stroke (Beretz, A., Cazenave, J.
P. and Anton, R., 1982; Chou, T. M. and Benowitz, N. L., 1994; de Lorgeril, M. S. P.,
1999; Demrow, H. S., Slane, P. R. and Folts, J. D., 1995; Duffy, s. J. et al., 2001;
Folts, J. D., 1998; Hakim, I. A. et al., 2003; Hertog, M. G. L., et al., 1993a; Hertog, M.
G. et al., 1995; Iijima, K. et al., 2000; Katan, M. B., 1997; Knekt, P. et al., 1996;
Kris-Etherton, P. M. et al., 2002a; Kris-Etherton, P. M. 2002b; Luc, G. and Fruchart,
J. C., 1991; Moline, J. et al., 2000; Paquay, J. B. G. et al., 2000; Princen, J. M. G. et
al., 1998; Riemersma, R. A. et al., 2001; Sato, M. et al., 1999; Sesso, H. D. et al.,
18
2003; Tijburg, L. B. M. et al., 1997; Whitehead, T. P. et al., 1995; Zhan, A. et al.,
1997; Zhao, W. and Chen, J., 2001; Zhang, A. et al., 1997).
Studies have shown that upon oral administration of radioactively labelled
catechins in humans, ~50% of the radioactivity was recovered in urine. Once
ingested, catechins are biotransformed in the liver, through glucuronidation,
sulphation and O-methylation. After oral administration to human subjects of EGCG
and EC from green tea, major sulphated conjugates of these compounds were found in
plasma, whilst EGC circulated as the glucuronide conjugate. Approximately 20% of
EGCG, however, remained unconjugated. O-methylation of catechins was observed
in in vitro incubation with liver homogenate, producing a 3-methoxy-catechin
(Hollman, P. C. H., Tijburg, L. B. M., and Yang, C. S., 1997; Kuhnle, G. et al., 2000;
Olthof, M. R. et al., 2000b; Scalbert, A. and Williamson, G., 2000; Spenser, J. P. E. et
al., 2001; Wiseman, H., 1999).
After biotransformation in the liver, the sulphated, glucuronidated, or O-
methylated derivatives have their catechin ring cleaved by microorganisms in the
colon. This is followed by the hydrolysis of these compounds, resulting in free
catechins and phenolic acid and lactone metabolites reabsorbed in the first
enterohepatic circulation, whilst the methylated ester derivatives are excreted into the
urine (Erlund, I. et al., 2001; Hollman, P. C. H., Tijburg, L. B. M., and Yang, C. S.,
1997; Pietta, P. G. et al., 1998a; Spenser, J. P. E. et al., 2000; Spenser, J. P. E. et al.,
2001).
Gallic acid, free or esterified, makes up approximately 5% wt/wt of the total
solid extract of green and black tea. On the other hand, free gallic acid makes up
about 1% of the total solid extract of black tea, and is lower in green tea (Bors, W.,
Michel, C., and Stettmaier, K., 2000; Finger, A. Kuhr, S., Engelhardt, U. H., 1992;
Harbowy, M. E. and Balentine, D. A., 1997; Hodgson, J. M. et al., 2000a; Shahrzad, S.
et al., 2001). The typical concentration of free gallic acid in a 200ml cup of black tea
is approximately 10 – 50mg (Hodgson, J. M. et al., 2000a). Free gallic acid is rapidly
absorbed, and in vivo metabolic pathways are likely to be similar to that of other
absorbed polyphenols. Gallic acid has potent antioxidant activity in vitro and may
contribute to any health benefits of drinking tea.

Chlorogenic acid and its conjugates are found in almost all fruits and
vegetables. However, coffee is the richest dietary source of these compounds,
contributing to more than 70% of total dietary intake (Rechner, A. R. et al., 2001).
Isoferulic acid is derived from the 4-methoxylation of caffeic acid or a conjugate of
caffeic acid. Chlorogenic acid concentration in coffees ranges from 20 – 100mg/L
(McCamey, D. A., Thorpe, T. M. and McCarthy, J. P., 1990), depending on the coffee
type and method of preparation of the beverage (del Castillo, M. D., Ames, J. M. and
Gordon, M. H., 2002). Being a polyphenolic compound, isoferulic acid also has
antioxidant properties similar to those of gallic acid and gallic acid esters (gallates)
(Frankel, E. N. et al., 1993; Frankel, E. N. et al, 1995; Hanasaki, Y., Ogawa, S. and
Fukui, S., 1994; Halder, J. and Bhaduri, A. N., 1998; Olthof, M. F., Hollman, P. C. H.
and Katan, M. B., 2001a; Olthof, M. F. et al., 2001b; Rechner, A. R. et al., 2001).
The antioxidant activity of chlorogenic acid is weaker than that of gallic acid and its
esters because of the methylation of an OH group (Facino, R. M. et al., 1994;
McCamey, D. A., Thorpe, T. M. and McCarthy, J. P., 1990; Olthof, M. F., Hollman, P.
C. H. and Katan, M. B., 2001a; Olthof, M. F. et al., 2001b; Rechner, A. R. et al.,
2001; Spiller, M. A., 1984).
0
2
4
6
8
10
12
0.5 1 2 4 6 8 10 12 14 16 18 20 22 24
Time (hr)
Figure 2.13 – Graph Showing Plasma Caffeine Concentration Over 24h After Oral Ingestion of 1 Standard Cup of Coffee (Derived from Nehlig, A., 1999)
19

20
2.7 Pharmacokinetics and Bioavailability of Polyphenols
To understand the mechanisms of actions of dietary polyphenols in vivo, we
must first have an understanding of the pharmacokinetics and bioavailabilities of
these compounds. Pharmacokinetics is the mathematical description of the rate and
extent of uptake, distribution, and elimination of drugs or compounds of interest in the
body (Gwilt, P. R., 1990). Bioavailability refers to the rate and extent of absorption
for a given dose (Gwilt, P. R., 1990). Therefore, the definition of bioavailability
evolves into the fraction of an oral dose (parent compound or active metabolite) from
a particular preparation that reaches the systemic circulation (Stahl, W. et al., 2002).
In order to obtain the pharmacokinetics of tea and coffee derived polyphenols,
various dose-response studies have been conducted by various research groups.
These studies have identified the effective dose, time of peak concentration after
ingestion, half-lives and elimination timelines. The bioavailabilities of polyphenols
were traced through the administration of radiolabelled compounds using human and
rat models, monitoring their possible routes of metabolism and excretion.
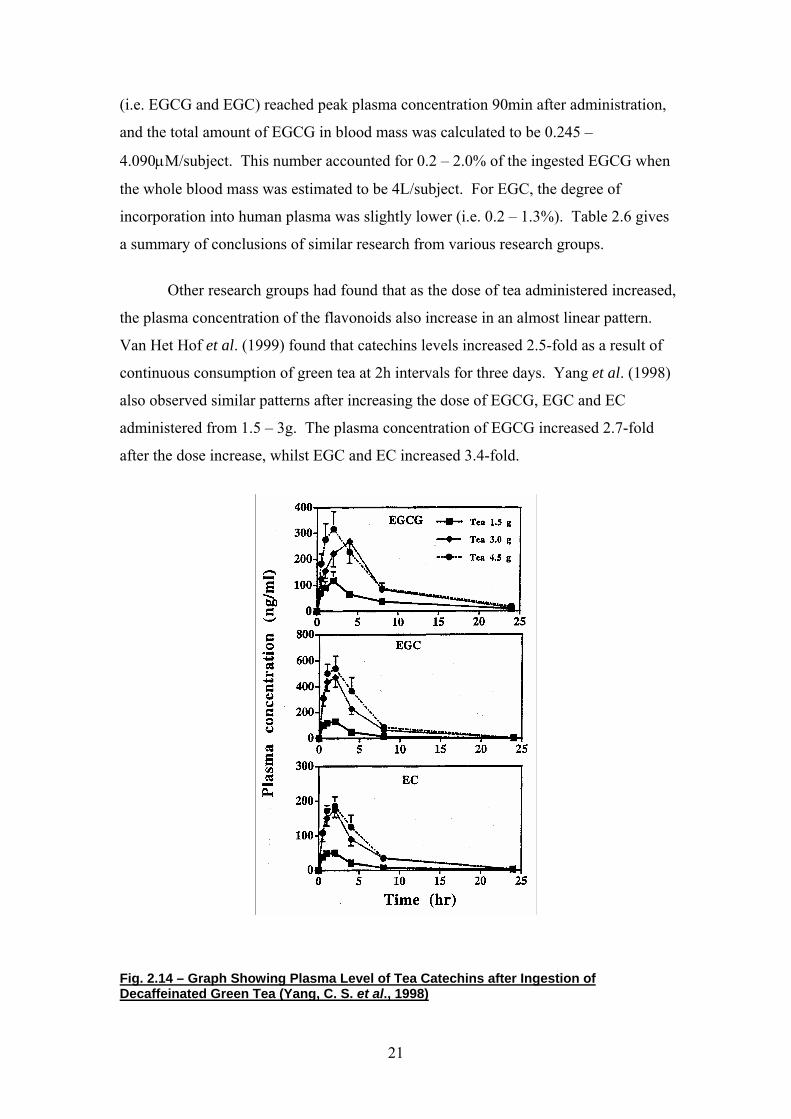
Figure 2.14, which derives from the work of Yang et al. (1998), depicts the
typical plasma pharmacokinetics of polyphenolic compounds. The three polyphenols
shown are EGCG, EGC and EC. These polyphenols are abundant in tea, with EGCG
making up the majority of the flavonoids. Figure 2.14 shows a steep increase in
initial plasma concentration from t = 0h to t ≈ 2.5h after ingestion. This is followed
by a rapid decrease from t = 3h until t = 8h, by which time approximately 60% of the
compounds are excreted. The remaining compound is excreted over the next 15 – 16h,
with total elimination occurring 24h after ingestion. In other studies (Peitta et al.,
1998a and 1998b, and Unno et al. 1996), a typical peak plasma concentration of 2µM
was attained approximately 2h after administration of a single dose of EGCG
equivalent to that in 2g of green tea brewed in 200ml of hot water. The compound
was eliminated rapidly after the peak plasma concentration was reached, almost
totally eliminated by 8h after ingestion and totally eliminated by 24h.
Nakagawa et al. (1997) looked at the dose-dependent incorporation of tea
catechins into human plasma via the administration of pure EGCG and EGC capsules
that corresponded to 2, 4 and 6 cups of green tea. They found that the two standards
(i.e. EGCG and EGC) reached peak plasma concentration 90min after administration,
and the total amount of EGCG in blood mass was calculated to be 0.245 –
4.090µM/subject. This number accounted for 0.2 – 2.0% of the ingested EGCG when
the whole blood mass was estimated to be 4L/subject. For EGC, the degree of
incorporation into human plasma was slightly lower (i.e. 0.2 – 1.3%). Table 2.6 gives
a summary of conclusions of similar research from various research groups.
Other research groups had found that as the dose of tea administered increased,
the plasma concentration of the flavonoids also increase in an almost linear pattern.
Van Het Hof et al. (1999) found that catechins levels increased 2.5-fold as a result of
continuous consumption of green tea at 2h intervals for three days. Yang et al. (1998)
also observed similar patterns after increasing the dose of EGCG, EGC and EC
administered from 1.5 – 3g. The plasma concentration of EGCG increased 2.7-fold
after the dose increase, whilst EGC and EC increased 3.4-fold.
Fig. 2.14 – Graph Showing Plasma Level of Tea Catechins after Ingestion of Decaffeinated Green Tea (Yang, C. S. et al., 1998)
21
22
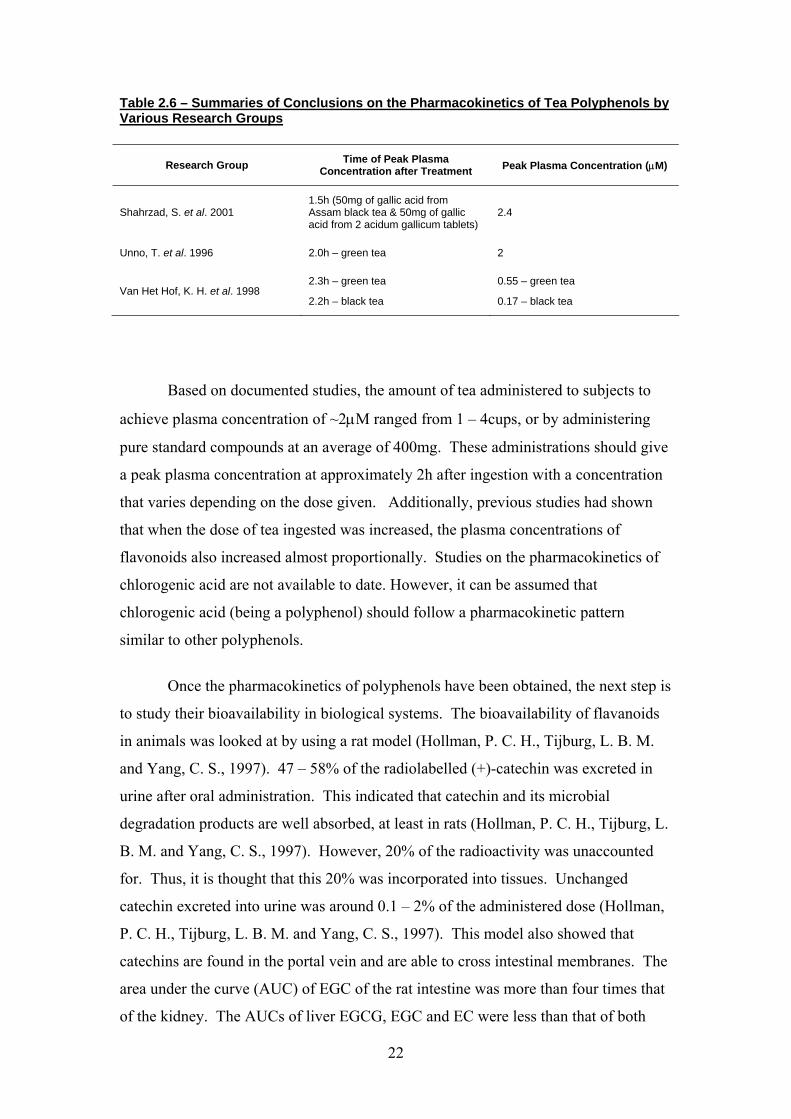
Table 2.6 – Summaries of Conclusions on the Pharmacokinetics of Tea Polyphenols by Various Research Groups
Research Group Time of Peak Plasma Concentration after Treatment Peak Plasma Concentration (µM)
Shahrzad, S. et al. 2001 1.5h (50mg of gallic acid from Assam black tea & 50mg of gallic acid from 2 acidum gallicum tablets)
2.4
Unno, T. et al. 1996 2.0h – green tea 2
Van Het Hof, K. H. et al. 1998 2.3h – green tea
2.2h – black tea
0.55 – green tea
0.17 – black tea
Based on documented studies, the amount of tea administered to subjects to
achieve plasma concentration of ~2µM ranged from 1 – 4cups, or by administering
pure standard compounds at an average of 400mg. These administrations should give
a peak plasma concentration at approximately 2h after ingestion with a concentration
that varies depending on the dose given. Additionally, previous studies had shown
that when the dose of tea ingested was increased, the plasma concentrations of
flavonoids also increased almost proportionally. Studies on the pharmacokinetics of
chlorogenic acid are not available to date. However, it can be assumed that
chlorogenic acid (being a polyphenol) should follow a pharmacokinetic pattern
similar to other polyphenols.
Once the pharmacokinetics of polyphenols have been obtained, the next step is
to study their bioavailability in biological systems. The bioavailability of flavanoids
in animals was looked at by using a rat model (Hollman, P. C. H., Tijburg, L. B. M.
and Yang, C. S., 1997). 47 – 58% of the radiolabelled (+)-catechin was excreted in
urine after oral administration. This indicated that catechin and its microbial
degradation products are well absorbed, at least in rats (Hollman, P. C. H., Tijburg, L.
B. M. and Yang, C. S., 1997). However, 20% of the radioactivity was unaccounted
for. Thus, it is thought that this 20% was incorporated into tissues. Unchanged
catechin excreted into urine was around 0.1 – 2% of the administered dose (Hollman,
P. C. H., Tijburg, L. B. M. and Yang, C. S., 1997). This model also showed that
catechins are found in the portal vein and are able to cross intestinal membranes. The
area under the curve (AUC) of EGC of the rat intestine was more than four times that
of the kidney. The AUCs of liver EGCG, EGC and EC were less than that of both

23
intestine and kidney. Therefore, it was concluded that EGCG is mainly excreted
through bile, and EGC and EC are excreted through bile and urine.
Human volunteers were recruited by Hollman, Tijburg and Yang (1997), and
Van Het Hof et al. (1998) for the examination of flavanoid bioavailability after the
administration of pure flavanoid standards (i.e. EGCG, EC and EGC, and green tea).
It was found that 90% of the total ECG and EC administered was excreted between 0
– 8h, and their levels were below detection limit at 24h after ingestion. Although the
concentration of EGCG is greater than EGC in green tea, plasma EGCG was found to
be lower than plasma EGC. Therefore, the bioavailability of EGCG is lower than that
of EGC in pure form, since EGCG may be converted into other metabolites (Hollman,
P. C. et al., 1997; Shahrzad, S. et al., 2001; Van Het Hof, K. H. et al., 1998; Wiseman,
H., 1999). Figure 2.15 shows the possible metabolic reactions of flavanoids in body
tissues and colon. The flavanoid used as an example in this figure is (+)-catechin,
showing that once ingested, part of the dose can undergo tissue incorporation, whilst a
fraction will be metabolised in the colon before excretion through urinary or other
portals.
Hollman et al. (1997) also looked at the bioavailability in animals of a
flavonol, quercetin aglycone, by administering radioactive quercetin aglycone to rats.
It was found that the compound was poorly absorbed. Only 4 – 13% of the dose,
including the compound’s conjugates, was recovered in urine. 40% of the dose was
recovered in faeces, and this high level of radioactivity was associated with CO2 that
had resulted from the absorbed quercetin that was metabolised through the β-
oxidation of phenylpropionic acid, where 12 – 14% of the dose originated.
Metabolism of quercetin was also traced in humans using its aglycone. After
oral administration of a very high dose of quercetin aglycone (4000mg), no aglycone
or conjugates of quercetin were detected in urine samples (Hollman, P. C. et al.,
1997). Less than 1% of the administered quercetin was absorbed. It was
hypothesised that the sugar moiety of the compound is important to the absorption of
dietary quercetin (Hollman, P. C. et al., 1997; Olthof, M. R. et al., 2000), and that the
elimination of quercetin from plasma was low. It is also possible that there may be an
accumulation of quercetin in plasma throughout the day with repeated dietary intake.
Figure 2.16 shows the possible metabolic pathways flavonols may undergo, using

24
quercetin as an example of the class of polyphenol. The schematic diagram shows
how quercetin can undergo tissue incorporations once ingested, metabolised in the
colon and then incorporated into the tissues. However, unlike flavanoids, the
metabolites of flavonols can also undergo tissue incorporation. This may be the
reason little or no flavonol and its metabolites were excreted in the urine.
Catechin condensation products (i.e. catechin dimers such as the B2 and B5
procyanidin dimers) (Fig. 2.17) are also relatively abundant in black tea. Therefore,
gain further understanding concerning the metabolism of black tea polyphenols, the
biological activities of these compounds should be scrutinised. It was found that
procyanidin dimers are absorbed in mice (Spenser, J. P. E. et al., 2000; Spenser, J. P.
E. et al., 2001), but absorption of these compounds intact in humans is less clear from
the available evidence.
In humans, larger polyphenols may be absorbed. However, it is not known if
or to what extent these larger polyphenolic compounds are absorbed intact. In
addition, it is plausible that the large thearubigens may undergo gastrointestinal
degradation or metabolism by colonic microflora, as is the case for simple catechins
(Hollman, P. C. et al., 1997; Scalbert, A. and Williamson, G., 2000; Spenser, J. P. E.
et al., 2000; Spenser, J. P. E. et al., 2001).
The compounds mentioned so far were polyphenols found in tea. The most
abundant polyphenol in coffee is chlorogenic acid, which is a hydroxycinnamate.
Therefore, it is possible to gain an insight to coffee metabolism by looking at the
metabolic patterns of chlorogenic acid. Olthof et al. (2001a), using ileostomy
subjects, found that 33% of ingested chlorogenic acid was absorbed from the small
intestine of humans. In the urine collected from the volunteers, only traces of
chlorogenic acid were found. This indicated that at least some of the ingested
chlorogenic acid was absorbed as intact molecules, whilst most of it was metabolised
extensively into other compounds after absorption.
In human subjects, urinary excretion of chlorogenic acid reached a peak at 1 –
3h after oral administration of a standard cup of coffee (149 ± 0.8mg of chlorogenic
acid) (Olthof, M. R., Hollman, P. C. H. and Katan, M. B., 2001a; Rechner, A. R. et al.,
2001). This indicated a relatively fast pathway of absorption, metabolism and
elimination of caffeic acid metabolites (Fig. 2.18), which also indicated chlorogenic

acids are readily bioavailable. Figure 2.18 shows the metabolism pathway of
chlorogenic acids, with caffeoyl quinic acid used as an example. Unlike tea
polyphenols, chlorogenic acid undergoes metabolism in the colon before it is
incorporated into tissues, and then excreted through urinary portals.
Figure 2.15 – Metabolic Reactions of Flavanoids in Body Tissues and Colon, with (+)-Catechin Shown as an Example (Hollman, P. C., Tijburg, L. B. M. and Yang, C. S., 1997)
25

Figure 2.16 – Metabolic Reactions of Flavonols in Body Tissues and Colon, with Quercetin Shown as an Example ( Hollman, P. C., Tijburg, L. B. M. and Yang, C. S., 1997)
26

27
It is a common practice to consume tea and coffee with milk. The question
arises, therefore, as to whether the polyphenol concentrations of the beverages can be
altered by the addition of milk. Figure 2.19 shows the effects of total catechin
concentration in blood before and after the addition of milk to black tea. It can be
seen that there is no significant effect on the total catechin levels in blood after the
addition of milk.
It is thought that upon the addition of milk, there can be an inhibition of the
antioxidant activities of polyphenols and bioavailability of flavanoids can be reduced
(Richelle, M. et al., van Het Hof, K. H. et al., 1998). Figure 2.20 shows the effects of
milk on the antioxidant activity of three beverages that are high in polyphenol content
(i.e. coffee, cocoa and black tea). The antioxidant activity is determined by the lag
time (i.e. the delay in LDL oxidation). There was no increase or decrease in the lag
time of LDL oxidation after milk was added to the three solutions. Hence, it can be
concluded that the addition of milk to beverages high in polyphenolic compounds
appears to have little effect on the concentration or activities of these compounds in
vivo.
However, a recent study has shown that the in vivo antioxidant activity of the
dietary flavanoid from chocolates, (-)-EC was impaired upon the addition of milk
(Serafini, M. et al., 2003). The experimental results using the ferric-reducing
antioxidant potential (FRAP) assay showed that the antioxidant capacities were 147 ±
4.5 and 78.3 ± 3.4µmol reduced iron per 100g of dark and milk chocolate,
respectively. In addition, when the volunteers consumed dark chocolate alone, their
plasma antioxidant levels increased significantly from 100 ±3.5% to 118.4 ± 3.5% (P
< 0.001) (Fig. 2.21).
As seen in the study by Serafini et al. (2003), the addition of milk during
ingestion or the manufacturing processes can cause impairments to the in vivo
antioxidant activity of chocolates and absorption of (-)-EC. It is hypothesised that this
hindrance is due to the formation of secondary bonds between chocolate flavanoids
and milk proteins, leading to a decrease in biological accessibility of the flavonoids,
resulting in a decrease of the antioxidant potential of the compounds.

However, it is still debatable whether milk causes changes to the polyphenol
contents of polyphenol rich foods, or impairments to their antioxidant potentials and
bioavailabilities.
Figure 2.17 – Structure of B2 and B5 Procyanidin Dimers. (A) Epicatechin-(4b-8)-Epicatechin = B2 Dimer; (B) Epicatechin-(4b-6)-Epicatechin = B5 Dimer (Spencer, J. P. E. et al., 2001)
28
Figure 2.18 – Metabolism Pathway of Chlorogenic Acids in Body Tissue and Colon, with Caffeoyl Quinic Acid as an Example (Rechner, A. R. et al., 2001)

0.01
0.1
10 0.5 1 2 3 4 5 6 7 8
Time After Tea Consumption (h)
Tota
l Cat
echi
ns in
Blo
od (m
M)
Green Tea Black Tea Black Tea + Milk
Figure 2.19 – Graph Showing Total Catechins in Blood after Consumption of Green Tea, Black Tea and Black Tea with Milk (adapted from van Het Hof, K. H. et al., 1998)
0
100
200
300
400
500
600
700
Coffee Cocoa Black Tea
Incr
ease
d of
Lag
Tim
e (m
in)
Water Milk
Figure 2.20 – Graph Showing the Effects of Milk on the Antioxidant Activity of Coffee, Cocoa and Black Tea (adapted from Richelle, M. et al., 2001)
29

Figure 2.21 – Graphs Showing the Effects of Acute Dark Chocolate (100g), Dark Chocolate with Milk (100g), and Milk Chocolate (200g) Ingestions on the Total Antioxidant Capacity (A) and Human Plasma (-)-Epicatechin Concentration (B) (Serafini, M. et al., 2003)
2.8 Biomarkers of Exposure to Tea and Coffee-
Derived Polyphenols
“Biomarker” is a word initially coined by free radical biologists to describe
molecular changes in biological molecules due to attack by reactive oxygen, nitrogen
or halide species (Griffiths, H. R. et al., 2002). However, with the recent increase in
interests in food sciences, this term has evolved to accommodate a broader range of
biological usage. Currently, study of biomarkers covers a range of biological interests,
from antioxidant studies to disease end-points related studies. In the field of food
science and nutrition, a biomarker can be any biological specimen that is an indicator
of nutritional status with respect to intake or metabolism of dietary constituents
30

31
(Potischman, N. and Freudenheim, J. L., 2003). Biomarkers can be a biochemical,
functional or clinical index of the status of an essential nutrient or other dietary
constituent. Therefore, biomarkers can also be broadly defined as the biological
consequences of dietary intakes or dietary patterns (i.e. they give an indication of a
nutritional exposure) (Blanck, H. M. et al., 2003; Kohlmeier, L., 1991; Kok, F. J.,
1991; Marshall, J. R., 2003; Mason, J. B., 2003; Potischman, N. and Freudenheim, J.
L., 2003; Willett, W. C., 1991).
For a biological specimen or molecule to be used as a biomarker, it must
satisfy two main criteria: (1) it is a compound that is unique to the item in question
and primarily found within this item, and (2) it is traceable in the metabolic pathways
of the item in question. By using biomarkers in scientific research, valuable
information can be gathered about the item in question. Biomarkers can provide
useful information on disease-related progressive outcomes (Griffiths, H. R. et al.,
2002).
4-O-methyl gallic acid (4OMGA) is the major metabolite of gallic acid. It has
been identified as a potential biomarker of tea intake and of tea-derived polyphenol
exposure in humans (He, Y. H. and Kies, C., 1994; Hodgson, J. M. et al., 2000a;
Shahrzad, S. et al., 2001). Gallic acid exists in free and bound forms and can be
readily extracted into hot water infusions. It is a simple polyphenol that has potent
antioxidant activity and anti-mutagenic and anti-carcinogenic properties. Despite the
biological activities gallic acid possesses, there is limited data available about the
extent of its absorption, elimination or relative bioavailability upon ingestion of
dietary materials such as tea. However, dose-response studies have resolved the
pharmacokinetics of gallic acid and its metabolite 4OMGA. Figure 2.22 shows that
the peak plasma concentrations of both the original compound (gallic acid) and its
metabolite (4OMGA) peaked at the same time (i.e. 2h after ingestion in the single
dose administration of gallic acid and administration of tea (Assam black tea, 6.24g in
200ml hot water) (Shahrzad, S. et al., 2001). Therefore, since tea is a rich dietary
source of gallic acid, these methylated ester derivatives of metabolised flavanoids
may be used as biomarkers to monitor tea consumption, and as an indicator of tea-
derived polyphenol exposure in humans.
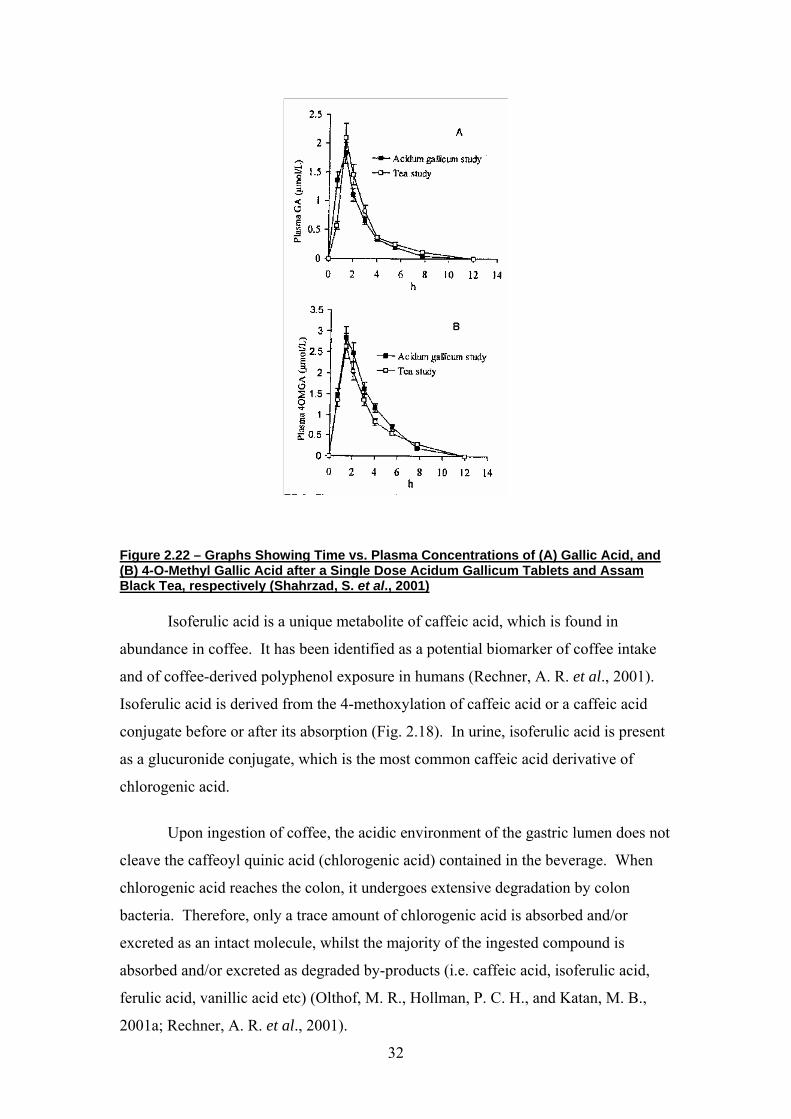
Figure 2.22 – Graphs Showing Time vs. Plasma Concentrations of (A) Gallic Acid, and (B) 4-O-Methyl Gallic Acid after a Single Dose Acidum Gallicum Tablets and Assam Black Tea, respectively (Shahrzad, S. et al., 2001)
Isoferulic acid is a unique metabolite of caffeic acid, which is found in
abundance in coffee. It has been identified as a potential biomarker of coffee intake
and of coffee-derived polyphenol exposure in humans (Rechner, A. R. et al., 2001).
Isoferulic acid is derived from the 4-methoxylation of caffeic acid or a caffeic acid
conjugate before or after its absorption (Fig. 2.18). In urine, isoferulic acid is present
as a glucuronide conjugate, which is the most common caffeic acid derivative of
chlorogenic acid.
Upon ingestion of coffee, the acidic environment of the gastric lumen does not
cleave the caffeoyl quinic acid (chlorogenic acid) contained in the beverage. When
chlorogenic acid reaches the colon, it undergoes extensive degradation by colon
bacteria. Therefore, only a trace amount of chlorogenic acid is absorbed and/or
excreted as an intact molecule, whilst the majority of the ingested compound is
absorbed and/or excreted as degraded by-products (i.e. caffeic acid, isoferulic acid,
ferulic acid, vanillic acid etc) (Olthof, M. R., Hollman, P. C. H., and Katan, M. B.,
2001a; Rechner, A. R. et al., 2001).
32

Gut microflora is responsible for the hydrolysis of chlorogenic acid into its
corresponding derivatives, caffeic acid and quinic acid (Fig. 2.18). Caffeic acid then
undergoes O-methylation in the liver, producing isoferulic acid and ferulic acid
(Olthof, M. R., Hollman, P. C. H., and Katan, M. B., 2001a). After O-methylation,
isoferulic acid is glucuronidated in the liver, then excreted into the urine. A notable
feature of this series of reactions is that the gut microflora may be responsible for the
rationing of the amounts of ferulic acid/isoferulic acid excreted into the urine, which
mirrors individual difference in gut microflora (Rechner, A. R. et al., 2001).
Figure 2.23 shows the systemic concentrations of chlorogenic acid and caffeic
acid after coffee ingestion. It can be seen that as chlorogenic acid builds up over time,
so does caffeic acid. However, as is shown in Figure 2.23, the original compound and
the metabolite do not reach peak concentration at the same time after coffee ingestion.
Therefore, since coffee is a rich dietary source of chlorogenic acid, it is hypothesised
that isoferulic acid, a metabolite of caffeic acid, may be used as a specific biomarker
to monitor coffee consumption in humans, and to monitor the pharmacokinetics of
coffee.
0
2
4
6
8
10
12
14
16
18
0 0.5 1 1.5 2
Time after Ingestion (h)
Plas
ma
Chl
orog
enic
Aci
d (m
M)
0
0.5
1
1.5
2
2.5
0 1 2 3 4 5
Time after Ingestion (h)
Plas
ma
Caf
feic
Aci
d (m
M)
Fig. 2.23 – Schematic Representation of Chlorogenic Acid Metabolism into Caffeic Acid after Coffee Ingestion (Olthof, M. R., Hollman, P. C. H., and Katan, M. B., 2001a; Olthof, M. R. et al., 2001; Rechner, A. R. et al., 2001)
33
CHAPTER 3
MATERIALS AND METHODS
3.1 Materials
3.1.1 Chemicals
Following is a list of analytical grade chemicals used and their sources:
1-hydroxy-2-naphthoic acid (Aldrich Chemical Company, Milwaukee, Wisconsin,
USA)
Sodium Carbonate (Ajax Chemicals Pty. Ltd., Melbourne, Australia)
Ethyl Acetate, Hydrochloric Acid, Pyridine (AnalaR – Merck Pty. Ltd., Kilsyth,
Victoria, Australia)
Sodium Acetate (BDH Chemicals, Australia Pty. Ltd., Kilsth, Victoria, Australia)
Air, Helium, Hydrogen, Nitrogen (BOC Gases, Perth, Australia)
Acetic Acid (Glacial), β-glucuronidase, 2,2,2-Trifluro-N-O-Bis(Trimethylsilyl)
Acetamide (BSTFA), Isovanillin, Malonic Acid (Sigma Chemical Co., St. Louis,
Missouri, USA)
3.1.2 Equipment
Glass vials, glass vial inserts, glass vial caps, and glass vial caps inserts were obtained
from Alltech, Australia.
Derivatising tubes, 6ml glass tubes were obtained from InterPath Services Pty. Ltd.,
Australia.
Gas Chromatography Mass Spectroscopy (GCMS) system used was the HP
ChemStation and HP 5890 gas chromatograph coupled to a HP 5970 mass-selective
Mass Spectrometer obtained from Hewlett-Packard, Rockville, MD, USA. Results
34

were analysed using: HP G1034C MS ChemStation Software; HP-1 cross-linked
methyl silicone column (12×0.20mm, 0.33mm film thickness); HP 1100 series HPLC
system, which consisted of a G1311A QuatPump, G1322A Degasser, and a G1313A
ALS; supercosil C18 reversed-phase column (150mm ×4.6mm, i.d.; particle size
5µm); HP 1049A programmable electrochemical detector (ECD); HP ChemStation
software for LC, Rev. A.06.01 [043] (Copyright, HP 1990 – 1998); HP LaserJet 1100
printer.
3.2 Methods
3.2.1 Synthesis of Standard Isoferulic Acid
10g (0.066mol) isovanillin and 15g (0.144mol) malonic acid were refluxed in
30mls (i.e. 30g, 0.38mol) of pyridine and 0.5ml piperidine for 3h 20min. An equal
amount of HCl as malonic acid was added into the reaction (i.e. 24ml of 6M HCl).
50ml of 32%HCl (10M) was diluted 1:1 in 50ml of DDI, and pre-chilled on ice.
Excess pyridine used in the reflux reaction was flushed out with the ice-cold 5M HCl,
and a white precipitate was formed. The precipitate was filtered and recrystallised
from ethanol, containing a few drops of glacial acetic acid. The glacial acetic acid
was added to maintain the acidic environment. The recrystallising solution was left to
cool overnight at room temperature, as crystals precipitated out of the solution over
the time span. Recrystallised isoferulic acid was filtered and tested for melting point.
The literature melting point of isoferulic acid is 231°C, and the synthesised compound
melted at 232°C. The synthesised compound was further confirmed to be isoferulic
acid by Gas Chromatography coupled Mass Spectroscopy (GCMS).
35

3.2.2 Measurement of Polyphenol Metabolite 4-O-Methyl Gallic
Acid and Isoferulic Acid in Urine Samples
1ml of urine was diluted in 4ml of 0.1M CH3CO2Na buffer, pH 4.6. An
internal standard, 2-hydroxy-3-naphthoic acid (2.5µg/ml, 20µl) and 20µl of β-
glucuronidase were added to the sample, which was incubated at 37ºC for 3h with
half-hourly mixing. The final pH of the mixture was 4.8. After incubation, pH was
adjusted to 1 – 2 before the addition of 4ml of ethyl acetate for 4OMGA extraction.
The sample mixture was mixed vigorously for 1min then centrifuged at 3000×g for
5min. Ethyl acetate layer was back extracted into 3ml of 5% NaHCO3, and the layers
separated by spinning the mixture at 3000×g for 5min. NaHCO3 was acidified with
5M HCl. Phenolic acids were finally extracted into 2ml of ethyl acetate, then dried
under N2 (g). Samples were then derivatised by the addition of 50µl of pyridine and
50µl of BSTFA are incubated at 40°C for 20min. The sample was analysed on the
GCMS.
Samples were injected onto a HP-1 cross-linked methyl silicone column
(12×0.20mm, 0.33mm film thickness, Hewlett-Packard) using He as carrier gas. An
inlet pressure of 30kPa was used and injections were made in a splitless mode. The
initial column temperature of 120ºC was held for 0.5min then programmed at 15ºC to
280ºC, where it was held for 5min. The mass-spectrometer was operated in the
electron impact mode (70eV). SCAN monitoring was carried out to monitor the
major characteristic ions for 4OMGA (M+ = 370) and the molecular ion minus a
methyl group for identification of internal standard (M+-15 = 317). Isoferulic acid
identification was by monitoring for its major characteristic ions at M+-15 = 323 and
M+-15 = 338.
36

CHAPTER 4
DOSE-RESPONSE STUDY
4.1 Introduction
Tea and coffee are widely consumed beverages in contemporary society.
Interest in the potential health effects of these beverages has developed in decades.
Both beverages represent major dietary sources of polyphenols, including the
phenolic acids and flavonoids. Polyphenols found in tea are predominantly
flavonoids, of which up to 15% of the polyphenols are present as free or esterified
gallic acid. Coffee polyphenols, on the other hand, are almost wholly comprised of
chlorogenic acid. Since polyphenols are a class of compound that possess various
biological activities, some of these may have positive effects on human health, such
as the prevention or treatment of chronic diseases.
In order to investigate the relationships of tea and coffee polyphenol intake
and exposure with chronic disease-related endpoints, it is crucial to be able to identify
a biomarker that allows the measurement of dietary polyphenol exposure. For a
compound to be classified as a biomarker, a clear dose-response relationship must be
evident. That is, a linear relationship of the biomarker with exposure is important. A
number of potential biomarkers have been identified in various studies, which
included the specific O-methylated polyphenols derived from in vivo polyphenol
metabolism (Rechner, A. R. et al., 2001; Shahrzad, S. et al., 2001). An example of
these metabolites is 4-O-methylated gallate (4OMGA), the principal metabolite of
gallic acid in humans, and isoferulic acid, a specific metabolite of dietary caffeic acid
derivatives that are abundant in coffee (Olthof, M. F., Hollman, P. C. H. and Katan,
M. B., 2001a; Olthof, M. F. et al., 2001b; Rechner, A. R. et al., 2001).
The objective of this study was to investigate the presence of a dose-response
relationship between tea and coffee intake and urinary excretion of 4OMGA and
isoferulic acid, respectively.
37

4.2 Methods
4.2.1 Study Participants
Eight healthy males and females were recruited to this study. Participants
were non-smokers, had an alcohol intake <20g/day, tea and coffee intake less than 5
cups/d, had no major illness or history of heart disease, were not taking medications,
had normal blood pressure and normocholesterolimia, with body mass index (BMI)
<30kg/m2. The experiment was carried out over ten weeks.
4.2.2 Study Design
In four participants, concentrations of 4OMGA were measured in urine
following ingestion of 250ml of: (1) hot water, (2) 2g of black tea, and (3) 4g of black
tea, in random order, 2 weeks apart, on the same day of the week and at the same time
of day. In another four participants, concentration of isoferulic acid was measured in
urine following ingestion of 250ml of: (1) hot water, (2) 2g of coffee, and (3) 4g
coffee in random order, 2 weeks apart, on the same day of the week and at the same
time of day. Prior to each visit, participants were asked to fast for at least 12 hours,
and not to consume any foods or beverages containing high levels of polyphenols.
Urine samples were collected over the same time intervals on each visit.
Foods and beverages avoided for 24h before the experiment were coffee and
teas (including herbal teas), Coca Cola, Diet Coke, Pepsi, Schweppes Cola, Diet
Pepsi, Jolt Cola, Bicardi or Bourbon and Coke, all chocolate products (cocoa, dark
chocolate, milk chocolate, baker’s or cooking chocolate, chocolate milk, chocolate
flavoured syrup and Milo), and certain pharmaceutical products (Ergodry or Migral
for migraines, Medislim for slimming, No-Doz for staying awake, Travacalm for anti-
nausea, Naturale or Powder Active / Capsules or 4000 Energy Bar for Guarana).
4.2.3 Preparation of Tea and Coffee
Each tea bag containing 2g of tea leaves was brewed in 250ml of hot water
with continuous movement for 5min. The tea or water was consumed over 5 – 10
minutes. Coffee samples of 2g and 4g were weighed out for participants. Coffee was
38

dissolved in 250ml of hot water and consumed over 5 – 10 minutes. All beverages
(including water) were consumed hot and without the addition of milk or sugar.
4.2.4 Urine Sample Collection
Participants provided a spot urine sample on waking in the morning before
each visit. A baseline urine sample was also collected in the department prior to the
drinking of the tea, coffee or hot water. Following the drinking of tea, coffee or hot
water, urine samples were collected from 0 – 6 hour and 6 – 24 hours. 10ml aliquots
of each pool were collected into 5ml sample vials and frozen at –80ºC. 4OMGA and
isoferulic acids excreted were analysed from each sample in relation to the dose of
coffee or tea ingestion.
4.2.5 Recovery Assay
A recovery assay was performed to determine the loss of 4OMGA, if any,
during the extraction described. To do this, standard 4OMGA was prepared by
hydrolysing a sample of methylated-4OMGA. 1mg of Me-4OMGA ester was
dissolved in 1ml of 1M methanolic potassium hydroxide, followed by the addition of
a few drops of double deionised water, which is necessary for the hydrolysis reaction.
The reaction mixture was flushed with nitrogen and incubated for 2 to 3 hours on a
heating block with the temperature set at 45°C. Another 2 to 3ml of double deionised
water was added to the reaction mixture after the incubation to dilute the sample. The
pH of the sample was then adjusted to 3 or 4. 4OMGA was extracted into ethyl
acetate (2ml), after centrifuging at 3,000×g for 5min. The extracted 4OMGA was
dried under nitrogen and reconstituted in 1ml of redistilled ethanol. The standard
4OMGA was sealed and stored at 4°C for later use.
Baseline urine samples from one participant’s water control were used to
check whether the recovery of standard 4OMGA was 100%. Samples were prepared
according to the following scheme (Table 4.1), and 4OMGA was extracted as
described, followed by analysis on the GCMS.
39

Table 4.1 – Sample Preparations for Standard 4-O-Methyl Gallic Acid Recovery Assay
Sample Preparations Purpose of Sample
1 20µL of Internal Standard (50ng) Standard control of AUC.
2 50µL 1mg/mL Standard 4OMGA (50µg) Standard control of AUC.
3 Urine spiked with 50µL of Standard 4OMGA , i.e. 50µg
To assay for possible loss of standards after extraction procedure.
4 20µL of Internal Standard (50ng)+ 50µL of Standard 4OMGA (50µg)
For the determination of AUC ratios of compounds to ensure accuracies of calculations.
4.2.6 Analysis of Urinary 4-O-Methylated Gallic Acid and Isoferulic
Acid
Urinary excretion of 4OMGA and isoferulic acid were measured in urine
samples obtained from the participants after beverage administration. The
compounds were extracted from the urine aliquots as described in Section 3.2.2.
4.3 Results
4.3.1 Identification and Measurement of 4-O-Methyl Gallic Acid and
Isoferulic Acid by GCMS
4OMGA and isoferulic acid were measured against the same internal standard,
2-hydroxy-3-naphthoic acid. Chromatographic details of the ion extraction analysis
of these compounds are given in Figures 4.1, 4.2 and 4.3. Isoferulic acid is a
derivative of ferulic acid, one of the major metabolites of chlorogenic acid. Isoferulic
acid and ferulic acid have the same mass spectrum and, therefore, characteristic ions
of 323 and 338. However, isoferulic acid was eluted just before ferulic acid (Fig.
4.1). This was confirmed by injecting authentic standards. When scanning for the
compounds chromatographically, ion extraction profiles used to identify isoferulic
acid included ions of 323 and 338. The identification of 4OMGA was based on the
elution of its major characteristic ions, which are 370 and 400 (Fig. 4.2). The internal
standard was identified by its major characteristic ion of 317 (Fig. 4.3).
40

Ferulic Acid
Isoferulic Acid
Major characteristic ions of isoferulic acid: 323 & 338
Figure 4.1 – Chromatographic Details of Isoferulic Acid
41

Figure 4.2 – Chromatographic Details of 4OMGA
Major characteristic ions of 4370 & 400
OMGA:
4OMGA
Figure 4.2 – Chromatographic Details of 4-O-Methyl Gallic Acid
42

Major characteristic ion of Internal
Standard: 317
Internal Standard
Figure 4.3 – Chromatographic Details of Internal Standard, 2-Hydroxy-3-Napthoic Acid
43

4.3.2 Results of GCMS Recovery Assay
Concentrations of 4OMGA from samples are calculated from the ratios of
4OMGA and the internal standard, and there is a chance that 4OMGA is lost during
the extraction and or GCMS analysis procedures. Therefore, a recovery assay was
carried out to verify this probability.
This recovery assay showed that the concentrations of standard 4OMGA
added to the urine samples were lowered after the extraction procedure. The decrease
in concentration was approximately 50% (i.e. decreased from 50ng to approximately
25ng after extraction). Although there is a loss of approximately 50% in the urine
spikes, the ratios between the area under the curve (AUC) of 4OMGA and internal
standard did not differ (see Table 4.1 and Table 4.2). Since the concentrations of
4OMGA were calculated from the AUC ratios of 4OMGA and internal standard, this
loss will not influence accuracy of measured concentrations.
4.3.3 Urinary Excretion of 4-O-Methyl Gallic Acid and Isoferulic
Acid
Urinary excretion of 4OMGA and isoferulic acid were calculated for urine
samples obtained for two time periods: 0 to 6h and 6 to 24h after tea and coffee
ingestion. Individual results of urinary excretion of 4OMGA and isoferulic acid
during these time periods are shown in Figures 4.4 and 4.5. A clear dose-response
was observed for 4OMGA in the 0 to 6h and 6 to 24h samples after black tea
ingestion. As the dose of black tea ingested increased, the amount of 4OMGA
excreted in urine also increased proportionally (Table 4.3). The dose-response
observed for the coffee samples was only clear in the 0 to 6h samples and not the 6 to
24h samples. Figure 4.5A shows that as the dose of coffee ingested increased, the
amount of isoferulic acid excreted into the urine also increased. This was also
apparent over 24h (Table 4.3). However, there was considerable variability in
response both between participants and in individual participants. In addition,
isoferulic acid excretion after coffee consumption was >80% less than that of
4OMGA after black tea ingestion for both the 2g and 4g doses.
44

Table 4.2 – Comparisons of Areas under the Curves of Recovery Assay Samples
AUC Sample
4OMGA Internal Standard
AUC Ratios of 4OMGA:Internal
Standard
1 - 1547263 -
2 25502577 - -
3 15722002 710175 22.14
4 26209111 1170574 22.39
Table 4.3 – Mean 24h Urinary Excretion of 4-O-Methyl Gallic Acid and Isoferulic Acid Following Different Doses of Tea and Coffee, respectively.
Doses 0g 2g 4g
Urine Collect at: 0 – 6h 6 – 24h 0 – 6h 6 – 24h 0 – 6h 6 – 24h
4OMGA (µg/mmol
creatinine) from Black Tea
0 0 432.45 ± 287.41
252.869 ± 223.26
938.331 ± 592.65
500.60 ± 333.28
Isoferulic acid (µg/mmol
creatinine) from Coffee
0 0 31.93 ± 53.23 34.53 ± 36.00 241.44 ±
277.73 51.75 ± 45.46
Data is presented as mean ± SD.
4.4 Discussion
Processing and differing methods of preparation of tea or coffee can lead to
substantial differences in chemical composition. However, the final beverages
consistently contain high concentrations of polyphenols, including gallic acid and
chlorogenic acid, respectively. One cup of tea (2 g) will contain about 25 to 50 mg of
free or esterified gallic acid (Hodgson, J. M. et al., 2000) and one cup of coffee (2 g)
will contain 100 to 200 mg of chlorogenic acid as 5-caffeoyl quinic acid (Nardini, M.
et al., 2002).
We proposed that 4OMGA and isoferulic acid might be useful as biomarkers
of tea and coffee-derived polyphenol exposure. They may be used as markers of
intake, compliance, polyphenol absorption and metabolism, and to investigate the
45

relationships with disease-related endpoints. They may have advantages over
assessment of intake where an indication of polyphenol intake and absorption or
metabolism is required. An important criterion for these potential biomarkers is that a
dose-response relationship can be observed.
A
0200400600800
10001200140016001800
Water BT 2g BT 4g
Beverage Ingested
Urin
ary
Excr
etio
n of
4O
MG
A
( µg)
B
0
200
400
600
800
1000
1200
Water BT 2g BT 4g
Beverage Ingested
Urin
ary
Excr
etio
n of
4O
MG
A
( µg)
Figure 4.4 – Individual Urinary Excretion of 4-O-Methyl Gallic Acid from (A) 0 – 6h and (B) 6 – 24h after Ingesting 0g, 2g and 4g of Black Tea ( = participant 1; = participant 2; = participant 3; = participant 4)
46

0
100
200
300
400
500
600
700
Water Coffee 2g Coffee 4g
Beverage Ingested
Urin
ary
Isof
erul
ic A
cid
Excr
etio
n (µ
g)
A
0
20
40
60
80
100
120
Water Coffee 2g Coffee 4g
Beverage Ingested
Urin
ary
Isof
erul
ic A
cid
Excr
etio
n (µ
g)
B
Figure 4.5 – Individual Urinary Excretion of Isoferulic Acid from 0 – 6h (A) and 6 – 24h (B) after Ingesting 0g, 2g and 4g of Coffee ( = participant 1; = participant 3; = participant 3; = participant 4)
In this study, a dose-related increase in urinary excretion of 4OMGA was
found following ingestion of black tea. This supports the suggestion that 4OMGA is
47

a specific and major metabolite of gallic acid metabolism. There was considerable
variability in the 4OMGA response between participants, but there was a consistent
dose-related increase within individual participants. (A more detailed discussion of
4OMGA production and metabolism is presented in Chapter 5, Section 5.4). These
results are an indication that 4OMGA may be a feasible biomarker of tea intake in
humans.
A dose-related increase in urinary excretion of isoferulic acid was also found
following ingestion of coffee. These results are consistent with the suggestion that
isoferulic acid is a specific metabolite derived from chlorogenic acid (Rechner, A. R.
et al., 2001). However, the absolute increase in isoferulic acid was less than that seen
for 4OMGA, despite a larger dose of chlorogenic acid from coffee in comparison to
gallic acid from tea. This suggests that less of the end metabolism of chlorogenic acid
is in the form of isoferulic acid. Isoferulic acid, although a specific metabolite of
chlorogenic acid metabolism, appears not to be a major metabolite. Alternatively, it
may have undergone further metabolism before urinary excretion. In addition, there
was considerable variability in the isoferulic acid response both between participants
and within individual participants. This may be related to the metabolic pathways
involved in isoferulic acid production and metabolism. (A more detailed discussion
of isoferulic acid production and metabolism is presented in Chapter 5, Section 5.4)
48

49
CHAPTER 5
POPULATION STUDIES
5.1 Introduction
Tea and coffee are widely consumed beverages. They can be major dietary
sources of poly-hydroxylated phenolic compounds (polyphenols), including phenolic
acids and flavonoids. Tea contains primarily flavonoids, as well as up to 15% (25-50
mg/cup) of total polyphenols present as free or esterified gallic acid (Hodgson, J. M. et
al., 2000a; Shahrzad, S. et al., 2001). Coffee polyphenols are almost entirely chlorogenic
acid (100-200 mg/cup) (Clifford, M. N., 1999). Polyphenols have a range of activities
(Morton, L. W. et al., 2000) consistent with the potential to impact positively on human
health. Results of population studies showing a higher intake of flavonoids to be
associated with lower risk for chronic diseases would support this hypothesis (Hertog, M.
L. et al., 1995; Knekt, P. et al., 2002).
The identification of biomarkers of dietary polyphenol exposure would provide an
additional tool to investigate relationships with chronic disease-related endpoints.
Several potential biomarkers of exposure to tea or coffee-derived polyphenols have been
identified (Kivits, G. A. A. et al., 1997; Hodgson, J. M. et al., 2000a; Rechner, A., R. et
al., 2001; Shahrzad, S. et al., 2001; Meng, X. F. et al., 2002). These include specific O-
methylated polyphenols derived from in vivo polyphenol metabolism, such as 4-O-
methylgallic acid (4OMGA) and isoferulic acid (Hodgson, J. M. et al., 2000a; Rechner,
A. R. et al., 2001; Shahrzad, S. et al., 2001; Meng, X. R. et al., 2002).
A major metabolite of gallic acid in humans is 4OMGA (Shahrzad, S. & Bitsch, I.,
1998; Hodgson, J. M. et al., 2000a; Shahrzad, S. et al., 2001). 4OMGA has been used to
assess compliance in intervention studies ( Caccetta, R. A. A. et al., 2001; Hodgson, J. M.
et al., 2000b; Hodgson, J. M. et al., 2001; Hodgson, J. M. et al., 2002a; Hodgson, J. M. et
al., 2002b), and as a marker of tea-derived polyphenol metabolism (Hodgson, J. M. et al.,
2003). It has been suggested that 4OMGA could be a biomarker of tea intake (Hodgson,

50
J. M. et al., 2000a), and may be a good marker for tea-derived polyphenol exposure,
which incorporates intake and absorption. The relationship between 4OMGA and tea
intake has not been assessed within populations.
The chlorogenic acid in coffee is present primarily as 5-caffeoyl quinic acid
(chlorogenic acid), which is an ester of caffeic acid with quinic acid (Herrmann, K., 1989;
Clifford, M. N., 1999). Isoferulic acid has been identified as a specific metabolite of
dietary caffeic acid derivatives, and was suggested as a useful biomarker for intake and
metabolism of caffeic acid derivatives from dietary sources (Rechner, A. R. et al., 2001).
Since coffee is a rich dietary source of chlorogenic acid, we proposed that isoferulic acid
might be useful as a biomarker for coffee intake and coffee-derived polyphenol exposure.
The relationship between isoferulic acid and coffee intake has not been assessed within
populations.
The ideal relationship between any exposure and its marker is linear. The major
objective of this study was to explore relationships of 24 h urinary excretion of 4OMGA
and isoferulic acid with usual and current tea and coffee intake in human populations.
5.2 Methods 5.2.1 Study Participants
The relationships of 4OMGA and isoferulic acid with usual (Population 1) and
contemporaneously recorded current (Population 2) tea and coffee intake were
investigated within two populations. For both populations, tea and coffee intake were
assessed in terms of number of cups consumed. Almost all tea intake was black tea with
added milk and most coffee intake was instant coffee. Tea and coffee intakes were not
subcategorised due to small numbers within subcategories. The statistical prevalence
within the population of gastrointestinal or renal disease, which may influence phenolic
acid metabolism, is very low (<2%) and therefore it is considered unlikely that either
disorder influenced the observed relationships.

51
5.2.1.1 Population 1 – Relationship of 4-O-Methyl Gallic Acid and Isoferulic
Acid with Usual Tea and Coffee Intake
Population 1 included 111 participants, comprising 43 men and 68 women with a
mean age of 55.8 (95%CI:53.1,58.5) years, recruited as a representative sample of Anglo-
Celtic men and women residing in Melbourne, Australia (Dalais, F. S. et al., 1998;
Kouris-Blazos, A. et al., 1999). Tea and coffee intake were assessed using a food
frequency questionnaire (Kouris-Blazos, A. et al., 1996). 4OMGA and isoferulic acid
were measured in a 24 h urine sample collected at the time participants filled out the food
frequency questionnaire. The relationships of usual tea and coffee intake with urinary
excretion of 4OMGA and isoferulic acid, respectively, were assessed.
5.2.1.2 Population 2 – Relationship of 4-O-Methyl Gallic Acid and Isoferulic
Acid with Current Tea and Coffee Intake
Population 2 included 344 participants, 50 men and 294 women with a mean age of 71.7
(95%CI: 70.8, 72.6) years, recruited to two studies. The first of these studies included
275 women with a mean age of 75.1 (95%CI:74.8,75.4) years, recruited from the
Western Australian general population of women over 70 years of age (Dick, I. M. et al.,
2002). All participants were healthy and did not have any medical conditions likely to
influence 5 year survival. Although the participants entering the study were weighted in
favour of those in higher socio-economic categories, they did not differ from the whole
population in health resource utilization (Bruce, D. G. et al., 2002). Tea and coffee
intake were assessed using a single interviewer administered 24 h diet recall. Informed
consent was obtained and the Human Rights Committee of the University of Western
Australia approved the study. The second study recruited 69 participants, comprising 50
men and 19 women with a mean age 58.0 (95%CI: 55.3, 60.7) y from the Western
Australian general population to a cross-sectional and case-control study. Participants
involved in this study were recruited on the basis of having normal or elevated blood
pressure. Current tea and coffee intake were assessed using a 24 h beverage intake diary.
Informed consent was obtained and the Royal Perth Hospital Ethics Committee approved
the study.

52
For both studies, a 24 h urine sample was collected for the period corresponding
to that for which tea and coffee intake were assessed. Relationships observed for tea and
coffee intake with 4OMGA and isoferulic acid excretion, respectively, within the two
studies were almost identical. Inclusion of participants from both these studies in
Population 2 allowed analysis in both men and women.
5.2.2 Analysis of Urinary 4-O-Methyl Gallic Acid and Isoferulic Acid
Urinary excretion of 4OMGA and isoferulic acid were measured in urine samples
obtained from the participants after beverage administration. The compounds were
extracted from the urine aliquots as described in 3.2.2.
5.2.3 Statistics
All statistical analyses were performed using SPSS Version 11.5 (Chicago, IL,
USA). Results are presented as means and 95 % confidence intervals (CI) and P<0.05
was used as the level of significance. The creatinine-adjusted urinary concentrations of
4OMGA and isoferulic acid were not normally distributed, and therefore log-transformed
values were used. Univariate associations were assessed using Spearman’s rank
correlation. Linear regression was used to investigate the relationships of 4OMGA and
isoferulic acid with tea and coffee intake after adjustment for potential confounding
factors.
5.3 Results
The relationships of 4OMGA and isoferulic acid with usual tea and coffee intake
were assessed in Population 1, and with current intake in Population 2. The tea and
coffee intake, and the 24 h urinary excretion of 4OMGA and isoferulic acid for each
population are presented in Table 5.1.

53
Table 5.1 – Tea and Coffee Intake, and Mean 24-hour Urinary Excretion of 4-O-Methyl Gallic Acid and Isoferulic Acid for Two Populations: Usual Tea and Coffee Intake was Assessed in Population One and Current Tea and Coffee Intake was Assessed in Population Two
Population 1 (n=111):
Usual intake Population 2 (n=344):
Current intake Mean 95% CI Mean 95% CI
Tea intake (cups/d) 2.49 (2.05,2.93) 1.99 (1.80,2.18)
Coffee intake (cups/d) 1.56 (1.23,1.90) 1.28 (0.98,1.52)
4-O-methylgallic acid
(µg/mmol creatinine)1 42.1 (29.0,61.2) 38.9 (30.9,49.3)
Isoferulic acid (µg/mmol
creatinine) 1 11.1 (8.8,14.1) 7.8 (6.4,9.5)
1 Results are geometric mean and 95% confidence intervals
4OMGA was strongly related to usual (r = 0.50, P < 0.001) and current (r = 0.57, P
< 0.001) tea intake. Isoferulic acid, by comparison, was less strongly related to coffee
intake, but the results were, nevertheless significant (usual intake: r = 0.26, P = 0.008 and
current intake: r = 0.18, P < 0.001) coffee intake. Figures 5.1A and B show the
relationship between 4OMGA and current and usual tea intake. Figures 5.2A and B show
the relationship between isoferulic acid and current and usual coffee intake. The
relationship observed between urinary isoferulic acid and usual and actual coffee intake is
clear but weak. The results for both current and usual intake of tea and coffee were
adjusted for age, sex and source of study participants. These adjustments did not alter the
observed relationships.
The relationships of 4OMGA and isoferulic acid with current tea and coffee
intake, respectively, are summarised in Figure 5.3. A cut-off concentration for 4OMGA
excretion of 25µg/mmol creatinine had 82% sensitivity and 81% specificity for prediction
of tea drinking status. A cut-off concentration for isoferulic acid excretion of 5 µg/mmol
creatinine had 61% sensitivity and 57% specificity for prediction of coffee drinking status.
The relationships of 4OMGA and isoferulic acid with usual tea and coffee intake,
respectively, are summarised in Figure 5.4.

14
A 12
10 U
sual
tea
inta
ke (c
ups/
day)
8 R2 = 0.254
6
4
2
0
0 2 4 6 8 10 Ln 4-O-methylgallic acid concentration (µg/mmol creatinine)
12
54
Figure 5.1 – Graphs Showing the Relationship of Urinary 4-O-Methyl Gallic Acid with (A) Usual Tea Intake and (B) Actual Tea Intake
10 8 6420
10
8
6
4
2
0
R2 = 0.307
B
Act
ual t
ea in
take
(cup
s)
Ln 4-O-methylgallic acid concentration (µg/mmol creatinine)

10
A 8 U
sual
cof
fee
inta
ke (c
ups/
day)
R2 = 0.066 6
4
2
0
0 1 2 3 4 5 6
Ln isoferulic acid concentration (µg/mmol creatinine)
10
55
Figure 5.2 – Graphs Showing the Relationship of Urinary Isoferulic Acid with (A) Usual Coffee Intake and (B) Actual Coffee Intake
8 6 42 0
8
6
4
2
0
R2 = 0.037
B
Cur
rent
cof
fee
inta
ke (c
ups)
Ln isoferulic acid concentration (µg/mmol creatinine)
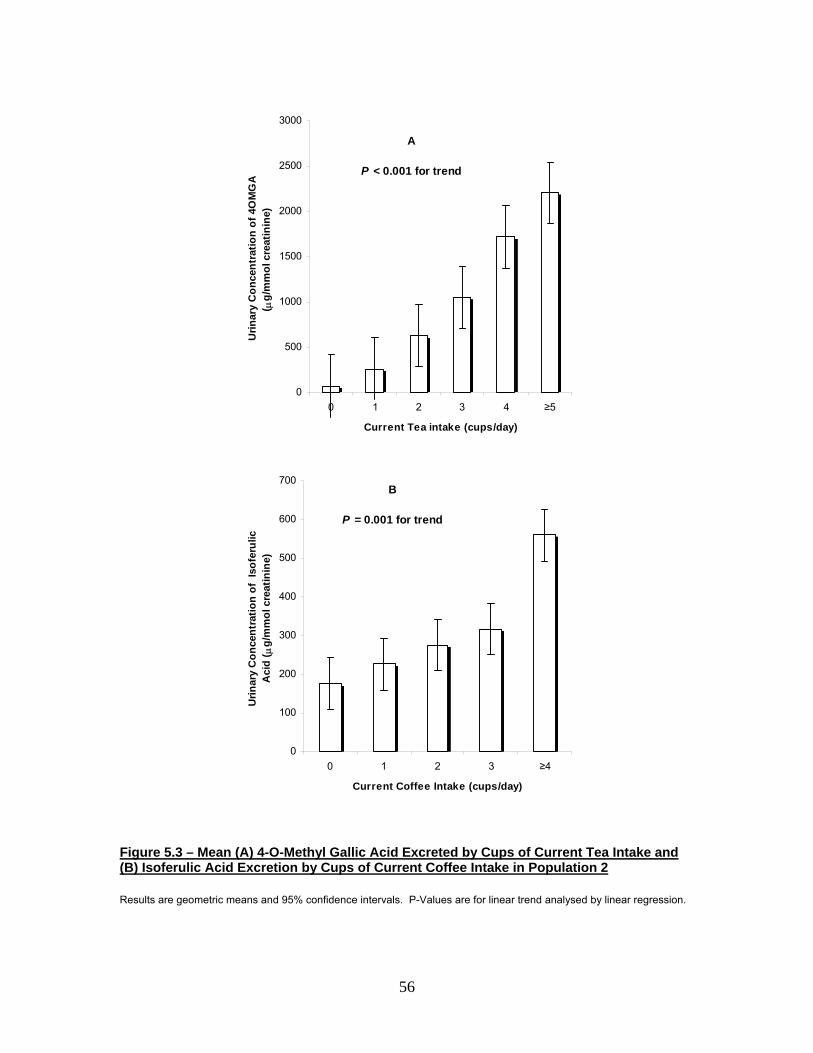
A
P < 0.001 for trend
0
500
1000
1500
2000
2500
3000
0 1 2 3 4 ≥5
Current Tea intake (cups/day)
Urin
ary
Con
cent
ratio
n of
4O
MG
A
( µg/
mm
ol c
reat
inin
e)
B
P = 0.001 for trend
0
100
200
300
400
500
600
700
0 1 2 3 ≥4
Current Coffee Intake (cups/day)
Urin
ary
Con
cent
ratio
n of
Iso
feru
lic
Aci
d ( µ
g/m
mol
cre
atin
ine)
Figure 5.3 – Mean (A) 4-O-Methyl Gallic Acid Excreted by Cups of Current Tea Intake and (B) Isoferulic Acid Excretion by Cups of Current Coffee Intake in Population 2
Results are geometric means and 95% confidence intervals. P-Values are for linear trend analysed by linear regression.
56
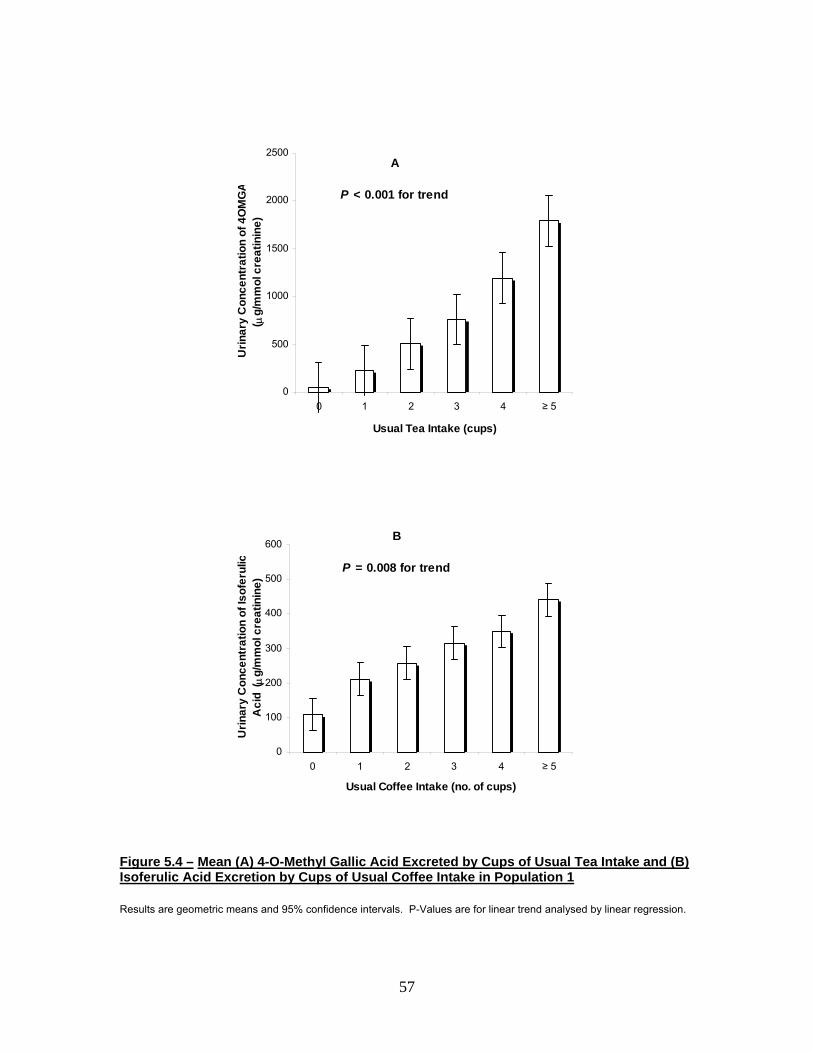
A
P < 0.001 for trend
0
500
1000
1500
2000
2500
0 1 2 3 4 ≥ 5
Usual Tea Intake (cups)
Urin
ary
Con
cent
ratio
n of
4O
MG
A( µ
g/m
mol
cre
atin
ine)
B
P = 0.008 for trend
0
100
200
300
400
500
600
0 1 2 3 4 ≥ 5
Usual Coffee Intake (no. of cups)
Urin
ary
Con
cent
ratio
n of
Isof
erul
icA
cid
( µg/
mm
ol c
reat
inin
e)
Figure 5.4 – Mean (A) 4-O-Methyl Gallic Acid Excreted by Cups of Usual Tea Intake and (B) Isoferulic Acid Excretion by Cups of Usual Coffee Intake in Population 1
Results are geometric means and 95% confidence intervals. P-Values are for linear trend analysed by linear regression.
57

58
5.4 Discussion
Tea and coffee are rich dietary sources of polyphenols. All tea derives from the plant Camellia sinensis. Coffee can be obtained from several Coffea species, with C. Arabica representing most of the world’s coffee production. Tea can be processed into a variety of types, the two main types being black and green. Promoting the enzymatic oxidation of polyphenols produces black teas, whereas enzymes involved in polyphenol oxidation are inactivated in the production of green tea. Production of black tea results in changes to polyphenol structure and composition, including increased free gallic acid concentrations. Coffee can also be processed and prepared for drinking in a range of ways. Processing and differing methods of preparation of tea or coffee can lead to substantial differences in chemical composition. However, the final beverages consistently contain high concentrations of polyphenols, including gallic acid and chlorogenic acid, respectively.
Identification of biomarkers of intake of, and exposure to tea and coffee-derived polyphenols has not been straightforward. This has been largely due to the complex nature of many of the polyphenols present in tea, and the lack of knowledge regarding polyphenol metabolism. We proposed that 4OMGA and isoferulic acid might be useful as biomarkers of tea and coffee-derived polyphenol exposure, and may be used as markers of intake, compliance, polyphenol absorption and metabolism, and to investigate the relationships with disease-related endpoints. 4OMGA and isoferulic acid may have advantages over assessment of intake where an indication of polyphenol intake and absorption or metabolism is required.
Following ingestion of black tea, most urinary 4OMGA is likely to be derived from free, rather than esterified gallic acid. Much of the gallic acid present in black tea is free gallic acid, whereas green tea, which has similar total gallic acid present as gallate esters, contains little free gallic acid (Harbowy, M. E. & Ballentine, D. A., 1997, Hodgson, , J. M. et al., 2000a). Hodgson et al. (2000b) have previously shown that following a set dose of black and green tea, the increase in urinary 4OMGA was 3-fold greater for black tea. Free gallic acid may be absorbed in the small intestine, transported to the liver where O-methylation and glucuronidation occurs, then excreted.

59
In contrast, most urinary isoferulic acid derives from cleavage of the caffeoyl quinic acid derivatives. This is likely to occur in the large intestine via esterase activity of gut microflora (Plumb, G. W. et al., 1999, Rechner, A. R. et al., 2001). Gallic acid may also be released from larger flavonoids containing gallate esters by the same means. The observed increase in urinary 4OMGA excretion following ingestion of green tea is consistent with this suggestion (Hodgson, J. M. et al., 2000b). The free caffeic acid or gallic acid released may then be absorbed, transported to the liver where O-methylation to isoferulic acid and 4OMGA, respectively, and glucuronidation occurs, then excreted. Alternatively, the gut microflora could also be responsible for O-methylation, with the compounds absorbed in this form (Chesson, A. et al., 1999). In addition, the phenolic acids may be further metabolised to smaller molecular weight compounds (Scalbert, A. and Williamson, G. 2000).
Peak plasma concentrations of phenolic acids occur about 1 to 2 h after ingestion (Shahrzad, S. et al., 2001, Nardini, M. et al., 2002). The precise time may relate to the location of absorption: small or large intestine. Incorporation into tissues is possible (Youdim, K. A., Martin, A. and Joseph, J. A., 2000), but is likely to be small. The O-methylated phenolic acids are then rapidly excreted and fully eliminated from plasma within 12 to 24 h (Shahrzad, S. et al., 2001). Therefore, 24 h urine samples will provide a better indication of short term consumption pattern and exposure than plasma measurements.
Urinary 4OMGA excretion was related to both usual and current tea intake. As might be expected, urinary 4OMGA predicted more of the variance in current tea intake than usual tea intake. However, the strength of the relationship was only slightly weaker for usual intake, suggesting that current tea consumption strongly predicts usual consumption. Although the mean 4OMGA concentrations were low in participants not drinking tea (Fig. 5.3A and 5.4A), the presence of 4OMGA in a substantial number of these participants is suggestive of other dietary sources. Therefore, some of the unexplained variance may be due to the presence of other dietary sources of gallic acid (Herrmann, K., 1989; Caccetta, A. et al., 2001), but in comparison to tea, their contribution is likely to be minor. It was also seen that the specificity and sensitivity of 4OMGA prediction in usual tea intake dropped radically despite the same relationship being observed in current tea intake. Hodgson et al. (2003) have previously found that

60
regardless of background, diet urinary excretion of 4OMGA increases at least 3-fold and up to14-fold following an increase in regular ingestion of black tea by 5 cups/d. In addition, the 4OMGA response to a given dose of gallic acid is highly variable, and there are errors in estimation of intake, and variations in the strength of tea and coffee ingested. However, overall the results are consistent with the proposal that 24 h excretion of 4OMGA provides a good biomarker of exposure to tea-derived polyphenols, and a reasonable estimate of intake.
Isoferulic acid was significantly related to coffee intake, but the relationship was weak (Fig. 5.2A and B). The results are consistent with the suggestion that isoferulic acid is a specific metabolite derived from chlorogenic acid (Rechner, A. R. et al., 2001). However, less than 7% of the variance in coffee intake was explained by isoferulic acid excretion, and the absolute increase in isoferulic acid was less than that seen for 4OMGA. This suggests that less of the end metabolism of chlorogenic acid is in the form of isoferulic acid. The weak relationship may be due to the presence of other dietary sources of caffeic acid derivatives as well as variability in isoferulic acid excretion in response to a given dose of chlorogenic acid. The presence of isoferulic acid in those not drinking coffee within the population studies is suggestive of other dietary sources. Therefore, isoferulic acid, although a specific metabolite of chlorogenic acid metabolism, appears not to be a major metabolite. Alternatively, it may have undergone further metabolism before urinary excretion. Differences in metabolism between free and esterified phenolic acids may help to further explain the weak association of isoferulic acid with coffee intake.
Overall, our results are consistent with the proposal that 4OMGA can be used as a biomarker for tea intake, and may provide a good indication of exposure to tea-derived polyphenols. However, isoferulic acid is quantitatively a minor metabolite in the metabolism of caffeic acid derivatives. Although isoferulic acid was significantly related to coffee intake in the population studies, the relationship was weak, limiting its usefulness as a potential biomarker of intake of coffee-derived polyphenols.

61
CHAPTER 6
FINAL DISCUSSION AND FUTURE DIRECTIONS
Tea and coffee are rich dietary sources of polyphenols. Dietary polyphenols,
including those derived from tea and coffee, are thought to have a variety of health-
related effects. Typically, one cup of tea brewed from 2g of tea will contain
approximately 200 to 400mg of total polyphenols and 25 to 50mg of total gallic acid,
whilst one cup of coffee brewed from 2g of coffee powder will contain 100 to 200mg
of chlorogenic acid as 4-caffeoyl quinic acid. However, as a result of different
processing and brewing methods applied in the manufacture and preparation of tea
and coffee, the composition and concentration of polyphenols in the final brew can be
influenced. The result is that exposure to tea and coffee-derived polyphenolic
compounds may be poorly estimated using an assessment of number of cups ingested
per day. Identification of biomarkers of exposure to tea and coffee-derived
polyphenols may, therefore, provide a better indicator of exposure than estimated
intake in cups.
It was proposed that 4OMGA and isoferulic acid may be useful biomarkers for
tea and coffee-derived polyphenol exposure. Given that the ideal relationship between
any exposure and its marker is linear, the major objectives were to establish a dose-
response relationship of 24h urinary excretions of 4OMGA and isoferulic acid
following ingestions of black tea and coffee of different strengths, and to explore
relationships of tea and coffee intake with 24h urinary excretion of 4OMGA and
isoferulic acid in human populations. Two studies were used to address these
objectives.
In the first study, a dose-related increase in urinary 4OMGA and isoferulic
acid excretion after the ingestion of black tea and coffee, respectively, was shown.
These results support the suggestion that 4OMGA and isoferulic acid are specific
metabolites of tea and coffee-derived polyphenols. It was also found that following a
fixed dose of tea or coffee, most of the 4OMGA and isoferulic acid was excreted
within the first 6 hours. These results are consistent with previous studies of
polyphenol metabolism.

62
In the second study, it was found that urinary 4OMGA excretion was related
to both usual and current tea intake. Up to 30% of the variance in tea intake was
predicted by 4OMGA in the populations studied. The unexplained variance is likely
to be due to the presence of other dietary sources of gallic acid, as well as inter-
individual variation in 4OMGA response to a given dose of tea. However, the results
of this study, as well as previous studies, suggest that tea-derived gallic acid is the
primary contributor to urinary 4OMGA excretion within the populations.
Future intervention studies with black tea can now use 24 h urinary excretion
of 4OMGA as an indicator of compliance. In addition, the measurement of 4OMGA
in cross-sectional and prospective population studies could be used as a biomarker of
tea-derived polyphenol exposure. If tea polyphenols are responsible for any health-
related effects, measurements of 4OMGA may be more strongly associated with
specific endpoints than estimation of tea intake in terms of cups consumed.
Isoferulic acid excretion was also associated with both usual and current
coffee intake. However, despite the fact that the chlorogenic acid content of coffee is
considerably higher than the content of gallic acid in tea, the increase in urinary
isoferulic acid was lower than that of urinary 4OMGA. This suggests that isoferulic
acid is not the major end product of chlorogenic acid metabolism, and although
isoferulic acid is a specific metabolite of chlorogenic acid metabolism, it is not a
major metabolite. Alternatively, it is possible that isoferulic acid may undergo further
metabolism before urinary excretion.
Future work may look at alternative potential biomarkers of exposure to
coffee-derived polyphenols. Although isoferulic acid is a specific metabolite of
chlorogenic acid, its feasibility of acting as a biomarker for coffee-derived polyphenol
exposure is questionable since it is also rich in other foodstuff such as plums.
Isoferulic acid may be of use in intervention studies to monitor compliance, but
measurement of 24 h excretion in cross-sectional and prospective population studies
is unlikely to provide a better indicator of coffee-derived polyphenol exposure than
assessment of intake in terms of cups consumed.
Overall, the studies are consistent with the proposal that 4OMGA is a good
biomarker for black tea-derived polyphenol exposure, but isoferulic acid may be of
limited value as a biomarker for coffee-derived polyphenol exposure.
REFERENCES
1. Abe, I., Seki, T., Umehara, K., Miyase, T., Noguchi, J., Sakakibara, J., Ono, T. (2000). Green Tea Polyphenols: Novel and Potent Inhibitors of Squalene Epoxidase. Biochemical and Biophysical Research Communications 268: 767 - 771.
2. Abe, I., Seki, T., Noguchi, H. (2000). Potent and Selective Inhibition of
Squalene Epoxidase by Synthetic Galloyl Esters. Biochemical and Biophysical Research Communications 370: 137 - 140.
3. Ahmad, N., Gupta, S., Mukhtar, H. (2000). Green Tea Polyphenol
Epigallocatechin-3-Gallate Differentially Modulates Nuclear Factor κB in Cancer Cells versus Normal Cells. Archives of Biochemistry and Biophysics 376: 338 - 346.
4. Astill, C., Birch, M. R., Dacombe, C., Humphrey, P. G., Martin, P. T. (2001).
Factors Affecting the Caffeine and Polyphenol Contents of Black and Green Tea Infusions. Journal of Agricultural Food Chemistry 49: 5340 - 5347.
5. Bagchi, D., Garg, A., Krohn, R. L., Bagchi, M., Tran, M. X., Stohs, S. J.
(1997). Oxygen Free Radical Scavenging Abilities of Vitamins C and E, and a Grape Seed Proanthocyanidin Extract in vitro. Research Communications in Molecular Pathology and Pharmacology 95: 179 - 189.
6. Bailey, R. G., McDowell, I., Nursten, H. E. (1990). Use of an HPLC
Photodiode-Array Detector in a Study of the Nature of a Black Tea Liquor. Journal of the Science of Food and Agriculture 52: 509 - 525.
7. Balentine, D. A., Wiseman, S. A., Bouwens, L. C. M. (1997). The Chemistry
of Tea Flavonoids. Critical Reviews in Food Science and Nutrition 37: 693 - 704.
8. Banks, B. A., Seri, I., Ischiropoulos, H., Merrill, J., Rychik, J., Ballard, R. A.
(1999). Changes in Oxygenation With Inhaled Nitric Oxide in Severe Bronchopulmonary Dysplasia. Pediatrics 103: 610 - 618.
9. Beecher, G. R., Warden, B. A., Merken, H. (1999). Analysis of Tea
Polyphenols. Proceedings of the Society for Experimental Biology & Medicine 220: 267 - 270.
10. Beretz, A., Cazenave, J. P., Anton, R. (1982). Inhibition of Aggregation and
Secretion of Human Platelets by Quercetin and Other Flavonoids: Structure-Activity Relationships. Agents and Actions 12: 382 - 387.
11. Berthaud, J., Charrier, A. (1988). Genetic Resources of Coffea. Coffee Volume
4 Agronomy. Clarke, R. J. and Macrae, R. (Editors), New York, Elsevier Applied Science Ltd. 4: 1 - 40.
63

12. Blanck, H. M., Bowan, B. A., Cooper, G. R., Myers, G. L., Miller, D. T.
(2003). Laboratory Issues: Use of Nutritional Biomarkers. The Journal of Nutrition 133 (Supplement 3): 888S - 894S.
13. Bors, W. Heller, W., Michel, C., Saran, M. (1983). Flavonoids as
Antioxidants: Determination of Radical-Scavenging Efficiencies. Methods in Enzymology 186: 343 - 355.
14. Bruce, D. G., Devin, A., Prince, R. L. (2002). Recreational Physical Activity
Levels in Healthy Older Women: The Importance of Fear of Falling. Journal of American Geriatric Society 50: 84 - 89.
15. Caccetta, R. A. A., Burke, V., Mori, T. A., Beilin, L. J., Puddey, I. B., Croft, K.
D. (2001). Red Wine Polyphenols, in the Absence of Alcohol, Reduce Lipid Peroxidative Stress in Smoking Subjects. Free Radical Biology and Medicine 30: 636 - 642.
16. Cambrony, H. R. (1988). Arabusta and Other Interspecific Fertile Hybrids.
Coffee Volume 4 Agronomy. Clarke, R. J. and Macrae, R. (Editors), New York, Elsevier Applied Science Ltd. 4: 263 - 290.
17. Cao, J., Xu, Y., Chen, J., Klaunig, J. E. (1996). Chemopreventive Effects of
Green and Black Tea on Pulmonary and Hepatic Carcinogenesis. Fundamental and Applied Toxicology 29: 224 - 250.
18. Carvalho, A. (1988). Principles and Practice of Coffee Plant Breeding for
Productivity and Quality Factors: Coffea Arabica. Coffee Volume 4 Agronomy. Clarke, R. J. and Macrae, R. (Editors), New York, Elsevier Applied Science Ltd. 4: 129 - 160.
19. Chatterjee, M. L., Agarwal, R., Mukhtar, H. (1998). Ultraviolet B Radiation-
Induced DNA Lesions in Mouse Epidermis: An Assessment Using a Novel 32P-Postlabelling Technique. Biochemical and Biophysical Research Communications 229: 590 - 595.
20. Chesson, A., Provan, G. J., Russell, W. R. (1999). Hydroxycinnamic Acids in
the Digestive Tract of Livestock and Humans. Journal of the Science of Food and Agriculture 79: 373 - 378.
21. Chou, T. M., Benowitz, N. L. (1994). Caffeine and Coffee - Effects on Health
and Cardiovascular Disease. Comparative Biochemistry & Physiology, Comparative Pharmacology & Toxicology. 109: 173 - 189.
22. Chugh, A., Ray, A., Gupta, J. B. (2003). Squalene Epoxidase as
Hypocholesterolemic Drug Target Revisited. Progress in Lipid Research 42: 37 - 50.
64

23. Clifford, M. N. (1999). Chlorogenic Acids and Other Cinnamates - Nature, Occurrence and Dietary Burden. Journal of the Science of Food and Agriculture 79: 362 - 372.
24. Dalais, F. S., Rice, G. E., Wahlqvist, M. L., Hsu-Hage, B. H. H.,
Wattanapenpaiboon, N. (1998). Urinary Excretion of Isoflavonoid Phytoestrogens in Chinese and Anglo-Celtic Populations in Australia. Nutritional Research 18: 1703 - 1709.
25. Dalluge, J. J., Nelson, B. C. (2000). Determination of Tea Catechins. Journal
of Chromatography A 881: 411 - 424. 26. Das, S. K., Tewari, V. K. (2002). Chemical Constituents of Tea Shoots and
Made Tea: A Review: Unpublished article. 27. de Lorgeril, M. S. P. (1999). Wine Ethanol, Platelets, and Mediterranean Diet.
The Lancet 353: 1067. 28. del Castillo, M. D., Ames, J. M., Gordon, M. H. (2002). Effect of Roasting on
the Antioxidant Activity of Coffee Brews. Journal of Agricultural Food Chemistry 50: 2698 - 3703.
29. Demrow, H. S., Slane, P. R., Folts, J. D. (1995). Administration of Wine and
Grape Juice Inhibits in vivo Platelet Activity and Thrombosis in Stenosed Canine Coronary Arteries. Circulation 91: 1182 - 1188.
30. Dick, I. M., Devine, A., Marangou, A., Dhaliwal, S. S., Laws, S., Martins, R.
N., Prince, R. L. (2002). Apolipoprotein E4 is Associated with Reduced Calcaneal Quantitative Ultrasound Measurements and Bone Mineral Density in Elderly Women. Bone 31: 497 - 502.
31. Drewnowski, A. (2001). The Science and Complexity of Bitter Taste.
Nutrition Reviews 59: 163 - 169. 32. Duffy, S. J., Vita, J. A., Holbrook, M., Swerdloff, P. L., Keaney, J. F. Jr.
(2001). Effect of Acute and Chronic Tea Consumption on Platelet Aggregation in Patients with Coronary Artery Disease. Arteriosclerosis, Thrombosis and Vascular Biology 21: 1084 - 1089.
33. Erlund, I., Meririnne, E., Alfthan, G., Aro, A. (2001). Plasma Kinetics and
Urinary Excretion of the Flavanones Naringenin and Hesperetine in Humans after Ingestion of Orange Juice and Grapefruit Juice. Journal of Nutrition 131: 235 - 241.
34. Facino, R. M., Carini, M., Aldini, G., Bombardelli, E., Morazzoni, P., Morelli,
R. (1994). Free Radicals Scavenging Action and Anto-Enzyme Activities of Procyanidines from Vitis vinifera. Arzneimittel-Forschung 44: 592 - 601.
35. Finger, A., Kuhr, S., Engelhardt, U. H. (1992). Chromatography of Tea
Constituents. Journal of Chromatography 624: 293 - 315.
65

36. Folts, J. D. (1998). Antithrombotic Potential of Grape Juice and Red Wine for
Preventing Heart Attacks. Pharmaceutical Biotechnology 36 (Supplement): 21 - 27.
37. Folts, J. D. (2002). Potential Health Benefits from the Flavonoids in Grape
Products on Vascular Disease. Advances in Experimental Medicine and Biology 505: 95 - 111.
38. Frankel, E. N., Kanner, J. German, J. B., Parks, E., Kinsella, J. E. (1993).
Inhibition of Oxidation of Human Low-Density Lipoprotein by Phenolic Substances in Red Wine. Lancet 341: 454 - 457.
39. Frankel, E. N., Waterhouse, A. L., Teissedre, P. L. (1995). Principal Phenolic
Phytochemicals in Selected California Wines and Their Antioxidant Activity in Inhibiting Oxidation of Human Low-Density Lipoproteins. Journal of Agricultural Food Chemistry 43: 890 - 894.
40. Fukuyo, M., Hara, Y., Muramatsu, K. (1986). Effect of Tea Leaf Catechin, (-)-
Epigallocatechin Gallate, on Plasma Chloresterol Level in Rats. Journal of Japananese Society of Nutrition and Food Science 39: 495 - 500.
41. Gao, Y. T., McLaughlin, J. K., Blot, W. J., Ji, B. T., Dai, A., Fraumeni, J. R. Jr.
(1994). Reduced Risk of Esophageal Cancer Associated with Green Tea Consumption. Journal of National Cancer Institute 86: 885 - 858.
42. Greenwalt, C. J., Ledford, R. A., Steinkraus, K. H. (1998). Determination and
Characterization of the Antimicrobial Activity of the Fermented Tea Kombucha. Lebensmittle Wissenschaft Und Technologie 31: 291 - 296.
43. Griffiths, H. R., Moller, L., Bartosz, G., Bast, A., Bertoni-Freddari, C., Collins,
A., Cooke, M., Coolen, S., Haenen, G., Hoberg, A-M., Loft, S., Lunec, J., Olinski, R., Parry, J., Pompella, A., Poulsen, H., Verhagen, H., Astley, S. B. (2002). Biomarkers. Molecular Aspects of Medicine 23: 101 - 208.
44. Groisser, D. S. (1978). A Study of Caffeine in Tea. The American Journal of
Clinical Nutrition 31: 1727 - 1731. 45. Guerrero, G., Suarez, M. (2001). Chlorogenic Acids as a Potential Criterion in
Coffee Genotype Selections. Journal of Agricultural Food Chemistry 49: 2454 - 2458.
46. Hakim, I. A., Alsaif, M. A., Alduwaihy, M., Al-Rubeaan, K., Al-Nuaim, A. R.,
Al-Attas, O. S. (2003). "Tea Consumption and the Prevalence of Coronary Heart Disease in Saudi Adults: Results from a Saudi National Study." Preventive Medicine 36: 64 - 70.
47. Hanasaki, Y., Ogawa, S., Fukui, S. (1994). The Correlation between Active
Oxygens Scavenging and Antioxidative Effects of Flavonoids. Free Radical Biology and Medicine 16: 845 - 850.
66

48. Halder, J., Bhaduri, A. N. (1998). Protective Role of Black Tea Against
Oxidative Damage of Human Red Blood Cells. Biochemical and Biophysical Research Communications 224: 903 - 907.
49. Harborne, J. G. and Williams, C. A. (2001). Anthocyanins and Other
Flavonoids. The Royal Society of Chemistry 18: 340 - 333. 50. Harbowy, M. E., Balentine, D. A. (1997). Tea Chemistry. Critical Reviews in
Plant Sciences 16: 415 - 480. 51. He, Y. H., Kies, C. (1994). Green and Black Tea Consumption by Humans:
Impact on Polyphenol Concentrations in Faeces, Blood and Urine. Plant Foods for Human Nutrition 46: 221 - 229.
52. Herrmann, K. (1989). Occurrence and Content of Hydroxycinnamic and
Hydroxybenzoic Acid Compounds in Foods. Critical Review in Food Science and Nutrition 28: 315 - 347.
53. Hertog, M. G. L., Feskens, E. J. M., Hollman, P. C. J., Katan, M. B.,
Kromhout, D. (1993a). Dietary Antioxidant Flavonoids and Risk of Coronary Heart Disease: The Zutphen Elderly Study. Lancet 142: 1007 - 1011.
54. Hertog, M. G. L., Hollman, P. C. H., Katan, M. B., Kromhout, D. (1993b).
Intake of Potentially Anticarcinogenic Flavonoids and Their Determinants in Adults in the Netherlands. Nutrition and Cancer 20: 21 - 29.
55. Hertog, M. G., Kromhout, D., Aravanic, C., Blackburn, H., Buzina R., Fidanza
F., Giampaoli, S., Jansen, A., Menotti, A., Nedeljkovic, S., Pekkarinen, M., Simic, B.S., Toshima, J., Feskens, E. J. M., Hollman, P. C. H., Katan, M. B. (1995). Flavonoid Intake and Long-Term Risk of Coronary Heart Disease and Cancer in the Seven Countries Study. Archives of Internal Medicine 155: 381 - 386.
56. Hindmarch, I., Quinlan, P. T., Moore, K. L., Parkin, C. (1998). The Effects of
Black Tea and Other Beverages on Aspects of Cognition and Psychomotor Performance. Psychopharmacology 139: 230 - 238.
57. Hodgson, J. M., Burke, V., Beilin, L. J., Croft, K. D., Puddey, I. B. (2003).
Can Black Tea Influence Plasma Total Homocysteine Concentrations? American Journal of Clinical Nutrition 77: 907 - 911.
58. Hodgson, J. M., Croft, K. D., Mori, T. A., Burke, V., Beilin, L. J., Puddey, I.
B. (2002a). Regular Ingestion of Tea Does Not Inhibit in vivo Lipid Peroxidation in Humans. Journal of Nutrition 132: 55 - 58.
59. Hodgson, J. M., Morton, L. W., Puddey, I. B., Beilin, L. J., Croft, K. D.
(2000a). Gallic Acid Metabolites are Markers of Black Tea Intake in Humans. Journal of Agricultural Food Chemistry 48: 2276 - 2280.
67

60. Hodgson, J. M., Puddey, I. B., Burke, V., Watts, G. F., Beilin, L. J. (2002b). Regular Ingestion of Black Tea Improves Brachial Artery Vasodilator Function. Clinical Science 102: 195 - 201.
61. Hodgson, J. M., Puddey, I. B., Croft, K. D., Burke, V., Mori, T. A., Caccetta,
R. A.A., Beilin, L. J. (2000b). Acute Effects of Ingestion of Black and Green Tea on Lipoprotein Oxidation. American Journal of Clinical Nutrition 71: 1103 - 1107.
62. Hodgson, J. M., Puddey, I. B., Mori, T. A., Burke, V., Baker, R. I., Beilin, L. J.
(2001). Effects of Regular Ingestion of Black Tea on Haemostasis and Cell Adhesion Molecules in Humans. European Journal of Clinical Nutrition 55: 881 - 886.
63. Hollman, P. C. H. (1997). Bioavailability of Flavonoids. European Journal of
Clinical Nutrition 51 (Supplement 1): S66 - S69. 64. Hollman, P. C. H., Tijburg, L. B. M, Yang, C. S. (1997). Bioavailability of
Flavonoids from Tea. Critical Reviews in Food Science and Nutrition 37: 719 - 738.
65. Hu, J. P., Calomme, M., Lasure, A., De Bruyne, T., Peiters, L., Vlietinck, A.,
Vanden Berghe, D. A. (1995). Structure-Activity Relationship of Flavonoids with Superoxide Scavenging Activity. Biological Trace Element Research 47: 327 - 331.
66. Husain, S. R., Cillard, J., Collard, P. (1987). Hydroxyl Radical Scavenging
Activity of Flavonoids. Phytochemistry 26: 2489 - 2491. 67. Iijima, K., Yoshizumi, M., Hashimoto, M., Kim, S., Eto, M., Ako, J. Liang,
Y.Q., Sudoh, N., Hosoda, K., Nakahara, K., Toba, K., Ouchi, Y. (2000). Red Wine Polyphenols Inhibit Proliferation of Vascular Smooth Muscle Cells and Down-regulate Expression of Cyclin A Gene. Circulation: Journal of the American Heart Association 101: 805 - 905.
68. Imai, K., Litt, D., Suga, K., Nakachi, K. (1997). Cancer-Preventive Effects of
Drinking Green Tea Among a Japanese Population. Preventive Medicine 26: 769 - 775.
69. Islam, S., Islam, N., Kemode, T., Jonstone, B., Mukhtar, H., Moskowitz, R.
W., Goldberg, V. M., Malemund, C. J., Haqqi, T. M. (2000). Involvement of Caspase-3 in Epigallocatechin-3-Gallate Mediated Apoptosis of Human Chondrosarcoma Cells. Biochemical and Biophysical Research Communications 270: 793 - 797.
70. Jankun, J., Sleman, S. H., Swiercz, R., Skrzypczak-Jankun, E. (1997). Why
Drinking Green Tea Could Prevent Cancer. Nature 387(6633): 561.
68

71. Jovanovic, S. V., Steenken, S., Tosic, M., Marjanovic, B., Simic, M. G. (1994). Flavonoids as Antioxidants. Journal of the American Chemical Society 116: 4846 - 4851.
72. Katan, M. B. (1997). Flavonoids and Heart Disease. American Journal of
Clinical Nutrition 65: 1542 - 1543. 73. Kanner, J., Frankel, E., Granit, R., German, B., Kinsella, J. E. (1994). Natural
Antioxidants in Grapes and Wines. Journal of Agricultural Food Chemistry 116: 64 - 69.
74. Katiyar, S. K., Ahmad, N., Mukhtar, H. (2000). Green Tea and Skin. Archives
of Dermatology 136: 989 - 994. 75. Keli, S. O., Hertong, M. G. L., Feskens, E. J. M., Kromhout, D. (1996).
Dietary Flavonoids, Antioxidant Vitamins, and Incidence of Stroke. Archives of Internal Medicine 156: 637 - 642.
76. Kimura, M., Umegaki, K., Kasuya, Y., Sugisawa, A., Higuchi, M. (2002). The
Relation between Single/Double or Repeated Tea Catechin Ingestions and Plasma Antioxidant Activity in Humans. European Journal of Clinical Nutrition 56: 1186 - 1193.
77. Kivits, G. A. A., Vandersman, F. J. P., Tijburg, L. B. M. (1997). Analysis of
Catechins from Green and Black Tea in Humans: A Specific and Sensitive Colorimetric Assay of Total Catechins in Biological Fluids. International Journal of Food Science and Nutrition 48: 387 - 392.
78. Knaggs, A. R. (2001). The Biosynthesis of Shikimate Metabolites. The Royal
Society of Chemistry 18: 334 - 355. 79. Knekt, P., Jarvinen, R., Reunanen, A., Maatela, J. (1996). Flavonoid Intake
and Coronary Mortality in Finland: A Cohort Study. British Journal of Medicine 312: 478 - 481.
80. Knekt, P., Kumpulainene, J., Jarvinen, R., Rissanen, H., Heliövaara, M.,
Reunanen, A., Hakulinen, T., Aromaa, A. (2002). Flavonoid Intake and Risk of Chronic Diseases. American Journal of Clinical Nutrition 76: 560 - 568.
81. Kohlmeier, L. (1991). What You Should Know About Your Marker.
Biomarkers of Dietary Exposure: Proceedings of the 3rd Meeting on Nutritional Epidemiology. P. Kok. F. J. and van't Veer. London, Smith-Gordon and Company Limited: 15 - 25.
82. Kok, F. J., van't Veer, P. (1991). Overview of Biomarkers of Dietary Intake.
Biomarkers of Dietary Exposure: Proceedings of the 3rd Meeting on Nutritional Epidemiology. P. Kok. F. J. and van't Veer. London, Smith-Gordon and Company Limited: 27 - 35.
69

83. Kondo, K., Kurihara, M., Miyata, N., Suzuki, T., Toyoda, M. (1999). "Mechanistic Studies of Catechins as Antioxidants against Radical Oxidation." Archives of Biochemistry and Biophysics 362(1): 79 - 86.
84. Kris-Etherton, P. M., Etherton, T. D., Carlson, J., Gardner, C. (2002a).
"Recent Discoveries in Inclusive Food-Based Approaches and Dietary Patterns for Reduction in Risk of Cardiovascular Disease." Current Opinion in Lipidology 13: 397 - 407.
85. Kris-Etherton, P. M., Hecker, K. D., Bonanome, A., Coval, S. M., Binkoski, A.
E., Hilpert, K. F., Griel, A. E., Etherton, T. D. (2002b). "Bioactive Compounds in Foods: Their Role in the Prevention of Cardiovascular Disease and Cancer." American Journal of Medicine 113 (Supplement 9B): 71S - 88S.
86. Krul, C., Luiten-Schuite, A., Tenfelde, A., van Ommen, B., Verhagen, H.,
Havenaar, R. (2001). "Antimutagenic Activity of Green Tea and Black Tea Extracts Studied in a Dynamic in vitro Gastrointestinal Model." Mutation Research 474: 71 - 85.
87. Kono, S., Ikeda, M., Tokudome, S., Kuratsune, M. (1988). A Case-Control
Study of Gastric Cancer and Diet in Northern Kyushu, Japan. Japan Journal of Cancer Research 79: 1067 - 1074.
88. Kouris-Blazos, A., Gnardellis, C., Wahlqvist, M. L., Trichopoulos, D., Lukito,
W., Trichopoulou, A. (1999). Are the Advantages of the Mediterranean Diet Transferable to Other Populations? A Cohort Study in Melbourne, Australia. British Journal of Nutrition 82: 57 - 61.
89. Kouris-Blazos, A., Wahlqvist, M. L., Trichopoulou, A., Polychronopoulos, E.,
Trichopoulos, D. (1996). Health and Nutritional Status of Elderly Greek Migrants to Melbourne, Australia. Age Ageing 25: 177 - 189.
90. Kubo, I., Xiao, P., Fujita, K. (2002). "Anti-MRSA Activity of Alkyl Gallates."
Bioorganic & Medicinal Chemistry Letters 12: 113 - 116. 91. Kuhnau, J. (1976). The Flavonoids. A Class of Semi-Essential Food
Components: Their Role in Human Nutrition. World Review of Nutrition and Dietetics 24: 117 - 191.
92. Kuhnle, G., Spencer, J. P. E, Schroeter, H., Shenoy, B., Debnam, E. S., Sarai,
S. K. S., Rice-Evans, C., Hahn, U. (2000). Epicatechin and Catechin are O-Methylated and Glucuronidated in the Small Intestine. Biochemical and Biophysical Research Communications 227: 507 - 512.
93. Ky, C. L., Louarn, J., Dussert, S., Guyot, B., Hamon, S., Noirot, M. (2001).
Caffeine, Trigonelline, Chlorogenic Acids and Sucrose Diversity in Wild Coffea Arabica L. and C. Canephora P. Accessions. Food Chemistry 75: 223 - 230.
70

94. Lakenbrink, C. L., S, Maiwald, B., Englehardt, U. H. (2000). "Flavonoids and Other Polyphenols in Consumer Brews of Tea and Other Caffeinated Beverages." Journal of Agricultural Food Chemistry 48: 2848 - 2852.
95. Luc, G., Fruchart, J. C. (1991). Oxidation of Lipoproteins and Atherosclerosis.
American Journal of Clinical Nutrition 53: 206S - 209S. 96. Manzocco, L., Anese, M., Nicoli, M. C. (1998). Antioxidant Properties of Tea
Extracts as Affected by Processing. Lebensmittle Wissenschaft Und Technologie 31: 694 - 698.
97. Maron, D. J., Lu, G. P., Cai, N. S., Li, Y. H., Chen, H., Zhu, J. Q., Jin, X. J.,
Wouters, B. C., Zhao, J. (2003). Cholesterol-Lowering Effect of a Theaflavin-Enriched Green Tea Extract: A Randomized Controlled Trial. Archives of Internal Medicine 163: 1448 - 1453.
98. Marshall, J. R. (2003). Methodologic and Statistical Considerations
Regarding Use of Biomarkers of Nutritional Exposure in Epidemiology. The Journal of Nutrition 133 (Supplement): 881S - 887S.
99. Mason, J. B. (2003). Biomarkers of Nutrient Exposure and Status in One-
Carbon (Methyl) Metabolism. The Journal of Nutrition 133 (Supplement): 941S - 947S.
100. McCamey, D. A., Thorpe, T. M., McCarthy, J. P. (1990). Coffee Bitterness.
Development in Food Science 25: 169 - 182. 101. Meng, X. F., Sang, S. M., Zhu, N. Q., Lu, H., Sheng, S., Lee, M. J., Ho, C. T.,
Yang, C. S. (2002). Identification and Characterization of Methylated and Ring-Fission Metabolites of Tea Catechins Formed in Humans, Mice, and Rats. Chemical Research in Toxicology 15: 1042 - 1050.
102. Mitchell, H. W. (1988). Cultivation and Harvesting of the Arabica Coffee Tree.
Coffee Volume 4 Agronomy. Clarke, R. J. and Macrae, R. (Editors), New York, Elsevier Applied Science Ltd. 4: 43 - 89.
103. Moline, J., Bukharovich, I. F., Wolff, M. S., Phillips, R. (2000). Dietary
Flavonoids and Hypertension: Is There a Link? Medical Hypotheses 55: 306 - 309.
104. Morel, I., Lescoat, G., Cillard, P., Cillard, J. (1994). Role of Flavonoids and
Iron Chelation in Antioxidant Action. Methods in Enzymology 234: 437 - 443. 105. Morton, L. W., Caccetta, R. A.A., Puddey, I. B., Croft, K. D. (2000).
Chemistry and Biological Effects of Dietary Phenolic Compounds: Relevance to Cardiovascular Disease. Clinical and Experimental Pharmacology and Physiology 27: 152 - 159.
71

106. Mukhtar, H., Ahmad, N. (2000). Tea Polyphenols: Prevention of Cancer and Optimizing Health. American Journal of Clinical Nutrition 71 (Supplements): 1698S - 1702S.
107. Naasani, I., Seimiya, H., Tsuruo, T. (1998). Telomerase Inhibition, Telomere
Shortening, and Senescence of Cancer Cells by Tea Catechins. Biochemical and Biophysical Research Communications 249: 391 - 396.
108. Nakagawa, K., Okuda, S, Miyazawa, T. (1997). Dose-dependent Incorporation
of Tea Catechins, (-)-Epigallocatechin-3-3gallate and (-)-Epigallocatechin, into Human Plasma. Bioscience, Biotechnology, and Biochemistry 61: 1981 - 1985.
109. Nawrot, P., Jordan, S., Eastwood, J., Rotstein, J., Hugenholtz, A., Feeley, M.
(2003). Effects of Caffeine on Human Health. Food Additives & Contaminants 20: 1 - 30.
110. Nardini, M., Cirillo, E., Natella, F., Scaccini, C. (2002). Absorption of
Phenolic Acids in Humans after Coffee Consumption. Journal of Agricultural and Food Chemistry 50: 5735 - 5741.
111. Nehlig, A., Derby, G. (1994). Potential Teratogenic and Neurodevelopmental
Consequences of Coffee and Caffeine Exposure - A Review on Human and Animal Data. Neurotoxicology & Teratology 16: 531 - 543.
112. Nehlig, A. (1999). Are We Dependent Upon Coffee and Caffeine? A Review
on Human and Animal Data. Neuroscience & Biobehavioral Reviews 23: 563 - 576.
113. Olthof, M. R., Hollman, P. C. H., Vree, T. B., Katan, M. B. (2000).
Bioavailabilities of Quercetin-3-Glucoside and Quercetin-4'-Glucoside Do Not Differ in Humans. Journal of Nutrition 130: 1200 - 1203.
114. Olthof, M. R., Hollman, P. C. H. and Katan, M. B. (2001a). Chlorogenic Acid
and Caffeic Acid are Absorbed in Humans. Journal of Nutrition 131: 66 - 71. 115. Olthof, M. R., Hollman, P. C. H., Zock, P. L., Katan, M. B. (2001b).
Consumption of High Doses of Chlorogenic Acid Present in Coffee or of Black Tea Increases Plasma Total Homocysteine Concentrations in Humans. American Journal of Clinical Nutrition 73: 532 - 538.
116. Paquay, J. B. G., Haenen, G. R. M. M., Stender, G., Wiseman, S. A., Tijburg,
T. B. M., Bast, A. (2000). Protection against Nitric Oxide Toxicity by Tea. Journal of Agricultural Food Chemistry 48: 5768 - 5772.
117. Pietta, P. G., Simonetti, P., Gardana, C., Brusamolino, A., Morazzoni, P.,
Bombardelli, E. (1998a). Catechin Metabolites after Intake of Green Tea Infusions. BioFactors 8: 111 - 118.
72

118. Pietta, P. G., Simonetti, P., Gardana, C., Brusamolino, A., Morazzoni, P., Bombardelli, E. (1998b). Relationship between Rate and Extent of Catechin Absorption and Plasma Antioxidant Status. Biochemistry and Molecular Biology International 46: 895 - 903.
119. Plumb, G. W., Garcia-Conesa, M. T., Kroon, P. A., Rhodes, M. Ridley, S.,
Williamson, G. (1999). Metabolism of Chlorogenic Acid by Human plasma, Liver, Intestine and Gut Microflora. Journal of the Science of Food Agriculture 79: 390 - 392.
120. Poisson, J. (1988). The Biosynthesis of Some Important Coffee Constituents.
Coffee Volume 4 Agronomy. R. J. Clarke, and Macrae, R. New York, Elsevier Applied Science Ltd. 4: 293 - 301.
121. Potischman, N., Freudenheim, J. L. (2003). Biomarkers of nutritional
exposure and nutritional status: an overview. Journal of Nutrition 133 (Supplement): 873S - 874S.
122. Princen, J. M. G., van Duyvenvoorde, W., Buytenhek, R., Blonk, C., Tijburg,
L. B. M., Langius, J. A. E., Meinder, A. E., Pijl, H. (1998). No Effect of Consumption of Green and Black Tea on Plasma Lipid and Antioxidant Levels and on LDL Oxidation in Smokers. Arteriosclerosis, Thrombosis and Vascular Biology 18: 833 - 841.
123. Quilan, P. T., Lane, J., Moore, K. L., Aspen, J., Rycroft, J. A., O'Brien, D. C.
(2000). The Acute Physiological and Mood Effects of Tea and Coffee: The Role of Caffeine Level. Pharmacology, Biochemistry & Behaviour 66: 19 - 28.
124. Rechner, A. R., Spencer, J. P. E., Kuhnle, F., Hahn, W., Rice-Evans, C. A.
(2001). Novel Biomarkers of the Metabolism of Caffeic Acid Derivatives in vivo. Free Radical Biology and Medicine 30: 1213 - 1222.
125. Reineccius, G. A. (1999). Kinetics of Flavor Formation During Maillard
Browning. Flavour Chemistry: Thirty Years of Progress. R. Teranishi, Wick, E. L. and Hornstein, I. New York, Kluwer Academic/Plenum Publishers, New York: 345 - 351.
126. Rice-Evans, C. A., Miller, N. J., Bolwell, P. G., Bramley, P. M., Pridham, J. B.
(1995). The Relative Antioxidant Activities of Plant-Derived Polyphenolic Flavonoids. Free Radical Research 22: 375 - 383.
127. Rice-Evans, C. A., Miller, N. J., Paganga, G. (1996). Structure-Antioxidant
Activity Relationships of Flavonoids and Phenolic Acids. Free Radical Biology and Medicine 20: 933 - 956.
128. Richelle, M., Tavazzi, I., Offord, E. (2001). Comparison of the Antioxidant
Activity of Commonly Consumed Polyphenolic Beverages (Coffee, Cocoa, and Tea) Prepared per Cup Serving. Journal of Agricultural Food Chemistry 49: 3438 - 3442.
73

129. Riemersma, R. A., Rice-Evans, C. A., Tyrrell, R. M., Clifford, M. N., Lean, M. E.J. (2001). Tea Flavonoids and Cardiovascular Health. Quarterly Journal of Medicine 94: 277 - 282.
130. Sato, M., Maulik, G., Ray, P.S., Bagchi, D., Das, D. K. (1999).
Cardioprotective Effects of Grape Seed Proanthocyanidin against Ischemic Reperfusion Injury. Journal of Molecular Cell Cardiology 31: 1289 - 1297.
131. Scalbert, A., Williamson, G. (2000). Dietary Intake and Bioavailability of
Polyphenols. Journal of Nutrition 130: 2073S - 2085S. 132. Serafini, M., Bugianesi, R., Maiani, G., Valtuena, S., de Santis, Simone,
Crozier, A. (2003). Plasma Antioxidants from Chocolate. Nature 424: 1013. 133. Sesso, H. D., Gaziano, J. M, Liu, S., Buring, J. E. (2003). Flavonoid Intake
and the Risk of Cardiovascular Disease in Women. American Journal of Clinical Nutrition 77: 1400 - 1408.
134. Shahzard, S., Aoyagi, K., Winter, A., Koyama, A., Bitsch, I. (2001).
Pharmacokinetics of Gallic Acid and Its Relative Bioavailability from Tea in Healthy Humans. Journal of Nutrition 131: 1207 - 1210.
135. Shahzard, S., Bitsch, I. (1998). Determination of Gallic Acid and Its
Metabolites in Human Plasma and Urine by High-Performance Liquid Chromatography. Journal of Chromatography B Biomedical Science Application 705: 87 - 95.
136. Snoeck, J. (1988). Cultivation and Harveting of the Robusta Coffee Tree.
Coffee Volume 4 Agronomy. R. J. Clarke, and Macrae, R. New York, Elsevier Applied Science Ltd. 4: 91 - 127.
137. Sondahl, M. R. a. L., W. H. T. (1988). Coffee Biotechnology. Coffee Volume 4
Agronomy. R. J. Clarke, and Macrae, R. New York, Elsevier Applied Science Ltd. 4: 236 - 259.
138. Spencer, J. P. E., Chaudry, F., Pannala, A. S., Srai, S. K., Debnam, E., Rice-
Evans, C. (2000). Decomposition of Coca Procyanidins in the Gastric Milieu. Biochemical and Biophysical Research Communications 272: 236 - 241.
139. Spencer, J. P. E., Schroeter, H., Shenoy, B., Srai, S. K. S., Debnam, E. S.,
Rice-Evans, C. (2001). Epicatechin is the Primary Bioavailable Form of the Procyanidin Dimers B2 and B5 after Transfer across the Small Intestine. Biochemical and Biophysical Research Communications 285: 588 - 593.
140. Spiller, M. A. (1984). The Chemical Components of Coffee. Progress in
Clinical and Biological Research. G. J. Brew. New York, Alan R. Liss, Inc. 158: 91 - 147.
74
141. Stagg, G. V., Millin, D. J. (1975). The Nutritional and Therapeutic Value of Tea - A Review. Journal of the Science of Food and Agriculture 26: 1439 - 1459.
142. Stahl, W., van den Berg, H., Arthur, J., Bast, A., Dainty, J., Faulks, R. M.,
Gartner, C., Haenen, G., Hollman, P., Holst, B., Kelly, F. J., Polidori, M. C., Rice-Evans, C., Southon, S., van Vliet, T., Vina-Ribes, J., Williamson, G., Astley, S. B. (2002). Bioavailability and Metabolism. Molecular Aspects of Medicine 23: 39 - 100.
143. Stensvold, I., Tverdal, A., Solvoll, K., Per Foss, O. (1992). Tea Consumption.
Relationship to Cholesterol, Blood Pressure, and Coronary and Total Mortality. Preventative Medicine 124: 546 - 553.
144. Strain, E. C., Mumford, G. K., Silverman, K., Griffiths, R. R. (1994). Caffeine
Dependence Syndrome: Evidence from Case Histories and Experimental Evaluations. The Journal of the American Medical Association 272: 1043 - 1048.
145. Takasaki, M., Konoshima, T., Kuroki, S., Tokuda, H., Nishino, H. (2001).
Cancer Chemopreventive Activity of Phenylpropanoid Esters of Sucrose, Vanicoside B and Lapathoside A, from Polygonum Lapathifolium. Cancer Letters 173: 133 - 138.
146. Taylor, D. A. (1990). Central Nervous System Stimulants. Modern
Pharmacology, 4th Edition, Craig, C. R. and Stitzel, R. E. (editors), Library of Congress Cataloging-in-Publication Data, United States of America: 383.
147. Tebib, K., Besançon, P, Rounat, J. M. (1994). Dietary Grape Seed Tannins
Affect Lipoproteins, Lipoprotein Lipases and Tissue Lipids in Rats Fed Hypercholesterolemic Diets. Journal of Nutrition 124: 383 - 385.
148. Thompson, W. G. (1994). Coffee - Brew or Bane. American Journal of the
Medical Sciences 308: 49 - 57. 149. Tijburg, L. B. M., Mattern, T., Folts, J. D., Weisgerber, U. M., Katan, M. B.
(1997). "The Flavonoids and Cardiovascular Diseases: A Review." Critical Reviews in Food Science and Nutrition 37: 771 - 785.
150. Tokunaga, S., Whiter, I. R., Frost, C., Kono, S., Tokudome, S., Akamatsu, T.,
Moriyama, T., Zakouji, H. (2002). Green Tea Consumption and Serum Lipids and Lipoproteins in a Population of Healthy Workers in Japan. Annals of Epidemiology 12: 157 - 165.
151. Torel, J., Cillard, J., Collard, P. (1986). Antioxidant Activity of Flavonoids
and Reactivity with Peroxy Radical. Phytochemistry 25: 383 - 385.
152. Unno, T., Takeo, T. (1995). Absorption of (-)-Epigallocatechin Gallate into the Circulation System of Rats. Bioscience, Biotechnology, and Biochemistry 59: 1558 - 1559.
75

153. Unno, T., Kondo, K., Itakura, H., Takeo, T. (1996). Analysis of (-)-
Epigallocatechin Gallate in Human Serum Obtained after Ingesting Green Tea. Bioscience, Biotechnology, and Biochemistry 60: 2066 - 2068.
154. Vaidya, S. G., Balentine, D., Blot, W., Bhonsle, R. B., Chung, F.L.,
Chigurupati, K., Gupta, P. C., Harris, D., Huvos, A. G., Naik, U. D., Shah, J. P., Shaha, A. R., Vaidya, N. S., Vaidya, J. S., Yang, C. S., Yu, G.P, Schantz, S. P. (1997). Green Tea and Leukoplakia. American Journal of Surgery 174: 552 - 555.
155. Valcic, S., Burr, J. A., Timmermann, B. N., Liebler, D. C. (2000). Antioxidant
Chemistry of Green Tea Catechins. New Oxidation Products of (-)-Epigallocatechin Gallate and (-)-Epigallocatechin from their Reactions with Peroxyl Radicals."- Chemical Research in Toxicology 13: 801 - 810.
156. van het Hof, K. H., Kivits, G. A. A., Weststrate, J. A., Tijburg, L. B. M.
(1998). Bioavailability of Catechins from Tea: The Effect of Milk. European Journal of Clinical Nutrition 52: 356 - 359.
157. van het Hof, K. H., Wiseman, S. A., Yang, C. S., Tijburg, L. B. M. (1999).
Plasma and Lipoprotein Levels of Tea Catechins Following Repeated Tea Consumption. Proceedings of the Society for Experimental Biology & Medicine 220: 203 - 209.
158. Vinson, J. A., Dabbagh, Y. A., Serry, M. M., Jang, J. (1995). Plant
Flavonoids, especially Tea Flavonols, Are Powerful Antioxidants Using an in vitro Oxidation Model for Heart Disease. Journal of Agricultural Food Chemistry 43: 2800 - 2802.
159. Vitzthum, O. G. (1999). Thirty Years of Coffee Chemistry Research. Flavor
Chemistry: Thirty Years of Progress. R. Teranishi, Wick, E. L. and Hornstein, I. New York, Kluwer Academic/Plenum Publishers, New York: 117 - 147.
160. Waterhouse, A. L., Shirley, J. R., Donovan, J. L. (1996). Antioxidants in
Chocolate. The Lancet 348(9030): 834 - 835. 161. Watkins, T. R., Bierenbaum, M. L. (1998). Grape Juice Attenuates
Cardiovascular Risk Factors in the Hyperlipidemic Subjects. Pharmaceutical Biotechnology 36 (Supplement): 75 - 80.
162. Weisburger, J. H., Chung, F. L. (2002). Mechanisms of Chronic Disease
Causation by Nutritional Factors and Tobacco Products and their Prevention by Tea Polyphenols. Food and Chemical Toxicology 40: 1145 - 1154.
163. Whitehead, T. P., Robnson, D., Allaway, S., Syms, J., Hale, A. (1995). Effect
of Red Wine Ingestion on the Antioxidant Capacity of Serum. Clinical Chemistry 41: 32 - 35.
76

164. Willett, W. C. (1991). The Use of Biomarkers in Nutritional Epidemiology. Biomarkers of Dietary Exposure. Proceedings of the 3rd Meeting on Nutritional Epidemiology. P. Kok. F. J. and van't Veer. London, Smith-Gordon and Company Limited: 9 - 14.
165. Wiseman, H. (1999). The Bioavailability of Non-nutrient Plant Factors:
Dietary Flavonoids and Phyto-oestrogens. Proceedings of the Nutrition Society 58: 139 - 146.
166. Wiseman, S. A., Balentine, D. A., Frie, B. (1997). Antioxidants in Tea.
Critical Reviews in Food Science and Nutrition 37(8): 705 - 718. 167. Xie, B., Shi, H., Chen, Q., Ho, C. T. (1993). Antioxidant Properties of
Fractions and Polyphenol Constituents from Green, Oolong and Black Teas. Proceedings of the National Science Council, ROC. Part B: Life Sciences 17: 77 - 84.
168. Yang, B., Arai, K, Kusu, F. (2000). Determination of Catechins in Human
Urine Subsequent to Tea Ingestion by High-Performance Liquid Chromatography with Electrochemical Detection. Analytical Biochemistry 283: 77 - 82.
169. Yang, C. S., Wang, Z. Y. (1993). Tea and Cancer. Journal of National
Cancer Institute 85: 1038 - 1049. 170. Yang, T. T. C., Koo, M. W. L. (1997). Hypocholesterolemic Effects of
Chinese Tea. Pharmacological Research 35: 505 - 512. 171. Yee, W. L., Wang, Q., Agdinaoay, T., Dang, K., Chang, H., Grandinetti, A.,
Franke, A. A., Theriault, A. (2002). Green Tea Catechins Decrease Apolipoprotein B-100 Secretion from HepG2 Cells. Molecular & Cellular Biochemistry 229: 85 - 92.
172. Youdim, K. A., Martin, A., Joseph, J. a. (2000). Incorporation of the
Elderberry Anthocyanins by Endothelial Cells Increases Protection against Oxidative Stress. Free Radical Biology and Medicine 29: 51 - 60.
173. Younes, M., Siegers, C. P. (1981). Inhibitory Action of Some Flavonoids on
Enhanced Spontaneous Lipid Peroxidation Following Glutathione Depletion. Planta Medica 43: 240 - 244.
174. Young, J. F., Dragstedt, L. O., Haraldsdottir, J., Daneshvar, B., Loft, S.,
Nilsson, L. Nielsen, S. E., Mayer, B. Skibsted, L. H., Huynh-Ba, T., Hermetter, A., Sandstorm, B. (2002). "Green Tea Extract Only Affects Markers of Oxidative Status Postprandially: Lasting Antioxidant Effect of Flavonoid-Free Diet." British Journal of Nutrition 87: 343 - 355.
175. Yu, J., Vasanthan, T., Temelli, F. (2001). Analysis of Phenolic Acids in
Barley by High-Performance Liquid Chromatography. Journal of Agricultural Food Chemistry 49: 4352 - 4358.
77

176. Zhan, H., Dong, H. J., Xin, Y. M., Tang, G. X. (1999). Effects of Tea
Polyphenols on Cardiac Function and Myocardial Ultrastructure in Rats After Repeated +Gz Stress. Hangtian Yixue Yu Yixue Gongcheng/Space Medicine & Medical Engineering 12: 79 - 83.
177. Zhang, A., Chan, P. T., Lunk, Y. S., Ho, W. K. K., Chen, Z.Y. (1997).
"Inhibitory Effect of Jasmine Green Tea Epicatechin Isomers on LDL-Oxidation." Journal of Nutritional Biochemistry 8: 334 - 340.
178. Zhao, W., Chen, J. (2001). Candidate Foods in the Asia-Pacific Region for
Cardiovascular Protection: Oriental Tea. Asia Pacific Journal of Clinical Nutrition 10: 138 - 142.
78


![Catalog polyphenol np_final[1]](https://static.fdocuments.us/doc/165x107/5a672d187f8b9a0c518b489f/catalog-polyphenol-npfinal1.jpg)