BIOMARKERS AND CLINICAL CHARACTERISTICS OF …...©2013 by American Association for Cancer Research...
29
BIOMARKERS AND CLINICAL CHARACTERISTICS OF RESPONSE TO PD-1 IMMUNE CHECKPOINT BLOCKADE IN NON-SMALL CELL LUNG CANCER Julie R. Brahmer, M.D., M.Sc. Associate Professor of Oncology Director of the Thoracic Oncology Program
Transcript of BIOMARKERS AND CLINICAL CHARACTERISTICS OF …...©2013 by American Association for Cancer Research...

BIOMARKERS AND CLINICAL CHARACTERISTICS OF RESPONSE TO
PD-1 IMMUNE CHECKPOINT BLOCKADE IN NON-SMALL CELL LUNG CANCER
Julie R. Brahmer, M.D., M.Sc.Associate Professor of Oncology
Director of the Thoracic Oncology Program
Disclosures
• Merck, Consultant/Advisor• Bristol Myers-Squibb, (non-compensated),
Consultant/Advisor• Bristol Myers Squibb, Grant/Research Funding• Merck, Grant/Research Funding• AstraZeneca, Grant/Research Funding
Julie R. Brahmer, M.D., M.Sc.
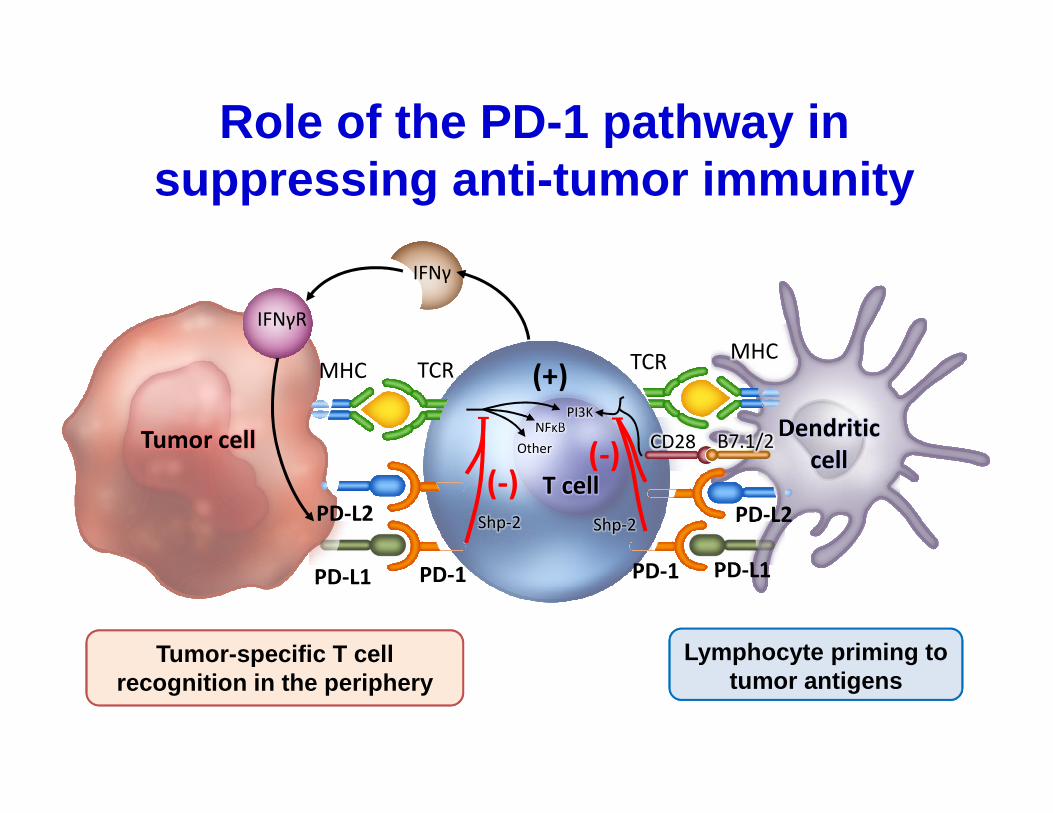
Dendritic
cellT cell
Tumor cell
MHC
PD-L1
MHCTCR
PD-L2
CD28 B7.1/2NFκB
Other
PI3K
Shp-2 Shp-2
IFNγ
IFNγR
Lymphocyte priming to tumor antigens
TCR
PD-L2
PD-1 PD-L1PD-1
Tumor-specific T cell recognition in the periphery
Role of the PD -1 pathway in suppressing anti-tumor immunity
(+)
(-)(-)
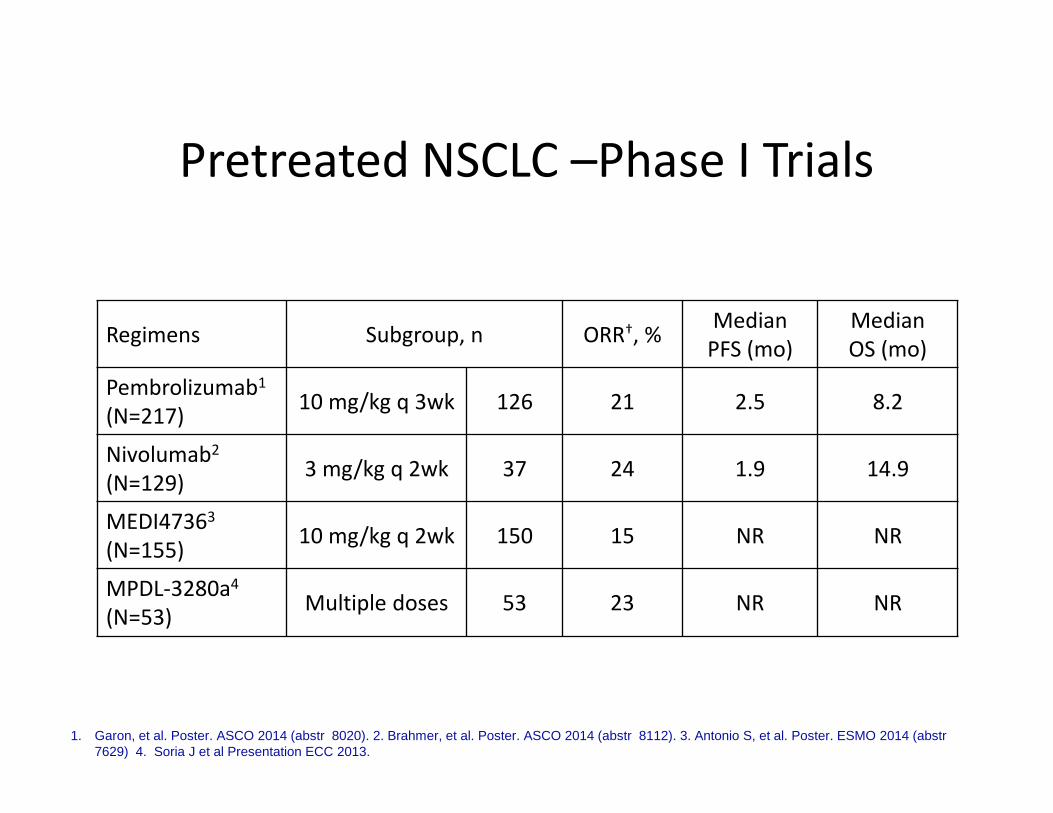
Pretreated NSCLC –Phase I Trials
Regimens Subgroup, n ORR†, %Median
PFS (mo)
Median
OS (mo)
Pembrolizumab1
(N=217)10 mg/kg q 3wk 126 21 2.5 8.2
Nivolumab2
(N=129)3 mg/kg q 2wk 37 24 1.9 14.9
MEDI47363
(N=155)10 mg/kg q 2wk 150 15 NR NR
MPDL-3280a4
(N=53)Multiple doses 53 23 NR NR
1. Garon, et al. Poster. ASCO 2014 (abstr 8020). 2. Brahmer, et al. Poster. ASCO 2014 (abstr 8112). 3. Antonio S, et al. Poster. ESMO 2014 (abstr7629) 4. Soria J et al Presentation ECC 2013.
Who is Most Likely to Respond?
Lessons From the Trials
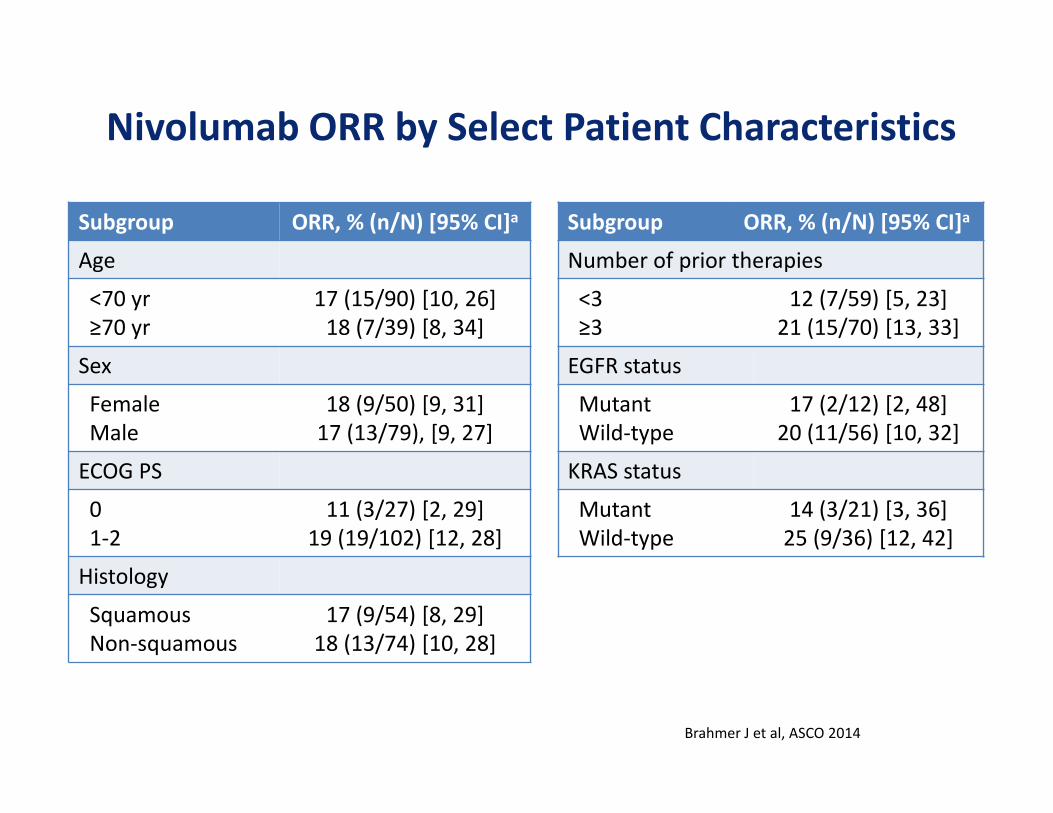
Subgroup ORR, % (n/N) [95% CI]a
Age
<70 yr
≥70 yr
17 (15/90) [10, 26]
18 (7/39) [8, 34]
Sex
Female
Male
18 (9/50) [9, 31]
17 (13/79), [9, 27]
ECOG PS
0
1-2
11 (3/27) [2, 29]
19 (19/102) [12, 28]
Histology
Squamous
Non-squamous
17 (9/54) [8, 29]
18 (13/74) [10, 28]
Nivolumab ORR by Select Patient Characteristics
Subgroup ORR, % (n/N) [95% CI]a
Number of prior therapies
<3
≥3
12 (7/59) [5, 23]
21 (15/70) [13, 33]
EGFR status
Mutant
Wild-type
17 (2/12) [2, 48]
20 (11/56) [10, 32]
KRAS status
Mutant
Wild-type
14 (3/21) [3, 36]
25 (9/36) [12, 42]
Brahmer J et al, ASCO 2014
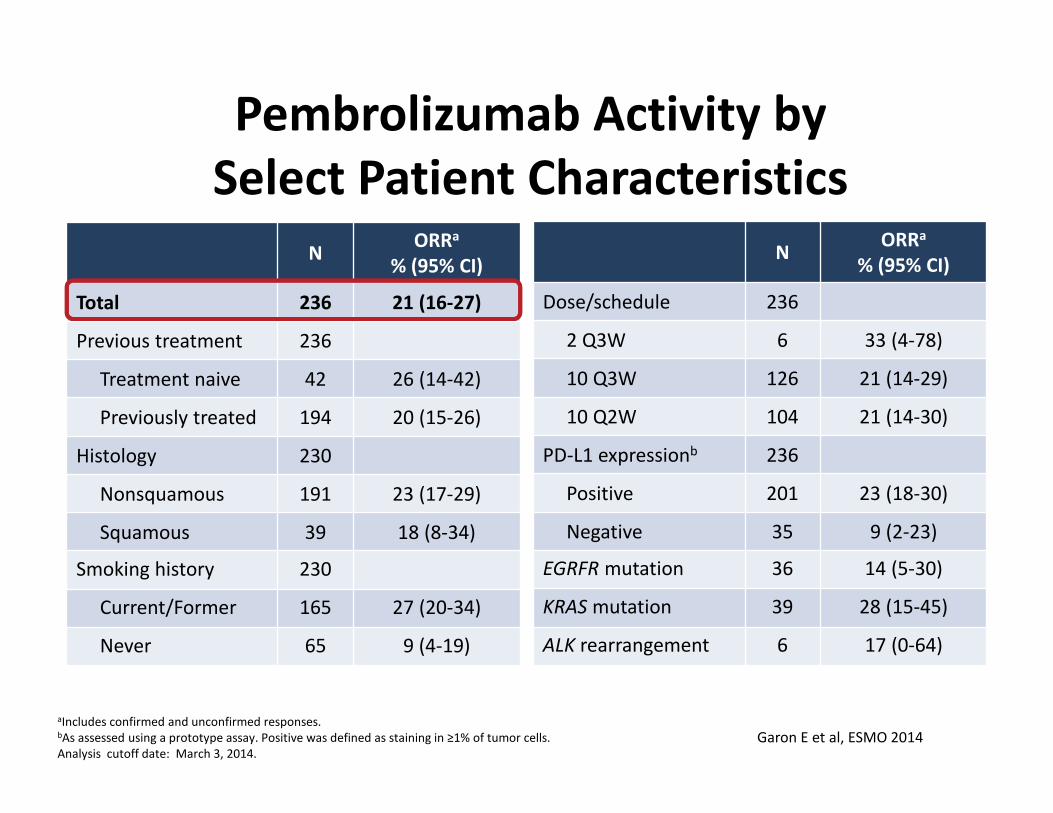
Pembrolizumab Activity by
Select Patient Characteristics
NORRa
% (95% CI)
Total 236 21 (16-27)
Previous treatment 236
Treatment naive 42 26 (14-42)
Previously treated 194 20 (15-26)
Histology 230
Nonsquamous 191 23 (17-29)
Squamous 39 18 (8-34)
Smoking history 230
Current/Former 165 27 (20-34)
Never 65 9 (4-19)
NORRa
% (95% CI)
Dose/schedule 236
2 Q3W 6 33 (4-78)
10 Q3W 126 21 (14-29)
10 Q2W 104 21 (14-30)
PD-L1 expressionb 236
Positive 201 23 (18-30)
Negative 35 9 (2-23)
EGRFR mutation 36 14 (5-30)
KRAS mutation 39 28 (15-45)
ALK rearrangement 6 17 (0-64)
aIncludes confirmed and unconfirmed responses.bAs assessed using a prototype assay. Positive was defined as staining in ≥1% of tumor cells.
Analysis cutoff date: March 3, 2014.
Garon E et al, ESMO 2014
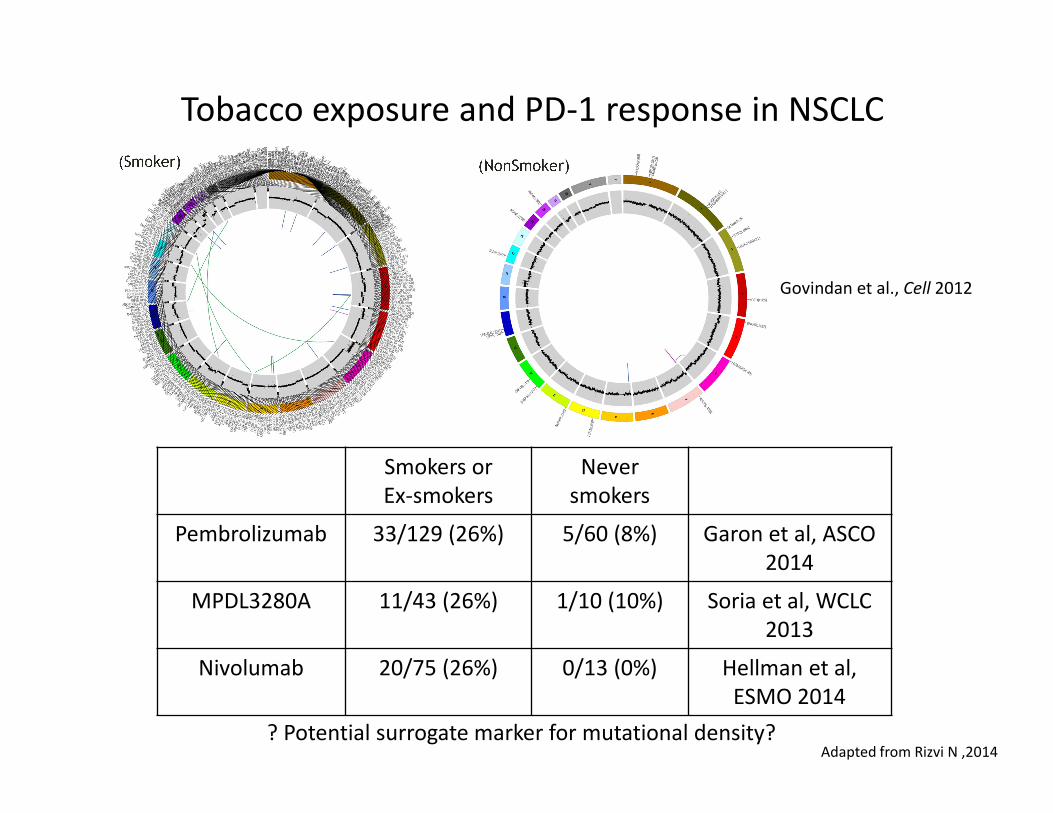
Tobacco exposure and PD-1 response in NSCLC
Govindan et al., Cell 2012
Smokers or
Ex-smokers
Never
smokers
Pembrolizumab 33/129 (26%) 5/60 (8%) Garon et al, ASCO
2014
MPDL3280A 11/43 (26%) 1/10 (10%) Soria et al, WCLC
2013
Nivolumab 20/75 (26%) 0/13 (0%) Hellman et al,
ESMO 2014
? Potential surrogate marker for mutational density?Adapted from Rizvi N ,2014
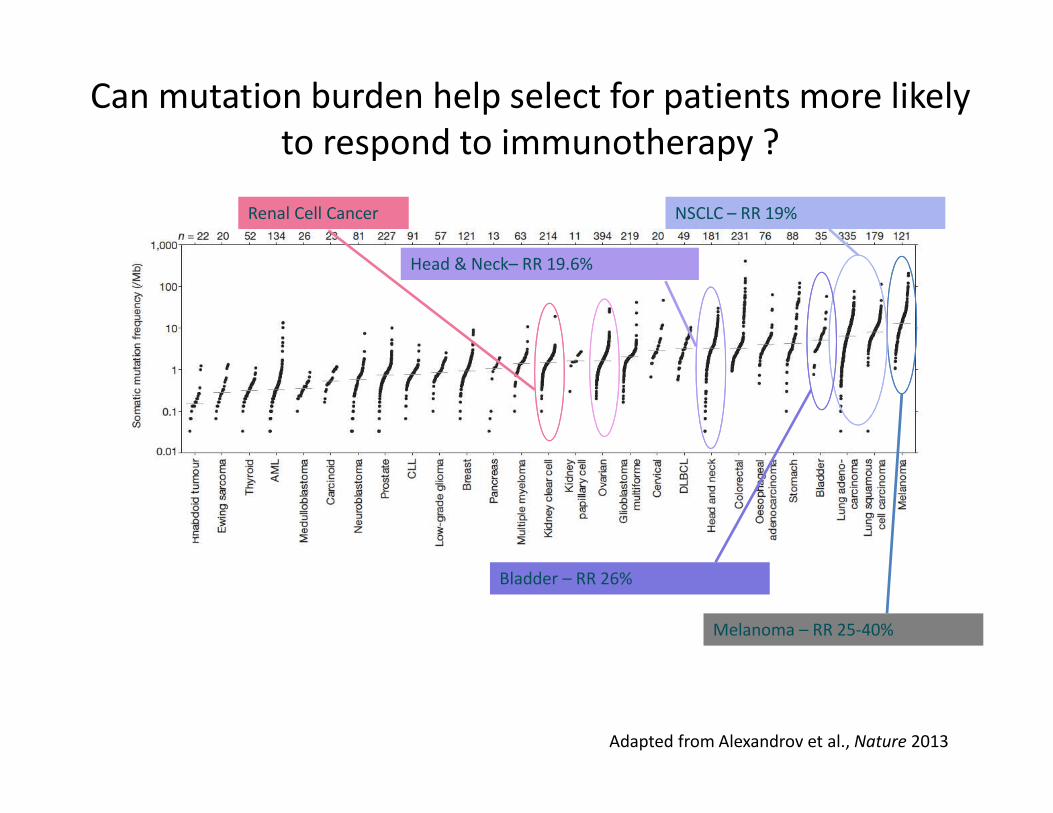
Can mutation burden help select for patients more likely
to respond to immunotherapy ?
Melanoma – RR 25-40%
NSCLC – RR 19%
Bladder – RR 26%
Head & Neck– RR 19.6%
Renal Cell Cancer
Adapted from Alexandrov et al., Nature 2013

PD-L1 (B7-H1) Expression and Inflammation: Implications for Mechanisms and Therapy
Sznol M , and Chen L Clin Cancer Res 2013;19:1021-1034©2013 by American Association for Cancer Research
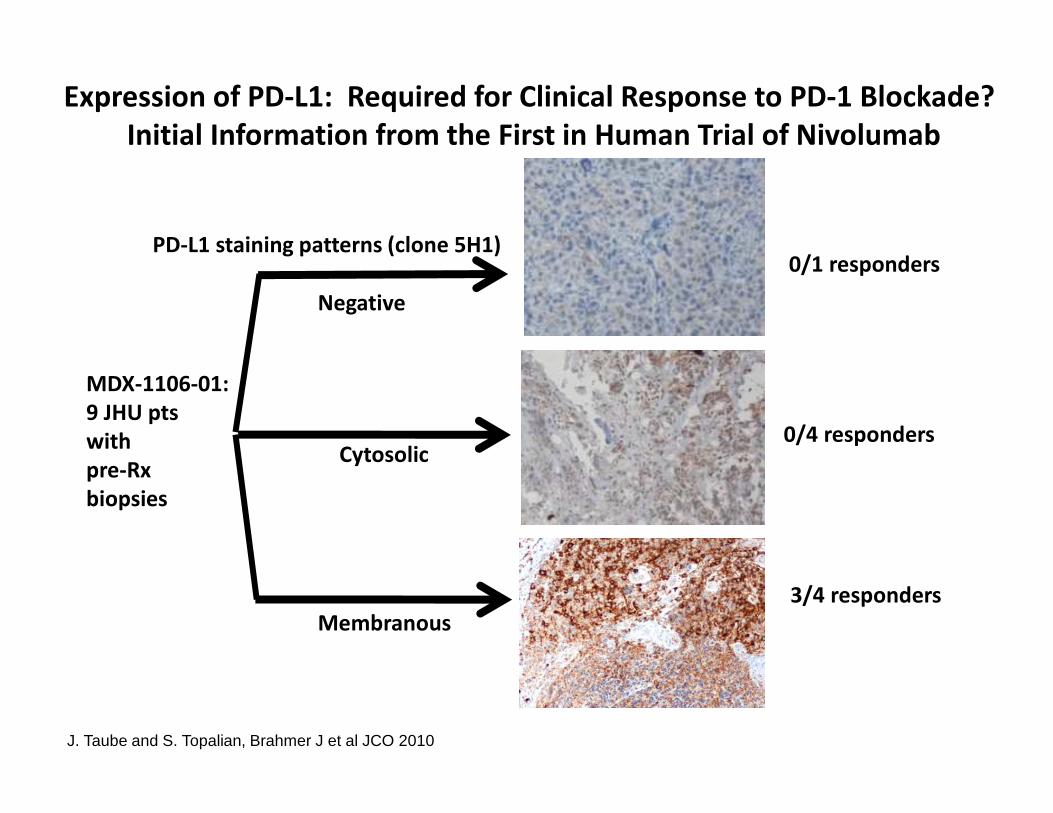
Expression of PD-L1: Required for Clinical Response to PD-1 Blockade?
Initial Information from the First in Human Trial of Nivolumab
0/1 responders
Negative
0/4 respondersCytosolic
3/4 responders
Membranous
MDX-1106-01:
9 JHU pts
with
pre-Rx
biopsies
PD-L1 staining patterns (clone 5H1)
J. Taube and S. Topalian, Brahmer J et al JCO 2010
Pro
port
ion
of p
atie
nts
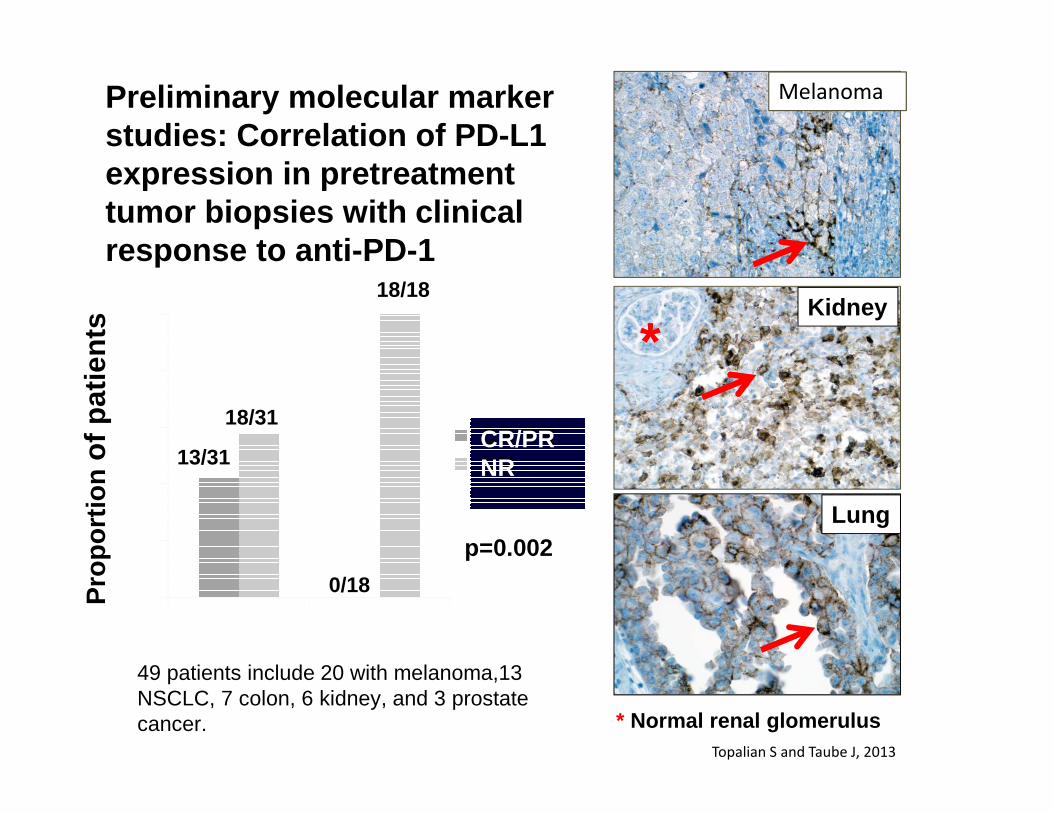
p=0.002Lung
Melanoma
Kidney
*
13/31
18/31
18/18
0/18
49 patients include 20 with melanoma,13 NSCLC, 7 colon, 6 kidney, and 3 prostate cancer. * Normal renal glomerulus
Preliminary molecular marker studies: Correlation of PD -L1 expression in pretreatment tumor biopsies with clinical response to anti-PD -1
CR/PRNR
Topalian S and Taube J, 2013
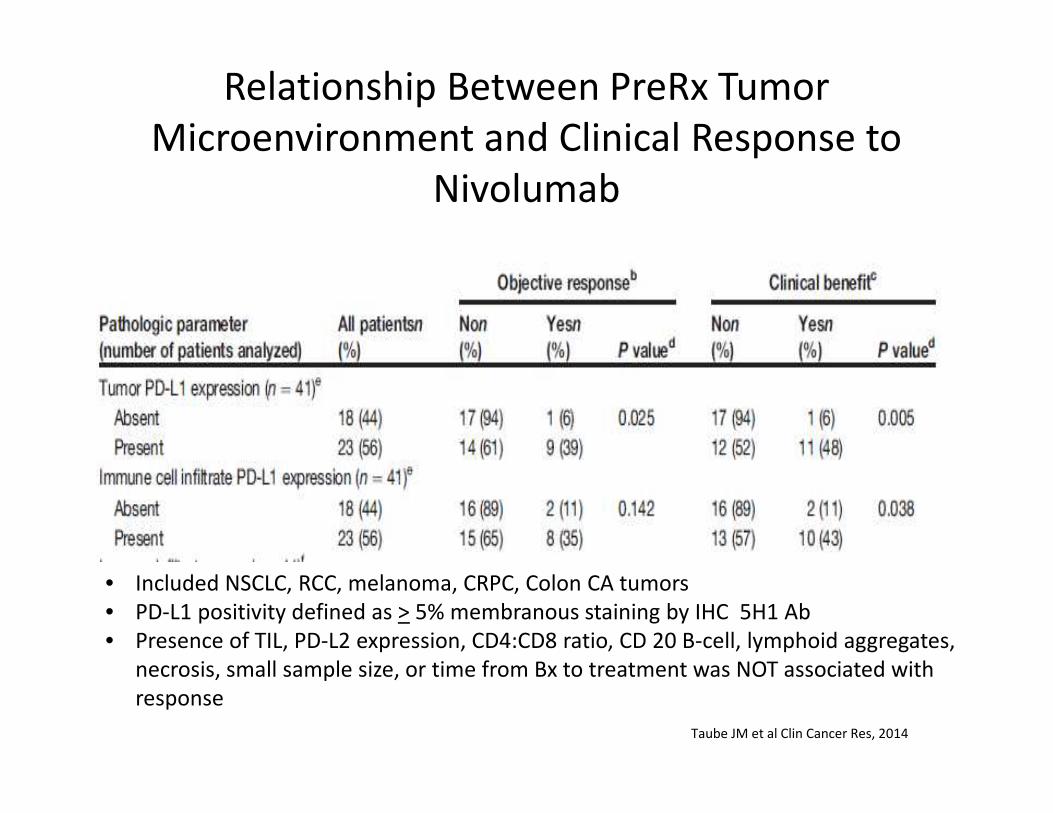
Relationship Between PreRx Tumor
Microenvironment and Clinical Response to
Nivolumab
Taube JM et al Clin Cancer Res, 2014
• Included NSCLC, RCC, melanoma, CRPC, Colon CA tumors
• PD-L1 positivity defined as > 5% membranous staining by IHC 5H1 Ab
• Presence of TIL, PD-L2 expression, CD4:CD8 ratio, CD 20 B-cell, lymphoid aggregates,
necrosis, small sample size, or time from Bx to treatment was NOT associated with
response

On
-Tx
H&
E
Baseline
CD8PD-L1PD-L1
Biomarkers at baseline:PD-L1 positiveCD8+ T cells present
Serial Biopsy in a PD-L1–Positive RCC Patient With a Rapid
Response to MPDL3280A B
ase
line
H&
E
On-T
x
CD8PD-L1
On-treatment H&E:
dense lymphocytic infiltrate and
no viable tumor cells seen
Necrotic tissue
Lymphocytic infiltrate
Degenerating tumor cells (“ghost cells”)
Degenerating tumor cells (“ghost cells”)
Biomarkers at week 4 post C1D1:PD-L1 positiveIncreased CD8+ T-cell infiltrate
Carolina BioOncology Institute (Powderly). ASCO 2013
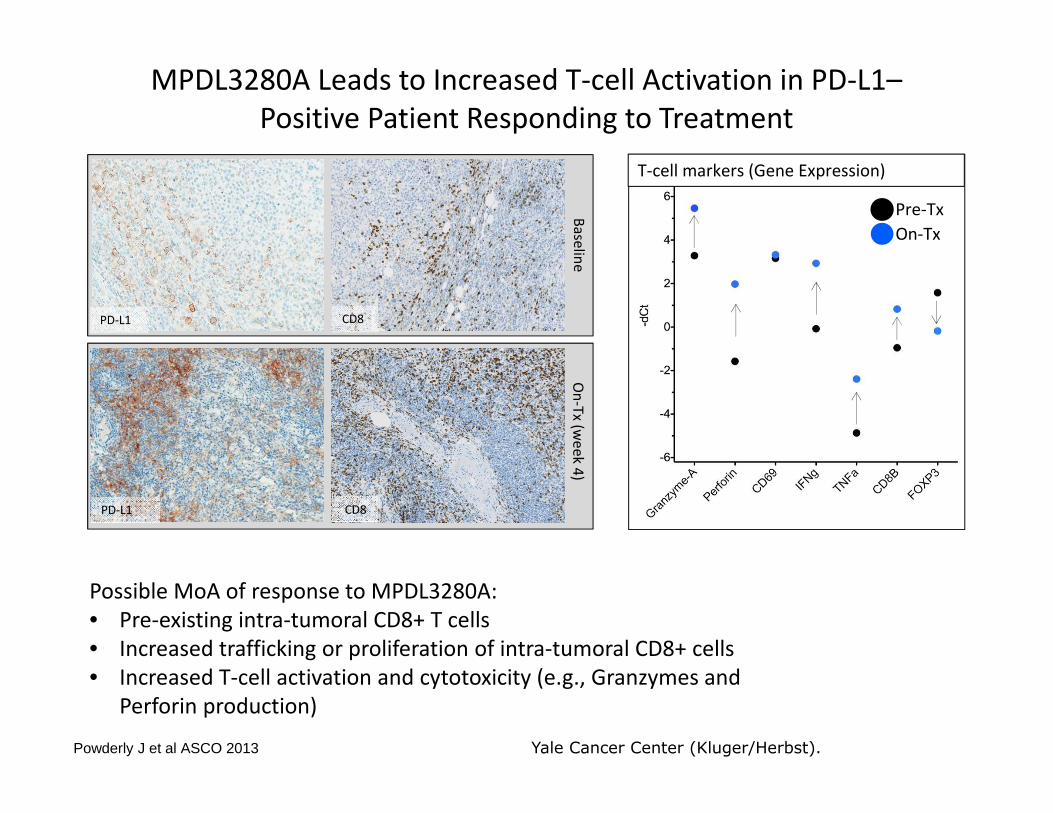
MPDL3280A Leads to Increased T-cell Activation in PD-L1–
Positive Patient Responding to Treatment
Ba
selin
e
Possible MoA of response to MPDL3280A:
• Pre-existing intra-tumoral CD8+ T cells
• Increased trafficking or proliferation of intra-tumoral CD8+ cells
• Increased T-cell activation and cytotoxicity (e.g., Granzymes and
Perforin production)
On
-Tx
(we
ek 4
)
T-cell markers (Gene Expression)
CD8
CD8PD-L1
PD-L1
Pre-Tx
On-Tx
Yale Cancer Center (Kluger/Herbst). Powderly J et al ASCO 2013
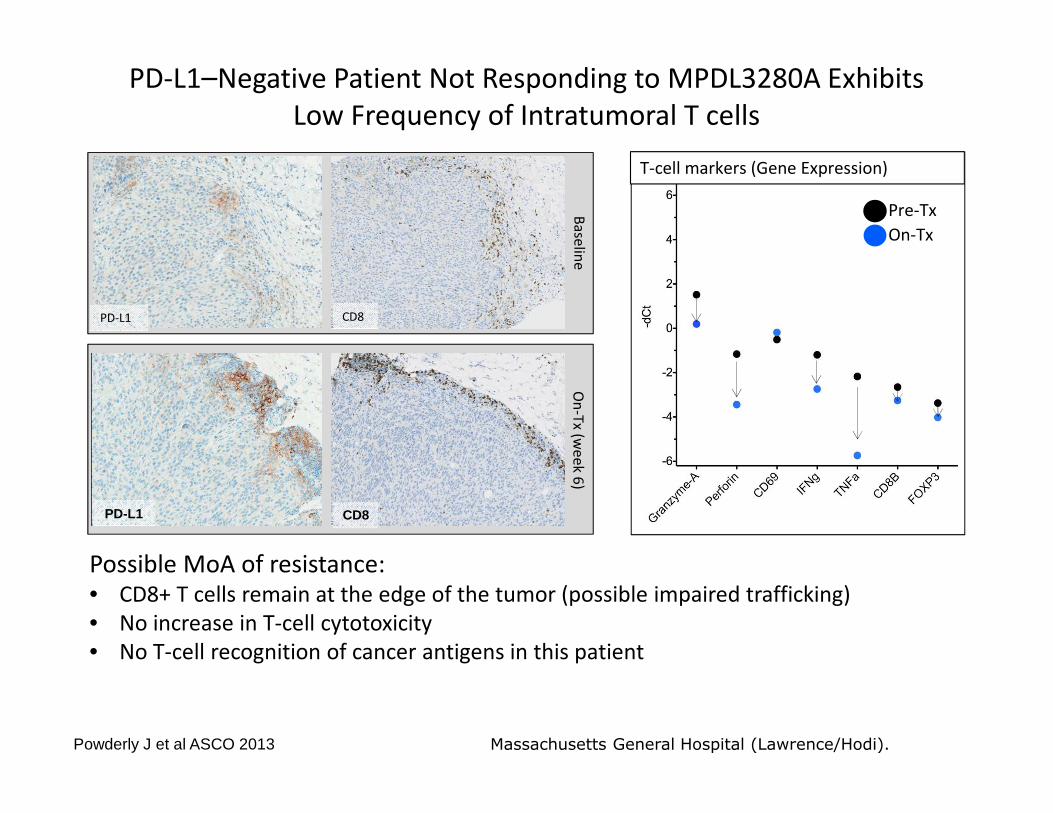
PD-L1–Negative Patient Not Responding to MPDL3280A Exhibits
Low Frequency of Intratumoral T cells
Ba
selin
e
Possible MoA of resistance: • CD8+ T cells remain at the edge of the tumor (possible impaired trafficking)
• No increase in T-cell cytotoxicity
• No T-cell recognition of cancer antigens in this patient
On
-Tx
(we
ek 6
)
T-cell markers (Gene Expression)
CD8
CD8
PD-L1
PD-L1
Pre-Tx
On-Tx
Massachusetts General Hospital (Lawrence/Hodi). Powderly J et al ASCO 2013
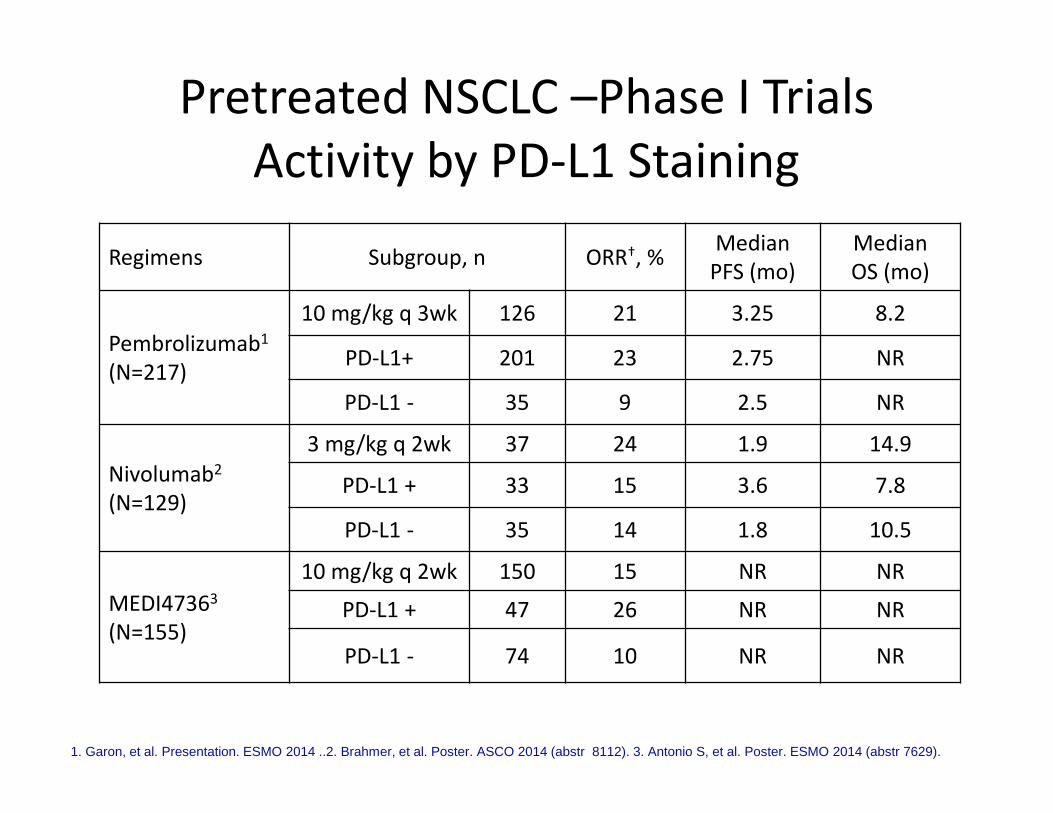
Pretreated NSCLC –Phase I Trials
Activity by PD-L1 Staining
Regimens Subgroup, n ORR†, %Median
PFS (mo)
Median
OS (mo)
Pembrolizumab1
(N=217)
10 mg/kg q 3wk 126 21 3.25 8.2
PD-L1+ 201 23 2.75 NR
PD-L1 - 35 9 2.5 NR
Nivolumab2
(N=129)
3 mg/kg q 2wk 37 24 1.9 14.9
PD-L1 + 33 15 3.6 7.8
PD-L1 - 35 14 1.8 10.5
MEDI47363
(N=155)
10 mg/kg q 2wk 150 15 NR NR
PD-L1 + 47 26 NR NR
PD-L1 - 74 10 NR NR
1. Garon, et al. Presentation. ESMO 2014 ..2. Brahmer, et al. Poster. ASCO 2014 (abstr 8112). 3. Antonio S, et al. Poster. ESMO 2014 (abstr 7629).
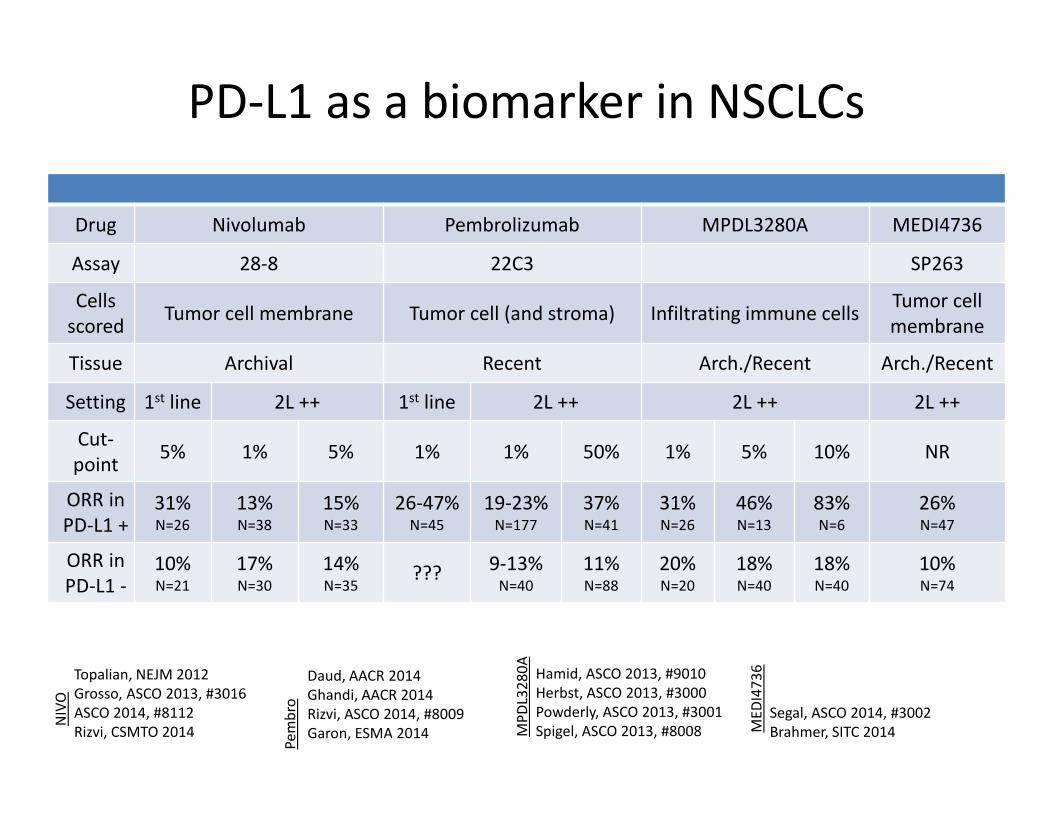
PD-L1 as a biomarker in NSCLCs
Drug Nivolumab Pembrolizumab MPDL3280A MEDI4736
Assay 28-8 22C3 SP263
Cells
scoredTumor cell membrane Tumor cell (and stroma) Infiltrating immune cells
Tumor cell
membrane
Tissue Archival Recent Arch./Recent Arch./Recent
Setting 1st line 2L ++ 1st line 2L ++ 2L ++ 2L ++
Cut-
point5% 1% 5% 1% 1% 50% 1% 5% 10% NR
ORR in
PD-L1 +31%N=26
13%N=38
15%N=33
26-47%N=45
19-23%N=177
37%N=41
31%N=26
46%N=13
83%N=6
26%N=47
ORR in
PD-L1 -10%N=21
17%N=30
14%N=35
???9-13%
N=40
11%N=88
20%N=20
18%N=40
18%N=40
10%N=74
Hamid, ASCO 2013, #9010
Herbst, ASCO 2013, #3000
Powderly, ASCO 2013, #3001
Spigel, ASCO 2013, #8008
Topalian, NEJM 2012
Grosso, ASCO 2013, #3016
ASCO 2014, #8112
Rizvi, CSMTO 2014
NIV
O
MP
DL3
28
0A
Daud, AACR 2014
Ghandi, AACR 2014
Rizvi, ASCO 2014, #8009
Garon, ESMA 2014
Pe
mb
ro Segal, ASCO 2014, #3002
Brahmer, SITC 2014ME
DI4
73
6
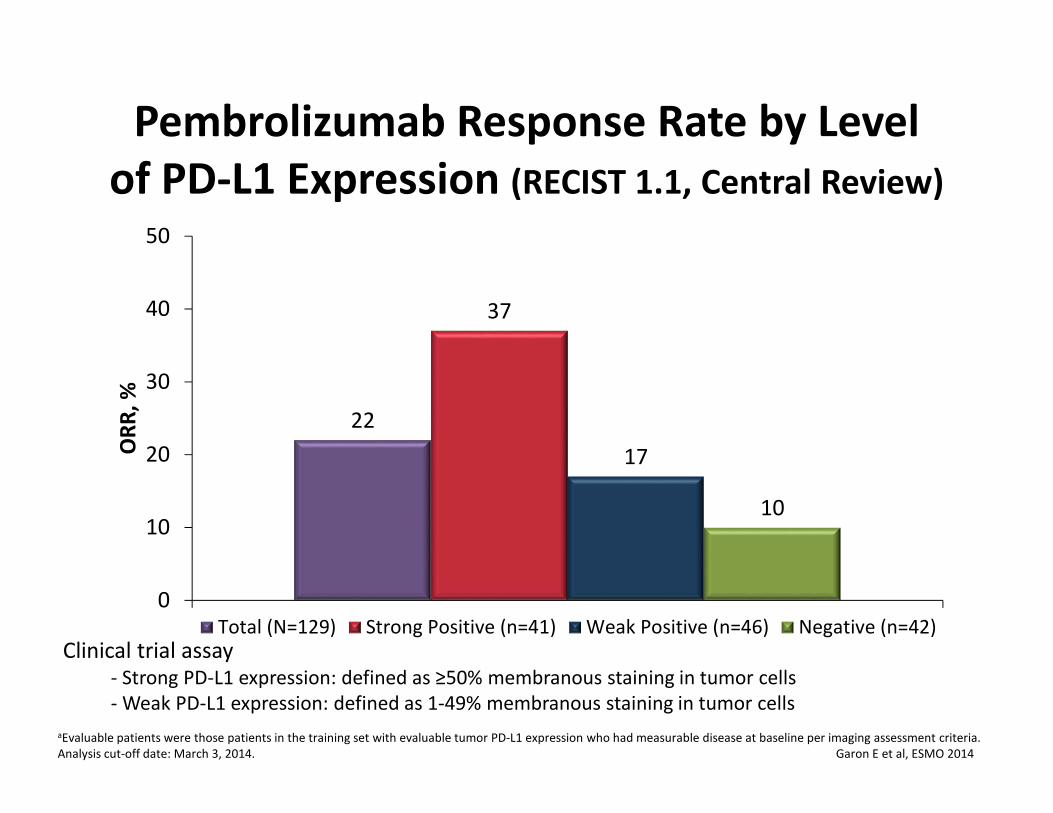
Pembrolizumab Response Rate by Level
of PD-L1 Expression (RECIST 1.1, Central Review)
aEvaluable patients were those patients in the training set with evaluable tumor PD-L1 expression who had measurable disease at baseline per imaging assessment criteria.
Analysis cut-off date: March 3, 2014. Garon E et al, ESMO 2014
22
37
17
10
0
10
20
30
40
50
OR
R,
%
Total (N=129) Strong Positive (n=41) Weak Positive (n=46) Negative (n=42)
Clinical trial assay- Strong PD-L1 expression: defined as ≥50% membranous staining in tumor cells
- Weak PD-L1 expression: defined as 1-49% membranous staining in tumor cells
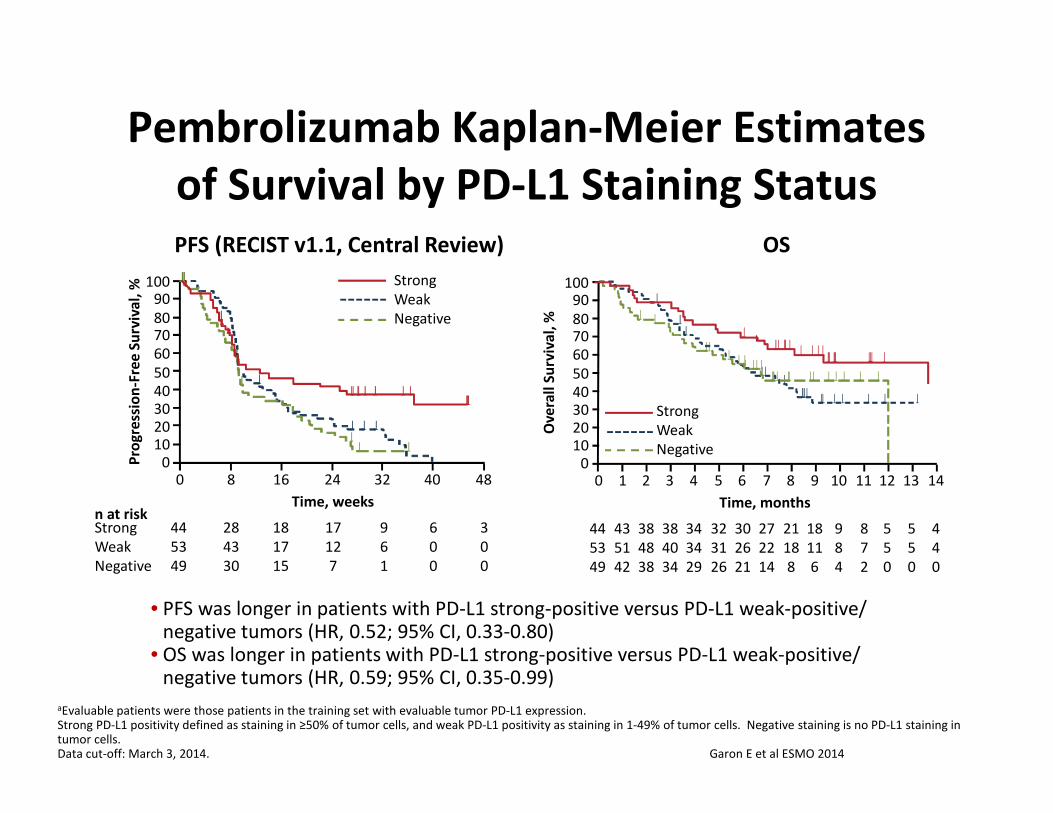
Pembrolizumab Kaplan-Meier Estimates
of Survival by PD-L1 Staining Status
aEvaluable patients were those patients in the training set with evaluable tumor PD-L1 expression. Strong PD-L1 positivity defined as staining in ≥50% of tumor cells, and weak PD-L1 positivity as staining in 1-49% of tumor cells. Negative staining is no PD-L1 staining in tumor cells. Data cut-off: March 3, 2014. Garon E et al ESMO 2014
• PFS was longer in patients with PD-L1 strong-positive versus PD-L1 weak-positive/ negative tumors (HR, 0.52; 95% CI, 0.33-0.80)
• OS was longer in patients with PD-L1 strong-positive versus PD-L1 weak-positive/ negative tumors (HR, 0.59; 95% CI, 0.35-0.99)
Ov
era
ll S
urv
iva
l, %
Strong
Weak
Negative
0 2 4 6 8 10 13
10090
8070
60
50
40
30
2010
0
Time, months
44
53
49
43
51
42
34
34
29
27
22
14
21
18
8
18
11
6
5
5
0
121197531
8
7
2
9
8
4
30
26
21
32
31
26
38
48
38
38
40
34
5
5
0
14
4
4
0
OSPFS (RECIST v1.1, Central Review)
0 8 16 24 32 40 48
10090
8070
60
50
40
30
2010
0Pro
gre
ssio
n-F
ree
Su
rviv
al,
%
Time, weeksn at riskStrong
Weak
Negative
44
53
49
28
43
30
18
17
15
17
12
7
9
6
1
6
0
0
3
0
0
Strong
Weak
Negative
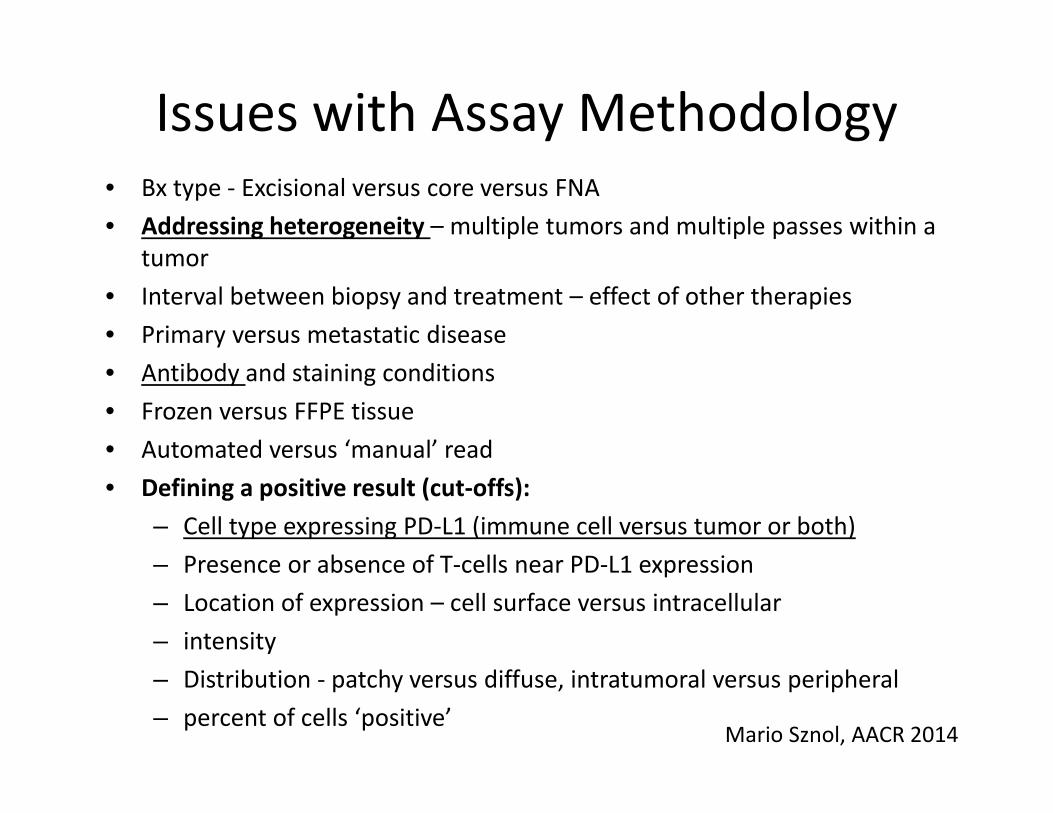
Issues with Assay Methodology• Bx type - Excisional versus core versus FNA
• Addressing heterogeneity – multiple tumors and multiple passes within a
tumor
• Interval between biopsy and treatment – effect of other therapies
• Primary versus metastatic disease
• Antibody and staining conditions
• Frozen versus FFPE tissue
• Automated versus ‘manual’ read
• Defining a positive result (cut-offs):
– Cell type expressing PD-L1 (immune cell versus tumor or both)
– Presence or absence of T-cells near PD-L1 expression
– Location of expression – cell surface versus intracellular
– intensity
– Distribution - patchy versus diffuse, intratumoral versus peripheral
– percent of cells ‘positive’ Mario Sznol, AACR 2014

Multiple Current Trials of PD -1 or PD-L1 inhibitors in Stage 4 NSCLC
• First Line Trials – PD -L1 + disease (ds)– Chemo vs. PD-1 Ab (Pembro and Nivo trials ongoing)
• Second Line Trials– Nivolumab vs. docetaxel in either Squam or Nonsquam
– both trials completed enrollment– Pembrolizumab vs. docetaxel in PD-L1 positive ds– MPDL-3280a vs. docetaxel
• Beyond 2 nd Line– MEDI-3476 vs. dealers choice chemotherapy– MPDL-3280a in PD-L1 positive ds– Phase 1s of combination therapies or expansion
cohorts ongoing with other PD-L1 Abs
How Can We Increase the Response Rate in Those Less Likely to
Respond?
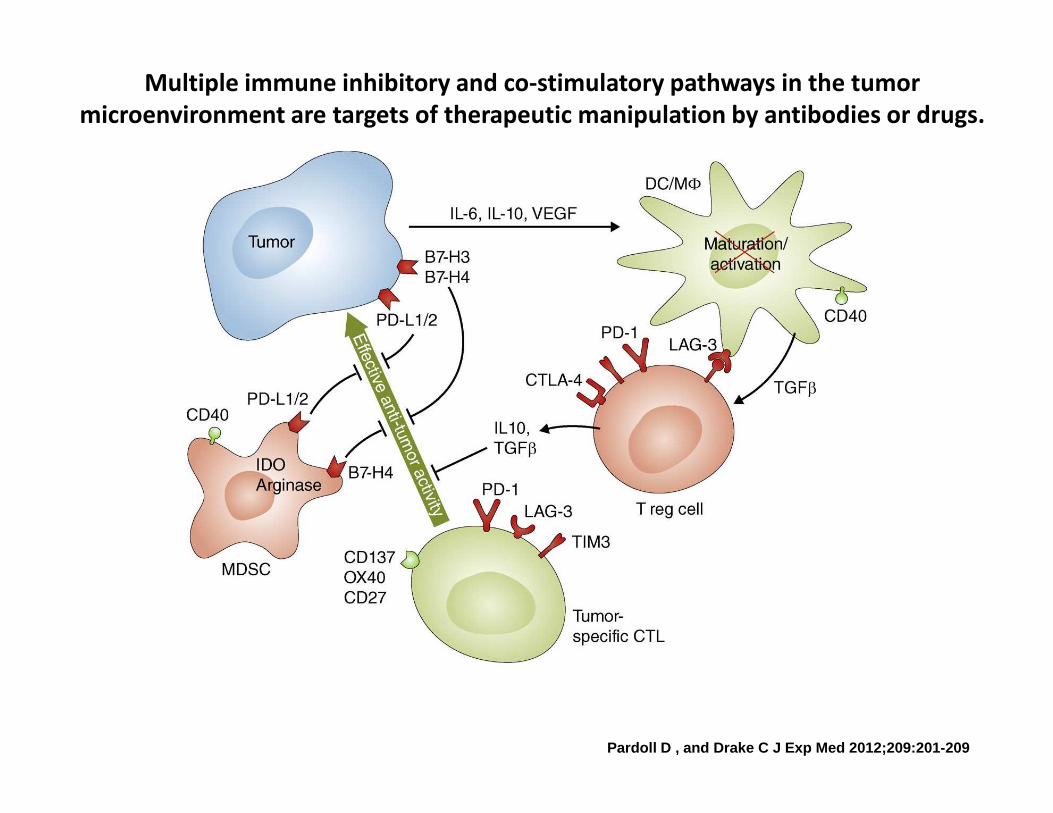
Multiple immune inhibitory and co-stimulatory pathways in the tumor
microenvironment are targets of therapeutic manipulation by antibodies or drugs.
Pardoll D , and Drake C J Exp Med 2012;209:201-209
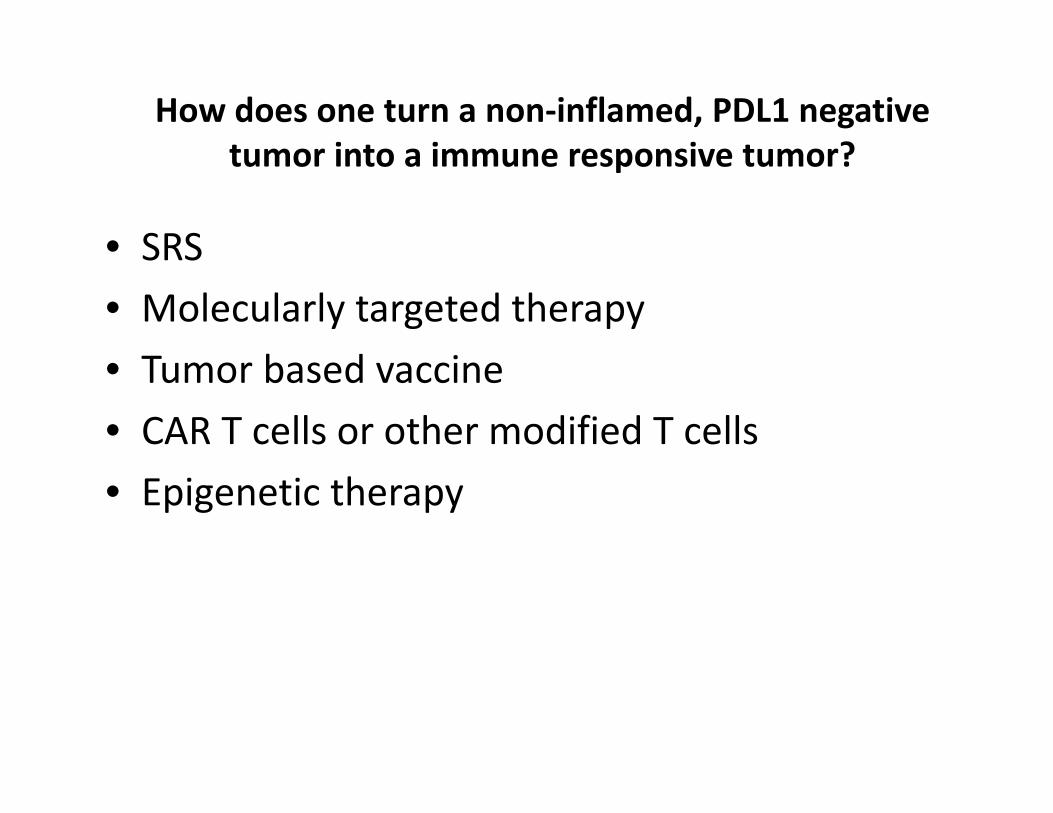
How does one turn a non-inflamed, PDL1 negative
tumor into a immune responsive tumor?
• SRS
• Molecularly targeted therapy
• Tumor based vaccine
• CAR T cells or other modified T cells
• Epigenetic therapy

Epigenetic Priming of Immunotherapy
Metastatic NSCLC
1 – 2 prior therapies
ECOG PS 0 - 1
Metastatic NSCLC
1 – 2 prior therapies
ECOG PS 0 - 1
Azacitidine 40 mg/m2 SC d 1-6, 8-
10Entinostat 7mg PO
days 3 + 1028 day cycle x 2
N=60
Azacitidine 40 mg/m2 SC d 1-6, 8-
10Entinostat 7mg PO
days 3 + 1028 day cycle x 2
N=60
Nivolumab3 mg/kg IV q 2
weeksUntil progression
Nivolumab3 mg/kg IV q 2
weeksUntil progression
R
Nivolumab3 mg/kg IV q 2
weeksUntil progression
N=30
Nivolumab3 mg/kg IV q 2
weeksUntil progression
N=30
2
1
BiopsyBiopsy
Primary endpoint – PFS rate at 32 weeks
Secondary endpoints – RR, PFS, TTP, OS, safety, lab correlates

Cancer Management in the
Anti–PD-1/PD-L1 Era – The need for
Personalized Immunotherapy
Features likely for response
Features unlikely for response
Combination immunotherapy
Durable response
Mixed response or delayed progression
•.•.
•. •.
•.•.•. •.
Standard treatment or
Adapted from Rizvi N, LALCA 2014
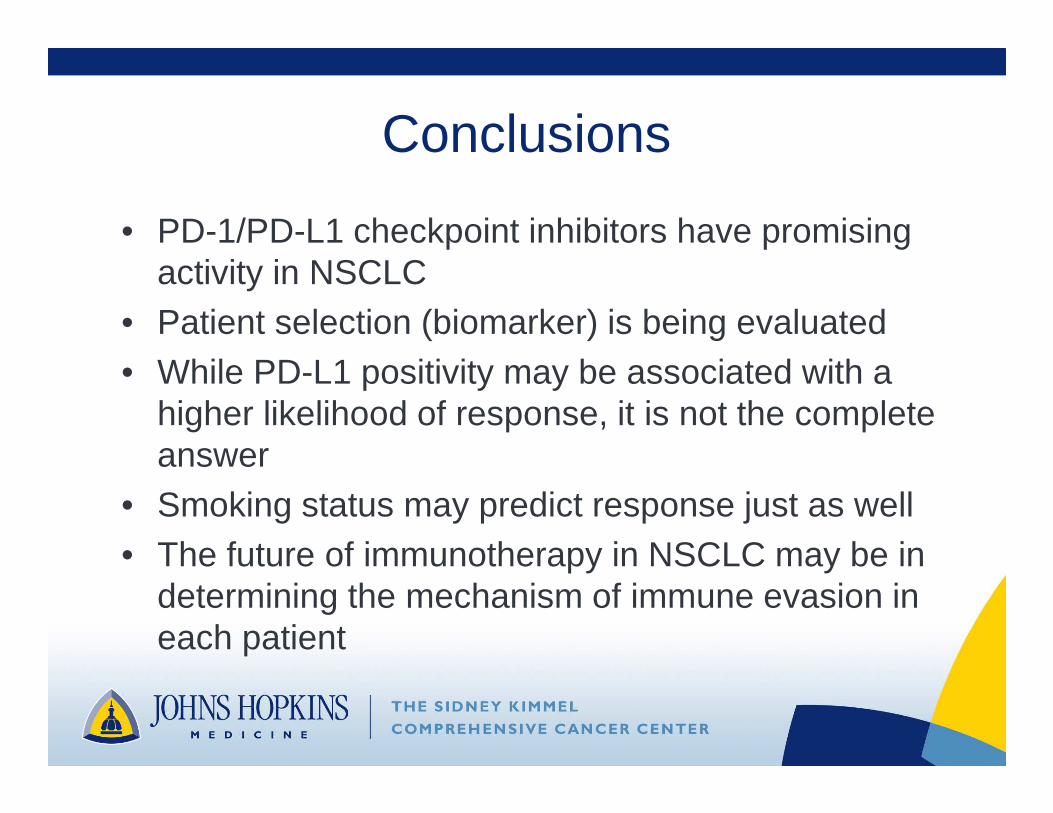
Conclusions
• PD-1/PD-L1 checkpoint inhibitors have promising activity in NSCLC
• Patient selection (biomarker) is being evaluated• While PD-L1 positivity may be associated with a
higher likelihood of response, it is not the complete answer
• Smoking status may predict response just as well• The future of immunotherapy in NSCLC may be in
determining the mechanism of immune evasion in each patient
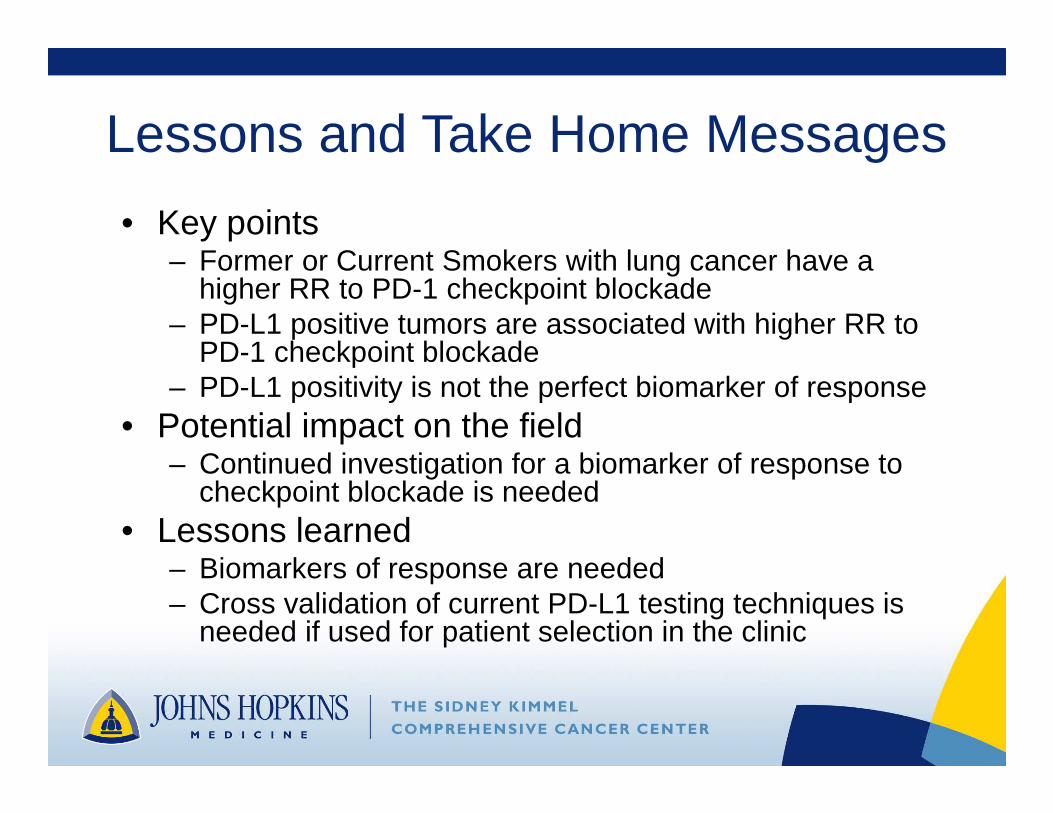
Lessons and Take Home Messages
• Key points– Former or Current Smokers with lung cancer have a
higher RR to PD-1 checkpoint blockade– PD-L1 positive tumors are associated with higher RR to
PD-1 checkpoint blockade– PD-L1 positivity is not the perfect biomarker of response
• Potential impact on the field– Continued investigation for a biomarker of response to
checkpoint blockade is needed• Lessons learned
– Biomarkers of response are needed– Cross validation of current PD-L1 testing techniques is
needed if used for patient selection in the clinic