Biomarkers and Cardiovascular Risk Assessment for Primary ... · protein, B-type natriuretic...
11
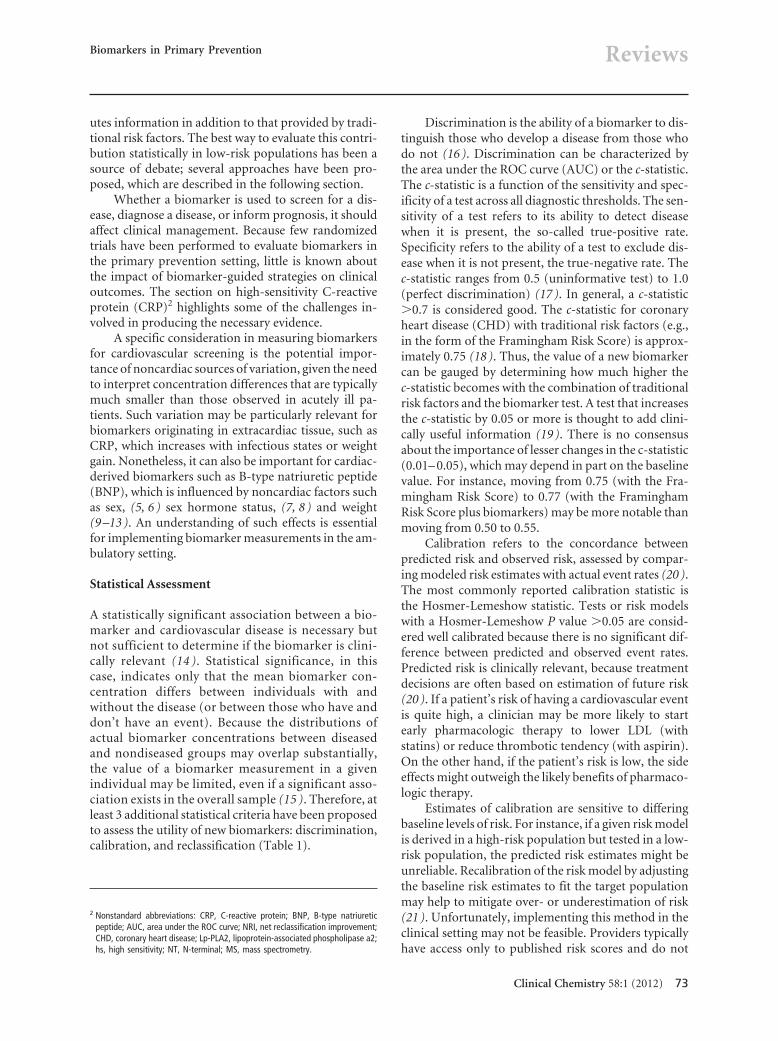
Biomarkers and Cardiovascular Risk Assessment for Primary Prevention: An Update Lauren G. Gilstrap 1 and Thomas J. Wang 1* BACKGROUND: Interest in cardiovascular biomarkers in primary prevention has increased dramatically in the past decade. This increase has been fueled by an im- proved understanding of cardiovascular pathophysiol- ogy, as well as novel technologies for biomarker identification. CONTENT: In this review we provide a brief overview of recent concepts in the evaluation of screening bio- markers, because biomarkers may behave differently when used for screening as opposed to diagnosis or disease staging. The following specific biomarker ex- amples are then discussed, with a focus on data from primary prevention studies: high-sensitivity C-reactive protein, B-type natriuretic peptide, lipoprotein- associated phospholipase A2, and high-sensitivity tro- ponin T. The article concludes by addressing novel platforms for biomarker discovery, reviewing recent examples from the field of metabolomics. SUMMARY: An ongoing challenge is to develop screen- ing strategies that can identify individuals at risk for cardiovascular events well before symptoms appear. For this purpose, the measurement of soluble biomark- ers could be an important adjunct to traditional car- diovascular risk assessment. Recent studies highlight both the strengths and limitations of “novel” circulat- ing biomarkers, and suggest that substantial work is still needed to identify biomarkers that are sufficiently accurate and cost-effective for routine use in primary prevention. © 2011 American Association for Clinical Chemistry Interest in cardiovascular biomarkers in primary pre- vention has increased dramatically in the past decade. This increase has been fueled by advances in genetic and molecular research, which have yielded insight about early cardiovascular pathophysiology and simul- taneously provided novel platforms for biomarker dis- covery (1). Another factor contributing to the in- creased focus on early screening tests has been the recognition that traditional cardiovascular risk factors (e.g., hypertension, hyperlipidemia, smoking, diabe- tes) do not fully explain interindividual variation in cardiovascular risk. For instance, a large proportion of individuals who develop cardiovascular disease have few or no risk factors (2). The challenge for physicians, researchers, and clinical chemists is to develop screening strategies that safely, accurately, and cost-effectively identify individ- uals at risk for cardiovascular events well before symp- toms appear. Preventive interventions are likely to be most effective in this period, because atherosclerosis can take decades to manifest. The measurement of “novel” biomarkers could be an important component of these strategies. Although a biomarker can be any- thing that reflects a biological process—from genetic markers to imaging tests—soluble biomarkers are par- ticularly attractive because they are easy to obtain and generally reproducible (3). Because biomarkers may behave differently when used for screening as opposed to diagnosis or disease staging, a distinct set of metrics has arisen to assess screening biomarkers. Thus, we begin this review with a brief overview of recent concepts in the evaluation of screening biomarkers. Then, we describe a few specific examples from the recent literature. For the sake of this review, only circulating biomarkers will be discussed. General Considerations In 2007, Morrow and de Lemos outlined 3 criteria for evaluating novel biomarkers: (a) ease of measurement; (b) addition of information; and (c) effect on manage- ment (4). The first criterion is typically straightforward to assess. Indeed, one of the advantages of soluble bio- markers is that standardized, reproducible assays exist for most biomarkers of interest. In contrast, addressing the second criterion—the incremental information from measuring a biomarker— can be challenging. In cardiology, a biomarker is useful only when it contrib- 1 Cardiology Division and Department of Medicine, Massachusetts General Hos- pital, Harvard Medical School, Boston, MA. * Address correspondence to this author at: Cardiology Division, GRB-800, Mas- sachusetts General Hospital, Boston, MA 02114. Fax 617-726-4105; e-mail [email protected]. Received August 1, 2011; accepted September 16, 2011. Previously published online at DOI: 10.1373/clinchem.2011.165712 Clinical Chemistry 58:1 72–82 (2012) Reviews 72
Transcript of Biomarkers and Cardiovascular Risk Assessment for Primary ... · protein, B-type natriuretic...
Biomarkers and Cardiovascular Risk Assessment forPrimary Prevention:
An UpdateLauren G. Gilstrap1 and Thomas J. Wang1*
BACKGROUND: Interest in cardiovascular biomarkers inprimary prevention has increased dramatically in thepast decade. This increase has been fueled by an im-proved understanding of cardiovascular pathophysiol-ogy, as well as novel technologies for biomarkeridentification.
CONTENT: In this review we provide a brief overview ofrecent concepts in the evaluation of screening bio-markers, because biomarkers may behave differentlywhen used for screening as opposed to diagnosis ordisease staging. The following specific biomarker ex-amples are then discussed, with a focus on data fromprimary prevention studies: high-sensitivity C-reactiveprotein, B-type natriuretic peptide, lipoprotein-associated phospholipase A2, and high-sensitivity tro-ponin T. The article concludes by addressing novelplatforms for biomarker discovery, reviewing recentexamples from the field of metabolomics.
SUMMARY: An ongoing challenge is to develop screen-ing strategies that can identify individuals at risk forcardiovascular events well before symptoms appear.For this purpose, the measurement of soluble biomark-ers could be an important adjunct to traditional car-diovascular risk assessment. Recent studies highlightboth the strengths and limitations of “novel” circulat-ing biomarkers, and suggest that substantial work isstill needed to identify biomarkers that are sufficientlyaccurate and cost-effective for routine use in primaryprevention.© 2011 American Association for Clinical Chemistry
Interest in cardiovascular biomarkers in primary pre-vention has increased dramatically in the past decade.This increase has been fueled by advances in genetic
and molecular research, which have yielded insightabout early cardiovascular pathophysiology and simul-taneously provided novel platforms for biomarker dis-covery (1 ). Another factor contributing to the in-creased focus on early screening tests has been therecognition that traditional cardiovascular risk factors(e.g., hypertension, hyperlipidemia, smoking, diabe-tes) do not fully explain interindividual variation incardiovascular risk. For instance, a large proportion ofindividuals who develop cardiovascular disease havefew or no risk factors (2 ).
The challenge for physicians, researchers, andclinical chemists is to develop screening strategies thatsafely, accurately, and cost-effectively identify individ-uals at risk for cardiovascular events well before symp-toms appear. Preventive interventions are likely to bemost effective in this period, because atherosclerosiscan take decades to manifest. The measurement of“novel” biomarkers could be an important componentof these strategies. Although a biomarker can be any-thing that reflects a biological process—from geneticmarkers to imaging tests—soluble biomarkers are par-ticularly attractive because they are easy to obtain andgenerally reproducible (3 ).
Because biomarkers may behave differently whenused for screening as opposed to diagnosis or diseasestaging, a distinct set of metrics has arisen to assessscreening biomarkers. Thus, we begin this review witha brief overview of recent concepts in the evaluation ofscreening biomarkers. Then, we describe a few specificexamples from the recent literature. For the sake of thisreview, only circulating biomarkers will be discussed.
General Considerations
In 2007, Morrow and de Lemos outlined 3 criteria forevaluating novel biomarkers: (a) ease of measurement;(b) addition of information; and (c) effect on manage-ment (4 ). The first criterion is typically straightforwardto assess. Indeed, one of the advantages of soluble bio-markers is that standardized, reproducible assays existfor most biomarkers of interest. In contrast, addressingthe second criterion—the incremental informationfrom measuring a biomarker— can be challenging. Incardiology, a biomarker is useful only when it contrib-
1 Cardiology Division and Department of Medicine, Massachusetts General Hos-pital, Harvard Medical School, Boston, MA.
* Address correspondence to this author at: Cardiology Division, GRB-800, Mas-sachusetts General Hospital, Boston, MA 02114. Fax 617-726-4105; [email protected].
Received August 1, 2011; accepted September 16, 2011.Previously published online at DOI: 10.1373/clinchem.2011.165712
Clinical Chemistry 58:172–82 (2012) Reviews
72
utes information in addition to that provided by tradi-tional risk factors. The best way to evaluate this contri-bution statistically in low-risk populations has been asource of debate; several approaches have been pro-posed, which are described in the following section.
Whether a biomarker is used to screen for a dis-ease, diagnose a disease, or inform prognosis, it shouldaffect clinical management. Because few randomizedtrials have been performed to evaluate biomarkers inthe primary prevention setting, little is known aboutthe impact of biomarker-guided strategies on clinicaloutcomes. The section on high-sensitivity C-reactiveprotein (CRP)2 highlights some of the challenges in-volved in producing the necessary evidence.
A specific consideration in measuring biomarkersfor cardiovascular screening is the potential impor-tance of noncardiac sources of variation, given the needto interpret concentration differences that are typicallymuch smaller than those observed in acutely ill pa-tients. Such variation may be particularly relevant forbiomarkers originating in extracardiac tissue, such asCRP, which increases with infectious states or weightgain. Nonetheless, it can also be important for cardiac-derived biomarkers such as B-type natriuretic peptide(BNP), which is influenced by noncardiac factors suchas sex, (5, 6 ) sex hormone status, (7, 8 ) and weight(9 –13 ). An understanding of such effects is essentialfor implementing biomarker measurements in the am-bulatory setting.
Statistical Assessment
A statistically significant association between a bio-marker and cardiovascular disease is necessary butnot sufficient to determine if the biomarker is clini-cally relevant (14 ). Statistical significance, in thiscase, indicates only that the mean biomarker con-centration differs between individuals with andwithout the disease (or between those who have anddon’t have an event). Because the distributions ofactual biomarker concentrations between diseasedand nondiseased groups may overlap substantially,the value of a biomarker measurement in a givenindividual may be limited, even if a significant asso-ciation exists in the overall sample (15 ). Therefore, atleast 3 additional statistical criteria have been proposedto assess the utility of new biomarkers: discrimination,calibration, and reclassification (Table 1).
Discrimination is the ability of a biomarker to dis-tinguish those who develop a disease from those whodo not (16 ). Discrimination can be characterized bythe area under the ROC curve (AUC) or the c-statistic.The c-statistic is a function of the sensitivity and spec-ificity of a test across all diagnostic thresholds. The sen-sitivity of a test refers to its ability to detect diseasewhen it is present, the so-called true-positive rate.Specificity refers to the ability of a test to exclude dis-ease when it is not present, the true-negative rate. Thec-statistic ranges from 0.5 (uninformative test) to 1.0(perfect discrimination) (17 ). In general, a c-statistic�0.7 is considered good. The c-statistic for coronaryheart disease (CHD) with traditional risk factors (e.g.,in the form of the Framingham Risk Score) is approx-imately 0.75 (18 ). Thus, the value of a new biomarkercan be gauged by determining how much higher thec-statistic becomes with the combination of traditionalrisk factors and the biomarker test. A test that increasesthe c-statistic by 0.05 or more is thought to add clini-cally useful information (19 ). There is no consensusabout the importance of lesser changes in the c-statistic(0.01– 0.05), which may depend in part on the baselinevalue. For instance, moving from 0.75 (with the Fra-mingham Risk Score) to 0.77 (with the FraminghamRisk Score plus biomarkers) may be more notable thanmoving from 0.50 to 0.55.
Calibration refers to the concordance betweenpredicted risk and observed risk, assessed by compar-ing modeled risk estimates with actual event rates (20 ).The most commonly reported calibration statistic isthe Hosmer-Lemeshow statistic. Tests or risk modelswith a Hosmer-Lemeshow P value �0.05 are consid-ered well calibrated because there is no significant dif-ference between predicted and observed event rates.Predicted risk is clinically relevant, because treatmentdecisions are often based on estimation of future risk(20 ). If a patient’s risk of having a cardiovascular eventis quite high, a clinician may be more likely to startearly pharmacologic therapy to lower LDL (withstatins) or reduce thrombotic tendency (with aspirin).On the other hand, if the patient’s risk is low, the sideeffects might outweigh the likely benefits of pharmaco-logic therapy.
Estimates of calibration are sensitive to differingbaseline levels of risk. For instance, if a given risk modelis derived in a high-risk population but tested in a low-risk population, the predicted risk estimates might beunreliable. Recalibration of the risk model by adjustingthe baseline risk estimates to fit the target populationmay help to mitigate over- or underestimation of risk(21 ). Unfortunately, implementing this method in theclinical setting may not be feasible. Providers typicallyhave access only to published risk scores and do not
2 Nonstandard abbreviations: CRP, C-reactive protein; BNP, B-type natriureticpeptide; AUC, area under the ROC curve; NRI, net reclassification improvement;CHD, coronary heart disease; Lp-PLA2, lipoprotein-associated phospholipase a2;hs, high sensitivity; NT, N-terminal; MS, mass spectrometry.
Biomarkers in Primary Prevention Reviews
Clinical Chemistry 58:1 (2012) 73

have the luxury of recalibrating risk scores to reflecttheir individual patient populations (16 ).
Reclassification refers to the ability of a test tochange an individual’s risk classification. Because re-classification is based on risk categories, it is potentiallythe most clinically relevant criterion, because treat-ment decisions are often linked to whether a patient isconsidered high risk or low risk rather than on theirspecific predicted event rate. On the other hand, theusefulness of reclassification relies on the existence ofwell-established risk categories. For cardiovascular dis-ease, the Adult Treatment Panel III is the most com-monly used risk stratification algorithm (22 ). It incor-porates the traditional risk factors of the FraminghamRisk Score and categorizes individuals as low, interme-diate, or high risk, on the basis of their 10-year pre-dicted risk of CHD. Low-risk individuals are those whohave a �10% predicted risk of a CHD event over 10years. Intermediate- risk individuals have a 10%–19%predicted risk, and high-risk individuals have a 20% orgreater predicted risk (23 ). According to the AdultTreatment Panel III, individuals in the high-risk groupwarrant more aggressive medical intervention, specifi-cally initiation of a statin with an LDL goal of �70mg/dL (14 ). If the addition of one or more biomarkersto traditional risk factors changed the risk categori-
zation of a given patient, it could affect theirmanagement.
Reclassification can be described by estimating theproportion of individuals in a population who are re-classified, although this metric doesn’t account forwhether the reclassification is “correct” or not. Pencinaand colleagues have proposed a metric known as thenet reclassification improvement (NRI), which sum-marizes the net proportion of individuals with “cor-rect” reclassification (e.g., those who develop eventswho were up-classified, and those who don’t developevents who were down-classified) and “incorrect” re-classification (those who develop events who weredown-classified, and those who don’t develop eventswho were up-classified) (24 ). They have recently ex-tended this concept to include a “category-free” NRI,which does not depend on the existence of fixed riskcategories (25 ).
There are advantages and limitations to each cri-terion for evaluating biomarkers. The c-statistic (dis-crimination) is easily understood, in that it is a func-tion of sensitivity and specificity and does not rely onspecific thresholds or categories. Nonetheless, it is of-ten quite challenging for a new biomarker to raise thec-statistic when existing models, such as the Framing-ham Risk Score, already discriminate well. Biomarkers
Table 1. Selected criteria for a ssessing the incremental predictive value of new biomarkers.a
Metric(s) Attribute Description Advantages Limitations
c-Statistic, AUC Discrimination Captures the sensitivity andspecificity of a marker,across a full range ofcutpoints
• Easily understood • Difficult for newbiomarkers to raise thec-statistic whenexisting variablesdiscriminate well
• No reliance on specificthresholds or categories
Hosmer-Lemeshowstatistic
Calibration Assesses concordancebetween predicted andobserved event rates inlongitudinal data
• Assesses accuracy of predictedrisks (basis for clinicaldecisions)
• Relatively insensitive todifferences betweenmodels
• Provides a globalmeasure, even thoughclinical decisions maybe based on predictedrisks within a relativelynarrow range
Net reclassificationimprovement
Reclassification Assesses the proportion ofindividuals reclassifiedcorrectly by the additionof new biomarker(s)
• Clinically relevant when riskcategories are linked totreatment decisions
• Sensitive to changes inthe number of riskcategories and choiceof cut points
• Incorporates the accuracy ofreclassification
• Gives same weight toreclassifications thatare unlikely to affectclinical decisions
a Adapted from Wang et al. (16 ), with permission.
Reviews
74 Clinical Chemistry 58:1 (2012)

could provide clinically important information despitesmall increments in the c-statistic. The Hosmer-Lemeshow statistic (calibration) assesses the accuracyof predicted risk estimates, which are the basis for mostclinical decisions. However, as noted, recalibration ofmodels may be necessary when applied to differentpopulations. Furthermore, as with discrimination, itmay be difficult to measure improvement in calibra-tion when baseline models are already well calibrated(e.g., when the Hosmer-Lemeshow statistic already hasa P-value �0.05). Reclassification has clinical relevancebecause practice guidelines typically refer to predeter-mined risk categories. The dependence of reclassifica-tion metrics on the number of risk categories and thechoice of cutpoints has been noted earlier. Further-more, reclassification metrics generally do not takeinto account whether the shift in risk classificationwould lead to a change in clinical management (16 ).Thus, it has been proposed that studies addressing bio-markers in primary prevention should describe theperformance of new biomarkers according each ofthese complementary criteria (26 ).
Specific Biomarkers
Over the past decade, multiple new cardiac biomarkershave emerged. Below, we discuss several examplesof established biomarkers (CRP, BNP) and newerbiomarkers [lipoprotein-associated phospholipaseA2 V(Lp-PLA2) and high-sensitivity troponin (hs-troponin)]. We then review findings from one of thenewer platforms for biomarker discovery (metabolo-mics). These examples are meant to be illustrative,rather than providing a comprehensive description ofavailable cardiovascular biomarkers.
HIGH-SENSITIVITY CRP
CRP was originally discovered by Tillett and Francis in1930. It was found in the serum of patients with acuteinflammation and was noted to react with the C poly-saccharide of pneumococcus, hence its name (27 ).CRP is an acute-phase reactant, produced primarilyby hepatocytes in response to stimulation frominterlukin-6 and tumor necrosis factor-� (28 ). Typi-cally, CRP binds to phosphocholine expressed on thesurface of dead or dying cells and activates the comple-ment system via the C1Q complex (29 ).
CRP is a 224-residue protein with an annular, pen-tameric disc shape. In general, circulating CRP concen-trations can increase up to 50 000 –fold in acute inflam-mation (i.e., infection) within 6 h. CRP typically peaksat 48 h. Because the half-life of CRP is constant, thedegree of increase is determined by the severity of theprecipitating cause (30 ). Intraindividual variability ofCRP in healthy individuals has been studied by several
groups. For instance, Macy et al. found an intraindi-vidual variability (CVI) of 42%, compared with abetween-individual variability (CVG) of 93% (31 ). Theindex of individuality (CVI/CVG) of 0.46 is comparableto other analytes such as total cholesterol. Anotherstudy, involving Framingham Heart Study partici-pants, examined the rank stability of long-term CRPmeasurements. Between 2 routine examinations (amean of 16 years apart), approximately half of the morethan 2000 individuals studied remained within thesame quintile of CRP values (32 ).
In the past 15 years, more than 20 epidemiologicalstudies have demonstrated a significant association be-tween increased CRP concentrations as measured byuse of high-sensitivity assays (hs-CRP) and the risk of afirst cardiovascular event among asymptomatic pa-tients (33, 34, 35 ). A metaanalysis of 22 studies by theUS Preventive Services Task Force indicated that hs-CRP concentrations greater than or equal to 3 mg/Lwere associated with a 60% increased risk of cardiovas-cular disease (36 ). The degree to which addition of hs-CRP measurement improves the predictive accuracy oftraditional risk stratification models, however, hasbeen controversial. Studies in low-risk populationshave generally shown modest increases in the c-statisticwith the addition of hs-CRP, from 0.0 to 0.02 (37 ). Thesame studies have shown only modest or absent in-creases in global calibration measures. On the otherhand, investigators from the Women’s Health Studyreported that the addition of hs-CRP reclassified asignificant proportion of individuals, including ap-proximately 20% of those at “intermediate risk.”The majority of the reclassification for intermediate-risk individuals (roughly 75%) were down-classifications into the low risk group (37 ).
The JUPITER (Justification for the Use of Statinsin Primary Prevention: An Intervention Trial Evaluat-ing Rosuvastatin) study was a large, primary preven-tion trial with a potent statin medication (rosuvastatin)(38 ). Its use of hs-CRP concentrations as one of theinclusion criteria makes it one of the few major ran-domized controlled trials in cardiology to incorporatebiomarker-directed therapy. JUPITER enrolled nearly18 000 individuals (men �50 and women �60 yearsold) with LDL concentrations less that 130 mg/dL, buths-CRP concentrations �2 mg/L. The study wasstopped early due to an approximately 40% reductionin the composite cardiovascular end point with rosuv-astatin compared with placebo. Because the study didnot randomize individuals with hs-CRP concentration�2 mg/L, it is uncertain whether screening with hs-CRP is necessary to identify older adults who wouldbenefit from statin therapy. In the 2010 American Col-lege of Cardiology Foundation/American Heart Asso-ciation Guideline for Assessment of Cardiovascular
Biomarkers in Primary Prevention Reviews
Clinical Chemistry 58:1 (2012) 75
Risk in Asymptomatic Adults, the measurement of hs-CRP in older men and women with LDL �130 mg/dLto aid in the decision to use statins was given a class IIarecommendation (39 ). Overall, measuring hs-CRP forcardiovascular risk assessment in men �50 yearsand women �60 years was given a class IIbrecommendation.
B-TYPE NATRIURETIC PEPTIDE
BNP is a member of a family of hormones known as thenatriuretic peptides. The natriuretic peptides are syn-thesized primarily in the heart, and upregulated bymyocardial wall stress (40 ). The gene that encodes BNP[natriuretic peptide B (NPPB)3] initially producespreproBNP. PreproBNP is cleaved to form proBNP, a108 –amino acid peptide precursor. Finally, proBNP iscleaved by the enzyme corin, forming the biologicallyactive C-terminal fragment (mature BNP) as well asthe inactive N-terminal fragment (NT-proBNP). Al-though both BNP and NT-proBNP can be measured inplasma, the latter has a longer half-life (1–2 h, com-pared with 20 min). In ambulatory populations, morethan 90% of individuals have detectable NT-proBNPconcentrations, compared with roughly 70% for BNP(41 ).
Both BNP and NT-proBNP are markedly increasedin individuals with acute heart failure (42), which makesthem valuable biomarkers in the setting of suspected heartfailure. Interestingly, within the “normal” reference inter-val of values, there is significant variation in BNP amongapparently healthy individuals, and this variation is prog-nostically significant (43). For example, in the Framing-ham Offspring Study, BNP concentrations �20 pg/mLwere associated with a 60%–200% increased risk of car-diovascular events, stroke, heart failure, and all-causemortality during a mean follow-up of 5.2 years (45). Arecent metaanalysis of 40 prospective studies, approxi-mately half of which were performed in primary preven-tion populations, found consistently strong associationsbetween BNP concentrations and cardiovascular risk(Fig. 1) (46). Subtle increases in BNP could reflect in-creased ventricular wall stress resulting from subclinicalischemia, high afterload, or increased neurohormonal ac-tivation. Interestingly, the association between BNP andfuture events persists even after adjustment for standardechocardiographic measures (45).
There are fewer data on whether BNP measure-ments improve discrimination, calibration, or re-classification for predicting cardiovascular events,on top of traditional risk factors. In the Malmo Diet
and Cancer cohort, NT-proBNP was evaluated alongwith CRP, lipoprotein-associated phospholipase 2,midregional proadrenomedullin, and cystatin C(41 ). During more than 12 years of follow up, NT-proBNP predicted cardiovascular and coronaryevents, even after adjusting for CRP and other bio-markers. In the whole sample, there was only a mod-est increase in c-statistic, and a nonsignificant NRI.Results were stronger when analyses were restrictedto intermediate-risk individuals, in whom signifi-cant NRIs were noted (ranging from 5% to 15%).Most of the correct reclassification consisted of“down-classification” to lower risk categories.
LIPOPROTEIN-ASSOCIATED PHOSPHOLIPASE A2
Lp-PLA2 is a 441–amino acid protein, encoded by thephospholipase A2, group VII (platelet-activating factoracetylhydrolase, plasma) (PLA2G7) gene, which is pro-duced by inflammatory cells. It circulates mainly withLDL (�20% is associated with HDL or remnant lipo-proteins), and it is responsible for hydrolyzing oxidizedphospholipids in LDL. Specifically, it catalyzes the deg-radation (hydrolysis) of platelet activating factor to in-active products (47 ). It is highly upregulated in athero-sclerotic plaques, and may be directly involved indevelopment of atherosclerosis (48 ) and plaque rup-ture (49 ). Because it is produced by macrophages andfoam cells in the vascular intima, Lp-PLA2 is thoughtto be potentially more specific for vascular inflamma-tion than other inflammatory markers, such as CRP(50 ).
Early in vivo studies showed that both rabbits andhumans with increased concentrations of circulatingLp-PLA2 have a higher plaque burden in the coronaryarteries than those with normal concentrations (51 ).Furthermore, it has been shown experimentally thatinhibiting Lp-PLA2 leads to a reduction in atheroscle-rotic lesions in hyperlipidemic rabbits (51 ). Given itslow biological variation, specificity for the vasculature,and association with atherosclerotic plaque burden,Lp-PLA2 has been proposed as a potential biomarkerfor identifying individuals at increased risk of cardio-vascular disease.
There have been more than 10 studies assessing therole of Lp-PLA2 in primary prevention. For instance,in the West of Scotland Coronary Prevention Studystudy, both hs-CRP and Lp-PLA2 were significantlyassociated with increased cardiovascular risk (52 ). Fur-thermore, after adjustment for traditional risk factors,Lp-PLA2 maintained its association whereas hs-CRPdid not (52 ). In the Atherosclerosis Risk in Communi-ties study, the weighted mean of both Lp-PLA2 andhs-CRP were higher in those who went on to developcoronary events than in those who did not (53). As withBNP, there are fewer data regarding the impact of Lp-
3 Human genes: NPPB, natriuretic peptide B; PLA2G7, phospholipase A2, groupVII (platelet-activating factor acetylhydrolase, plasma).
Reviews
76 Clinical Chemistry 58:1 (2012)

PLA2 measurements on discrimination, calibration, orreclassification. A recent nested case-control study fromthe Nurses Health Study examined discrimination withLp-PLA2 in women (54). The additional of Lp-PLA2
raised the c-statistic from 0.72 to 0.733, and improved netreclassification. In contrast, a report from the Malmo Dietand Cancer Study suggested nonsignificant changes indiscrimination and reclassification (41).
Fig. 1. Relative risks for cardiovascular disease (CVD) in individuals in the top vs bottom third of baseline BNP orNT-proBNP concentration, according to different study characteristics.
Reproduced with permission from Di Angelantonio et al. (46 ).
Biomarkers in Primary Prevention Reviews
Clinical Chemistry 58:1 (2012) 77

HIGH-SENSITIVITY TROPONIN
In 1963, Ebashi and colleagues discovered that a newmyofibrillar protein, troponin, was integral to bothskeletal and cardiac muscle contraction (55 ). Troponinhas 3 subunits: troponin C, I, and T. Troponin C isresponsible for sensing and responding to the presenceof calcium. Troponin T binds tropomyosin, formingthe troponin–tropomyosin complex. Troponin I bindsto actin in thin myofilaments, and holds the troponin–tropomyosin complex in place (56 ).
Cardiac troponins have become the standard bio-marker in the diagnosis of acute myocardial infarction.On the basis of consensus guidelines, a troponin con-centration above the 99th percentile (of a healthy pop-ulation) is considered diagnostic of an acute myocar-dial infarction. With conventional troponin assays,troponin concentrations are undetectable in the vastmajority of healthy individuals. However, newer gen-erations of cardiac troponin I and T assays, the so-called high-sensitivity assays, permit detection of con-centrations significantly lower than the 99th percentile
of the normal reference population (57 ). The hs-troponin assay, which can detect picomolar concentra-tions of troponin, has increased the sensitivity of acutemyocardial infarction diagnosis and introduced otherpotential clinical applications (58 ).
There have been 3 recent cohort studies examiningthe clinical utility of hs-troponins. A recent study by deLemos et al. measured troponin T concentrations usingboth standard and highly sensitive assays in over 3500adults in the Dallas Heart Study (59). The prevalence ofdetectable troponin T was 25% with the high-sensitivityassay, compared with only 0.7% for the conventional as-say. The investigators found that hs-troponin T concen-trations were associated with baseline structural heart dis-ease (as determined based on MRI) and all-cause andcardiovascular mortality over 6 years of follow up (Fig. 2).This association was substantially attenuated with the useof conventional troponin T. The addition of hs-troponinto a multivariable-adjusted model for mortality improvedthe c-statistic (�0.02, P � 0.001) and integrated discrim-ination index (0.04, P�0.001).
Fig. 2. Association of cardiac troponin T (cTnT) detected with a highly sensitive assay and all-cause and cardio-vascular mortality.
The blue segment of the vertical axis indicates the range from 0% to 20%. Reproduced with permission from de Lemos et al.(59 ).
Reviews
78 Clinical Chemistry 58:1 (2012)
deFilippi et al. studied the prognostic value of hs-troponin T concentrations in more than 4200 olderadults (age �65 years) (60 ). Increased hs-troponin Tconcentrations were associated with the developmentof heart failure and cardiovascular death. The additionof hs-troponin T to traditional risk factors raised thec-statistics for heart failure and cardiovascular death byapproximately 0.01. Similarly, investigators from theAtherosclerosis Risk in Communities study found thaths-troponin T concentrations were associated with in-cident CHD, mortality, and heart failure in nearly10000 individuals (44 ). Furthermore, the addition ofhs-troponin T to traditional risk factors modestly im-proved discrimination and reclassification.
Comparisons of Biomarkers
A growing number of studies have provided data on thecomparative performance of cardiovascular biomark-ers. For instance, several cohort studies suggest thatNT-proBNP concentrations are more strongly relatedto future vascular risk than hs-CRP concentrations(61– 63 ). Similarly, recent studies indicate hs-troponinmeasurements have predictive value comparable toNT-proBNP and greater than hs-CRP (44, 59 ). Notsurprisingly, panels of multiple biomarkers appear su-perior to individual biomarkers (61, 63, 64 ), althoughthe optimal composition of multimarker panels re-mains to be established.
Furthermore, biomarkers may differ in their abil-ity to predict specific types of cardiovascular events.This variation often reflects the physiology underlyingthe biomarkers. For instance, BNP and NT-proBNPstrongly predict incident heart failure risk (45, 65 ),
which is not surprising in view of their association withcardiac wall stress. hs-CRP and Lp-PLA2 are very goodmarkers of vascular risk, probably reflecting the impor-tance of vascular inflammation in atherogenesis (66 ).On the other hand, “myocardial” biomarkers such asNT-proBNP and hs-troponin are also surprisinglygood predictors of future vascular events, for reasonsthat are not entirely understood (44, 67 ).
New Directions
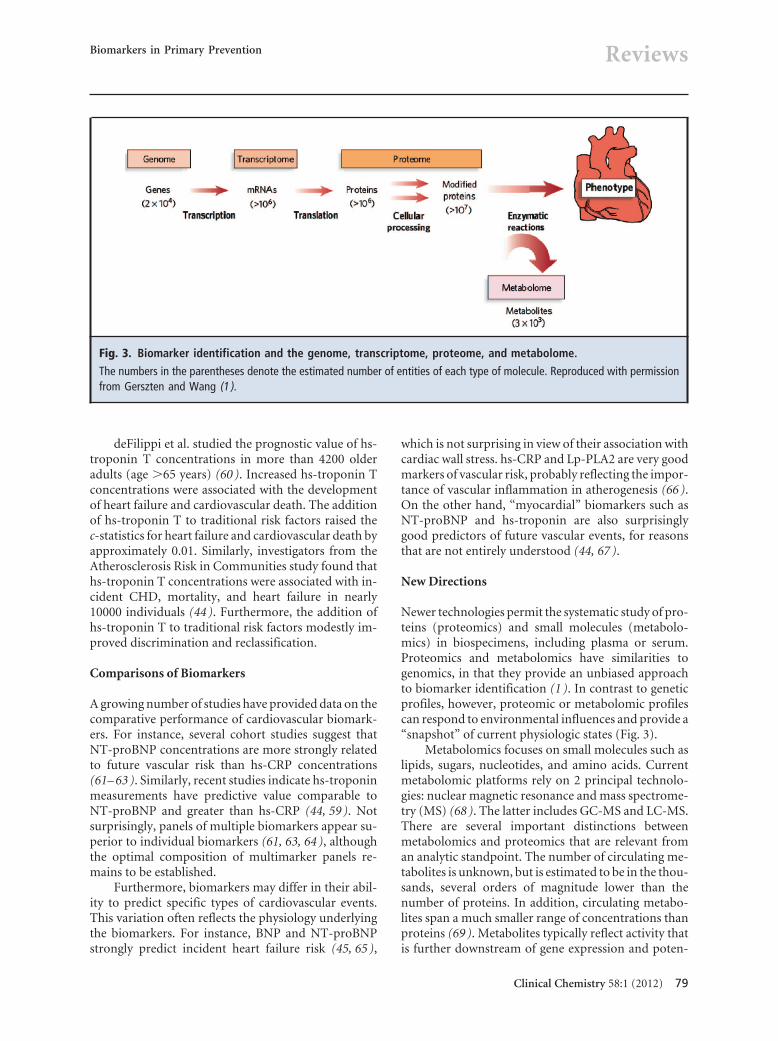
Newer technologies permit the systematic study of pro-teins (proteomics) and small molecules (metabolo-mics) in biospecimens, including plasma or serum.Proteomics and metabolomics have similarities togenomics, in that they provide an unbiased approachto biomarker identification (1 ). In contrast to geneticprofiles, however, proteomic or metabolomic profilescan respond to environmental influences and provide a“snapshot” of current physiologic states (Fig. 3).
Metabolomics focuses on small molecules such aslipids, sugars, nucleotides, and amino acids. Currentmetabolomic platforms rely on 2 principal technolo-gies: nuclear magnetic resonance and mass spectrome-try (MS) (68 ). The latter includes GC-MS and LC-MS.There are several important distinctions betweenmetabolomics and proteomics that are relevant froman analytic standpoint. The number of circulating me-tabolites is unknown, but is estimated to be in the thou-sands, several orders of magnitude lower than thenumber of proteins. In addition, circulating metabo-lites span a much smaller range of concentrations thanproteins (69 ). Metabolites typically reflect activity thatis further downstream of gene expression and poten-
Fig. 3. Biomarker identification and the genome, transcriptome, proteome, and metabolome.
The numbers in the parentheses denote the estimated number of entities of each type of molecule. Reproduced with permissionfrom Gerszten and Wang (1 ).
Biomarkers in Primary Prevention Reviews
Clinical Chemistry 58:1 (2012) 79
tially more closely related to cellular function than doproteins. Thus, circulating metabolites have the poten-tial advantage of providing immediate informationabout an organism’s physiologic condition, but the po-tential disadvantage of being affected by multiplesources of variability including diet, activity, and med-ication use.
An early study by Brindle and colleagues demon-strated the promise and potential pitfalls of metabolo-mic approaches to cardiovascular screening (70 ).They analyzed (1 ) H-NMR sera in individuals withangiography-proven coronary artery disease, and com-pared the profile with those in healthy controls. Theydeveloped a profile that identified the cases with �90%accuracy. However, a subsequent report showed thatcommon variables, including sex and statin use, wereimportant confounders of the nuclear magnetic reso-nance spectroscopy profile (71 ).
Several groups have used targeted LC-MS ap-proaches to reduce potential susceptibility to con-founding inherent in more global screens. For instance,Shah and colleagues used targeted LC-MS to profile 69metabolites in individuals with and without coronaryartery disease referred to an academic cardiac catheter-ization laboratory (72 ). Two principal componentsthat were analysis-derived factors, one comprisingbranched-chain amino acids and another comprisingurea cycle metabolites, were associated with the pres-ence of coronary artery disease. Similarly, we recentlyemployed targeted LC-MS to investigate predictors offuture diabetes in the Framingham Offspring Study(73 ). Five branched-chain and aromatic amino acidswere strongly associated with incident diabetes over 12years of follow-up (P � 0.001 to �0.0001). The find-ings were replicated in an independent Swedish cohort.
Another recent study demonstrated the poten-tial for metabolomic approaches to elucidate etio-logic factors in cardiovascular disease. Wang andcolleagues used nontargeted LC-MS to profile spec-imens from individuals with and without incidentmyocardial infarction (74 ). They identified 3 metab-olites derived from phosphatidylcholine— choline,betaine, and trimethylamine-N-oxide—that wereassociated with incident events. Dietary supplemen-tation of these metabolites promoted atherosclerosisin animal models, which was inhibited by suppres-sion of gut microflora involved in the metabolism ofphosphatidylcholine.
Gene expression profiling represents another rel-atively unbiased technology for biomarker discovery.Rosenberg and colleagues recently derived and tested a23-gene expression profile from whole blood for de-tecting coronary artery disease in individuals without
diabetes (75 ). At a score threshold corresponding to a20% likelihood of coronary artery disease, the sensitiv-ity and specificity were 85% and 43%. More studies arewarranted to validate this approach, and to investigatewhether profiles from specific cell populations mightenable more accurate detection of occult cardiovascu-lar disease.
Conclusion
Biomarkers hold the promise of earlier and more accu-rate cardiovascular risk stratification. Their role inacute cardiovascular diseases, such as myocardial in-farction and heart failure, has been well studied. Anincreasing number of studies have investigated the roleof biomarkers in primary prevention. To date, no bio-marker has emerged as the best screening marker forcardiovascular disease, and it is likely that no singlebiomarker will be sufficiently sensitive or specific to beused on its own.
Future strategies will likely involve larger bio-marker panels and more specific target populations.Larger panels require new biomarkers that providenonoverlapping information to already -available bio-markers or risk factors (16 ). Newer, “unbiased” ap-proaches, such as proteomics or metabolomics, showsome promise in this regard. Further studies are alsoneeded to better define the target populations for bio-marker screening, because a very broad approach maybe unnecessary as many individuals are adequately riskstratified by traditional risk factors.
Author Contributions: All authors confirmed they have contributed tothe intellectual content of this paper and have met the following 3 re-quirements: (a) significant contributions to the conception and design,acquisition of data, or analysis and interpretation of data; (b) draftingor revising the article for intellectual content; and (c) final approval ofthe published article.
Authors’ Disclosures or Potential Conflicts of Interest: Upon man-uscript submission, all authors completed the Disclosures of PotentialConflict of Interest form. Potential conflicts of interest:
Employment or Leadership: None declared.Consultant or Advisory Role: T.J. Wang, Diasorin, Inc.Stock Ownership: None declared.Honoraria: T.J. Wang, Roche Diagnostics and Quest Diagnostics.Research Funding: T.J. Wang, NIH R01-HL086875, R01-HL102780,R01-DK081572, R01-HL098283, and R01-HL083197; Diasorin;Brahms; Critical Diagnostics; Singulex; Siemens Healthcare Diag-nostics; and Roche Diagnostics.Expert Testimony: None declared.Other: T.J. Wang, coinventor on patent applications relating to theuse of metabolomic and neurohormonal biomarkers in riskprediction.
Reviews
80 Clinical Chemistry 58:1 (2012)

References
1. Gerszten RE, Wang TJ. The search for new car-diovascular biomarkers. Nature 2008;451:949–52.
2. Khot UN, Khot MB, Bajzer CT, Sapp SK, OhmanEM, Brener SJ, et al. Prevalence of conventionalrisk factors in patients with coronary heart dis-ease. JAMA 2003;290:898–904.
3. Biomarkers Definitions Working Group. Biomark-ers and surrogate endpoints: preferred definitionsand conceptual framework. Clin Pharmacol Ther2001;69:89–95.
4. Morrow DA, de Lemos JA. Benchmarks for theassessment of novel cardiovascular biomarkers.Circulation 2007;115:949–52.
5. Wang TJ, Larson MG, Levy D, Leip EP, BenjaminEJ, Wilson PW, et al. Impact of age and sex onplasma natriuretic peptide levels in healthyadults. Am J Cardiol 2002;90:254–8.
6. Redfield MM, Rodeheffer RJ, Jacobsen SJ, Ma-honey DW, Bailey KR, Burnett Jr. Plasma brainnatriuretic peptide concentration: impact of ageand gender. J Am Coll Cardiol 2002;40:976–82.
7. Lam CS, Cheng S, Choong K, Larson MG, Mu-rabito JM, Newton-Cheh C, et al. Influence of sexand hormone status on circulating natriureticpeptides. J Am Coll Cardiol 2011;58:618–26.
8. Chang AY, Abdullah SM, Jain T, Stanek HG, DasSR, McGuire DK, et al. Associations among an-drogens, estrogens, and natriuretic peptides inyoung women: observations from the DallasHeart Study. J Am Coll Cardiol 2007;49:109–16.
9. Wang TJ, Larson MG, Levy D, Benjamin EJ, LeipEP, Wilson PW, et al. Impact of obesity on plasmanatriuretic peptide levels. Circulation 2004;109:594–600.
10. Mehra MR, Uber PA, Park MH, Scott RL, VenturaHO, Harris BC, et al. Obesity and suppressedB-type natriuretic peptide levels in heart failure.J Am Coll Cardiol 2004;43:1590–5.
11. Das SR, Drazner MH, Dries DL, Vega GL, StanekHG, Abdullah SM, et al. Impact of body mass andbody composition on circulating levels of natri-uretic peptides: results from the Dallas HeartStudy. Circulation 2005;112:2163–8.
12. McCord J, Mundy BJ, Hudson MP, Maisel AS,Hollander JE, Abraham WT, et al. Relationshipbetween obesity and B-type natriuretic peptidelevels. Arch Intern Med 2004;164:2247–52.
13. Horwich TB, Hamilton MA, Fonarow GC. B-typenatriuretic peptide levels in obese patients withadvanced heart failure. J Am Coll Cardiol 2006;47:85–90.
14. Koenig W. Cardiovascular biomarkers: addedvalue with an integrated approach? Circulation2007;116:3–5.
15. Ware JH. The limitations of risk factors as prog-nostic tools. N Engl J Med 2006;355:2615–7.
16. Wang TJ. Assessing the role of circulating, ge-netic, and imaging biomarkers in cardiovascularrisk prediction. Circulation 2011;123:551–65.
17. Hanley JA, McNeil BJ. The meaning and use ofthe area under a receiver operating characteristic(ROC) curve. Radiology 1982;143:29–36.
18. Wilson PW. Prediction of cardiovascular diseaseevents. Cardiol Clin 2011;29:1–13.
19. May A, Wang TJ. Biomarkers for cardiovasculardisease: challenges and future directions. Trends
Mol Med 2008;14:261–7.20. Cook NR. Use and misuse of the receiver operat-
ing characteristic curve in risk prediction. Circu-lation 2007;115:928–35.
21. D’Agostino RB Sr, Grundy S, Sullivan LM, WilsonP. Validation of the Framingham coronary heartdisease prediction scores: results of a multipleethnic groups investigation. JAMA 2001;286:180–7.
22. Expert Panel on Detection, Evaluation, and Treat-ment of High Blood Cholesterol in Adults. Exec-utive Summary of The Third Report of The Na-tional Cholesterol Education Program (NCEP)Expert Panel on Detection, Evaluation, And Treat-ment of High Blood Cholesterol In Adults (AdultTreatment Panel III). JAMA : the journal of theAmerican Medical Association 2001;285:2486–97.
23. Wilson PW, D’Agostino RB, Levy D, Belanger AM,Silbershatz H, Kannel WB. Prediction of coronaryheart disease using risk factor categories. Circu-lation 1998;97:1837–47.
24. Pencina MJ, D’Agostino RB Sr, D’Agostino RB Jr,Vasan RS. Evaluating the added predictive abilityof a new marker: from area under the ROC curveto reclassification and beyond. Stat Med 27:157–72, 2008; discussion 207–12.
25. Pencina MJ, D’Agostino RB Sr, Steyerberg EW.Extensions of net reclassification improvementcalculations to measure usefulness of new bio-markers. Stat Med 2011;30:11–21.
26. Hlatky MA, Greenland P, Arnett DK, BallantyneCM, Criqui MH, Elkind MS, et al. Criteria forevaluation of novel markers of cardiovascularrisk: a scientific statement from the AmericanHeart Association. Circulation 2009;119:2408–16.
27. Tillett WS, Francis T. Serological reactions inpneumonia with a non-protein somatic fractionof pneumococcus. J Exp Med 1930;52:561–71.
28. Kushner I. The phenomenon of the acute phaseresponse. Ann NY Acad Sci 1982;389:39–48.
29. Thompson D, Pepys MB, Wood SP. The physio-logical structure of human C-reactive protein andits complex with phosphocholine. Structure 1999;7:169–77.
30. Pepys MB, Hirschfield GM. C-reactive protein: acritical update. J Clin Invest 2003;111:1805–12.
31. Macy EM, Hayes TE, Tracy RP. Variability in themeasurement of C-reactive protein in healthysubjects: implications for reference intervals andepidemiological applications. Clinical Chemistry1997;43:52–8.
32. Chen TH, Gona P, Sutherland PA, Benjamin EJ,Wilson PW, Larson MG, et al. Long-termC-reactive protein variability and prediction ofmetabolic risk. Am J Med 2009;122:53–61.
33. Ridker PM, Cushman M, Stampfer MJ, Tracy RP,Hennekens CH. Inflammation, aspirin, and therisk of cardiovascular disease in apparentlyhealthy men. N Engl J Med 1997;336:973–9.
34. Pearson TA, Mensah GA, Alexander RW, Ander-son JL, Cannon RO 3rd, Criqui M, et al. Markersof inflammation and cardiovascular disease: ap-plication to clinical and public health practice: Astatement for healthcare professionals from theCenters for Disease Control and Prevention and
the American Heart Association. Circulation2003;107:499–511.
35. Zacho J, Tybjaerg-Hansen A, Jensen JS, Grande P,Sillesen H, Nordestgaard BG. Genetically elevatedC-reactive protein and ischemic vascular disease.N Engl J Med 2008;359:1897–908.
36. Buckley DI, Fu R, Freeman M, Rogers K, HelfandM. C-reactive protein as a risk factor for coronaryheart disease: a systematic review and meta-analyses for the U.S. Preventive Services TaskForce. Ann Intern Med 2009;151:483–95.
37. Cook NR, Buring JE, Ridker PM. The effect ofincluding C-reactive protein in cardiovascular riskprediction models for women. Ann Intern Med2006;145:21–9.
38. Ridker PM, Danielson E, Fonseca FA, Genest J,Gotto AM Jr, Kastelein JJ, et al. Rosuvastatin toprevent vascular events in men and women withelevated C-reactive protein. N Engl J Med 2008;359:2195–207.
39. Greenland P, Alpert JS, Beller GA, Benjamin EJ,Budoff MJ, Fayad ZA, et al. 2010 ACCF/AHAguideline for assessment of cardiovascular risk inasymptomatic adults: a report of the AmericanCollege of Cardiology Foundation/American HeartAssociation Task Force on Practice Guidelines.J Am Coll Cardiol 2010;56:e50–103.
40. Levin ER, Gardner DG, Samson WK. Natriureticpeptides. N Engl J Med. 1998;339:321–8.
41. Melander O, Newton-Cheh C, Almgren P, Hed-blad B, Berglund G, Engstrom G, et al. Novel andconventional biomarkers for prediction of inci-dent cardiovascular events in the community.JAMA 2009;302:49–57.
42. Burnett JC Jr, Kao PC, Hu DC, Heser DW, HeubleinD, Granger JP, et al. Atrial natriuretic peptideelevation in congestive heart failure in the hu-man. Science 1986;231:1145–7.
43. McKie PM, Cataliotti A, Lahr BD, Martin FL, Red-field MM, Bailey KR, et al. The prognostic valueof N-terminal pro-B-type natriuretic peptide fordeath and cardiovascular events in healthy nor-mal and stage A/B heart failure subjects. J AmColl Cardiol 2010;55:2140–7.
44. Saunders JT, Nambi V, de Lemos JA, ChamblessLE, Virani SS, Boerwinkle E, et al. Cardiac tro-ponin T measured by a highly sensitive assaypredicts coronary heart disease, heart failure, andmortality in the Atherosclerosis Risk in Commu-nities Study. Circulation 2011;123:1367–76.
45. Wang TJ, Larson MG, Levy D, Benjamin EJ, LeipEP, Omland T, et al. Plasma natriuretic peptidelevels and the risk of cardiovascular events anddeath. N Engl J Med 2004;350:655–63.
46. Di Angelantonio E, Chowdhury R, Sarwar N, RayKK, Gobin R, Saleheen D, et al. B-type natriureticpeptides and cardiovascular risk: systematic re-view and meta-analysis of 40 prospective studies.Circulation 2009;120:2177–87.
47. O’Donoghue M, Morrow DA, Sabatine MS, Mur-phy SA, McCabe CH, Cannon CP, et al.Lipoprotein-associated phospholipase A2 and itsassociation with cardiovascular outcomes in pa-tients with acute coronary syndromes in thePROVE IT-TIMI 22 (PRavastatin Or atorVastatinEvaluation and Infection Therapy-Thrombolysis InMyocardial Infarction) trial. Circulation 2006;113:
Biomarkers in Primary Prevention Reviews
Clinical Chemistry 58:1 (2012) 81
1745–52.48. Zalewski A, Macphee C. Role of lipoprotein-
associated phospholipase A2 in atherosclerosis:biology, epidemiology, and possible therapeutictarget. Arterioscler Thromb Vasc Biol 2005;25:923–31.
49. Anderson JL. Lipoprotein-associated phospho-lipase A2: an independent predictor of coronaryartery disease events in primary and secondaryprevention. Am J Cardiol 2008;101:23F–33F.
50. McConnell JP, Hoefner DM. Lipoprotein-associated phospholipase A2. Clin Lab Med 2006;26:679–97, vii.
51. Hakkinen T, Luoma JS, Hiltunen MO, MacpheeCH, Milliner KJ, Patel L, et al. Lipoprotein-associated phospholipase A(2), platelet-activating factor acetylhydrolase, is expressed bymacrophages in human and rabbit atheroscleroticlesions. Arterioscler Thromb Vasc Biol 1999;19:2909–17.
52. Packard CJ, O’Reilly DS, Caslake MJ, McMahonAD, Ford I, Cooney J, et al. Lipoprotein-associatedphospholipase A2 as an independent predictor ofcoronary heart disease. West of Scotland Coro-nary Prevention Study Group. N Engl J Med 2000;343:1148–55.
53. Ballantyne CM, Hoogeveen RC, Bang H, Coresh J,Folsom AR, Heiss G, et al. Lipoprotein-associatedphospholipase A2, high-sensitivity C-reactive pro-tein, and risk for incident coronary heart diseasein middle-aged men and women in the Athero-sclerosis Risk in Communities (ARIC) study. Cir-culation 2004;109:837–42.
54. Hatoum IJ, Cook NR, Nelson JJ, Rexrode KM,Rimm EB. Lipoprotein-associated phospholipaseA2 activity improves risk discrimination of inci-dent coronary heart disease among women. AmHeart J 2011;161:516–22.
55. Ebashi S. Third component participating in thesuperprecipitation of ‘natural actomyosin’. Na-ture 1963;200:1010.
56. Rybakova IN, Greaser ML, Moss RL. Myosin bind-ing protein C interaction with actin: characteriza-tion and mapping of the binding site. J Biol Chem2011;286:2008–16.
57. Christenson RH, Phillips D. Sensitive and highsensitivity next generation cardiac troponinassays: more than just a name. Pathology 2011;43:213–9.
58. Scirica BM. Acute coronary syndrome: emergingtools for diagnosis and risk assessment. J Am CollCardiol 2010;55:1403–15.
59. de Lemos JA, Drazner MH, Omland T, Ayers CR,Khera A, Rohatgi A, et al. Association of troponinT detected with a highly sensitive assay andcardiac structure and mortality risk in the generalpopulation. JAMA 2010;304:2503–12.
60. deFilippi CR, de Lemos JA, Christenson RH, Gott-diener JS, Kop WJ, Zhan M, et al. Association ofserial measures of cardiac troponin T using asensitive assay with incident heart failure andcardiovascular mortality in older adults. JAMA2010;304:2494–502.
61. Wang TJ, Gona P, Larson MG, Tofler GH, Levy D,Newton-Cheh C, et al. Multiple biomarkers forthe prediction of first major cardiovascular eventsand death. N Engl J Med 2006;355:2631–9.
62. Wannamethee SG, Welsh P, Lowe GD, GudnasonV, Di Angelantonio E, Lennon L, et al. N-terminalpro-brain natriuretic Peptide is a more usefulpredictor of cardiovascular disease risk thanC-reactive protein in older men with and withoutpre-existing cardiovascular disease. J Am CollCardiol 2011;58:56–64.
63. Zethelius B, Berglund L, Sundstrom J, Ingelsson E,Basu S, Larsson A, et al. Use of multiple biomark-ers to improve the prediction of death from car-diovascular causes. N Engl J Med 2008;358:2107–16.
64. Blankenberg S, Zeller T, Saarela O, Havulinna AS,Kee F, Tunstall-Pedoe H, et al. Contribution of 30biomarkers to 10-year cardiovascular risk estima-tion in 2 population cohorts: the MONICA, risk,genetics, archiving, and monograph (MORGAM)biomarker project. Circulation 2010;121:2388–97.
65. Velagaleti RS, Gona P, Larson MG, Wang TJ, LevyD, Benjamin EJ, et al. Multimarker approach forthe prediction of heart failure incidence in thecommunity. Circulation 2010;122:1700–6.
66. Ridker PM, Hennekens CH, Buring JE, Rifai N.C-reactive protein and other markers of inflam-mation in the prediction of cardiovascular diseasein women. N Engl J Med 2000;342:836–43.
67. Emberson JR, Ng LL, Armitage J, Bowman L,Parish S, Collins R. N-terminal Pro-B-type natri-uretic peptide, vascular disease risk, and choles-terol reduction among 20,536 patients in theMRC/BHF heart protection study. J Am Coll Car-diol 2007;49:311–9.
68. Mayr M. Metabolomics: ready for the prime time?Circ Cardiovasc Genet 2008;1:58–65.
69. Wishart DS. Human Metabolome Database: com-pleting the “human parts list.” Pharmacogenom-ics 2007;8:683–6.
70. Brindle JT, Antti H, Holmes E, Tranter G, Nichol-son JK, Bethell HW, et al. Rapid and noninvasivediagnosis of the presence and severity of coro-nary heart disease using 1H-NMR-based metabo-nomics. Nat Med 2002;8:1439–44.
71. Kirschenlohr HL, Griffin JL, Clarke SC, Rhydwen R,Grace AA, Schofield PM, et al. Proton NMR anal-ysis of plasma is a weak predictor of coronaryartery disease. Nat Med 2006;12:705–10.
72. Shah SH, Bain JR, Muehlbauer MJ, Stevens RD,Crosslin DR, Haynes C, et al. Association of aperipheral blood metabolic profile with coronaryartery disease and risk of subsequent cardiovas-cular events. Circ Cardiovasc Genet 2010;3:207–14.
73. Wang TJ, Larson MG, Vasan RS, Cheng S, RheeEP, McCabe E, et al. Metabolite profiles and therisk of developing diabetes. Nat Med 2011;17:448–53.
74. Wang Z, Klipfell E, Bennett BJ, Koeth R, LevisonBS, Dugar B, et al. Gut flora metabolism of phos-phatidylcholine promotes cardiovascular disease.Nature 2011;472:57–63.
75. Rosenberg S, Elashoff MR, Beineke P, Daniels SE,Wingrove JA, Tingley WG, et al. Multicenter val-idation of the diagnostic accuracy of a blood-based gene expression test for assessing obstruc-tive coronary artery disease in nondiabeticpatients. Ann Intern Med 2010;153:425–34.
Reviews
82 Clinical Chemistry 58:1 (2012)