33 Biology 30 Biology 30 Biology 30 Biology 30 Biology 30 ...

75
Appendix N
Biology Style Manual
Department of Biology
St. Mary’s College of Maryland St. Mary’s City, Maryland
Spring 2013

Principles of Biology Laboratory Appendices
TABLE OF CONTENTS
Purpose ........................................................................................................................... 77 The Anatomy of a Formal Research Report ................................................................ 77 TITLE PAGE ABSTRACT INTRODUCTION MATERIALS AND METHODS RESULTS DISCUSSION CONCLUSIONS LITERATURE CITED
Citing the Work of Others .............................................................................................. 79 How to Cite the Work of Others
Citation of References in the text Citation of References in the Literature Cited Section
When to Cite the Work of Others: Avoiding Plagiarism
Tables and Figures ......................................................................................................... 82 Tables
Row and Column Headings Table Abbreviations
Figures Choice of Graph Type Bar Graphs Line Graphs Scatter Plots Figure Conventions Figure Captions Titles Axes Axis Labels Axis Scale Learn from Examples
Our Expectations ............................................................................................................ 89 General Suggestions Specific Suggestions How to Judge Writing Editing Symbols and Abbreviations
Posters and Oral Presentations .................................................................................... 93 Posters Oral presentations
Mannerisms Organization Visual Aids Answering Questions

Appendix N: Biology Style Manual
77
Purpose The purpose of the Department of Biology Style Manual is to guide the writing and presentations required of biology students throughout their time at St. Mary’s College of Maryland. The Style Manual provides a standard format for writing and gives the specific requirements and expectations that department instructors will use to evaluate written work. The emphasis of this manual is on formal research reports because they are so important in science, but it also serves as a guide for library research papers, St. Mary’s Projects and other writing done in biology. We start by describing the basic elements–the anatomy–of a formal research report, in the first section. Then, we describe the method of citation you should use in making reference to work that has been done by others. The next section gives a detailed discussion of tables and figures, and in the following sections we offer some suggestions on the elements of good writing, oral presentations, and posters.
The Anatomy of a Formal Research Report Laboratory or technical reports serve several useful functions: (1) they provide a clear record of your laboratory work; (2) they evaluate raw experimental data and relate them to other information you possess; (3) they provide an avenue for you to learn the elements of scientific writing; and (4) they provide your instructor with a document demonstrating your progress in understanding biology. As biology majors, it is absolutely essential that you know how to write technical reports that present the results of your work in a clear and concise way. One of the principle objectives of all biology laboratory courses at St. Mary’s College is, therefore, to provide you with an opportunity to practice presenting the results of your experiments in a standard format. To this end, you should draft your laboratory reports as scientific communications, that is, as if you were going to send them to an editor for publication in a scientific journal. Any report that communicates the results of an experiment has a different style than other kinds of writing. The scientific report does, however, include the basic elements of any well-written paper: good grammar, concise sentences, accurate spelling, logical development of ideas, and clear organization. Below is an outline of the form in which many scientists write their reports. The suggestions offered may not apply to a particular experiment, so don’t expect to write all parts all the time. Your report should lead the reader from a clear statement of your subject (or purpose), through the procedures and data, and on to conclusions. Think of your paper as having these main parts: title, abstract, introduction, materials and methods, results, discussion, and literature cited. Be sure to include the appropriate headings for each section of your report. TITLE PAGE Develop a carefully worded, concise title that describes the experiment. On the title page, also include your name, the names of your lab teammates, the date, and the course for which you wrote the report. ABSTRACT This section is a very brief overview of all of the main sections of the report, highlighting major results and conclusions. Authors often prefer to write this section last since it is a summary of the entire paper. The abstract helps readers decide if the paper is of interest to them. Do not include references or long discussions in this section, as abstracts are usually limited to 200-300 words. As a summary of work done, an abstracts is always written in the past tense. Unless you are told otherwise, you should include an abstract for formal laboratory reports in all Biology classes, and you will certainly need one for your SMP. INTRODUCTION This section gives background information, setting the stage for your research. Develop your ideas from the general to the specific, explaining what is known, then what’s not known, and why your contribution is valuable and interesting. A common error is to begin with a description of what you did; be sure you give background first! You will need to cite others’ research from journal articles, book chapters, etc., and when you refer to this work use the past tense. Refer to published literature as described in the "Literature Cited" section below. The introduction leads up to the purpose of your experiment, models and hypotheses.

Principles of Biology Laboratory Appendices
The difference between models and hypotheses is often confusing to students. Try the following approach to understanding them: You made predictions on the outcomes that you expected from each experiment. These predictions are predictive hypotheses. Now ask yourself why you expected these outcomes. The answer to that question is the model for your experiment. Remember that the model must relate to the actual experiments that you conducted. Normally one develops a model first and later develops experiments and predictive hypotheses to test the model. The model and hypothesis are generally written in the past tense and often appear in the last paragraph of the Introduction. Be sure you explain what you’ll be doing and why before you give your hypothesis. MATERIALS AND METHODS The objective of the Materials and Methods section is to allow others to judge the validity of the experiment and even to repeat it for themselves. This section should briefly describe the methods you used for your experiments, including data analyses such as statistical methods. Be concise and thorough, but avoid unnecessary detail. When possible, save yourself and your reader some work by referring to published methods you have adopted. In journal articles this section is often nearly all references, for example, "We prepared the extract using Jones's (1994) method, analyzed the lysate spectrophotometrically as described by Smith (1996), and fit the data to Hatch's (1998) theory of minimal attendance." In some cases it is acceptable to simply refer to the lab manual for a general method, and then note any additions or changes you employed (but ask your instructor about specific cases). Always write the Materials and Methods section out in text format (not in a cookbook, outline, or list format). In this section you do not give the results you obtained, nor do you discuss them. Always use the past tense in the Materials and Methods section. Here are some suggestions for writing a good Materials and Methods section: 1. Arrange the information in a unified and coherent sequence, so that the section develops clearly, but do
this in narrative paragraph form, not as a list. This is a report on what you did, not a set of instructions to someone else, so use past tense.
2. Use active voice for brevity and clarity: “We measured coleoptile length…” rather than “Coleoptile length was measured…..”
3. Use tables and figures (photographs, drawings, or graphs) sparingly in this section to clarify and document your procedures. You must make reference to these in the Methods narrative, for example: “We built an apparatus (Fig. 1) to hold the wombat during the experiments.”
4. Include scientific names of organisms, complete names of apparatus (including model number, manufacturer, and place of manufacture), and chemicals, as well as any information that may be significant to your results. For example: “We determined photosynthetic rates using a LiCor 6400 portable gas exchange system (LiCor Inc., Lincoln, Nebraska, USA).”
5. Remember to underline or italicize scientific names and foreign words. Do not capitalize common names unless they are proper nouns (“brine shrimp” or “blue crab,” but “Maine lobster”).
6. Do not include results or discussion. 7. Be concise and thorough, but avoid unnecessary detail such as the size of the beakers you used (unless
for some reason this information is crucial to repeating the experiment). Also avoid details about common laboratory procedures, such as how you standardized a pH meter or spectrophotometer.
8. Remember that the objective of the Materials and Methods section is to allow others to judge the validity of your experiment or even to repeat it for themselves.
RESULTS The Results section should include your analyzed data (descriptive statistics, such as means and standard errors, and tests of significance) and a narrative that presents your observations and data. Do not give unanalyzed, raw data in a lab report unless you are specifically asked to do so. The results section contains an objective description of what happened, without evaluation, (for example): “Respiration rate increased with temperature in all species (Fig. 1), but there were significant differences among species (ANOVA; P≤0.05).” You should state your most general results first then logically move to more specific results. Summarize your results in a narrative and cite significant results in tables and figures where appropriate. Every table and figure must be described in the Results section with text that tells the reader what message

Appendix N: Biology Style Manual
79
to get from the graphic. For example, the text describing a figure with a graph of enzyme activity as a function of temperature might be: “The activity of the enzyme showed a sharp optimum at 37o C (Fig. 1).” Tables and figures should be presented in numerical sequence, in the order that they are described in the text of your paper. Do not present the same data more than once. Choose the best way to present the data, as a table or as a figure, but not both. For further details about preparing these, see the Tables and Figures section of this Style Manual. DISCUSSION The purpose of this section is to interpret and discuss the data presented in the Results section. The Discussion section should follow the same sequence given in the results section with general first and specifics later. Do your data support the hypothesis that you presented in the Introduction? Assess the meaning of the experiment’s results and describe whether your data support or refute the hypothesis that you presented in the Introduction. If your results do not support your hypothesis, do they unambiguously refute it, or are more experiments necessary? Indicate how you might change your understanding of the system to accommodate your data, and suggest how your new ideas might be tested. Your results have meaning in the context of what other researchers have discovered, so you should relate your experiment to previously-published work, and include logical deductions. Do your data support (or refute) previously published work? Try to provide reasonable suggestions as to why you got the results you did, and account, where you can, for unexpected results. If you think the problem might be approached differently, mention other ways of testing the hypothesis. The discussion is not a time for self-flagellation. If you made an error that affected your results, certainly mention it, but don’t grovel. Usually the last part of the Discussion section is a summary of conclusions, a discussion of significance of the work and/or suggestions for future research. CONCLUSIONS This is an optional section and is usually included in longer, more comprehensive research reports. Conclusions may also be inserted (unlabeled) as the last paragraph of the Discussion section. Wherever placed, this section should be very short, and it simply summarizes your major conclusions in three or four sentences. LITERATURE CITED When and how one cites the work of others is critical in scholarly work. Each reference requires both an in-text citation and an entry in the Literature Cited section. In the text, refer to literature by placing the author(s) and the year(s) of the publication in parentheses. For example, a statement in the introduction might read as follows: “The enzyme sequence is found in bacteria from hot springs and is likely to be active at high temperatures (Byrd and Colwell, 1992).” The Literature Cited section gives details that allow a reader to find the original document: BYRD, J.J., AND R.R. COLWELL. 1992. Detection and enumeration of bacteria in the environment by
microscopic methods. In M.A. Levin, R.J. Seidler, and M. Rogul [eds.], Microbial ecology: principles, methods, and applications. McGraw-Hill Publishing Company, New York, New York, USA.
The (Byrd and Colwell, 1992) example above demonstrates the use of in-text citations and Literature Cited entries, but you’ll need more information to format different types of citations correctly. The Department of Biology citation format is detailed below.
Citing the Work of Others Correct citing requires knowing both how and when to cite. The “how” part is technical and follows a strict set of formatting rules. The “when” part is sometimes more subtle, but is critical to avoiding plagiarism. We discuss both below. How to Cite the Work of Others Whenever you take information (intellectual property) from another person, you must give credit and enable the reader to check your information source as well as learn more about the cited studies. The

Principles of Biology Laboratory Appendices
Department of Biology has chosen the format used by the American Journal of Botany as our standard format. If questions arise about citation style or other technical issues, then you should consult the instructions to authors for this journal (http://www.amjbot.org/misc/ifora.shtml), or look at the journal itself for examples. The American Journal of Botany is available on-line through the SMCM library and JSTOR. Before we consider the nitty-gritty format, please consider these general rules:
• Cite only those sources you actually read and used in the development of your paper. • Avoid referring to unpublished materials (school papers, lecture notes, etc.) • Citing reviews or texts is sometimes appropriate for general information, but, when possible, cite
primary literature. • You must have at least one in-text citation for every entry in your Literature Cited section, and
every in-text citation must have a corresponding reference in Literature Cited. Citation of References in the Text The placement of citations normally occurs as soon as you end the first sentence containing information from another source. You do not need to cite every sentence. If a paragraph is long (writer’s decision) and can be attributed to one source, then you can cite the source either at the end of the paragraph or at the end of the first sentence that introduces the work. Of course if the source of information switches within a paragraph you should cite the different sources. What if information comes from multiple sources within the same sentence? Either scatter citations after their respective part or group them all together at the sentence end. For example, the citation “(Smith, 1996; Thomas and Jones, 2000; Paul et al., 2003)” says that the information in the sentence or paragraph cited is found in all these works. Note that when you cite multiple sources, list them in chronological order in the in-text citation. In contrast, a sentence like “Birds (Smith, 1996), bees (Thomas and Jones, 2000) and butterflies (Paul et al., 2003) all see ultraviolet radiation.” tells the reader the source of each bit of information. Beware of over-citing, which is usually the result of unnecessary citing of general knowledge or excessive reliance on source material. In-text citations should follow the (name, year) system:
One author: (Smith, 1998)
Same author(s) of two or more papers in a year: (Smith, 1998a)
Same author(s) multiple years: (Smith, 1998a, 1998b, 1999, 2002)
Two authors: (Smith and Jones, 1998)
Three or more authors: (Smith et al., 1998)
Multiple citations, same year: (Smith, 1998; Taylor, 1998)
Multiple citations, different years: (Taylor, 1978; Smith, 1998)
Manuals: (Department of Biology, 2006; American Public Health Association, 1981)
Government Publication: (Environmental Protection Agency, 2007)
Web Site: (Watson and Dallwitz, 1992; St. Mary’s College of Maryland, 1998)
Unpublished data: (J.J. Price, Personal Communication, date)
Use personal communication only when necessary. This type of citation is one of the few cases where there is no reference to the citation in the Literature Cited section of the paper.
Citation of References in the Literature Cited Section The citations in this section should be in alphabetical order by the last name of the first author of the reference. Note that all author names are capitalized in the Literature Cited section. If the same author has been cited more that once, then the order of the publications is by the last name of the second author. Examples of different reference types follow.
• Note that we have separated references by type (journals, books,…) so you can understand the different examples, but in your Literature Cited section, you should list all your references together regardless of type.

Appendix N: Biology Style Manual
81
• Also note that although the authors’ names appear to upper case, they are actually in SMALL CAPS. If you use endnote this will be accomplished automatically. If you are formatting the bibliography manually, simply type out the authors names with appropriate capitalization and then convert the font to small caps in the format font dialog box.
Traditional Journal Articles – accessed either in hardcopy or online ARNOLD, T. M., C. E. TANNER, AND W. I. HATCH. 1995. Phenotypic variation in polyphenolic content of
the tropical brown alga Lobophora variegata as a function of nitrogen availability. Marine and Ecological Progress Series 123: 177-183.
CRAMER, E. R. A., AND J. J. PRICE. 2007. Red-winged blackbirds respond differently to song types with different performance levels. Journal of Avian Biology 38: 122-127.
PAUL, R. W., W. I. HATCH, W. P. JORDAN, AND M. J. STEIN. 1989. Behavior and respiration of the salt marsh periwinkle, Littorina irrorata (Say), during winter. Marine Behaviour and Physiology 15: 229-241.
RAMCHARITAR, J. 2006. Sciaenid bioacoustics: a review. Transactions of the American Fisheries Society 135: 1409-1431.
WADESON, P. H., AND K. CRAWFORD. 2003. Formation of the blastoderm and yolk syncytial layer in early squid development. Biological Bulletin 203: 216-217.
WILLIAMS, W. E., H. L. GORTON, AND T. C. VOGELMANN. 2003. Surface gas-exchange processes of snow algae. Proceedings of the National Academy of Sciences of the United States of America 100: 562-566.
Online Journal Articles – available only online KERRY, S., M. TEKIPPE, N. C. GADDIS, AND A. ABALLAY. 2006. GATA transcription factor required for
immunity to bacterial and fungal pathogens, PLoS ONE, e77. doi:10.1371/journal.pone.0000077. Books (Whole): BYRD, J. J., AND T. POWLEDGE. 2006. Complete idiot's guide to microbiology. Alpha Press, Indianapolis,
Indiana, USA. CLESCERI, L. S., A. E. GREENBERG, AND A. D. EATON. 1998. Standard methods for the examination of
water and wastewater. American Public Health Association, Washington, DC., USA. SAMBROOK, J., E. F. FRITSCH, AND T. MANIATIS. 1989. Molecular cloning: a laboratory manual. Cold
Spring Harbor Laboratory Press, Cold Spring Harbor, New York, USA. Book (Chapters): BYRD, J. J., AND R. R. COLWELL. 1992. Detection and enumeration of bacteria in the environment by
microscopic methods. In M. A. Levin, R. J. Seidler, and M. Rogul [eds.], Microbial ecology: principles, methods, and applications, 93-112. McGraw-Hill, New York, New York, USA.
MYEROWITZ, R. 2001. The search for the genetic lesion in Ashkenazi Jews with classic Tay-Sachs disease. In R. J. Desnick and M. M. Kaback [eds.], Tay-Sachs disease, 137-143. Academic Press, New York, New York, USA.
Lab Manuals or Appendices: You will normally be citing a particular lab exercise or appendix. Modify the following to reflect the exercise you use and the appropriate year. DEPARTMENT OF BIOLOGY. 2012. Enzymology: polyphenol oxidase, Laboratory manual for principles of
biology I, 49-58. St. Mary's College of Maryland, St. Mary's City, Maryland, USA. Abstracts: COUGHLIN, L. J., J. C. O'BRIEN, AND W. P. JORDAN. 2000. Behavioral sensitization by psychostimulants:
Evidence for a failure to habituate. Society for Neuroscience Abstracts 26: 1767 (abstract).
St. Mary's Projects/Theses/Dissertations: PHUNG, A. 2006. Nutrition and skeletal disease in the seventeenth century colonial Chesapeake. St. Mary's
Project, St. Mary's College of Maryland, St. Mary's City, Maryland, USA.
Principles of Biology Laboratory Appendices
Government Publications: ENVIRONMENTAL PROTECTION AGENCY. 2007. Hazardous waste management system: identification and
listing of hazardous waste; amendment to hazardous waste code F019, Proposed rule. Federal Register 72: 2219-2235.
U.S. DOE. 2006. Breaking the biological barriers of cellulosic ethanol: a joint research agenda, DOE/SC-0095. U.S. Department of Energy Office of Science and Office of Energy Efficiency and Renewable Energy, Washington, D.C., USA.
Web sites: ST. MARY'S COLLEGE OF MARYLAND DEPARTMENT OF BIOLOGY. 2007. Welcome to the St. Mary's College
Biology Department! Website http://www.smcm.edu/nsm/biology/ [Accessed 22 May 2007]. WATSON, L., AND M. J. DALLWITZ. 1992. The families of flowering plants: descriptions and information
retrieval. Website http://biodiversity.uno.edu/delta/ [Accessed 14 May 2000]. CD-ROMs or Software Package: MADDISON, D. R., AND W. P. MADDISON. 2000. MacClade: Analysis of phylogeny and character evolution.
Version 4.0. Sinauer and Associates, Sunderland. Massachusetts, USA. SAS. 1997. SAS/STAT software: changes and enhancements through release 6.11. SAS Institute, Cary,
North Carolina, USA. When to Cite the Work of Others: Avoiding Plagiarism When and where do you cite? You do not need to cite an idea that is standard biological information, such as material discussed in class or general information your reader knows or can locate easily (e.g., cells are either prokaryotic or eukaryotic, or Charles Darwin (and Alfred Russell Wallace) formulated the theory of evolution by natural selection). Such information is widely available and not disputed. You do need to cite a reference for a fact that is not common knowledge. The SMCM Student Code and Student Rights and Responsibilities (http://www.smcm.edu/campus/tothepoint0304/studentcodes.pdf) defines plagiarism as the act of appropriating and using the words, ideas, symbols, images, or other works of original expression of others as one's own without giving credit to the person who created the work. Specific instances of plagiarism include, but are not limited to, the following: a) Word-for-word copying of sentences or paragraphs from one or more sources that are the work or data of other persons (including books, articles, theses, unpublished works, working papers, seminar and conference papers, lecture notes or tapes, graphs, images, charts, data, electronically based materials, etc.), without clearly identifying their origin by appropriate referencing. b) Closely paraphrasing ideas or information (in whatever form) without appropriate acknowledgement by reference to the original work or works. c) Presenting material obtained from the Internet as if it were the student's own work. d) Minor alterations such as adding, subtracting, or rearranging words, or paraphrasing sections of a source without appropriate acknowledgement of the original work or works. Another useful source of information about plagiarism and how to avoid it is available at: http://www.web-miner.com/plagiarism Often students use direct quotes, properly referenced, as a way to guard against plagiarism. However, quotations are rare in scientific writing. Only use direct quotes when the exact words are important, or when they are of historical relevance. Another common problem is to use a close paraphrase of the source material; even with a proper citation, a close paraphrase is plagiarism! At the very least, it represents intellectual laziness. You must read the material, understand it, and then write in your own words. Sometimes you may need to put the source material away for a while before you can find another appropriate way of expressing the ideas. Remember, even when you write in your own words, you must include a reference to give credit for the source of the idea or information.
Tables and Figures Tables and figures are devices for presenting results more clearly and concisely than can be done in text. It is from your tables and figures that a reader will judge the validity of your work because it is here that your

Appendix N: Biology Style Manual
83
work is most concisely summarized. A well-designed figure will demonstrate at a glance the functional relationships between variables, and a well-designed table will allow the reader to look up a specific datum in the midst of a complex set of data. Every table and graph must have a number and must be referenced in the text. Tables and figures should be numbered sequentially with Arabic numerals and referenced as well as displayed in numerical order (i.e., you should not discuss Fig. 2 before discussing Fig. 1). Tables are numbered separately from figures, but graphs and other illustrations (photographs, drawings, etc.) are numbered together and collectively referred to as "figures." Tables Tables usually present specific data that are critical to understanding a scientific paper. A table has two components: 1) the table number with its caption (sometimes called a caption title) and 2) the table itself. Tables are numbered sequentially with Arabic numerals followed by a period, then the table caption with only the first letter capitalized, and finally a period. The table caption is always placed above the table and should not extend past the margins of the table itself. The table is bounded by horizontal lines (double on top and single on the bottom) showing where the table begins and ends. The first row in the table contains the column headings and this row is separated from data by another horizontal line. Generally vertical lines are only used to separate columns of data that are grouped. Therefore, do not use lines to identify or separate individual columns. Since tables have both vertical and horizontal dimensions, data can be arranged with the independent-variable values either across the table or down the table. A table with the data presented vertically provides two advantages: this arrangement allows the reader to grasp the information most easily, and it is in the most compact form. Consider the following examples. With four species of bacteria, the horizontal arrangement we show in Table 1 is difficult to follow, and the table takes up more space than required. Look at the same data presented vertically. In this format is far more compact, and it is a simple matter to look up any factor associated with any of the bacteria. Which arrangement you choose will depend on just what you need to display. Table 1. Characteristics of antibiotic-producing Streptomyces spp. Determination S. fluoriclor S. griseus S. coelicolor S. nocolor Optimal growth temp (°C) -10 24 28 92 Color of mycelium Tan Gray Red Purple Antibiotic produced Fluoricillinmycin Streptomycin Rholmondelaya Nomycin Yield of antibiotic (mg/mL) 4 108 78 2 Table 2. Characteristics of antibiotic-producing Streptomyces spp.
Organism
Optimal growth temp (°C)
Color of mycelium Antibiotic produced
Yield of antibiotic (mg/mL)
S. fluoricolor -10 Tan Fluoricillinmycin 4 S. griseus 24 Gray Streptomycin 108 S. coelicolor 28 Red Rholmondelaya 78 S. nocolor 92 Purple Nomycin 2 Row and Column Headings The headings in a table must be clear enough to make the meaning of the data clear without reference to the text of the paper. Rows and columns must have heading labels clearly identifying their contents without requiring the reader to refer back to the Methods section. Strictly avoid meaningless labels such as “Treatment 1,” using instead some concise description of the treatment, e.g., “N + P”. Numbers must have units. Often units are repetitive and the same for all values in a row or column. If this is the case then

Principles of Biology Laboratory Appendices
incorporate the units into the row or column headings. If the headings need explanation, then the proper place to do that is in the table caption. Use explanatory footnotes sparingly. A table should contain only data and sufficient information (headings, units, etc.) to make those data clear. It should not contain details of the experiment or conclusions, which should be in the Materials and Methods and Discussion sections, respectively. Generally, data in the table should be centered under the heading, which is also centered in the area above the column. Make columns wide enough to contain the headings and the numerical data, but not so wide as to leave large gaps between columns. If necessary, make the headings several short lines (rather than one long line) in order to minimize the column width (see Table 2 above). Table Abbreviations Scientific journals encourage abbreviations in tables to save space. Capitalize an abbreviation only when it is the first word in a heading, and do not use periods except in “no.” (for number). Tables with numerical data (Table 3) have some special considerations. Notice that the heading for needle length has units and that these are common to both pine species, and that the SE (standard error of the mean), as well as mean needle lengths have the same number of significant figures to the right of the decimal place. This indicates that the precision of measurement for all groups was the same. Note as well that all headings are centered over columns and that the columns have appropriate widths for the data. However, the values for “Site” in Table 3 are text and these are generally positioned on the left-hand margin of the column. The data of Table 3 are summary data because they calculate a mean value for each pine species at each location. Therefore, you must tell, in the table title, the sample size (n=100) used to calculate the mean and the standard error of the mean (SE). Table 3. Mean length ± 1 SE of pine (loblolly – Pinus taeda – and Virginia red pine – Pinus viginiana) needles (n=100) collected at different locations on the St. Mary’s College of Maryland campus.
Stand Identification Site
Needle length (mm) Pinus taeda Pinus virginiana
QA Queen Anne Hall - west of parking lot 26.7 ± 7.8 14.6 ± 2.0 NF North Field – behind barns 28.6 ± 6.5 13.6 ± 1.5
LQ Northwest of Lewis quadrangle 26.5 ± 3.9 16.0 ± 2.2
PGC Behind Prince George’s and Caroline dormitories 27.7 ± 6.8 12.9 ± 1.8
Figures Figures are graphs, photographs, drawings, and anything else that is not a table. Graphs show relationships between variables. Regardless of the figure type, figure captions are numbered with Arabic numerals and discussed sequentially as are tables. However, figure numbers and captions are placed underneath the figure. Choice of Graph Type Graphs have become a significant part of scientific communication, and it is difficult to pick up a newspaper or magazine or to look at a scientific web page that does not incorporate them. In general, graphs show the dependence of data (called the dependent variable) on some treatment or condition (called the independent variable). The dependent variable is plotted on the y-axis while the independent or grouping variable (often controlled by the researcher) is plotted on the x-axis. There are two basic kinds of scientific graphs, bar and line, and you should be careful to select the most appropriate type for your data. Some types of graphs, such as pie charts, are inappropriate for scientific data even though they are commonly used in business and other nonscientific communication.
Appendix N: Biology Style Manual
85
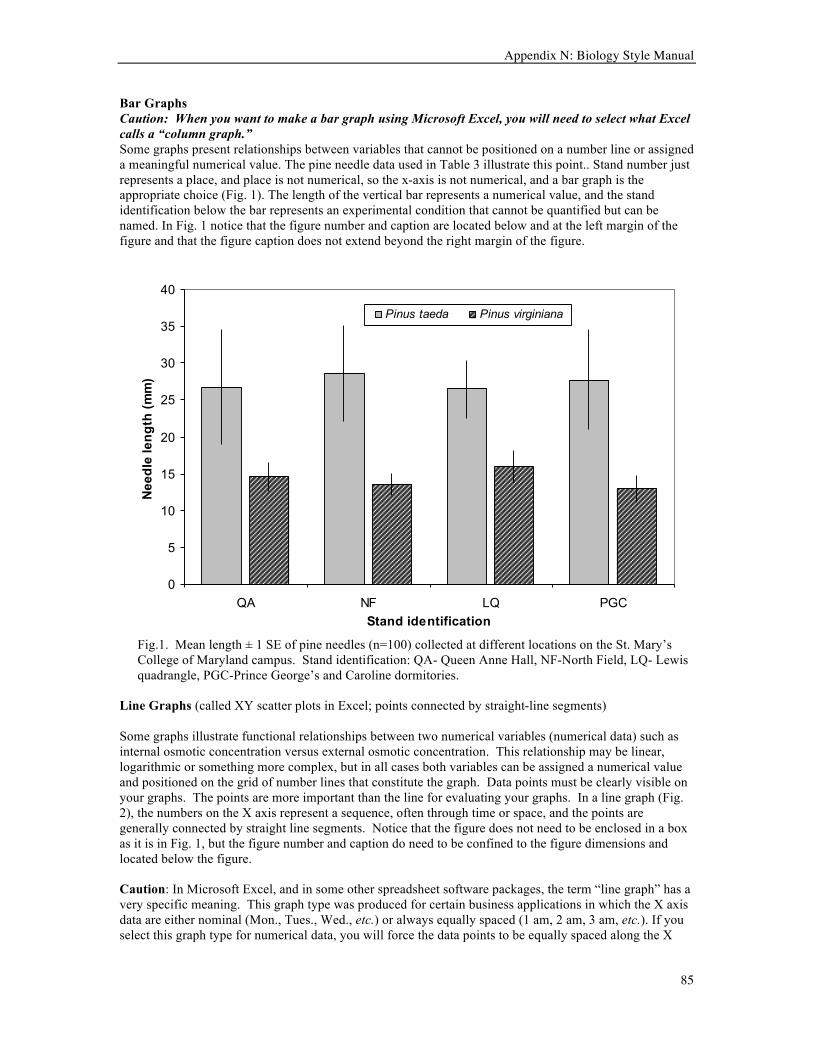
Bar Graphs Caution: When you want to make a bar graph using Microsoft Excel, you will need to select what Excel calls a “column graph.” Some graphs present relationships between variables that cannot be positioned on a number line or assigned a meaningful numerical value. The pine needle data used in Table 3 illustrate this point.. Stand number just represents a place, and place is not numerical, so the x-axis is not numerical, and a bar graph is the appropriate choice (Fig. 1). The length of the vertical bar represents a numerical value, and the stand identification below the bar represents an experimental condition that cannot be quantified but can be named. In Fig. 1 notice that the figure number and caption are located below and at the left margin of the figure and that the figure caption does not extend beyond the right margin of the figure.
Fig.1. Mean length ± 1 SE of pine needles (n=100) collected at different locations on the St. Mary’s College of Maryland campus. Stand identification: QA- Queen Anne Hall, NF-North Field, LQ- Lewis quadrangle, PGC-Prince George’s and Caroline dormitories.
Line Graphs (called XY scatter plots in Excel; points connected by straight-line segments) Some graphs illustrate functional relationships between two numerical variables (numerical data) such as internal osmotic concentration versus external osmotic concentration. This relationship may be linear, logarithmic or something more complex, but in all cases both variables can be assigned a numerical value and positioned on the grid of number lines that constitute the graph. Data points must be clearly visible on your graphs. The points are more important than the line for evaluating your graphs. In a line graph (Fig. 2), the numbers on the X axis represent a sequence, often through time or space, and the points are generally connected by straight line segments. Notice that the figure does not need to be enclosed in a box as it is in Fig. 1, but the figure number and caption do need to be confined to the figure dimensions and located below the figure. Caution: In Microsoft Excel, and in some other spreadsheet software packages, the term “line graph” has a very specific meaning. This graph type was produced for certain business applications in which the X axis data are either nominal (Mon., Tues., Wed., etc.) or always equally spaced (1 am, 2 am, 3 am, etc.). If you select this graph type for numerical data, you will force the data points to be equally spaced along the X
0
5
10
15
20
25
30
35
40
QA NF LQ PGCStand identification
Nee
dle
leng
th (m
m)
Pinus taeda Pinus virginiana

Principles of Biology Laboratory Appendices
axis even if this is not your intention. Always select “XY (scatter) plot” when working in Excel, unless you have a very specific reason to do otherwise.
Fig. 2. Mean titer ± 1 standard deviation of bacteria grown in liquid medium for 100 hours at 37oC (n=5).
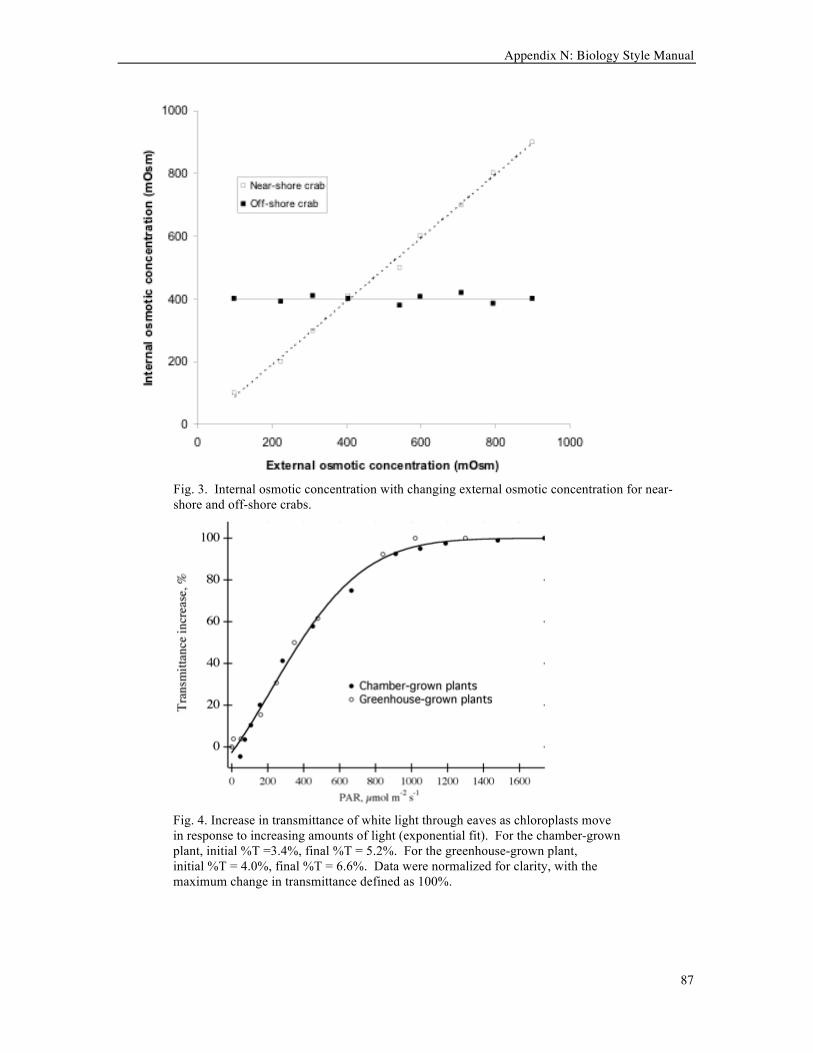
Scatter Plots (called XY scatter plots in Excel; points not connected) Scatter plots are much like line graphs, but the points are not connected (Figs. 3 and 4). Sometimes there is no obvious sequence in the data so it makes no sense to connect the points, but often a trendline can be used to emphasize a correlation. Sometimes there may be a sequence in the data, but the points are not connected because there may be more than one experiment on the graph, or because the point is to emphasize the trend rather than the variability (Fig. 4).
Appendix N: Biology Style Manual
87
Fig. 3. Internal osmotic concentration with changing external osmotic concentration for near-shore and off-shore crabs.
Fig. 4. Increase in transmittance of white light through eaves as chloroplasts move in response to increasing amounts of light (exponential fit). For the chamber-grown plant, initial %T =3.4%, final %T = 5.2%. For the greenhouse-grown plant, initial %T = 4.0%, final %T = 6.6%. Data were normalized for clarity, with the maximum change in transmittance defined as 100%.
Principles of Biology Laboratory Appendices
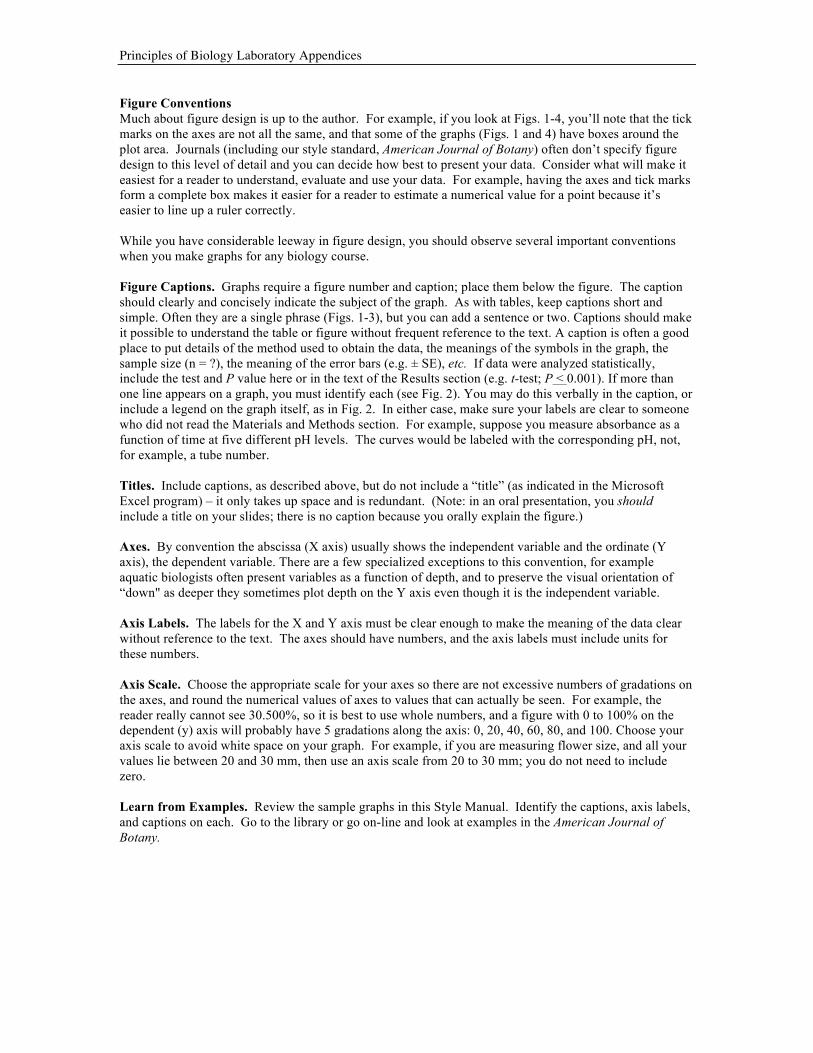
Figure Conventions Much about figure design is up to the author. For example, if you look at Figs. 1-4, you’ll note that the tick marks on the axes are not all the same, and that some of the graphs (Figs. 1 and 4) have boxes around the plot area. Journals (including our style standard, American Journal of Botany) often don’t specify figure design to this level of detail and you can decide how best to present your data. Consider what will make it easiest for a reader to understand, evaluate and use your data. For example, having the axes and tick marks form a complete box makes it easier for a reader to estimate a numerical value for a point because it’s easier to line up a ruler correctly. While you have considerable leeway in figure design, you should observe several important conventions when you make graphs for any biology course. Figure Captions. Graphs require a figure number and caption; place them below the figure. The caption should clearly and concisely indicate the subject of the graph. As with tables, keep captions short and simple. Often they are a single phrase (Figs. 1-3), but you can add a sentence or two. Captions should make it possible to understand the table or figure without frequent reference to the text. A caption is often a good place to put details of the method used to obtain the data, the meanings of the symbols in the graph, the sample size (n = ?), the meaning of the error bars (e.g. ± SE), etc. If data were analyzed statistically, include the test and P value here or in the text of the Results section (e.g. t-test; P < 0.001). If more than one line appears on a graph, you must identify each (see Fig. 2). You may do this verbally in the caption, or include a legend on the graph itself, as in Fig. 2. In either case, make sure your labels are clear to someone who did not read the Materials and Methods section. For example, suppose you measure absorbance as a function of time at five different pH levels. The curves would be labeled with the corresponding pH, not, for example, a tube number. Titles. Include captions, as described above, but do not include a “title” (as indicated in the Microsoft Excel program) – it only takes up space and is redundant. (Note: in an oral presentation, you should include a title on your slides; there is no caption because you orally explain the figure.) Axes. By convention the abscissa (X axis) usually shows the independent variable and the ordinate (Y axis), the dependent variable. There are a few specialized exceptions to this convention, for example aquatic biologists often present variables as a function of depth, and to preserve the visual orientation of “down" as deeper they sometimes plot depth on the Y axis even though it is the independent variable. Axis Labels. The labels for the X and Y axis must be clear enough to make the meaning of the data clear without reference to the text. The axes should have numbers, and the axis labels must include units for these numbers. Axis Scale. Choose the appropriate scale for your axes so there are not excessive numbers of gradations on the axes, and round the numerical values of axes to values that can actually be seen. For example, the reader really cannot see 30.500%, so it is best to use whole numbers, and a figure with 0 to 100% on the dependent (y) axis will probably have 5 gradations along the axis: 0, 20, 40, 60, 80, and 100. Choose your axis scale to avoid white space on your graph. For example, if you are measuring flower size, and all your values lie between 20 and 30 mm, then use an axis scale from 20 to 30 mm; you do not need to include zero. Learn from Examples. Review the sample graphs in this Style Manual. Identify the captions, axis labels, and captions on each. Go to the library or go on-line and look at examples in the American Journal of Botany.
Appendix N: Biology Style Manual
89
Our Expectations We expect good writing and will accept nothing less. It is your responsibility to turn in your papers clearly written, typed, and on time. It is our responsibility to help you learn by pointing out problems, but we are not proofreaders. It is not our responsibility to try to figure out what you meant to say, but rather what you said. Your work must be grammatical (see the section below “How to Judge Writing” from our SMCM Writing Center). General Suggestions
• Allow enough time to write and revise draft documents.
• Edit and proofread thoroughly. Using a spelling checker is simply not enough. • The best way to become familiar with the style of scientific papers is to read them. Go to the library
and find some journal articles that describe experimental results; use them as a guide in your own writing.
• Refer to a writing handbook if you have questions about grammar. There are many excellent writing guides. You may already have such a handbook, but if not you should consider buying one. We suggest buying the following (it is available in the Campus Store):
MCMILLAN, V.E. 2006. Writing papers in the biological sciences, 4th edition. Bedford/St. Martin’s,
Boston, Massachusetts, USA. • Get help! Most students admitted to St. Mary's are familiar with most of the rules of grammar and can
write well by being more aware and by working seriously. You will often be working in teams, so you'll have built-in proofreaders—take advantage of this and swap papers for comments! None of your biology faculty members would think of submitting a paper to a journal or a grant proposal for review without first giving it to a colleague for comments. Giving those comments is a service we do for each other. It is part of our professional responsibility, and we take it very seriously. You should too. You can also go to the Writing Center for help.
Specific Suggestions These are some specific suggestions we have compiled because they address problems we see commonly: • Use words with precision, clarity, and economy. Every sentence should be as exact as possible. Write
correct, straightforward English sentences. Think about what each sentence actually says, not what you think it says. Ask yourself if it is possible to misinterpret it.
• Follow a consistent pattern of tense. Record observations and experiments in the past tense; use the present tense for generalizations and references to stable conditions. Use the past tense for your unpublished results and for the published experimental results to which you refer.
• Avoid direct quotations except when the specific words used by the original author are particularly
important, for example, "It has not escaped our notice that the specific pairing we have postulated immediately suggests a possible copying mechanism for the genetic material." (WATSON, J. D., AND F. H. C. CRICK. 1953. A structure for deoxyribose nucleic acid. Nature 171: 737.). Do not use them just because you cannot easily think of how to say something in your own words.
• The word "data" is plural (“datum” is singular): "My data show…," NOT "My data shows." This is a
very common error! Other common singular/plural errors are spectrum/spectra and bacterium/bacteria. • Use the passive voice sparingly; it requires extra words and may not convey the exact meaning.
Compare "Fungi produce antibiotics" with "Antibiotics are produced by fungi." The passive here

Principles of Biology Laboratory Appendices
requires two more words and 25% more space. Worse, its idle words are not merely superfluous; they obscure the words that do the work. "It was found to have had" is simply, in the active voice, "It had." Economy of communication and reading time is the major concern. Economy of words also yields clarity. "I found" costs less than half as much as "it was discovered," and identifies the discoverer immediately. When "experiments were conducted," the reader cannot tell whether the author or his predecessors conducted them. If you use "I" or "we" ("we" for two or more writers, never as a substitute for "I"), you easily avoid the passive voice, at least in that one sentence. It may embarrass the writer, but it takes exactly one-tenth the space. Change every "It was discovered that" to "I found.” Instead of "It was reported by Smith," just describe what Smith reported and put the name and date in parenthesis at the end (Smith, 1983). Be alert for "by" as the danger sign of the passive voice. You may even enjoy this word game, and the prize is increased professional competence.
• Refer to the subsection, "Editing Symbols and Abbreviations,” included at the end of this guide. It will refresh your mind about some common grammatical errors. Your instructor may use some of these editing marks on your lab reports, but remember that we are not editors. If your lab report contains more than a few such errors, we will return it to you for rewriting.
How to Judge Writing The SMCM Writing Center prepared the following guidelines several years ago. They do not always apply directly to scientific writing, but they are excellent points to keep in mind. The views that underlie the approach described here are widely shared by writers and thoughtful teachers of writing. Some minor changes have been made to Reichstad and McAndrew's Training Tutors for Writing Conferences (NCTE, 1984). Their method is not only useful for judging the writing of others, but also for understanding how to approach one's own writing tasks. 1. Higher Order Concerns (HOCs) These concerns are pervasive. They involve the essence and purpose of the piece, and as a rule they cannot be found at particular points on the page. Crucially, they must be improved by revision (i.e., re-seeing), not editing. Fixing problems in grammar, usage, and so on will have no beneficial effect on HOCs. The HOCs are as follows; the questions that accompany them can help a writer determine the extent to which these concerns have been satisfied.
Focus: Is the piece about one main idea? Does it stay with this idea or wander off? Is the idea about the right size for the length of the piece, or is it too general to allow a detailed discussion? Is the focus relevant, useful to the intended readers?
Development: Does the piece present enough information so that the reader feels that the work is com-plete? Are there specific details that develop or support generalizations? Are uninformative summaries, mere assertions, and other vague subjectivity avoided?
Organization: Is there a plan for the piece? What is the reason for using this plan? Are ideas presented in an order that makes sense, considering the purpose of the paper? Are paragraphs about one main idea? Is the reader introduced to the topic at the beginning and led to an ending that creates a sense of completeness or conclusion? Are sections of the piece linked together by transitions?
Audience: For whom is this piece written? What sort of action or reaction does the writer expect from the audience? How much does the audience know, and what are/might they be interested in? What views or prejudices do they already hold, and has the writer reckoned with these? Do the other HOCs reflect what the writer knows about the audience and his/her purpose?
2. Lower Order Concerns (LOCs) These are not called lower order because they are unimportant. In fact, getting these concerns wrong will often cause the writer as much trouble as neglecting HOCs. LOCs have their name for three reasons:
• Writers must worry about them after they have gotten the HOCs into reasonable shape. Making significant editing changes before whole sections of the text are added, moved, or deleted during

Appendix N: Biology Style Manual
91
revision only wastes time, since the HOCs will have to be attended to anyway, and the writer will have to edit again for LOCs.
• In general, LOCs have to do with the linguistic surface of a piece of writing, not with its content or purpose, which are much more complicated matters.
• LOCs are fixed by editing, and by referring to rules, a much simpler business for writers than discovering what they are saying and how to say it. Writers should always deal with HOCs first.
• Examples of LOCs include:
Spelling Punctuation subject-verb agreement verb tense fragments run-ons comma splices sentence structure parallel structure misplaced modifiers dangling modifiers manuscript form pronoun agreement pronoun reference word choice

Principles of Biology Laboratory Appendices
Editing Symbols and Abbreviations
(We do not often use these abbreviations, but you may find the list of common errors useful.) P Punctuation error. Examples: Henry Ford said, that “History is bunk”.
PRO REF Unclear pronoun reference. Example: Lincoln and Jefferson were talking one day, and he said....
PRO AGR Pronoun agreement error. Example: Every person is entitled to the iguana of their choice.
CAP Capitalization error. Examples: The president of the US said that he would visit every State this year.
SP Spelling. Examples: If yu kin reed this, yu are verry persistant.
CS Comma splice. Example: We ate sandwiches after the movie, we thought they were delicious.
ROS Run-on sentence. Example: We ate sandwiches after the movie we thought they were delicious.
FRAG Sentence Fragment. Example: I thought that he would give in. After seeing the annual report.
MS Improper manuscript form. Example: Problems with margins, spacing, typefaces, page numbering, etc.
AGR Subject-verb agreement. Example: A box of oranges were found under the stairs.
¶ Make new paragraph
N¶ Do not make new paragraph
RED Redundancy. Example: Walter moved to an uninhabited island where no one lived.
REP Repetition. Example: Realistically, one can never count realistically on the stock market. WW Wrong word choice. Example: William decided that he would devour his dinner in the living room.
WDY Wordiness. Example: Sometimes I occasionally wonder whether I would like to begin to consider the possibility that I can write more concisely.
? Confusing thought or wording. Example: The supporters of the U.S. English movement have not only concentrated on trying to pass the Official English movement to the Constitution.
SS Defective sentence structure. Example: Tarantino is the one Stallone wondered whether went to the Cannes Festival.
VT Inconsistent or incorrect verb tense. Example: In the year 1492, Columbus discovers America and re-ported his findings to the King.
DM Dangling modifier. Example: Exhausted by the long hours in the hot sun, the beach ball was forgotten.
MM Misplaced modifier. Example: Exhausted by the long hours in the hot sun, the beach ball was forgot-ten by the revelers.
COLL Colloquial expression. Example: In 1066, William the Conqueror got it in his head that he was going to take over England.
|| Faulty parallel structure. Example: In 1066, William the Conqueror ruled his native Normandy, invaded England, and Norman nobles were put in charge of everything.

Appendix N: Biology Style Manual
93
Posters and Oral Presentations Posters At some point in your career at St. Mary's College, you may need to present your work in poster format. This is appropriate when you want to discuss your work with a few people at a time, over the course of a couple of hours. It is often less appropriate for courses because you will want to present your work to your whole class at once, and a large group can't see a poster clearly. We mention it here because many biology students present their work from upper-division classes in public, semester-end poster sessions, and many choose a poster as the format for the public presentation of their St. Mary's Projects. The poster format is extremely important for the dissemination of hot new scientific information. Journal articles are slow to produce and often avoid controversial results. Posters are, however, quick to produce and are presented to any interested persons at poster sessions associated with scientific meetings, symposia and conferences. They serve not as repositories of information, but to stimulate conversation among scientists with similar interests. The poster is far more flexible in its format than a formal research report. Most, however, follow the same basic format described above for reports. The most striking difference between a poster and a report is its length. The abstract, introduction, methods, and literature-cited sections are extremely brief. The results and conclusions dominate the poster. Remember that the objective is to stimulate conversation. The results are therefore prominently displayed in bold graphical formats such as diagrams, photographs, tables, and graphs. The conclusion needs to contain just enough information to tell the observer what you think the results mean. See “How to Make a Great Poster” on the Biology SMP website. Oral Presentations You will certainly present your experimental results and other material to your classes in formal oral pres-entations, with visual aids. The following guidelines and suggestions may help you develop a professional presentation:
Mannerisms • Do not wear a hat or chew gum. Speak in a loud, clear voice, at a moderate speed. Don't say
"uhm,” "well,” or "like." (e.g., "The fish were like more languid when the water was like cool."). Avoid pauses in mid-sentence. Don't pace, sway, or use excessive hand gestures. Never begin a presentation by saying “OK...” or “So…”.
• Do not read off of the screen (you may, of course, refer to the screen, but you should face your audience). Make eye contact with the audience (not just your instructor)!
• Keep your place with note cards or a single-page outline, but don't read it. Know your material! If giving a group presentation, divide the speaking evenly among group members.
Organization • Proceed in a logical, step-by-step order following the basic manuscript format of introduction,
methods, etc., Define any unfamiliar terms to the audience in your introduction. • Make sure your introduction gives enough background information and sets the stage for your
investigation. When you state your hypothesis, be sure you have the audience's attention—they'll be lost forever if they don't know what you're trying to show.
• Describe your procedures in general terms (e.g., don't tell us how you did each individual dilution), but be specific where it matters (e.g., never name a group “treatment 1,” but rather “high-temperature treatment” or something else meaningful). Present your results graphically. Describe the graphs and tables. ("The X axis shown here is body weight in Kg, and the Y axis is nutrient intake in cal/day. Note that the relationship appears to be nonlinear").
• Discuss your results. Say what you think they mean. If your results don't support your hypothesis, give an alternate hypothesis.
• State a conclusion. Just don't stop talking. Say, "In conclusion…." • Include an “Acknowledgements” slide to thank appropriate people. • Conclude by taking one step backward and saying “Thank you”.

Principles of Biology Laboratory Appendices
Visual Aids • Most students use Microsoft PowerPoint to create slides as visual aids. Plan for approximately 1
slide per minute, but practice your presentation to assure your presentation duration is correct. • Avoid fancy slide changes and sounds. They can distract your audience from the content of your
presentation. • Use as few words as possible in your slides without losing clarity (English in visual aids can be
less formal than in a lab report). • Avoid including any information in a slide that you do not specifically refer to in your talk. If
including this extra information is unavoidable, steer your audience’s attention to the relevant part of your slide.
• Try presenting your methods diagrammatically. • Use a large, clear font. Put important words in bold. Use bullets or numbers. • Make things eye-catching, but avoid clutter. • Figures for a presentation slide look a little different than those for a written report. Axis labels
and all text must be large enough to read. A title is better than a lengthy caption because you are there to explain the figure. Be sure your figures are simple; their meaning should be obvious.
• Never display large, dense tables; two or three columns by two or three rows is plenty. • The most common mistake in visual aids is trying to put too much information in a single slide.
Answering Questions • The last step in an oral presentation is to interact with the audience by answering questions. (Hint:
try to anticipate what questions you will be asked and how you will answer them.) • Direct your answer to the person asking the question and keep your response short and to the
point. • If giving a group presentation, group members should take turns fielding questions. • If you don't know the answer to a question, admit it, and then try an educated guess.