BIOLOGICAL RESOURCES. - Seattle
28
The section provides a qualitative assessment of potential impacts to biological resources within the project study area. For the purposes of this analysis, the resources covered include environmentally critical areas (ECAs), as defined by SMC 25.09, and the City’s urban forest and tree cover. 3.6.1 AFFECTED ENVIRONMENT POLICY FRAMEWORK ECAs Regulations for ECAs apply to any habitat alteration in landslide-prone areas (steep slopes), riparian corridors, wetlands, and various buffers (SMC 25.09). Proposed development on a property with a mapped ECA requires a different level of City review, specific regulations, and additional safeguards to ensure that slope stability, drainage and/or other ecological functions and values are protected where present; and that proposed structures are designed to avoid and minimize risks of future issues in these areas. These safeguards may include tree and vegetation protections, water quality regulations, and development setbacks around sensitive areas, as well as mandatory construction best practices to prevent landslides and ensure building stability. Tree Protection Trees in the City are specifically valued and legally protected under various regulations in addition to the ECA code (SMC 25.09.320). These include the Tree Protection Ordinance (SMC 25.11), landscaping requirements in each zoning category (SMC 23), and specific environmental regulations (SMC 25.05.675) 3.6 BIOLOGICAL RESOURCES. What’s changed since the DEIS? New information and other corrections and revisions since issuance of the DEIS are described in cross-out (for deleted text) and underline (for new text) format. Entirely new sections or exhibits may be identified by a sidebar callout instead of underline.
Transcript of BIOLOGICAL RESOURCES. - Seattle

The section provides a qualitative assessment of potential impacts to biological resources within the project study area. For the purposes of this analysis, the resources covered include environmentally critical areas (ECAs), as defined by SMC 25.09, and the City’s urban forest and tree cover.
3.6.1 AFFECTED ENVIRONMENT
POLICY FRAMEWORK
ECAs
Regulations for ECAs apply to any habitat alteration in landslide-prone areas (steep slopes), riparian corridors, wetlands, and various buffers (SMC 25.09). Proposed development on a property with a mapped ECA requires a different level of City review, specific regulations, and additional safeguards to ensure that slope stability, drainage and/or other ecological functions and values are protected where present; and that proposed structures are designed to avoid and minimize risks of future issues in these areas. These safeguards may include tree and vegetation protections, water quality regulations, and development setbacks around sensitive areas, as well as mandatory construction best practices to prevent landslides and ensure building stability.
Tree Protection
Trees in the City are specifically valued and legally protected under various regulations in addition to the ECA code (SMC 25.09.320). These include the Tree Protection Ordinance (SMC 25.11), landscaping requirements in each zoning category (SMC 23), and specific environmental regulations (SMC 25.05.675)
3.6 BIOLOGICAL RESOURCES.
What’s changed since the DEIS?New information and other corrections and
revisions since issuance of the DEIS are described in cross-out (for deleted text)
and underline (for new text) format. Entirely new sections or exhibits may be identified by a sidebar callout instead of underline.

MHA Final EISNov. 2017
3.316
that implement the goals and policies of the Seattle 2035 Comprehensive Plan for protection of the urban forest. Exceptional trees are specifically protected and defined as a tree or group of trees that constitutes an important community resource because of its unique historical, ecological, or aesthetic value. The regulations include provisions for tree protection, removal, replacement, and designation of exceptional trees.
Seattle’s Department of Construction & Inspections (SDCI) Office of Sustainability and Environment (OSE) conducted an analysis of existing tree protection measures to assess whether or not the current regulations and processes are helping the City achieve the goals of the Urban Forest Stewardship Plan (UFSP). The findings are informing the development of recommendations to address gaps and opportunities (City of Seattle, 2017c). In October of 2017, the Mayor signed executive order 2017-11 directing City departments to improve departmental coordination, strengthen enforcement, and adopt new regulations to improve and expand protections for Seattle’s urban trees and canopy coverage.
2013 Urban Forest Stewardship Plan
The City implemented the Urban Forest Management Plan (UFSP) in 2007 to outline actions needed to maintain the urban forest. The 30-year plan “set a goal to increase Seattle’s canopy cover to 30 percent by 2037 and created a framework for City departments, non-profit organizations, residents, and the community as a whole to support efforts to maintain the urban forest” (City of Seattle, 2013). The 2013 Urban Forest Stewardship Plan is a comprehensive update to the 2007 Plan.
The UFSP establishes four goals:
1. Create an ethic of stewardship for the urban forest among City staff, community organizations, businesses, and residents;
2. Strive to replace and enhance specific urban forest functions and benefits when trees are lost, and achieve a net increase in the urban forest functions and related environmental, economic, and social benefits;
3. Expand canopy cover to 30 percent by 2037; and
4. Remove invasive species and improve species and age diversity to increase the health and longevity of the City’s urban forest (City of Seattle, 2013).
Seattle recently completed a 2016 canopy cover analysis which shows a 28 percent canopy cover citywide. The majority of trees are located in residential zones, representing 67 percent of the land and 72 percent
MHA Final EISNov. 2017
3.317
of the tree canopy. The public right-of-way (interspersed in all zones) holds 23 percent of the city’s tree canopy. A separate analysis from 2015 suggests Seattle may be losing trees, with an estimated canopy cover loss of 2 percent between 2010 and 2015, with a 3 percent margin of error. The assessment report and presentation materials can be found at www.seattle.gov/trees/.
Street Tree Management Plan
Approximately 40,000 trees within Seattle’s road right-of-way areas are managed by the Department of Transportation (SDOT). SDOT implemented the Street Tree Management Plan in 2016 to help facilitate this large task. The goal of the plan is to improve the condition of SDOT-maintained street trees by the end of 2024. The program includes inventory, analysis, deliberate maintenance, and targeted tree replacement to create and maintain healthy and resilient street trees (City of Seattle, 2017b).
ASSESSMENT METHODOLOGY
To characterize and assess potential changes in ECAs and tree canopy cover as a result of proposed changes in zoning classifications and urban village boundary expansion areas within the City, the project team conducted an analysis using geographic information systems (GIS). The following datasets were used:
• MHA Alternative 2 Zoning and Urban Village Expansion (City of Seattle)
• MHA Alternative 3 Zoning and Urban Village Expansion (City of Seattle)
• MHA Preferred Alternative Zoning and Urban Village Expansion (City of Seattle)
• Environmentally Critical Areas (City of Seattle)
• Tree Canopy, derived from 2016 LiDAR (Office of Sustainability and Environment/University of Vermont)
• Green Spaces: Parks, Cemeteries, Public and Private Schools (City of Seattle)
• Urban Villages with Displacement—Access Opportunity category (City of Seattle)
The MHA Alternative 2, and 3, and Preferred Alternative data includes existing and proposed zoning designations. The existing zones and MHA zones were aggregated into zone categories: Single Family (SF), Residential Small Lot (RSL), Residential Low Rise (LR), Residential Mid and High Rise (MR/HR), and Neighborhood Commercial and Commercial

MHA Final EISNov. 2017
3.318
(NC/C). The areas of Urban Village Expansion for Alternatives 2, and 3, and Preferred Alternative include expansions to the boundaries of 10 urban villages (Rainier Beach, Othello, Roosevelt, Ballard, West Seattle Junction, Crown Hill, Columbia City, North Rainier, and 23rd & Union-Jackson), with an additional expansion in Northgate under Alternative 2. The zoning categories were aggregated for the following reasons:
• For NC zones, there is not likely to be significant differences in the amount of tree canopy on redeveloped sites as lot line to lot line development is allowed in all NC zones. The changes in standards for NC zones as well as changes that increase the height of NC zones are likely to result in taller but not wider buildings
• No parcels are proposed to change from MR to HR zones. While HR is significantly taller, the bottom of these structures might not be significantly different.
• There is a significant diversity of development types in LR zones (cottages, townhouses, apartments) that have different impacts on tree canopy. However, the development types do not occur exclusively in any single zone (e.g., townhouse buildings are found in different zones) and the high density does not directly relate to lower tree canopy. For example, townhouses sometimes result in lower canopy than apartments since they spread the structures out and have pavement in between.
To characterize ECAs, the current acreage of individual ECAs was quantified for each Urban Village. The total acreage of all ECAs was quantified for the proposed Urban Village Expansion areas for each of the MHA Alternatives. For areas with proposed changes in zoning designations, a qualitative assessment of the potential impacts to ECAs was conducted using available information. Because this review used existing mapped data sources and no field investigations, it is a general summary for the purposes of identifying ECAs that could be affected by implementation of MHA requirements. Additional resources could exist but are not identifiable at the coarse scale of the GIS data.
The acreage and percent of tree canopy cover was quantified for the existing and proposed zoning designations within each of the MHA Alternatives in GIS. For this analysis, green spaces data were evaluated separately, as tree canopy in these areas are unlikely to change, regardless of zoning change. Tree cover for a given zone was assumed to remain constant over time if the zoning designation stayed the same. For example, a zone change from LR to LR would not represent a change. The one exception was the percent cover for RSL. There is currently only one area zoned RSL in the study area. This did not provide a large enough sample
MHA Final EISNov. 2017
3.319
size to accurately estimate the percent coverage for all current and future RSL zones. Given this, the tree cover was calculated as the average of SF tree cover and LR tree cover, weighted by lot coverage. This calculation assumed that lot coverage translates to canopy coverage proportionally.
Tree Canopy data was created by remote sensing techniques using LiDAR data. The canopy area was then intersected with project areas to calculate acres of tree cover. Comparing the acres of tree cover within a zone to the total amount of area within that zone resulted in percent tree cover. The GIS comparison was done at the city scale and then subdivided and summarized by zoning areas. The percent tree cover was then used to determine the amount of change (change coefficient) for high and low tree change scenarios.
First, the high scenario was calculated as the difference in percent between the proposed zone tree cover and the existing zone tree cover. This represents the maximum amount of potential change likely to occur based on the changes in zoning. It would approximate a condition wherein tree canopy would transition completely to the characteristics of the new zone designation over the 20-year period, including tree losses, and tree maturation, and replanting. For example, a high scenario zone change from LR- to NC/ to C would represent a 10.27 percent change in tree cover while a zone change from RSL to LR would be 0.85 percent. Because development occurs incrementally over time, such a complete transition is unlikely. The low scenario was calculated as half of this difference. For example, the same zone change from LR- to NC/ to C would represent a 5.14 percent change while a zone change from RSL to LR would be 0.43 percent. This assumes a more moderate level of change in canopy cover. The range of tree loss was calculated by multiplying the acres of land in each zone change category by its high and low change coefficient to determine the amount of acres lost for each zone. The same methods were used to calculate tree loss for the Displacement and Access summary table.
EXISTING CONDITIONS
The nature of Seattle’s landforms, soils, streams, and wetlands and the risks posed by large seismic events and seasonal weather, has led the City to designate ECAs. These are places where landslides or floods could occur, or major soil movements during earthquakes, or where there are riparian features that have recreational and aesthetic value. ECAs provide natural functions and values that support wildlife presence and also fish passage through major waterbodies. The Seattle Comprehensive Plan Update Draft EIS describes the City’s existing landforms and natural
MHA Final EISNov. 2017
3.320
features and provides an overview of ECAs in the City (City of Seattle, 2015). Areas designated as ECAs include (SMC 25.09.020): • Landslide-prone areas (including steep slope areas, potential landslide
areas and known landslide areas) • Liquefaction-prone areas (sites with loose, saturated soil that can lose
the strength needed to support a building during earthquakes) • Peat-settlement-prone areas (sites containing peat and organic soils that
may settle when the area is developed or the water table is lowered) • Seismic hazard areas • Volcanic hazard areas • Flood-prone areas • Wetlands • Fish and wildlife habitat conservation areas (including priority habitats
and species areas, riparian corridors, and habitat for species of local importance)
• Abandoned landfills
Other studies including the Duwamish River Cumulative Health Impacts Analysis describe and examine a range of disproportionate health exposures and impacts affecting people in certain neighborhood areas. (Duwamish River Cleanup Coalition, 2013).
Many but not all of these features are in lightly developed areas or are otherwise protected as parklands in the City. Table 3.1–1 in Chapter 3.1 of the Comprehensive Plan DEIS lists the presence of ECAs in or near urban centers and villages. Generally, while there is often a scattered presence of mapped steep slope ECAs within many lower-density residential neighborhoods, the majority of the urban centers’ and villages’ areas are developed in the flatter and lesser constrained areas of the city, which do not contain ECAs. The DEIS also describes areas of the City with a greater potential risk of ECA disturbance (City of Seattle, 2015).
A healthy urban forest provides benefits including air and water pollution mitigation, habitat for wildlife, reduction of the urban heat island effect, and storm water runoff reduction. Trees are fundamental to the character of Seattle—a city that celebrates its reputation as one of the country’s greenest cities. Trees create beautiful views in their own right, and frame views of other natural wonders, such as Mount Rainier, the Cascade and Olympic mountain ranges, Puget Sound, and magnificent lakes throughout Seattle. Seattle’s natural landscape was originally heavily wooded; however, most of the original trees were clear-cut by the late 1800s. Seattle’s existing urban forest is mostly human-made and consists of more recently planted vegetation (City of Seattle, 2013).

MHA Final EISNov. 2017
3.321
3.6.2 IMPACTSThe Implementing MHA in the study area program would not directly impact any biological resources, but development allowed by the MHA program could affect these resources by affecting decisions to redevelop or expand properties containing trees or ECAs. All anticipated growth has the potential to affect these resources and would be required to comply with the existing regulations for protection of ECAs and trees. The City’s regulations require protective measures such as erosion controls that limit areas subject to construction-related disturbance and minimize the transport of soils and pollutants off site. There are also protections through critical areas regulations that will be applied where relevant, such as buffers, prohibitions on disturbance or limitations on the nature and extent of development activities.
IMPACTS COMMON TO ALL ALTERNATIVES
Development and redevelopment is expected to occur under all of the alternatives, although at different projected rates. In general, development of any kind has the potential to affect ECAs and tree canopy cover through site disturbance during construction and through land use activities after construction. Under all of the alternatives, parcels that are not proposed to have a zoning change but are included within the MHA study area still have the potential for development or redevelopment based on the existing zoning category. However, Alternatives 2, and 3, and the Preferred Alternative would allow more housing units and more dense development within the project study area than would Alternative 1. In the action alternatives, uniform application of MHA to existing areas within urban villages that have ECA’s and those that do not, is expected to maintain a balance of development feasibility conditions between lands with and without ECAs.
Under all of the alternatives, zoning changes to lands classified in the public domain would not result in direct impacts to biological resources. This includes parks, open and green spaces, trails, schools, and cemeteries. These public areas are not anticipated to have changes to intensify use over the life of the project. Because of this, it can be inferred that existing ECAs and trees would be retained and allowed to mature naturally. Indirect impacts, such as changes to stream flows from upstream development, could occur. Direct and indirect impacts to ECA’s would be evaluated on a project by project basis as a condition of permitting.

MHA Final EISNov. 2017
3.322
IMPACTS OF ALTERNATIVE 1 NO ACTION
Alternative 1 is based on the growth strategy of the Seattle 2035 Comprehensive Plan and assumes that MHA would not be implemented in the study area. No area-wide zoning changes or affordable housing requirements would take place. Under Alternative 1, redevelopment, demolition, and new construction projects could occur in the study area under the existing zoning.
ECAs
Under Alternative 1, there would be no change in zoning due to the MHA program. All existing critical area regulations would continue to govern development in and near ECAs under the current zoning.
Tree Canopy
Under Alternative 1, there would be no change in zoning due to the MHA program. The resulting change in canopy cover is assumed to be static. In other words, changes in canopy coverage would still be expected, but as a result of the current zoning and tree protection policies, codes, and development standards. This study does not quantify tree loss resulting from current development patterns.
IMPACTS OF ALTERNATIVE 2
Alternative 2 would revise the existing Land Use Code, resulting in a potential for 63,070 housing units in the planning area, an increase of 39 percent in housing unit growth compared to 45,361 housing units under Alternative 1. The overall effect would be an additional 17,709 housing units (see Chapter 2, Exhibit 2–7). Additionally, the zoning changes would allow the scale of development to increase and in some cases, the type of structures. For additional details on the potential land use changes that would be allowed under the alternatives, see Section 3.2 Land Use.
In Alternative 2, urban village boundary expansions approximating a full 10-minute walkshed are proposed in 10 of the urban villages where boundary expansions were proposed in the Seattle 2035 Comprehensive Plan update process, plus a small urban village boundary expansion in Northgate. The Seattle 2035 Comprehensive Plan Future Land Use map would be modified to reflect larger urban villages in these areas.

MHA Final EISNov. 2017
3.323
ECAs
Growth will occur in all urban villages in varying amounts due to the proposed changes in zoning and boundary expansion. Given the potential for future growth, ECAs in these areas could experience adverse impacts generated during future construction and by increased density of urban uses and activities after construction.
During Construction
Future development will lead to grading, demolition and similar construction activities that will generate the potential for disturbed soil to be conveyed off site and into nearby drainage systems, primarily through stormwater runoff, tracking of soils, and leaking of petroleum products on surfaces in the local vicinity. Releases could be intentional or unintentional in nature, and could make their way into local streams or wetlands through stormwater washoff and drainage. On construction sites that are close to natural vegetated areas and/or ECAs, there may be increased potential for disturbance to generate adverse impacts, such as when potentially unstable steep slopes or poor quality soils are present.
In a variety of places, future development in properties without ECAs could indirectly lead to adverse effects upon critical areas such as natural ravine drainages that lie in nearby downstream locations. This could occur in places that drain to natural streams or via drainage utility systems that are designed to outfall to natural receiving waterbodies if soils and other pollutants are washed off and conveyed far enough away from construction sites. Compliance with regulations for on-site activities is anticipated to sufficiently address and minimize the potential for adverse impacts of these kinds from future development.
After Construction
Even after construction, future possible activities on residential or commercial properties could adversely affect ECAs directly or indirectly. Examples include: landscaping involving earth movement in or near critical areas, improper tree cutting or other vegetation management that violates City rules, paving areas without including appropriate stormwater control features, or the cumulative effects of multiple parties’ actions that could potentially alter drainage patterns and/or affect soil and slope stability.
The proposed changes in zoning may result in increased density and activity levels for residential or commercial purposes and the associated use of automobiles and other activities, which could contribute to additional increments of adverse water quality impacts in ECAs. For

MHA Final EISNov. 2017
3.324
example, wetlands and streams may be impacted by runoff of pollutants from street surfaces and discharge of pollutants into drains. However, the City’s current level of requirements for stormwater and water quality controls mean that future development would in most cases be expected to lead to net increases in protection of nearby ECAs or other natural resources, due to the slowing, redirection and treatment of stormwater and surface runoff by on-site systems.
Based on the analysis of available information, ECAs cover approximately 9,000 acres of all Urban Villages combined with nearly 69 percent (6,149 acres) designated as liquefaction prone areas. Under Alternative 2, an additional 142 acres of mapped ECAs would occur within the boundaries of Urban Villages. This is a 1.6 percent increase from current conditions and is considered very minimal. In addition, the expansion areas are located at the outer edges of the current Urban Villages boundaries and are thus adjacent to lower zoning designations. Exhibit 3.6–1 shows the total amount (acres) of each ECA type (i.e., wetland, steep slopes, etc.) for all of the Urban Village Expansion Areas combined. Exhibit 3.6–3 and Exhibit 3.6–4 display the locations of mapped critical areas within the City, Urban Villages, and Urban Village Expansion Areas for MHA Alternative 2.
Exhibit 3.6–1 ECA Analysis Summary, Alternative 2
ECA Type
Amount (Acres) of Mapped ECA within All Existing Urban Villages
Amount (Acres) of Mapped ECA within All MHA Alternative 2
Urban Village Expansion Areas
Steep Slope Erosion Areas 375.5 30.3
Slope 40% Areas 481.9 27.8
Potential Slide Areas 259.6 23.0
Known Slide Areas 37.4 0.9
Liquefaction-Prone Areas 6,148.8 24.1
Peat Settlement-Prone Areas 632.8 4.2
Flood-Prone Areas 138.8 0.1
Wetland Areas 54.7 0.6
Priority Habitats and Species Areas 254.2 30.3
Riparian Corridors 101.3 0.3
Shoreline Habitat Areas 442.7 —
Total 8,927.7 141.6
Note: Only ECAs that overlap urban villages are shown; other ECA types occur within the City, but are not mapped within the existing and proposed expansion areas of Urban Villages (seismic hazard areas, volcanic hazard areas, abandoned landfills). ECA amounts were calculated using 2017 Seattle GIS data for ECAs and the urban village boundaries used for the alternatives.Source: ESA, 2017.

MHA Final EISNov. 2017
3.325
In general, the parcels within the expansion areas that are changing from non-Urban Village to Urban Village would potentially experience redevelopment, which may affect ECAs in ways described above. Parcels within Urban Villages that have proposed zoning changes may also experience redevelopment due to the changes in the development standards in the land use code (e.g., removal of density limits for some zones and increases in height and the allowable floor-to-area ratios). In particular, the increases in FAR is proposed for all zones except LR1, RSL, and SF may result in potential for adverse impacts to ECAs in and near the vicinity generated during future construction and by increased density of urban uses and activities after construction. However, current ECA regulations would continue to govern development. Projects proposed under the regulations would require site-specific analysis to determine the presence of ECAs, and subsequent avoidance and minimization of potential impacts. In addition, landscaping and setback requirements will be required on parcels in LR, MR, HR, NC, and C zones, which can contribute to overall vegetation preservation and rectification.
Exhibit 3.6–2 provides the total acreage of ECAs that intersect urban villages and expansion areas in Alternative 2. Urban villages with high displacement risk have the largest amounts of ECAs added to urban villages. Compared to Alternative 3, there are 7.2 more acres of ECAs in expansion areas in urban villages with high displacement risk and low access to opportunity. Most of the difference is due to a larger urban village boundary expansion in Rainier Beach. In urban villages with high displacement risk and high access to opportunity, there are 25.9 more acres of ECAs in expansion areas compared to Alternative 3. Most of the difference is due to a larger urban village boundary expansion in the 23rd & Union–Jackson Urban Village near the I-90 right-of-way. Exhibit 3.6–3 and Exhibit 3.6–4 provide maps of ECAs in urban villages.
Exhibit 3.6–2 ECA and Shoreline District Land Area in MHA Study Area Urban Villages and Expansion Areas (Acres), Alternative 2
Neighborhood Type Existing Urban Villages Expansion Areas
High Displacement Risk & Low Access to Opportunity 544.4 30.7
Low Displacement Risk & High Access to Opportunity 285.2 2.7
High Displacement Risk & High Access to Opportunity 573.9 47.8
Low Displacement Risk & Low Access to Opportunity 23.3 —
Source: ESA, 2017.

MHA Final EISNov. 2017
3.326
5
5
520
LakeUnion
LakeWashington
GreenLake
23rd &Union-Jackson
Aurora-LictonSprings
Ballard
BitterLake
Village
CrownHill
Eastlake
First Hill-Capitol Hill
Fremont
GreenLake
Greenwood-Phinney Ridge
Lake City
Madison-Miller
Northgate
Roosevelt
Wallingford
UpperQueen
Anne
Downtown
South LakeUnion
UniversityCommunity
Uptown
miles210 0.5
Exhibit 3.6–3 Critical Areas, Alternative 2 North
UrbanCenters/Villages
In MHA Study Area
Outside MHA Study AreaPotential ExpansionAreas: Alternative 2
Geologic Hazard andSteep Slope Areas
Known Slide Area
Slopes <40%
Potential Slide Areas
Steep Slope Erosion Areas
Peat Settlement Prone Areas
Liquefaction Prone Areas
Known Slide Location
Fish and Wildlife HabitatConservation Areas
Riparian CorridorPriority Habitatsand Species AreasShoreline Habitat
Flood Prone Areas
Wetlands
Source: City of Seattle, 2017; Seattle Department of Transportation, 2017.

MHA Final EISNov. 2017
3.327
5
5
90
509
99
LakeWashington
Elliott Bay
Admiral
ColumbiaCity
MorganJunction
North Rainier
Othello
RainierBeach
SouthPark
West SeattleJunction
Westwood-Highland Park
NorthBeacon
Hill
23rd &Union-Jackson
Madison-Miller
First Hill-Capitol Hill
Downtown
miles210 0.5
Exhibit 3.6–4 Critical Areas, Alternative 2 South
UrbanCenters/Villages
In MHA Study Area
Outside MHA Study AreaPotential ExpansionAreas: Alternative 2
Geologic Hazard andSteep Slope Areas
Known Slide Area
Slopes <40%
Potential Slide Areas
Steep Slope Erosion Areas
Peat Settlement Prone Areas
Liquefaction Prone Areas
Known Slide Location
Fish and Wildlife HabitatConservation Areas
Riparian CorridorPriority Habitatsand Species AreasShoreline Habitat
Flood Prone Areas
Wetlands
Source: City of Seattle, 2017; Seattle Department of Transportation, 2017.
MHA Final EISNov. 2017
3.328
Tree Canopy
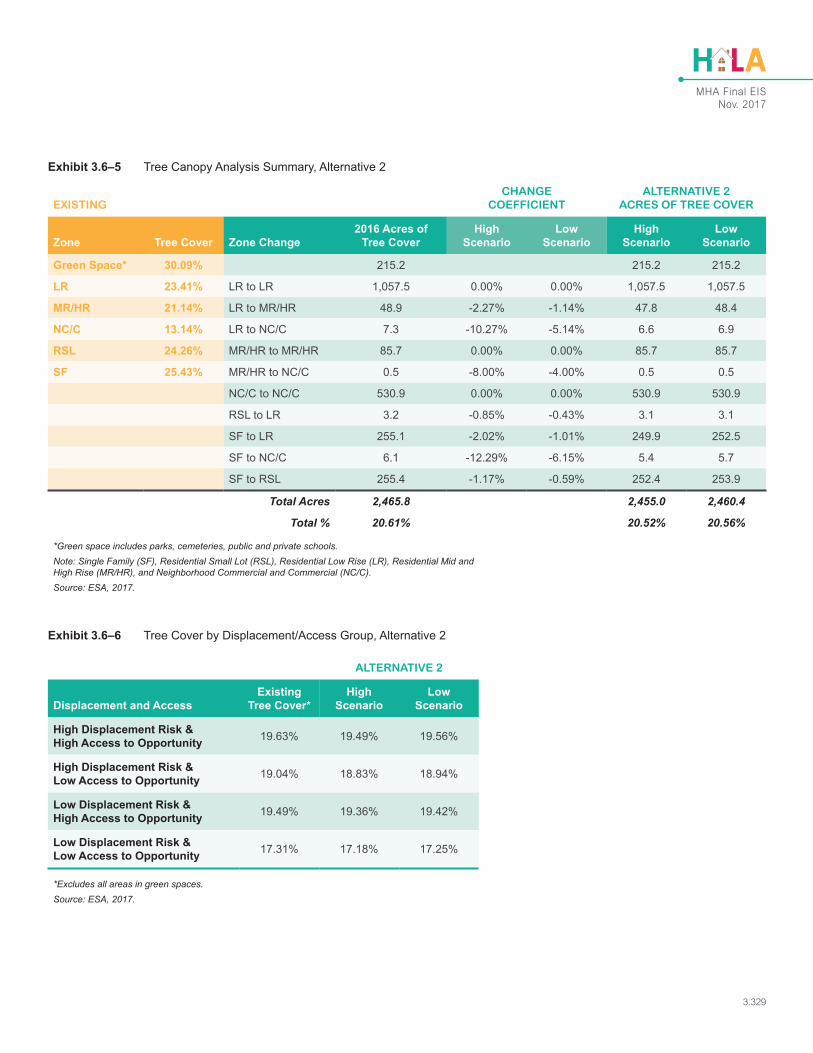
The analysis described above was completed for the Alternative 2 zoning changes and is summarized in Exhibit 3.6–5. The parcels changing from SF and LR to NC/C would see the largest change in tree canopy cover if fully developed; however, these two categories only account for approximately 13 acres within the 2,466-acre study area. Overall, there is currently approximately 20 percent tree canopy coverage within the Alternative 2 study area. With the zoning changes proposed in Alternative 2, there is the potential for a total loss of between 5 and 11 acres of tree canopy cover within the study area.
Exhibit 3.6–6 summarizes the existing tree canopy cover for the Alternative 2 study area by Displacement Risk and Access to Opportunity categories. In all cases, there is less than one percent difference between the existing cover and the Alternative 2 scenario.
In every category, there is less than one-half of one percent (<0.5 percent) difference between the existing tree canopy cover and the Alternative 2 scenario. In addition, this change in cover is a conservative scenario based on full conversion to characteristics of the proposed zoning.
The Tree Protection Ordinance (SMC 25.11) would not change with the proposed changes in zoning and would regulate all tree removal resulting from implementation of the project. The City does not have a threshold for determining significance of tree loss. Assuming that all tree protection regulations are implemented with future development under the new zoning, the This change in tree canopy cover under Alternative 2 is not considered a significant impact.
MHA Final EISNov. 2017
3.329
Exhibit 3.6–5 Tree Canopy Analysis Summary, Alternative 2
EXISTINGCHANGE
COEFFICIENTALTERNATIVE 2
ACRES OF TREE COVER
Zone Tree Cover Zone Change2016 Acres of
Tree CoverHigh
ScenarioLow
ScenarioHigh
ScenarioLow
Scenario
Green Space* 30.09% 215.2 215.2 215.2
LR 23.41% LR to LR 1,057.5 0.00% 0.00% 1,057.5 1,057.5
MR/HR 21.14% LR to MR/HR 48.9 -2.27% -1.14% 47.8 48.4
NC/C 13.14% LR to NC/C 7.3 -10.27% -5.14% 6.6 6.9
RSL 24.26% MR/HR to MR/HR 85.7 0.00% 0.00% 85.7 85.7
SF 25.43% MR/HR to NC/C 0.5 -8.00% -4.00% 0.5 0.5
NC/C to NC/C 530.9 0.00% 0.00% 530.9 530.9
RSL to LR 3.2 -0.85% -0.43% 3.1 3.1
SF to LR 255.1 -2.02% -1.01% 249.9 252.5
SF to NC/C 6.1 -12.29% -6.15% 5.4 5.7
SF to RSL 255.4 -1.17% -0.59% 252.4 253.9
Total Acres 2,465.8 2,455.0 2,460.4
Total % 20.61% 20.52% 20.56%
*Green space includes parks, cemeteries, public and private schools.Note: Single Family (SF), Residential Small Lot (RSL), Residential Low Rise (LR), Residential Mid and High Rise (MR/HR), and Neighborhood Commercial and Commercial (NC/C).Source: ESA, 2017.
Exhibit 3.6–6 Tree Cover by Displacement/Access Group, Alternative 2
ALTERNATIVE 2
Displacement and AccessExisting
Tree Cover*High
ScenarioLow
Scenario
High Displacement Risk & High Access to Opportunity 19.63% 19.49% 19.56%
High Displacement Risk & Low Access to Opportunity 19.04% 18.83% 18.94%
Low Displacement Risk & High Access to Opportunity 19.49% 19.36% 19.42%
Low Displacement Risk & Low Access to Opportunity 17.31% 17.18% 17.25%
*Excludes all areas in green spaces.Source: ESA, 2017.

MHA Final EISNov. 2017
3.330
IMPACTS OF ALTERNATIVE 3
Alternative 3 would revise the existing Land Use Code resulting in a potential for 62,858 housing units in the planning area, an increase of 38.6 percent in housing unit growth compared to 45,361 housing units under Alternative 1. The overall effect would be an additional 17,497 housing units (see Chapter 2, Exhibit 2–7).
Under Alternative 3, expansions to the boundaries of 10 urban villages are proposed, and the Future Land Use map would be modified to reflect the larger urban villages. However, urban village boundary expansion areas are reduced from an approximate 10-minute walkshed, to an approximate 5-minute walkshed from the transit node for certain urban villages based on the Access to Opportunity and Displacement Risk typology. This reduced walkshed results in smaller urban village boundary expansions for Rainier Beach, Othello, North Rainier, North Beacon Hill and 23rd & Union-Jackson in Alternative 3 compared to Alternative 2.
ECAs
Based on the analysis for Alternative 3, an additional 102 acres of ECAs would be within the expanded boundaries, or a 1.2 percent increase from existing conditions (Exhibit 3.6–7). This is approximately 40 acres less than Alternative 2, although both alternatives would experience very minimal changes in comparison to the current amount of mapped critical areas. As with Alternative 2, parcels within Urban Villages that have proposed zoning changes may also experience redevelopment due to the changes in the development standards. Current critical areas would continue to govern development and projects proposed under the regulations would require site analysis to determine the presence of ECAs, and subsequent avoidance and minimization of potential impacts.
Exhibit 3.6–8 provides the total acreage of ECAs that intersect in urban villages and expansion areas in Alternative 3. The largest increases in ECA acreage occur in urban villages with high displacement risk, like Alternative 2 but to a lesser degree. Compared to Alternative 2, there are 7.2 fewer acres of ECAs in expansion areas in urban villages with high displacement risk and low access to opportunity. Most of the difference is due to a smaller urban village boundary expansion in Rainier Beach. In urban villages with high displacement risk and high access to opportunity, there are 25.9 fewer acres of ECAs in expansion areas compared to Alternative 2. Most of the difference is due to a smaller urban village boundary expansion in the 23rd & Union–Jackson Urban Village near

MHA Final EISNov. 2017
3.331
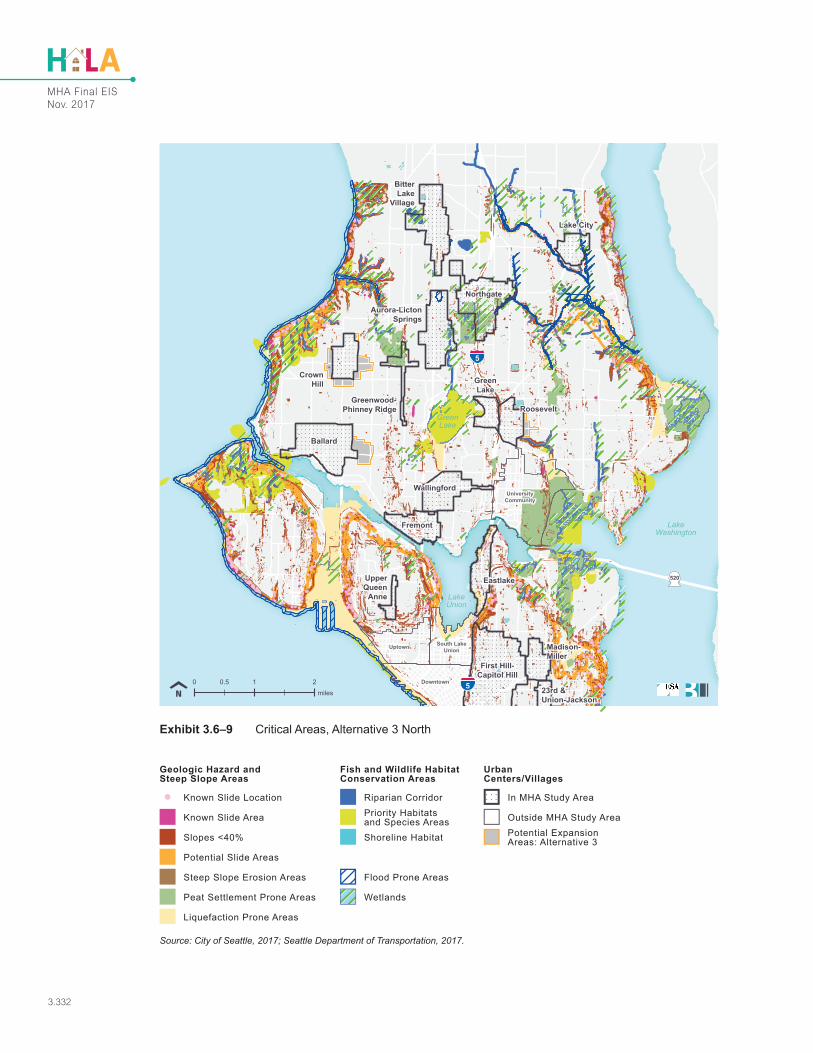
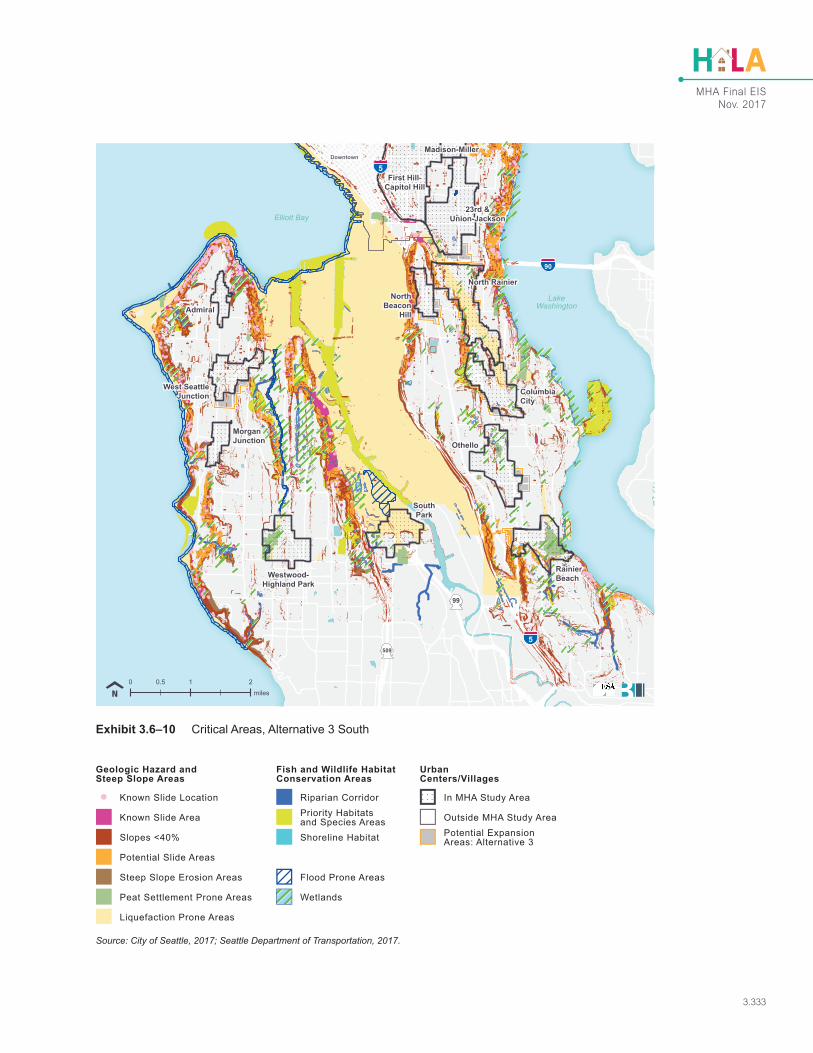
the I-90 right-of-way. Compared to Alternative 2, 0.9 more acres of ECAs exist in expansion areas in urban villages with low displacement risk and high access to opportunity due to the inclusion of small isolated ECA areas in West Seattle Junction and Roosevelt. Exhibit 3.6–9 and Exhibit 3.6–10 provide maps of ECAs in urban villages.
Exhibit 3.6–7 ECA Analysis Summary, Alternative 3
ECA Type
Amount (Acres) of Mapped ECA within All Existing Urban Villages
Amount (Acres) of Mapped ECA within All MHA Alternative 3
Urban Village Expansion Areas
Steep Slope Erosion Areas 375.5 24.4
Slope 40% Areas 481.9 21.4
Potential Slide Areas 259.6 17.0
Known Slide Areas 37.4 0.5
Liquefaction-Prone Areas 6,148.8 8.6
Peat Settlement-Prone Areas 632.8 —
Flood-Prone Areas 138.8 0.1
Wetland Areas 54.7 0.4
Priority Habitats and Species Areas 254.2 29.6
Riparian Corridors 101.3 0.3
Shoreline Habitat Areas 442.7 —
Total 8,927.7 102.3
Note: Only ECAs that overlap urban villages are shown; other ECA types occur within the City, but are not mapped within the existing and proposed expansion areas of Urban Villages (seismic hazard areas, volcanic hazard areas, abandoned landfills). ECA amounts were calculated using 2017 Seattle GIS data for ECAs and the urban village boundaries used for the alternatives.Source: ESA, 2017.
Exhibit 3.6–8 ECA and Shoreline District Land Area in MHA Study Area Urban Villages and Expansion Areas (Acres), Alternative 3
Neighborhood Type Existing Urban Villages Expansion Areas
High Displacement Risk & Low Access to Opportunity 501.9 23.4
Low Displacement Risk & High Access to Opportunity 275.2 3.6
High Displacement Risk & High Access to Opportunity 573.6 21.9
Low Displacement Risk & Low Access to Opportunity 23.3 —
Source: ESA, 2017.
MHA Final EISNov. 2017
3.332
5
5
520
LakeUnion
LakeWashington
GreenLake
23rd &Union-Jackson
Aurora-LictonSprings
Ballard
BitterLake
Village
CrownHill
Eastlake
First Hill-Capitol Hill
Fremont
GreenLake
Greenwood-Phinney Ridge
Lake City
Madison-Miller
Northgate
Roosevelt
Wallingford
UpperQueen
Anne
Downtown
South LakeUnion
UniversityCommunity
Uptown
miles210 0.5
Exhibit 3.6–9 Critical Areas, Alternative 3 North
UrbanCenters/Villages
In MHA Study Area
Outside MHA Study AreaPotential ExpansionAreas: Alternative 3
Geologic Hazard andSteep Slope Areas
Known Slide Area
Slopes <40%
Potential Slide Areas
Steep Slope Erosion Areas
Peat Settlement Prone Areas
Liquefaction Prone Areas
Known Slide Location
Fish and Wildlife HabitatConservation Areas
Riparian CorridorPriority Habitatsand Species AreasShoreline Habitat
Flood Prone Areas
Wetlands
Source: City of Seattle, 2017; Seattle Department of Transportation, 2017.
MHA Final EISNov. 2017
3.333
5
5
90
509
99
LakeWashington
Elliott Bay
Admiral
ColumbiaCity
MorganJunction
North Rainier
Othello
RainierBeach
SouthPark
West SeattleJunction
Westwood-Highland Park
NorthBeacon
Hill
23rd &Union-Jackson
Madison-Miller
First Hill-Capitol Hill
Downtown
miles210 0.5
Exhibit 3.6–10 Critical Areas, Alternative 3 South
UrbanCenters/Villages
In MHA Study Area
Outside MHA Study AreaPotential ExpansionAreas: Alternative 3
Geologic Hazard andSteep Slope Areas
Known Slide Area
Slopes <40%
Potential Slide Areas
Steep Slope Erosion Areas
Peat Settlement Prone Areas
Liquefaction Prone Areas
Known Slide Location
Fish and Wildlife HabitatConservation Areas
Riparian CorridorPriority Habitatsand Species AreasShoreline Habitat
Flood Prone Areas
Wetlands
Source: City of Seattle, 2017; Seattle Department of Transportation, 2017.

MHA Final EISNov. 2017
3.334
Tree Canopy
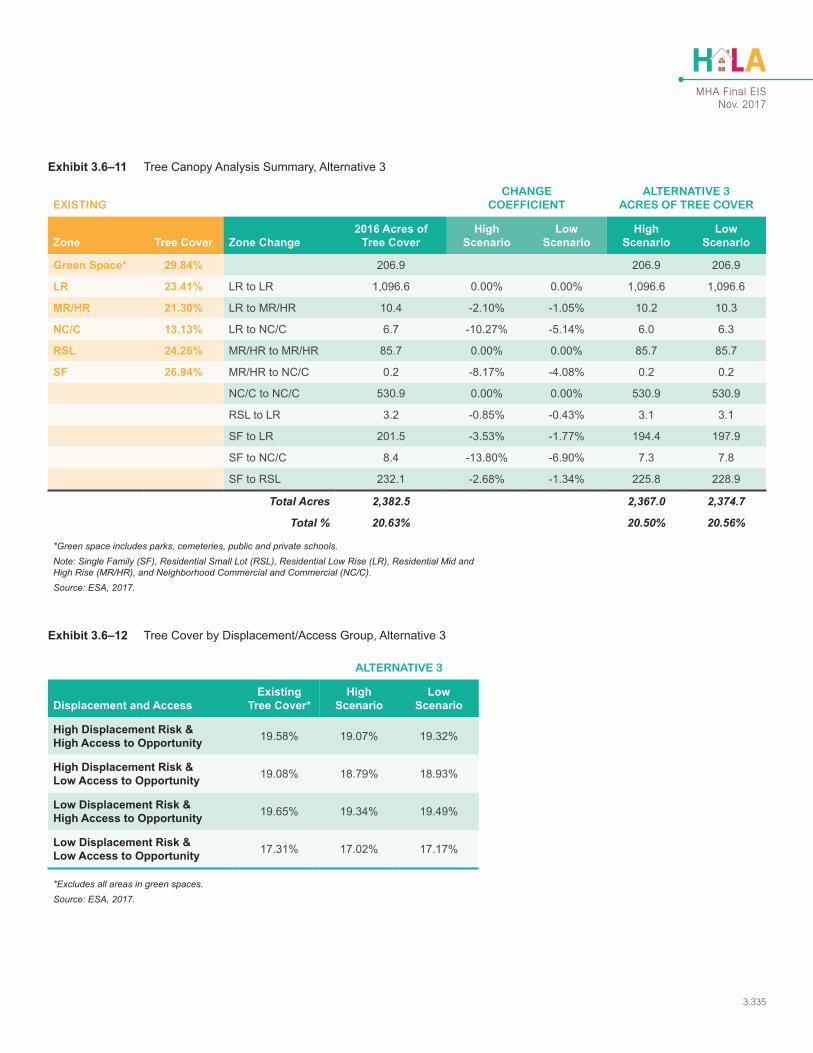
The analysis described above was completed for the Alternative 3 zoning changes and is summarized in Exhibit 3.6–11. Similar to Alternative 2, the parcels changing from SF and LR to NC/C would see the largest change in tree canopy cover if fully developed; however, these two categories only account for approximately 15 acres within the 2,383-acre study area. Overall, there is currently approximately 21 percent tree canopy coverage within the Alternative 3 study area. With the zoning changes proposed in Alternative 3, there is the potential for a total loss of between 8 and 16 acres of tree canopy cover.
Exhibit 3.6–12 summarizes the existing tree canopy cover for the Alternative 3 study area by Displacement Risk and Access to Opportunity categories.
In every category, there is less than one-half of one percent (<0.5 percent) difference between the existing tree canopy cover and the Alternative 3 scenario. In addition, this change in cover is a worst-case scenario based on full development under the proposed zoning.
The Tree Protection Ordinance (SMC 25.11) would not change with the proposed changes in zoning and would regulate all tree removal resulting from implementation of the project. The City does not have a threshold for determining significance of tree loss. Assuming that all tree protection regulations are implemented with future development under the new zoning, the change in tree canopy cover under Alternative 3 is not considered a significant impact. This change is not considered a significant impact.
MHA Final EISNov. 2017
3.335
Exhibit 3.6–11 Tree Canopy Analysis Summary, Alternative 3
EXISTINGCHANGE
COEFFICIENTALTERNATIVE 3
ACRES OF TREE COVER
Zone Tree Cover Zone Change2016 Acres of
Tree CoverHigh
ScenarioLow
ScenarioHigh
ScenarioLow
Scenario
Green Space* 29.84% 206.9 206.9 206.9
LR 23.41% LR to LR 1,096.6 0.00% 0.00% 1,096.6 1,096.6
MR/HR 21.30% LR to MR/HR 10.4 -2.10% -1.05% 10.2 10.3
NC/C 13.13% LR to NC/C 6.7 -10.27% -5.14% 6.0 6.3
RSL 24.26% MR/HR to MR/HR 85.7 0.00% 0.00% 85.7 85.7
SF 26.94% MR/HR to NC/C 0.2 -8.17% -4.08% 0.2 0.2
NC/C to NC/C 530.9 0.00% 0.00% 530.9 530.9
RSL to LR 3.2 -0.85% -0.43% 3.1 3.1
SF to LR 201.5 -3.53% -1.77% 194.4 197.9
SF to NC/C 8.4 -13.80% -6.90% 7.3 7.8
SF to RSL 232.1 -2.68% -1.34% 225.8 228.9
Total Acres 2,382.5 2,367.0 2,374.7
Total % 20.63% 20.50% 20.56%
*Green space includes parks, cemeteries, public and private schools.Note: Single Family (SF), Residential Small Lot (RSL), Residential Low Rise (LR), Residential Mid and High Rise (MR/HR), and Neighborhood Commercial and Commercial (NC/C).Source: ESA, 2017.
Exhibit 3.6–12 Tree Cover by Displacement/Access Group, Alternative 3
ALTERNATIVE 3
Displacement and AccessExisting
Tree Cover*High
ScenarioLow
Scenario
High Displacement Risk & High Access to Opportunity 19.58% 19.07% 19.32%
High Displacement Risk & Low Access to Opportunity 19.08% 18.79% 18.93%
Low Displacement Risk & High Access to Opportunity 19.65% 19.34% 19.49%
Low Displacement Risk & Low Access to Opportunity 17.31% 17.02% 17.17%
*Excludes all areas in green spaces.Source: ESA, 2017.
MHA Final EISNov. 2017
3.336
IMPACTS OF THE PREFERRED ALTERNATIVE
As described in Chapter 2, the Preferred Alternative assigns development capacity increases with an approach similar to Alternative 3, but places a greater emphasis on proximity to frequent transit nodes. Changes to zoning under the Preferred Alternative would result in the potential for 64,267 new housing units in the planning area, an increase of 41.7 percent, or 18,906 housing units, compared to Alternative 1.
Under the Preferred Alternative, boundary expansions are proposed to the same 10 urban villages as in Alternatives 2 with the exception of Northgate, and Alternative 3. In the Preferred Alternative urban village boundary expansion areas include an approximate 10-minute walkshed for all expanded villages, with greater capacity increases made within an approximate 5-minute walkshed from frequent transit nodes. In the Preferred Alternative urban village boundary expansions are reduced compared to Alternative 2 to avoid expansion in areas with sensitive environmental conditions.
ECAs
The Preferred Alternative would add 98.8 acres within the expanded boundaries, or a 1.1 percent increase from existing conditions (Exhibit 3.6–13). This is approximately 43 acres less than Alternative 2 and 3.5 acres less than Alternative 3. Although the Preferred Alternative includes 10-minute walkshed expansions similar to Alternative 2 it includes 30 percent less ECA land within the expanded areas than Alternative 2. All alternatives would experience very minimal changes in comparison to the current amount of mapped critical areas within the urban villages. As with Alternatives 2 and 3, parcels within areas that have proposed zoning changes may also experience redevelopment due to the changes in the development standards. The current critical areas code would continue to govern development and projects proposed under the regulations would require site analysis to determine the presence of ECAs and subsequent avoidance and minimization of potential impacts.
Exhibit 3.6–14 provides the total acreage of ECAs that intersect in urban villages and expansion areas in the Preferred Alternative. The largest increases in ECA acreage occur in urban villages with high displacement risk, very similar to Alternative 2. Compared to Alternative 2, there are a total of 12.3 fewer acres of ECAs in urban village expansion areas with high displacement risk.
New to the FEIS
Impacts of the Preferred Alternative, including Exhibit 3.6–13, Exhibit
3.6–14, Exhibit 3.6–15, and Exhibit 3.6–16, is a new section
since issuance of the DEIS

MHA Final EISNov. 2017
3.337
Exhibit 3.6–13 ECA Analysis Summary, Preferred Alternative
ECA Type
Amount (Acres) of Mapped ECA within All Existing Urban Villages
Amount (Acres) of Mapped ECA within All MHA Preferred Alternative
Urban Village Expansion Areas
Steep Slope Erosion Areas 375.5 19.1
Slope 40% Areas 481.9 17.4
Potential Slide Areas 259.6 23.1
Known Slide Areas 37.4 0.9
Liquefaction-Prone Areas 6,148.8 22.8
Peat Settlement-Prone Areas 632.8 4.2
Flood-Prone Areas 138.8 —
Wetland Areas 54.7 0.3
Priority Habitats and Species Areas 254.2 11.0
Riparian Corridors 101.3 —
Shoreline Habitat Areas 442.7 —
Total 8,927.7 98.8
Note: Only ECAs that overlap urban villages are shown; other ECA types occur within the City, but are not mapped within the existing and proposed expansion areas of Urban Villages (seismic hazard areas, volcanic hazard areas, abandoned landfills). ECA amounts were calculated using 2017 Seattle GIS data for ECAs and the urban village boundaries used for the alternatives.Source: ESA, 2017.
Exhibit 3.6–14 ECA and Shoreline District Land Area in MHA Study Area Urban Villages and Expansion Areas (Acres), Preferred Alternative
Neighborhood Type Existing Urban Villages Expansion Areas
High Displacement Risk & Low Access to Opportunity 501.9 22.3
Low Displacement Risk & High Access to Opportunity 275.2 3.9
High Displacement Risk & High Access to Opportunity 573.6 43.5
Low Displacement Risk & Low Access to Opportunity 23.3 —
Source: ESA, 2017.

MHA Final EISNov. 2017
3.338
Of the 98.8 acres of ECA area included in expansion areas 61 percent is a steep slope or potential slide area ECAs. Many of these are isolated slopes identified based on topographical data in GIS. In a city with varied topography it is common for developed lands to have slopes, and therefore the presence of isolated slopes on, or at the edges of developable urban land is common and may not represent an environmentally sensitive condition. Of the ECA acreage in expansion areas, 23 percent is in liquefaction-prone areas that are located throughout the floor of the Rainier Valley. These liquefaction prone areas are widespread within the existing Columbia City, North Rainier, and 23rd & Union-Jackson urban villages, and the urban village boundary expansions to the 10-minute walkshed would include an increment of additional land with the condition at the edges of these villages.
Tree Canopy
The analysis described above was completed for the zoning changes for the Preferred Alternative. Similar to the other Alternatives, the parcels changing from SF and LR to NC/C under the Preferred Alternative would see the largest change in tree canopy cover if fully developed. Overall, there is currently approximately 22 percent tree canopy coverage within the Preferred Alternative expansion areas. With the zoning changes proposed in the Preferred Alternative, there is the potential for a total loss of between 0.7 and 3.6 acres of tree canopy cover within those expansion areas.
Exhibit 3.6–16 summarizes the existing tree canopy cover for the Preferred Alternative by Displacement Risk and Access to Opportunity categories. In every category, there is less than one percent difference between the existing tree canopy cover and the Preferred Alternative scenario, and in all but one case, less than one-half of one percent (<0.5 percent) difference. In addition, this change in cover is a worst-case scenario based on full development under the proposed zoning.
The Tree Protection Ordinance (SMC 25.11) would not change with the proposed changes in zoning and would regulate all tree removal resulting from implementation of the project. The City does not have a threshold for determining significance of tree loss. Assuming that all tree protection regulations are implemented with future development under the new zoning, the change in tree canopy cover under the Preferred Alternative is not considered a significant impact.

MHA Final EISNov. 2017
3.339
Exhibit 3.6–15 Tree Canopy Analysis Summary, Preferred Alternative
EXISTINGCHANGE
COEFFICIENTPREFERRED ALTERNATIVE
ACRES OF TREE COVER
Zone Tree Cover Zone Change2016 Acres of
Tree CoverHigh
ScenarioLow
ScenarioHigh
ScenarioLow
Scenario
Green Space* 39.70% 206.2 206.2 206.2
LR 18.81% LR to LR 1,066.1 0.00% 0.00% 1,066.1 1,066.1
MR/HR 0.00% LR to MR/HR 15.8 -1.76% -0.88% 15.6 15.7
NC/C 12.25% LR to NC/C 10.6 -9.59% -4.80% 9.6 10.1
RSL 0.00% MR/HR to MR/HR 86.9 0.00% 0.00% 86.9 86.9
SF 22.24% MR/HR to NC/C 0.1 -7.84% -3.92% 0.1 0.1
NC/C to NC/C 511.4 0.00% 0.00% 511.4 511.4
RSL to LR 3.3 -7.18% 3.59% 3.0 3.1
SF to LR 183.7 -2.57% -1.29% 179.0 181.4
SF to NC/C 6.0 -12.16% -6.08% 5.3 5.6
SF to RSL 308.2 -1.81% -0.91% 302.6 305.4
SF to MR/HR 0.5 -4.33% -2.16% 0.5 0.5
Total Acres 2,398.8 2,386.3 2,392.5
Total % 21.01% 19.09% 19.15%
*Green space includes parks, cemeteries, public and private schools.Note: Single Family (SF), Residential Small Lot (RSL), Residential Low Rise (LR), Residential Mid and High Rise (MR/HR), and Neighborhood Commercial and Commercial (NC/C).Source: ESA, 2017.
Exhibit 3.6–16 Tree Cover by Displacement/Access Group, Preferred Alternative
PREFERRED ALTERNATIVE
Displacement and AccessExisting
Tree Cover*High
ScenarioLow
Scenario
High Displacement Risk & High Access to Opportunity 20.52% 19.76% 20.14%
High Displacement Risk & Low Access to Opportunity 19.47% 18.75% 19.11%
Low Displacement Risk & High Access to Opportunity 19.82% 19.08% 19.45%
Low Displacement Risk & Low Access to Opportunity** 16.88% 16.26% 16.57%
*Excludes all areas in green spaces.** There are no Low Displacement Risk & Low Access to Opportunity areas within the Preferred Alternative expansion areasSource: ESA, 2017.
MHA Final EISNov. 2017
3.340
3.6.3 MITIGATION MEASURESThis section has identified comparative differences in the potential for adverse impacts related to disturbance of ECAs and tree canopy by potential future development. However, none of these identified impacts are concluded to be significant adverse impacts. The following mitigation measures are provided, which would reduce impacts.
REGULATIONS AND COMMITTMENTS
The continued application of the City’s existing policies, review practices and regulations, would help to avoid and minimize the potential for significant adverse impacts to critical areas discussed in this section. Existing ECA regulations require a pre-construction survey for development or redevelopment in and near ECAs to determine the presence of significant biological resources, including exceptional trees. Should an ECA be identified, measures would be taken during project design to avoid, minimize, or mitigate the impact to the critical area. Such measures could include redesigning the facility to avoid the sensitive area, or enhancing the sensitive area. For sites with steep slopes and riparian corridors, appropriate building setbacks and erosion control measures would be taken into consideration.
For tree canopy, the City is evaluating a range of urban forestry policies and programs in preparation for the 2018 update of the Urban Forest Stewardship Plan (UFSP). Findings from the 2015 and 2016 canopy cover assessments, the regulatory research, and the analysis in this MHA Draft EIS indicate that tree protection codes and incentives are important to protecting, planting, and maintaining trees on private property as the city grows. Current options the City is exploring include:
• Address gaps in current tree protections through training, process, and systems improvements.
• Improve enforcement of regulations and penalties.
• Improve and/or expand tree protections.
• Expand incentives and development standards to grow trees as development occurs, specifically in single and multifamily residential areas.
• Increase stewardship of conifers, which provide the greatest public benefit and comprise only 28 percent of the canopy.
• Expand and enhance trees on public lands and in the right-of-way.
• Partner with the community to expand trees in low canopy areas to advance environmental justice and racial equity.

MHA Final EISNov. 2017
3.341
• Preserve and enhance tree groves to maximize environmental benefits.
• Strategically plant and care for trees to mitigate heat island effect and promote greater community resilience.
Executive Order 2017-11: Tree Protection
In October of 2017, the Mayor signed executive order 2017-11 directing City departments to improve departmental coordination, strengthen enforcement, and adopt new regulations to improve and expand protections for Seattle’s urban trees and canopy coverage. The executive order includes specific direction for enforcement adjustment and procedural improvements, tree protection, expanding compliance options, and tree and landscaping requirements. The order is expected to result in updates to SDCI Director’s rules regarding Exceptional Trees, removal of hazardous trees, and penalties for removing trees illegally. The order also calls for expansion of compliance options to include in-lieu payment options for tree mitigation. Fees from any-in-lieu payment will be used for mitigating the loss of canopy cover through replanting and reforestation while prioritizing addressing racial and economic disparities in accessing and enjoying the benefits of urban trees. Adjustments pursuant to the order could include providing greater protection for coniferous trees. Implementation of the executive order would mitigate impacts to tree canopy under all alternatives.
Design Review Amendments for Exceptional Tree Retention
In October of 2017, the Seattle City Council passed legislation reforming the design review process. The legislation includes an allowance for an additional 0.5 increment of Floor Area Ratio (FAR) or an additional 10 feet of allowed building height, if protection and retention of an exceptional tree is provided in a development project. Protection of the exceptional tree would be approved as a development standard departures through the design review process. Development projects seeking to use the incentive to preserve an exceptional tree could opt into the design review process whether or not design review thresholds would require design review.
Street Tree Requirements
Development standards in multi-family and commercial zones include required street tree planting. Planting of trees in the public right of
MHA Final EISNov. 2017
3.342
way encourages long-term tree maturation, as the tree is in the public domain. The City Arborist must approve the type of tree and the planting location for street trees.
INCORPORATED PLAN FEATURES
The Action Alternatives include features intended to reduce the negative effects associated with impacts to tree canopy, including the following proposed Land Use Code amendments:
Residential Small Lot Tree Planting Requirement
The proposed action would implement a new tree planting requirement in the Residential Small Lot (RSL) zone. There is currently no such requirement in the zone. Trees must be planted on the lot. The tree planting requirement is based on a scoring system that requires a minimum number of caliper inches of tree based on the lot size. The requirement provides greater weight for the planting of large tree species.
Modification to Green Factor Scoring System
The proposed action includes revision to green factor landscaping requirements scoring system to encourage planting and preservation of trees in new development. Revisions to the scoring system include:
• Less weight for planting of shrubs
• Greater weight for planting or preserving trees
• Remove vegetated walls from elements that meet requirements in residential zones
• Remove water features from elements that meet requirements in all zones
• Greater weight for trees and other vegetation to be placed near the public right of way
3.6.4 SIGNIFICANT UNAVOIDABLE ADVERSE IMPACTS
No significant unavoidable adverse impacts to ECAs or tree canopy cover have been identified.