Biological processes algal growth - unipd.itlasa.dii.unipd.it/mces/LEX/15_mces.pdf · Fixed...
38
University of Padova LASA – Environmental Systems Analysis Lab Modelling and Control of Environmental Systems 1 G A s m es r dt dA where A: weight concentration of algae [mgX/l] : growth rate [1/d] r: respiration rate [1/d] es: exudation rate [1/d] m: non-predatory mortality rate [1/d] s: sedimentation rate [1/d] G: grazing [mgX/l/d] Biological processes – algal growth ,... , , , Si C P N f L f T f T ref MAX Copyright © 2008 Field Studies Council http://www.theseashore.org.uk/theseashore/Plankton/Phyto.htm
Transcript of Biological processes algal growth - unipd.itlasa.dii.unipd.it/mces/LEX/15_mces.pdf · Fixed...
University of Padova LASA – Environmental Systems Analysis Lab Modelling and Control of Environmental Systems
1
GAsmesrdt
dA
where A: weight concentration of algae [mgX/l]
: growth rate [1/d]
r: respiration rate [1/d]
es: exudation rate [1/d]
m: non-predatory mortality rate [1/d]
s: sedimentation rate [1/d]
G: grazing [mgX/l/d]
Biological processes – algal growth
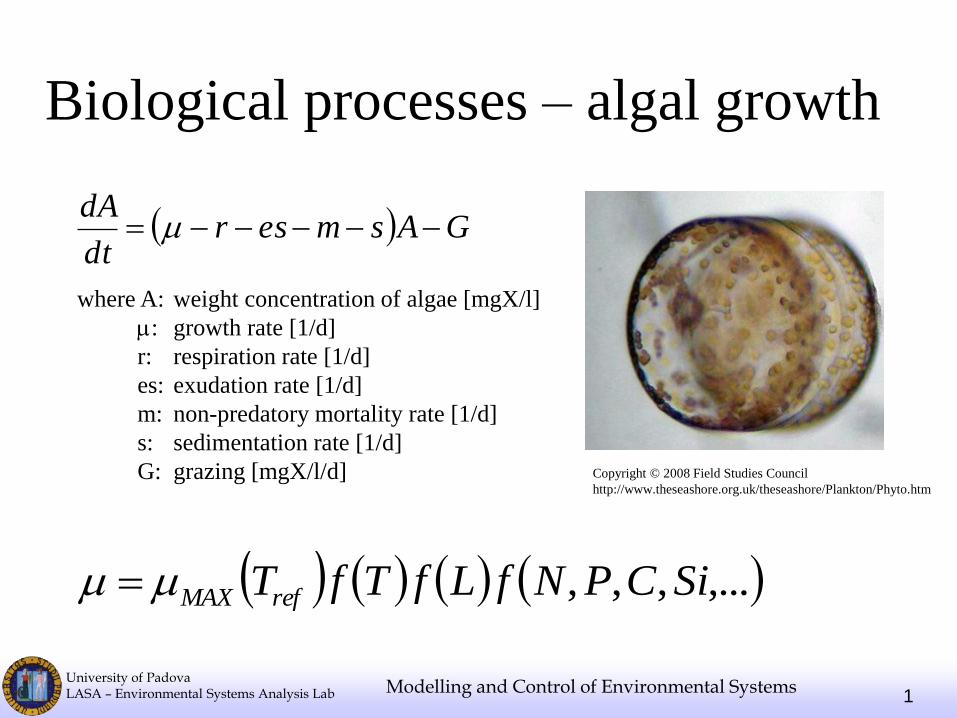
,...,,, SiCPNfLfTfTrefMAX
Copyright © 2008 Field Studies Council
http://www.theseashore.org.uk/theseashore/Plankton/Phyto.htm
University of Padova LASA – Environmental Systems Analysis Lab Modelling and Control of Environmental Systems
2
Temperature dependence
Linear: min
min
TT
TTTf
ref
Exponential: refTTTf
Optimum:
2
3.2optx
opt
TT
TT
eTf
Biological processes – algal growth
,...,,, SiCPNfLfTfTrefMAX

University of Padova LASA – Environmental Systems Analysis Lab Modelling and Control of Environmental Systems
3
Temperature °C
m
ax (
1/d
ay)
Biological processes – algal growth

University of Padova LASA – Environmental Systems Analysis Lab Modelling and Control of Environmental Systems
4
Light dependence: I(t,h)
Saturation: (Michaelis Menten equation)
Ik
IIf
L
Optimum (Steele):
optI
I
opt
eI
IIf
1
Iopt(t)?
Biological processes – algal growth
,...,,, SiCPNfLfTfTrefMAX

University of Padova LASA – Environmental Systems Analysis Lab Modelling and Control of Environmental Systems
5
Biological processes – algal growth

University of Padova LASA – Environmental Systems Analysis Lab Modelling and Control of Environmental Systems
6
f(L) for the calculation of the growth rate: integrate the previous ones
over depth and photoperiod
d
L
Lp
eIk
Ik
d
fLf
0
0lnSaturation:
opt
d
opt I
Ie
I
I
pee
d
feLf
00
Optimum:
Biological processes – algal growth
University of Padova LASA – Environmental Systems Analysis Lab Modelling and Control of Environmental Systems
7
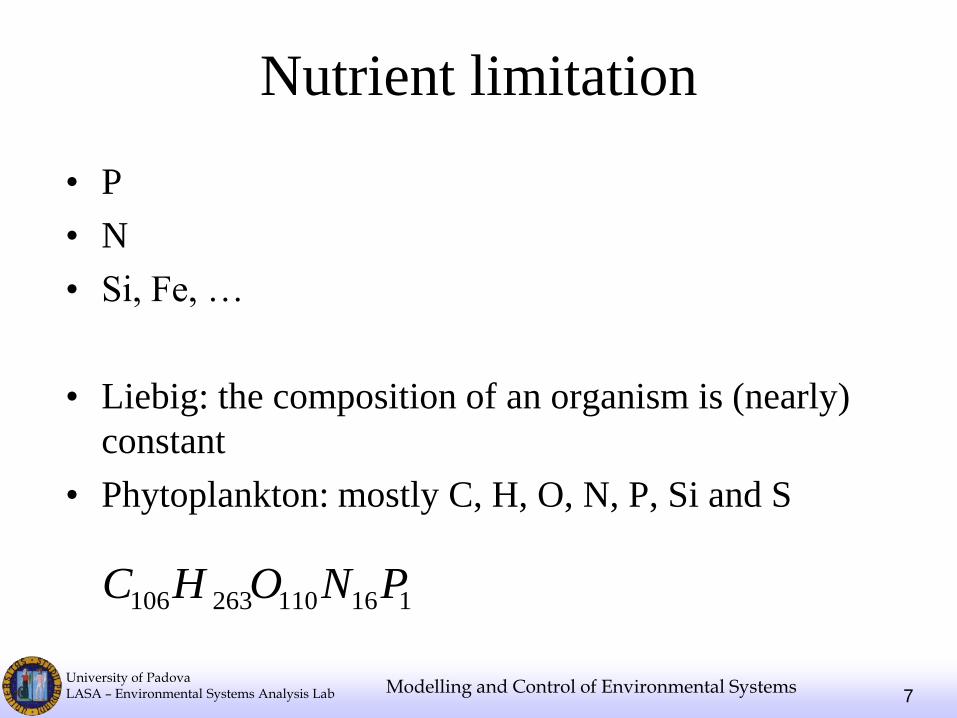
Nutrient limitation
• P
• N
• Si, Fe, …
• Liebig: the composition of an organism is (nearly)
constant
• Phytoplankton: mostly C, H, O, N, P, Si and S
116110263106 PNOHC

University of Padova LASA – Environmental Systems Analysis Lab Modelling and Control of Environmental Systems
8
Nutrient limitation
,min
,
PfNf
PfNfPNf ;
NKN
NNf
PKP
PPf
; NutKNut
NutNutf
Fixed stochiometry model
Nut = external nutrient concentration
Liebig’s Law of minimum
multiplication ~ “sinergy”
• harmonic mean
...,...,,, SifCfPfNfSiCPNf
,...,,,min,...,,, SifCfPfNfSiCPNf
...
1111,...,,,
SifCfPfNf
nSiCPNf
n
SifCfPfNfSiCPNf
...,...,,,
• arithmetic mean
University of Padova LASA – Environmental Systems Analysis Lab Modelling and Control of Environmental Systems
9
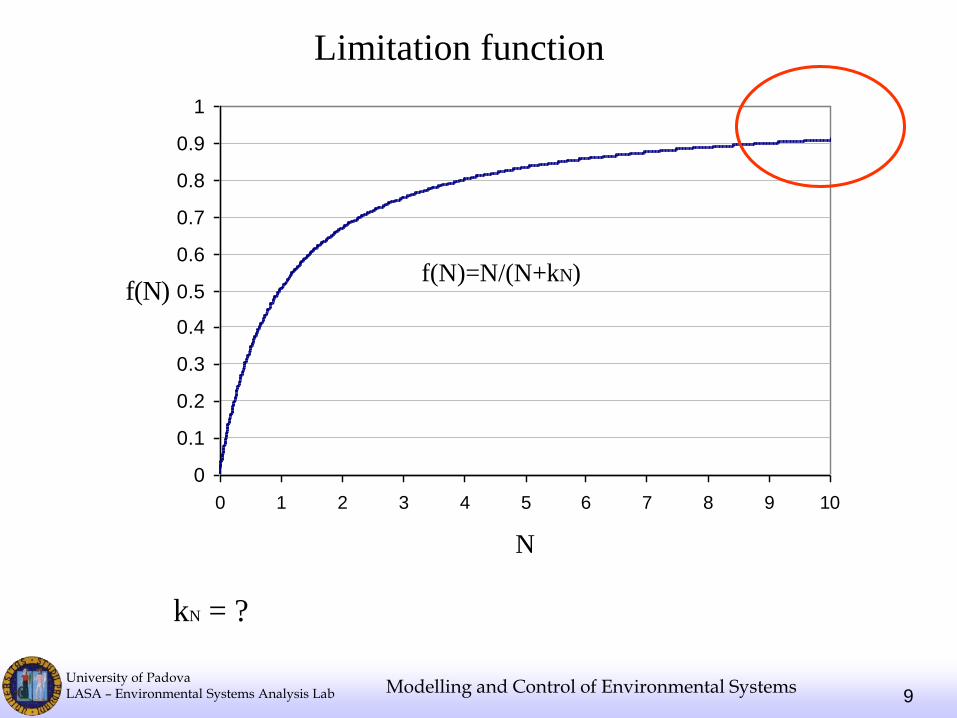
Limitation function
0
0.1
0.2
0.3
0.4
0.5
0.6
0.7
0.8
0.9
1
0 1 2 3 4 5 6 7 8 9 10
N
f(N)f(N)=N/(N+kN)
kN=??
kN = ?

University of Padova LASA – Environmental Systems Analysis Lab Modelling and Control of Environmental Systems
10
Growth dynamics
• Uptake (influenced by the
external concentration and by
the internal concentration of
the nutrient in the cell)
• Growth (depends only on
internal quota)
A two-step process
Ck
C
qqCqf
C
minmax
max),(
minmax
min
min
min
min
qqqf
q
qqqf
qqk
qqqf
Michaelis
Menten !
linear
As above with
k=qmin

University of Padova LASA – Environmental Systems Analysis Lab Modelling and Control of Environmental Systems
11
A two-step process

University of Padova LASA – Environmental Systems Analysis Lab Modelling and Control of Environmental Systems
12
Nutrient bioavailability
• Nitrogen:
– Organic:
• Dissolved
• Particulate
– Inorganic:
• Ammonia-Ammonium
• Nitrite
• Nitrate
• Phosphorus:
– Organic:
• Dissolved
• Particulate
– Inorganic:
• Orthophosphate
• Polyphosphate
• Colloidal
University of Padova LASA – Environmental Systems Analysis Lab Modelling and Control of Environmental Systems
13
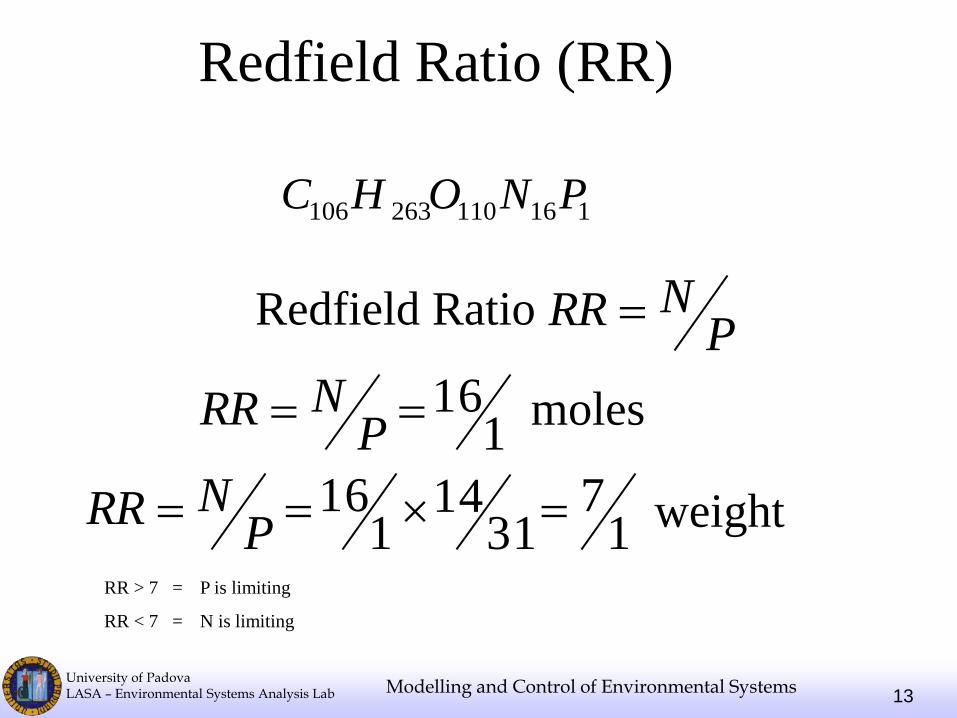
Redfield Ratio (RR)
116110263106 PNOHC
RR > 7 = P is limiting
RR < 7 = N is limiting
pesoin 1
731
141
16
moliin 1
16
Redfield di Rapporto
PNRR
PNRR
PNRRRedfield Ratio
moles
weight

University of Padova LASA – Environmental Systems Analysis Lab Modelling and Control of Environmental Systems
14
Redfield Ratio
116110263106 PNOHC
RR = N : P = 7
Often calculated using TN / TP, however:
• not all forms are bioavailable
• two-step dynamics
• even if concentration in water is low, uptake could be balanced by
other processes (e.g. flux from sediments)
• the limiting nutrient could be harder to reduce than others (e.g. P in
lakes)

University of Padova LASA – Environmental Systems Analysis Lab Modelling and Control of Environmental Systems
15
Platt Index
• absolute • relative
P
NL
PP
NN
l
where:
; PfNfK ; NKN
NNf
PKP
PPf

University of Padova LASA – Environmental Systems Analysis Lab Modelling and Control of Environmental Systems
16
Limitation due to other nutrients
• Silicon
• Oligoelements (Fe)
• Carbon (rarely limiting)

University of Padova LASA – Environmental Systems Analysis Lab Modelling and Control of Environmental Systems
17
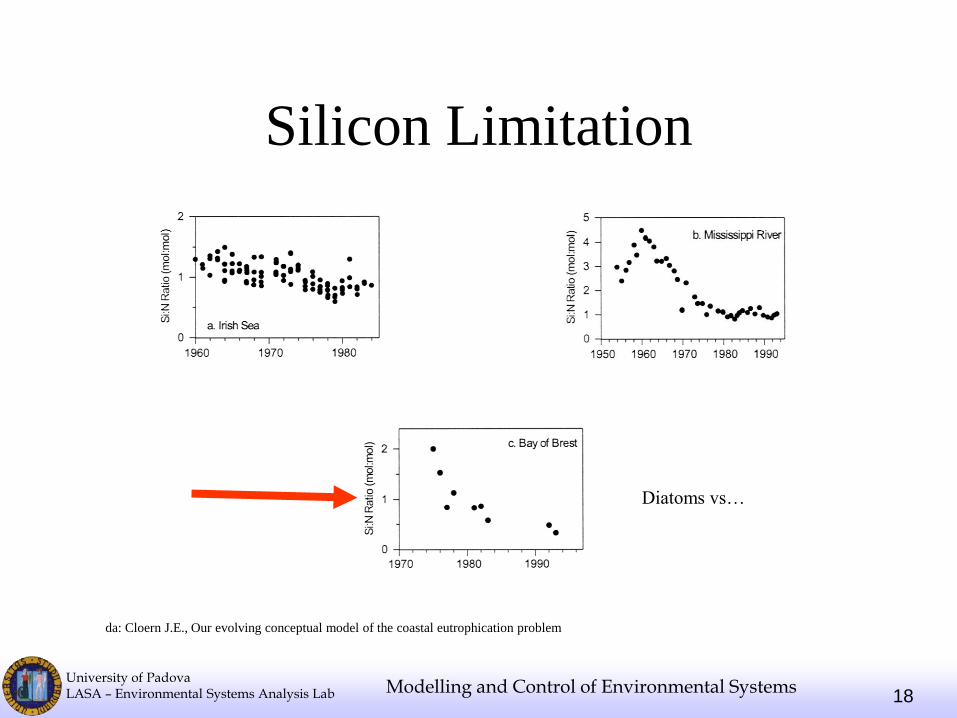
Silicon Limitation
University of Padova LASA – Environmental Systems Analysis Lab Modelling and Control of Environmental Systems
18
Silicon Limitation
da: Cloern J.E., Our evolving conceptual model of the coastal eutrophication problem
Diatoms vs…

University of Padova LASA – Environmental Systems Analysis Lab Modelling and Control of Environmental Systems
19
Co-limitation
0
0,05
0,1
0,15
0,2
0,25
+ C + P + N + TN + ALL -0,2
0
0,2
0,4
0,6
0,8
1
1,2
+ C + P + N + TN + ALL
0
0,1
0,2
0,3
0,4
0,5
0,6
0,7
0,8
0,9
+ C + P + N + TN + ALL
0
0,1
0,2
0,3
0,4
0,5
0,6
0,7
0,8
0,9
1
+ C + P + N + TN + ALL
da: Strener R.W & Gorver J.P., Algal growth in warm temperate reservoirs: Kinetic examination of Nitrogen, Temperature, Light and other nutrients
Chlorophyll growth rates
+C +P +N +TN +all +C +P +N +TN +all
+C +P +N +TN +all +C +P +N +TN +all

University of Padova LASA – Environmental Systems Analysis Lab Modelling and Control of Environmental Systems
20
Biological processes – grazing
2020 T
np
T
ref zmmTgG
ZATfTCG greff
ZTfTCG grefg
GAsmesrdt
dA
j
iji GG
Copyright © 2008 Field Studies Council
http://www.theseashore.org.uk/theseashore/SpeciesPages/Pla
nkton/Copepod.JPG.html

University of Padova LASA – Environmental Systems Analysis Lab Modelling and Control of Environmental Systems
21
Biological processes
Zooplankton Growth
GZmexrgdt
dZ
where Z: weight zoopl concentration [mgX/l]
g: growth rate [1/d]
r: respiration rate [1/d]
ex: excretion rate [1/d]
m: non-predatory mortality rate [1/d]
G: predation mortality [mgX/l/d]
No settling

University of Padova LASA – Environmental Systems Analysis Lab Modelling and Control of Environmental Systems
22
Phosphorus Cycle
• Key element for life:
– one of the 5 most important elements found in living organisms (60% of bones as calcium phosphate, also found in soft tissues)
– energetic metabolism: ADP – ATP
– found in DNA, RNA, phospholipids, etc.
• Agriculture (fertilizers) and industrial processes (e.g. detergents, medicines)

University of Padova LASA – Environmental Systems Analysis Lab Modelling and Control of Environmental Systems
23
Mozetic et al. (2010)
Decreasing P load and aquatic ecosystem productivity
0
1000000
2000000
3000000
4000000
5000000
6000000
0
1000
2000
3000
4000
5000
6000
7000
19
68
19
71
19
74
19
77
19
80
19
83
19
86
19
89
19
92
19
95
Sard
ine
, kg
PO
4, t
Carico di PO4 scaricato dal fiume Po (t/y)
Sardine (kg sbarcato, lag di 1 anno)
University of Padova LASA – Environmental Systems Analysis Lab Modelling and Control of Environmental Systems
24
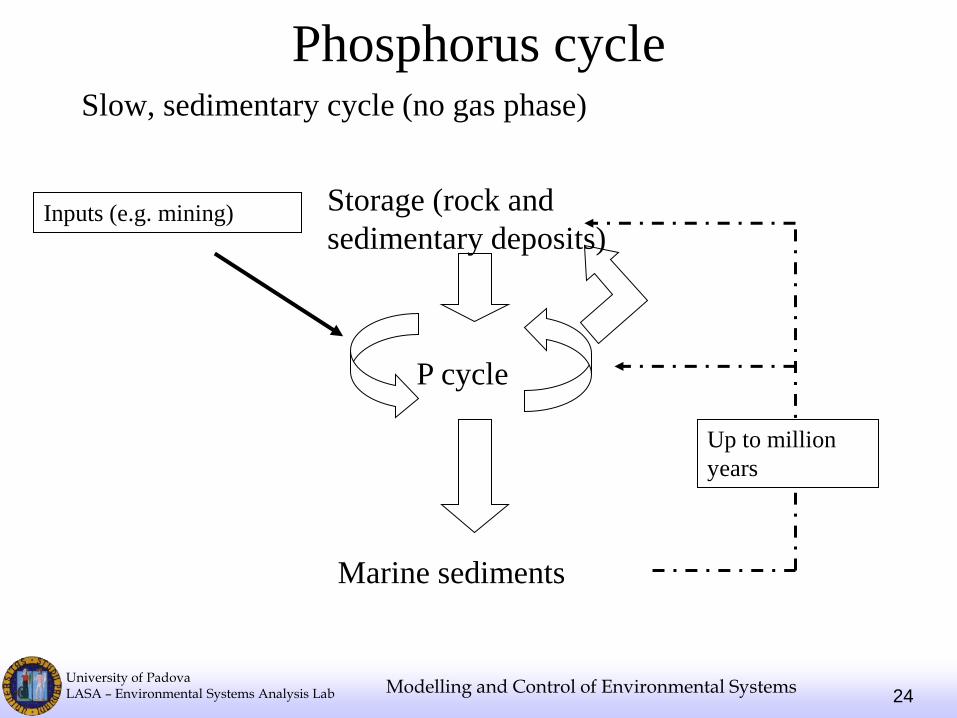
Phosphorus cycle Slow, sedimentary cycle (no gas phase)
Marine sediments
P cycle
Storage (rock and
sedimentary deposits)
Up to million
years
Inputs (e.g. mining)

University of Padova LASA – Environmental Systems Analysis Lab Modelling and Control of Environmental Systems
25
Phoshorus storages 0,1% Earth’s crust
Mainly
• Ca5F(PO4)3 (95%)
• Ca3(PO4)2
in magmatic and metamorphic rocks, sedimentary deposits (marine phosphorite beds 80% of potential P), guano from birds (most ancient fertilizer source)

University of Padova LASA – Environmental Systems Analysis Lab Modelling and Control of Environmental Systems
26
Phosphorus in the environment Inorganic P: nearly always as phosphate
Orthophosphate (PO43- ion) is the main bioavailable form
pH play an important role:
Image from Holtan, H., Kamp-Nielsen, L., Stuanes, A.O., 1988. Phosphorus in
soli, water and sediment: an overview. Hydrobiologia 170: 19-34
{ Reduced forms, the most common in the environment
HPO42- in cultivated soil
(more basic)

University of Padova LASA – Environmental Systems Analysis Lab Modelling and Control of Environmental Systems
27
Phosphorus in the environment
Organic P (hydrolyzed into inorganic P):
• Dissolved (mainly polyphosphate with low molecular
weight)
• Particulate (mainly polyphosphate with high molecular
weight adsorbed to organic sediments, organic acids,
esters)
• Colloidal (dispersed phase with dim. 10-6 – 10-9 m
throughout a continuous phase): bioavailable (but
secondarily)

University of Padova LASA – Environmental Systems Analysis Lab Modelling and Control of Environmental Systems
28
Adsorbed P
Accumulated in the lithosphere
Adsorption:
• physical (reversible)
• chemical (irreversible or partially irrev.)
– Complexes with con metal cations (Ca, Fe, Al) are formed
– Substitution of water molecules or silicate ions (with high conc. of
phosphates) in clays. Enhanced by low pH.
University of Padova LASA – Environmental Systems Analysis Lab Modelling and Control of Environmental Systems
29
Adsorbed P
P has a strong tendency to adsorbe →
• Land-sea transport through erosion (solid transport), no
transport of dissolved forms (e.g. leaching)
• Particulate P not much bioavailable = limiting despite
abundance, sometimes more limiting than N even if
organisms need less P than N

University of Padova LASA – Environmental Systems Analysis Lab Modelling and Control of Environmental Systems
30
Adsorbed P
Deposition-release in water environments. Factors influencing adsorption:
• Granulometry (ads. increase with fine fraction)
• Organic substrate: not a general rule (can ads. phosphates, or block adsorption sites on inorganic particles)
• Redox potential:
– > 200 mV → Fe3+ and insoluble hydroxides with phosphates
– In reducing conditions, Fe2+ and P becomes soluble
Anoxia can lead to P release from sediments (Baltic)

University of Padova LASA – Environmental Systems Analysis Lab Modelling and Control of Environmental Systems
31
Adsorbed P
Factors influencing adsorption:
• Temperature: influences bacterial processes which hydrolyze
organic P.
• pH: no general rule
University of Padova LASA – Environmental Systems Analysis Lab Modelling and Control of Environmental Systems
32
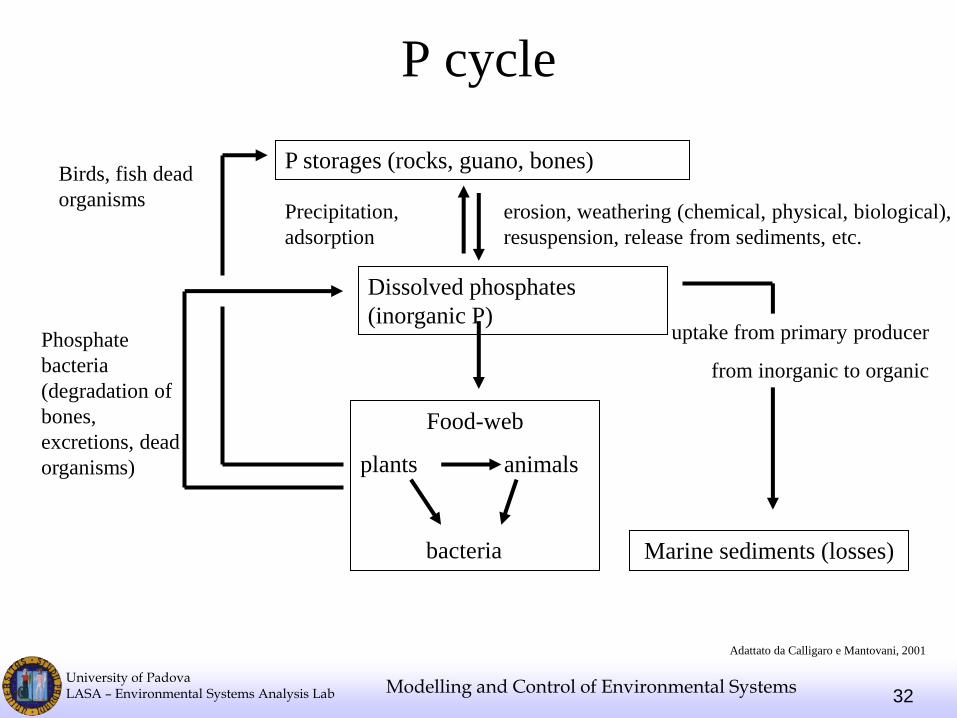
P cycle
Food-web
plants animals
bacteria
P storages (rocks, guano, bones)
erosion, weathering (chemical, physical, biological),
resuspension, release from sediments, etc.
Birds, fish dead
organisms
Phosphate
bacteria
(degradation of
bones,
excretions, dead
organisms)
uptake from primary producer
from inorganic to organic
Marine sediments (losses)
Precipitation,
adsorption
Adattato da Calligaro e Mantovani, 2001
Dissolved phosphates
(inorganic P)

University of Padova LASA – Environmental Systems Analysis Lab Modelling and Control of Environmental Systems
33
Surface water bodies: sources of P
loads
• Uncultivated soils
• Precipitations
• Wastewaters (1.5 gP/adult/day, detergents),
also industrial discharges, livestock
activities, etc.
• Diffuse sources (e.g., agricultural fields)

University of Padova LASA – Environmental Systems Analysis Lab Modelling and Control of Environmental Systems
34
Internal loads: transport from sediments to
epilimnion (lakes)
Influenced by:
• Diffusion of P into water column (pH, redox, etc.)
• Turbulence (direct transport or re-create gradients)
• Convection (anaerobiosis: CH4, N2, CO2 bubbles)
• Bioturbation
• Low saturation capacity for the sediments
• Shallow depths

University of Padova LASA – Environmental Systems Analysis Lab Modelling and Control of Environmental Systems
35
Dynamics of biogeochemical cycles
Biogeochemical cycles for different nutrients
are characterized by different dynamics and
time-scales (RR correction)
15 40 dtdt PN

University of Padova LASA – Environmental Systems Analysis Lab
For the modelling exercise: the k-C* model of
nutrient abatement in wetlands
0%
10%
20%
30%
40%
50%
60%
70%
80%
0 5 10 15 20 25 30
tempo di ritenzione (giorni)
eff
icie
nza d
i rim
ozio
ne
T=20°C
T=15°C
T=10°C
T=5°C
q
k
CC
CC
i
o
*
*ln
sA
365
Plug flow, 1st order; can be used for all pollutants: N, P, SS, bacteria, etc.
As= wetland surface, m2;
Ci = pollutant concentration in the inflow (mg/l);
Co = concentration in the outflow (mg/l);
C* = background concentration (mg/l);
k = first order rate (m/y); can depend on temperature
Q = average flow through the system (m3/d);
q = specific hydraulic load (m/y).
Rem
ov
al e
ffic
ien
cy
Retention time (days)
University of Padova LASA – Environmental Systems Analysis Lab
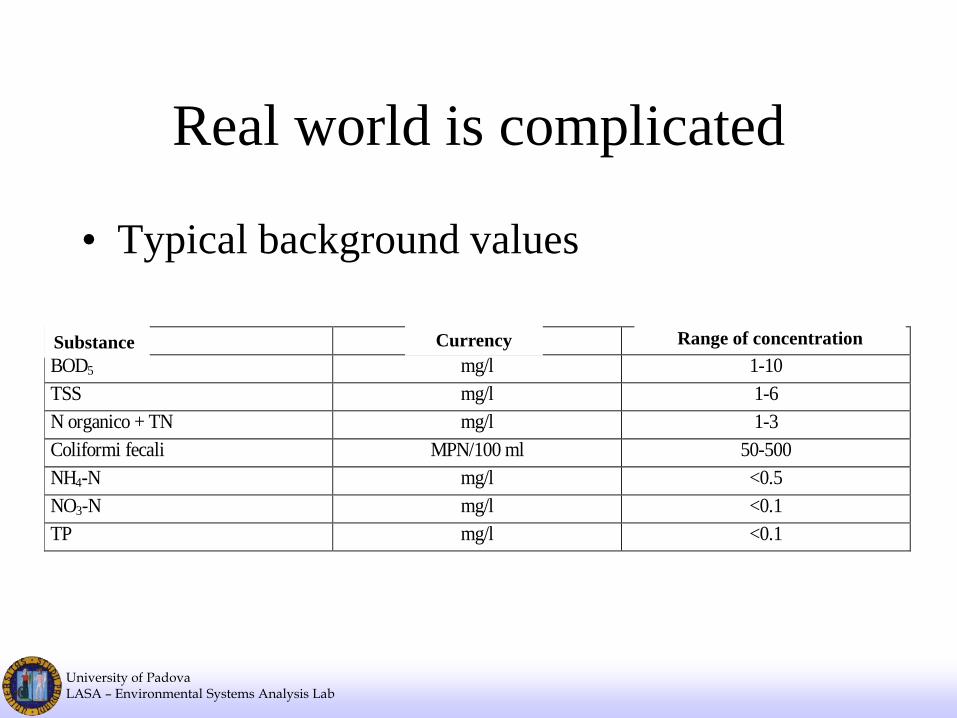
Real world is complicated
• Typical background values
Costituente Unità di misura Intervallo di concentrazioni
BOD5 mg/l 1-10
TSS mg/l 1-6
N organico + TN mg/l 1-3
Coliformi fecali MPN/100 ml 50-500
NH4-N mg/l <0.5
NO3-N mg/l <0.1
TP mg/l <0.1
Substance Currency Range of concentration
University of Padova LASA – Environmental Systems Analysis Lab
Books on wetland models
• Kadlec & Knight, 1996. Treatment wetlands. CRC
press (Second Edition also available by Kadlec &
Wallace)
• ANPA, 2002 Linee guida per la ricostruzione di
aree umide per il trattamento di acque superficiali http://www.apat.gov.it/site/it-
IT/APAT/Pubblicazioni/Manuali_e_linee_guida/Documento/manuali_lineeguida_2002_9.html