BIOLOGICAL EVALUATION OF THE PROTOTYPE GATEWELL LIFT-TANK …
52
Transcript of BIOLOGICAL EVALUATION OF THE PROTOTYPE GATEWELL LIFT-TANK …


BIOLOGICAL EVALUATION OF THE PROTOTYPE GATEWELL LIFT-TANK SYSTEM AT LOWER GRANITE DAM, 1994
by
George A. Swan M. Brad Eppard Paul A. Ocker
Robert N. Iwamoto and
Benjamin P. Sandford
Annual Report of Research
Funded by
U.S. Army Corps of Engineers Walla Walla District
Delivery Order E86940120
and
Coastal·Zone and Estuarine Studies Division Northwest Fisheries Science Center National Marine Fisheries Service
National Oceanic and Atmospheric Administration 2725 Montlake Boulevard East
Seattle, Washington 98112-2097
December 1994

:.-, .. _ e
e

CONTENTS
Page
INTRO DUCT I ON . . . . . . . . . . . . . . . . . . . . .• . . . . . . . . . . . . . . . . . . . . . . . . . . . . 1
MATERIALS AND METHODS........................................ 1
Location. . . . . . . . . . . . . . . . . . . . . . . . . . . . . . . . . . . . . . . . . . . . . . . . 9
Test Fish. . . . . . . . . . . . . . . . . . . . . . . . . . . . . . . . . . . . . . . . . . . . . . . 11
Test Sequence. . . . . . . . . . . . . . . . . . . . . . . . . . . . . . . . . . . . . . . . . . . 11
Phase I. On-Deck Testing. . . . . . . . . . . . . . . . . . . . . . . . . . . 13
Phase II. Gatewell Testing with Lift Tank Fully Submerged. . . . . . . . . . . . . . . . . . . . . . . . . . 14
Phase III. Gatewell Testing with Lift Tank above Water. . . . . . . . . . . . . . . . . . . . . . . . . . . . . 16
Test Schedule . . . . . . . . . . . . . . . . . . . . . . . . . . . . . . . . . . . . . . . . . . . 1 7
RESULTS .................................................... ·. . 18
Phase I. On-deck Testing ............................... 18
Phase II. Gatewell Testing with Lift Tank in Water {submerged 4. 9 m) . . . . . . . . . . . . . . . . . . . . . . . . . . . . 20
Phase III. Gatewell Testing with Lift Tank above Water ................................ ·. 2 2
DISCUSSION. . . . . . . . . . . . . . . . . . . . . . . . . . . . . . . . . . . . . . . . . . . . . . . . . . . 27
SUMMARY. . • • • . . • . . . . • • • • • • . . . • • • • . • • • • • • • • • • • • • • . . • . • • • • • • • • • . 2 8
RECOMMENDATIONS . . . . . . . . . . . . . . . . . . . . . . . . . . . . . . . . . . . . . . . . . . . . . . 2 9
ACKNOWLEDGEMENTS . . . . . . . . . . . . . . . . . . . . . . . . . . . . . . . . . . . . . . . . . . . . . 31
REFERENCES . . . . . . . . . . . . . . . . . . . . . . . . . . . . . . . . . . . . . . . . . . . . . . . . . . . 3 2
APPENDIX. . . . . . . . . . . . . . . . . . . . . . . . . . . . . . . . . . . . . . . . . . . . . . . . . . . . . 3 3


INTRODUCTION
A proposed drawdown of Lower Granite Reservoir (Fig. 1) would
reduce turbine intake gatewell water levels at the dam to an
extent that would prevent normal egress of migrant salmonid
smelts to the fingerling bypass collection gallery, as described
by Matthews et al. (1977) (COE 1994a) . This .could result in
large numbers of fish stranded in the gatewells (COE 1993) .
Because of this anticipated stranding, several options for
fish removal from gatewells were considered, including dip
baskets (Swan et al. 1979) , lift tanks, air-lift pumps, and screw
pumps-. After analysis of these options, lift tanks emerged as
the preferred choice (Fig. 2) .
Although similar to existing gatewell dip baskets, the lift
tanks differ in several significant ways, such as size; frequency
and duration of operation; and fish collection, transfer, and
delivery (Fig. 3) {COE 1994b}. Furthermore, unlike gatewell dip
baskets, the proposed lift-tank system had not been evaluated.
At the request of the U.S. Army Corps of Engineers (COE) , the
National Marine Fisheries Service (NMFS) conducted a study to
evaluate a prototype lift tank in 1994. Results of that study
are presented in this report.
MATE�IALS AND METHODS
The testing schedule was extremely compressed in order to
meet COE schedules necessary to develop an operational lift-tank
system for proposed reservoir drawdown tests {Table l}.

CANADA
·-r-·-· ,·-. -·-·-
j MONTANA
WASHINGTON Wanapum
0
OREGON
50 100 Km
. I
I ·,
(
9!''\ ..... ·,. "· ....
.....
·---- �----·-·-·-·-·-·-r-·-·-·-·-·---·�·-·-·-·-·-·-CALIFORNIA · NEVADA
Figure 1.--Location of Lower Granite Dam relative to other hydroelectric projects of the Snake and Columbia Rivers.
2

Figure
>.f?,�<..--;\f:fr£�{r-w.t,:,
.�r�
2.--Cross-section of a turbine Dam showing the lift tank the 1994 study and at the
3
Lift tank hoist tower
ishing position
ypass gallery
Proposed drawdown
lift tank fishing
position
Proposed drawdown
forebay level (El. 693')
Vertical barrier
screen
Turbine intake
intake at Lower in the bulkhead
Granite slot for
drawdown level. proposed

Lift tank
Figure 3.--Cross-section of lift tank releasing fish through the orifice into the fingerling bypass gallery at Lower Granite Dam for a proposed biological drawdown test.
4

"'
Table 1.--Schedule for the lift-tank biological evaluation at Lower Granite Dam, starting June 18, 1994.
Test Test Phase � Replicate Testing and Gatewell Activity
I 1 Tagged fish
2 1 & i Tagged fish; lift-tank test in
3 3 Tagged fish; lift-tank test in
4 4 Tagged fish; lift-tank test in
5 5 Tagged fish; lift-tank test in
6 Tagged fish
II 7 1 Tagged fish; Dip-basket test in Lift-tank .test in
8 2 Tagged fish; Dip-basket test in Lift-tank test in
9 3 Tagged fish; Dip-basket test in Lift-tank test in
10 4 Tagged fish; Dip-basket test in Lift-tank test in
III 11 1 Tagged fish; Dip-basket test in Lift-tank test in
12 2 Tagged fish; Dip-basket test in Lift-tank test in
13 3 Tagged fish; Dip-basket test in Lift-tank test in
14 4 Dip-basket test in Lift-tank test in
15 Gear clean-up, end of project
5
Slot
Slot
Slot
Slot
Slot Slot
Slot Slot
Slot Slot
Slot Slot
Slot Slot
Slot Slot
Slot Slot
Slot Slot
6A
6A
6A
6A
4B 6A
4B 6A
4B 6A
4B 6A
4B 6A
4B 6A
4B 6A
4B 6A

The 1994 evaluation was conducted with steelhead (Oncorhynchus
mykiss) only. Complete testing of the lift-tank system and
evaluation of its effects on yearling chinook salmon {O.
tshawytscha) requires additi9nal studies.
The lift tank consisted of a steel box measuring 7-m long,
1.1-m wide, and 1.8-m deep and held about 11.7 kL of water
{Fig. 4). The floor {gate) of the tank was hinged. The gate was
opened when the tank was lowered into the gatewell so that fish
could swim into the tank. To remove fish from the gatewell, the
gate was closed, and the tank was then lifted with fish and water
to the bypass orifice. The inner surface of the tank floor was
designed to drain water from each end of the tank to the orifice
connection {Fig. 5). The support structure for the lift tank was
bolted and grouted to the inta�e deck. The lift tank was
designed to be fully automated and during a drawdown scenario
would operate 24 h/day with each cycle taking about 1 h.
The lift tank was equipped with a debris screen system to
remove large debris from the gatewell when the lift tank was
raised. It was mounted inside of the tank and consisted of an
array of parallel cables spaced at 15.2 cm intervals, each
enclosed in a vertical tube on the downstream side of the tank.
The cables were attached to a square steel beam positioned
length-wise at the top of the tank. Prior to raising the lift
6
1(/IJ,,
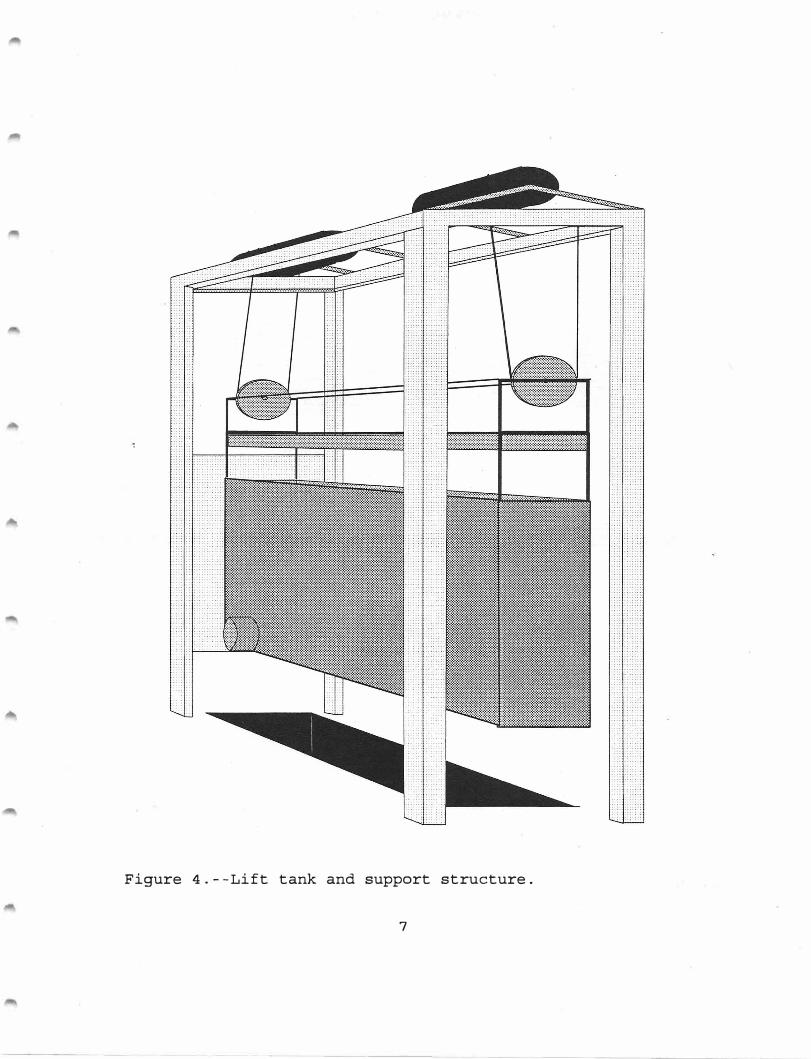
Figure 4.--Lift tank and support structure.
7

3 Percent Slope
Figure 5.--Plan and slope to
side views of the orifice.
8
Orifice
I
o__ 1 o Percent Slope
lift-tank floor (gate) showing

tank from the fishing position, the steel beam was pulled across
the top of the tank by a chain and sprocket system powered by a
pneumatic motor. The pneumatic motor failed to operate
throughout the evaluation. Therefore, the debris screen system
was not tested.
A formal consultation, as required by Section 7 of the
Endangered Species Act, was requested and approved for the
-. incidental take of wi°ld and listed hatchery yearling chinook
salmon, subyearling fall chinook salmon, and sockeye salmon (0.
nerka) . Incidental catches of these species were unavoidable as
a result of the lift-tank evaluation.
Location
The lift-tank tests were conducted in bulkhead Slot 6A
equipped with a standard submersible traveling screen (STS) and a
blocked vertical barrier screen (BVBS) (Fig. 6) . The BVBS
consisted of the modified balanced-flow vertical barrier screen
(MBFVBS) removed from bulkhead slot 4A and further modified to
consist of four upper panels of balanced-flow vertical barrier
screen and six lower panels that were blocked by covering them
with plywood. The BVBS was installed in bulkhead slot 6A to
simulate estimated gatewell flows at a forebay. elevation of 692
ft during the proposed drawdown. These estimates were based upon
hydraulic model studies conducted at the COE's Waterways
Experiment Station at Vicksburg, Mississippi.
9

MBFVBS BVBS
II Screened Area II Solid Area
Figure 6.-- View of two vertical barrier screen configurations at Lower Granite Dam. The modified balanced flow vertical barrier screen (MBFVBS) formerly located in bulkhead slot 4A was further modified as a blocked vertical barrier screen (BVBS) and installed in bulkhead slot·6A.
10
..

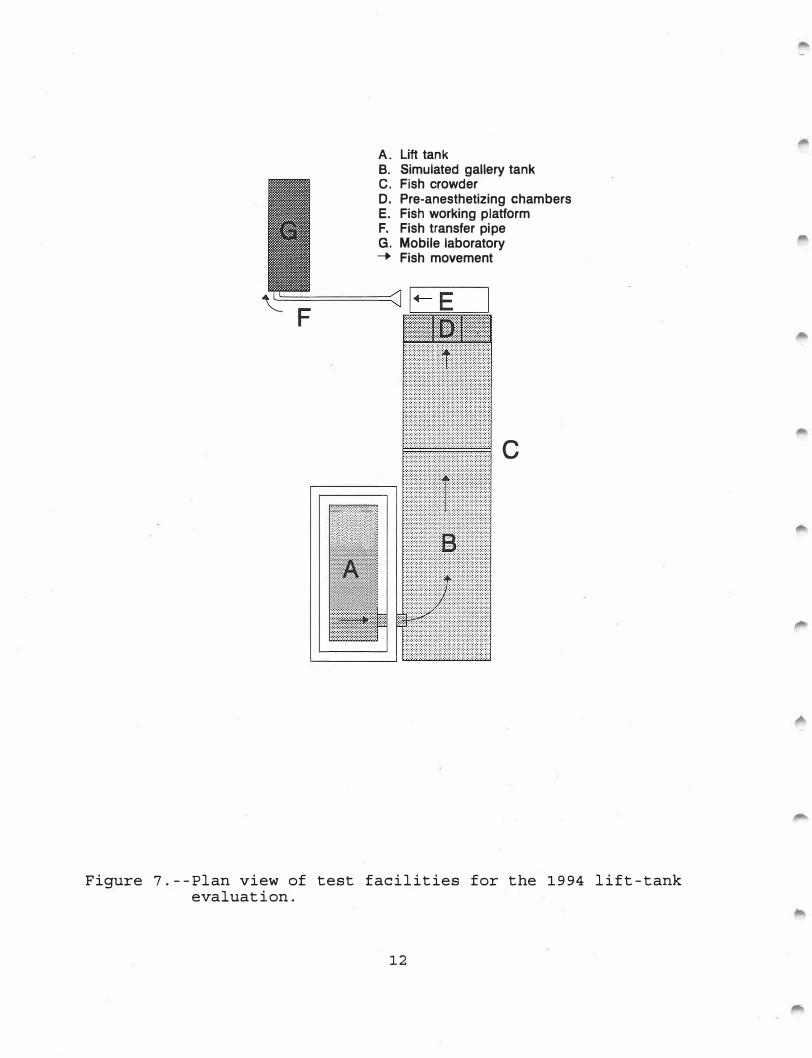
A standard dip basket was used to remove control fish from
Slot 4B {with a MBFVBS and a standard STS) to compare descaling
incidence and collection efficiency with the test slot. The
configuration of test equipment is shown in Figure 7.
Test Fish
River-run hatchery steelhead were collected at the juvenile
collection facility at Lower Granite Dam. Fish for different
treatment and control groups were marked with small, colored
Floy1 T-bar tags. Descaling was assessed according to Fish
Transport Oversight Team guidelines {Ceballos et al. 1992) .
Fish naturally recruited into the gatewell during test periods
were also counted and examined for descaling and fish condition.
Test Sequence
The evaluation of the gatewell lift-tank system was conducted
in three phas�s. Phase I addressed operating procedures for the
lift tank, evaluated effects of confinement in and exit from the
lift tank, and established descaling and fish condition indices.
Phase II assessed collection efficiency and effectiveness of the
water-draining process {dewatering) for the lift tank and
provided further information on descaling and fish condition.
Phase III assessed changes in fish behavior and location in the
gatewell as a result of lift-tank position �n the gatewell, and
1 Reference to trade names does not imply endorsement by the National Marine Fisheries Service, NOAA.
11
.· ............. .. . . ·.·.·.-.•.•.-:- ··.·.
lilililililjljljljljliljljjiJ:J:!l!t
A. Lift tank B. Simulated gallery tank C. Fish crowder D. Pre-anesthetizing chambers E. Fish working platform F. Fish transfer pipe G. Mobile laboratory -. Fish movement
C
Figure 7.--Plan view of test facilities for the 1994 lift-tank evaluation.
12

evaluated collection efficiency and descaling after complete
operating cycles of the lift tank.
During testing, Turbines 4 and 6 were operated at 135 MW
which corresponded to turbine intake flows of a�proximately
18, 450 cfs per unit. Gatewell orifices from Slots 4B and 6A were
closed to prevent escape of marked test fish. Above-water
procedures and fish behavior and movement were video taped
te;, throughout the evaluation.
Phase I. On-Deck Testing
Phase I testing was conducted on the intake deck and examined
the combined effects of containment in and exit from the lift
tank. Prior to testing, treatment and control fish were examined
for descaling and differentially marked. Descaled fish were not
� used in the experiment. Tagged treatment fish were placed into
the lift tank and allowed to pass, via an orifice coupling, into
a tank that simulated.the bypass gallery {gallery tank) . Control
fish were released directly into the gallery tank. All fish in'
the gallery tank were crowded to a pre-anesthetic chamber and
anesthetized. Fish were then counted and examined to determine
descaling, injury, and mortality rates. To facilitate fish
handling, examinations were conducted in a NMFS mobile laboratory
parked on the intake deck. Condition of fish released from the
• lift tank was compared to control fish released directly into the
gallery tank.
For calculation of sample sizes, we assumed background and
additional treatment descaling incidences of 1% each. We
13

determined that approximately 2, 400 steelhead were required for
testing, and planned on using 400 fish (200 test and 200 control)
for each of 6 tests. Treatment and control descaling incidence
were compared by paired t-tests at the a = 0.05 significance
level.
We videotaped fish exiting the tank via the orifice opening
to determine any unusual fish behavior and problems with tank
design. The bottom gate of the lift tank was designed to empty
all fish from the tank during the water draining process.
However, prior experience with similar designs and fish behavior
suggested that additional flush water might be necessary, and in
certain cases, still might not be adequate in removing all fish.
Phase II. Gatewell Testing with Lift. Tank Fully Submerged
The objectives of Phase II testing were to evaluate
1) collection efficiency (i.e., the percentage of available fish
collected with each lift-tank immersion in the gatewell) ; 2) fish
escapement, either by passing between the lift-tank sides and
gatewell sides or by remaining below the lift tank; and 3) the
effect of lift-tank operation on fish condition.
Testing began with the lift tank lowered to maximum fishing
depth where the upper and lower ends of the lift tank were
approximately 1.4-m and 4.9-m, respectively, below the water
surface in the gatewell. Traditionally, the dip basket has been
fished at a depth of about 24.4 m.
Marked fish were transferred into the gatewell via a 7.6-cm
diameter hose from the intake deck and released just below the
14

water surface in the gatewell. After allowing 20 minutes for
fish dispersion and acclimation, the bottom gate of the lift tank
was closed. The lift tank was then raised to the deck, the
orifice fittings coupled, and fish were released through the
orifice into the simulated gallery tank (Fig. 4) . This process
was repeated two more times to recover fish (with the exception
that no additional fish were released) .
Once in the gallery tank, fish were handled and inventoried
as in Phase I. Descaling in Phase II evaluations could have
resulted from operation of the lift tank in the gatewell, exit of
fish from the lift tank to the gallery tank, or post-treatment
fish handling. Causes of descaling were partitioned by releasing
marked control fish in the simulated gallery tank using the
procedures previously described for Phase I. The net result
indicated that descaling was caused by lift-tank operation
including exit of fish from the lift tank.
'""" Condition of fish collected with the lift tank was also
compared with that of fish collected with a standard dip basket.
For every lift-tank test, marked fish were also released into
Slot 4B, and after 20 minutes were collected using a standard
gatewell dip basket.
We assumed that Phase I descaling would.be 2%, that
standard dip basket descaling would be 2%, and that. the lift-tank
collection operation would cause an additional 1% descaling. As
a result, we determined that 4 replicates of. approximately 1, 000
fish each were necessary for the lift-tank and dip-basket groups.
15

Control replicates were released into the simulated gallery
tank as in Phase I. Sample sizes were adjusted once actual tests
were conducted and variability of treatment effects was
determined. The comparisons of between treatment and control
descaling and between lift tank and standard dip basket were made
by two-sample t-tests at the a = 0.05 significance level.
Phase XIX. Gatewell Testing with Lift Tank above Water
Phase III evaluated the proposed operational cycle for the
lift-tank system. It provided information on 1) the effect of . .
lowering the lift tank on fish in the gatewell, 2) lift-tank
collection efficiency, and 3) fish condition after exposure to
the entire operational cycle.
Phase III testing began with the opened lift tank suspended
above the water surface in the gatewell. Marked fish were
released below the water surface as in Phase II. After a period
of approximately 20 minutes to allow fish to disperse and
acclimate, the lift tank was lowered to the same depth as in
Phase II and closed. The lift tank was then raised to the deck,
the orifice fittings coupled, and fish released into the
simulated gallery tank as in Phase II. This process was repeated
2 more times with the lift tank remaining at maximum fishing
depth with the bottom gate open for 20 minutes prior to being
closed and raised.
Initially, the standard gatewell dip basket was fished in
Slot 4B using similar procedures and at the same depth as the
lift tank. This proved ineffective. Consequently, the dip
16
.fl"'

basket was lowered to 15.2 m after the first two replicates in
Phase II, and during Phase III, it was lowered to 24.4 m, closer
to the standard depth for dip baskets.
During Phases II and III� the overhead orifice light located
on top of the lift tank was turned on during Replicates 1 and 3
and off during Replicates 2 and 4 to determine if the light
provided any collection benefit.
Test Schedule
The original testing schedule (Table 1) was constrained by
the late delivery and release of the prototype lift tank, delay
in issuance of the Section 7 formal consultation, and the
relatively narrow time frame that inriver hatchery steelhead were
available. The emergency spill program contributed to limited
collection of juvenile hatchery steelhead.
17

RESULTS
The goal of tagging 18, 400 juvenile hatchery steelhead was
not met due to the low numbers of juvenile salmonids migrating
through Lower Granite Dam. A total of 5, 214 hatchery steelhead
were tagged and released for testing during the three phases of
the lift-tank evaluation.
Phase I. On-deck Testing
We reduced the size of test groups to about 200 hatchery
steelhead {-100 fish each for treatment and control groups} for
each of the five replicates in Phase I testing. Average
descaling was 1.3% for the treatment fish and 0.6% for the
controls (Table 2}.
The moderate slope of the floor in the lift tank failed to
drain water efficiently. The majority of water did not drain
from the lift tank until approximately 3 .5 minutes after the
orifice slide gate was opened. Review of video tapes indicated
that most fish did not begin exiting the lift tank until the
water level had decrease� to the top of the orifice. At that
time, the low water elevation in the lift tank produced a slower
flow of water. As a result, fish resisted exiting and remained
in the lift tank. About 5 to 10 fish remained in the tank after
water had been .completely removed, 5 to 5.5 minutes after the
orifice slide gate had opened. These last fish either had to be
removed by hand or forced to exit with use of additional water
from a hose. However, the added water was not effective, and
18

Table 2.--Percent descaling of hatchery steelhead during Phase of the lift-tank biological evaluation at Lower Granite Dam, 1994.
Treatment Control Number Number Percent Number Number Percent
Replicate sampled descaled descaled sampled descaled descaled
� 1 99 3 3.0 99 0 0.0
2 10 1 0 0.0 67 0 0.0
3 113 3 2 . 7 114 9 7. 91
4 118 3 2.5 9 7 3 3.1
5 117 0 0.0 119 0 0.0
6 138 0 0.0 157 0 0.0
Total 6 8 6 9 539 3
Average 1.3 0.6
1 Handling problem, control data not used for this replicate.
19

instead compounded the removal problem by attracting fish away
from the orifice.
Phase II. Gatewell Testing with Lift Tank in Water {submerged 4. 9 _m)
During Phase II testing, the majority of marked fish were
· -recovered in the first dip of the lift tank {Table 3) . Over the
4 replicates, an average of 83.7% of the tagged fish were
recovered in the first dip, 9.5% in the second dip, and 1.4% in
the third dip for an overall recovery rate of 94.5% for 3 dips.
In c_omparison, the standard dip basket averaged 96. 0%
collection efficiency after 4 dips. Efficiency was affected by /
the depth to which the dip basket was fished. In the first
2 replicates, the dip basket was fished at approximately the same
depth as the lift tank {bottom at approximately 4.9 m) .
Percent recovery after 3 dips was unusually low, and a fourth dip
to 15.2 m was required. Beginning with the third replicate, the
dip basket was fished at 15.2 m, closer to the usual depth of
24.4 to 27.4 m. This improved fish collection, eliminating the
need for the fourth dip. Collection efficiency of the dip basket
totaled 97.8% after three dips in Replicates 3 and 4.
About 16.3% of the tagged fish evaded collection by the ·1ift
tank during the first dip. We were unable to determine if fish
evaded. coll.ection by passing between the lift-tank and the
gatewell walls or by swimming deeper than the lift-tank fishing
depth before the bottom gate was closed.
20

)
N _..
} ) ) ) ) )
Table 3.--Collection efficiency and percent descaling of hatchery steelhead during Phase II of the lift-tank biological evaluation at Lower Granite Dam, 1994.
Number Replicate1 released
1 168 2 299 3 115 4 295
Total 877 Average
Number Replicate released
1 97 2 299 3 115 4 298
Total 809 Average
Lift-tank efficiency in Slot 6A (%) First Second Third lift lift lift Total
75.6 15.5 0.6 91.7 88.0 5.0 1. 7 94.6 86.1 4.3 1.7 92.2 83.1 12.5 1.4 96.9
83.7 9.5 1.4 94.5
Dip-basket efficiency in Slot 4B (%) First Second Third Fourth fil!L fil!L fil!L dip2 Total
33.0 0.0 2.1 61. 9 96.9 7 6.9 0.7 1. 3 16.7 95.7 93.9 1. 7 0.0 95.7 96.6 2.0 0.0 98.7
81.3 0.5 0.7 27.8 96.0
Control Percent Number Percent descaled sampled descaled
1.3 1.1 99 1.0 0.0 1.7 97 0.0
196 0.8 0.5
Percent de scaling
0.0 0.0 0.9 0.7
0.4
1 The overhead orifice light located on top of the lift tank was turned on during Replicates 1 and 3 and off during Replicates 2 and 4.
2 The dip basket was originally fished at the same depth as the lift tank (about 4.9 m} . At that depth, a fourth dip was required to recover fish. After Replicate 2, the dip basket was fished closer to the traditional depth at about 15.2 m.

On the average, descaling during Phase II testing was 0.8%
for the treatment fish and was 0.5% for the controls. Nominal
descaling (treatment effect only) was 0.3%. Descaling for the
dip basket treatment fish was 0.4%.
During Phase II testing, 42 unmarked fish were collected by
the lift tank in Slot 6A, and SO were collected by the dip basket
in Slot 4B (Table 4) . Only 3 unmarked juvenile chinook salmon
were collected with the lift tank compared to 14 collected with
the dip basket, possibly due to the difference in fishing depths.
Several of the juvenile chinook salmon collected by the lift tank
were descaled. However, numbers of these fish collected for each
replicate were small, and we were unable to determine the
cause (s) of the descaling.
Phase III. Gatewell Testing with Lift Tank above Water
Lowering the lift tank into the gatewell while tagged
hatchery steelhead were in the gatewell seemed to have little
effect on collection. During the first dip of the lift tank,
84.7% of the tagged fish were recaptured. Total collection by
the lift tank averaged 95.0% (Table 5) .
Recovery percentages for the dip basket were higher for
Replicates 2, 3, and 4 due to the change in fishing depths. With
the exception of the first replicate, the standard dip basket
recovered an average of 97.3% of the tagged fish in the first
dip. Overall collection efficiency for the dip basket throughout
Phase III averaged 98.0%.
2 2
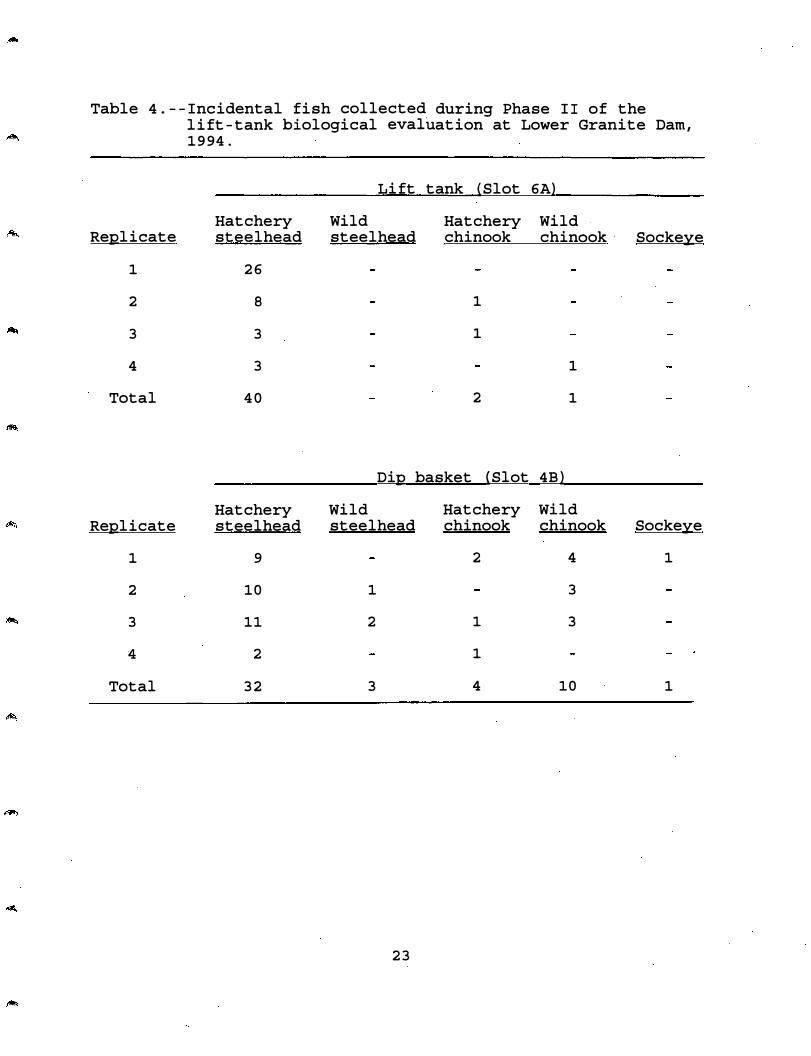
Table 4.--Incidental fish collected during Phase II of the lift-tank biological evaluation at Lower Granite Dam, 1994.
Hatchery Replicate steelhead
1 26
2 8
3 3
4 3
Total 40
Hatchery Replicate steelhead
1 9
2 10
3 11
4 2
Total 32
Lift tank {Slot 6A)
Wild steelhead
Hatchery Wild chinook chinook · Sockeye
1
1
2
1
1
Dip basket {Slot 4B)
Wild Hatchery Wild steelhead chinook chinook Sockeye
2 4 1
1 3
2 1 3
1
3 4 10 1
23

J
Table 5.--Collection efficiency and percent descaling of hatchery steelhead during Phase III of the lift-tank biological evaluation at Lower Granite pam,· 1994.
Lift-tank efficiency in Slot 6A (%) Number First Second Third
Replicate1 released lift lift lift Total
1
2
3
4
Total
Average
129
161
287
245
822
80.6
85.7
86.8
83.7
84.7
9.3
5.6
6.6
8.2
7.3
3.9
4.3
3.1
1. 6
3.0
93.8
95.7
96.5
93.5
95.0
Dip-basket efficiency in Slot 4B (%) Number First �econd Third
Repiicate released dip dip dip Total
1
2
3
4
114
121
255
216
Total 706
Average
33.3
98.3
96.1
98.1
87.0
59.6
0.8
1.2
0.5
10.3
2.6
0.0
0.8
0.0
0.7
95.6
99.2
98.0
98.6
98.0
Control Number Percent Number Percent descaled descaled sampled descaled
2
3
1
1
7
1. 7
1. 9
0.4
0.4
0.9
Number Percent Descaled Descaled
1
1
4
1
7
0.9
0.8
1. 6
0.5
1. 0
94 0.0
94
0.0
1 The overhead orifice light on top of the lift tank was turned on during Replicates 1 and 3 and off during Replicates 2 and 4.
}. J ,} ) <} \}
Descaling in the lift-tank treatment group averaged 0.9%. No
..-. descaling was found in the control group. Descaling in the dip.
basket averaged 1.0%. Nine, 1, and 87 unmarked yearling
spring chinook salmon, sockeye salmon, and steelhead, were
incidentally collected by the lift tank and dip basket,
respectively (Table 6}.
The overhead orifice light on top of the lift tank had no
effect on fish recovery, suggesting that the light was
ineffective in attracting fish to the surface during daylight.
Mean recovery for Phases II and III when the light was on (94.1%
for Replicates 1 and 3} was 1.1% lower than when the light was
off (95.2% in Replicates 2 and 4} (Tables 3 and 5}. No tests
were conducted during darkness.
Appendix Table 1 lists the handling mortality of hatchery
steelhead during the lift-tank biological evaluation. No
handling mortality of other species was observed. Numbers of
fish used during testing ·and the analysis of those data are
provided in Appendix Table·s 2 through 5 .
25
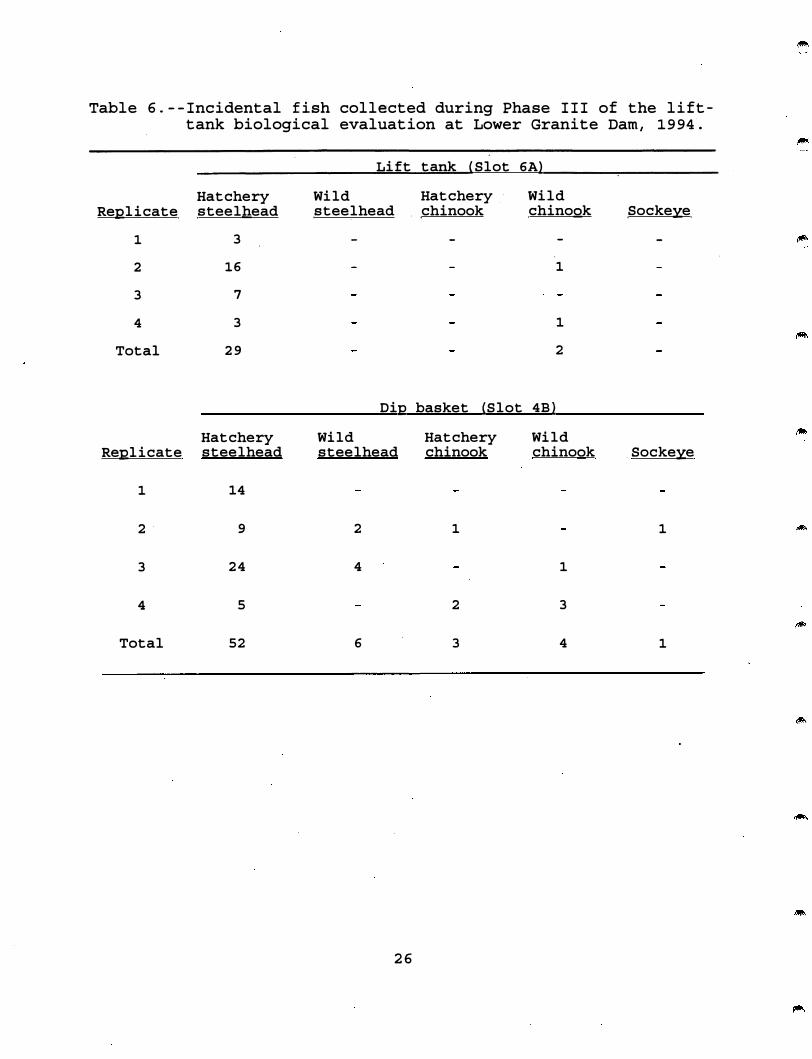
Table 6.--Incidental fish collected during Phase III of the lifttank biological evaluation at Lower Granite Dam, 1994.
Hatchery Replicate steelhead
1 3
2 16
3 7
4 3
Total 29
Hatchery Re;12licate steelhead
1 14
2· 9
3 24
4 5
Total 52
Lift tank (Slot 6A)
Wild steelhead
Di:12
Wild steelhead
2
4
6
2 6
Hatchery chinook
basket (Slot
Hatchery chinook
1
2
3
Wild chinook
4B)
1
1
2
Wild chinook
1
3
4
Sockeye
Sockeye
1
1
DISCUSSION
Preliminary evaluation of the lift-tank system indicated that
its collection efficiency was satisfactory (compared with
standard gatewell dip baskets} and that its use for the
collection and transfer of fish did not cause excessive
descaling, injuries, or mortalities. However, the lack of
detrimental effects may have been a result of the specific test
conditions. Test results might have been different had the
evaluation occurred during the spring migration period when fish
numbers were higher and the species composition was different.
For example, the low descaling incidence may have resulted
from a combination of low fish densities and the use of steelhead
juveniles, which have less deciduous scales. Maximum number of
fish in the lift tank at any time during testing was about 250,
and given the lift-tank capacity of 11, 925 L of water (COE,
1994a}, this number resulted in a density of 1 fish per 48 L.
In the future, during the peak of the juvenile salmonid
migration, several thousand fish might be collected in one dip of
the lift tank, increasing densities considerably.
Increased densities and propensity of fish to resist exiting
the tank could lead to higher incidences of descaling, injury, or
mortality, particularly if combined with the presence of sharp
edges inside the lift tank and adult fish. Occasionally, adult
fish are collected in dip baskets, and·their activity may also
cause descaling of juvenile fish.
2 7
SUMMARY
1. The lift-tank system efficiently and safely collected and
transferred tagged juvenile steelhead released into the gatewell.
2. Fewer than 1% of the tagged steelhead collected and
transferred via the lift-tank system were descaled.
3. The evaluation indicated that the lift-tank system is, at
a minimum, as effective as the standard gatewell dip baskets.
4. Few non-target species were captured with the lift tank
but a variety of other species were caught with the dip basket,
most likely because the dip basket was fished at a much deeper
depth.
5. Several potential design weaknesses of the lift-tank
system were observed and noted.
2 8

RECOMMENDATIONS
1. Before installation of operational lift tanks, further
testing should be conducted during a spring migration to evaluate
the lift-tank system under normal migratory conditions when fish
densities in gatewells are higher and the species composition is
different.
2. Testing should involve both chinook salmon and steelhead.
3. The lift-tank orifice connection to the existing orifice
of the bypass gallery should be evaluated for fish safety.
4. Testing should be extended to longer durations to examine
equipment reliability in terms of fish handling.
5. Several potential problems with lift-tank system design
were noted and should be addressed before additional testing,
including;
a. The.debris screen was not working at the time of the
test. Considering the potential amount and size of
debris encountered at Lower Granite Dam, debris
separation/removal systems should be tested before
implementation ot the lift-tank system.
b. The inner walls of the lift tank were cluttered with
debris-screen system hardware. Many sharp edges inside
the tank including conduit clips and nuts and bolts may
cause descaling when fish are in high numbers. The
majority of sharp edges would be eliminated with
modifications to the current debris-screen system. The
system should be comple.tely covered, mounted on the
2 9

outside of the tank, or replaced with a bar grating to
handle debris and adult fish.
c. Structures near the orifice opening caused erratic flows
precluding smooth release of fish and may cause
descaling with high fish densities. These structures
should be shielded to provide laminar flow from the lift
tank.
d. The floor (inner surface of the bottom gate) of the lift
tank did not have an appropriate slope to drain water
efficiently from the tank. Therefore, most fish
remained in the tank until nearly all water has drained.
We recommend increasing the slope on the floor to drain
water faster, promote a more efficient fish exit, and
eliminate the need for flush water.
e. The eye bolts associated with the cable attachments for
opening and closing the bottom gate of the lift tank
were surrounded by large gaps which may be harmful to
small fish. These eye bolts should be replaced with eye
bolts with longer shanks that would allow covering of
the gaps without restricting cable attachment.
f. The limit switch that controlled the upward movement of
the lift tank de-activated on several occasions. As a
result, the lift tank remained stationary until the
limit switch was manually activated and the operating
system was re-set. Because the lift tank had several
leaks, a malfunction of the limit switch while the tank
30

was suspended could result in complete draining of the
lift tank. A more reliable limit switch should be
implemented.
ACKNOWLEDGEMENTS
We thank the many COE personnel who provided information and
assistance; Dan Kenney, Sean Milligan, and Norm Hawes from the
Walla Walla District office; Del Gerke from Little Goose Dam; and
Jess Smiley, Doug Mciver, Tim Wik, Mike Halter, Ed King, Dennis
Golding, and Jim Harris from Lower G·ranite Dam.
We thank the personnel of the Washington Department of Fish
and Wildlife for collecting additional fish for our testing.
Last, but of equal importance, we acknowledge the help of
the following NMFS personnel: Scott Davidson, Neil Paasch, Ken
McIntyre, Rich Burland, Zach Burland, Jerry Harmon, Chuck Ebel,
Philip Weitz, and Thomas Ruehle.
31

REFERENCES
Ceballos, J. R., S. W. Pettit, and J. L. McKern. 1992. Fish Transportation Oversight Team. Annual Report FY 1991. Transportation operations on the Snake and Columbia Rivers. NOAA Technical Memorandum NMFS F/NWR-29. 77 p. plus Appendix. (Available from Environmental and Technical Services Division, 525 NE Oregon St./Suite 500, Portland, OR 97232.)
Matthews, G. M., G. A. Swan, and J. R. Smith. 1977. Improved bypass and collection system for protection of juvenile salmon and steelhead trout at Lower Granite Dam. Mar. Fish. Rev. 39(7) :10-14.
Swan, G. A., R. F. Krcma, and W. E. Farr. 1979. Dip basket for collecting juvenile salmon and trout in gatewells at hydroelectric dams. Prag. Fish. Cult. 41(1) : 48-49.
U.S. Army Corps of Engineers. 1993. Reservoir drawdown test, Lower Granite and Little Goose Dams, 185 p. (Available from U.S. Army Corps of Engineers, Walla Walla District, Bldg. 602, City-County Airport, Walla Walla, WA 99362.)
U.S. Army Corps of Engineers. 1994a. Lower Granite Lock and Dam gatewell fish removal system concept report 2, 76 p. (Available from U.S. Army Corps of Engineers, Walla Walla District, Bldg. 602, City-County Airport, Walla Walla, WA 99362.)
U.S. Army Corps of Engineers. 1994b. Lower Snake River biological drawdown test, draft environmental impact tf/1',
statement, 449 p. (Available from U.S. Army Corps of Engineers, Walla Walla District, Bldg. 602, City-County Airport, Walla Walla, WA 99362.)
32

·,


�PPENDIX
.) : .: �'-· ,:'
·� -
.-.
;
� . . . . "
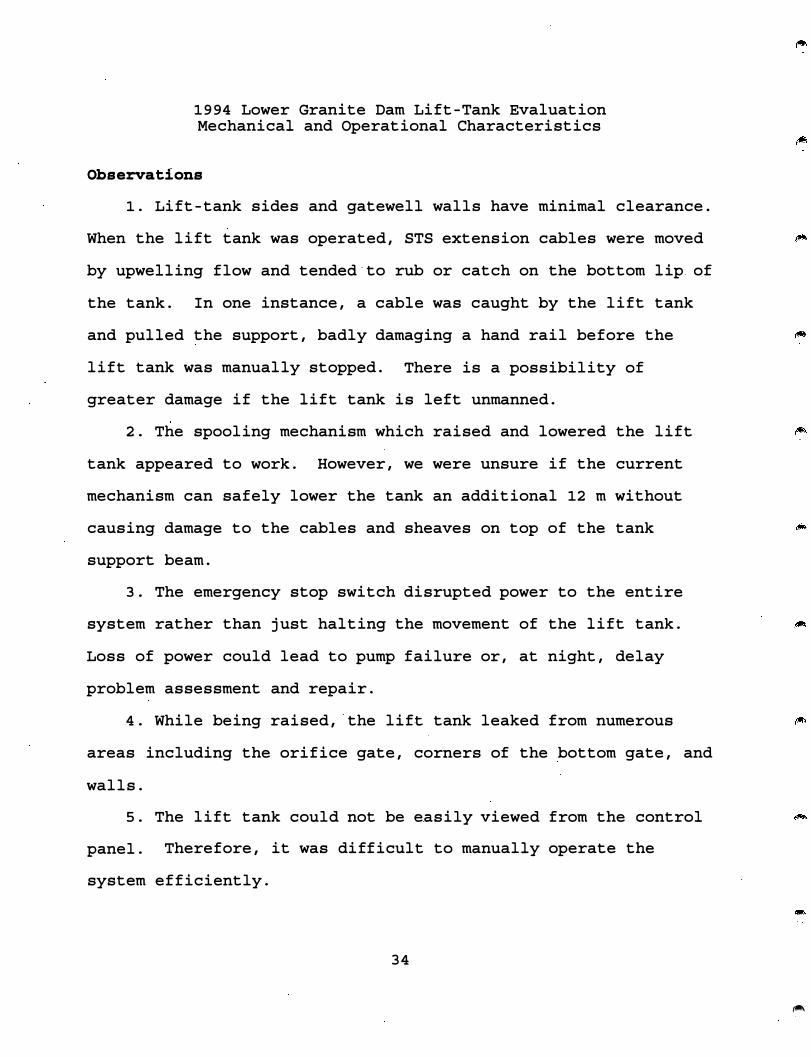
1994 Lower Granite Darn Lift-Tank Evaluation Mechanical and Operational Characteristics
Observations
1. Lift-tank sides and gatewell walls have minimal clearance.
When the lift tank was operated, STS extension cables were moved
by upwelling flow and tended ·to rub or catch on the bottom lip. of
the tank. In one instance, a cable was caught by the lift tank
and pulled the support, badly damaging a hand rail before the
lift tank was manually stopped. There is a possibility of
greater damage if the lift tank is left unmanned.
2. The spooling mechanism which raised and lowered the lift
tank appeared to work. However, we were unsure if the current
mechanism can safely lower the tank an additional 12 rn without
causing damage to the cables and sheaves on top of the tank
support beam.
3 . The emergency stop switch disrupted power to the entire
system rather than just halting the movement of the lift tank.
Loss of power could lead to pump failure or, at night, delay
problem assessment and repair.
4. While being raised, the lift tank leaked from numerous
areas including the orifice gate, corners of the bottom gate, and
walls.
5. The lift tank could not be e.asily viewed from the control
panel. Therefore, it was difficult to manually operate the
system efficiently.
34
"'

6. The liquid crystal display (LCD) screen was ineffective at
normal summer temperatures. Heat from direct sunlight caused the
screen to blank out.
7. The float-limit switch did not have adequate support along
the shaft. Also, the limit switch occasionally did not disengage
while at simulated gallery orifice level causing a halt to
operations until the switch was tripped manually.
8. When full of water, the lift tank shifted downstream
against the wall of the gatewell while being lifted.
Suggestions For Improvements To The Lift Tank
1. To avoid the possibility of catching STS extension cables,
the tank could be made narrower and/or slots could be made on the
tank to accommodate the cables. In addition, if the lift tank is
used in a gatewell with an extended STS, a slot for the center
lifting cable should be incorporated into the lift tank. Also,
brushes mounted around the top of the tank would guide fish into
the tank and hold cables out of the way against the wall.
2. Emergency kill switches should be located at multiple
points for safety purposes. The switches should only shut off
the movement of the tank rather than the whole system.
· 3. In addition to or in place of the LCD screen, install
labeled buttons to perform the desired functions.
4. Eliminate or completely cover all protruding structures
inside the tank and make the inside as smooth as possible.
35

5. Redesign the orifice opening to provide smoother flow of
water. In addition, install the slide gate and air cylinder
outside the tank or enclose within a smooth cover.
6. The bottom gate of the tank currently has a dual-slope
design. Changing to a tri-slope design with the third slope
leading to the opening, increasing the slope and/or putting a
small reservoir at the exit may provide a safer and more
efficient exit for the fish.
The Simulated Gallery Tank
1. The pump to fill the simulated gallery had inadequate
pumping capacity.
2. A semi-permanent screen at the orifice end of the tank
would permit use of submersible pumps to supply water to fish
holding facilities.
3. A 10.2 cm quick-disconnect hose fitting on the upstream
side of the simulated gallery tank would facilitate control fish
releases and help to reduce congestion of traffic on the intake
deck during testing.
36

-
Appendix Table 1.--Incidental mortality of hatchery steelhead during the lift-tank biological evaluation at Lower Granite Dam , 1994 .
Replicate
l
2
3
4
5
6
Total
Replicate
l
2
3
4
Total
Replicate
l
2
3
4
Total
Pre-release Lift tank
Treatment Control
l
0
0
l
3
2
7
l
0
0
l
l
l
4
Pre- release Lift tank
Treatment Control
0
l
l
5
7
l
0
l
Pre- release Lift tank
Treatment Control
2 l
5
13 l
2
22 2
Phase I mortality After collection ( laboratory)
Lift tank Dip basket Treatment Control Dip basket
0
0
0
l
0
3
4
0
0
0
l
0
0
l
Phase II mortality After collection (laboratory>
Lift tank Dip basket Treatment Control Dip basket
l
0
l
2
4
Phase
Dip basket
l
l
7
l
10
III
l
l
0
3
5
mortality
0
2
2
After collection Lift tank
Treatment Control
0 0
0 0
0 3
0
0 3
2
131
0
0
15
C laboratory)
Dip basket
0
0
7
l
8
Incidental
Incidental
0
0
0
0
0
Incidental
0
0
0
0
0
1 Fish mortality occurred in holding tank and was caused by blockage in water hose.
37
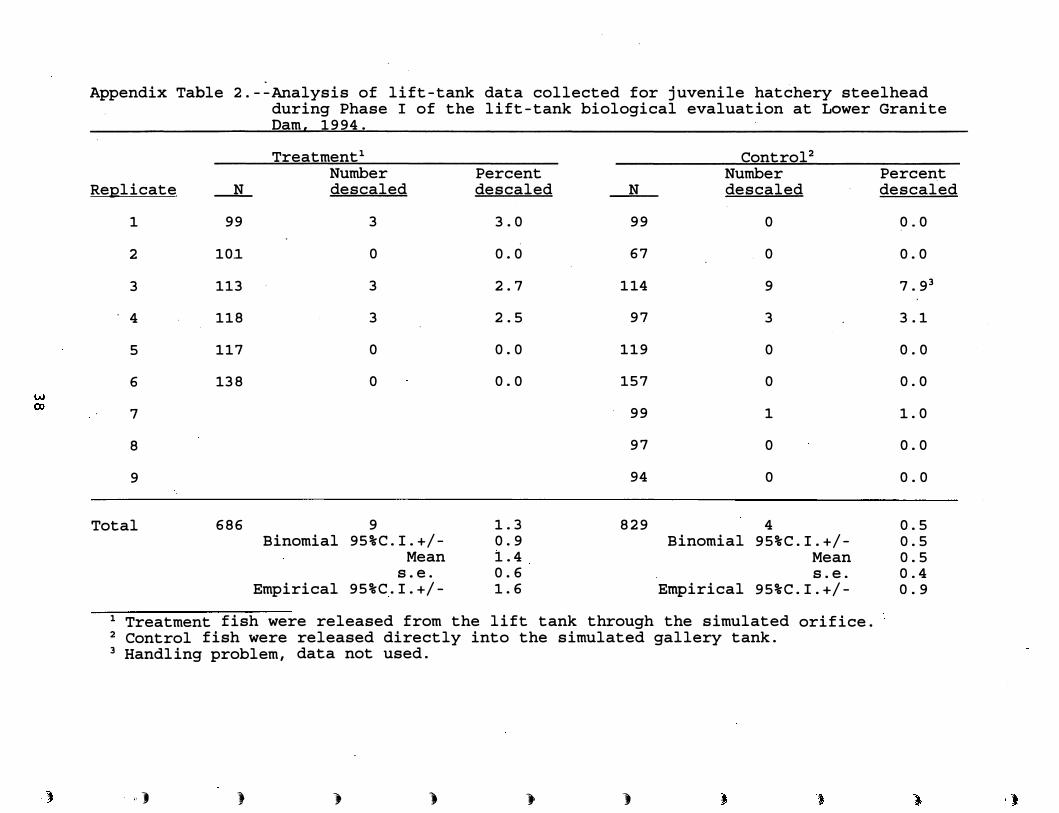
Appendix Table 2.--Analysis of lift-tank data collected for j uvenile hatchery steelhead during Phase I of the lift-tank biological evaluation at Lower Granite Dam 1994.
Treatment1 Control2
Number Percent Number Percent Replicate _N_ descaled descaled N descaled descaled
1 99 3 3.0 99 0 0 . 0
2 10.1 0 0.0 67 0 0.0
3 113 3 2.7 1 14 9 7. 93
4 118 3 2.5 97 3 3 .1
5 117 0 0.0 119 0 0.0
6 138 0 0.0 157 0 0.0
7 99 1 1.0
8 97 0 0.0
9 94 0 0.0
Total 686 9 1 . 3 829 4 0.5 Binomial 95%C.I.+/- 0.9 Binomial 95%C.I.+/- 0.5
Mean 1.4 Mean 0.5 s.e. 0.6 s.e. 0 . 4
Empirical 95%C.I.+/- 1.6 Empirical 95%C.I.+/- 0.9
1 Treatment fish were released from the lift tank through the simulated orifice. 2 Control fish were released directly into the simulated gallery tank. 3 Handling problem, data not used.
· ) ) } } } }
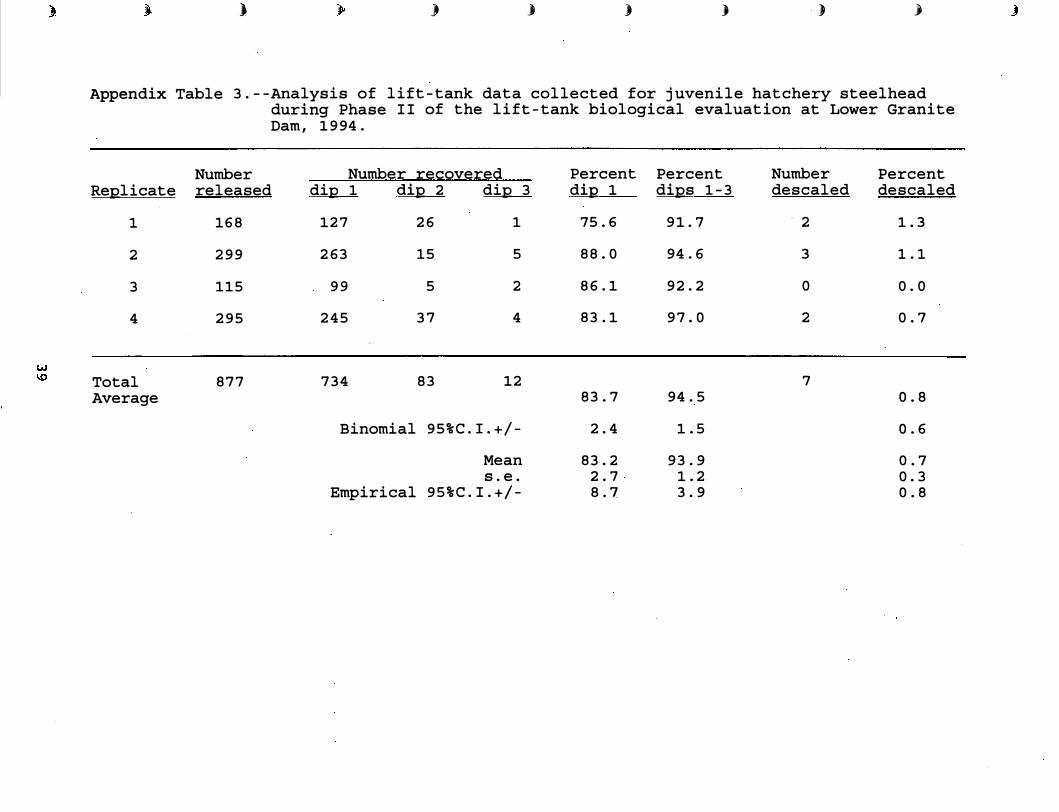
Appendix
Replicate
1
2
3
4
Total Average
l ) j ) } · ) j
Table 3.--Analysis of lift-tank data collected for juvenile hatchery steelhead during Phase II of the lift-tank biological evaluation at Lower Granite Dam,
Number released
168
29 9
115
29 5
8 7 7
19 94 .
Number recovered dip 1 dip 2 dip 3
127 26 1
26 3 15 5
99 5 2
24 5 3 7 4
7 3 4 8 3 12
Binomial 95%C.I.+/-
Mean s.e.
Empirical 95%C.I.+/-
Percent dip 1
75 . 6
88 . 0
86 . 1
8 3 . 1
8 3 . 7
2 . 4
8 3 . 2 2 . 7 8.7
Percent dips 1-3
91 . 7
94 . 6
9 2 . 2
9 7 . 0
94 . 5
1 . 5
9 3 . 9 1 . 2 3 . 9
Number Percent descaled descaled
- 2 1.3
3 1.1
0 0.0
2 0.7
7 0 . 8
0 . 6
0.7 0.3 0 . 8

Appendix Table 4. --Analysis of lift-tank data collected for j uvenile hatchery steelhead during Phase III of the lift-tank biological evaluation at Lower Granite Dam, 1994.
Number Replicate released dip
1 129 104
2 161 138
3 287 249
4 245 205
Total 822 696
r }
Number recovered 1 dip 2
12
9
19
20
60 Binomial
Empirical
. ,
dip 3
5
7
9
4
25 95%C. I. +/-
Mean s. e.
95%C . I. +/-
Percent dip 1
80. 6
85. 7
86. 8
83. 7
84. 7 2. 5
84. 2 1. 4 4. 3
Percent dips 1-3
93. 8
95. 7
96. 5
93. 5
95. 0 1. 5
94. 9 0. 7 2. 3
Number Percent descaled descaled
2 1. 7
3 1. 9
1 0. 4
1 0. 4
7 0. 9 0. 6
1. 0 0. 4 1. 2
l

), }. ) )
Appendix Table 5.--Analysis of dip-basket data during Phases II and III of Lower Granite Dam 1994.
Number Replicate released
1 97
�
3
4
5
6
7
8
Total ( 3 )
Total (4 )
299
115
298
114
121
25 5
216
1119
3 96
Total ( al l ) 1515
Number recovered dip 1 dip 2 dip 3 dip 4
3 2 0 2 6 0
23 0
10 8
28 8
3 8
119
24 5
212
1010
262
2
2
6
6 8
1
3
1
4
0
0
3
0
2
0
81 5
5 0
Binomial 95 %C . I . + / Mean s . e .
Empirical 95 %C . I . + / -
2 6 110 Binomial 95 %C . I . +/ -
( 3 ) 3 dips all to about 24 . 4 m as i s traditional
) } )
collected for juvenile hatchery steelhead the lift-tank biological evaluation at
Percent Percent Percent dip 1 dips 1-3 dip 1-4
Number Percent descaled descaled
3 3 . 0 3 5 . 1 96 . 9
76 . 9
93 . 9
96 . 6
3 3 . 3
98 . 4
96 . 1
98 . 2
90 . 3 1 . 7
86 . 1 10 . 6 2 7 . 2
66 . 2 4 . 7
7 8 . 9
95 . 7
98 . 7
95 . 6
99 . 2
98 . 0
98 . 6
97 . 9 0 . 8
97 . 6 0 . 7 1 . 7
6 8 . 2 4 . 6
95 . 7
96 . 0 1 . 9
Binomial 95 %C . I . + / Mean s . e .
Empirical 95%C . I . +/ -
0 0 . 0
0
1
2
1
1
4
1
10
0 . 0
0 . 9
0 . 7
0 . 9
0 . 8
1 . 6
0 . 5
0 . 7 0 . 4 0 . 7 0 . 2 0 . 4
(4 ) Dips 1- 3 made at same depth as l i ft tank and dip 4 was to 15 . 24 m .
}