Biological and Water Quality Study of Sandy Creek 1996, · PDF fileRockbass (Ambloplites...
98
State of Ohio Ecological Assessment Environmental Protection Agency Division of Surface Water Mayfly (Stenonema) P.O. Box 1049, 1800 WaterMark Dr., Columbus, Ohio 43266-1049 Biological and Water Quality Study of Sandy Creek 1996, 1997 Columbiana, Carroll and Stark Counties, Ohio Rockbass (Ambloplites rupestis) March 4, 1998
Transcript of Biological and Water Quality Study of Sandy Creek 1996, · PDF fileRockbass (Ambloplites...

State of Ohio Ecological AssessmentEnvironmental Protection Agency Division of Surface Water
Mayfly (Stenonema)
P.O. Box 1049, 1800 WaterMark Dr., Columbus, Ohio 43266-1049
Biological and Water Quality Studyof
Sandy Creek1996, 1997
Columbiana, Carroll and Stark Counties, Ohio
Rockbass (Ambloplites rupestis)
March 4, 1998

Biological and Water Quality Study of Sandy Creek
Minerva1996, 1997
Carroll, Stark and Columbiana Counties, Ohio
March 4, 1998
OEPA Technical Report MAS/1997-3-1
prepared for
State of Ohio Environmental Protection AgencyDivision of Emergency and Remedial Response
Northeast District Office
prepared by
State of Ohio Environmental Protection AgencyDivision of Surface Water
Monitoring and Assessment Section1685 Westbelt Dr.
Columbus, Ohio 43228

DSW/MAS 1997-3-1 Sandy Creek/ Minerva March 4, 1998
TABLE OF CONTENTS Page
INTRODUCTION . . . . . . . . . . . . . . . . . . . . . . . . . . . . . . . . . . . . . . . . . . . . . . . . . . . . . . . . . . . 1
SUMMARY / CONCLUSIONS . . . . . . . . . . . . . . . . . . . . . . . . . . . . . . . . . . . . . . . . . . . . . . . . . 2
METHODS . . . . . . . . . . . . . . . . . . . . . . . . . . . . . . . . . . . . . . . . . . . . . . . . . . . . . . . . . . . . . . . . . 8
RESULTS AND DISCUSSION . . . . . . . . . . . . . . . . . . . . . . . . . . . . . . . . . . . . . . . . . . . . . . . . 10Sediment Chemistry . . . . . . . . . . . . . . . . . . . . . . . . . . . . . . . . . . . . . . . . . . . . . . . . . . . . . 10Surface Water Chemistry . . . . . . . . . . . . . . . . . . . . . . . . . . . . . . . . . . . . . . . . . . . . . . . . . 15Pollutant Loadings . . . . . . . . . . . . . . . . . . . . . . . . . . . . . . . . . . . . . . . . . . . . . . . . . . . . . . 15Physical Habitat for Aquatic Life . . . . . . . . . . . . . . . . . . . . . . . . . . . . . . . . . . . . . . . . . . . 27Macroinvertebrate Community . . . . . . . . . . . . . . . . . . . . . . . . . . . . . . . . . . . . . . . . . . . 29Fish Community . . . . . . . . . . . . . . . . . . . . . . . . . . . . . . . . . . . . . . . . . . . . . . . . . . . . . . . . 33Fish Tissue . . . . . . . . . . . . . . . . . . . . . . . . . . . . . . . . . . . . . . . . . . . . . . . . . . . . . . . . . . . . 37
TREND ASSESSMENT . . . . . . . . . . . . . . . . . . . . . . . . . . . . . . . . . . . . . . . . . . . . . . . . . . . . . . 40
REFERENCES . . . . . . . . . . . . . . . . . . . . . . . . . . . . . . . . . . . . . . . . . . . . . . . . . . . . . . . . . . . . . 42
APPENDICES . . . . . . . . . . . . . . . . . . . . . . . . . . . . . . . . . . . . . . . . . . . . . . . . . . . . . . . . . . . . . . 45
i

DSW/MAS 1997-3-1 Sandy Creek/ Minerva March 4, 1998
NOTICE TO USERS
Ohio EPA incorporated biological criteria into the Ohio Water Quality Standards (WQS; OhioAdministrative Code 3745-1) regulations in February 1990 (effective May 1990). These criteriaconsist of numeric values for the Index of Biotic Integrity (IBI) and Modified Index ofWell-Being (MIwb), both of which are based on fish assemblage data, and the InvertebrateCommunity Index (ICI), which is based on macroinvertebrate assemblage data. Criteria for eachindex are specified for each of Ohio's five ecoregions (as described by Omernik 1987), and arefurther organized by organism group, index, site type, and aquatic life use designation. Thesecriteria, along with the existing chemical and whole effluent toxicity evaluation methods andcriteria, figure prominently in the monitoring and assessment of Ohio’s surface water resources.
The following Ohio EPA documents support the use of biological criteria by outlining therationale for using biological information, the methods by which the biocriteria were derived andcalculated, the field methods by which sampling must be conducted, and the process forevaluating results:
Ohio Environmental Protection Agency. 1987a. Biological criteria for the protection of aquaticlife: Volume I. The role of biological data in water quality assessment. Division of WaterQual. Mont. & Assess., Surface Water Section, Columbus, Ohio.
Ohio Environmental Protection Agency. 1987b. Biological criteria for the protection of aquaticlife: Volume II. Users manual for biological field assessment of Ohio surface waters.Division of Water Qual. Mont. & Assess., Surface Water Section, Columbus, Ohio.
Ohio Environmental Protection Agency. 1989b. Addendum to Biological criteria for theprotection of aquatic life: Volume II. Users manual for biological field assessment ofOhio surface waters. Division of Water Qual. Plan. & Assess., Ecological AssessmentSection, Columbus, Ohio.
Ohio Environmental Protection Agency. 1989c. Biological criteria for the protection of aquaticlife: Volume III. Standardized biological field sampling and laboratory methods forassessing fish and macroinvertebrate communities. Division of Water Quality Plan. &Assess., Ecol. Assess. Sect., Columbus, Ohio.
Ohio Environmental Protection Agency. 1990. The use of biological criteria in the Ohio EPAsurface water monitoring and assessment program. Division of Water Qual. Plan. &Assess., Ecol. Assess. Sect., Columbus, Ohio.
Rankin, E.T. 1989. The qualitative habitat evaluation index (QHEI): rationale,methods, andapplication. Division of Water Qual. Plan. & Assess., Ecol. Assess. Sect., Columbus,Ohio.
ii

DSW/MAS 1997-3-1 Sandy Creek/ Minerva March 4, 1998
Since the publication of the preceding guidance documents new publications by Ohio EPA havebecome available. The following publications should also be consulted as they represent thelatest information and analyses used by Ohio EPA to implement the biological criteria.
DeShon, J.D. 1995. Development and application of the invertebrate community index (ICI),pp. 217-243. in W.S. Davis and T. Simon (eds.). Biological Assessment and Criteria:Tools for Risk-based Planning and Decision Making. Lewis Publishers, Boca Raton, FL.
Rankin, E. T. 1995. The use of habitat assessments in water resource management programs,pp. 181-208. in W. Davis and T. Simon (eds.). Biological Assessment and Criteria:Tools for Water Resource Planning and Decision Making. Lewis Publishers, Boca Raton,FL.
Yoder, C.O. and E.T. Rankin. 1995. Biological criteria program development andimplementation in Ohio, pp. 109-144. in W. Davis and T. Simon (eds.). BiologicalAssessment and Criteria: Tools for Water Resource Planning and Decision Making.Lewis Publishers, Boca Raton, FL.
Yoder, C.O. and E.T. Rankin. 1995a. Biological response signatures and the area of degradationvalue: new tools for interpreting multimetric data, pp. 263-286. in W. Davis and T.Simon (eds.). Biological Assessment and Criteria: Tools for Water Resource Planningand Decision Making. Lewis Publishers, Boca Raton, FL.
Yoder, C.O. 1995. Policy issues and management applications for biological criteria, pp. 327-344. in W. Davis and T. Simon (eds.). Biological Assessment and Criteria: Tools forWater Resource Planning and Decision Making. Lewis Publishers, Boca Raton, FL.
Yoder, C.O. and E.T. Rankin. 1995b. The role of biological criteria in water quality monitoring,assessment, and regulation. Environmental Regulation in Ohio: How to Cope With theRegulatory Jungle. Inst. of Business Law, Santa Monica, CA. 54 pp.
These documents and this report can be obtained by writing to:
Ohio EPA, Division of Surface WaterMonitoring and Assessment Section
1685 Westbelt DriveColumbus, Ohio 43228-3809
(614) 728-3377
iii

DSW/MAS 1997-3-1 Sandy Creek/ Minerva March 4, 1998
FOREWORD
What is a Biological and Water Quality Survey?A biological and water quality survey, or “biosurvey” is an interdisciplinary monitoring effortcoordinated on a waterbody specific or watershed scale. Ohio EPA employs biological, chemical,and physical monitoring and assessment techniques in biosurveys in order to meet three majorobjectives: 1) determine the extent to which uses assigned under the Ohio Water QualityStandards (WQS) are either attained or not attained; 2) determine if use designations assigned to agiven water body are appropriate and attainable; and 3) determine if any changes in the ambientbiological, chemical, or physical indicators have taken place over time, particularly before andafter the implementation of point source pollution controls or best management practices. Thedata gathered by a biosurvey is processed into information and then synthesized into this report.Each biological and water quality study contains a summary of major findings andrecommendations for revisions to WQS, future monitoring needs, or other actions which may beneeded to resolve existing impairment of designated uses. While the principal focus of abiosurvey is on the status of aquatic life uses, the status of other uses such as recreation andwater supply, as well as human health concerns, are addressed as well.
The findings and conclusions of a biological water quality study may factor into regulatoryactions taken by Ohio EPA (e.g., NPDES permits, Director’s Orders), the Ohio Water QualityStandards (OAC 3745-1), and are eventually incorporated into Water Quality Permit SupportDocuments (WQPSDs), State Water Quality Management Plans, the Ohio Nonpoint SourceAssessment, and the biennial Ohio Water Resource Inventory (305[b] report).
Hierarchy of IndicatorsA carefully conceived ambient monitoring approach, which uses cost-effective indicatorscomprised of ecological, chemical, toxicological measures, can ensure that all relevant pollutionsources are judged objectively and on the basis of environmental results. Ohio EPA relies on atiered approach in attempting to link the results of administrative activities with trueenvironmental measures. Such an integrated approach is outlined in Figure I and includes ahierarchical continuum from administrative to true environmental indicators. The six “levels” ofindicators include: 1) actions taken by regulatory agencies (permitting, enforcement, grants); 2)responses by the regulated community (treatment works, pollution prevention); 3) changes indischarged quantities (pollutant loadings); 4) changes in ambient conditions (water quality,habitat); 5) changes in uptake and/or assimilation (tissue contamination, biomarkers, wasteloadallocation); and, 6) changes in health, ecology, or other effects (ecological condition, pathogens).In this process the results of administrative activities (levels 1 and 2) can be linked to efforts toimprove water quality (levels 3, 4, and 5) which should translate into the environmental “results”(level 6). Thus, the aggregate effect of billions of dollars spent on water pollution control sincethe early 1970s can now be determined with quantifiable measures of environmental condition.
Superimposed on this hierarchy is the concept of stressor, exposure, and response indicators.Stressor indicators generally include activities which have the potential to degrade the aquaticenvironment such as pollutant discharges (permitted and unpermitted), land use effects, andhabitat modifications. Exposure indicators are those which measure the effects of stressors and
iv

DSW/MAS 1997-3-1 Sandy Creek/ Minerva March 4, 1998
can include whole effluent toxicity tests, tissue residues, and biomarkers, each of which providesevidence of biological exposure to a stressor or bioaccumulative agent. Response indicators aregenerally composite measures of the cumulative effects of stress and exposure and include themore direct measures of community and population response and are represented here by thebiological indices which comprise Ohio’s biological criteria. Other response indicators couldinclude target assemblages, i.e., rare, threatened, endangered, special status, and declining speciesor bacterial levels which serve as surrogates for the recreational uses. These indicators representthe essential technical elements for watershed-based management approaches. The key, however,is to use the different indicators within the roles which are most appropriate for each.
In describing the causes and sources associated with observed impairments revealed by thebiological criteria and linking this with pollution sources involves an interpretation of multiplelines of evidence including the water chemistry data, sediment data, habitat data, effluent data,biomonitoring results, land use data, and biological response signatures within the biological data
itself. Thus the assignment of principal causes and sources of impairment represents theassociation of impairments (defined by response indicators) with stressor and exposure
Actions by EPA/States
Responses by Regulated Community
Changes in Discharge Quantities
Changes in Ambient
Conditions
Changes in Uptake and/or Assimilation
Changes in Health,
Ecology, or Other Effects
LEVEL 1 LEVEL 2 LEVEL 3 LEVEL 4 LEVEL 5 LEVEL 6
• NPDES• Funding• NPS (319)• CSOs• Stormwater• 404/401• Stream
Protection
• POTW Const.• CSO Controls• Local
ordinances• Stormwater
controls• NPS BMPs
• Loadings• WET/TRE• NPDES viol.• Spills, kills• Other
releases
• Water column
• Sediment• Habitat• Land use
• Tissue contaminants
• TMDL• Biomarkers• Habitat
• Biota (Biocriteria)
• Bacterial• Target
assemblages
HIERARCHY OF INDICATORS USED BY OHIO EPA
Administrative Indicators True Environmental Indicators
INFORMATION CURRENTLY AVAILABLE TO OHIO EPA
Figure I. Hierarchy of administrative and environmental indicators used by Ohio EPA formonitoring, assessment, reporting, and evaluating program effectiveness. This continuumis patterned after a model developed by U.S. EPA.
v

DSW/MAS 1997-3-1 Sandy Creek/ Minerva March 4, 1998
indicators. The principal reporting venue for this process on a watershed or subbasin scale is abiological and water quality report. These reports then provide the foundation for aggregatedassessments such as the Ohio Water Resource Inventory (305[b] report, the Ohio NonpointSource Assessment, and technical bulletins covering a variety of subjects.
Ohio Water Quality Standards: Designated Aquatic Life UsesThe Ohio Water Quality Standards (WQS; Ohio Administrative Code 3745-1) consist ofdesignated uses and chemical, physical, and biological criteria designed to represent measurableproperties of the environment that are consistent with the goals specified by each usedesignation. Use designations consist of two broad groups, aquatic life and non-aquatic life uses.In applications of the Ohio WQS to the management of water resource issues in Ohio’s rivers andstreams, the aquatic life use criteria frequently result in the most stringent protection andrestoration requirements, hence their emphasis in biological and water quality reports. Fivedifferent aquatic life uses are currently defined in the Ohio WQS:
1) Warmwater Habitat (WWH) - this use designation defines the “typical” warmwaterassemblage of aquatic organisms for Ohio rivers and streams; this use represents the principalrestoration target for the majority of water resource management efforts in Ohio.
2) Exceptional Warmwater Habitat (EWH) - this use designation is reserved for waters whichsupport “unusual and exceptional” assemblages of aquatic organisms which are characterizedby a high diversity of species, particularly those which are highly intolerant and/or rare,threatened, endangered, or special status (i.e., declining species); this designation represents aprotection goal for water resource management efforts dealing with Ohio’s best waterresources.
3) Coldwater Habitat (CWH) - this use is intended for waters which support assemblages ofcold water organisms and/or those which are stocked with salmonids with the intent ofproviding a put-and-take fishery on a year round basis which is further sanctioned by theOhio DNR, Division of Wildlife; this use should not be confused with the Seasonal SalmonidHabitat (SSH) use which applies to the Lake Erie tributaries which support periodic “runs”of salmonids during the spring, summer, and/or fall.
4) Modified Warmwater Habitat (MWH) - this use applies to streams and rivers which havebeen subjected to extensive, maintained, and essentially permanent hydromodifications suchthat the biocriteria for the WWH use are not attainable and where the activities have beensanctioned by state or federal law; the representative aquatic assemblages are generallycomposed of species which are tolerant to low dissolved oxygen, silt, nutrient enrichment,and poor quality habitat.
5) Limited Resource Water (LRW) - this use applies to streams (usually <3 mi.2 drainage area)which have been irretrievably altered to the extent that no appreciable assemblage of aquaticlife can be supported; such streams generally includes small streams in extensively urbanizedareas, small streams which lie in watersheds with extensive drainage modifications, and/orsmall streams which completely lack water on a recurring annual basis (i.e., true ephemeralstreams).
vi

DSW/MAS 1997-3-1 Sandy Creek/ Minerva March 4, 1998
Chemical, physical, and/or biological criteria are generally assigned to each use designation in accordance with the broad goals defined by each. As such the system of use designations employed in the Ohio WQS constitutes a “tiered” approach in that varying and graduated levelsof protection are provided by each. This hierarchy is especially apparent for parameters such asdissolved oxygen, ammonia-nitrogen, temperature, and the biological criteria. For otherparameters such as heavy metals, the technology to construct an equally graduated set of criteriahas been lacking, thus the same criteria may apply to two or three different use designations.
Ohio Water Quality Standards: Non-Aquatic Life UsesIn addition to assessing the appropriateness and status of aquatic life uses, each biological andwater quality survey also addresses non-aquatic life uses such as recreation, water supply, andhuman health concerns as appropriate. The two recreation uses which are the most applicable torivers and streams are the Primary Contact Recreation (PCR) and Secondary Contact Recreation(SCR) uses. The criterion for designating the PCR use is simply having a water depth of at leastone meter over an area of at least 100 square feet or where canoeing is a feasible activity. If awater body is too small and shallow to meet either criterion the SCR use applies. The attainmentstatus of PCR and SCR is determined using bacterial indicators (e.g., fecal coliforms, E. Coli) andthe criteria for each as specified in the Ohio WQS.
Water supply uses include Public Water Supply (PWS), Agricultural Water Supply (AWS), andIndustrial Water Supply (IWS). Public Water Supplies are simply defined as segments within500 yards of a potable water supply or food processing industry intake. The Agricultural WaterSupply (AWS) and Industrial Water Supply (IWS) use designations generally apply to all watersunless it can be clearly shown that they are not applicable. An example of this would be notdesignating AWS in an urban area where livestock watering or pasturing does not take place.Chemical criteria are specified in the Ohio WQS for each use and attainment status is basedprimarily on chemical-specific indicators. Human health concerns are additionally addressed withfish tissue data, but any consumption advisories are issued by the Ohio Department of Healthoutside of this report.
vii

DSW/MAS 1997-3-1 Sandy Creek/ Minerva March 4,1998
ACKNOWLEDGEMENTS
The following Ohio EPA staff are acknowledged for their significant contribution to this report.
Coordinator - David AltfaterData Management - Dennis Mishne and Ed RankinFish Data Analysis, Sediment, Pollutant Loadings - David AltfaterMacroinvertebrate Data Analysis - Bernie CountsReviewers - Chris Yoder, Jeff DeShon, and Marc Smith
Support during field collections was provided by Kevin Kish, Bart Ray, Tim Wilson, John Fritz,Marc Smith, Paul Vandermeer, Teri Phillips, Bob Wysenski, Kim Wylie, Paul Novak, and LarryLins.
ix

DSW/MAS 1997-3-1 Sandy Creek/ Minerva March 4,1998
Biological and Water Quality Study of Sandy Creek(Carroll, Stark and Columbiana Counties, Ohio)
Ohio Environmental Protection AgencyDivision of Surface Water
Monitoring and Assessment Section1685 Westbelt Drive
Columbus, Ohio 43228
INTRODUCTION
The Sandy Creek study area included the mainstem river from East Rochester [river mile (RM)35] to Waynesburg (RM 17).
Specific objectives of this evaluation were to:
1) measure and determine biological condition and sediment quality in Sandy Creek and thelower Still Fork in the vicinity of Minerva and Malvern,
2) determine the potential accumulation of contaminants in river sediments in the vicinity ofMinerva,
3) measure and establish the level of bioaccumulative chemicals in selected bottom feedingand predator fish species from Sandy Creek and the lower Still Fork,
4) evaluate influences from municipal and industrial discharges to Sandy Creek,
5) determine the attainment status of the current WWH aquatic life use designation forSandy Creek and the Still Fork within the study area, and
6) follow-up on conditions documented in the 1993 Ohio EPA survey (Ohio EPA 1995).
A fish tissue study was proposed for Sandy Creek in the Oneida area during May 1996. Thestudy was initiated to collect fish for chemical analyses to supplement other types of samplingdata (groundwater, surface water) from this area investigating a possible link betweenenvironmental contamination and a serious medical condition of two area infants. Results fromthis initial fish tissue study revealed a severely degraded fish community in Sandy Creek withinthe Oneida/Minerva section of stream. Additional sampling was proposed to determine both theextent and source of instream biological degradation in Sandy Creek.
The Sandy Creek watershed is located in the Erie-Ontario Lake Plain (EOLP) and WesternAllegheny Plateau (WAP) ecoregions. Based on a review of stream attributes and ecoregioncharacteristics, Sandy Creek within the study area was evaluated using Erie-Ontario Lake Plainbiocriteria (Ohio EPA 1995). Still Fork falls entirely within the WAP ecoregion. Sandy Creekand the Still Fork are currently assigned the Warmwater Habitat (WWH) aquatic life use.
11

DSW/MAS 1997-3-1 Sandy Creek/ Minerva March 4,1998
SUMMARY / CONCLUSIONS
From June to October, 1996 staff from the Ohio EPA Divisions of Surface Water and Emergencyand Remedial Response conducted biological community and fish tissue sampling on SandyCreek and the Still Fork. In addition, sediment sampling was conducted in July 1996 by theU.S.EPA and the data are contained in this report. Three biological sampling locations wereresampled in 1997 to evaluate potential stream improvements associated with the completion ofupgrades at the Minerva WWTP. The results of these sampling events are summarized below.
• A substantial improvement in aquatic biological conditions occurred in Sandy Creek between1996 and 1997, downstream from the Minerva WWTP. Fish and macroinvertebratecommunities improved from non-attainment to partial attainment, and the improvementcorresponded to a significant decrease in ammonia-N pollutant loadings from the MinervaWWTP during late 1996 and 1997.
• Non-attainment of the Warmwater Habitat (WWH) aquatic life use designation occurredduring 1996 at all of the biological sampling sites located downstream from the MinervaWastewater Treatment Plant (WWTP) (Table 2). Partial attainment of the WWH use wasobserved at the sampling location adjacent to the Minerva WWTP (RM 29.2) and fullattainment was documented at all sites located upstream from the Minerva WWTP.Biological results from 1996 for the Sandy Creek study area indicated that 5.4 miles of riverwere in full attainment of the WWH use, 0.3 miles were in partial attainment, and 6.6 miles ofriver were not meeting the WWH use designation. The non-attainment status of the biologicalsampling locations was due primarily to the poor to very poor performance of the fishcommunities.
• The fish community sampling results indicated that prior to July 1996 (and possibly intoJuly 1996) chemical contaminants were released into Sandy Creek in the vicinity of theMinerva WWTP, causing severely toxic conditions for at least 6.6 miles. The source or typeof contamination is unknown. Chemical spills and wild animal kills have not been reportedfrom Sandy Creek since 1994. However, highly toxic ammonia-N concentrations and loadingswere discharged into Sandy Creek from the Minerva WWTP prior to 1997; this wasparticularly evident during the summer of 1995. Water quality modeling of the MinervaWWTP effluent calculated that the allowable average summer ammonia-N concentrationdischarged to Sandy Creek should be at or less than 4.0 mg/l; average concentrations duringthe summers of 1995 and 1996 were 28.1 mg/l and 8.3 mg/l, respectively.
• The macroinvertebrate community sampling in 1996 downstream from the Minerva WWTPindicated disturbed conditions with the community completely predominated by blackflies,organisms often found in high numbers in Ohio streams under degraded conditions.Conditions 3.6 miles downstream from the WWTP improved into the good range but stillshowed signs of a stressed community. The macroinvertebrate community at Malvern haddeclined back into the fair range with 84% of the community consisting of nutrient toleranthydras. With the available data it was difficult to discern if the high numbers of blackflies
2
DSW/MAS 1997-3-1 Sandy Creek/ Minerva March 4,1998
and hydras in Sandy Creek are indicators of a recovery from a recent kill-off or a communitycontinuously stressed by high nutrient levels.
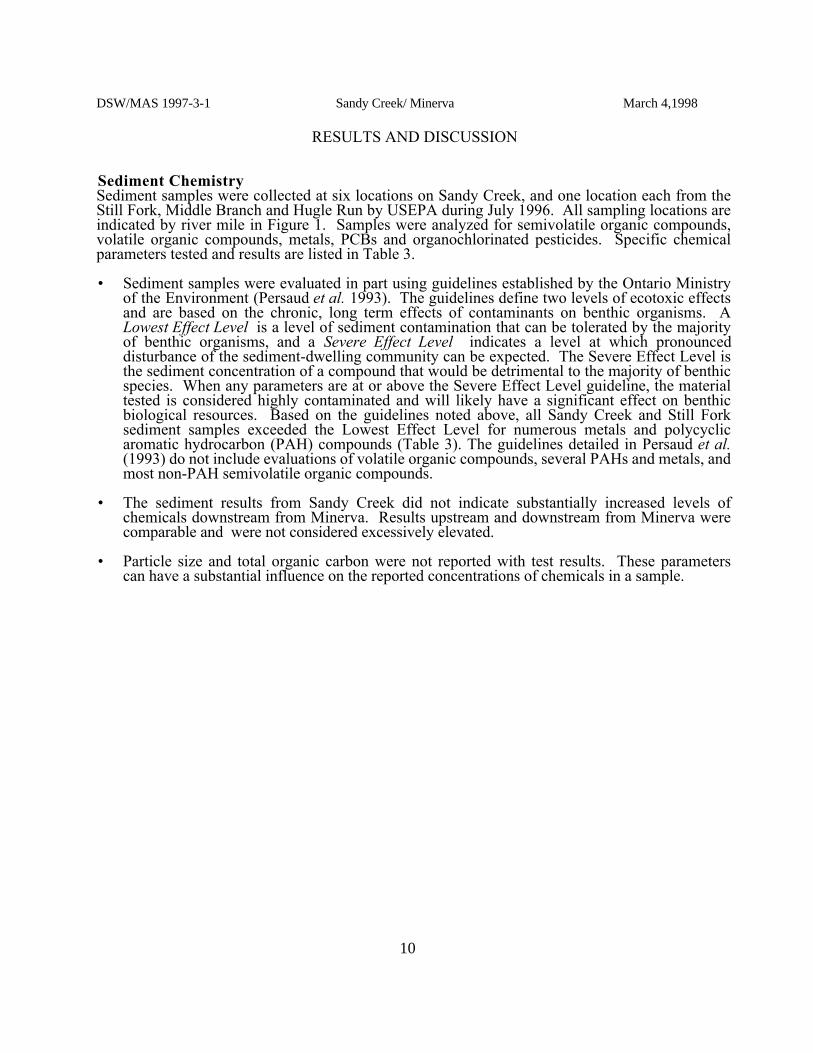
• Sediment and surface water sampling results were not reflective of contaminated conditions.Sediment results upstream and downstream from Minerva were comparable and were notconsidered excessively elevated. Overall water quality of the five surface water samples wasgood, with only fecal coliform from one sample exceeding Ohio’s Water Quality Standards.Continuously recorded dissolved oxygen and conductivity measurements from Sandy Creekwere within acceptable levels; however, a distinct decline in dissolved oxygen and increase inconductivity was noted downstream from the Minerva WWTP. Conductivity is a measure ofthe electrical resistance of water and is associated with the levels of various salts (eg.potassium, chloride, sulfate, calcium) in the water. The higher the level of salts (ionized) inwater, the higher the conductivity.
• A previous study of Sandy Creek conducted in 1993 documented severe biologicaldegradation immediately downstream from the Minerva WWTP. The impact during 1993was primarily related to gross organic enrichment, although the severity of impact coupledwith an observed fish kill suggested periodically lethal conditions downstream from theMinerva WWTP discharge. The condition of the biological communities during 1996,particularly fish communities, suggest that instream water quality conditions have notimproved since 1993, and, in fact, have worsened.
• The highest PCB concentrations in fish occurred in common carp samples from RM 23.5, anarea of Sandy Creek which is lake-like due to past quarrying operations in the stream channeland surrounding floodplain. All three common carp samples collected at RM 23.5 exceededthe Ohio Water Quality Standards for PCBs. Health effects from the consumption of fish fromSandy Creek is being evaluated by the Ohio Department of Health.
RECOMMENDATIONS
• Given the severe impacts observed in Sandy Creek downstream from Minerva and the highlyelevated ammonia-N concentrations in the effluent of the Minerva WWTP prior to 1997, therequirement for ammonia-N limits at the facility should be investigated.
3

DSW/MAS 1997-3-1 Sandy Creek/ Minerva March 4,1998
Table 1. Sampling locations in the Sandy Creek study area, 1996. Type of sampling includedfish community (F), macroinvertebrate community (M), fish tissue (T), sediment (S),surface water chemistry (C) and dissolved oxygen (D).
________________________________________________________________________________
Stream/ Type of USGS 7.5 min.River Mile Sampling Latitude Longitude Landmark County Quad. Map________________________________________________________________________________
Sandy Creek35.4 S 40°44’42” 81°02’06” Augusta Road Columbiana Minerva, OH34.7 F,T 40°44’46” 81°02’37” West Township Park Columbiana Minerva, OH30.5 F,M,T,D,S 40°44’00” 81°05’57” Minerva City Park/ Stark Minerva, OH
US3029.5 F,M,D 40°43’20” 81°06’22” NYC RR Trestle Carroll Minerva, OH29.2 F,M,T 40°43’01” 81°06’29” Ust. Minerva WWTP Carroll Minerva, OH29.0 F,M 40°43’00” 81°06’30” Minerva WWTP mix.zone Carroll Minerva, OH28.9 F,M,D 40°43’00” 81°06’35” Dst. Minerva WWTP Carroll Minerva, OH28.2* F,M,D 40°42’45” 81°07’08” Summitville Tile Carroll Minerva, OH27.8 F,T,S 40°42’51” 81°07’41” State Route 183 Carroll Malvern, OH27.6 S 40°42’51” 81°07’54” Dst. State Route 183 Carroll Malvern, OH25.4* F,M 40°42’06” 81°09’00” Oneida Sand/Gravel Carroll Malvern, OH25.1 T,C,D,S 40°41’58” 81°09’04” Blade Rd. Carroll Malvern, OH24.1 F 40°41’31” 81°09’44” Adj. ColForm Carroll Malvern, OH23.5 T 40°41’31” 81°10’24” Nat. Aggregates Quarry Carroll Malvern, OH23.0 S 40°41’27” 81°10’51” Reed Ave., Malvern Carroll Malvern, OH22.4* F,M,D 40°41’14” 81°11’11” Malvern Ballfields Carroll Malvern, OH22.1 T 40°41’08” 81°11’31” Malvern WWTP Carroll Malvern, OH18.1 D 40°40’17” 81°14’55” Township 369 Stark Malvern, OH17.0 T 40°40’14” 81°15’47” Waynesburg Park/ Stark Waynesburg, OH
Dst. SR 183
Still Fork3.9 S 40°41’51” 81°04’11” Arbor Road Carroll Minerva, OH0.2 T 40°42’54” 81°06’23” Minerva Sportsman Club Carroll Minerva, OH0.1 F,M 40°42’59” 81°06’29” At Mouth Carroll Minerva, OH
Middle Branch2.6 S 40°46’50” 81°04’14” Essick Road Columbiana Homeworth, OH
Hugle Run0.7 S 40°43’10” 81°09’08” Leisure Road Carroll Malvern, OH_______________________________________________________________________________* - fish and/or macroinvertebrate communities resampled during 1997.
4

DSW/MAS 1997-3-1 Sandy Creek/ Minerva March 4,1998
Table 2. Aquatic life use attainment status for the Warmwater Habitat (WWH) use designation ofSandy Creek and the Still Fork based on data collected during June - August, 1996 andAugust - September, 1997.
_______________________________________________________________________________
RIVER MILE Modified Attainment Fish/Invert. IBI Iwb ICI QHEIa Statusb Comment_______________________________________________________________________________Sandy Creek
Erie-Ontario Lake Plain - WWH Use Designation (Existing)199728.2/28.2 28* 6.9* 32ns - PARTIAL Improvement from 199625.4/25.4 30* 6.7* 36 - PARTIAL Improvement from 1996 - /22.4 - - 38 - (FULL) Improvement from 1996
199634.7/- 56 9.5 - 75.5 (FULL) Upstream Minerva30.5/30.7 46 8.9 44 74.0 FULL Downstream TRW- Minerva29.5/29.5 45 8.0 40 84.0 FULL Upstream Minerva WWTP29.2/29.2 35ns 7.1* 40 85.0 PARTIAL Adjacent Minerva WWTP29.0/29.0 27 5.0 22 65.5 NA Minerva WWTP mixing zone28.9/ - 25* 6.1* - 77.5 (NON) Downstream Minerva WWTP28.2/28.2 17* 2.4* 26* 84.0 NON Adj. Summitville Tile27.8/ - 14* 3.5* - NA (NON) State Route 18325.4/25.4 18* 3.7* 34 87.5 NON @ Oneida24.1/ - 12* 3.2* - NA (NON) Adj. Colform22.4/22.4 22* 4.0* 26* 78.0 NON Malvern
Still ForkWestern Allegheny Plateau - WWH Use Designation (Existing)
19960.1/0.1 30* 6.4* 28* 67.5 NON @Mouth, dst. impoundments_______________________________________________________________________________
Ecoregion Biocriteria: Erie-Ontario Lake Plain (EOLP)INDEX WWH EWH MWHc
IBI - Wading 38 50 24MIwb - Wading 7.9 9.4 6.2ICI 34 46 22
Ecoregion Biocriteria: Western Allegheny Plateau (WAP)INDEX WWH EWH MWHc
IBI - Wading 44 50 24/24MIwb - Wading 8.4 9.4 6.2/5.5ICI 36 46 22/30(All criteria from the Ohio WQS: OAC 3745-1-07, Table 7-14)
_______________________________________________________________________________* - Significant departure from ecoregion biocriterion; poor and very poor results are underlined.ns - Nonsignificant departure from ecoregion biocriterion for WWH (≤4 IBI or ICI units; ≤0.5 MIwb units).NA -Biocriteria not applicable in mixing zones.a - Qualitative Habitat Evaluation Index (QHEI) values based on Rankin (1989).b - Attainment status based on one organism group is parenthetically expressed.c - Modified Warmwater Habitat for channel modified areas/ mine affected areas.
5
Sand
y
Creek
Littl
eSa
ndy
Creek
Fork
Still
LakeMohawk
Hug
le
Pipe
Run
Run
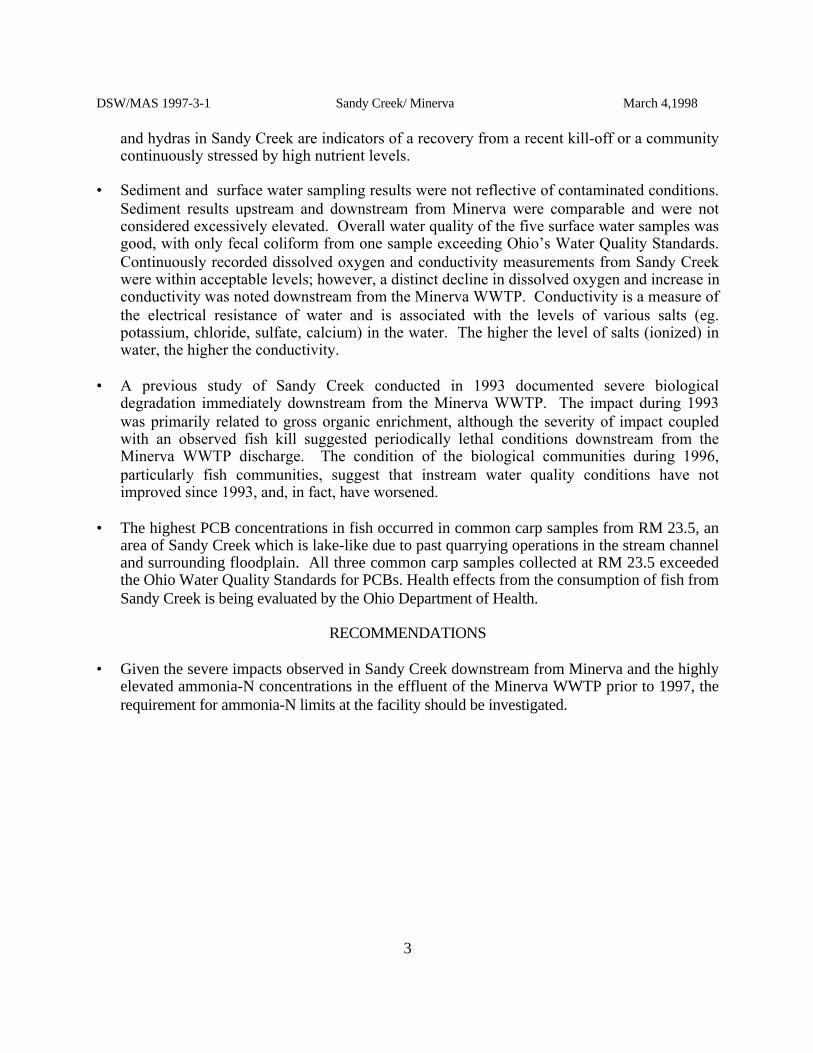
Figure 1. The upper Sandy Creek study area showing principal streams and tributaries, population centers, the Minerva WWTP, and stream sampling locations, 1996 and 1997.
6
Magnolia
Waynesburg
Malvern
MinervaUS 30
34.7
28.2
25.1
29.5
30.5
24.122.1
17.0
29.2
23.5
0.2
22.4
25.4
27.8
MinervaWWTP
28.9 0.1
CARROLL CO.
CO
LU
MB
IAN
A C
O.
ST
AR
K C
O.
TU
SC
AR
AW
AS
CO
.C
AR
RO
LL
CO
.
STARK CO.
SR 1
83
Blade Rd.
N
17.0 Sampling location by river mile, 1996
29.0
* Resampled in 1997
**
*

Sand
y
Creek
Littl
eSa
ndy
Creek
Fork
Still
LakeMohawk
Hug
le
Run
STREAMHABITAT
Sand
y
CreekLi
ttle
Sand
y
Creek
Fork
Still
LakeMohawk
Hug
le
Pipe
Run
Run
7
Figure 2. Biological and stream habitat conditions in the Sandy Creek study area, 1996 and 1997.
22.4
0.1
NARRATIVEEVALUATION
EXCEPTIONAL
GOODMARGINALLY GOODFAIR
VERY GOOD
FAIR-POOR
VERY POORPOOR
Blade Rd.
Magnolia
Waynesburg
Malvern
MinervaUS 30
MinervaWWTP
CARROLL CO.
CO
LU
MB
IAN
A C
O.
ST
AR
K C
O.
TU
SC
AR
AW
AS
CO
.C
AR
RO
LL
CO
.
STARK CO.SR
183
N
29.0
LEGEND
BIOLOGICAL INTEGRITY, 1996
STREAM HABITAT
24.1
25.4
27.8
28.2
29.5
30.5
34.7
29.2
28.9
BIOLOGICAL INTEGRITY, 1997

DSW/MAS 1997-3-1 Sandy Creek/ Minerva March 4,1998
METHODS
All chemical, physical, and biological field, laboratory, data processing, and data analysismethodologies and procedures adhere to those specified in the Manual of Ohio EPA SurveillanceMethods and Quality Assurance Practices (Ohio Environmental Protection Agency 1989a) andBiological Criteria for the Protection of Aquatic Life, Volumes I-III (Ohio EnvironmentalProtection Agency 1987a, 1987b, 1989b, 1989c), and The Qualitative Habitat Evaluation Index(QHEI): Rationale, Methods, and Application (Rankin 1989) for aquatic habitat assessment.Fish and macroinvertebrate communities were sampled during the summer of 1996 at elevenlocations on Sandy Creek from river miles (RM) 34.7 to 22.4 and on the Still Fork at RM 0.1(Table 1, Figure 1). Fish tissue samples were collected from eight sites on Sandy Creek and onelocation on the Still Fork. Sediment samples were collected by USEPA at six locations on SandyCreek, and one location each from the Still Fork, Middle Branch and Hugle Run.Three sites (twofor fish) were resampled in 1997 to assess any change in biological condition following completionof improvements at the Minerva WWTP. Three sites (two for fish) were resampled in 1997 toassess any change in biological condition following completion of improvements at the MinervaWWTP.
Determining Use Attainment StatusThe attainment status of aquatic life uses (i.e., full, partial, and non) is determined by using thebiological criteria codified in the Ohio Water Quality Standards (WQS; Ohio Administrative Code[OAC] 3745-1-07, Table 7-17). The biological community performance measures which are usedinclude the Index of Biotic Integrity (IBI) and Modified Index of Well-Being (MIwb), based onfish community characteristics, and the Invertebrate Community Index (ICI) which is based onmacroinvertebrate community characteristics. The IBI and ICI are multimetric indices patternedafter an original IBI described by Karr (1981) and Fausch et al. (1984). The ICI was developed byOhio EPA (1987b) and further described by DeShon (1995). The MIwb is a measure of fishcommunity abundance and diversity using numbers and weight information and is a modificationof the original Index of Well-Being originally applied to fish community information from theWabash River (Gammon 1976; Gammon et al. 1981).
Performance expectations for the principal aquatic life uses in the Ohio WQS (Warmwater Habitat[WWH], Exceptional Warmwater Habitat [EWH], and Modified Warmwater Habitat [MWH])were developed using the regional reference site approach (Hughes et al. 1986; Omernik 1987).This fits the practical definition of biological integrity as the biological performance of the naturalhabitats within a region (Karr and Dudley 1981). Attainment of the aquatic life use is full if allthree indices (or those available) meet the applicable biocriteria, partial if at least one of the indicesdoes not attain and performance is at least fair, and non-attainment if all indices fail to attain orany index indicates poor or very poor performance. Partial and non-attainment indicate that thereceiving water is impaired and does not meet the designated use criteria specified by the OhioWQS.
Habitat AssessmentPhysical habitat was evaluated using the Qualitative Habitat Evaluation Index (QHEI) developedby the Ohio EPA for streams and rivers in Ohio (Rankin 1989, 1995). Various attributes of thehabitat are scored based on the overall importance of each to the maintenance of viable, diverse,and functional aquatic faunas. The type(s) and quality of substrates, amount and quality ofinstream cover, channel morphology, extent and quality of riparian vegetation, pool, run, and riffledevelopment and quality, and gradient are some of the metrics used to determine the QHEI scorewhich generally ranges from 20 to 100. The QHEI is used to evaluate the characteristics of astream segment, as opposed to the characteristics of a single sampling site. As such, individualsites may have poorer physical habitat due to a localized disturbance yet still support aquaticcommunities closely resembling those sampled at adjacent sites with better habitat, provided
8

DSW/MAS 1997-3-1 Sandy Creek/ Minerva March 4,1998
water quality conditions are similar. QHEI scores from hundreds of segments around the statehave indicated that values greater than 60 are generally conducive to the existence of warmwaterfaunas. Scores greater than 75 frequently typify habitat conditions which have the ability tosupport exceptional warmwater faunas.
Macroinvertebrate Community AssessmentMacroinvertebrates were sampled quantitatively by placing multiple-plate, artificial substratesamplers (modified Hester/Dendy) in stream for a six-week colonization period from July 10 toAugust 22, 1996; in conjunction, a qualitative assessment of the available natural substrates wasconducted at the time of the artificial substrate retrieval. Macroinvertebrate sampling during 1997occurred from August 15 to September 24 using the same methods as described for 1996.
Fish Community AssessmentFish were sampled using the wading method pulsed DC electrofishing gear, used at a frequency ofone or two samples at each site. Fish collections were made at each site from June to August usingpulsed DC electrofishing gear, with sampling distances varying between 140 and 220 meters perlocation. Two fish sites from 1997 were sampled once (September 24) using the same methodsand equipment as described for 1996.
Causal AssociationsUsing the results, conclusions, and recommendations of this report requires an understanding ofthe methodology used to determine the use attainment status and assigning probable causes andsources of impairment. The identification of impairment in rivers and streams is straightforward -the numerical biological criteria are the principal arbiter of aquatic life use attainment andimpairment (partial and non-attainment). The rationale for using the biological criteria in the roleof principal arbiter within a weight of evidence framework has been extensively discussedelsewhere (Karr et al. 1986; Karr 1991; Ohio EPA 1987a,b; Yoder 1989; Miner and Borton 1991;Yoder 1991; Yoder 1995). Describing the causes and sources associated with observedimpairments relies on an interpretation of multiple lines of evidence including water chemistrydata, sediment data, habitat data, effluent data, biomonitoring results, land use data, and thebiological response signatures (Yoder and Rankin 1995) within the biological data itself. Thus theassignment of principal causes and sources of impairment in this report do not represent a true“cause and effect” analysis, but rather represent the association of impairments (based onresponse indicators) with stressor and exposure indicators whose links with the biosurvey dataare based on previous research or experience with analogous situations and impacts. Thereliability of the identification of probable causes and sources is increased where many such priorassociations have been identified. The process is similar to making a medical diagnosis in which adoctor relies on multiple lines of evidence concerning patient health. Such diagnoses are based onprevious research which experimentally or statistically linked symptoms and test results tospecific diseases or pathologies. Thus a doctor relies on previous experience in interpretingsymptoms (i.e., multiple lines from test results) to establish a diagnosis, potential causes and/orsources of the malady, a prognosis, and a strategy for alleviating the symptoms of the disease orcondition. As in medical science, where the ultimate arbiter of success is the eventual recoveryand the well-being of the patient, the ultimate measure of success in water resource management isrestoration of lost or damaged ecosystem attributes including aquatic community structure andfunction. While there have been criticisms of misapplying the metaphor of ecosystem “health”compared to human patient “health” (Suter 1993) here we are referring to the process foridentifying biological integrity and causes/sources associated with observed impairment, notwhether human health and ecosystem health are analogous concepts.
9
DSW/MAS 1997-3-1 Sandy Creek/ Minerva March 4,1998
RESULTS AND DISCUSSION
Sediment ChemistrySediment samples were collected at six locations on Sandy Creek, and one location each from theStill Fork, Middle Branch and Hugle Run by USEPA during July 1996. All sampling locations areindicated by river mile in Figure 1. Samples were analyzed for semivolatile organic compounds,volatile organic compounds, metals, PCBs and organochlorinated pesticides. Specific chemicalparameters tested and results are listed in Table 3.
• Sediment samples were evaluated in part using guidelines established by the Ontario Ministryof the Environment (Persaud et al. 1993). The guidelines define two levels of ecotoxic effectsand are based on the chronic, long term effects of contaminants on benthic organisms. ALowest Effect Level is a level of sediment contamination that can be tolerated by the majorityof benthic organisms, and a Severe Effect Level indicates a level at which pronounceddisturbance of the sediment-dwelling community can be expected. The Severe Effect Level isthe sediment concentration of a compound that would be detrimental to the majority of benthicspecies. When any parameters are at or above the Severe Effect Level guideline, the materialtested is considered highly contaminated and will likely have a significant effect on benthicbiological resources. Based on the guidelines noted above, all Sandy Creek and Still Forksediment samples exceeded the Lowest Effect Level for numerous metals and polycyclicaromatic hydrocarbon (PAH) compounds (Table 3). The guidelines detailed in Persaud et al.(1993) do not include evaluations of volatile organic compounds, several PAHs and metals, andmost non-PAH semivolatile organic compounds.
• The sediment results from Sandy Creek did not indicate substantially increased levels ofchemicals downstream from Minerva. Results upstream and downstream from Minerva werecomparable and were not considered excessively elevated.
• Particle size and total organic carbon were not reported with test results. These parameterscan have a substantial influence on the reported concentrations of chemicals in a sample.
10

DSW/MAS 1997-3-1 Sandy Creek/ Minerva March 4,1998
Table 3. Chemical compounds detected in sediment samples collected by USEPA from SandyCreek, the Middle Branch and the Still Fork, July 17-19, 1996. Measurements in boldexceed the Lowest Effect Level as detailed in Persaud et al. 1993. Parameters exceedingthe Severe Effect Level are indicated by underlined bold numbers. Parameters in italicsdo not have review guidelines established in Persaud et al. 1993.
________________________________________________________________________________
Sandy Creek Sediment(River Mile)
Parameter 35.4 30.4 27.8 27.6 25.1 23.0________________________________________________________________________________
Metals - Total (mg/kg)Aluminum 10,000 3,100 9,800 12,000 2,700 2,800Barium 150 41 99 120 43 40Beryllium 2.2 0.9 1.5 1.8 1.0 1.2Chromium 16 39 19 21 4.8 5.7Cobalt 25 6.6 12 21 5.6 5.6Copper 19 5.5 16 23 7.7 8.5Iron 28,000 17,000 26,000 34,000 20,000 23,000Lead 25 120 33 41 10 20Lithium 24 8.6 20 26 6.3 8Manganese 2,900 500 970 1,700 930 650Mercury 0.2 - - 0.2 0.1 -Nickel 35 13 31 43 13 12Strontium 30 11 13 16 5.8 7.1Titanium 47 16 27 17 16 16Vanadium 23 7.4 20 21 8.4 8.1Zinc 150 45 120 160 58 69
Volatile Organic Compounds (ug/kg) NONE DETECTED
Semivolatile Organic Compounds (ug/kg)4-Methylphenol ND ND ND 350J ND NDNaphthalene 580J ND ND 310J ND ND2-Methylnaphthalene 1,600 ND ND 490J ND NDAcenaphthene 140J ND ND ND ND NDDibenzofuran 530J ND ND 180J ND ND_________________________________________________________________________________
11

DSW/MAS 1997-3-1 Sandy Creek/ Minerva March 4,1998
Table 3. Continued. ________________________________________________________________________________
Sandy Creek Sediment(River Mile)
Parameter 35.4 30.4 27.8 27.6 25.1 23.0________________________________________________________________________________
Semivolatile Organic Compounds (ug/kg)Fluorene 200J ND ND 140J ND NDPhenanthrene 2,700 630 360J 860J ND NDAnthracene 550J 200J 64J ND ND NDDi-n-butylphthalate 310J 130J ND 270J 150J 120JFluoranthene 3,100 1,100 800 1,200J 130J 180JPyrene 2,600 910 640J 940J 110J 150JBenzo(a)anthracene 1,600 460J 340J 420J ND 99JBis(2-ethylhexyl)phthalate 720J 620 800 1,040J 250J 320JDi-n-octylphthalate ND ND 160J 280J ND NDChrysene 1,300 460J 350J 510J ND 90JCarbazole 120J 97J ND ND ND NDBenzo(b)fluoranthene 1,500 560J 400J 550J 84J 120JBenzo(k)fluoranthene 370J 180J 170J 170J ND NDBenzo(a)pyrene 1,030J 360J 270J 320J ND 81JIndeno(1,2,3-cd)pyrene 920J 410J 330J 370J ND 107JBenzo(g,h,i)perylene 710J 340J 260J 310J ND 92JDibenzo(a,h)anthracene 180J ND ND ND ND ND
PCBs (ug/kg) NONE DETECTED
Pesticides (ug/kg)Endosulfan sulfate 235D 6 563D 419D 10 20________________________________________________________________________________
12

DSW/MAS 1997-3-1 Sandy Creek/ Minerva March 4,1998
Table 3. Continued. ________________________________________________________________________________
Still Fork Middle Branch Hugle RunParameter RM 3.9 RM 2.6 RM 0.7________________________________________________________________________________
Metals - Total (mg/kg)Aluminum 12,000 2,200 2,900Barium 120 26 19Beryllium 1.5 0.6 0.5Chromium 18 4.6 3.4Cobalt 12 3.3 2.7Copper 15 5.2 4.3Iron 22,000 11,000 11,000Lead 15 5.7 3.6Lithium 27 4.8 6.4Manganese 980 380 310Mercury 0.3 0.06 -Nickel 22 6.6 8Strontium 17 7.2 3.9Titanium 23 16 10Vanadium 20 5.7 5.9Zinc 92 25 25
Volatile Organic Compounds (ug/kg) NONE DETECTED
Semivolatile Organic Compounds (ug/kg)4-Methylphenol ND ND NDNaphthalene ND ND ND2-Methylnaphthalene ND ND 75JAcenaphthene ND ND NDDibenzofuran ND ND ND_________________________________________________________________________________
13

DSW/MAS 1997-3-1 Sandy Creek/ Minerva March 4,1998
Table 3. Continued. ________________________________________________________________________________
Still Fork Middle Branch Hugle RunParameter RM 3.9 RM 2.6 RM 0.7________________________________________________________________________________
Semivolatile Organic Compounds (ug/kg)Fluorene ND ND NDPhenanthrene ND ND NDAnthracene ND ND NDDi-n-butylphthalate ND ND NDFluoranthene ND ND NDPyrene ND ND NDBenzo(a)anthracene ND ND NDBis(2-ethylhexyl)phthalate ND 160J 720Di-n-octylphthalate ND ND NDChrysene ND ND NDCarbazole ND ND NDBenzo(b)fluoranthene ND ND NDBenzo(k)fluoranthene ND ND NDBenzo(a)pyrene ND ND NDIndeno(1,2,3-cd)pyrene ND ND NDBenzo(g,h,i)perylene ND ND NDDibenzo(a,h)anthracene ND ND ND
PCBs (ug/kg) NONE DETECTED
Pesticides (ug/kg)Endosulfan sulfate ND ND 7________________________________________________________________________________
ND - Not detected.J - Estimated concentration.
14

DSW/MAS 1997-3-1 Sandy Creek/ Minerva March 4,1998
Surface Water Chemistry
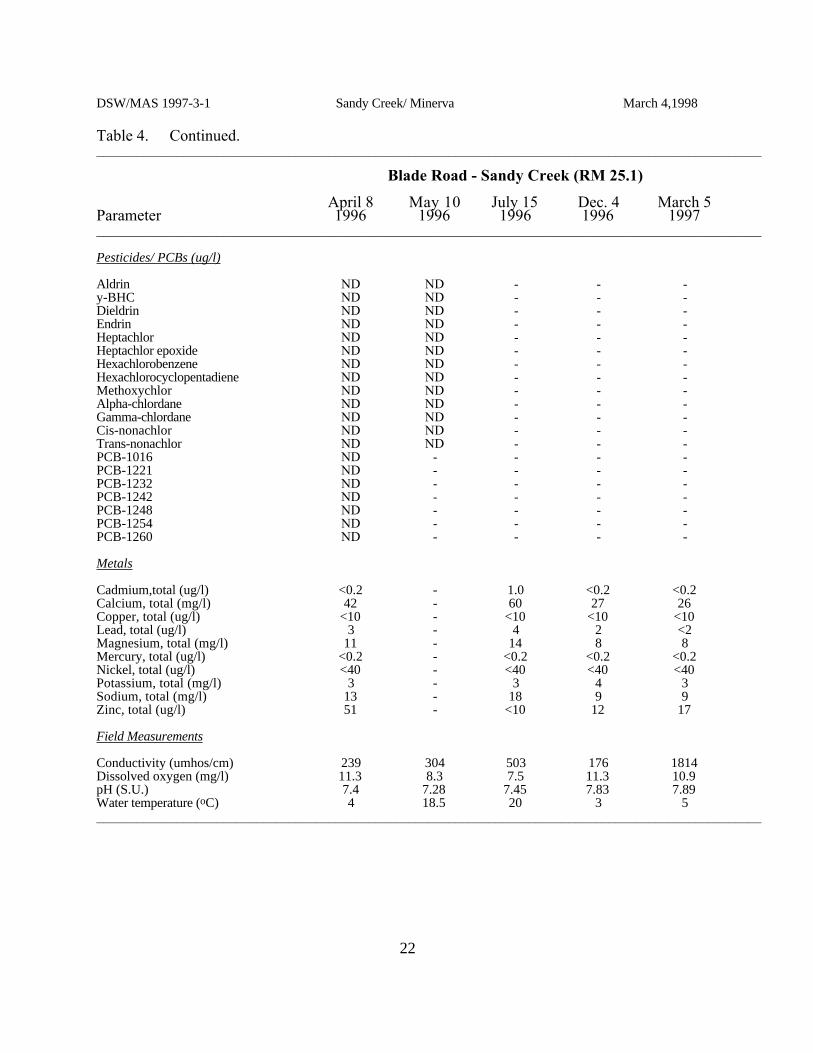
Surface water chemical analyses were conducted on samples collected from Sandy Creek at RM25.1 (Blade Road) during 1996 and 1997. Four samples were collected between April 8 andDecember 4, 1996 and one was collected on March 15, 1997. Four samples were tested for tendifferent metal parameters, two samples were tested for organochlorinated pesticides, and onesample was tested for volatile organic compounds and semivolatile organic compounds. Results ofthese tests are reported in Table 4.
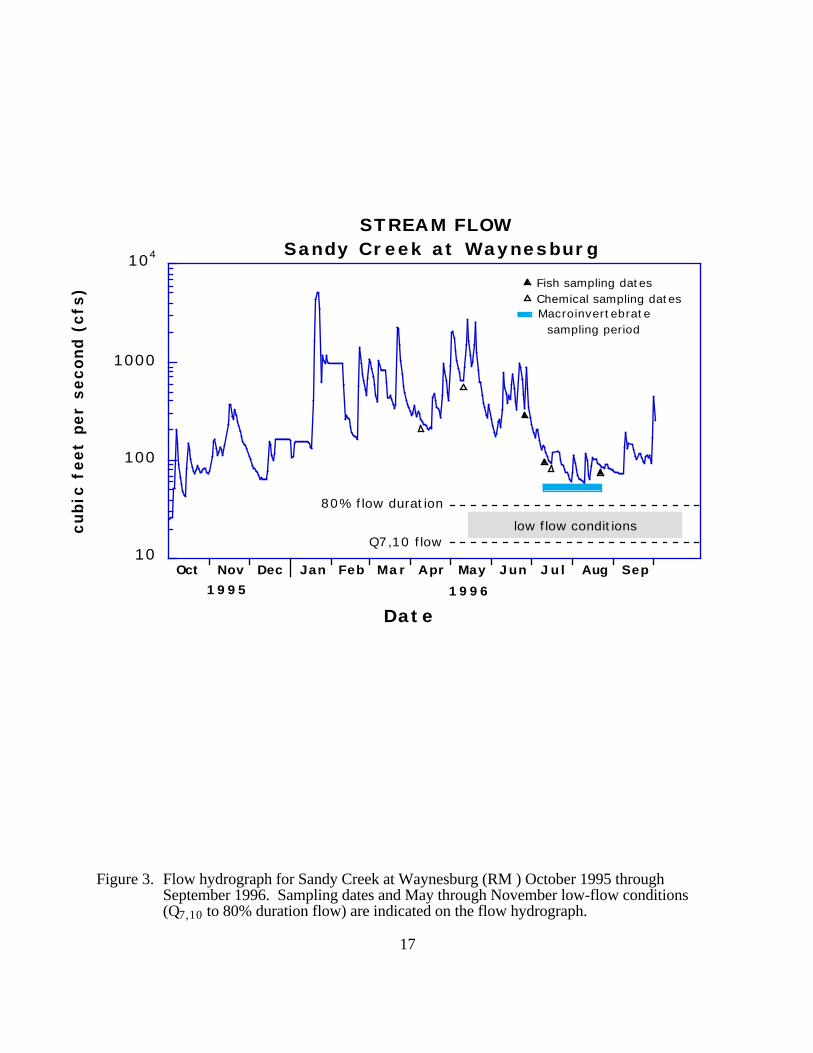
• The daily average flows as reported by the United States Geological Survey for October 1995through September 1996 in Sandy Creek at RM 17.34 are shown in Figure 3. None of thestream flows during the June through September sampling period were less than Q7,10 or 80%flow duration values.
• Overall water quality of the five surface water samples was good, with only fecal coliformfrom one sample exceeding Ohio’s WQS criteria. All other chemical parameters withassociated water quality criteria were within acceptable levels. All PCB, pesticide, volatile andsemivolatile organic compounds tested (143 measurements) were reported by the laboratory asnon-detected. One cadmium value (1.0 ug/l) was elevated above background conditions;however, the concentration was less than the Ohio WQS criterion.
• Continuous dissolved oxygen, pH, and conductivity data were collected at seven locations inSandy Creek from August 27 to 29, 1996 (Figure 4). Exceedances of Ohio WQS criteria werenot detected; however, a distinct decline in dissolved oxygen and a well defined increase inconductivity were noted downstream from the Minerva WWTP and Still Fork confluence.Dissolved oxygen, conductivity, and pH measurements were representative of good waterquality conditions. The data did appear to show distinct but relatively minor influences fromthe Minerva WWTP on the water quality of Sandy Creek.
Pollutant Loadings: 1986 - 1997
The Village of Minerva operates a wastewater treatment plant which provides secondary treatmentof municipal and pretreated industrial wastewater. The plant discharges treated wastewater toSandy Creek at RM 29.08, immediately upstream from the confluence with the Still Fork. Majorimprovements to the Minerva WWTP were completed in September, 1996. The improvementsincluded influent pumps, fine screens, activated sludge aeration with new blowers and fine bubblediffusers, periphery feed circular final clarifiers, U-V disinfection, and effluent flow metering.Additional improvements included converting all abandoned settling tanks to sludge holding anddigestion tanks. The Village is currently planning to install sludge dewatering equipment becausethe sludge can not be land applied due to nickel contamination. The production of a cake sludgewill allow the disposal of the sludge at a nearby landfill. The design flow of the newly improvedWWTP is 0.93 mgd; median effluent flow for 1996 and 1997 was 0.8 and 0.7 mgd, respectively.
Three major industrial contributors to the Minerva WWTP include Mascotech, PCC Airfoils andMinerva Dairy. Mascotech currently discharges all of its wastewater (0.03 mgd) into the Minervasanitary sewers; only stormwater is now discharged to the Still Fork. Prior to 1996, Mascotechdischarged 0.16 mgd of process wastewater to the Still Fork. The process wastewater fromMascotech is regulated by an Indirect Discharge Permit (IDP) issued by the Ohio EPA. The IDPincludes local limits developed by the Village of Minerva. Effluent quality from the Mascotechfacility has substantially improved since 1995, and the facility has demonstrated compliance withthe local limits contained in the IDP. The Minerva Dairy discharges process wastewater into the
15

DSW/MAS 1997-3-1 Sandy Creek/ Minerva March 4,1998
sanitary sewer system. Currently, Minerva Dairy is maintaining reasonable compliance withpretreatment permit limits. The Dairy is planning a significant improvement to their pretreatmentwastewater plant which will allow the dairy to increase production. PCC Airfoil has experiencedspikes in nickel discharged into the Minerva sanitary sewer system. During December 1995, a 24-hour composite sample of the PCC Airfoil discharge revealed a nickel concentration ofapproximately 5.0 mg/l. During the same time period, the Minerva WWTP influent had a nickelconcentration of 0.5 mg/l. Recent improvements in waste stream segregation and pretreatmentfacilities at the PCC Airfoil facility have resulted in below detection readings for nickel in thedischarge to the Minerva sanitary sewer.
A summary of the Minerva WWTP loadings of wastewater to Sandy Creek is depicted in Figures 5and 6.
• Effluent loadings data from the Minerva WWTP revealed highly elevated levels of ammonia-Ndischarged into Sandy Creek from 1986 - 1989 and 1993 - 1996 . Particularly high was theammonia-N third-quarter effluent loading during 1995, with 50th and 95th percentile values of58.9 kg/day and 78.0 kg/day, respectively. The loadings results were based on ammonia-N50th and 95th percentile effluent concentrations of 28.15 mg/l and 33.83 mg/l, respectively.These results revealed that little to no nitrification of effluent was occurring at the MinervaWWTP during 1995. Wastewater improvements completed in 1996 resulted in a substantialdecline in both loadings and concentrations of ammonia-N in the effluent during 1997. Annualloadings of ammonia-N, based on 50th percentile values, declined from 58.9 kg/day in 1995, to28.9 kg/day in 1996, and 1.1 kg/day in 1997. This decline represents a 98 percent reduction inammonia-N loadings to Sandy Creek.
• CBOD5 and TSS loadings data generally revealed a decline between 1986 and 1997, with theexception of highly elevated levels reported during 1993.
• Loadings of total nickel and total zinc did not reveal any consistent trend between 1986 and1996. However, during 1997, total nickel concentrations in the effluent were reported at lessthan lab detection limits, resulting in no appreciable load of nickel into Sandy Creek.
Reports of chemical spills and wild animal kills are also indications of possible impacts due topollutant loadings. Reviews were conducted for discharges and kills to Sandy Creek, Still Fork andother tributary streams to Sandy Creek within the study area as reported by the Ohio EPADivision of Emergency and Remedial Response and the Ohio DNR Division of Wildlife (PollutionInvestigation Reports). Spills and kills are reported in Tables 5 and 6.
• Review of the reported spills revealed little available information, with the latest reported spilloccurring in 1994. Wild animal kills have not been reported since 1993 (during the Ohio EPAsurvey).
16
10
100
1000
104
STREAM FLOWSandy Creek at Waynesburg
Date
cubic
feet
per
second (
cfs
)
Oct Nov Dec Jan Feb Mar Apr May Jun Jul Aug Sep
1995 1996
Fish sampling datesChemical sampling datesMacroinvertebrate
sampling period
80% flow duration
Q7,10 flowlow flow conditions
Figure 3. Flow hydrograph for Sandy Creek at Waynesburg (RM ) October 1995 throughSeptember 1996. Sampling dates and May through November low-flow conditions(Q7,10 to 80% duration flow) are indicated on the flow hydrograph.
17

2
4
6
8
10
12
14
30.6 29.5 28.9 28.4 24.9 24.9 22.3 18.1
DISSOLVED OXYGEN
MG
/L
EWH
WWH
Minerva WWTP
Malvern WWTP
Duplicate
SANDY CREEK
6
6.5
7
7.5
8
8.5
9
9.5
10
30.6 29.5 28.9 28.4 24.9 24.9 22.3 18.1
pH
SU
RIVER MILE
WW
H c
riter
ia r
ange
Duplicate
Malvern WWTPMinerva WWTP
Minerva WWTP
300
400
500
600
700
800
900
30.6 29.5 28.9 28.4 24.9 24.9D 22.3 18.1
CONDUCTIVITY
UM
HO
S/C
M
Duplicate
Malvern WWTP
Figure 4. Boxplots of dissolved oxygen, pH, and conductivity recorded with DatasondeTM continuous monitors at seven locations in Sandy Creek during August 27-29, 1996.The dissolved oxygen criteria for WWH and EWH use designations are indicated byhorizontal lines and the pH criteria range is shaded.
18

DSW/MAS 1997-3-1 Sandy Creek/ Minerva March 4,1998
Table 4. Results of analyses of water samples collected by Ohio EPA from Sandy Creek during1996 and March 1997 at RM 25.1 (Blade Road).
____________________________________________________________________________________________________
Blade Road - Sandy Creek (RM 25.1)
April 8 May 10 July 15 Dec. 4 March 5Parameter 1996 1996 1996 1996 1997____________________________________________________________________________________________________
Semivolatile Organic Compounds (ug/l)
Acenaphthene ND - - - -Acenaphthylene ND - - - -Anthracene ND - - - -Benzo(a)anthracene ND - - - -Benzo(a)pyrene ND - - - -Benzo(b)fluoranthene ND - - - -Benzo(g,h,i)perylene ND - - - -Benzo(k)fluoranthene ND - - - -Bis(2-chloroethoxy) methane ND - - - -Bis(2-chloroethyl) ether ND - - - -Bis(2-chloroisopropyl) ether ND - - - -Bis(2-Ethylhexyl) phthalate ND - - - -4-Bromophenyl phenyl ether ND - - - -Butyl benzyl phthalate ND - - - -4-Chloro-3-methylphenol ND - - - -2-Chloronaphthalene ND - - - -2-Chlorophenol ND - - - -4-Chlorophenyl phenyl ether ND - - - -Chrysene ND - - - -Di-n-butylphthalate ND - - - -Di-n-octyl phthalate ND - - - -Dibenz(a,h)anthracene ND - - - -1,3-Dichlorobenzene ND - - - -1,4-Dichlorobenzene ND - - - -1,2-Dichlorobenzene ND - - - -2,4-Dichlorophenol ND - - - -Diethylphthalate ND - - - -2,4-Dimethylphenol ND - - - -Dimethyl phthalate ND - - - -4,6-Dinitro-2-methylphenol ND - - - -2,4-Dinitrophenol ND - - - -2,6-Dinitrotoluene ND - - - -2,4-Dinitrotoluene ND - - - -Fluoranthene ND - - - -Fluorene ND - - - -Hexachlorobenzene ND - - - -____________________________________________________________________________________________________
19

DSW/MAS 1997-3-1 Sandy Creek/ Minerva March 4,1998
Table 4. Continued.____________________________________________________________________________________________________
Blade Road - Sandy Creek (RM 25.1)
April 8 May 10 July 15 Dec. 4 March 5Parameter 1996 1996 1996 1996 1997____________________________________________________________________________________________________
Semivolatile Organic Compounds (ug/l)
Hexachlorobutadiene ND - - - -Hexachlorocyclopentadiene ND - - - -Hexachloroethane ND - - - -Indeno(1,2,3-cd)pyrene ND - - - -Isophorone ND - - - -N-Nitroso-di-n-propylamine ND - - - -N-Nitrosodiphenylamine ND - - - -Naphthalene ND - - - -Nitrobenzene ND - - - -2-Nitrophenol ND - - - -4-Nitrophenol ND - - - -Pentachlorophenol ND - - - -Phenanthrene ND - - - -Phenol ND - - - -Pyrene ND - - - -1,2,4-Trichlorobenzene ND - - - -2,4,6-Trichlorophenol ND - - - -
Volatile Organic Compounds (ug/l)
Benzene ND - - - -Bromobenzene ND - - - -Bromochloromethane ND - - - -Bromodichloromethane ND - - - -Bromoform ND - - - -Bromomethane ND - - - -N-Butylbenzene ND - - - -Sec-Butylbenzene ND - - - -Tert-Butylbenzene ND - - - -Carbon tetrachloride ND - - - -Chlorobenzene ND - - - -Chloroethane ND - - - -Chloroform ND - - - -Chloromethane ND - - - -2-Chlorotoluene ND - - - -4-Chlorotoluene ND - - - -Dibromochloromethane ND - - - -1,2-Dibromo-3-chloropropane ND - - - -1,2-Dibromoethane ND - - - -___________________________________________________________________________________
20

DSW/MAS 1997-3-1 Sandy Creek/ Minerva March 4,1998
Table 4.Continued.____________________________________________________________________________________________________
Blade Road - Sandy Creek (RM 25.1)
April 8 May 10 July 15 Dec. 4 March 5Parameter 1996 1996 1996 1996 1997____________________________________________________________________________________________________
Volatile Organic Compounds (ug/l)
Dibromomethane ND - - - -1,2-Dichlorobenzene ND - - - -1,3-Dichlorobenzene ND - - - -1,4-Dichlorobenzene ND - - - -Dichlorodifluoromethane ND - - - -1,1-Dichloroethane ND - - - -1,2-Dichloroethane ND - - - -1,1-Dichloroethene ND - - - -Cis-1,2-dichloroethene ND - - - -Trans-1,2-dichloroethene ND - - - -1,2-Dichloropropane ND - - - -1,3-Dichloropropane ND - - - -2,2-Dichloropropane ND - - - -1,1-Dichloropropene ND - - - -Cis-1,3-dichloropropene ND - - - -Trans-1,3-dichloropropene ND - - - -Ethylbenzene ND - - - -Hexachlorobutadiene ND - - - -Isopropylbenzene ND - - - -4-Isopropyltoluene ND - - - -Methylene chloride ND - - - -Naphthalene ND - - - -N-Propylbenzene ND - - - -Styrene ND - - - -1,1,1,2-Tetrachloroethane ND - - - -1,1,2,2-Tetrachloroethane ND - - - -Tetrachloroethene ND - - - -Toluene ND - - - -1,2,3-Trichlorobenzene ND - - - -1,2,4-Trichlorobenzene ND - - - -1,1,1-Trichlorobenzene ND - - - -1,1,2-Trichlorobenzene ND - - - -Trichloroethene ND - - - -Trichlorofluoromethane ND - - - -1,2,3-Trichloropropane ND - - - -1,2,4-Trimethylbenzene ND - - - -1,3,5-Trimethylbenzene ND - - - -Vinyl chloride ND - - - -O-xylene ND - - - -Total m&p-xylenes ND - - - -____________________________________________________________________________________________________
21
DSW/MAS 1997-3-1 Sandy Creek/ Minerva March 4,1998
Table 4. Continued.____________________________________________________________________________________________________
Blade Road - Sandy Creek (RM 25.1)
April 8 May 10 July 15 Dec. 4 March 5Parameter 1996 1996 1996 1996 1997____________________________________________________________________________________________________
Pesticides/ PCBs (ug/l)
Aldrin ND ND - - -y-BHC ND ND - - -Dieldrin ND ND - - -Endrin ND ND - - -Heptachlor ND ND - - -Heptachlor epoxide ND ND - - -Hexachlorobenzene ND ND - - -Hexachlorocyclopentadiene ND ND - - -Methoxychlor ND ND - - -Alpha-chlordane ND ND - - -Gamma-chlordane ND ND - - -Cis-nonachlor ND ND - - -Trans-nonachlor ND ND - - -PCB-1016 ND - - - -PCB-1221 ND - - - -PCB-1232 ND - - - -PCB-1242 ND - - - -PCB-1248 ND - - - -PCB-1254 ND - - - -PCB-1260 ND - - - -
Metals
Cadmium,total (ug/l) <0.2 - 1.0 <0.2 <0.2Calcium, total (mg/l) 42 - 60 27 26Copper, total (ug/l) <10 - <10 <10 <10Lead, total (ug/l) 3 - 4 2 <2Magnesium, total (mg/l) 11 - 14 8 8Mercury, total (ug/l) <0.2 - <0.2 <0.2 <0.2Nickel, total (ug/l) <40 - <40 <40 <40Potassium, total (mg/l) 3 - 3 4 3Sodium, total (mg/l) 13 - 18 9 9Zinc, total (ug/l) 51 - <10 12 17
Field Measurements
Conductivity (umhos/cm) 239 304 503 176 1814Dissolved oxygen (mg/l) 11.3 8.3 7.5 11.3 10.9pH (S.U.) 7.4 7.28 7.45 7.83 7.89Water temperature (oC) 4 18.5 20 3 5____________________________________________________________________________________________________
22

DSW/MAS 1997-3-1 Sandy Creek/ Minerva March 4,1998
Table 4. Continued.____________________________________________________________________________________________________
Blade Road - Sandy Creek (RM 25.1)
April 8 May 10 July 15 Dec. 4 March 5Parameter 1996 1996 1996 1996 1997____________________________________________________________________________________________________
Others
Hardness, total CaCO3 (mg/l) 150 - 207 100 98Alkalinity, total CaCO3 (mg/l) 77 128 44 49Chloride (mg/l) 19 - 26 13 14Nitrate-Nitrite, as N (mg/l) 1.60 1.76 1.00 2.89 2.49Ammonia-nitrogen, as N (mg/l) <0.05 0.06 <0.05 0.22 0.13Total Kjeldahl Nitrogen (mg/l) - 0.5 - - -Phosphorus, total (mg/l) - 0.12 - - -Sulfate, SO4 (mg/l) 74 - 80 50 41Fecal coliform, MF (#/100 ml) - - 3,000* 200 -____________________________________________________________________________________________________
ND - Compound not detected or less than detection limit.* - Indicates an exceedance of the maximum Primary Contact Recreation criterion (set at 2,000 colonies/ 100 ml water).
23

0
50
100
150
200
25019
86
1987
1988
1989
1990
1991
1992
1993
1994
1995
1996
1997
50th percentile95th percentile
CB
OD
5 (kg
/day
)
ANNUAL
0
20
40
60
80
100
120
1986
1987
1988
1989
1990
1991
1992
1993
1994
1995
1996
1997
ANNUAL
50th percentile95th percentile
Am
mon
ia-N
(kg/
day)
0
20
40
60
80
100
1986
1987
1988
1989
1990
1991
1992
1993
1994
1995
1996
1997
THIRD QUARTER
50th percentile95th percentile
Am
mon
ia-N
(kg/
day)
0
5
10
15
20
25
1986
1987
1988
1989
1990
1991
1992
1993
1994
1995
1996
1997
50th percentile95th percentile
Oil
& G
reas
e (k
g/da
y)
ANNUAL
0
50
100
150
200
250
300
350
1986
1987
1988
1989
1990
1991
1992
1993
1994
1995
1996
1997
50th percentile95th percentile
Tot.
Sus
. Sol
ids
(kg/
day)
YEAR
ANNUAL
0
0.5
1
1.5
1986
1987
1988
1989
1990
1991
1992
1993
1994
1995
1996
1997
50th percentile95th percentile
EFF
LUE
NT
FLO
W (M
GD
)
YEAR
ANNUAL
MINERVA WWTP
Figure 5. Annual loadings (kg/day) of ammonia-N, carbonaceous biochemical oxygendemand (cBOD5), oil and grease, total suspended solids, and annual effluentflow from the Minerva WWTP, 1986-1997.
24

0
0.5
1
1.5
2
1986
1987
1988
1989
1990
1991
1992
1993
1994
1995
1996
1997
50th percentile95th percentile
Zinc
- Tot
al (k
g/da
y)YEAR
ANNUAL
0
0.1
0.2
0.3
0.4
0.5
0.6
0.7
1986
1987
1988
1989
1990
1991
1992
1993
1994
1995
1996
1997
50th percentile95th percentile
Nick
el -
Tot
al (
kg/d
ay)
YEAR
ANNUAL
0
5
10
15
20
25
30
35
40
1986
1987
1988
1989
1990
1991
1992
1993
1994
1995
1996
1997
Third Quarter Effluent Concentration
50th percentile95th percentile
Amm
onia
-N (m
g/l)
YEAR
MINERVA WWTP
Figure 6. Annual loadings (kg/day) of total nickel and total zinc, and third-quarterammonia-N concentrations of effluent from the Minerva WWTP, 1986-1997.
25

DSW/MAS 1997-3-1 Sandy Creek/ Minerva March 4,1998
Table 5. Summary of pollutant discharges to Sandy Creek and selected tributaries reported to theOhio EPA Division of Emergency and Remedial Response from 1989 - 1996. Onlyspills to Sandy Creek which occurred from the headwaters to Malvern were included inthis table.
_____________________________________________________________________________
Date Stream Entity Material Amount Units_____________________________________________________________________________
10/31/94 Sandy Creek Unknown Hydrocarbon Unk. Unk.04/14/94 Storm Sewer to Unkefer Trucking Ethylene Glycol Unk. Unk.
Sandy Creek Motor Oil Unk. Unk.10/19/93 Sandy Creek Oneida Sand & Gravel - Unk. Unk.08/27/93 Sandy Creek Minerva WWTP - Unk. Unk.07/27/93 Sandy Creek Snyder Construction - Unk. Unk.06/28/93 Sandy Creek Unknown - Unk. Unk.07/09/92 Sandy Creek Colfor - Unk. Unk.07/28/91 Sandy Creek Harry Green - Unk. Unk.07/22/91 Sandy Creek Buckeye Mining Co. - Unk. Unk.03/29/90 Sandy Creek Summitville Tile - Unk. Unk.01/30/89 Sandy Creek Minerva Dairy - Unk. Unk.
09/09/91 Still Fork Unknown - Unk. Unk.06/11/91 Still Fork Unknown - Unk. Unk.03/29/89 Still Fork Burns Cold Forge - Unk. Unk._____________________________________________________________________________
Table 6. Summary of wild animal kills in Sandy Creek and select tributaries from 1983 - 1996 asreported by the Ohio Department of Natural Resources.
_____________________________________________________________________________
Date Stream Pollutant Number Killed_____________________________________________________________________________
08/27/93* Sandy Creek sewage >10010/15/89 Sandy Creek alkaline wastes 11,06505/25/88 Sandy Creek anhydrous ammonia 7,540
07/17/83 Still Fork coal pile runoff 36,287_____________________________________________________________________________
*Reported by Ohio EPA fish sampling crew.
26

DSW/MAS 1997-3-1 Sandy Creek/ Minerva March 4,1998
Physical Habitat for Aquatic Life
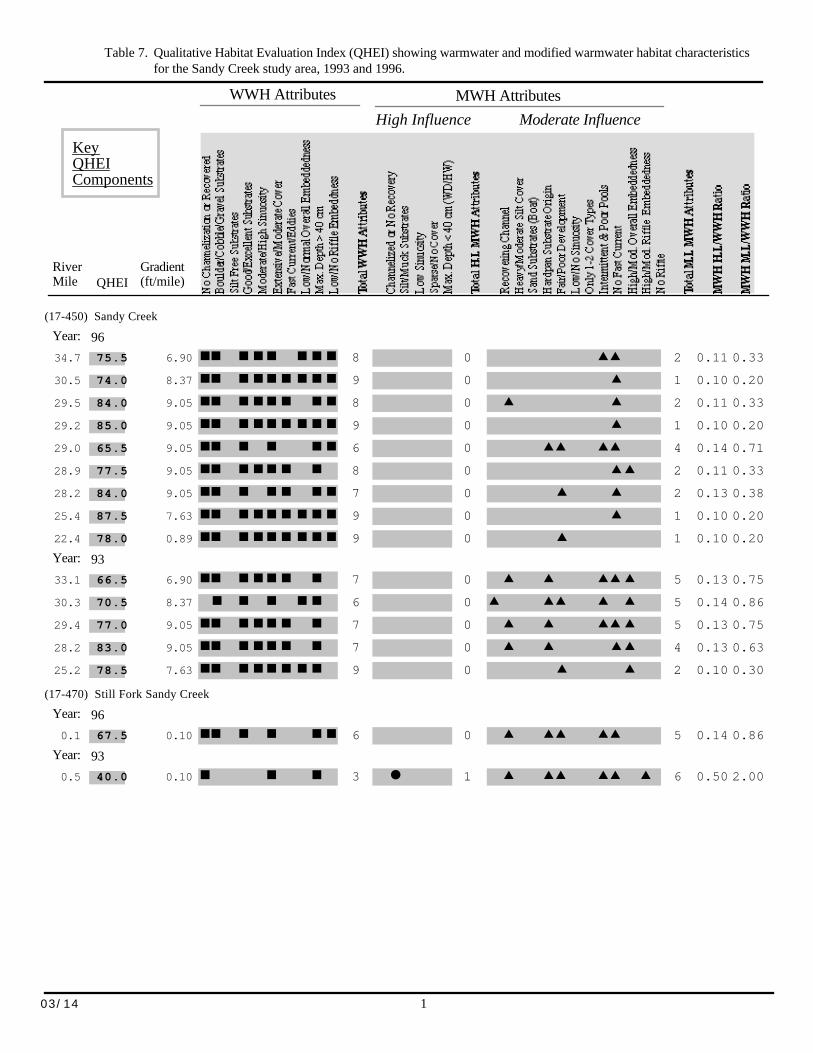
Physical habitat was evaluated in Sandy Creek and the Still Fork at each 1996 biological samplinglocation (excluding RMs 27.8 and 24.1 in Sandy Creek). Qualitative Habitat Evaluation Index(QHEI) scores are detailed in Table 7.
• Stream morphology in Sandy Creek within the study area is free-flowing and consists ofpools interspersed with well developed riffle and run habitats. Bottom substrates arepredominated by cobble and gravel, with lesser amounts of sand. Qualitative HabitatEvaluation Index (QHEI) scores for Sandy Creek within the study area ranged between 74.0and 87.5, with a mean value of 80.7. These scores are indicative of good to excellent streamand riparian habitat and reflect conditions which are easily capable of supporting WWH andprobably EWH stream fish communities.
• Still Fork habitat conditions were evaluated at the mouth (RM 0.1). Gravel and sandpredominated the bottom substrates, with a moderate level of silt covering the bottom andsubstrates showing moderate embeddedness. The sampling station was essentially a largepool, with the one riffle present composed of primarily fractured concrete (an old dam indisrepair). A QHEI score of 67.5 was recorded in the Still Fork at RM 0.1, indicating thepotential to fully support WWH biotas.
27
KeyQHEIComponents
WWH Attributes
QHEI
MWH Attributes
High Influence Moderate Influence
Gradient(ft/mile)
RiverMile
Qualitative Habitat Evaluation Index (QHEI) showing warmwater and modified warmwater habitat characteristicsfor the Sandy Creek study area, 1993 and 1996.
Table 7.
(17-450) Sandy Creek
Year: 96
75.5 ■ ■ ■ ■ ■ ■ ■ ■ 34.7 ▲▲ 6.90 8 0 2 0.11 0.33
74.0 ■ ■ ■ ■ ■ ■ ■ ■ ■ 30.5 ▲ 8.37 9 0 1 0.10 0.20
84.0 ■ ■ ■ ■ ■ ■ ■ ■ 29.5 ▲ ▲ 9.05 8 0 2 0.11 0.33
85.0 ■ ■ ■ ■ ■ ■ ■ ■ ■ 29.2 ▲ 9.05 9 0 1 0.10 0.20
65.5 ■ ■ ■ ■ ■ ■ 29.0 ▲▲ ▲▲ 9.05 6 0 4 0.14 0.71
77.5 ■ ■ ■ ■ ■ ■ ■ 28.9 ▲ 9.05 8 0 2▲ 0.11 0.33
84.0 ■ ■ ■ ■ ■ ■ ■ 28.2 ▲ ▲ 9.05 7 0 2 0.13 0.38
87.5 ■ ■ ■ ■ ■ ■ ■ ■ ■ 25.4 ▲ 7.63 9 0 1 0.10 0.20
78.0 ■ ■ ■ ■ ■ ■ ■ ■ ■ 22.4 ▲ 0.89 9 0 1 0.10 0.20
Year: 93
66.5 ■ ■ ■ ■ ■ ■ ■ 33.1 ▲ ▲ ▲▲ 6.90 7 0 5▲ 0.13 0.75
70.5 ■ ■ ■ ■ ■ 30.3 ▲ ▲▲ ▲ 8.37 6 0 5▲ 0.14 0.86
77.0 ■ ■ ■ ■ ■ ■ ■ 29.4 ▲ ▲ ▲▲ 9.05 7 0 5▲ 0.13 0.75
83.0 ■ ■ ■ ■ ■ ■ ■ 28.2 ▲ ▲ ▲ 9.05 7 0 4▲ 0.13 0.63
78.5 ■ ■ ■ ■ ■ ■ ■ ■ 25.2 ▲ 7.63 9 0 2▲ 0.10 0.30
(17-470) Still Fork Sandy Creek
Year: 96
67.5 ■ ■ ■ ■ ■ ■ 0.1 ▲ ▲▲ ▲▲ 0.10 6 0 5 0.14 0.86
Year: 93
40.0 ■ ■ ■ ● 0.5 ▲ ▲▲ ▲▲ 0.10 3 1 6▲ 0.50 2.00
03/14 1
DSW/MAS 1997-3-1 Sandy Creek/ Minerva March 4,1998
Macroinvertebrate Community
Macroinvertebrate communities were sampled in 1996 at seven locations in Sandy Creek from RM30.7 to RM 22.4 and one location on the Still Fork at RM 0.1 (Table 1). In 1997, sampling wasrepeated at three locations downstream from the Minerva WWTP at RMs 28.2, 25.4, and 22.4. Summarized results from the macroinvertebrate sampling are compiled in Table 8 and Figure 7. ICImetrics and scores and raw data tables by river mile are attached as Appendix Tables 1 and 2. Included in Table 8 and Figure 7 are macroinvertebrate results collected in 1993 by the Ohio EPA. A detailed discussion of the 1993 data is provided in Ohio EPA (1995).
Sandy Creek
• The sampling data, from 1996, showed the presence of macroinvertebrate communities in thevery good range in the upper reach (RMs 30.7 - 29.2) of the study area. ICI scores ranged from44 at the Minerva High School (RM 30.7) to 40 at RM 29.2, just upstream from the MinervaWWTP discharge. These three sites were characterized by moderately high numbers of taxa butrelatively low numbers of pollution sensitive mayflies and caddisflies. High numbers of therelatively pollution sensitive Chironomidae (midge) tribe Tanytarsini were present, comprisingapproximately 60% of the total organisms sampled at each site. The sites had low numbers ofboth pollution tolerant individuals and non-Tanytarsini dipterans and non-insects; both arenegative ICI metrics. All three upstream sites exceeded the WWH ecoregional ICI biocriterion.
• The 1996 Minerva WWTP mixing zone sample (RM 29.0) resulted in an ICI score of 22 (fair). Although mixing zone sites are not measured against the biocriterion, the data provided ameasure of community condition compared with the surrounding conditions. Dipterans,excluding Tanytarsini midges, and non-insects predominated the community making up 95% ofthe total organisms sampled with pollution tolerant individuals comprising 31% of the sample. The more sensitive Tanytarsini midges were almost completely absent.
• The site downstream from the WWTP (near Summitville Tile, RM 28.2), in 1996 showed amacroinvertebrate community in the fair range with an ICI score of 26, well below the WWHecoregional biocriterion of 34. Non-Tanytarsini dipterans and non-insects predominated,comprising 64% of the sample. The site had low numbers of mayflies, caddisflies, andTanytarsini midges. In the stream blackflies were present in extremely large numbers coveringnearly all available structure. The blackfly genus Simulium is considered a pioneer group thatcan quickly move into nutrient degraded systems, reaching large numbers until other taxa canreestablish, competitively check the number of blackflies, and develop a more balanced aquaticcommunity (Ward 1992). In 1997 the community had improved into the marginally good rangewith an ICI score of 32. Non-Tanytarsini dipterans and non-insects still predominated,comprising 72% of the sample. The number of blackflies was greatly reduced and the number ofcaddisflies improved substantially. However, number of mayflies was reduced both in taxapresent and as a percentage of the total sample. The site did not meet the WWH ecoregionalbiocriterion in 1996 but in 1997 was in the range of nonsignificant departure.
• The macroinvertebrates improved in 1996 into the good range (ICI=34) at RM 25.4, 3.6 milesdownstream from the Minerva WWTP discharge. The number of mayfly and caddisfly taxaincreased to seven and five, respectively, though their total numbers were still low. The numberof Tanytarsini midges increased to 20% of the total sample but non-Tanytarsini dipterans andnon-insects still predominated the sample at 66%. Tolerant individuals made up only 0.7% of
29

DSW/MAS 1997-3-1 Sandy Creek/ Minerva March 4,1998
the sample and EPT taxa richness of the qualitative sample increased to 11. Themacroinvertebrate community showed an improvement compared with the site closer to theWWTP but the number of pollution sensitive taxa, as a percent of the total sample, remainedlow. Additionally, community quality continued to be at a level well below what was observedat the sites upstream from the WWTP. In 1997 the ICI score increased slightly to 36. Theoverall diversity improved, the numbers of mayflies and caddisflies increased, and the percent ofnon-Tanytarsini and non-insects was reduced. This site met the WWH ecoregional biocriterionin both 1996 and 1997.
• The site at Malvern (RM 22.4) declined into the fair range with an ICI score of 26 in 1996. Pollution sensitive taxa were low both in the number of taxa present and as a percent of the totalsample. Non-Tanytarsini dipterans and non-insects made up 85% of the sample with theCnidarian genus Hydra comprising 74%. EPT taxa richness of the qualitative sample was lowwith only 8 taxa present. A large part of the decline in the ICI score was attributable to the veryhigh number of hydra, reducing the contribution that other groups made in the proportionalmetrics of the ICI. According to Slobodkin and Bossert (1991), hydras are not tolerant of heavymetals but do tolerate high nutrient levels. In 1997, although overall diversity remained thesame, the ICI score improved to 38. This is a result of the considerable decline in the number ofhydra and a significant increase in the numbers of mayflies and caddisflies. A reasonableexplanation of the high number of hydra at this location is the presence upstream of a sand andgravel quarry located in the stream channel at RM 23.5. In general, hydras eat small open waterplankters, e.g., Cladocera and Copepoda. Cladocerans and copepods are generally only abundantin lotic (running water) systems downstream from the outflow of a lake or impoundment (Hynes1970). This quarry would act as a sink for the processing of nutrients originating from theMinerva WWTP effluent and with the reduced current velocities produce high concentrations ofphytoplankton and associated zooplankton, i.e., protozoa, Rotifera, cladocerans, copepods, andother microcrustaceans. This would provide the food source for the high number of hydra foundin Sandy Creek at this location. Sandy Creek at RM 22.4 did not meet the WWH ecoregionalbiocriterion in 1996 but with the improvement in the macroinvertebrate community in 1997 itexceeded the biocriterion.
Still Fork
• The lower reach of the Still Fork is impounded by two old lowhead dams, which makes theinterpretation of the ICI score somewhat subjective since the current velocity was below therequired minimum velocity for a valid sample. The current velocity over the artificial substrates,when set, was above the minimum velocity (0.3 ft/sec); however, when they were retrieved theflow was lower and the current velocity had dropped below the minimum. The overridingcharacteristic of the sample was the complete predominance of the genus Hydra with 32,160individuals (84% of the sample); this genus along with non-Tanytarsini dipteran and other non-insect taxa, comprised 98% of the sample. There was a good number of caddisfly taxa but theirnumbers made up a very low percentage of the sample. As at the Sandy Creek site at Malvern,the high density of hydras is likely indicative of high nutrient inputs.
30
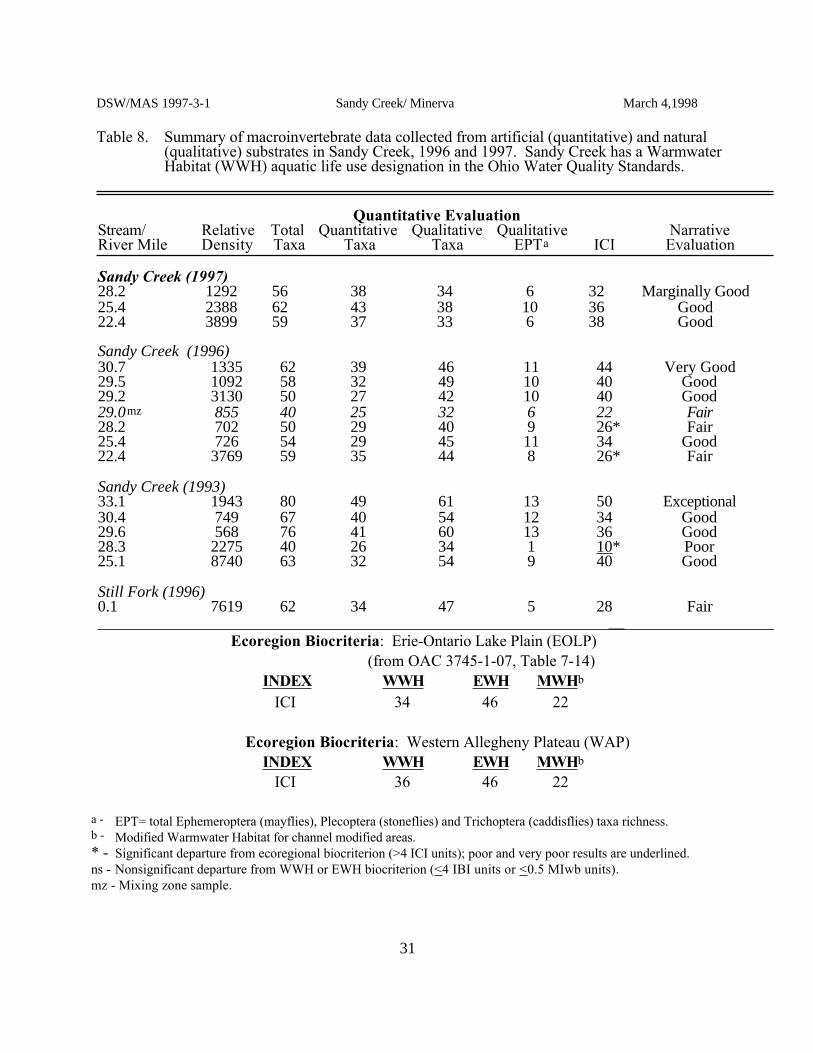
DSW/MAS 1997-3-1 Sandy Creek/ Minerva March 4,1998
Table 8. Summary of macroinvertebrate data collected from artificial (quantitative) and natural(qualitative) substrates in Sandy Creek, 1996 and 1997. Sandy Creek has a WarmwaterHabitat (WWH) aquatic life use designation in the Ohio Water Quality Standards.
Quantitative EvaluationStream/ Relative Total Quantitative Qualitative Qualitative NarrativeRiver Mile Density Taxa Taxa Taxa EPTa ICI Evaluation
Sandy Creek (1997)28.2 1292 56 38 34 6 32 Marginally Good25.4 2388 62 43 38 10 36 Good22.4 3899 59 37 33 6 38 Good
Sandy Creek (1996)30.7 1335 62 39 46 11 44 Very Good29.5 1092 58 32 49 10 40 Good29.2 3130 50 27 42 10 40 Good29.0mz 855 40 25 32 6 22 Fair28.2 702 50 29 40 9 26* Fair25.4 726 54 29 45 11 34 Good22.4 3769 59 35 44 8 26* Fair
Sandy Creek (1993)33.1 1943 80 49 61 13 50 Exceptional30.4 749 67 40 54 12 34 Good29.6 568 76 41 60 13 36 Good28.3 2275 40 26 34 1 10* Poor25.1 8740 63 32 54 9 40 Good
Still Fork (1996)0.1 7619 62 34 47 5 28 Fair __
Ecoregion Biocriteria: Erie-Ontario Lake Plain (EOLP)(from OAC 3745-1-07, Table 7-14)
INDEX WWH EWH MWHb
ICI 34 46 22
Ecoregion Biocriteria: Western Allegheny Plateau (WAP)INDEX WWH EWH MWHb
ICI 36 46 22
a - EPT= total Ephemeroptera (mayflies), Plecoptera (stoneflies) and Trichoptera (caddisflies) taxa richness.b - Modified Warmwater Habitat for channel modified areas.* - Significant departure from ecoregional biocriterion (>4 ICI units); poor and very poor results are underlined.ns - Nonsignificant departure from WWH or EWH biocriterion (<4 IBI units or <0.5 MIwb units).mz - Mixing zone sample.
31
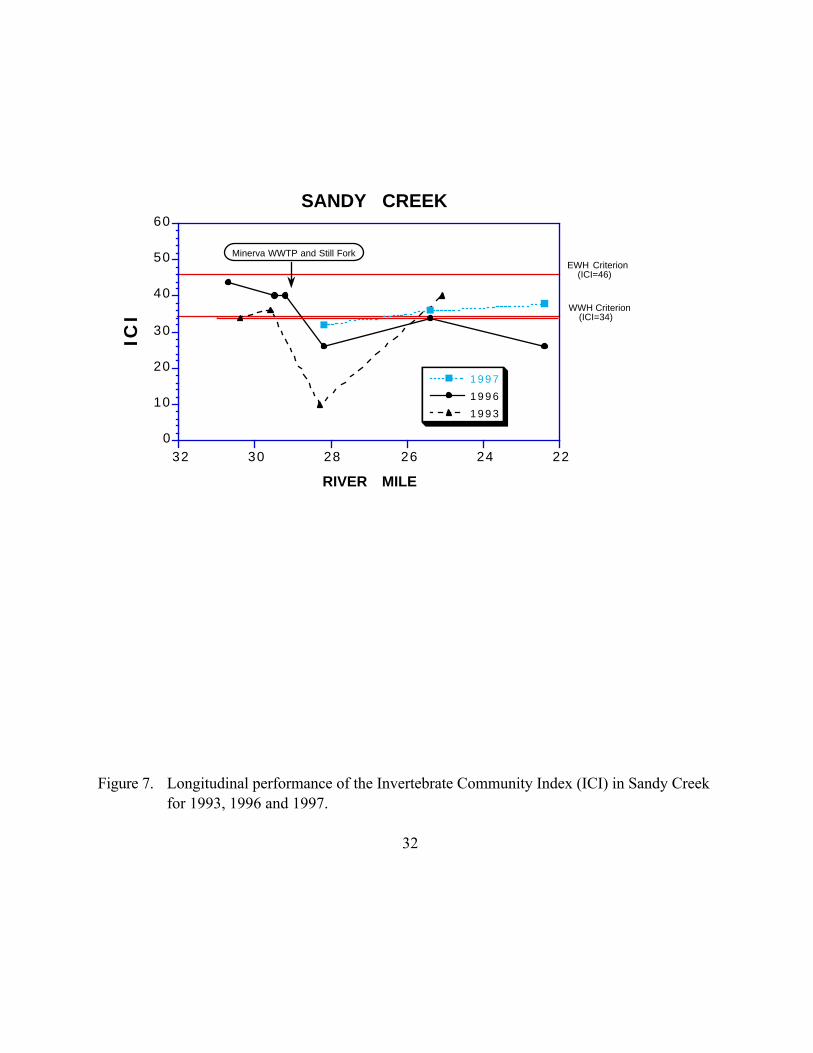
0
10
20
30
40
50
60
222426283032
1997
1996
1993
ICI
RIVER MILE
Minerva WWTP and Still Fork
SANDY CREEK
EWH Criterion (ICI=46)
WWH Criterion (ICI=34)
Figure 7. Longitudinal performance of the Invertebrate Community Index (ICI) in Sandy Creekfor 1993, 1996 and 1997.
32
DSW/MAS 1997-3-1 Sandy Creek/ Minerva March 4,1998
Fish Community
A total of 4,130 fish representing 36 species and four hybrids were collected from Sandy Creekand the Still Fork between June and August, 1996. The sampling effort included a cumulativedistance electrofished of 3.65 km at twelve locations. (Table 9, Figure 8). Two sites wereresampled in 1997. Relative numbers and species collected per location are presented inAppendix Table 3. Sampling locations were evaluated using Warmwater Habitat biocriteria.
Sandy Creek
• The fish communities from the three most upstream sampling locations (RMs 34.5 - 29.5;(West Township Park - East Rochester to NYC RR Trestle - Minerva) exhibited good toexceptional biological condition. The IBI (45 - 56) and MIwb (8.0 - 9.5) scores were good toexceptional and the entire stream reach achieved the applicable biocriteria.
• A decline in the fish community was noted at RM 29.2, an area immediately upstream fromthe Minerva WWTP 001 effluent discharge but influenced by sewage sludge overflows. TheIBI (35) and MIwb (7.1) scores were marginally good to fair, and not fully achieving theappropriate biocriteria. Substantially lower scores were recorded for both indices from thesampling results in July compared to August.
• Fish communities exhibited substantial biological degradation downstream from the MinervaWWTP, where location averaged IBI (12-25) and MIwb (2.5-6.1) scores reflected very poorto fair conditions. Sampling at each location (downstream from the Minerva WWTP) in Juneand July produced extremely low index scores, with IBI (12-14) and MIwb (0.0-4.6) valuesindicating very poor water quality conditions, suggestive of toxic conditions instream. Onestation at RM 28.2 (0.8 miles downstream from the Minerva WWTP) was completelyabsent of fish during the July sampling, indicating acutely toxic conditions. Substantialimprovement in the fish communities downstream from Minerva was noted in late August;however, results were still in the poor to fair range. Sandy Creek downstream from Minerva(RMs 28.9-22.4) was not achieving the applicable biocriteria.
• The fish community sampling results indicate that prior to July, 1996 (and possibly intoJuly, 1996) chemical contaminants were released into Sandy Creek in the vicinity of theMinerva WWTP, causing severely toxic conditions instream.
• Fish community results from 1997 were improved from 1996. Index of Biotic Integrity andMIwb scores from the two sites resampled in 1997 (RMs 28.2 and 25.4) were in the fairrange, a substantial increase from the very poor/poor results documented during 1996.However, the fish community results show that Sandy Creek downstream from the MinveraWWTP still is not achieving the applicable biocriteria.
Still Fork
• The fish community at the mouth of the Still Fork (RM 0.1) exhibited fair biologicalcondition, with an IBI score of 30 and an MIwb score of 6.4. The lack of any well-developed riffles appeared to influence the results in this section of stream.
33

DSW/MAS 1997-3-1 Sandy Creek/ Minerva March 4,1998
Table 9. Fish community summaries based on pulsed D.C. electrofishing sampling conducted by Ohio EPA in Sandy Creekand Still Fork during July and August, 1996 and September, 1997. Additional historical data in presented forSandy Creek and Still Fork from 1993. The number of samples collected at each location is listed with thesampling method. Relative number and weight are per 0.3 km for wading sites. Mixing zone samples are denotedby italics.
_____________________________________________________________________________________________________
Mean MeanMean Mean Modified Index of
Stream Sampling Mean # Total # Relative Relative Index of Biotic Narrative RM Method Species Species Number Weight(kg) QHEI Well Being Integrity Evaluationa
_______________________________________________________________________________________________________
Sandy Creek (1997)28.2 Wading -1 - 21 783 11.87 - 6.9* 28* Fair25.4 Wading -1 - 21 1115 8.60 - 6.7* 30* Fair
Sandy Creek (1996)34.7 Wading-1 - 25 987 16.75 75.5 9.5 56 Exceptional30.5 Wading-2 21.5 25 1322 24.91 74.0 8.9 46 Very Good30.5 (July) 21 884 19.35 8.5 4630.5 (Aug) 22 1761 30.48 9.3 46
29.5 Wading-2 19.5 23 478 8.00 84.0 8.0 45 Good29.5 (July) 19 228 8.71 7.1 4229.5 (Aug) 20 727 7.29 8.9 48
29.2 Wading-2 15.5 20 241 4.31 85.0 7.1* 35ns Fair/Marg. Good29.2 (July) 12 110 2.85 6.2 3029.2 (Aug) 19 372 5.77 7.9 40
29.0mz Wading-2 7.5 11 240 1.95 65.5 5.0 27 Mixing Zone28.9 Wading-2 11.0 17 181 4.05 77.5 6.1* 25* Poor/Fair28.9 (July) 6 41 0.29 4.6 1428.9 (Aug) 16 321 7.81 7.6 36
28.2 Wading-2 5.0 10 47 0.23 84.0 2.4* 17* Very Poor28.2 (July) 0 0 0.00 0.0 1228.2 (Aug) 9 95 0.45 4.8 22
27.8 Wading-1 - 7 19 0.35 - 3.5* 14* Very Poor25.4 Wading-2 5.5 10 94 0.28 87.5 3.7* 18* Very Poor/Poor25.4 (July) 3 6 0.15 1.9 1225.4 (Aug) 8 181 0.42 5.5 24
24.1 Wading-1 - 4 12 0.18 - 3.2* 12* Very Poor22.4 Wading-2 6.5 9 51 0.17 78.0 4.0* 22* Very Poor/Poor22.4 (July) 5 50 0.06 2.7 1422.4 (Aug) 8 52 0.28 5.2 30
Still Fork (1996)0.1 Wading-2 15.5 19 259 7.68 67.5 6.4* 30* Fair0.1 (July) 13 164 1.77 5.8 220.1 (Aug) 18 354 13.59 6.9 38
______________________________________________________________________________________________________
34

DSW/MAS 1997-3-1 Sandy Creek/ Minerva March 4,1998
Table 9. Continued._____________________________________________________________________________________________________
Mean MeanMean Mean Modified Index of
Stream Sampling Mean # Total # Relative Relative Index of Biotic Narrative RM Method Species Species Number Weight(kg) QHEI Well Being Integrity Evaluationa
_______________________________________________________________________________________________________
Sandy Creek (1993)33.1 23.0 28 1463 26.93 66.5 7.6ns 44 Marg. Good/Good30.3 22.0 25 1516 54.37 70.5 9.5 46 V.Good/Exceptional29.4 23.5 28 938 46.08 77.0 8.4 39 Good28.2 13.0 15 494 52.90 83.0 5.5* 23* Poor25.2 20.5 22 385 28.55 78.5 7.0* 33* Fair
Still Fork (1993)
5.7 17.0 20 297 24.55 29.5 7.1* 37* Fair0.5 12.5 13 618 46.56 40.0 7.9* 39ns Fair/Marg. Good_______________________________________________________________________________________________________
Ecoregion Biocriteria: Erie-Ontario Lake Plain (EOLP) (from Ohio Administrative Code 3745-1-07, Table 7-17)
INDEX WWH EWH MWHb
IBI - Wading 38 50 24MIwb - Wading 7.9 9.4 6.2
Ecoregion Biocriteria: Western Allegheny Plateau (WAP)
INDEX WWH EWH MWHb
IBI - Wading 44 50 24MIwb - Wading 8.4 9.4 6.2
______________________________________________________________________________________
* Significant departure from ecoregional biocriteria (>4 IBI units, >0.5 MIwb units); poor and very poor results areunderlined.
ns Nonsignificant departure from biocriterion (<4 IBI units, ≤0.5 MIwb units).a Narrative evaluation is based on MIwb and IBI scores.b Modified Warmwater Habitat for channel modified areas.
35

0
2
4
6
8
10
12
2224262830323436
1997June-July 1996August 19961993
MIw
b
Minerva WWTP and Still Fork
EWH Criterion (MIwb=9.4)
WWH Criterion (MIwb=7.9)
0
10
20
30
40
50
60
2224262830323436
June-July 1996
1993August 1996
1997
IBI
Minerva WWTP and Still Fork
SANDY CREEK
EWH Criterion (IBI=48)
WWH Criterion (IBI=38)
0
5
10
15
20
25
30
2224262830323436
19961993
1997
Fis
h S
pec
ies
(mea
n)
RIVER MILE
Minerva WWTP and Still Fork
Figure 8. Longitudinal trend of the Index of Biotic Integrity (IBI), modified Index of Well-being(MIwb), and number of fish species from Sandy Creek, 1993,1996 and 1997.
36

DSW/MAS 1997-3-1 Sandy Creek/ Minerva March 4,1998
Fish Tissue
Fish tissue samples were collected from eight locations in Sandy Creek and one location in the StillFork during 1996 (Table 1). Whole body and fillet samples representing seven fish species wereanalyzed for PCBs, pesticides, semivolatile organic compounds, metals and percent lipid content(Appendix Tables 5 and 6).
• Percent lipid content was measured in all fish tissue samples collected. Lipids consist of fatsand other substances of similar properties (insoluble in water, soluble in fat solvents, greasy tothe touch). The ability of an organism to bioaccumulate lipophilic (compounds with a strongattraction for fats) organic chemicals is assumed to be proportional to its lipid content (USEPA1993a). Since PCBs are lipophilic and lipid content varies between fish species and betweenindividuals, lipid normalization is appropriate to characterize relative site contamination byPCBs.
• Table 10 and Figure 9 present a site-by-site comparison of lipid-normalized PCBconcentrations, along with the actual total PCB concentration. The highest PCB normalizedconcentrations occur in common carp and white sucker; all largemouth bass samples (3collected) did not have detectable levels of PCBs. Largemouth bass percent lipid contents werethe lowest of all fish samples collected, with values ranging between 0.05% and 0.22%.
• The highest PCB concentrations occurred in common carp samples (fillets, whole body, andnormalized) at RM 23.5, an area of Sandy Creek which is lake-like due to past quarryingoperations in the stream channel and surrounding floodplain. All three common carp samplescollected at RM 23.5 exceeded the Ohio WQS criterion for PCBs (any whole sample of anyrepresentative aquatic organism shall not exceed 640 ug/kg total PCBs, wet weight) .
• All other organic parameters appeared to be at low levels (most were reported as ‘non-detect’)in fish tissue, with detected organochlorine pesticides below screening values (concentrationsof target analytes in fish that are of potential public health concern) recommended by USEPA(1993b).
• Arsenic and nickel measurements in fish tissue samples from Sandy Creek were all less than thelab detection limit. Most cadmium and lead samples were less than lab detection levels: of thedetected values, the maximum cadmium and lead concentrations were 0.08 mg/kg and 0.7mg/kg, respectively. Mercury and selenium were detected in all samples collected. A majorityof the mercury values were detected at concentrations below 0.05 mg/kg and the majority ofselenium concentrations were reported between 0.2 mg/kg and 0.3 mg/kg. All cadmium,mercury and selenium values were below USEPA screening values; arsenic, lead and nickel donot have USEPA screening values developed.
37

DSW/MAS 1997-3-1 Sandy Creek/ Minerva March 4,1998
Table 10. Summary of PCB concentrations in fish tissue samples collected from Sandy Creek andthe Still Fork during 1996. Tissue concentrations are in ug/kg. Underlined valuesexceed Ohio Water Quality Standards Criterion.
_________________________________________________________________________________
River Whole PCB PCB PCB Total PCBsMile Species Fillet Body 1248 1254 1260 PCBs Normalizeda
_________________________________________________________________________________
Sandy Creek34.7 rockbass - √ nd 68 72 140 5134.7 n. hog sucker √ - nd nd nd nd nd34.7 white sucker √ - nd 30 20 50 114
30.5 n. hog sucker √ - nd 67 22 89 18530.5 white sucker √ - nd 72 29 101 224
29.2 white sucker - √ nd 190 69 235 26129.2 white sucker √ - nd 45 21 90 96
27.8 white sucker √ - nd 70 nd 70 5127.8 common carp √ - nd 170 22 192 8227.8 black bullhead - √ nd 33 nd 33 51
25.1 white sucker √ - nd 56 nd 56 37
23.5 white sucker √ - nd 33 nd 33 2523.5 common carp √ - 97 1300 140 1537 24923.5 common carp - √ nd 900 320 1220 11923.5 common carp - √ nd 1800 210 2010 55723.5 bluegill - √ nd 120 110 230 9123.5 largemouth bass √ - nd nd nd nd nd23.5 largemouth bass √ - nd nd nd nd nd
22.1 n. hog sucker √ - nd 26 nd 26 2222.1 white sucker √ - nd 33 nd 33 16
17.0 white sucker √ - nd 21 31 52 3217.0 common carp √ - nd 120 33 153 40
Still Fork0.2 white sucker √ - nd 51 nd 51 380.2 largemouth bass √ - nd nd nd nd nd_________________________________________________________________________________a - Total PCB values are normalized to 1% lipids [(mg PCB/kg)/ % lipid].
38

0
100
200
300
400
500
600
1520253035
Normalized to 1% Lipid
PC
B
Con
cent
ratio
n(u
g/kg
/1%
lip
id)
RIVER MILE
Minerva WWTP Malvern WWTP
0
500
1000
1500
2000
2500
1520253035
SANDY CREEK
FilletWhole body
PC
B
Con
cent
ratio
n(u
g/k
g)
RIVER MILE
Minerva WWTP
Malvern WWTP
Figure 9. Scatter plots of PCB concentrations in fish tissue samples collected fromSandy Creek during 1996. The upper graph depicts actual PCBconcentrations for fillet and whole body samples and the lower graph depictsall samples normalized to 1% lipid.
39

DSW/MAS 1997-3-1 Sandy Creek/ Minerva March 4,1998
TREND ASSESSMENT
Changes in Macroinvertebrate Community Performance: 1993 - 1996, 1997
• The macroinvertebrate community in the upper reach of the study area (RM 29.6/29.5),consistently performed in the good range (1993 ICI = 36, 1996 ICI = 40). Immediatelydownstream from the Minerva WWTP (RM 28.3/28.2), the macroinvertebrate communityimproved from poor (1993 ICI = 10), to fair (1996 ICI = 26), to the good range in 1997 withan ICI score of 32. The macroinvertebrate community in the lower reach (RM 25.1/25.4)declined from an ICI score of 40 in 1993 to an ICI score of 34 in 1996 and improved slightlyto an ICI score of 36 in 1997. Principally, the slight decline was the result of a steep drop innumber of pollution sensitive Tanytarsini midges and a large increase in the number ofblackflies (Simulium sp.) which suggested increased nutrient enrichment. Themacroinvertebrate community at Malvern (RM 22.4) improved from the fair range (ICI = 26)in 1996 to the good range (ICI = 38) in 1997. This change was due primarially to a decline inthe number of Hydra and an increase in the number of cadddisflies.
Changes in Fish Community Performance: 1993 - 1996, 1997
• The fish communities in Sandy Creek between RMs 34.5 and 22.4 were sampled during 1993and 1996. The 1993 sampling revealed fish populations fully attaining the biological criteriaupstream from the Minerva WWTP - sampling downstream documented communities inpartial to non attainment of the WWH biocritera. Fish sampling during 1996 revealed similarresults upstream from the Minerva WWTP, where full biological attainment prevailed.Downstream from the Minerva WWTP, significant degradation of the fish community wasdocumented. The downstream fish communities during 1996 were more severely degradedthan results reported for 1993. Area of Degradation Values (ADV) substantially increasedduring 1996 (Table 13), with 1996 IBI and MIwb ADVs per mile 2.8 to 3.8 times greaterthan from 1993.
• In Sandy Creek downstream from the Minerva WWTP, two sites sampled during 1996 wereresampled in 1997. The 1997 data revealed a substantial improvement in communityperformance. Although the results from 1997 did not achieve the fish biocriteria, thecommunities improved from the very poor/poor range into the fair category.
40

DSW/MAS 1997-3-1 Sandy Creek/ Minerva March 4,1998
Table 13. Area of Degradation (ADV) statistics for Sandy Creek, 1993 and 1996 (calculated usingecoregion biocriteria as the background community performance).
____________________________________________________________________________________
_Biological Index Scores___ ____ADV Statistics_____ _____Attainment Status (miles)_____Stream Upper Lower Mini- Maxi- ADV/ Index RM . RM . mum mum ADV Mile FULL PARTIAL NON Poor/VP____________________________________________________________________________________
Sandy Creek (1993)IBI 23 46 224 28.0MIwb 33.1 25.1 5.5 9.5 209 26.1 3.9 1.3 2.8 1.5ICI 10 50 316 39.5
Sandy Creek (1996)IBI 12 56 974 79.2MIwb 34.7 22.4 2.5 9.5 1229 99.9 5.4 0.3 6.6 6.5ICI 22 44 108 13.0
____________________________________________________________________________________
41
DSW/MAS 1997-3-1 Sandy Creek/ Minerva March 4,1998
REFERENCES
DeShon, J.E. 1995. Development and application of the Invertebrate Community Index (ICI),pp.217-243 (Chapter 15) in W.S. Davis and T. Simon (eds.). Biological Assessment andCriteria: Tools for Water Resource Planning and Decision Making. Lewis Publishers, BocaRaton, Fl.
Fausch, D.O., J.R. Karr, and P.R. Yant. 1984. Regional application of an index of biotic integritybased on stream fish communities. Trans. Amer. Fish. Soc. 113:39-55.
Gammon, J.R. 1976. The fish populations of the middle 340 km of the Wabash River. TechReport No. 86 Purdue University. Water Resources Research Center, West Lafayette, Indiana.73 pp.
Gammon, J.R., A. Spacie, J.L. Hamelink, and R.L. Kaesler. 1981. Role of electrofishing in assessingenvironmental quality of the Wabash River. pp. 307-324. In: Ecological assessments of effluentimpacts on communities of indigenous aquatic organisms. ASTM STP 703, J.M. Bates andC.I.Weber (eds). Philadelphia, PA.
Hughes, R. M., D. P. Larsen, and J. M. Omernik. 1986. Regional reference sites: a method forassessing stream pollution. Env. Mgmt. 10(5): 629-635.
Hynes, H.B.N. 1970. The Ecology of Running Waters. University of Toronto Press, Canada.
Karr, J.R. 1981. Assessment of biotic integrity using fish communities. Fisheries 6 (6): 21-27.
Karr, J.R. and D.R. Dudley. 1981. Ecological perspective on water quality goals. Env. Mgmt. 5(1):55-68.
Karr, J.R., K.D. Fausch, P.L. Angermier, P.R. Yant, and I.J. Schlosser. 1986. Assessing biologicalintegrity in running waters: a method and its rationale. Ill. Nat. Hist. Surv. Spec. Publ. 5. 28pp.
Karr, J.R. 1991. Biological integrity: a long-neglected aspect of water resource management.Ecological Applications 1(1):66-84.
Miner, R. and D. Borton. 1991. Considerations in the development and implementation ofbiocriteria. Pages 115-119 in G.H. Flock (editor). Water Quality Standards for the 21stCentury, Proceedings of a Conference. U.S. Environmental Protection Agency, Office ofScience and Technology, Washington D.C.
Ohio Environmental Protection Agency. 1987a. Biological criteria for the protection of aquatic life:Volume I. The role of biological data in water quality assessment. Division of Water QualityMonitoring and Assessment, Surface Water Section, Columbus, Ohio.
Ohio Environmental Protection Agency. 1987b. Biological criteria for the protection of aquatic life:Volume II. Users manual for biological field assessment of Ohio surface waters. Division ofWater Quality Monitoring and Assessment, Surface Water Section, Columbus, Ohio.
42

DSW/MAS 1997-3-1 Sandy Creek/ Minerva March 4,1998
Ohio Environmental Protection Agency. 1989a. Ohio EPA manual of surveillance methods andquality assurance practices, updated edition. Division of Environmental Services, Columbus,Ohio.
Ohio Environmental Protection Agency. 1989b. Addendum to biological criteria for theprotection of aquatic life, Vol.II: Users manual for biological field assessment of Ohio surfacewaters. Division of Water Quality Planning and Assessment, Surface Water Section,Columbus, Ohio.
Ohio Environmental Protection Agency. 1989c. Biological criteria for the protection of aquaticlife: Volume III. Standardized biological field sampling and laboratory methods for assessingfish and macroinvertebrate communities. Division of Water Quality Planning andAssessment, Columbus, Ohio.
Ohio Environmental Protection Agency. 1990. The use of biological criteria in the Ohio EPAsurface water monitoring and assessment program. Division of Water Qual. Plan. & Assess.,Ecol. Assess. Sect., Columbus, Ohio.
Ohio Environmental Protection Agency. 1992a. DERR sampling guidance, Vol. III. Fieldstandard operating procedures. Division of Emergency and Remedial Response, Columbus,Ohio.
Ohio Environmental Protection Agency. 1995. Biological and water quality study of SandyCreek and Still Fork Sandy Creek. Columbiana, Carroll and Stark Counties, Ohio. Ohio EPATechnical Report EAS/1994-5-4. Columbus, Ohio. 58 pp.
Omernik, J. M. 1987. Ecoregions of the conterminous United States. Ann. Assoc. Amer.Geogr. 77(1): 118-125.
Persaud D., J. Jaagumagi, And A. Hayton. 1993. Guidelines for the protection and managementof aquatic sediment quality in Ontario. Ontario Ministry of the Environment. Toronto.24pp.
Rankin, E. T. 1989. The qualitative habitat evaluation index (QHEI): Rationale, methods, andapplication. Ohio Environmental Protection Agency. Division of Water Quality Planningand Assessment, Ecological Assessment Section, Columbus, Ohio.
Rankin, E.T. 1995. Habitat indices in water resource quality assessments, pp.181-208 (Chapter13) in W.S. Davis and T. Simon (eds.). Biological Assessment and Criteria: Tools for WaterResource Planning and Decision Making. Lewis Publishers, Boca Raton, Fl.
Slobodkin, L.B. and P.E. Bossert. 1991. The freshwater Cnidaria - or Coelenterates, pp.125-144(Chapter 5) in J.H. Thorp and A.P. Covich (eds.). Ecology and Classification of NorthAmerican Freshwater Invertebrates. Academic Press, Inc., San Diego, CA.
43

DSW/MAS 1997-3-1 Sandy Creek/ Minerva March 4,1998
Suter, G.W. 1993. A critique of ecosystem health concepts and indexes. EnvironmentalToxicology and Chemistry, 12: 1533-1539.
United States Environmental Protection Agency. 1993a. Proposed water quality guidance for theGreat Lakes system. 58 Federal Register. pages 20802-21047.
United States Environmental Protection Agency. 1993b. Guidance for assessing chemicalcontaminant data for use in fish advisories. Volume 1 - fish sampling and analysis. EPA 823-R-93-002.
Ward, J.V. 1992. Aquatic Insect Ecology, 1. Biology and Habitat, John Wiley & Sons, Inc. NewYork, NY.
Yoder, C.O. 1989. The development and use of biological criteria for Ohio surface waters. U.S.EPA, Criteria and Standards Div., Water Quality Stds. 21st Century, 1989: 139-146.
Yoder, C. O. 1991. Answering some concerns about biological criteria based on experiences inOhio. In: Gretchin H. Flock, editor. Water quality standards for the 21st century. Proceedingsof a National Conference, U. S. EPA, Office of Water, Washington, D.C.
Yoder, C.O. 1995. Policy issues and management applications of biological criteria, pp.327-343(Chapter 21). in W.S. Davis and T. Simon (eds.). Biological Assessment and Criteria: Toolsfor Water Resource Planning and Decision Making. Lewis Publishers,Boca Raton,Fl.
Yoder, C.O. and E.T. Rankin. 1995. Biological response signatures and the area of degradationvalue: new tools for interpreting multi-metric data, pp.263-286 (Chapter 17). in W.S. Davisand T. Simon (eds.). Biological Assessment and Criteria: Tools for Water Resource Planningand Decision Making. Lewis Publishers, Boca Raton, Fl.
44

DSW/MAS 1997-3-1 Sandy Creek/ Minerva March 4,1998
Appendix Table 1. Raw macroinvertebrate data by river mile for the SandyCreek study area, 1996 and 1997.
45

Collection Date: River Code: River:09/24/97 17-450 Sandy Creek
TaxaCode Taxa Quant/Qual
RM: 28.20
Taxa Quant/QualTaxaCode
Ohio EPA/DSW Monitoring and Assessment SectionMacroinvertebrate Collection
00556 Ephydatia fluviatilis +
01320 Hydra sp 1
01801 Turbellaria +
03121 Paludicella articulata 1
03600 Oligochaeta 28 +
06700 Crangonyx sp 4 +
08260 Orconectes (Crokerinus) sanborniisanbornii
+
08601 Hydracarina 16 +
13400 Stenacron sp +
17200 Caenis sp 21 +
21200 Calopteryx sp +
22001 Coenagrionidae +
22300 Argia sp +
45100 Palmacorixa sp +
45300 Sigara sp +
45400 Trichocorixa sp +
47600 Sialis sp +
52200 Cheumatopsyche sp +
52430 Ceratopsyche morosa group 106 +
52530 Hydropsyche depravata group 153 +
52540 Hydropsyche dicantha 58 +
60300 Dineutus sp +
65800 Berosus sp 1
68601 Ancyronyx variegata 1
68708 Dubiraphia vittata group 1
68901 Macronychus glabratus 5 +
69400 Stenelmis sp 6 +
71900 Tipula sp 2 +
74100 Simulium sp 24 +
74501 Ceratopogonidae 4
77500 Conchapelopia sp 61 +
77750 Hayesomyia senata or Thienemannimyianorena
30
77800 Helopelopia sp 357
78655 Procladius (Holotanypus) sp +
80204 Brillia flavifrons group 46
80310 Cardiocladius obscurus +
80420 Cricotopus (C.) bicinctus 15
80430 Cricotopus (C.) tremulus group 53
81465 Orthocladius (O.) carlatus 106 +
81631 Parakiefferiella n.sp 1 23
81632 Parakiefferiella n.sp 2 38
81825 Rheocricotopus (Psilocricotopus) robacki 15
82141 Thienemanniella xena 8
82220 Tvetenia discoloripes group 8
83040 Dicrotendipes neomodestus 30
83051 Dicrotendipes simpsoni 8
84460 Polypedilum (P.) fallax group 15 +
84888 Xenochironomus xenolabis +
85500 Paratanytarsus sp 8
85800 Tanytarsus sp 8
86401 Atherix lantha 1 +
87540 Hemerodromia sp 27
94400 Fossaria sp +
95100 Physella sp +
96200 Planorbella sp 1
96900 Ferrissia sp 2 +
No. Quantitative Taxa:
No. Qualitative Taxa:
Total Taxa:
ICI: 32
38
34
56
Number of Organisms: Qual EPT: 61292

Collection Date: River Code: River:09/24/97 17-450 Sandy Creek
TaxaCode Taxa Quant/Qual
RM: 25.40
Taxa Quant/QualTaxaCode
Ohio EPA/DSW Monitoring and Assessment SectionMacroinvertebrate Collection
03600 Oligochaeta 116
06201 Hyalella azteca +
06700 Crangonyx sp 12 +
08260 Orconectes (Crokerinus) sanborniisanbornii
+
08601 Hydracarina 24 +
11130 Baetis intercalaris 68 +
11250 Centroptilum sp (w/o hindwing pads) +
12200 Isonychia sp 1
13400 Stenacron sp 2
13561 Stenonema pulchellum 10 +
17200 Caenis sp 231 +
21200 Calopteryx sp 8 +
22300 Argia sp 4 +
23909 Boyeria vinosa +
24900 Gomphus sp +
45300 Sigara sp +
45400 Trichocorixa sp +
47600 Sialis sp +
50804 Lype diversa 88
52200 Cheumatopsyche sp 124 +
52430 Ceratopsyche morosa group 259 +
52440 Ceratopsyche slossonae 40 +
52530 Hydropsyche depravata group 117 +
52540 Hydropsyche dicantha 62 +
56001 Limnephilidae +
65800 Berosus sp +
67750 Sperchopsis tesselatus +
68130 Helichus sp +
68700 Dubiraphia sp 4 +
68901 Macronychus glabratus 22 +
69400 Stenelmis sp 6 +
71900 Tipula sp 3 +
74100 Simulium sp 6 +
77355 Clinotanypus pinguis +
77500 Conchapelopia sp 33
77750 Hayesomyia senata or Thienemannimyianorena
33
77800 Helopelopia sp 132
78450 Nilotanypus fimbriatus 22
80430 Cricotopus (C.) tremulus group 22
80570 Doncricotopus bicaudatus 44
81231 Nanocladius (N.) crassicornus or N. (N.) 22
rectinervus
81270 Nanocladius (N.) spiniplenus 22
81631 Parakiefferiella n.sp 1 11
81825 Rheocricotopus (Psilocricotopus) robacki 198
82200 Tvetenia bavarica group 11
82300 Xylotopus par +
82730 Chironomus (C.) decorus group +
84460 Polypedilum (P.) fallax group 66 +
84540 Polypedilum (Tripodura) scalaenum group +
85500 Paratanytarsus sp 11
85615 Rheotanytarsus distinctissimus group 66
85625 Rheotanytarsus exiguus group 88
85800 Tanytarsus sp 132 +
85802 Tanytarsus curticornis group +
85814 Tanytarsus glabrescens group 22
85840 Tanytarsus guerlus group 33
86100 Chrysops sp +
86401 Atherix lantha +
87540 Hemerodromia sp 66
95100 Physella sp 119
96264 Planorbella (Pierosoma) pilsbryi 1
96900 Ferrissia sp 27
No. Quantitative Taxa:
No. Qualitative Taxa:
Total Taxa:
ICI: 36
43
38
62
Number of Organisms: Qual EPT: 102388

Collection Date: River Code: River:09/24/97 17-450 Sandy Creek
TaxaCode Taxa Quant/Qual
RM: 22.40
Taxa Quant/QualTaxaCode
Ohio EPA/DSW Monitoring and Assessment SectionMacroinvertebrate Collection
01320 Hydra sp 1144
01801 Turbellaria +
03121 Paludicella articulata 7 +
03360 Plumatella sp 5
03600 Oligochaeta 66 +
05800 Caecidotea sp +
06201 Hyalella azteca 3 +
06700 Crangonyx sp +
08260 Orconectes (Crokerinus) sanborniisanbornii
+
08601 Hydracarina 256
13400 Stenacron sp +
13561 Stenonema pulchellum 6
17200 Caenis sp 324 +
21200 Calopteryx sp +
22001 Coenagrionidae 4 +
24900 Gomphus sp +
27500 Somatochlora sp +
45100 Palmacorixa sp +
45300 Sigara sp +
47600 Sialis sp +
50804 Lype diversa 26
52200 Cheumatopsyche sp 629 +
52430 Ceratopsyche morosa group 572 +
52530 Hydropsyche depravata group 126 +
52540 Hydropsyche dicantha 126
56001 Limnephilidae +
59100 Ceraclea sp 2
60300 Dineutus sp +
60900 Peltodytes sp +
63300 Hydroporus sp +
64050 Liodessus sp +
65800 Berosus sp 2 +
68901 Macronychus glabratus 4
69400 Stenelmis sp +
70600 Antocha sp 1
74100 Simulium sp +
77750 Hayesomyia senata or Thienemannimyianorena
33
77800 Helopelopia sp 47
80430 Cricotopus (C.) tremulus group 2
81231 Nanocladius (N.) crassicornus or N. (N.)rectinervus
12
81240 Nanocladius (N.) distinctus 2
81465 Orthocladius (O.) carlatus 12
81650 Parametriocnemus sp +
81825 Rheocricotopus (Psilocricotopus) robacki 36
83840 Microtendipes pedellus group 2
84300 Phaenopsectra obediens group 2
84460 Polypedilum (P.) fallax group 2
85500 Paratanytarsus sp 2
85615 Rheotanytarsus distinctissimus group 9
85625 Rheotanytarsus exiguus group 156 +
85800 Tanytarsus sp 9
85814 Tanytarsus glabrescens group 2
85840 Tanytarsus guerlus group 5
86401 Atherix lantha 1 +
87540 Hemerodromia sp 192
95100 Physella sp +
96264 Planorbella (Pierosoma) pilsbryi +
96900 Ferrissia sp 70
98600 Sphaerium sp +
No. Quantitative Taxa:
No. Qualitative Taxa:
Total Taxa:
ICI: 38
37
33
59
Number of Organisms: Qual EPT: 63899

Collection Date: River Code: River:08/22/96 17-450 Sandy Creek
TaxaCode Taxa Quant/Qual
RM: 30.70
Taxa Quant/QualTaxaCode
Ohio EPA/DSW Monitoring and Assessment SectionMacroinvertebrate Collection
01320 Hydra sp 8
03600 Oligochaeta 8
06700 Crangonyx sp +
08260 Orconectes (Crokerinus) sanborniisanbornii
+
08601 Hydracarina 4
11120 Baetis flavistriga 21 +
11130 Baetis intercalaris 123 +
13400 Stenacron sp 103 +
13540 Stenonema mediopunctatum 69 +
13561 Stenonema pulchellum 161 +
17200 Caenis sp 37 +
18600 Ephemera sp +
21200 Calopteryx sp 1
22001 Coenagrionidae 4
23909 Boyeria vinosa +
45100 Palmacorixa sp +
47600 Sialis sp 1 +
52200 Cheumatopsyche sp 148 +
52430 Ceratopsyche morosa group 170 +
52530 Hydropsyche depravata group 5 +
57900 Pycnopsyche sp +
60300 Dineutus sp +
63900 Laccophilus sp +
68708 Dubiraphia vittata group +
68901 Macronychus glabratus 9 +
69400 Stenelmis sp 4 +
70600 Antocha sp 1
71900 Tipula sp +
74100 Simulium sp 28 +
77500 Conchapelopia sp 33 +
77750 Hayesomyia senata or Thienemannimyianorena
67 +
77800 Helopelopia sp 100
78450 Nilotanypus fimbriatus 33 +
78650 Procladius sp +
80310 Cardiocladius obscurus +
80370 Corynoneura lobata 48
80420 Cricotopus (C.) bicinctus +
80430 Cricotopus (C.) tremulus group +
80440 Cricotopus (C.) trifascia group +
80750 Eukiefferiella devonica group +
81825 Rheocricotopus (Psilocricotopus) robacki 133
82141 Thienemanniella xena 8
82220 Tvetenia discoloripes group +
82820 Cryptochironomus sp +
83820 Microtendipes "caelum" (sensu Simpson &Bode, 1980)
33 +
83840 Microtendipes pedellus group +
84300 Phaenopsectra obediens group 133 +
84450 Polypedilum (P.) convictum 766 +
84460 Polypedilum (P.) fallax group 333
84470 Polypedilum (P.) illinoense 67
85261 Cladotanytarsus vanderwulpi group Type 1 +
85500 Paratanytarsus sp +
85615 Rheotanytarsus distinctissimus group 33
85625 Rheotanytarsus exiguus group 3430 +
85800 Tanytarsus sp 200 +
85802 Tanytarsus curticornis group 100 +
85814 Tanytarsus glabrescens group 200
86100 Chrysops sp +
87540 Hemerodromia sp 32 +
93200 Hydrobiidae +
95100 Physella sp 4
96900 Ferrissia sp 19
No. Quantitative Taxa:
No. Qualitative Taxa:
Total Taxa:
ICI: 44
39
46
62
Number of Organisms: Qual EPT: 116677

Collection Date: River Code: River:08/22/96 17-450 Sandy Creek
TaxaCode Taxa Quant/Qual
RM: 29.50
Taxa Quant/QualTaxaCode
Ohio EPA/DSW Monitoring and Assessment SectionMacroinvertebrate Collection
01320 Hydra sp 4
03600 Oligochaeta +
06700 Crangonyx sp +
08260 Orconectes (Crokerinus) sanborniisanbornii
+
08601 Hydracarina 24 +
11120 Baetis flavistriga 4 +
11130 Baetis intercalaris 12 +
12200 Isonychia sp 4
13400 Stenacron sp 142
13510 Stenonema exiguum 7 +
13540 Stenonema mediopunctatum 12 +
13561 Stenonema pulchellum 92 +
16700 Tricorythodes sp 1
17200 Caenis sp 30 +
21200 Calopteryx sp 4 +
22001 Coenagrionidae +
22300 Argia sp +
23909 Boyeria vinosa 1 +
43300 Ranatra sp +
47600 Sialis sp +
50315 Chimarra obscura +
52200 Cheumatopsyche sp 73 +
52430 Ceratopsyche morosa group 116 +
52530 Hydropsyche depravata group 10 +
67700 Paracymus sp +
68601 Ancyronyx variegata 12 +
68708 Dubiraphia vittata group +
68901 Macronychus glabratus 10 +
69400 Stenelmis sp 5 +
70600 Antocha sp +
71900 Tipula sp +
74100 Simulium sp +
77500 Conchapelopia sp 387 +
77800 Helopelopia sp +
78401 Natarsia species A (sensu Roback, 1978) +
80310 Cardiocladius obscurus +
80420 Cricotopus (C.) bicinctus +
80430 Cricotopus (C.) tremulus group +
80440 Cricotopus (C.) trifascia group +
80470 Cricotopus (C.) or Orthocladius (O.) sp 43
81825 Rheocricotopus (Psilocricotopus) robacki +
82141 Thienemanniella xena 16 +
82220 Tvetenia discoloripes group 43 +
83840 Microtendipes pedellus group +
84450 Polypedilum (P.) convictum 344 +
84460 Polypedilum (P.) fallax group 258 +
84470 Polypedilum (P.) illinoense +
84520 Polypedilum (Tripodura) halterale group +
85500 Paratanytarsus sp 172
85615 Rheotanytarsus distinctissimus group 301
85625 Rheotanytarsus exiguus group 2924 +
85802 Tanytarsus curticornis group 43
85814 Tanytarsus glabrescens group 86
86401 Atherix lantha +
87190 Odontomyia (Catatasina) sp +
87540 Hemerodromia sp 17 +
95100 Physella sp +
96900 Ferrissia sp 265 +
No. Quantitative Taxa:
No. Qualitative Taxa:
Total Taxa:
ICI: 40
32
49
58
Number of Organisms: Qual EPT: 105462

Collection Date: River Code: River:08/21/96 17-450 Sandy Creek
TaxaCode Taxa Quant/Qual
RM: 29.20
Taxa Quant/QualTaxaCode
Ohio EPA/DSW Monitoring and Assessment SectionMacroinvertebrate Collection
06700 Crangonyx sp +
08260 Orconectes (Crokerinus) sanborniisanbornii
+
08601 Hydracarina 36 +
11118 Baetis dubius +
11120 Baetis flavistriga 13
11130 Baetis intercalaris 284 +
13400 Stenacron sp 1 +
13540 Stenonema mediopunctatum 1
13561 Stenonema pulchellum 14 +
17200 Caenis sp +
18750 Hexagenia limbata +
21200 Calopteryx sp +
23909 Boyeria vinosa +
24900 Gomphus sp +
45300 Sigara sp +
47600 Sialis sp +
51600 Polycentropus sp +
52200 Cheumatopsyche sp 210 +
52430 Ceratopsyche morosa group 704 +
52530 Hydropsyche depravata group 430 +
68130 Helichus sp +
68700 Dubiraphia sp +
68901 Macronychus glabratus 38 +
69400 Stenelmis sp 4 +
70600 Antocha sp 16 +
74100 Simulium sp 930 +
77500 Conchapelopia sp 350 +
78450 Nilotanypus fimbriatus 175
78650 Procladius sp +
80310 Cardiocladius obscurus 524 +
80420 Cricotopus (C.) bicinctus +
80430 Cricotopus (C.) tremulus group 699 +
80440 Cricotopus (C.) trifascia group 175 +
81825 Rheocricotopus (Psilocricotopus) robacki 87
82141 Thienemanniella xena 119
82200 Tvetenia bavarica group 87
82730 Chironomus (C.) decorus group +
82820 Cryptochironomus sp +
84300 Phaenopsectra obediens group +
84450 Polypedilum (P.) convictum 1136 +
84460 Polypedilum (P.) fallax group 87 +
85615 Rheotanytarsus distinctissimus group 175
85625 Rheotanytarsus exiguus group 8738 +
85814 Tanytarsus glabrescens group +
85840 Tanytarsus guerlus group +
86401 Atherix lantha +
87540 Hemerodromia sp 569 +
89001 Sciomyzidae +
96900 Ferrissia sp 50
97601 Corbicula fluminea +
No. Quantitative Taxa:
No. Qualitative Taxa:
Total Taxa:
ICI: 40
27
42
50
Number of Organisms: Qual EPT: 1015652

Collection Date: River Code: River:08/21/96 17-450 Sandy Creek
TaxaCode Taxa Quant/Qual
RM: 29.00
Taxa Quant/QualTaxaCode
Ohio EPA/DSW Monitoring and Assessment SectionMacroinvertebrate Collection
03600 Oligochaeta 8
08260 Orconectes (Crokerinus) sanborniisanbornii
+
11130 Baetis intercalaris 4 +
13400 Stenacron sp 2 +
13540 Stenonema mediopunctatum 2
17200 Caenis sp 4 +
45100 Palmacorixa sp +
45300 Sigara sp +
47600 Sialis sp +
52200 Cheumatopsyche sp 5 +
52430 Ceratopsyche morosa group 30 +
52530 Hydropsyche depravata group 19 +
60300 Dineutus sp +
66500 Enochrus sp +
68130 Helichus sp +
68901 Macronychus glabratus 8
69400 Stenelmis sp 8 +
71300 Limonia sp +
72110 Pericoma or Telmatoscopus sp +
74100 Simulium sp 137 +
77500 Conchapelopia sp 1200 +
77800 Helopelopia sp 77 +
80420 Cricotopus (C.) bicinctus 155 +
80430 Cricotopus (C.) tremulus group 581 +
80570 Doncricotopus bicaudatus +
81240 Nanocladius (N.) distinctus 39
81650 Parametriocnemus sp 39
82141 Thienemanniella xena 55
82730 Chironomus (C.) decorus group +
82820 Cryptochironomus sp +
83040 Dicrotendipes neomodestus +
83820 Microtendipes "caelum" (sensu Simpson &Bode, 1980)
+
84300 Phaenopsectra obediens group 39 +
84450 Polypedilum (P.) convictum 155
84460 Polypedilum (P.) fallax group 1084 +
84470 Polypedilum (P.) illinoense 39 +
85625 Rheotanytarsus exiguus group 77
85802 Tanytarsus curticornis group 77 +
87540 Hemerodromia sp 432 +
89704 Limnophora aequifrons +
No. Quantitative Taxa:
No. Qualitative Taxa:
Total Taxa:
ICI: 22
25
32
40
Number of Organisms: Qual EPT: 64276

Collection Date: River Code: River:08/21/96 17-450 Sandy Creek
TaxaCode Taxa Quant/Qual
RM: 28.20
Taxa Quant/QualTaxaCode
Ohio EPA/DSW Monitoring and Assessment SectionMacroinvertebrate Collection
01320 Hydra sp 216
06700 Crangonyx sp +
08260 Orconectes (Crokerinus) sanborniisanbornii
+
08601 Hydracarina 88
11118 Baetis dubius +
11120 Baetis flavistriga 22 +
11130 Baetis intercalaris 490 +
13400 Stenacron sp 10 +
13561 Stenonema pulchellum 20 +
17200 Caenis sp 8 +
21001 Calopterygidae 8
22001 Coenagrionidae 8 +
23804 Basiaeschna janata +
42700 Belostoma sp +
43300 Ranatra sp +
45100 Palmacorixa sp +
45300 Sigara sp +
45900 Notonecta sp +
47600 Sialis sp +
52200 Cheumatopsyche sp 16 +
52430 Ceratopsyche morosa group 38 +
52530 Hydropsyche depravata group 1
53800 Hydroptila sp 16
59700 Triaenodes sp +
68708 Dubiraphia vittata group +
68901 Macronychus glabratus 37 +
69400 Stenelmis sp +
74100 Simulium sp 602 +
77120 Ablabesmyia mallochi +
77500 Conchapelopia sp 265 +
77800 Helopelopia sp 227 +
78450 Nilotanypus fimbriatus 19
78650 Procladius sp +
80420 Cricotopus (C.) bicinctus +
81231 Nanocladius (N.) crassicornus or N. (N.)rectinervus
19
81270 Nanocladius (N.) spiniplenus 151
82730 Chironomus (C.) decorus group +
82820 Cryptochironomus sp +
82880 Cryptotendipes sp +
83040 Dicrotendipes neomodestus 19 +
84300 Phaenopsectra obediens group 38 +
84450 Polypedilum (P.) convictum 340 +
84460 Polypedilum (P.) fallax group 227
84470 Polypedilum (P.) illinoense +
85625 Rheotanytarsus exiguus group 454 +
85752 Sublettea coffmani 19
85802 Tanytarsus curticornis group 113 +
86401 Atherix lantha +
87540 Hemerodromia sp 32 +
95100 Physella sp 9 +
No. Quantitative Taxa:
No. Qualitative Taxa:
Total Taxa:
ICI: 26
29
40
50
Number of Organisms: Qual EPT: 93512

Collection Date: River Code: River:08/21/96 17-450 Sandy Creek
TaxaCode Taxa Quant/Qual
RM: 25.40
Taxa Quant/QualTaxaCode
Ohio EPA/DSW Monitoring and Assessment SectionMacroinvertebrate Collection
01320 Hydra sp 32
03600 Oligochaeta +
06700 Crangonyx sp 4 +
08260 Orconectes (Crokerinus) sanborniisanbornii
+
08601 Hydracarina 60
11120 Baetis flavistriga 12 +
11130 Baetis intercalaris 350 +
11155 Baetis punctiventris 1
11250 Centroptilum sp (w/o hindwing pads) +
12200 Isonychia sp 1 +
13400 Stenacron sp 6 +
13561 Stenonema pulchellum 3 +
17200 Caenis sp 8 +
21200 Calopteryx sp 4 +
22001 Coenagrionidae 4 +
22300 Argia sp +
23804 Basiaeschna janata +
24900 Gomphus sp +
45100 Palmacorixa sp +
45300 Sigara sp +
47600 Sialis sp +
50804 Lype diversa 8
52200 Cheumatopsyche sp 13 +
52430 Ceratopsyche morosa group 53 +
52530 Hydropsyche depravata group 1
52540 Hydropsyche dicantha 4 +
52570 Hydropsyche simulans +
60300 Dineutus sp +
63900 Laccophilus sp +
65800 Berosus sp +
66500 Enochrus sp +
67750 Sperchopsis tesselatus +
67800 Tropisternus sp +
68601 Ancyronyx variegata 4
68708 Dubiraphia vittata group +
68901 Macronychus glabratus 15 +
69400 Stenelmis sp 1
74100 Simulium sp 1872 +
77500 Conchapelopia sp 84 +
77800 Helopelopia sp +
78650 Procladius sp +
80370 Corynoneura lobata 24
82820 Cryptochironomus sp +
83820 Microtendipes "caelum" (sensu Simpson &Bode, 1980)
+
84450 Polypedilum (P.) convictum 96 +
84460 Polypedilum (P.) fallax group 12 +
84470 Polypedilum (P.) illinoense +
85615 Rheotanytarsus distinctissimus group 72
85625 Rheotanytarsus exiguus group 672 +
86100 Chrysops sp +
86401 Atherix lantha +
87540 Hemerodromia sp 200 +
89800 Lispe sp +
95100 Physella sp 12 +
No. Quantitative Taxa:
No. Qualitative Taxa:
Total Taxa:
ICI: 34
29
45
54
Number of Organisms: Qual EPT: 113628
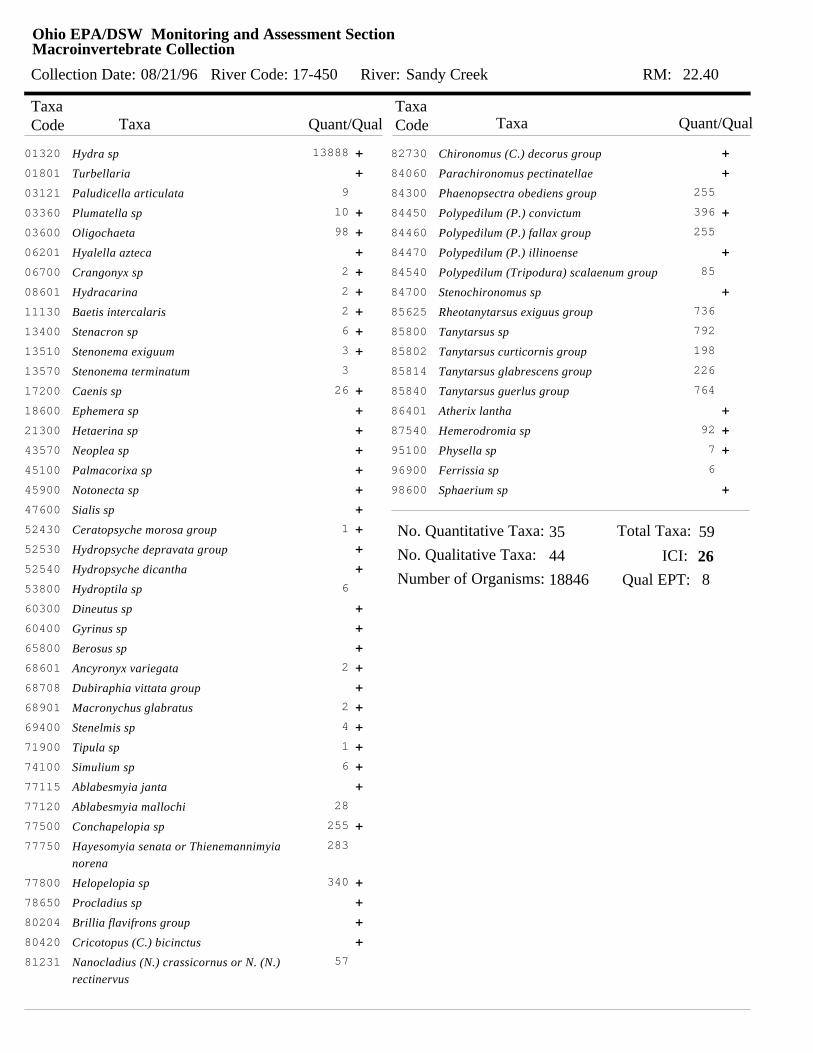
Collection Date: River Code: River:08/21/96 17-450 Sandy Creek
TaxaCode Taxa Quant/Qual
RM: 22.40
Taxa Quant/QualTaxaCode
Ohio EPA/DSW Monitoring and Assessment SectionMacroinvertebrate Collection
01320 Hydra sp 13888 +
01801 Turbellaria +
03121 Paludicella articulata 9
03360 Plumatella sp 10 +
03600 Oligochaeta 98 +
06201 Hyalella azteca +
06700 Crangonyx sp 2 +
08601 Hydracarina 2 +
11130 Baetis intercalaris 2 +
13400 Stenacron sp 6 +
13510 Stenonema exiguum 3 +
13570 Stenonema terminatum 3
17200 Caenis sp 26 +
18600 Ephemera sp +
21300 Hetaerina sp +
43570 Neoplea sp +
45100 Palmacorixa sp +
45900 Notonecta sp +
47600 Sialis sp +
52430 Ceratopsyche morosa group 1 +
52530 Hydropsyche depravata group +
52540 Hydropsyche dicantha +
53800 Hydroptila sp 6
60300 Dineutus sp +
60400 Gyrinus sp +
65800 Berosus sp +
68601 Ancyronyx variegata 2 +
68708 Dubiraphia vittata group +
68901 Macronychus glabratus 2 +
69400 Stenelmis sp 4 +
71900 Tipula sp 1 +
74100 Simulium sp 6 +
77115 Ablabesmyia janta +
77120 Ablabesmyia mallochi 28
77500 Conchapelopia sp 255 +
77750 Hayesomyia senata or Thienemannimyianorena
283
77800 Helopelopia sp 340 +
78650 Procladius sp +
80204 Brillia flavifrons group +
80420 Cricotopus (C.) bicinctus +
81231 Nanocladius (N.) crassicornus or N. (N.)rectinervus
57
82730 Chironomus (C.) decorus group +
84060 Parachironomus pectinatellae +
84300 Phaenopsectra obediens group 255
84450 Polypedilum (P.) convictum 396 +
84460 Polypedilum (P.) fallax group 255
84470 Polypedilum (P.) illinoense +
84540 Polypedilum (Tripodura) scalaenum group 85
84700 Stenochironomus sp +
85625 Rheotanytarsus exiguus group 736
85800 Tanytarsus sp 792
85802 Tanytarsus curticornis group 198
85814 Tanytarsus glabrescens group 226
85840 Tanytarsus guerlus group 764
86401 Atherix lantha +
87540 Hemerodromia sp 92 +
95100 Physella sp 7 +
96900 Ferrissia sp 6
98600 Sphaerium sp +
No. Quantitative Taxa:
No. Qualitative Taxa:
Total Taxa:
ICI: 26
35
44
59
Number of Organisms: Qual EPT: 818846

Collection Date: River Code: River:08/21/96 17-470 Still Fork
TaxaCode Taxa Quan/Qual
RM: 0.10
Taxa Quan/QualTaxaCode
Ohio EPA Monitoring and Assessment SectionMacroinvertebrate Collection
00401 Spongillidae +
01200 Cordylophora lacustris 5
01320 Hydra sp 32160 +
01801 Turbellaria 1
03121 Paludicella articulata 2
03221 Pectinatella magnifica 1
03600 Oligochaeta 71 +
04666 Helobdella triserialis +
06201 Hyalella azteca 23 +
08601 Hydracarina 22 +
13400 Stenacron sp 3 +
17200 Caenis sp 245 +
22001 Coenagrionidae +
22630 Enallagma signatum +
23804 Basiaeschna janata +
27610 Epitheca (Tetragoneuria) cynosura +
28955 Libellula lydia +
45100 Palmacorixa sp +
47600 Sialis sp +
51206 Cyrnellus fraternus 2
52200 Cheumatopsyche sp 92 +
52430 Ceratopsyche morosa group +
53800 Hydroptila sp 16
54200 Orthotrichia sp 4
59570 Oecetis nocturna +
60300 Dineutus sp 1 +
60900 Peltodytes sp +
60910 Peltodytes edentulus +
65800 Berosus sp +
66500 Enochrus sp +
68601 Ancyronyx variegata +
68702 Dubiraphia bivittata +
68708 Dubiraphia vittata group +
68901 Macronychus glabratus 6 +
69400 Stenelmis sp 1
74100 Simulium sp +
74501 Ceratopogonidae 13 +
77120 Ablabesmyia mallochi 43
77130 Ablabesmyia rhamphe group 860 +
77355 Clinotanypus pinguis +
77800 Helopelopia sp +
78650 Procladius sp +
82730 Chironomus (C.) decorus group +
83002 Dicrotendipes modestus +
83050 Dicrotendipes lucifer 473
83051 Dicrotendipes simpsoni 172
83158 Endochironomus nigricans 129 +
83300 Glyptotendipes (G.) sp 1634 +
83820 Microtendipes "caelum" (sensu Simpson &Bode, 1980)
+
84002 Parachironomus n.sp 2 387 +
84010 Parachironomus "abortivus" (sensuSimpson & Bode, 1980)
731 +
84404 Polypedilum (Pentapedilum) n.sp 1 86 +
84450 Polypedilum (P.) convictum 387 +
84460 Polypedilum (P.) fallax group +
84470 Polypedilum (P.) illinoense +
84700 Stenochironomus sp +
85800 Tanytarsus sp 129 +
85814 Tanytarsus glabrescens group 43
85840 Tanytarsus guerlus group 86
95100 Physella sp 208 +
96120 Menetus (Micromenetus) dilatatus 51
96900 Ferrissia sp 10
No. Quantitative Taxa:
No. Qualitative Taxa:
Total Taxa:
ICI: 28
34
47
62
Number of Organisms: Qual EPT: 538097
03/14/97

DSW/MAS 1997-3-1 Sandy Creek/ Minerva March 4,1998
Appendix Table 2. Invertebrate Community Index (ICI) metrics and scoresfor the Sandy Creek study area, 1996 and 1997.
46

RiverMile
DrainageArea
(sq mi)TotalTaxa
MayflyTaxa
CaddisflyTaxa
DipteranTaxa Mayflies
Caddis-flies
Tany-tarsini
OtherDipt/NI
TolerantOrganisms
Qual.EPT
Eco-region ICI
Number of Percent:
Sandy Creek ICI Table
(17-450)
Year: 97
32 28.20 135.0 38(6) 1(0) 3(4) 22(6) 1.6(2) 24.5(6) 1.2(2) 71.5(0) 5.3(4) 6(2) 3 6
36 25.40 162.0 43(6) 5(2) 6(6) 21(6) 13.1(2) 28.9(6) 14.7(2) 41.5(4) 13.7(0) 10(2) 3 0
38 22.40 191.0 37(6) 2(0) 6(6) 19(6) 8.5(2) 38.0(6) 4.7(2) 48.6(2) 3.6(6) 6(2) 3 6
Year: 96
44 30.70 62.0 39(6) 6(4) 3(4) 20(6) 7.7(2) 4.8(2) 59.4(6) 27.8(6) 6.5(4) 11(4) 3 1
40 29.50 63.0 32(4) 9(6) 3(4) 12(2) 5.6(2) 3.6(2) 64.6(6) 25.7(6) 9.6(4) 10(4) 3 0
40 29.20 63.0 27(4) 5(2) 3(4) 15(4) 2.0(2) 8.6(4) 56.9(6) 32.2(4) 0.9(6) 10(4) 3 0
22 29.00 63.0 25(4) 4(2) 3(4) 15(4) 0.3(2) 1.3(2) 3.6(2) 94.5(0) 31.0(0) 6(2) 3 6
26 28.20 135.0 29(4) 5(2) 4(4) 14(4) 15.7(2) 2.0(2) 16.7(2) 64.1(0) 6.7(4) 9(2) 3 9
34 25.40 162.0 29(4) 7(4) 5(6) 8(2) 10.5(2) 2.2(2) 20.5(4) 66.0(0) 0.7(6) 11(4) 3 1
26 22.40 191.0 35(4) 5(2) 2(2) 17(4) 0.2(2) 0.0(2) 14.4(2) 85.3(0) 1.9(6) 8(2) 3 8
Year: 93
34 30.40 62.0 40(6) 7(4) 2(4) 18(4) 19.6(4) 3.7(2) 28.5(4) 46.1(2) 25.5(0) 12(4) 3 2
36 29.60 63.0 41(6) 6(4) 7(6) 18(4) 23.8(4) 2.6(2) 25.3(4) 46.4(2) 25.0(0) 13(4) 3 3
10 28.30 135.0 26(4) 1(0) 0(0) 14(4) 0.0(2) 0.0(0) 0.0(0) 99.8(0) 53.2(0) 1(0) 3 1
40 25.10 162.0 32(4) 4(2) 6(6) 12(4) 0.0(2) 2.5(2) 78.2(6) 19.3(6) 2.1(6) 9(2) 3 9
(17-470)
Year: 96
28 0.10 71.0 34(4) 2(0) 4(6) 14(4) 0.7(2) 0.3(2) 0.7(2) 98.4(0) 1.2(6) 5(2) 4 5
Year: 93
18 0.50 70.0 28(4) 1(0) 4(6) 14(4) 1.0(2) 0.4(2) 0.0(0) 95.3(0) 33.5(0) 3(0) 4 3

DSW/MAS 1997-3-1 Sandy Creek/ Minerva March 4,1998
Appendix Table 3. Summary of relative numbers and weight of fish andspecies collected at each location by river mile sampledin the Sandy Creek area, 1996 and 1997. Relativenumbers are per 0.3 km.
47

1Drain Area:No of Passes:
Date Range: 09/24/97
Species List
# ofFish
River Code: Sample Date:
Sampler Type:
17-450 1 9 9 7
D
Basin:Time Fished:Dist Fished:
Muskingum RiverSandy Creek
0.19 km
Page 1
Number% by
Number Weight% by
WeightAve(gm)Weight
Relative RelativeIBI FeedGrpGuild Tol
BreedGuild
Stream:River Mile: 2 8 . 2 0
135.0 sq mi2288 sec
Name / ODNR StatusSpecies
NORTHERN HOG SUCKER 9 14.21 1.81 40.56 0.58 4.85R I S MWHITE SUCKER 93 146.84 18.75 52.06 7.64 64.38W O S THORNYHEAD CHUB 12 18.95 2.42 7.33 0.14 1.17N I N ICREEK CHUB 67 105.79 13.51 13.19 1.40 11.75N G N TROSYFACE SHINER 2 3.16 0.40 3.00 0.01 0.08N I S ISTRIPED SHINER 64 101.05 12.90 5.87 0.59 4.99N I SCOMMON SHINER 9 14.21 1.81 5.00 0.07 0.60N I SSAND SHINER 4 6.32 0.81 3.00 0.02 0.16N I M MBLUNTNOSE MINNOW 120 189.47 24.19 3.79 0.72 6.05N O C TCENTRAL STONEROLLER 10 15.79 2.02 3.60 0.06 0.48N H NSTRIPED SH X COMMON SH 2 3.16 0.40 19.00 0.06 0.51IROCK BASS 1 1.58 0.20 7.00 0.01 0.09S C CSMALLMOUTH BASS 1 1.58 0.20 26.00 0.04 0.35F C C MLARGEMOUTH BASS 1 1.58 0.20 18.00 0.03 0.24F C CGREEN SUNFISH 4 6.32 0.81 8.75 0.06 0.46S I C TPUMPKINSEED SUNFISH 2 3.16 0.40 7.00 0.02 0.19S I C PLOGPERCH 1 1.58 0.20 20.00 0.03 0.27D I S MGREENSIDE DARTER 28 44.21 5.65 3.93 0.17 1.47D I S MBANDED DARTER 31 48.95 6.25 1.45 0.07 0.60D I S IRAINBOW DARTER 16 25.26 3.23 2.44 0.06 0.52D I S MFANTAIL DARTER 9 14.21 1.81 2.22 0.03 0.27D I CMOTTLED SCULPIN 10 15.79 2.02 4.00 0.06 0.53I C
Mile Total 496Number of SpeciesNumber of Hybrids
21 1
11.87 783.16
Run Date 02/27/98 OEPA Division of Surface Water Ecological Assessment Unit Took 0.3 min

1Drain Area:No of Passes:
Date Range: 09/24/97
Species List
# ofFish
River Code: Sample Date:
Sampler Type:
17-450 1 9 9 7
D
Basin:Time Fished:Dist Fished:
Muskingum RiverSandy Creek
0.20 km
Page 2
Number% by
Number Weight% by
WeightAve(gm)Weight
Relative RelativeIBI FeedGrpGuild Tol
BreedGuild
Stream:River Mile: 2 5 . 4 0
162.0 sq mi3659 sec
Name / ODNR StatusSpecies
NORTHERN HOG SUCKER 5 7.50 0.67 18.80 0.14 1.64R I S MWHITE SUCKER 244 366.00 32.84 13.51 4.95 57.51W O S TBLACKNOSE DACE 25 37.50 3.36 4.04 0.15 1.77N G S TCREEK CHUB 73 109.50 9.83 10.41 1.14 13.26N G N TSTRIPED SHINER 28 42.00 3.77 8.08 0.34 3.94N I SCOMMON SHINER 10 15.00 1.35 2.40 0.04 0.42N I SSAND SHINER 4 6.00 0.54 1.00 0.01 0.07N I M MSILVERJAW MINNOW 1 1.50 0.13 2.00 0.00 0.03N I MBLUNTNOSE MINNOW 160 240.00 21.53 2.93 0.70 8.19N O C TCENTRAL STONEROLLER 67 100.50 9.02 4.69 0.47 5.48N H NROCK BASS 1 1.50 0.13 20.00 0.03 0.35S C CGREEN SUNFISH 1 1.50 0.13 4.00 0.01 0.07S I C TBLUEGILL SUNFISH 3 4.50 0.40 20.00 0.09 1.05S I C PPUMPKINSEED SUNFISH 3 4.50 0.40 13.33 0.06 0.70S I C PLOGPERCH 1 1.50 0.13 18.00 0.03 0.31D I S MJOHNNY DARTER 1 1.50 0.13 2.00 0.00 0.03D I CGREENSIDE DARTER 9 13.50 1.21 1.67 0.02 0.27D I S MBANDED DARTER 1 1.50 0.13 1.00 0.00 0.02D I S IRAINBOW DARTER 7 10.50 0.94 2.00 0.02 0.24D I S MFANTAIL DARTER 1 1.50 0.13 2.00 0.00 0.03D I CMOTTLED SCULPIN 98 147.00 13.19 2.70 0.40 4.62I C
Mile Total 743Number of SpeciesNumber of Hybrids
21 0
8.60 1,114.50
Run Date 02/27/98 OEPA Division of Surface Water Ecological Assessment Unit Took 0.3 min
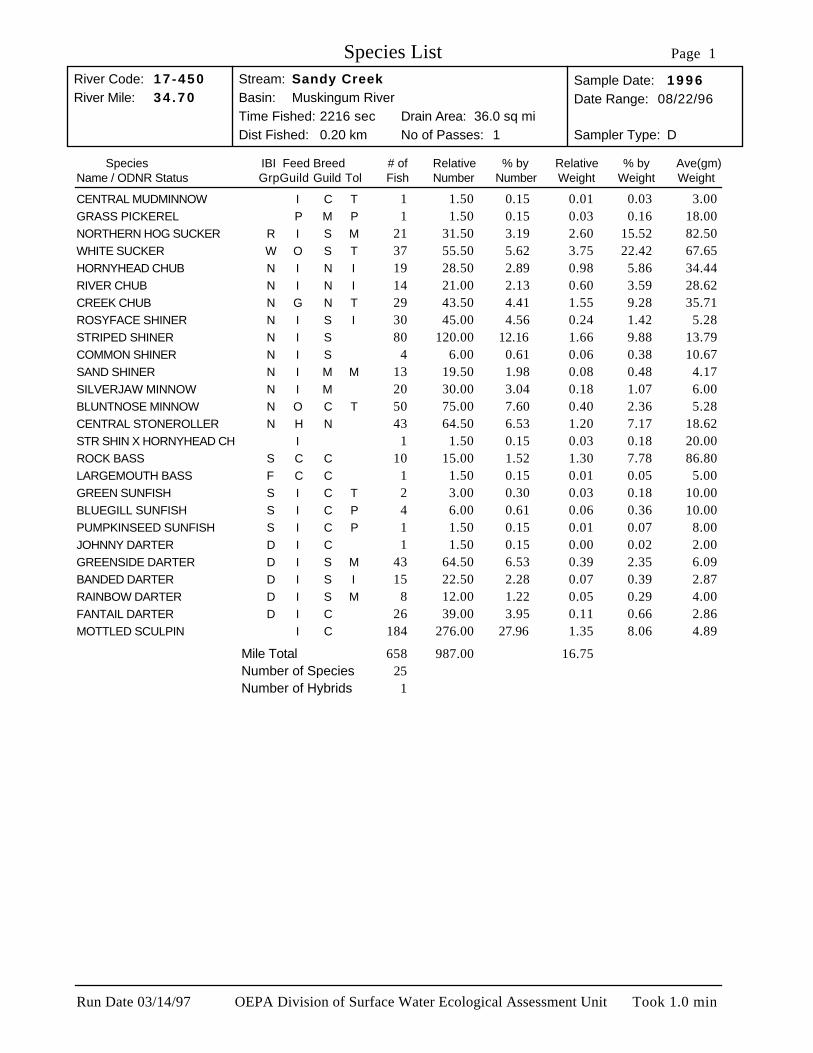
1Drain Area:No of Passes:
Date Range: 08/22/96
Species List
# ofFish
River Code: Sample Date:
Sampler Type:
17-450 1 9 9 6
D
Basin:Time Fished:Dist Fished:
Muskingum RiverSandy Creek
0.20 km
Page 1
Number% by
Number Weight% by
WeightAve(gm)Weight
Relative RelativeIBI FeedGrpGuild Tol
BreedGuild
Stream:River Mile: 3 4 . 7 0
36.0 sq mi2216 sec
Name / ODNR StatusSpecies
CENTRAL MUDMINNOW 1 1.50 0.15 3.00 0.01 0.03I C TGRASS PICKEREL 1 1.50 0.15 18.00 0.03 0.16P M PNORTHERN HOG SUCKER 21 31.50 3.19 82.50 2.60 15.52R I S MWHITE SUCKER 37 55.50 5.62 67.65 3.75 22.42W O S THORNYHEAD CHUB 19 28.50 2.89 34.44 0.98 5.86N I N IRIVER CHUB 14 21.00 2.13 28.62 0.60 3.59N I N ICREEK CHUB 29 43.50 4.41 35.71 1.55 9.28N G N TROSYFACE SHINER 30 45.00 4.56 5.28 0.24 1.42N I S ISTRIPED SHINER 80 120.00 12.16 13.79 1.66 9.88N I SCOMMON SHINER 4 6.00 0.61 10.67 0.06 0.38N I SSAND SHINER 13 19.50 1.98 4.17 0.08 0.48N I M MSILVERJAW MINNOW 20 30.00 3.04 6.00 0.18 1.07N I MBLUNTNOSE MINNOW 50 75.00 7.60 5.28 0.40 2.36N O C TCENTRAL STONEROLLER 43 64.50 6.53 18.62 1.20 7.17N H NSTR SHIN X HORNYHEAD CH 1 1.50 0.15 20.00 0.03 0.18IROCK BASS 10 15.00 1.52 86.80 1.30 7.78S C CLARGEMOUTH BASS 1 1.50 0.15 5.00 0.01 0.05F C CGREEN SUNFISH 2 3.00 0.30 10.00 0.03 0.18S I C TBLUEGILL SUNFISH 4 6.00 0.61 10.00 0.06 0.36S I C PPUMPKINSEED SUNFISH 1 1.50 0.15 8.00 0.01 0.07S I C PJOHNNY DARTER 1 1.50 0.15 2.00 0.00 0.02D I CGREENSIDE DARTER 43 64.50 6.53 6.09 0.39 2.35D I S MBANDED DARTER 15 22.50 2.28 2.87 0.07 0.39D I S IRAINBOW DARTER 8 12.00 1.22 4.00 0.05 0.29D I S MFANTAIL DARTER 26 39.00 3.95 2.86 0.11 0.66D I CMOTTLED SCULPIN 184 276.00 27.96 4.89 1.35 8.06I C
Mile Total 658Number of SpeciesNumber of Hybrids
25 1
16.75 987.00
Run Date 03/14/97 OEPA Division of Surface Water Ecological Assessment Unit Took 1.0 min

2Drain Area:No of Passes:
Date Range: 07/11/9608/22/96
Species List
# ofFish
River Code: Sample Date:
Sampler Type:
17-450 1 9 9 6
D
Basin:Time Fished:Dist Fished:
Muskingum RiverSandy Creek
0.40 km
Page 2
Number% by
Number Weight% by
WeightAve(gm)Weight
Relative Relative
Thru:
IBI FeedGrpGuild Tol
BreedGuild
Stream:River Mile: 3 0 . 5 0
62.0 sq mi5395 sec
Name / ODNR StatusSpecies
NORTHERN HOG SUCKER 78 58.50 4.42 73.96 4.33 17.37R I S MWHITE SUCKER 24 18.00 1.36 72.29 1.30 5.22W O S TCOMMON CARP 1 0.75 0.06 195.00 0.15 0.59G O M THORNYHEAD CHUB 25 18.75 1.42 25.96 0.49 1.95N I N IRIVER CHUB 72 54.00 4.08 19.75 1.07 4.28N I N IBLACKNOSE DACE 1 0.75 0.06 2.00 0.00 0.01N G S TCREEK CHUB 33 24.75 1.87 25.15 0.62 2.50N G N TROSYFACE SHINER 26 19.50 1.47 5.15 0.10 0.40N I S ISTRIPED SHINER 56 42.00 3.18 16.21 0.68 2.73N I SCOMMON SHINER 10 7.50 0.57 16.30 0.12 0.49N I SBLUNTNOSE MINNOW 54 40.50 3.06 5.34 0.22 0.87N O C TCENTRAL STONEROLLER 575 431.25 32.61 23.87 10.30 41.32N H NSTRIPED SH X COMMON SH 7 5.25 0.40 18.00 0.09 0.38IYELLOW BULLHEAD 3 2.25 0.17 81.00 0.18 0.73I C TBROWN BULLHEAD 1 0.75 0.06 250.00 0.19 0.75I C TROCK BASS 14 10.50 0.79 98.79 1.04 4.16S C CSMALLMOUTH BASS 1 0.75 0.06 265.00 0.20 0.80F C C MLARGEMOUTH BASS 2 1.50 0.11 31.50 0.05 0.19F C CGREEN SUNFISH 31 23.25 1.76 6.76 0.16 0.63S I C TLOGPERCH 1 0.75 0.06 10.00 0.01 0.03D I S MJOHNNY DARTER 1 0.75 0.06 1.00 0.00 0.00D I CGREENSIDE DARTER 173 129.75 9.81 6.29 0.82 3.28D I S MBANDED DARTER 10 7.50 0.57 3.50 0.03 0.11D I S IRAINBOW DARTER 54 40.50 3.06 4.31 0.17 0.70D I S MFANTAIL DARTER 6 4.50 0.34 5.17 0.02 0.09D I CMOTTLED SCULPIN 504 378.00 28.59 6.86 2.59 10.41I C
Mile Total 1,763Number of SpeciesNumber of Hybrids
25 1
24.91 1,322.25
Run Date 03/14/97 OEPA Division of Surface Water Ecological Assessment Unit Took 1.0 min

2Drain Area:No of Passes:
Date Range: 07/10/9608/22/96
Species List
# ofFish
River Code: Sample Date:
Sampler Type:
17-450 1 9 9 6
D
Basin:Time Fished:Dist Fished:
Muskingum RiverSandy Creek
0.40 km
Page 3
Number% by
Number Weight% by
WeightAve(gm)Weight
Relative Relative
Thru:
IBI FeedGrpGuild Tol
BreedGuild
Stream:River Mile: 2 9 . 5 0
63.0 sq mi5049 sec
Name / ODNR StatusSpecies
NORTHERN HOG SUCKER 40 30.00 6.28 30.35 0.91 11.39R I S MWHITE SUCKER 34 25.50 5.34 24.98 0.64 7.97W O S TCOMMON CARP 1 0.75 0.16 3,500.00 2.63 32.83G O M THORNYHEAD CHUB 1 0.75 0.16 8.00 0.01 0.08N I N IRIVER CHUB 12 9.00 1.88 35.75 0.32 4.03N I N IBLACKNOSE DACE 1 0.75 0.16 2.00 0.00 0.02N G S TCREEK CHUB 18 13.50 2.83 9.64 0.13 1.63N G N TROSYFACE SHINER 25 18.75 3.92 2.98 0.06 0.70N I S ISTRIPED SHINER 52 39.00 8.16 11.66 0.46 5.69N I SCOMMON SHINER 31 23.25 4.87 5.71 0.13 1.66N I SSAND SHINER 1 0.75 0.16 3.00 0.00 0.03N I M MSILVERJAW MINNOW 4 3.00 0.63 7.75 0.02 0.29N I MBLUNTNOSE MINNOW 62 46.50 9.73 4.03 0.19 2.35N O C TCENTRAL STONEROLLER 133 99.75 20.88 11.70 1.17 14.60N H NROCK BASS 14 10.50 2.20 57.64 0.61 7.58S C CWARMOUTH SF 1 0.75 0.16 25.00 0.02 0.24S C CGREEN SUNFISH 14 10.50 2.20 5.64 0.06 0.74S I C TLOGPERCH 3 2.25 0.47 13.33 0.03 0.38D I S MGREENSIDE DARTER 47 35.25 7.38 4.64 0.16 2.04D I S MBANDED DARTER 13 9.75 2.04 2.62 0.03 0.33D I S IRAINBOW DARTER 8 6.00 1.26 4.75 0.03 0.36D I S MFANTAIL DARTER 5 3.75 0.78 4.60 0.02 0.22D I CMOTTLED SCULPIN 117 87.75 18.37 4.47 0.39 4.90I C
Mile Total 637Number of SpeciesNumber of Hybrids
23 0
8.00 477.75
Run Date 03/14/97 OEPA Division of Surface Water Ecological Assessment Unit Took 1.0 min
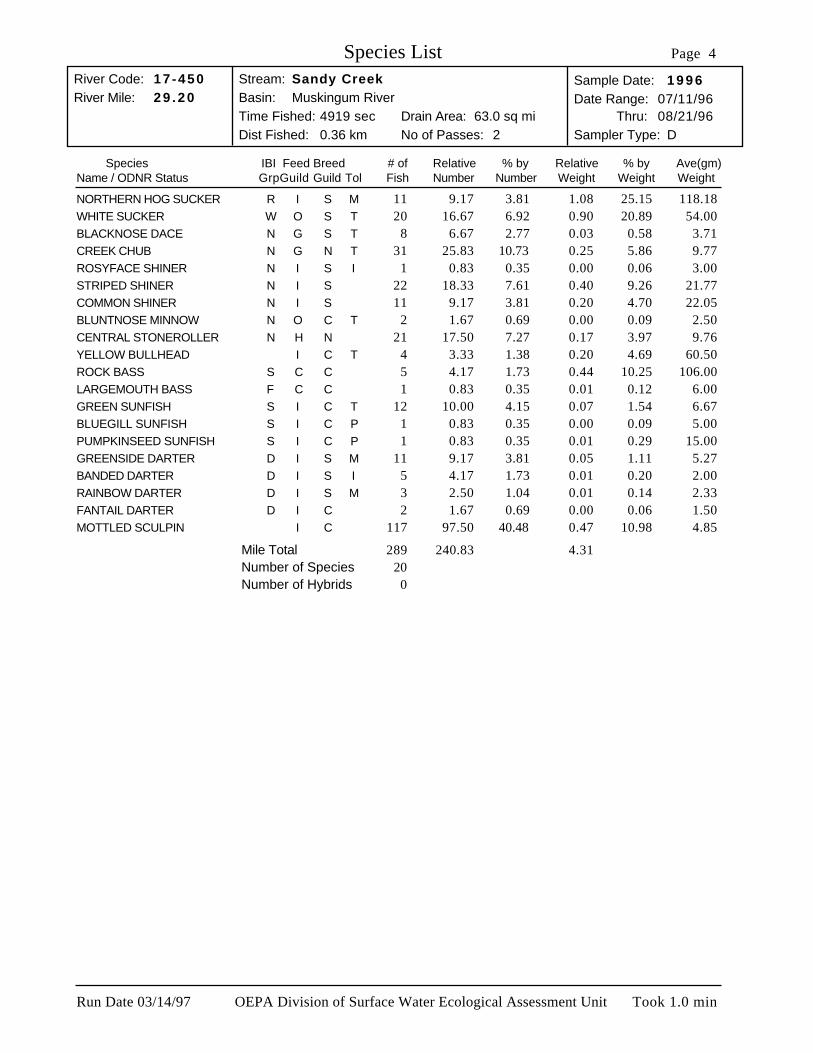
2Drain Area:No of Passes:
Date Range: 07/11/9608/21/96
Species List
# ofFish
River Code: Sample Date:
Sampler Type:
17-450 1 9 9 6
D
Basin:Time Fished:Dist Fished:
Muskingum RiverSandy Creek
0.36 km
Page 4
Number% by
Number Weight% by
WeightAve(gm)Weight
Relative Relative
Thru:
IBI FeedGrpGuild Tol
BreedGuild
Stream:River Mile: 2 9 . 2 0
63.0 sq mi4919 sec
Name / ODNR StatusSpecies
NORTHERN HOG SUCKER 11 9.17 3.81 118.18 1.08 25.15R I S MWHITE SUCKER 20 16.67 6.92 54.00 0.90 20.89W O S TBLACKNOSE DACE 8 6.67 2.77 3.71 0.03 0.58N G S TCREEK CHUB 31 25.83 10.73 9.77 0.25 5.86N G N TROSYFACE SHINER 1 0.83 0.35 3.00 0.00 0.06N I S ISTRIPED SHINER 22 18.33 7.61 21.77 0.40 9.26N I SCOMMON SHINER 11 9.17 3.81 22.05 0.20 4.70N I SBLUNTNOSE MINNOW 2 1.67 0.69 2.50 0.00 0.09N O C TCENTRAL STONEROLLER 21 17.50 7.27 9.76 0.17 3.97N H NYELLOW BULLHEAD 4 3.33 1.38 60.50 0.20 4.69I C TROCK BASS 5 4.17 1.73 106.00 0.44 10.25S C CLARGEMOUTH BASS 1 0.83 0.35 6.00 0.01 0.12F C CGREEN SUNFISH 12 10.00 4.15 6.67 0.07 1.54S I C TBLUEGILL SUNFISH 1 0.83 0.35 5.00 0.00 0.09S I C PPUMPKINSEED SUNFISH 1 0.83 0.35 15.00 0.01 0.29S I C PGREENSIDE DARTER 11 9.17 3.81 5.27 0.05 1.11D I S MBANDED DARTER 5 4.17 1.73 2.00 0.01 0.20D I S IRAINBOW DARTER 3 2.50 1.04 2.33 0.01 0.14D I S MFANTAIL DARTER 2 1.67 0.69 1.50 0.00 0.06D I CMOTTLED SCULPIN 117 97.50 40.48 4.85 0.47 10.98I C
Mile Total 289Number of SpeciesNumber of Hybrids
20 0
4.31 240.83
Run Date 03/14/97 OEPA Division of Surface Water Ecological Assessment Unit Took 1.0 min

2Drain Area:No of Passes:
Date Range: 07/11/9608/21/96
Species List
# ofFish
River Code: Sample Date:
Sampler Type:
17-450 1 9 9 6
D
Basin:Time Fished:Dist Fished:
Muskingum RiverSandy Creek
0.08 km
Page 5
Number% by
Number Weight% by
WeightAve(gm)Weight
Relative Relative
Thru:
IBI FeedGrpGuild Tol
BreedGuild
Stream:River Mile: 2 9 . 0 0
63.0 sq mi1211 sec
Name / ODNR StatusSpecies
WHITE SUCKER 7 26.25 10.94 4.57 0.12 6.14W O S TBLACKNOSE DACE 1 3.75 1.56 2.00 0.01 0.38N G S TCREEK CHUB 16 60.00 25.00 14.56 0.87 44.73N G N TSTRIPED SHINER 1 3.75 1.56 20.00 0.08 3.84N I SBLUNTNOSE MINNOW 1 3.75 1.56 1.00 0.00 0.20N O C TYELLOW BULLHEAD 13 48.75 20.31 1.54 0.08 3.84I C TROCK BASS 1 3.75 1.56 100.00 0.38 19.19S C CSMALLMOUTH BASS 2 7.50 3.13 1.00 0.01 0.38F C C MGREEN SUNFISH 11 41.25 17.19 7.91 0.33 16.71S I C TBLUEGILL SUNFISH 2 7.50 3.13 1.50 0.01 0.59S I C PMOTTLED SCULPIN 9 33.75 14.06 2.33 0.08 4.04I C
Mile Total 64Number of SpeciesNumber of Hybrids
11 0
1.95 240.00
Run Date 03/14/97 OEPA Division of Surface Water Ecological Assessment Unit Took 1.0 min
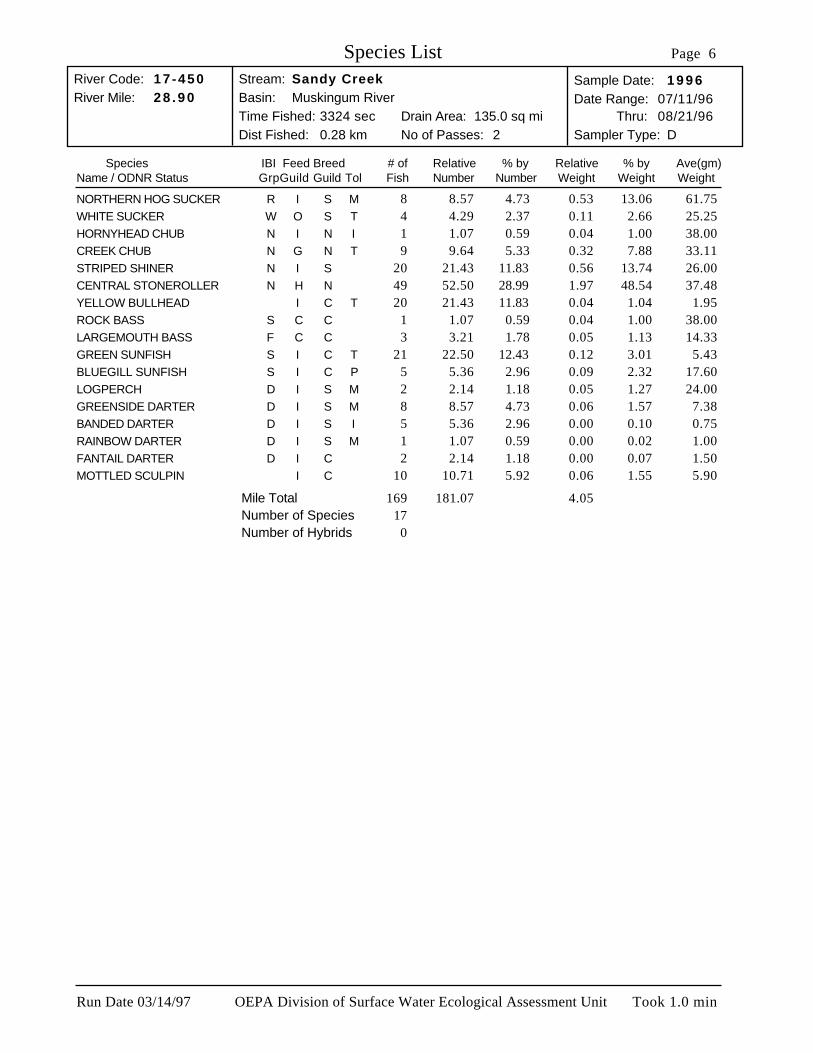
2Drain Area:No of Passes:
Date Range: 07/11/9608/21/96
Species List
# ofFish
River Code: Sample Date:
Sampler Type:
17-450 1 9 9 6
D
Basin:Time Fished:Dist Fished:
Muskingum RiverSandy Creek
0.28 km
Page 6
Number% by
Number Weight% by
WeightAve(gm)Weight
Relative Relative
Thru:
IBI FeedGrpGuild Tol
BreedGuild
Stream:River Mile: 2 8 . 9 0
135.0 sq mi3324 sec
Name / ODNR StatusSpecies
NORTHERN HOG SUCKER 8 8.57 4.73 61.75 0.53 13.06R I S MWHITE SUCKER 4 4.29 2.37 25.25 0.11 2.66W O S THORNYHEAD CHUB 1 1.07 0.59 38.00 0.04 1.00N I N ICREEK CHUB 9 9.64 5.33 33.11 0.32 7.88N G N TSTRIPED SHINER 20 21.43 11.83 26.00 0.56 13.74N I SCENTRAL STONEROLLER 49 52.50 28.99 37.48 1.97 48.54N H NYELLOW BULLHEAD 20 21.43 11.83 1.95 0.04 1.04I C TROCK BASS 1 1.07 0.59 38.00 0.04 1.00S C CLARGEMOUTH BASS 3 3.21 1.78 14.33 0.05 1.13F C CGREEN SUNFISH 21 22.50 12.43 5.43 0.12 3.01S I C TBLUEGILL SUNFISH 5 5.36 2.96 17.60 0.09 2.32S I C PLOGPERCH 2 2.14 1.18 24.00 0.05 1.27D I S MGREENSIDE DARTER 8 8.57 4.73 7.38 0.06 1.57D I S MBANDED DARTER 5 5.36 2.96 0.75 0.00 0.10D I S IRAINBOW DARTER 1 1.07 0.59 1.00 0.00 0.02D I S MFANTAIL DARTER 2 2.14 1.18 1.50 0.00 0.07D I CMOTTLED SCULPIN 10 10.71 5.92 5.90 0.06 1.55I C
Mile Total 169Number of SpeciesNumber of Hybrids
17 0
4.05 181.07
Run Date 03/14/97 OEPA Division of Surface Water Ecological Assessment Unit Took 1.0 min
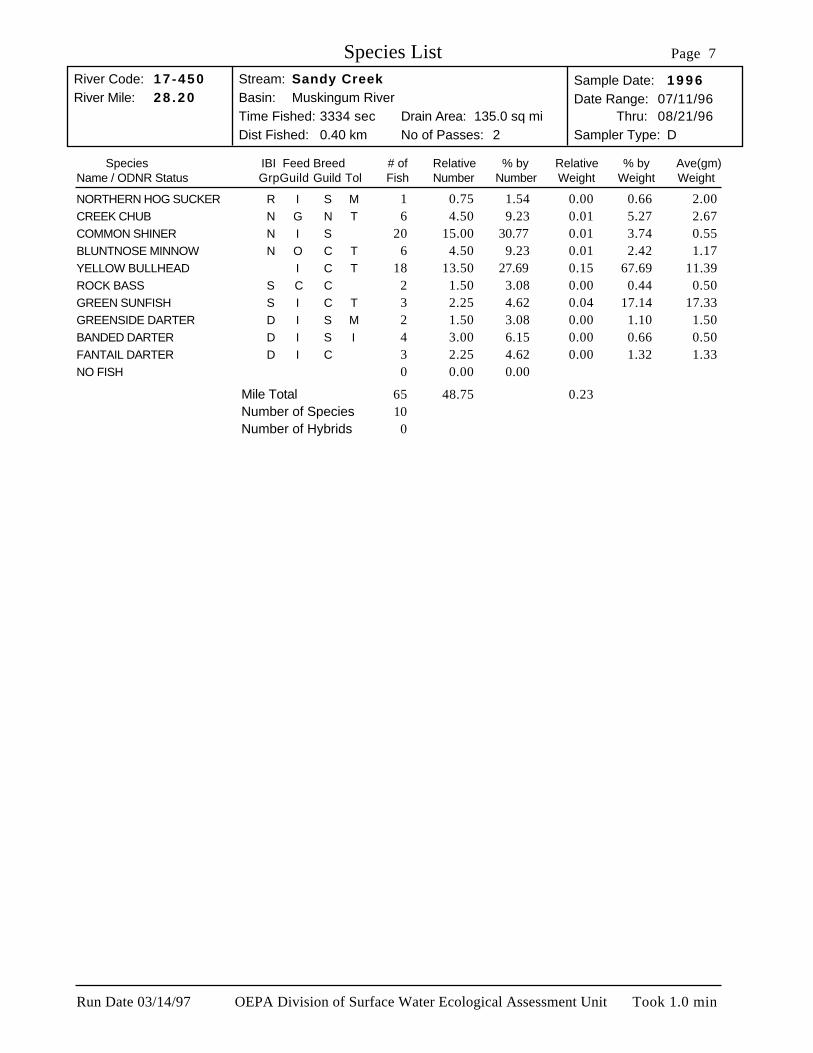
2Drain Area:No of Passes:
Date Range: 07/11/9608/21/96
Species List
# ofFish
River Code: Sample Date:
Sampler Type:
17-450 1 9 9 6
D
Basin:Time Fished:Dist Fished:
Muskingum RiverSandy Creek
0.40 km
Page 7
Number% by
Number Weight% by
WeightAve(gm)Weight
Relative Relative
Thru:
IBI FeedGrpGuild Tol
BreedGuild
Stream:River Mile: 2 8 . 2 0
135.0 sq mi3334 sec
Name / ODNR StatusSpecies
NORTHERN HOG SUCKER 1 0.75 1.54 2.00 0.00 0.66R I S MCREEK CHUB 6 4.50 9.23 2.67 0.01 5.27N G N TCOMMON SHINER 20 15.00 30.77 0.55 0.01 3.74N I SBLUNTNOSE MINNOW 6 4.50 9.23 1.17 0.01 2.42N O C TYELLOW BULLHEAD 18 13.50 27.69 11.39 0.15 67.69I C TROCK BASS 2 1.50 3.08 0.50 0.00 0.44S C CGREEN SUNFISH 3 2.25 4.62 17.33 0.04 17.14S I C TGREENSIDE DARTER 2 1.50 3.08 1.50 0.00 1.10D I S MBANDED DARTER 4 3.00 6.15 0.50 0.00 0.66D I S IFANTAIL DARTER 3 2.25 4.62 1.33 0.00 1.32D I CNO FISH 0 0.00 0.00
Mile Total 65Number of SpeciesNumber of Hybrids
10 0
0.23 48.75
Run Date 03/14/97 OEPA Division of Surface Water Ecological Assessment Unit Took 1.0 min

1Drain Area:No of Passes:
Date Range: 06/27/96
Species List
# ofFish
River Code: Sample Date:
Sampler Type:
17-450 1 9 9 6
D
Basin:Time Fished:Dist Fished:
Muskingum RiverSandy Creek
0.20 km
Page 8
Number% by
Number Weight% by
WeightAve(gm)Weight
Relative RelativeIBI FeedGrpGuild Tol
BreedGuild
Stream:River Mile: 2 7 . 8 0
137.0 sq mi1889 sec
Name / ODNR StatusSpecies
WHITE SUCKER 4 6.00 30.77 16.00 0.10 27.35W O S TCOMMON CARP 1 1.50 7.69 1.00 0.00 0.57G O M TGOLDEN SHINER 1 1.50 7.69 2.00 0.00 0.85N I M TBLACK BULLHEAD 1 1.50 7.69 138.00 0.21 58.97I C PLARGEMOUTH BASS 1 1.50 7.69 7.00 0.01 3.13F C CGREEN SUNFISH 4 6.00 30.77 5.00 0.03 8.55S I C TBLUEGILL SUNFISH 1 1.50 7.69 2.00 0.00 0.85S I C P
Mile Total 13Number of SpeciesNumber of Hybrids
7 0
0.35 19.50
Run Date 03/14/97 OEPA Division of Surface Water Ecological Assessment Unit Took 1.0 min

2Drain Area:No of Passes:
Date Range: 07/10/9608/21/96
Species List
# ofFish
River Code: Sample Date:
Sampler Type:
17-450 1 9 9 6
D
Basin:Time Fished:Dist Fished:
Muskingum RiverSandy Creek
0.42 km
Page 9
Number% by
Number Weight% by
WeightAve(gm)Weight
Relative Relative
Thru:
IBI FeedGrpGuild Tol
BreedGuild
Stream:River Mile: 2 5 . 4 0
162.0 sq mi4949 sec
Name / ODNR StatusSpecies
WHITE SUCKER 3 2.14 2.29 27.00 0.06 20.21W O S TBLACKNOSE DACE 15 10.71 11.45 1.54 0.02 5.80N G S TCREEK CHUB 33 23.57 25.19 1.94 0.05 15.99N G N TCOMMON SHINER 41 29.29 31.30 2.02 0.06 20.91N I SBLUNTNOSE MINNOW 7 5.00 5.34 0.75 0.00 1.41N O C TCENTRAL STONEROLLER 28 20.00 21.37 2.89 0.06 20.39N H NYELLOW BULLHEAD 1 0.71 0.76 31.00 0.02 7.73I C TROCK BASS 1 0.71 0.76 1.00 0.00 0.18S C CLARGEMOUTH BASS 1 0.71 0.76 2.00 0.00 0.53F C CGREEN SUNFISH 1 0.71 0.76 27.00 0.02 6.85S I C T
Mile Total 131Number of SpeciesNumber of Hybrids
10 0
0.28 93.57
Run Date 03/14/97 OEPA Division of Surface Water Ecological Assessment Unit Took 1.0 min

1Drain Area:No of Passes:
Date Range: 06/27/96
Species List
# ofFish
River Code: Sample Date:
Sampler Type:
17-450 1 9 9 6
D
Basin:Time Fished:Dist Fished:
Muskingum RiverSandy Creek
0.17 km
Page 10
Number% by
Number Weight% by
WeightAve(gm)Weight
Relative RelativeIBI FeedGrpGuild Tol
BreedGuild
Stream:River Mile: 2 4 . 1 0
163.0 sq mi2400 sec
Name / ODNR StatusSpecies
WHITE SUCKER 1 1.77 14.29 36.00 0.06 36.57W O S TCREEK CHUB 2 3.53 28.57 7.00 0.03 14.29N G N TFATHEAD MINNOW 1 1.77 14.29 4.00 0.01 4.00N O C TCENTRAL STONEROLLER 3 5.29 42.86 15.00 0.08 45.14N H N
Mile Total 7Number of SpeciesNumber of Hybrids
4 0
0.18 12.35
Run Date 03/14/97 OEPA Division of Surface Water Ecological Assessment Unit Took 1.0 min

2Drain Area:No of Passes:
Date Range: 07/10/9608/21/96
Species List
# ofFish
River Code: Sample Date:
Sampler Type:
17-450 1 9 9 6
D
Basin:Time Fished:Dist Fished:
Muskingum RiverSandy Creek
0.44 km
Page 11
Number% by
Number Weight% by
WeightAve(gm)Weight
Relative Relative
Thru:
IBI FeedGrpGuild Tol
BreedGuild
Stream:River Mile: 2 2 . 4 0
191.0 sq mi3290 sec
Name / ODNR StatusSpecies
NORTHERN HOG SUCKER 6 4.09 8.00 14.50 0.06 35.21R I S MWHITE SUCKER 29 19.77 38.67 0.76 0.02 8.88W O S TBLUNTNOSE MINNOW 2 1.36 2.67 1.00 0.00 0.59N O C TLARGEMOUTH BASS 1 0.68 1.33 8.00 0.01 3.25F C CGREEN SUNFISH 10 6.82 13.33 9.30 0.06 37.57S I C TJOHNNY DARTER 7 4.77 9.33 0.86 0.00 2.37D I CGREENSIDE DARTER 8 5.45 10.67 2.13 0.01 6.80D I S MFANTAIL DARTER 7 4.77 9.33 0.86 0.00 2.37D I CMOTTLED SCULPIN 5 3.41 6.67 1.40 0.00 2.66I C
Mile Total 75Number of SpeciesNumber of Hybrids
9 0
0.17 51.14
Run Date 03/14/97 OEPA Division of Surface Water Ecological Assessment Unit Took 1.0 min

2Drain Area:No of Passes:
Date Range: 07/11/9608/21/96
Species List
# ofFish
River Code: Sample Date:
Sampler Type:
17-470 1 9 9 6
D
Basin:Time Fished:Dist Fished:
Muskingum RiverStill Fork
0.30 km
Page 12
Number% by
Number Weight% by
WeightAve(gm)Weight
Relative Relative
Thru:
IBI FeedGrpGuild Tol
BreedGuild
Stream:River Mile: 0 .10
71.0 sq mi3583 sec
Name / ODNR StatusSpecies
NORTHERN HOG SUCKER 8 8.00 3.09 56.00 0.45 5.83R I S MWHITE SUCKER 12 12.00 4.63 84.83 1.02 13.25W O S TSPOTTED SUCKER 1 1.00 0.39 4.00 0.00 0.05R I SCOMMON CARP 4 4.00 1.54 854.50 3.42 44.50G O M TGOLDEN SHINER 4 4.00 1.54 18.50 0.07 0.96N I M TSTRIPED SHINER 3 3.00 1.16 24.67 0.07 0.96N I SCENTRAL STONEROLLER 4 4.00 1.54 32.50 0.13 1.69N H NYELLOW BULLHEAD 12 12.00 4.63 17.42 0.21 2.72I C TROCK BASS 1 1.00 0.39 2.00 0.00 0.03S C CLARGEMOUTH BASS 27 27.00 10.42 19.41 0.52 6.82F C CWARMOUTH SF 1 1.00 0.39 52.00 0.05 0.68S C CGREEN SUNFISH 93 93.00 35.91 5.24 0.49 6.35S I C TBLUEGILL SUNFISH 73 73.00 28.19 15.49 1.13 14.73S I C PPUMPKINSEED SUNFISH 1 1.00 0.39 12.00 0.01 0.16S I C PGREEN SF X BLUEGILL 1 1.00 0.39 6.00 0.01 0.08GR'N SF X PUMPKINS'D 2 2.00 0.77 9.00 0.02 0.23LOGPERCH 2 2.00 0.77 24.00 0.05 0.62D I S MJOHNNY DARTER 1 1.00 0.39 1.00 0.00 0.01D I CGREENSIDE DARTER 3 3.00 1.16 2.50 0.01 0.10D I S MFANTAIL DARTER 4 4.00 1.54 3.00 0.01 0.16D I CMOTTLED SCULPIN 2 2.00 0.77 2.00 0.00 0.05I C
Mile Total 259Number of SpeciesNumber of Hybrids
19 2
7.68 259.00
Run Date 03/14/97 OEPA Division of Surface Water Ecological Assessment Unit Took 1.0 min
DSW/MAS 1997-3-1 Sandy Creek/ Minerva March 4,1998
Appendix Table 4. Index of Biotic Integrity (IBI) metrics and scores andModified Index of Well-being (MIwb) scores by rivermile for locations sampled in the Sandy Creek studyarea, 1996 and 1997.
48

RiverMile Date
Drainagearea (sq mi)
Totalspecies
Sunfishspecies
Suckerspecies
Intolerantspecies
Darterspecies
SimpleLithophils
Tolerantfishes
Omni-vores
Topcarnivores
Insect-ivores
DELTanomalies
Rel.No.minus
tolerants/(0.3km) IBI
ModifiedIwbType
Number of Percent of Individuals
Sandy Creek - (17450)
Year: 97
28.20 09/24/97 21(3) 135 3(3) 2(1) 3(3) 5(3) 51(5) 57(1) 43(1) 0.6(1) 41(3) 6.4(1)D 28 6.9335(3)
25.40 09/24/97 21(3) 162 4(5) 2(1) 1(1) 6(5) 44(5) 68(1) 54(1) 0.1(1) 23(1) 0.6(3)D 30 6.7360(3)
Year: 96
34.70 08/22/96 25(5) 36 4(5) 2(3) 4(5) 5(5) 36(5) 18(5) 13(5) 1.8(3) 74(5) 0.0(5)D 56 9.5809(5)
30.50 07/11/96 20(3) 62 2(3) 2(3) 4(3) 5(5) 22(3) 5(5) 3(5) 2.0(3) 44(3) 0.0(5)D 46 8.5843(5)
30.50 08/22/96 22(5) 62 2(3) 2(3) 4(3) 5(5) 26(3) 10(5) 5(5) 0.4(1) 68(5) 0.2(3)D 46 9.31580(5)
29.50 07/10/96 18(3) 63 3(3) 2(3) 4(3) 3(3) 36(3) 12(5) 9(5) 4.6(3) 63(5) 0.7(3)D 42 7.1201(3)
29.50 08/22/96 20(3) 63 2(3) 2(3) 3(3) 5(5) 41(5) 23(5) 17(5) 1.7(3) 57(5) 0.0(5)D 48 8.9560(3)
29.20 07/11/96 12(3) 63 3(3) 2(3) 0(1) 1(1) 33(3) 27(3) 20(3) 4.5(3) 64(5) 1.5(3)D 32 6.280(1) *
29.20 08/21/96 19(3) 63 3(3) 2(3) 2(1) 4(3) 31(3) 26(3) 4(5) 1.4(3) 71(5) 0.0(5)D 40 7.9273(3)
29.00 07/11/96 5(1) 63 2(3) 0(1) 0(1) 0(1) 5(1) 75(1) 0(5) 0.0(1) 55(5) 0.0(5)D 26 4.138(1) *
29.00 08/21/96 10(1) 63 3(3) 1(1) 0(1) 0(1) 18(3) 77(1) 18(5) 6.8(5) 57(5) 2.3(5)D 32 5.875(1)
28.90 07/11/96 6(1) 135 3(3) 0(1) 0(1) 1(1) 16(1) 58(1) 0(1) 10.5(1) 74(1) 0.0(1)D 14 4.617(1)**
28.90 08/21/96 16(3) 135 2(3) 2(1) 2(1) 5(3) 30(3) 29(3) 3(5) 1.3(3) 59(5) 0.7(3)D 36 7.6229(3)
28.20 07/11/96 0(1) 135 0(1) 0(1) 0(1) 0(1) 0(1) 0(1) 0(1) 0.0(1) 0(1) 0.0(1)D 12 0.00(1)**
28.20 08/21/96 9(1) 135 1(1) 1(1) 1(1) 3(3) 43(5) 52(1) 10(3) 0.0(1) 81(5) 0.0(1)D 22 4.845(1) * ▲
27.80 06/27/96 6(1) 137 2(3) 1(1) 0(1) 0(1) 31(1) 77(1) 38(1) 7.7(1) 54(1) 7.7(1)D 14 3.55(1)** ▲
25.40 07/10/96 3(1) 162 0(1) 1(1) 0(1) 0(1) 50(1) 75(1) 50(1) 25.0(1) 25(1) 0.0(1)D 12 1.91(1)** ▲
25.40 08/21/96 8(1) 162 2(3) 1(1) 0(1) 0(1) 45(5) 45(1) 6(3) 0.8(1) 33(3) 0.0(3)D 24 5.5100(1) * ▲
24.10 06/27/96 4(1) 163 0(1) 1(1) 0(1) 0(1) 14(1) 57(1) 29(1) 0.0(1) 0(1) 57.1(1)D 12 3.25(1)**
22.40 07/10/96 5(1) 191 1(1) 2(1) 0(1) 0(1) 84(3) 89(1) 81(1) 0.0(1) 19(1) 0.0(1)D 14 2.75(1) * ▲
na - Qualitative data, Modified Iwb not applicable. 1 02/27/98▲ - IBI is low-end adjusted.
- One or more species excluded from IBI calculation.●

RiverMile Date
Drainagearea (sq mi)
Totalspecies
Sunfishspecies
Suckerspecies
Intolerantspecies
Darterspecies
SimpleLithophils
Tolerantfishes
Omni-vores
Topcarnivores
Insect-ivores
DELTanomalies
Rel.No.minus
tolerants/(0.3km) IBI
ModifiedIwbType
Number of Percent of Individuals
22.40 08/21/96 8(1) 191 1(1) 1(1) 0(1) 3(3) 32(3) 21(3) 3(5) 2.6(3) 95(5) 0.0(3)D 30 5.241(1) * ▲
Still Fk. Sandy Cr. - (17470)
Year: 96
0.10 07/11/96 12(3) 71 3(3) 2(3) 0(1) 2(1) 10(1) 61(1) 7(1) 6.1(5) 83(1) 2.4(1)D 22 5.864(1) * ▲
0.10 08/21/96 17(3) 71 4(5) 3(3) 0(1) 4(3) 12(1) 42(3) 6(5) 13.6(5) 79(5) 1.7(1)D 38 6.9204(3)
na - Qualitative data, Modified Iwb not applicable. 2 02/27/98▲ - IBI is low-end adjusted.
- One or more species excluded from IBI calculation.●
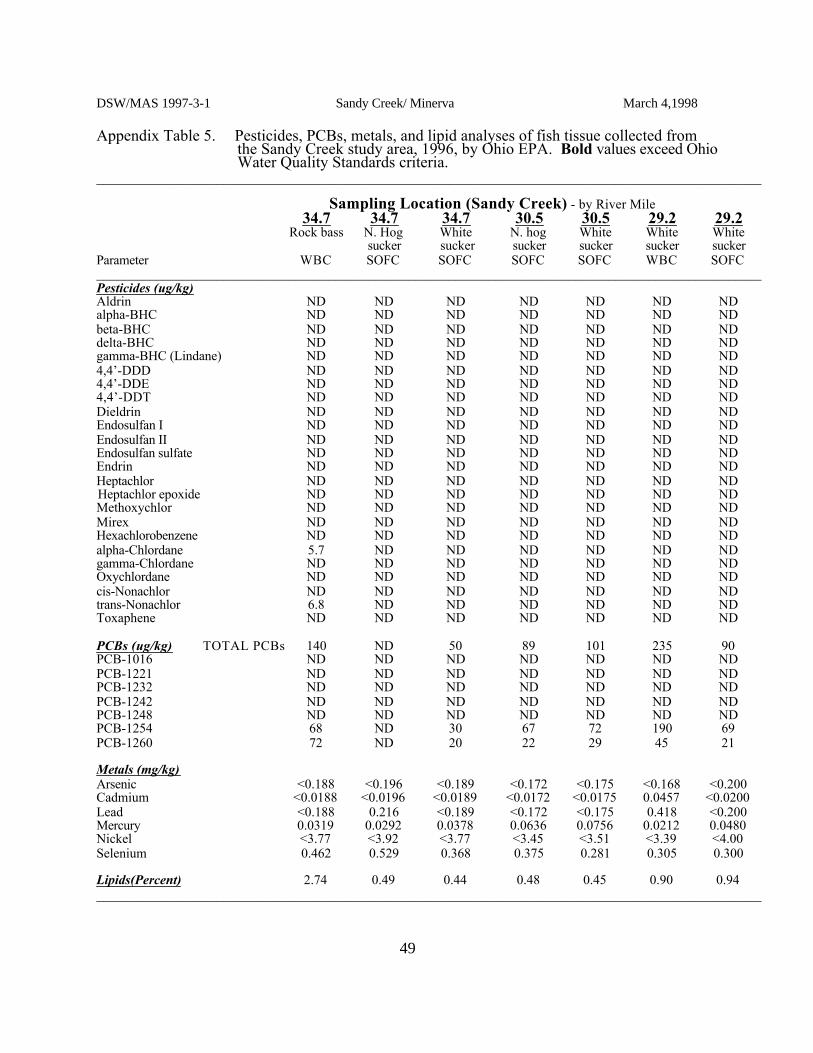
DSW/MAS 1997-3-1 Sandy Creek/ Minerva March 4,1998
Appendix Table 5. Pesticides, PCBs, metals, and lipid analyses of fish tissue collected fromthe Sandy Creek study area, 1996, by Ohio EPA. Bold values exceed OhioWater Quality Standards criteria.
____________________________________________________________________________________________________
Sampling Location (Sandy Creek) - by River Mile 34.7 34.7 34.7 30.5 30.5 29.2 29.2
Rock bass N. Hog White N. hog White White Whitesucker sucker sucker sucker sucker sucker
Parameter WBC SOFC SOFC SOFC SOFC WBC SOFC____________________________________________________________________________________________________Pesticides (ug/kg)Aldrin ND ND ND ND ND ND NDalpha-BHC ND ND ND ND ND ND NDbeta-BHC ND ND ND ND ND ND NDdelta-BHC ND ND ND ND ND ND NDgamma-BHC (Lindane) ND ND ND ND ND ND ND4,4’-DDD ND ND ND ND ND ND ND4,4’-DDE ND ND ND ND ND ND ND4,4’-DDT ND ND ND ND ND ND NDDieldrin ND ND ND ND ND ND NDEndosulfan I ND ND ND ND ND ND NDEndosulfan II ND ND ND ND ND ND NDEndosulfan sulfate ND ND ND ND ND ND NDEndrin ND ND ND ND ND ND NDHeptachlor ND ND ND ND ND ND NDHeptachlor epoxide ND ND ND ND ND ND NDMethoxychlor ND ND ND ND ND ND NDMirex ND ND ND ND ND ND NDHexachlorobenzene ND ND ND ND ND ND NDalpha-Chlordane 5.7 ND ND ND ND ND NDgamma-Chlordane ND ND ND ND ND ND NDOxychlordane ND ND ND ND ND ND NDcis-Nonachlor ND ND ND ND ND ND NDtrans-Nonachlor 6.8 ND ND ND ND ND NDToxaphene ND ND ND ND ND ND ND
PCBs (ug/kg) TOTAL PCBs 140 ND 50 89 101 235 90PCB-1016 ND ND ND ND ND ND NDPCB-1221 ND ND ND ND ND ND NDPCB-1232 ND ND ND ND ND ND NDPCB-1242 ND ND ND ND ND ND NDPCB-1248 ND ND ND ND ND ND NDPCB-1254 68 ND 30 67 72 190 69PCB-1260 72 ND 20 22 29 45 21
Metals (mg/kg)Arsenic <0.188 <0.196 <0.189 <0.172 <0.175 <0.168 <0.200Cadmium <0.0188 <0.0196 <0.0189 <0.0172 <0.0175 0.0457 <0.0200Lead <0.188 0.216 <0.189 <0.172 <0.175 0.418 <0.200Mercury 0.0319 0.0292 0.0378 0.0636 0.0756 0.0212 0.0480Nickel <3.77 <3.92 <3.77 <3.45 <3.51 <3.39 <4.00Selenium 0.462 0.529 0.368 0.375 0.281 0.305 0.300
Lipids(Percent) 2.74 0.49 0.44 0.48 0.45 0.90 0.94____________________________________________________________________________________________________
49

DSW/MAS 1997-3-1 Sandy Creek/ Minerva March 4,1998
Appendix Table 5. Continued.____________________________________________________________________________________________________
Sampling Location (Sandy Creek)- by River Mile 27.8 27.8 27.8 25.1 23.5 23.5 23.5White Common Black White White Common Largemouthsucker carp bullhead sucker sucker carp bass
Parameter SOFC SFFC WBC SOFC SOFC SFFC SOF____________________________________________________________________________________________________Pesticides (ug/kg)Aldrin ND ND ND ND ND ND NDalpha-BHC ND ND ND ND ND ND NDbeta-BHC ND ND ND ND ND ND NDdelta-BHC ND ND ND ND ND ND NDgamma-BHC (Lindane) ND ND ND ND ND ND ND4,4’-DDD ND ND ND ND ND 5.8 ND4,4’-DDE ND ND ND ND ND ND ND4,4’-DDT ND ND ND ND ND ND NDDieldrin ND ND ND ND ND ND NDEndosulfan I ND ND ND ND ND ND NDEndosulfan II ND ND ND ND ND ND NDEndosulfan sulfate ND ND ND ND ND ND NDEndrin ND ND ND ND ND ND NDHeptachlor ND ND ND ND ND ND NDHeptachlor epoxide ND ND ND ND ND ND NDMethoxychlor ND ND ND ND ND ND NDMirex ND ND ND ND ND ND NDHexachlorobenzene ND ND ND ND ND ND NDalpha-Chlordane ND ND ND ND ND 12 NDgamma-Chlordane ND ND ND ND ND ND NDOxychlordane ND ND ND ND ND ND NDcis-Nonachlor ND ND ND ND ND ND NDtrans-Nonachlor ND ND ND ND ND 11 NDToxaphene ND ND NA ND ND ND ND
PCBs (ug/kg) TOTAL PCBs 70 192 33 56 33 1537 NDPCB-1016 ND ND ND ND ND ND NDPCB-1221 ND ND ND ND ND ND NDPCB-1232 ND ND ND ND ND ND NDPCB-1242 ND ND ND ND ND ND NDPCB-1248 ND ND ND ND ND 97 NDPCB-1254 70 170 33 56 33 1300 NDPCB-1260 ND 22 ND ND ND 140 ND
Metals (mg/kg)Arsenic <0.182 <0.185 <0.0990 <0.167 <0.167 <0.189 <0.167Cadmium <0.0182 <0.0185 0.0841 <0.0167 <0.0167 <0.0189 <0.0167Lead <0.182 <0.185 0.188 <0.167 <0.167 <0.189 <0.167Mercury 0.0245 0.0335 0.0197 0.0443 0.0355 0.0824 0.374Nickel <3.64 <3.70 NA <3.33 <3.33 <3.77 <3.33Selenium 0.200 0.361 0.723 0.217 0.383 0.321 0.258
Lipids (Percent) 1.37 2.33 0.65 1.49 1.34 6.18 0.16____________________________________________________________________________________________________
50

DSW/MAS 1997-3-1 Sandy Creek/ Minerva March 4,1998
Appendix Table 5. Continued.____________________________________________________________________________________________________
Sampling Location (Sandy Creek) - by River Mile 23.5 23.5 23.5 23.5 22.1 22.1 17.0
Largemouth Common Blue- Common N. hog White Whitebass carp gill carp sucker sucker sucker
Parameter SOFC WB WBC WBC SOFC SOFC SOFC____________________________________________________________________________________________________Pesticides (ug/kg)Aldrin ND ND ND ND ND ND NDalpha-BHC ND ND ND ND ND ND NDbeta-BHC ND ND ND ND ND ND NDdelta-BHC ND ND ND ND ND ND NDgamma-BHC (Lindane) ND ND ND ND ND ND ND4,4’-DDD ND 11 ND 7.1 ND ND ND4,4’-DDE ND 31 10 19 ND ND ND4,4’-DDT ND ND ND ND ND ND NDDieldrin ND ND 4.5 ND ND ND NDEndosulfan I ND ND ND ND ND ND NDEndosulfan II ND ND ND ND ND ND NDEndosulfan sulfate ND ND ND ND ND ND NDEndrin ND ND ND ND ND ND NDHeptachlor ND ND ND ND ND ND NDHeptachlor epoxide ND ND ND ND ND ND NDMethoxychlor ND ND ND ND ND ND NDMirex ND ND ND ND ND ND NDHexachlorobenzene ND 6.8 ND ND ND ND NDalpha-Chlordane ND 24 ND 9.1 ND ND NDgamma-Chlordane ND ND ND ND ND ND NDOxychlordane ND ND ND ND ND ND NDcis-Nonachlor ND ND ND ND ND ND NDtrans-Nonachlor ND 28 4.2 12 ND ND NDToxaphene ND NA NA NA ND ND ND
PCBs (ug/kg) TOTAL PCBs ND 1220 230 2010 26 33 52PCB-1016 ND ND ND ND ND ND NDPCB-1221 ND ND ND ND ND ND NDPCB-1232 ND ND ND ND ND ND NDPCB-1242 ND ND ND ND ND ND NDPCB-1248 ND ND ND ND ND ND NDPCB-1254 ND 900 120 1800 26 33 21PCB-1260 ND 320 110 210 ND ND 31
Metals (mg/kg)Arsenic <0.185 NA NA NA <0.196 <0.178 <0.169Cadmium <0.0185 0.0532 0.0738 0.0289 <0.0196 <0.0178 <0.0169Lead <0.185 0.710 0.383 0.570 <0.196 <0.178 <0.169Mercury 0.107 0.0569 0.0356 0.0438 0.0321 0.0319 0.0278Nickel <3.70 NA NA NA <3.92 <3.57 <3.39Selenium 0.241 NA NA NA 0.363 0.303 0.297
Lipids (Percent) 0.22 10.21 2.54 3.61 1.18 2.11 1.62____________________________________________________________________________________________________
51
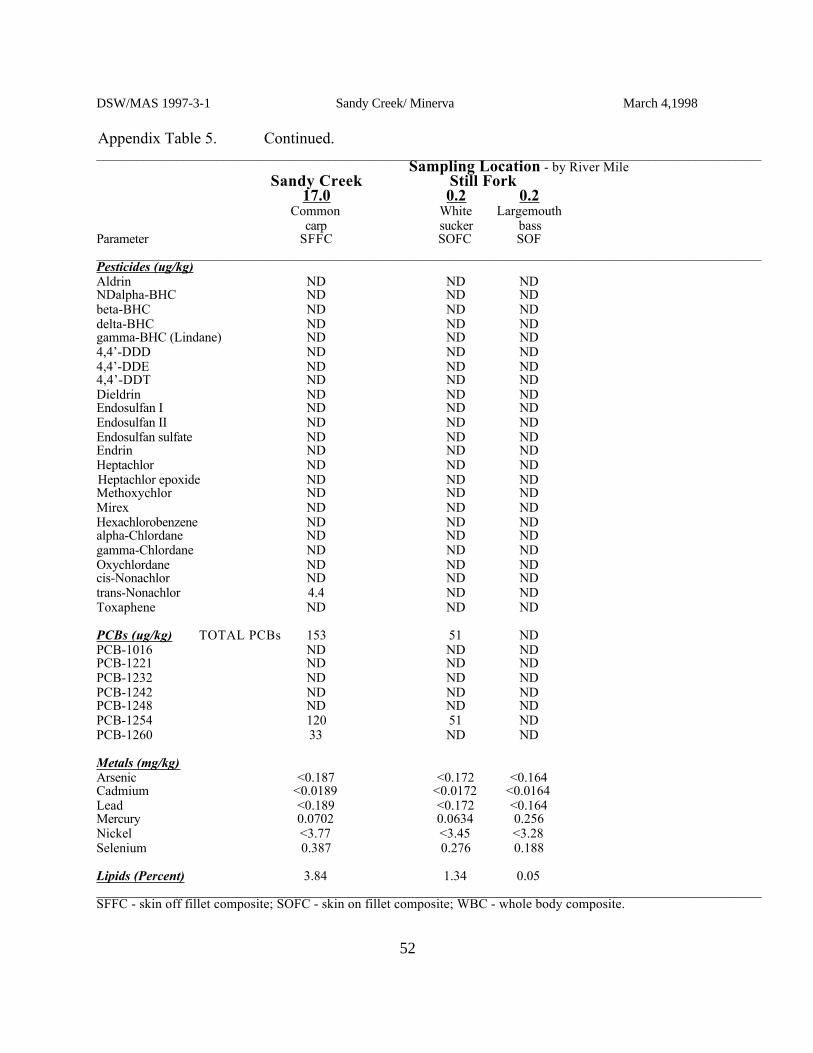
DSW/MAS 1997-3-1 Sandy Creek/ Minerva March 4,1998
Appendix Table 5. Continued.____________________________________________________________________________________________________
Sampling Location - by River Mile Sandy Creek Still Fork
17.0 0.2 0.2Common White Largemouth
carp sucker bassParameter SFFC SOFC SOF____________________________________________________________________________________________________Pesticides (ug/kg)Aldrin ND ND NDNDalpha-BHC ND ND NDbeta-BHC ND ND NDdelta-BHC ND ND NDgamma-BHC (Lindane) ND ND ND4,4’-DDD ND ND ND4,4’-DDE ND ND ND4,4’-DDT ND ND NDDieldrin ND ND NDEndosulfan I ND ND NDEndosulfan II ND ND NDEndosulfan sulfate ND ND NDEndrin ND ND NDHeptachlor ND ND NDHeptachlor epoxide ND ND NDMethoxychlor ND ND NDMirex ND ND NDHexachlorobenzene ND ND NDalpha-Chlordane ND ND NDgamma-Chlordane ND ND NDOxychlordane ND ND NDcis-Nonachlor ND ND NDtrans-Nonachlor 4.4 ND NDToxaphene ND ND ND
PCBs (ug/kg) TOTAL PCBs 153 51 NDPCB-1016 ND ND NDPCB-1221 ND ND NDPCB-1232 ND ND NDPCB-1242 ND ND NDPCB-1248 ND ND NDPCB-1254 120 51 NDPCB-1260 33 ND ND
Metals (mg/kg)Arsenic <0.187 <0.172 <0.164Cadmium <0.0189 <0.0172 <0.0164Lead <0.189 <0.172 <0.164Mercury 0.0702 0.0634 0.256Nickel <3.77 <3.45 <3.28Selenium 0.387 0.276 0.188
Lipids (Percent) 3.84 1.34 0.05____________________________________________________________________________________________________SFFC - skin off fillet composite; SOFC - skin on fillet composite; WBC - whole body composite.
52
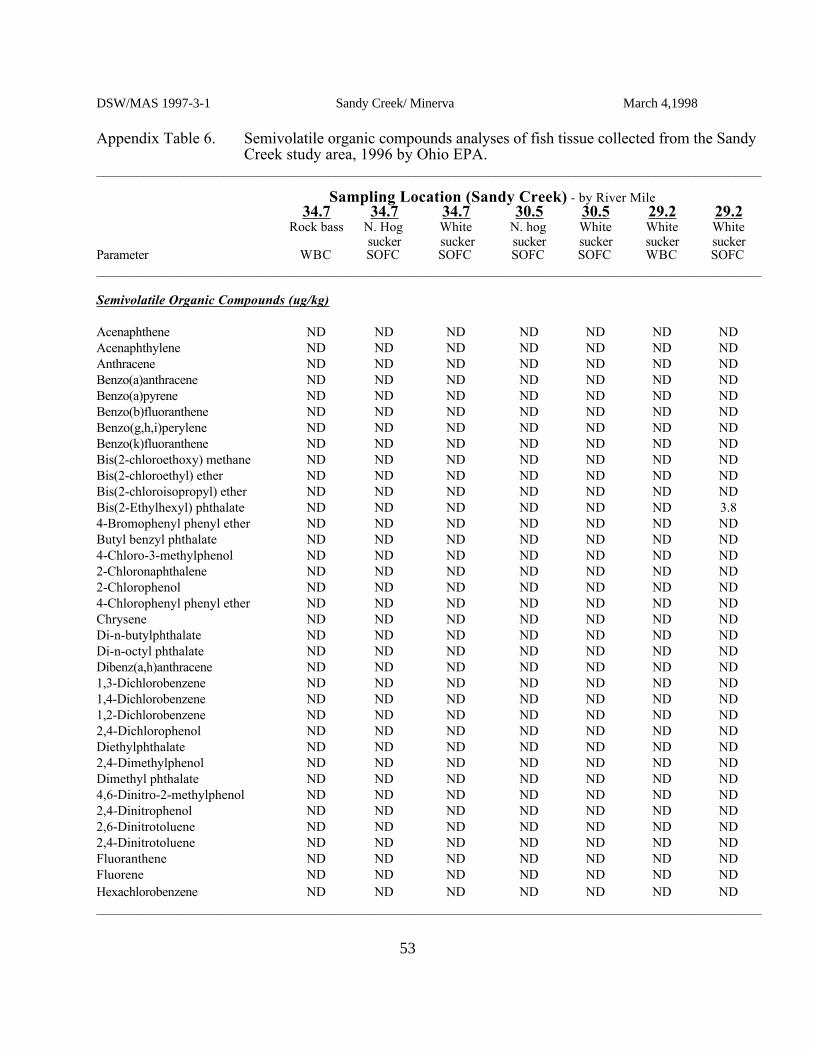
DSW/MAS 1997-3-1 Sandy Creek/ Minerva March 4,1998
Appendix Table 6. Semivolatile organic compounds analyses of fish tissue collected from the SandyCreek study area, 1996 by Ohio EPA.
____________________________________________________________________________________________________
Sampling Location (Sandy Creek) - by River Mile 34.7 34.7 34.7 30.5 30.5 29.2 29.2
Rock bass N. Hog White N. hog White White Whitesucker sucker sucker sucker sucker sucker
Parameter WBC SOFC SOFC SOFC SOFC WBC SOFC____________________________________________________________________________________________________
Semivolatile Organic Compounds (ug/kg)
Acenaphthene ND ND ND ND ND ND NDAcenaphthylene ND ND ND ND ND ND NDAnthracene ND ND ND ND ND ND NDBenzo(a)anthracene ND ND ND ND ND ND NDBenzo(a)pyrene ND ND ND ND ND ND NDBenzo(b)fluoranthene ND ND ND ND ND ND NDBenzo(g,h,i)perylene ND ND ND ND ND ND NDBenzo(k)fluoranthene ND ND ND ND ND ND NDBis(2-chloroethoxy) methane ND ND ND ND ND ND NDBis(2-chloroethyl) ether ND ND ND ND ND ND NDBis(2-chloroisopropyl) ether ND ND ND ND ND ND NDBis(2-Ethylhexyl) phthalate ND ND ND ND ND ND 3.84-Bromophenyl phenyl ether ND ND ND ND ND ND NDButyl benzyl phthalate ND ND ND ND ND ND ND4-Chloro-3-methylphenol ND ND ND ND ND ND ND2-Chloronaphthalene ND ND ND ND ND ND ND2-Chlorophenol ND ND ND ND ND ND ND4-Chlorophenyl phenyl ether ND ND ND ND ND ND NDChrysene ND ND ND ND ND ND NDDi-n-butylphthalate ND ND ND ND ND ND NDDi-n-octyl phthalate ND ND ND ND ND ND NDDibenz(a,h)anthracene ND ND ND ND ND ND ND1,3-Dichlorobenzene ND ND ND ND ND ND ND1,4-Dichlorobenzene ND ND ND ND ND ND ND1,2-Dichlorobenzene ND ND ND ND ND ND ND2,4-Dichlorophenol ND ND ND ND ND ND NDDiethylphthalate ND ND ND ND ND ND ND2,4-Dimethylphenol ND ND ND ND ND ND NDDimethyl phthalate ND ND ND ND ND ND ND4,6-Dinitro-2-methylphenol ND ND ND ND ND ND ND2,4-Dinitrophenol ND ND ND ND ND ND ND2,6-Dinitrotoluene ND ND ND ND ND ND ND2,4-Dinitrotoluene ND ND ND ND ND ND NDFluoranthene ND ND ND ND ND ND NDFluorene ND ND ND ND ND ND NDHexachlorobenzene ND ND ND ND ND ND ND____________________________________________________________________________________________________
53

DSW/MAS 1997-3-1 Sandy Creek/ Minerva March 4,1998
Appendix Table 6. Continued.____________________________________________________________________________________________________
Sampling Location (Sandy Creek) - by River Mile 34.7 34.7 34.7 30.5 30.5 29.2 29.2
Rock bass N. Hog White N. hog White White Whitesucker sucker sucker sucker sucker sucker
Parameter WBC SOFC SOFC SOFC SOFC WBC SOFC____________________________________________________________________________________________________
Semivolatile Organic Compounds (ug/kg)
Hexachlorobutadiene ND ND ND ND ND ND NDHexachlorocyclopentadiene ND ND ND ND ND ND NDHexachloroethane ND ND ND ND ND ND NDIndeno(1,2,3-cd)pyrene ND ND ND ND ND ND NDIsophorone ND ND ND ND ND ND NDN-Nitroso-di-n-propylamine ND ND ND ND ND ND NDN-Nitrosodiphenylamine ND ND ND ND ND ND NDNaphthalene ND ND ND ND ND ND NDNitrobenzene ND ND ND ND ND ND ND2-Nitrophenol ND ND ND ND ND ND ND4-Nitrophenol ND ND ND ND ND ND NDPentachlorophenol ND ND ND ND ND ND NDPhenanthrene ND ND ND ND ND ND NDPhenol ND ND ND ND ND ND NDPyrene ND ND ND ND ND ND ND1,2,4-Trichlorobenzene ND ND ND ND ND ND ND2,4,6-Trichlorophenol ND ND ND ND ND ND ND___________________________________________________________________________________
54
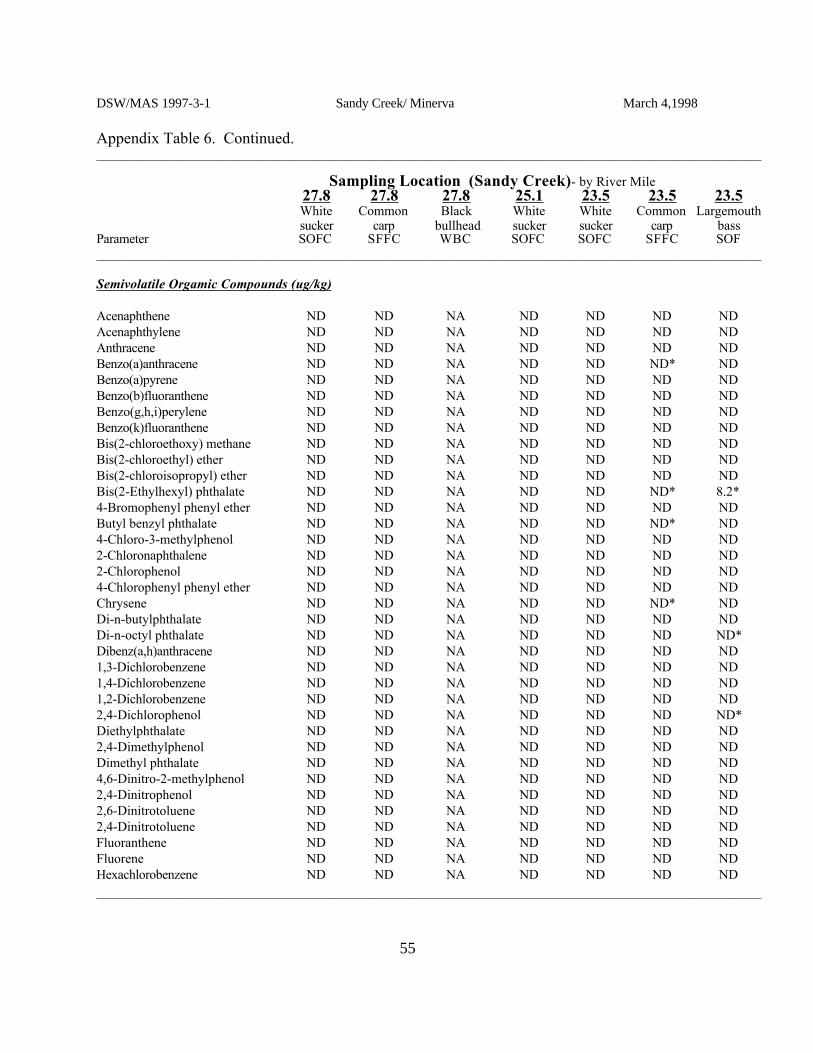
DSW/MAS 1997-3-1 Sandy Creek/ Minerva March 4,1998
Appendix Table 6. Continued.____________________________________________________________________________________________________
Sampling Location (Sandy Creek)- by River Mile 27.8 27.8 27.8 25.1 23.5 23.5 23.5White Common Black White White Common Largemouthsucker carp bullhead sucker sucker carp bass
Parameter SOFC SFFC WBC SOFC SOFC SFFC SOF____________________________________________________________________________________________________
Semivolatile Orgamic Compounds (ug/kg)
Acenaphthene ND ND NA ND ND ND NDAcenaphthylene ND ND NA ND ND ND NDAnthracene ND ND NA ND ND ND NDBenzo(a)anthracene ND ND NA ND ND ND* NDBenzo(a)pyrene ND ND NA ND ND ND NDBenzo(b)fluoranthene ND ND NA ND ND ND NDBenzo(g,h,i)perylene ND ND NA ND ND ND NDBenzo(k)fluoranthene ND ND NA ND ND ND NDBis(2-chloroethoxy) methane ND ND NA ND ND ND NDBis(2-chloroethyl) ether ND ND NA ND ND ND NDBis(2-chloroisopropyl) ether ND ND NA ND ND ND NDBis(2-Ethylhexyl) phthalate ND ND NA ND ND ND* 8.2*4-Bromophenyl phenyl ether ND ND NA ND ND ND NDButyl benzyl phthalate ND ND NA ND ND ND* ND4-Chloro-3-methylphenol ND ND NA ND ND ND ND2-Chloronaphthalene ND ND NA ND ND ND ND2-Chlorophenol ND ND NA ND ND ND ND4-Chlorophenyl phenyl ether ND ND NA ND ND ND NDChrysene ND ND NA ND ND ND* NDDi-n-butylphthalate ND ND NA ND ND ND NDDi-n-octyl phthalate ND ND NA ND ND ND ND*Dibenz(a,h)anthracene ND ND NA ND ND ND ND1,3-Dichlorobenzene ND ND NA ND ND ND ND1,4-Dichlorobenzene ND ND NA ND ND ND ND1,2-Dichlorobenzene ND ND NA ND ND ND ND2,4-Dichlorophenol ND ND NA ND ND ND ND*Diethylphthalate ND ND NA ND ND ND ND2,4-Dimethylphenol ND ND NA ND ND ND NDDimethyl phthalate ND ND NA ND ND ND ND4,6-Dinitro-2-methylphenol ND ND NA ND ND ND ND2,4-Dinitrophenol ND ND NA ND ND ND ND2,6-Dinitrotoluene ND ND NA ND ND ND ND2,4-Dinitrotoluene ND ND NA ND ND ND NDFluoranthene ND ND NA ND ND ND NDFluorene ND ND NA ND ND ND NDHexachlorobenzene ND ND NA ND ND ND ND____________________________________________________________________________________________________
55
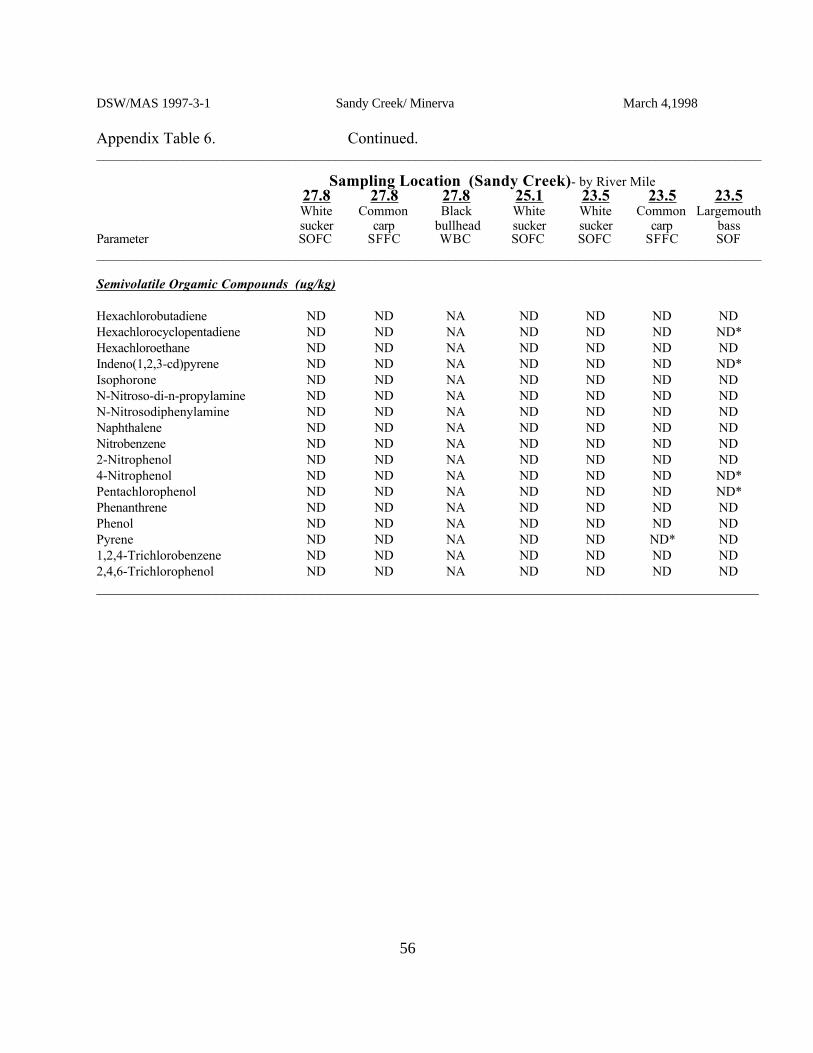
DSW/MAS 1997-3-1 Sandy Creek/ Minerva March 4,1998
Appendix Table 6. Continued.____________________________________________________________________________________________________
Sampling Location (Sandy Creek)- by River Mile 27.8 27.8 27.8 25.1 23.5 23.5 23.5White Common Black White White Common Largemouthsucker carp bullhead sucker sucker carp bass
Parameter SOFC SFFC WBC SOFC SOFC SFFC SOF____________________________________________________________________________________________________
Semivolatile Orgamic Compounds (ug/kg)
Hexachlorobutadiene ND ND NA ND ND ND NDHexachlorocyclopentadiene ND ND NA ND ND ND ND*Hexachloroethane ND ND NA ND ND ND NDIndeno(1,2,3-cd)pyrene ND ND NA ND ND ND ND*Isophorone ND ND NA ND ND ND NDN-Nitroso-di-n-propylamine ND ND NA ND ND ND NDN-Nitrosodiphenylamine ND ND NA ND ND ND NDNaphthalene ND ND NA ND ND ND NDNitrobenzene ND ND NA ND ND ND ND2-Nitrophenol ND ND NA ND ND ND ND4-Nitrophenol ND ND NA ND ND ND ND*Pentachlorophenol ND ND NA ND ND ND ND*Phenanthrene ND ND NA ND ND ND NDPhenol ND ND NA ND ND ND NDPyrene ND ND NA ND ND ND* ND1,2,4-Trichlorobenzene ND ND NA ND ND ND ND2,4,6-Trichlorophenol ND ND NA ND ND ND ND___________________________________________________________________________________
56

DSW/MAS 1997-3-1 Sandy Creek/ Minerva March 4,1998
Appendix Table 6. Continued.____________________________________________________________________________________________________
Sampling Location (Sandy Creek) - by River Mile 23.5 23.5 23.5 23.5 22.1 22.1 17.0
Largemouth Common Blue- Common N. hog White Whitebass carp gill carp sucker sucker sucker
Parameter SOFC WB WBC WBC SOFC SOFC SOFC____________________________________________________________________________________________________
Semivolatile Orgamic Compounds (ug/kg)
Acenaphthene ND NA NA NA ND ND NDAcenaphthylene ND NA NA NA ND ND NDAnthracene ND NA NA NA ND ND NDBenzo(a)anthracene ND NA NA NA ND ND NDBenzo(a)pyrene ND NA NA NA ND ND NDBenzo(b)fluoranthene ND NA NA NA ND ND NDBenzo(g,h,i)perylene ND NA NA NA ND ND NDBenzo(k)fluoranthene ND NA NA NA ND ND NDBis(2-chloroethoxy) methane ND NA NA NA ND ND NDBis(2-chloroethyl) ether ND NA NA NA ND ND NDBis(2-chloroisopropyl) ether ND NA NA NA ND ND NDBis(2-Ethylhexyl) phthalate ND NA NA NA ND ND ND4-Bromophenyl phenyl ether ND NA NA NA ND ND NDButyl benzyl phthalate ND NA NA NA ND ND ND4-Chloro-3-methylphenol ND NA NA NA ND ND ND2-Chloronaphthalene ND NA NA NA ND ND ND2-Chlorophenol ND NA NA NA ND ND ND4-Chlorophenyl phenyl ether ND NA NA NA ND ND NDChrysene ND NA NA NA ND ND NDDi-n-butylphthalate ND NA NA NA ND ND NDDi-n-octyl phthalate ND NA NA NA ND ND NDDibenz(a,h)anthracene ND NA NA NA ND ND ND1,3-Dichlorobenzene ND NA NA NA ND ND ND1,4-Dichlorobenzene ND NA NA NA ND ND ND1,2-Dichlorobenzene ND NA NA NA ND ND ND2,4-Dichlorophenol ND NA NA NA ND ND NDDiethylphthalate ND NA NA NA ND ND ND2,4-Dimethylphenol ND NA NA NA ND ND NDDimethyl phthalate ND NA NA NA ND ND ND4,6-Dinitro-2-methylphenol ND NA NA NA ND ND ND2,4-Dinitrophenol ND NA NA NA ND ND ND2,6-Dinitrotoluene ND NA NA NA ND ND ND2,4-Dinitrotoluene ND NA NA NA ND ND NDFluoranthene ND NA NA NA ND ND NDFluorene ND NA NA NA ND ND NDHexachlorobenzene ND NA NA NA ND ND ND____________________________________________________________________________________________________
57

DSW/MAS 1997-3-1 Sandy Creek/ Minerva March 4,1998
Appendix Table 6. Continued.____________________________________________________________________________________________________
Sampling Location (Sandy Creek) - by River Mile 23.5 23.5 23.5 23.5 22.1 22.1 17.0
Largemouth Common Blue- Common N. hog White Whitebass carp gill carp sucker sucker sucker
Parameter SOFC WB WBC WBC SOFC SOFC SOFC____________________________________________________________________________________________________
Semivolatile Orgamic Compounds (ug/kg)
Hexachlorobutadiene ND NA NA NA ND ND NDHexachlorocyclopentadiene ND NA NA NA ND ND NDHexachloroethane ND NA NA NA ND ND NDIndeno(1,2,3-cd)pyrene ND NA NA NA ND ND NDIsophorone ND NA NA NA ND ND NDN-Nitroso-di-n-propylamine ND NA NA NA ND ND NDN-Nitrosodiphenylamine ND NA NA NA ND ND NDNaphthalene ND NA NA NA ND ND NDNitrobenzene ND NA NA NA ND ND ND2-Nitrophenol ND NA NA NA ND ND ND4-Nitrophenol ND NA NA NA ND ND NDPentachlorophenol ND NA NA NA ND ND NDPhenanthrene ND NA NA NA ND ND NDPhenol ND NA NA NA ND ND NDPyrene ND NA NA NA ND ND ND1,2,4-Trichlorobenzene ND NA NA NA ND ND ND2,4,6-Trichlorophenol ND NA NA NA ND ND ND___________________________________________________________________________________
58

DSW/MAS 1997-3-1 Sandy Creek/ Minerva March 4,1998
Appendix Table 6. Continued.____________________________________________________________________________________________________
Sampling Location - by River Mile Sandy Creek Still Fork
17.0 0.2 0.2Common White Largemouth
carp sucker bassParameter SFFC SOFC SOF____________________________________________________________________________________________________
Semivolatile Orgamic Compounds (ug/kg)
Acenaphthene ND ND NDAcenaphthylene ND ND NDAnthracene ND ND NDBenzo(a)anthracene ND ND ND*Benzo(a)pyrene ND ND NDBenzo(b)fluoranthene ND ND NDBenzo(g,h,i)perylene ND ND NDBenzo(k)fluoranthene ND ND NDBis(2-chloroethoxy) methane ND ND NDBis(2-chloroethyl) ether ND ND NDBis(2-chloroisopropyl) ether ND ND NDBis(2-Ethylhexyl) phthalate ND ND ND*4-Bromophenyl phenyl ether ND ND NDButyl benzyl phthalate ND ND ND*4-Chloro-3-methylphenol ND ND ND2-Chloronaphthalene ND ND ND2-Chlorophenol ND ND ND4-Chlorophenyl phenyl ether ND ND NDChrysene ND ND ND*Di-n-butylphthalate ND ND NDDi-n-octyl phthalate ND ND NDDibenz(a,h)anthracene ND ND ND1,3-Dichlorobenzene ND ND ND1,4-Dichlorobenzene ND ND ND1,2-Dichlorobenzene ND ND ND2,4-Dichlorophenol ND ND NDDiethylphthalate ND ND ND2,4-Dimethylphenol ND ND NDDimethyl phthalate ND ND ND4,6-Dinitro-2-methylphenol ND ND ND2,4-Dinitrophenol ND ND ND*2,6-Dinitrotoluene ND ND ND2,4-Dinitrotoluene ND ND NDFluoranthene ND ND NDFluorene ND ND NDHexachlorobenzene ND ND ND____________________________________________________________________________________________________
59

DSW/MAS 1997-3-1 Sandy Creek/ Minerva March 4,1998
Appendix Table 6. Continued.____________________________________________________________________________________________________
Sampling Location - by River Mile Sandy Creek Still Fork
17.0 0.2 0.2Common White Largemouth
carp sucker bassParameter SFFC SOFC SOF____________________________________________________________________________________________________
Semivolatile Orgamic Compounds (ug/kg)
Hexachlorobutadiene ND ND NDHexachlorocyclopentadiene ND ND ND*Hexachloroethane ND ND NDIndeno(1,2,3-cd)pyrene ND ND NDIsophorone ND ND NDN-Nitroso-di-n-propylamine ND ND NDN-Nitrosodiphenylamine ND ND NDNaphthalene ND ND NDNitrobenzene ND ND ND2-Nitrophenol ND ND ND4-Nitrophenol ND ND ND*Pentachlorophenol ND ND NDPhenanthrene ND ND NDPhenol ND ND NDPyrene ND ND ND*1,2,4-Trichlorobenzene ND ND ND2,4,6-Trichlorophenol ND ND ND___________________________________________________________________________________
SFFC - skin off fillet composite; SOFC - skin on fillet composite; WBC - whole body composite. * - results cannot be validated because of matrix interference.
60