Bioinformatics and Sequence Alignment · Bioinformatics uses the statistical analysis of protein...
29
University of Illinois at Urbana-Champaign Luthey-Schulten Group Beckman Institute for Advanced Science and Technology Theoretical and Computational Biophysics Group San Francisco Workshop Bioinformatics and Sequence Alignment Felix Autenrieth Barry Isralewitz Zaida Luthey-Schulten Anurag Sethi Taras Pogorelov June 2005
Transcript of Bioinformatics and Sequence Alignment · Bioinformatics uses the statistical analysis of protein...
University of Illinois at Urbana-ChampaignLuthey-Schulten GroupBeckman Institute for Advanced Science and TechnologyTheoretical and Computational Biophysics GroupSan Francisco Workshop
Bioinformatics andSequence Alignment
Felix Autenrieth
Barry Isralewitz
Zaida Luthey-Schulten
Anurag Sethi
Taras Pogorelov
June 2005
CONTENTS 2
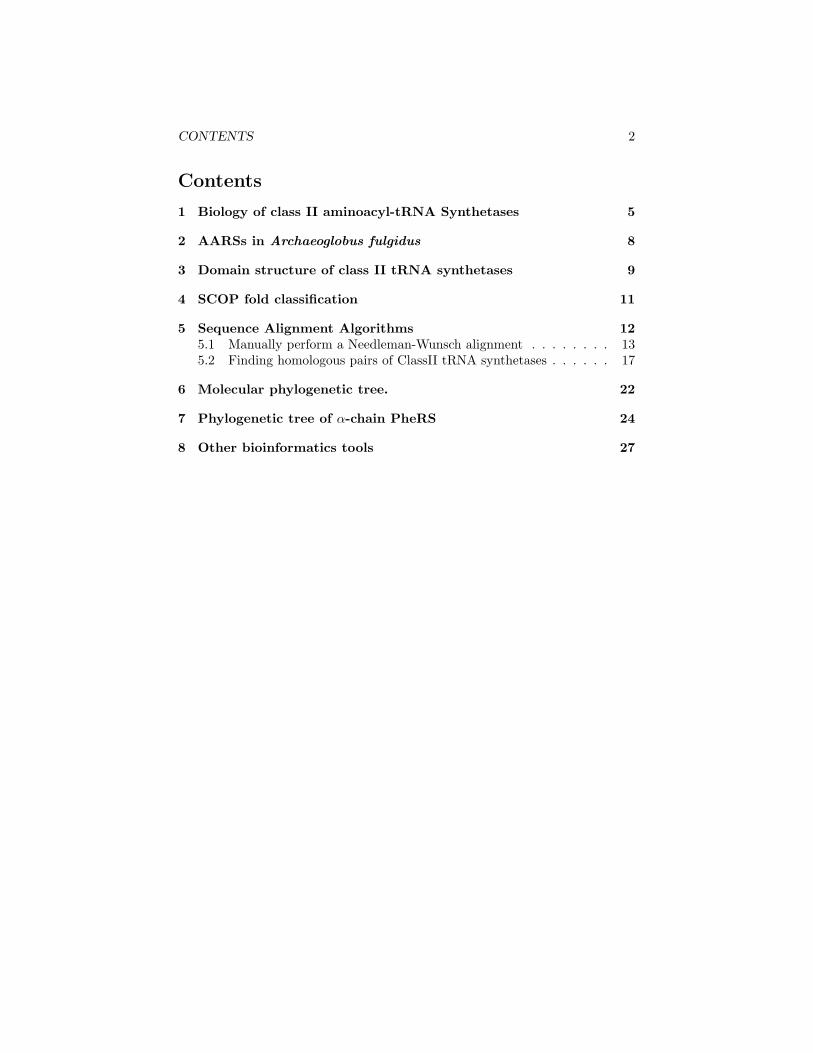
Contents
1 Biology of class II aminoacyl-tRNA Synthetases 5
2 AARSs in Archaeoglobus fulgidus 8
3 Domain structure of class II tRNA synthetases 9
4 SCOP fold classification 11
5 Sequence Alignment Algorithms 125.1 Manually perform a Needleman-Wunsch alignment . . . . . . . . 135.2 Finding homologous pairs of ClassII tRNA synthetases . . . . . . 17
6 Molecular phylogenetic tree. 22
7 Phylogenetic tree of α-chain PheRS 24
8 Other bioinformatics tools 27

CONTENTS 3
Introduction
The sequencing of the genomes from several organisms, and high-throughput X-ray structure analysis, have brought to the scientific community a large amountof data about the sequences and structures of several thousand proteins. Thisinformation can effectively be used for medical and biological research only if onecan extract functional insight from it. Two main computational techniques existto help us reach this goal: a bioinformatics approach, and full atom moleculardynamics simulations. Bioinformatics uses the statistical analysis of proteinsequences and structures to help annotate the genome, to understand theirfunction, and to predict structures when only sequence information is available.Molecular modeling and molecular dynamics simulations use the principles fromphysics and physical chemistry to study the function and folding of proteins.Bioinformatics methods are among the most powerful technologies availablein life sciences today. They are used in fundamental research on theories ofevolution and in more practical considerations of protein design. Algorithms andapproaches used in these studies range from sequence and structure alignments,secondary structure prediction, functional classification of proteins, threadingand modeling of distantly-related homologous proteins to modeling the progressof protein expression through a cell’s life cycle.
In this tutorial you will begin with classical pairwise sequence alignmentmethods using the Needleman-Wunsch algorithm, and end with the multiplesequence alignment available through CLUSTAL W. You will start out only withsequence and biological information of class II aminoacyl-tRNA synthetases, keyplayers in the translational mechanism of cell. Then you will classify proteindomains and align the catalytic domains. If structural alignments are consideredto be the true alignments, you will see that simple pair sequence alignment oftwo proteins with low sequence identity has serious limitations. Finally youwill determine the phylogenetic relationship of class II tRNA synthetases witha dendrogram algorithm. You will carry out the exercises with the programMATLAB and the Needleman-Wunsch alignment program provided by A. Sethi.Many of the tools of the field can be freely accessed by any person with a webbrowser; a listing of our favorite bioinformatics tools and resources is providedin Section 8.
CONTENTS 4
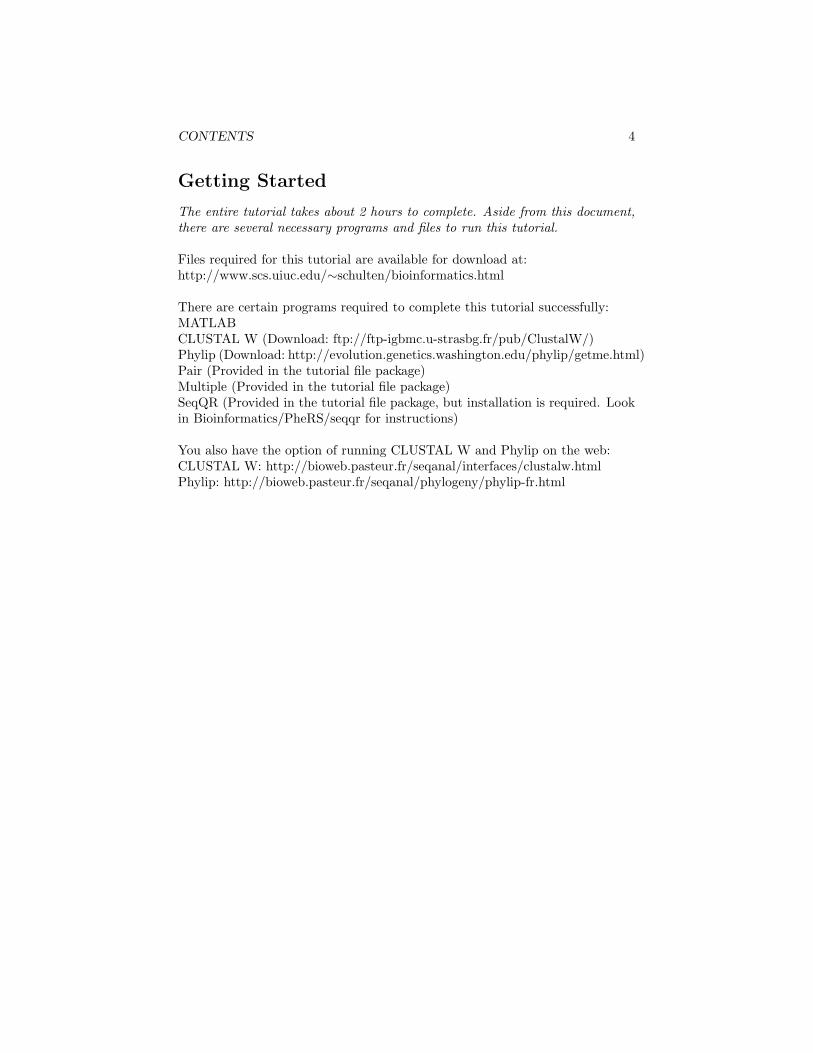
Getting Started
The entire tutorial takes about 2 hours to complete. Aside from this document,there are several necessary programs and files to run this tutorial.
Files required for this tutorial are available for download at:http://www.scs.uiuc.edu/∼schulten/bioinformatics.html
There are certain programs required to complete this tutorial successfully:MATLABCLUSTAL W (Download: ftp://ftp-igbmc.u-strasbg.fr/pub/ClustalW/)Phylip (Download: http://evolution.genetics.washington.edu/phylip/getme.html)Pair (Provided in the tutorial file package)Multiple (Provided in the tutorial file package)SeqQR (Provided in the tutorial file package, but installation is required. Lookin Bioinformatics/PheRS/seqqr for instructions)
You also have the option of running CLUSTAL W and Phylip on the web:CLUSTAL W: http://bioweb.pasteur.fr/seqanal/interfaces/clustalw.htmlPhylip: http://bioweb.pasteur.fr/seqanal/phylogeny/phylip-fr.html
1 BIOLOGY OF CLASS II AMINOACYL-TRNA SYNTHETASES 5
1 Biology of class II aminoacyl-tRNA Synthetases
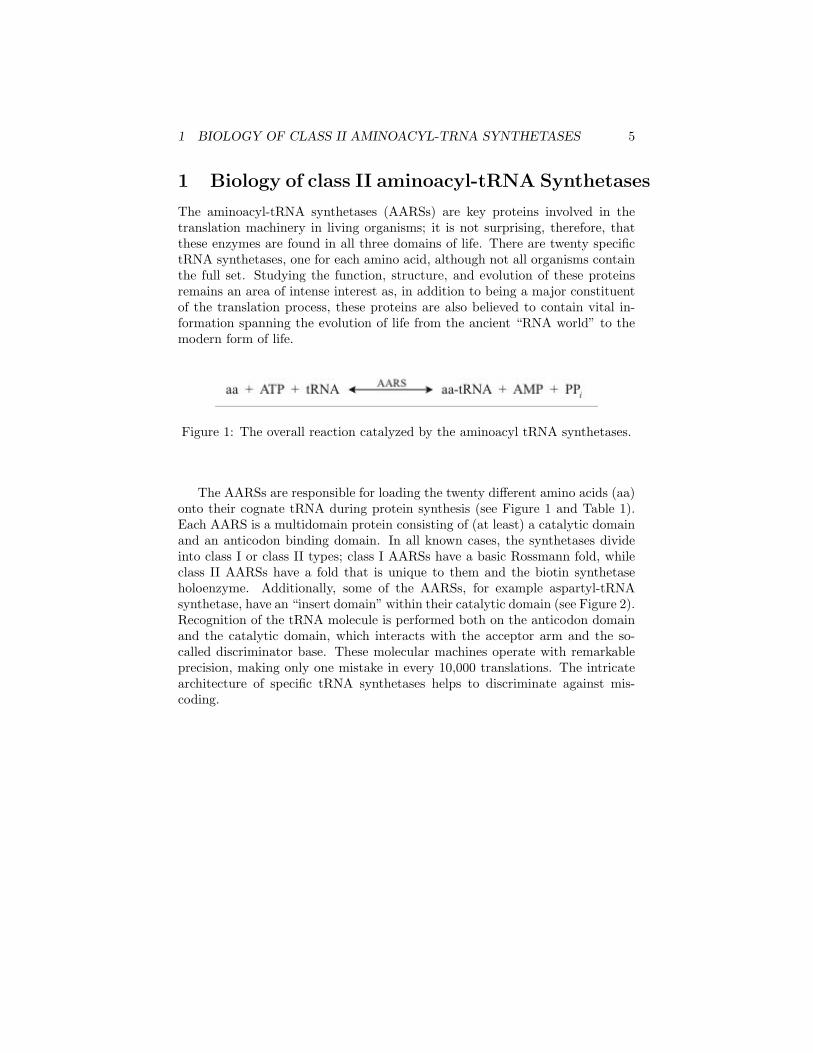
The aminoacyl-tRNA synthetases (AARSs) are key proteins involved in thetranslation machinery in living organisms; it is not surprising, therefore, thatthese enzymes are found in all three domains of life. There are twenty specifictRNA synthetases, one for each amino acid, although not all organisms containthe full set. Studying the function, structure, and evolution of these proteinsremains an area of intense interest as, in addition to being a major constituentof the translation process, these proteins are also believed to contain vital in-formation spanning the evolution of life from the ancient “RNA world” to themodern form of life.
Figure 1: The overall reaction catalyzed by the aminoacyl tRNA synthetases.
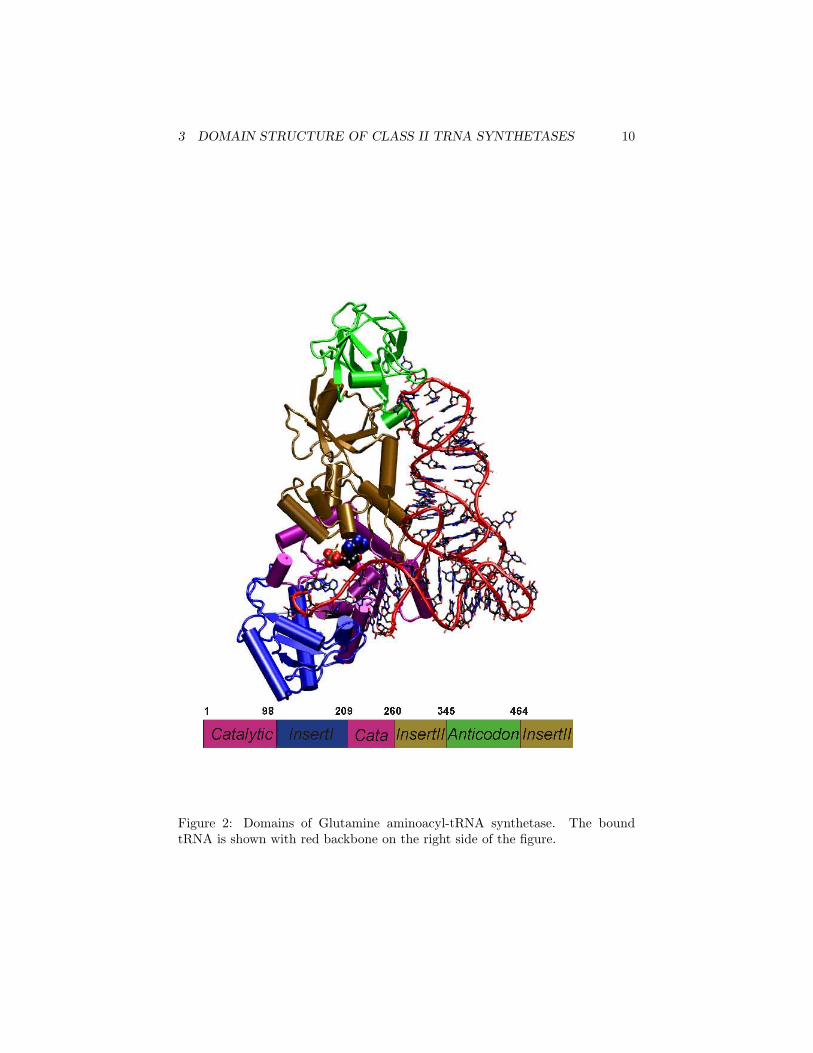
The AARSs are responsible for loading the twenty different amino acids (aa)onto their cognate tRNA during protein synthesis (see Figure 1 and Table 1).Each AARS is a multidomain protein consisting of (at least) a catalytic domainand an anticodon binding domain. In all known cases, the synthetases divideinto class I or class II types; class I AARSs have a basic Rossmann fold, whileclass II AARSs have a fold that is unique to them and the biotin synthetaseholoenzyme. Additionally, some of the AARSs, for example aspartyl-tRNAsynthetase, have an “insert domain” within their catalytic domain (see Figure 2).Recognition of the tRNA molecule is performed both on the anticodon domainand the catalytic domain, which interacts with the acceptor arm and the so-called discriminator base. These molecular machines operate with remarkableprecision, making only one mistake in every 10,000 translations. The intricatearchitecture of specific tRNA synthetases helps to discriminate against mis-coding.
1 BIOLOGY OF CLASS II AMINOACYL-TRNA SYNTHETASES 6
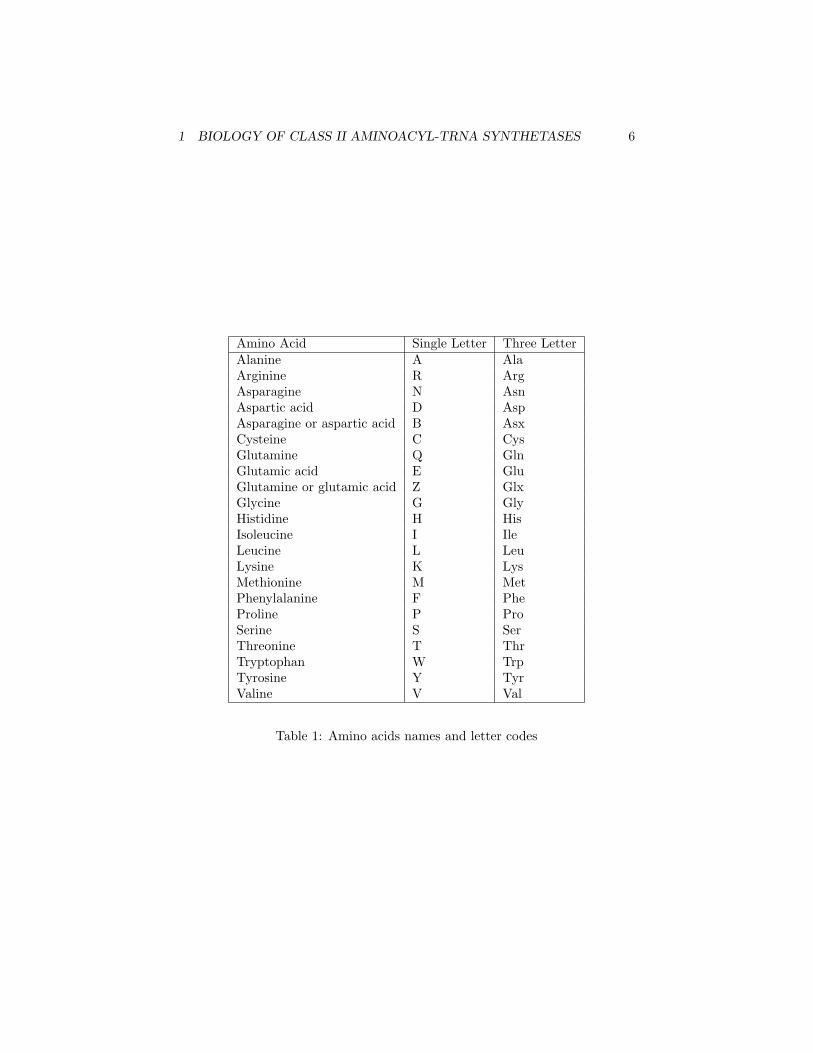
Amino Acid Single Letter Three LetterAlanine A AlaArginine R ArgAsparagine N AsnAspartic acid D AspAsparagine or aspartic acid B AsxCysteine C CysGlutamine Q GlnGlutamic acid E GluGlutamine or glutamic acid Z GlxGlycine G GlyHistidine H HisIsoleucine I IleLeucine L LeuLysine K LysMethionine M MetPhenylalanine F PheProline P ProSerine S SerThreonine T ThrTryptophan W TrpTyrosine Y TyrValine V Val
Table 1: Amino acids names and letter codes

1 BIOLOGY OF CLASS II AMINOACYL-TRNA SYNTHETASES 7
U C A GUUU Phe UCU Ser UAU Tyr UGU Cys U
U UUC Phe UCC Ser UAC Tory GU Cys CUUA Leu UCA Ser UAA stop UGA stop AUUG Leu UCG Ser UAG stop UGG Trp GCUU Leu CCU Pro CAU His CGU Arg U
C CUC Leu CCC Pro CAC His CGC Arg CCUA Leu CCA Pro CAA Gln CGA Arg ACUG Leu CCG Pro CAG Gln CGG Arg GAUU Ile ACU Thr AAU Asn AGU Ser U
A AUC Ile ACC Thr AAC Asn AGC Ser CAUA Ile ACA Thr AAA Lys AGA Arg AAUG∗ Met ACG Thr AAG Lys AGG Arg GGUU Val GCU Ala GAU Asp GGU Gly U
G GUC Val GCC Ala GAC Asp GGC Gly CGUA Val GCA Ala GAA Glu GGA Gly AGUG∗ Val GCG Ala GAG Glu GGG Gly G
Table 2: The genetic code. Some species have slightly different codes. ∗Thiscodon also specifies the initiator tRNAfMet.
2 AARSS IN ARCHAEOGLOBUS FULGIDUS 8
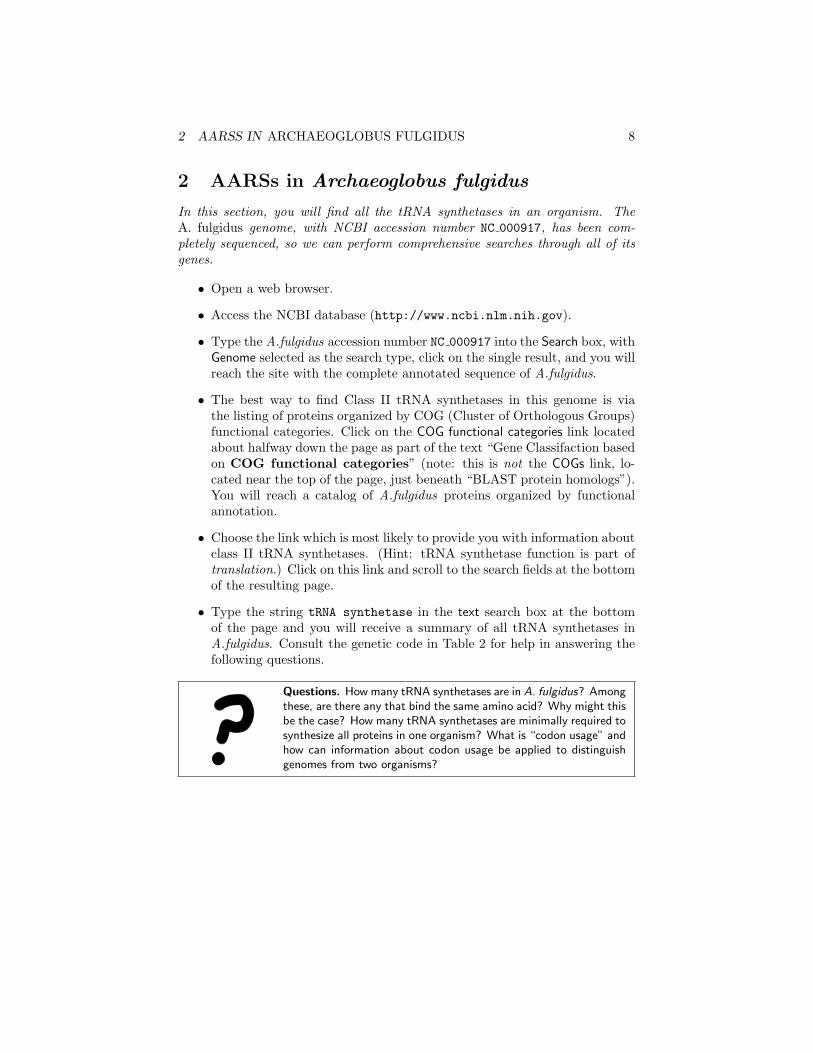
2 AARSs in Archaeoglobus fulgidus
In this section, you will find all the tRNA synthetases in an organism. TheA. fulgidus genome, with NCBI accession number NC 000917, has been com-pletely sequenced, so we can perform comprehensive searches through all of itsgenes.
• Open a web browser.
• Access the NCBI database (http://www.ncbi.nlm.nih.gov).
• Type the A.fulgidus accession number NC 000917 into the Search box, withGenome selected as the search type, click on the single result, and you willreach the site with the complete annotated sequence of A.fulgidus.
• The best way to find Class II tRNA synthetases in this genome is viathe listing of proteins organized by COG (Cluster of Orthologous Groups)functional categories. Click on the COG functional categories link locatedabout halfway down the page as part of the text “Gene Classifaction basedon COG functional categories” (note: this is not the COGs link, lo-cated near the top of the page, just beneath “BLAST protein homologs”).You will reach a catalog of A.fulgidus proteins organized by functionalannotation.
• Choose the link which is most likely to provide you with information aboutclass II tRNA synthetases. (Hint: tRNA synthetase function is part oftranslation.) Click on this link and scroll to the search fields at the bottomof the resulting page.
• Type the string tRNA synthetase in the text search box at the bottomof the page and you will receive a summary of all tRNA synthetases inA.fulgidus. Consult the genetic code in Table 2 for help in answering thefollowing questions.
Questions. How many tRNA synthetases are in A. fulgidus? Amongthese, are there any that bind the same amino acid? Why might thisbe the case? How many tRNA synthetases are minimally required tosynthesize all proteins in one organism? What is “codon usage” andhow can information about codon usage be applied to distinguishgenomes from two organisms?
3 DOMAIN STRUCTURE OF CLASS II TRNA SYNTHETASES 9
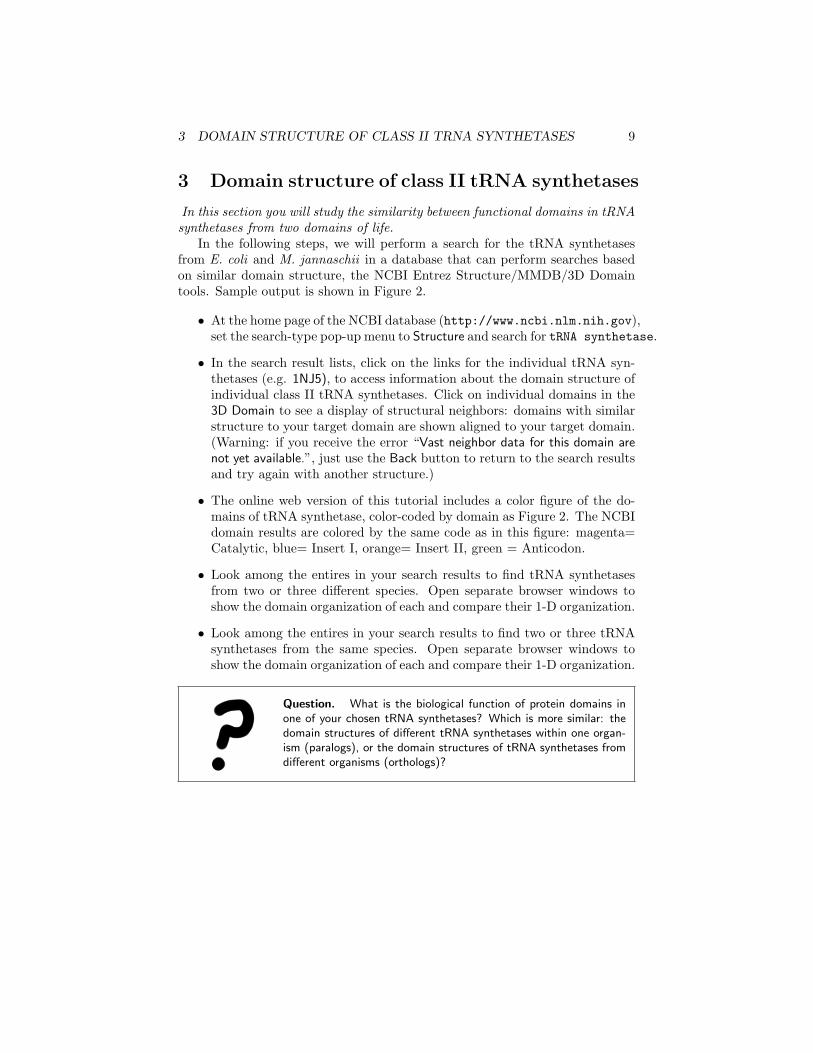
3 Domain structure of class II tRNA synthetases
In this section you will study the similarity between functional domains in tRNAsynthetases from two domains of life.
In the following steps, we will perform a search for the tRNA synthetasesfrom E. coli and M. jannaschii in a database that can perform searches basedon similar domain structure, the NCBI Entrez Structure/MMDB/3D Domaintools. Sample output is shown in Figure 2.
• At the home page of the NCBI database (http://www.ncbi.nlm.nih.gov),set the search-type pop-up menu to Structure and search for tRNA synthetase.
• In the search result lists, click on the links for the individual tRNA syn-thetases (e.g. 1NJ5), to access information about the domain structure ofindividual class II tRNA synthetases. Click on individual domains in the3D Domain to see a display of structural neighbors: domains with similarstructure to your target domain are shown aligned to your target domain.(Warning: if you receive the error “Vast neighbor data for this domain arenot yet available.”, just use the Back button to return to the search resultsand try again with another structure.)
• The online web version of this tutorial includes a color figure of the do-mains of tRNA synthetase, color-coded by domain as Figure 2. The NCBIdomain results are colored by the same code as in this figure: magenta=Catalytic, blue= Insert I, orange= Insert II, green = Anticodon.
• Look among the entires in your search results to find tRNA synthetasesfrom two or three different species. Open separate browser windows toshow the domain organization of each and compare their 1-D organization.
• Look among the entires in your search results to find two or three tRNAsynthetases from the same species. Open separate browser windows toshow the domain organization of each and compare their 1-D organization.
Question. What is the biological function of protein domains inone of your chosen tRNA synthetases? Which is more similar: thedomain structures of different tRNA synthetases within one organ-ism (paralogs), or the domain structures of tRNA synthetases fromdifferent organisms (orthologs)?
3 DOMAIN STRUCTURE OF CLASS II TRNA SYNTHETASES 10
Figure 2: Domains of Glutamine aminoacyl-tRNA synthetase. The boundtRNA is shown with red backbone on the right side of the figure.
4 SCOP FOLD CLASSIFICATION 11
4 SCOP fold classification
As with all multi-domain proteins, the properties of Class II tRNA synthetasesdepend on their component domains. The schematic domain structure of as-partyl class II tRNA synthetase from Eubacteria is depicted in Figure 2.
Only one domain is common to all class II tRNA synthetases studied sofar: the catalytic domain, which carries out the amino acid loading reaction.In later sections of this tutorial, you will align the catalytic domains of classII tRNA synthetases using Needleman-Wunsch sequence alignment, and withstructure-based alignment methods. The fourth column of Table 6 provideyou with the ASTRAL database accession codes [2]. The ASTRAL database( tt http://astral.stanford.edu) is a compendium of protein domain structuresderived from the PDB database [3].
In the following exercise you will classify one of your chosen catalytic domainsin folds, superfamilies and families with help of the database SCOP (StructuralClassification Of Proteins) [4].
• Point your web browser to the SCOP server(http://scop.berkeley.edu/index.html).
• You are going to browse a hierarchy of protein structural classifications.Go to the top of the hierarchy: Click on the link top of the hierarchy. Thisplaces you at the root of all the protein classes deposited in SCOP.
• Click on one of the Classes links (e.g. Alpha and Beta proteins); you shouldreach the next hierarchy level of folds. Note how lineage records your paththrough the hierarchy.
• Some of the 3D structure renderings of an example of the protein classentries have been prepared in advance. Click on the purple and whitebuttons to the right of a few entries to see an example view of the chosenprotein class.
• We will now search for entries relevant to a particular domain of interest.Now enter one of the ASTRAL database catalytic domain codes fromTable 6 (e.g. d1asza2) in the Search field you find at the bottom of thepage.
• You should reach a window showing the SCOP lineage and a summary ofall relevant PDB entry domains. For subsequent exercises we have pro-vided you with catalytic domain coordinates of Class II tRNA synthetasesobtained from the ASTRAL database. The ASTRAL coordinate files areproduced by extracting domains from PDB coordinate files.
Questions. What is the lineage of your chosen tRNA synthetasedomain? What are some other members in the SCOP family andsuperfamily of the catalytic domain of Class II tRNA synthetase?What is the most abundant fold in SCOP’s ”Alpha and Beta pro-teins” fold class ?
5 SEQUENCE ALIGNMENT ALGORITHMS 12
5 Sequence Alignment Algorithms
In this section you will optimally align two short protein sequences using penand paper, then search for homologous proteins by using a computer program toalign several, much longer, sequences.
Dynamic programming algorithms are recursive algorithms modified to storeintermediate results, which improves efficiency for certain problems. The Smith-Waterman (Needleman-Wunsch) algorithm uses a dynamic programming algo-rithm to find the optimal local (global) alignment of two sequences — a and b.The alignment algorithm is based on finding the elements of a matrix H wherethe element Hi,j is the optimal score for aligning the sequence (a1,a2,...,ai) with(b1,b2,.....,bj). Two similar amino acids (e.g. arginine and lysine) receive a highscore, two dissimilar amino acids (e.g. arginine and glycine) receive a low score.The higher the score of a path through the matrix, the better the alignment.The matrix H is found by progressively finding the matrix elements, starting atH1,1 and proceeding in the directions of increasing i and j. Each element is setaccording to:
Hi,j = max
Hi−1,j−1 + Si,j
Hi−1,j − dHi,j−1 − d
Where Si,j is the similarity score of comparing amino acid ai to amino acidbj (obtained here from the BLOSUM40 similarity table) and d is the penaltyfor a single gap. The matrix is initialized with H0,0 = 0. When obtaining thelocal Smith-Waterman alignment, Hi,j is modified:
Hi,j = max
0Hi−1,j−1 + Si,j
Hi−1,j − dHi,j−1 − d
The gap penalty can be modified, for instance, d can be replaced by (d× k),where d is the penalty for a single gap and k is the number of consecutive gaps.
Once the optimal alignment score is found, the “traceback” through H alongthe optimal path is found, which corresponds to the the optimal sequence align-ment for the score. In the next set of exercises you will manually implementthe Needleman-Wunsch alignment for a pair of short sequences, then performglobal sequence alignments with a computer program developed by AnuragSethi, which is based on the Needleman-Wunsch algorithm with an affine gappenalty, d + e(k− 1), where e is the extension gap penalty. The output file willbe in the GCG format, one of the two standard formats in bioinformatics forstoring sequence information (the other standard format is FASTA).
5 SEQUENCE ALIGNMENT ALGORITHMS 13
5.1 Manually perform a Needleman-Wunsch alignment
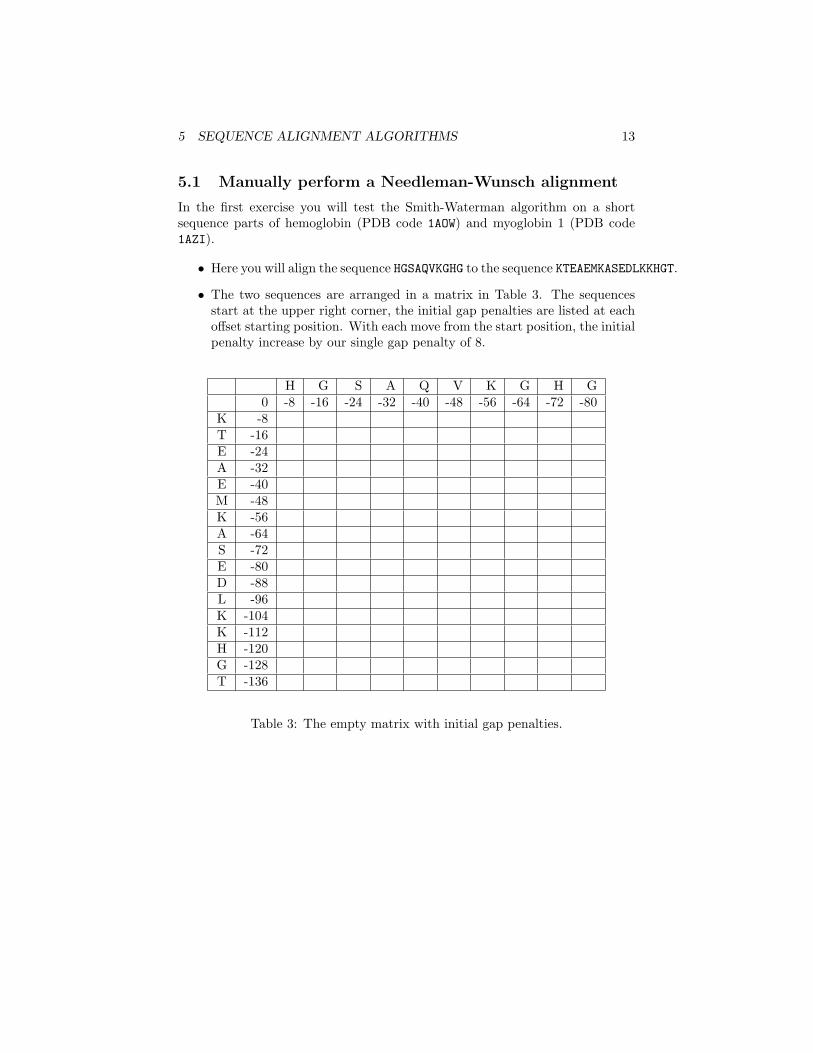
In the first exercise you will test the Smith-Waterman algorithm on a shortsequence parts of hemoglobin (PDB code 1AOW) and myoglobin 1 (PDB code1AZI).
• Here you will align the sequence HGSAQVKGHG to the sequence KTEAEMKASEDLKKHGT.
• The two sequences are arranged in a matrix in Table 3. The sequencesstart at the upper right corner, the initial gap penalties are listed at eachoffset starting position. With each move from the start position, the initialpenalty increase by our single gap penalty of 8.
H G S A Q V K G H G0 -8 -16 -24 -32 -40 -48 -56 -64 -72 -80
K -8T -16E -24A -32E -40M -48K -56A -64S -72E -80D -88L -96K -104K -112H -120G -128T -136
Table 3: The empty matrix with initial gap penalties.
5 SEQUENCE ALIGNMENT ALGORITHMS 14
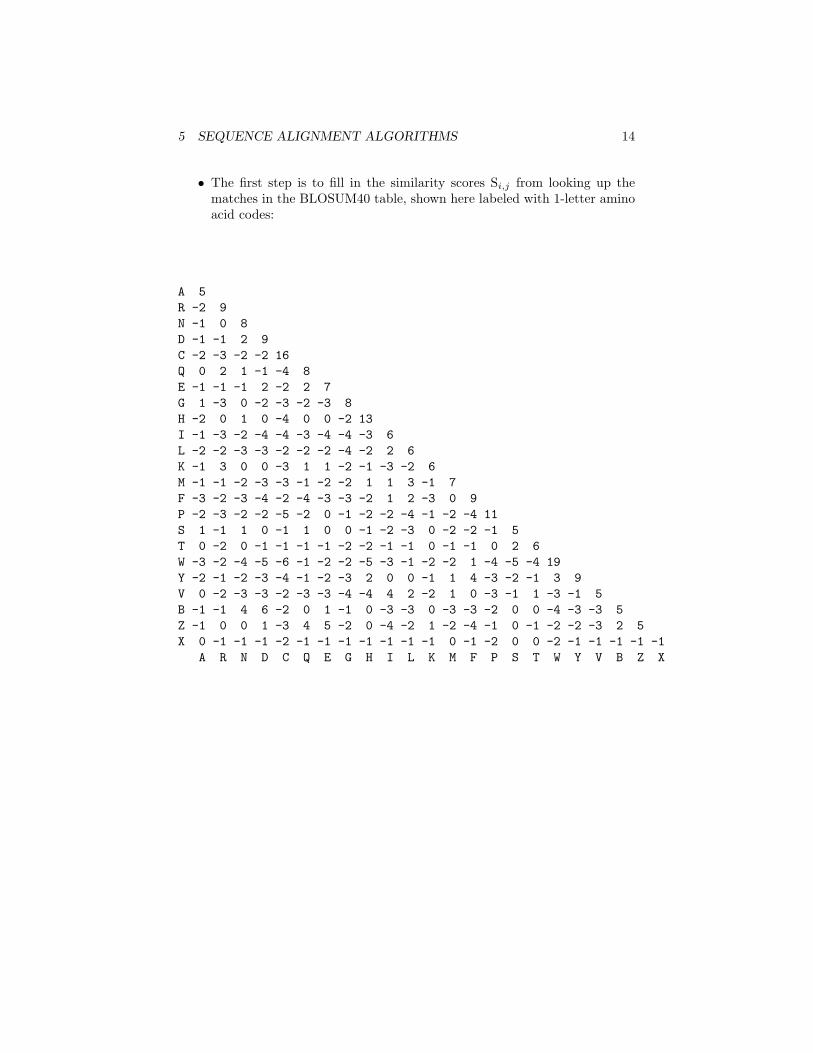
• The first step is to fill in the similarity scores Si,j from looking up thematches in the BLOSUM40 table, shown here labeled with 1-letter aminoacid codes:
A 5R -2 9N -1 0 8D -1 -1 2 9C -2 -3 -2 -2 16Q 0 2 1 -1 -4 8E -1 -1 -1 2 -2 2 7G 1 -3 0 -2 -3 -2 -3 8H -2 0 1 0 -4 0 0 -2 13I -1 -3 -2 -4 -4 -3 -4 -4 -3 6L -2 -2 -3 -3 -2 -2 -2 -4 -2 2 6K -1 3 0 0 -3 1 1 -2 -1 -3 -2 6M -1 -1 -2 -3 -3 -1 -2 -2 1 1 3 -1 7F -3 -2 -3 -4 -2 -4 -3 -3 -2 1 2 -3 0 9P -2 -3 -2 -2 -5 -2 0 -1 -2 -2 -4 -1 -2 -4 11S 1 -1 1 0 -1 1 0 0 -1 -2 -3 0 -2 -2 -1 5T 0 -2 0 -1 -1 -1 -1 -2 -2 -1 -1 0 -1 -1 0 2 6W -3 -2 -4 -5 -6 -1 -2 -2 -5 -3 -1 -2 -2 1 -4 -5 -4 19Y -2 -1 -2 -3 -4 -1 -2 -3 2 0 0 -1 1 4 -3 -2 -1 3 9V 0 -2 -3 -3 -2 -3 -3 -4 -4 4 2 -2 1 0 -3 -1 1 -3 -1 5B -1 -1 4 6 -2 0 1 -1 0 -3 -3 0 -3 -3 -2 0 0 -4 -3 -3 5Z -1 0 0 1 -3 4 5 -2 0 -4 -2 1 -2 -4 -1 0 -1 -2 -2 -3 2 5X 0 -1 -1 -1 -2 -1 -1 -1 -1 -1 -1 -1 0 -1 -2 0 0 -2 -1 -1 -1 -1 -1
A R N D C Q E G H I L K M F P S T W Y V B Z X
5 SEQUENCE ALIGNMENT ALGORITHMS 15
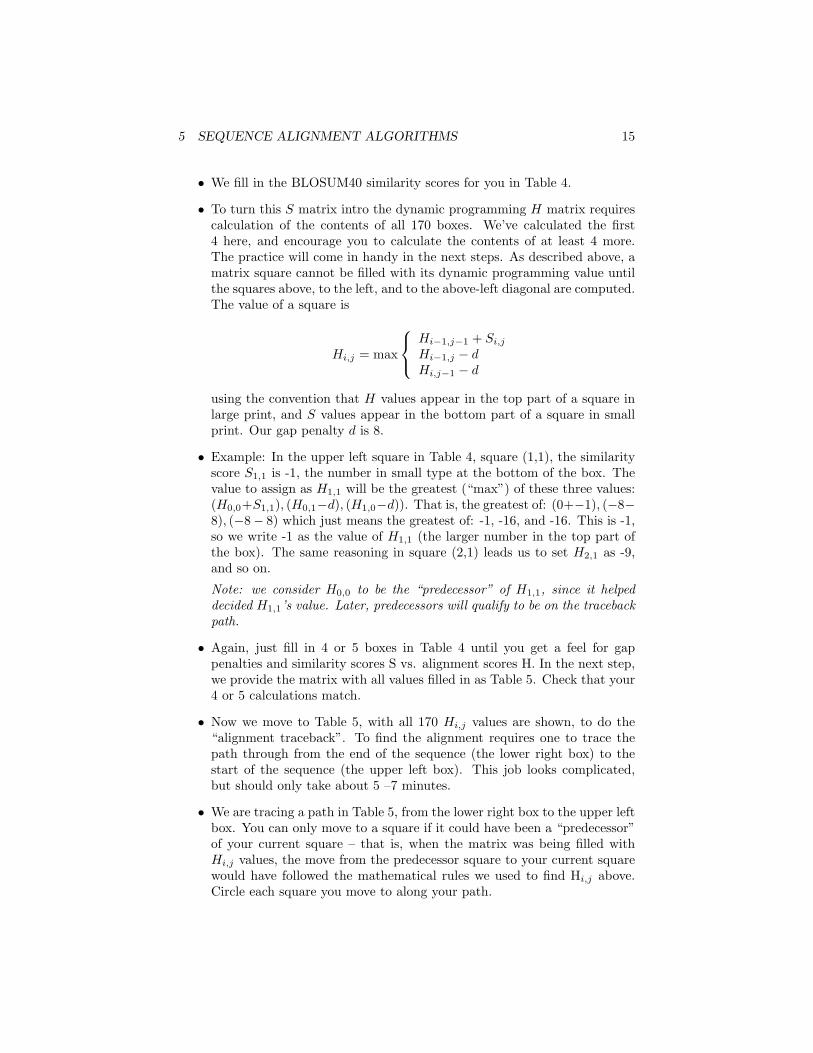
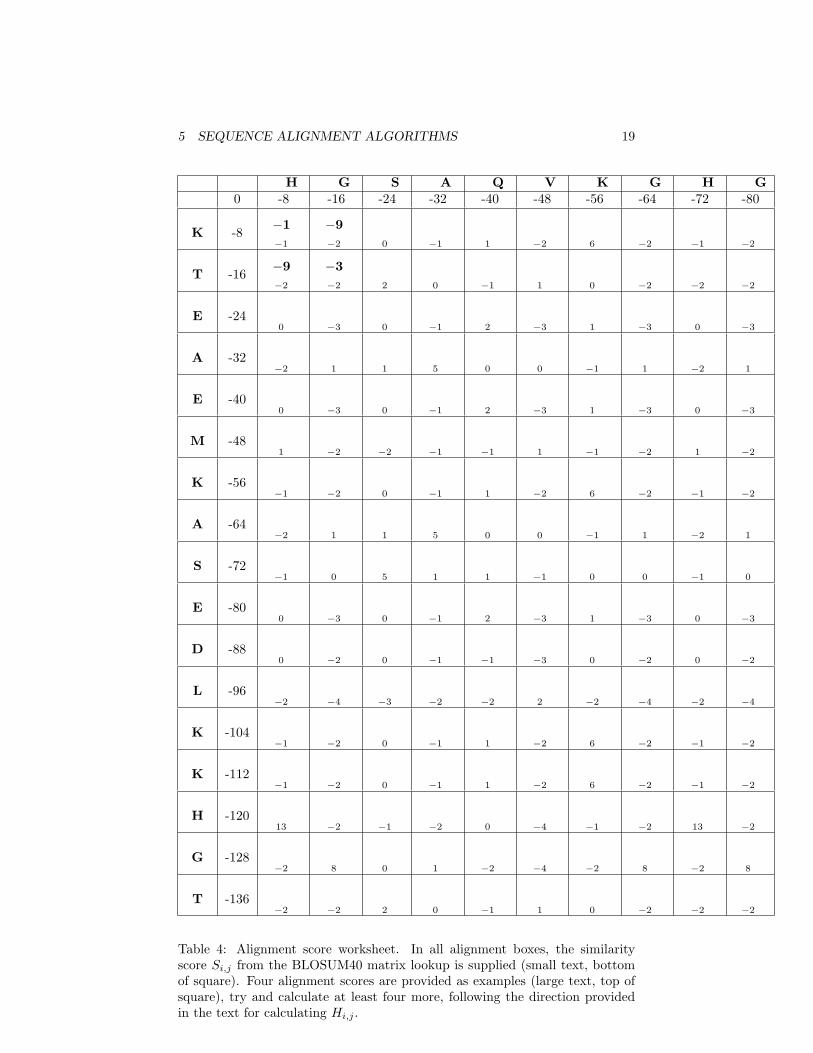
• We fill in the BLOSUM40 similarity scores for you in Table 4.
• To turn this S matrix intro the dynamic programming H matrix requirescalculation of the contents of all 170 boxes. We’ve calculated the first4 here, and encourage you to calculate the contents of at least 4 more.The practice will come in handy in the next steps. As described above, amatrix square cannot be filled with its dynamic programming value untilthe squares above, to the left, and to the above-left diagonal are computed.The value of a square is
Hi,j = max
Hi−1,j−1 + Si,j
Hi−1,j − dHi,j−1 − d
using the convention that H values appear in the top part of a square inlarge print, and S values appear in the bottom part of a square in smallprint. Our gap penalty d is 8.
• Example: In the upper left square in Table 4, square (1,1), the similarityscore S1,1 is -1, the number in small type at the bottom of the box. Thevalue to assign as H1,1 will be the greatest (“max”) of these three values:(H0,0+S1,1), (H0,1−d), (H1,0−d)). That is, the greatest of: (0+−1), (−8−8), (−8− 8) which just means the greatest of: -1, -16, and -16. This is -1,so we write -1 as the value of H1,1 (the larger number in the top part ofthe box). The same reasoning in square (2,1) leads us to set H2,1 as -9,and so on.
Note: we consider H0,0 to be the “predecessor” of H1,1, since it helpeddecided H1,1’s value. Later, predecessors will qualify to be on the tracebackpath.
• Again, just fill in 4 or 5 boxes in Table 4 until you get a feel for gappenalties and similarity scores S vs. alignment scores H. In the next step,we provide the matrix with all values filled in as Table 5. Check that your4 or 5 calculations match.
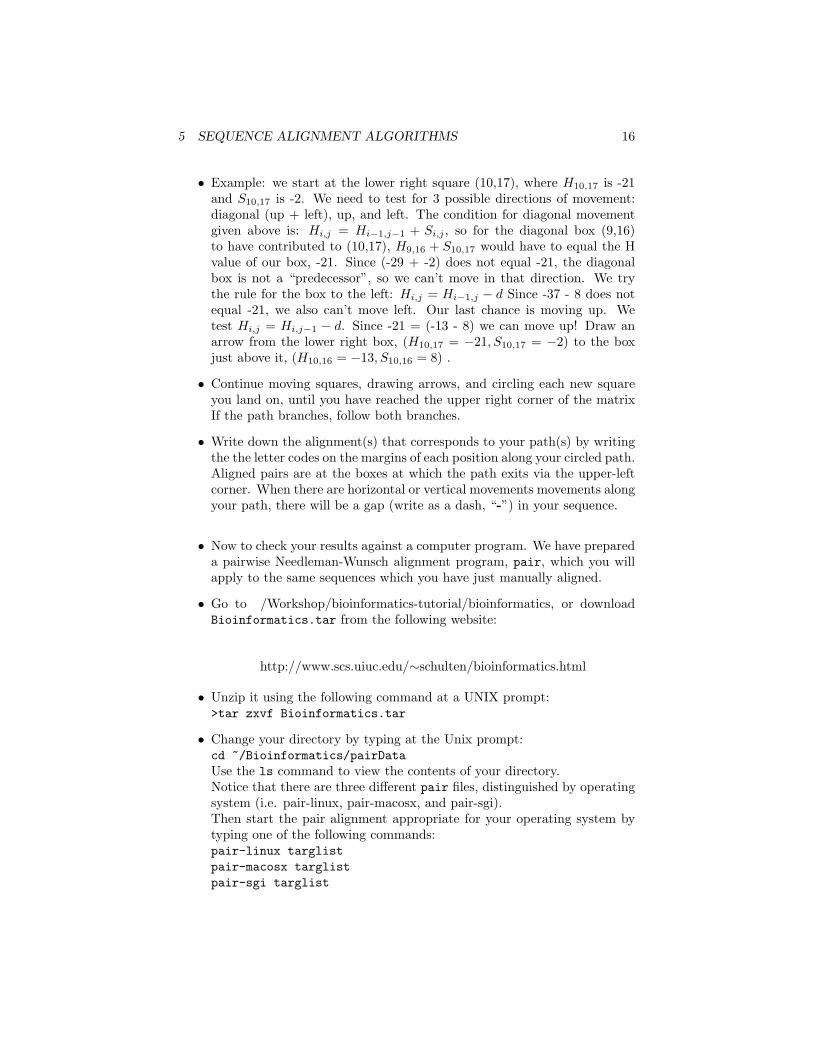
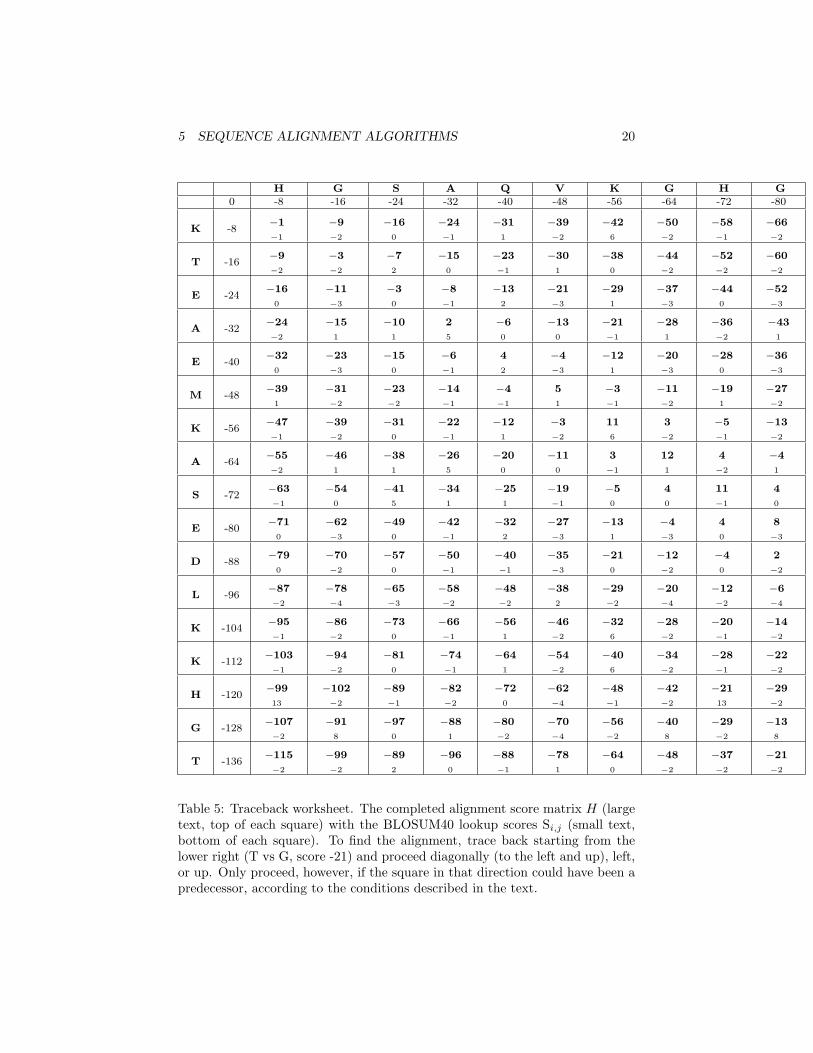
• Now we move to Table 5, with all 170 Hi,j values are shown, to do the“alignment traceback”. To find the alignment requires one to trace thepath through from the end of the sequence (the lower right box) to thestart of the sequence (the upper left box). This job looks complicated,but should only take about 5 –7 minutes.
• We are tracing a path in Table 5, from the lower right box to the upper leftbox. You can only move to a square if it could have been a “predecessor”of your current square – that is, when the matrix was being filled withHi,j values, the move from the predecessor square to your current squarewould have followed the mathematical rules we used to find Hi,j above.Circle each square you move to along your path.
5 SEQUENCE ALIGNMENT ALGORITHMS 16
• Example: we start at the lower right square (10,17), where H10,17 is -21and S10,17 is -2. We need to test for 3 possible directions of movement:diagonal (up + left), up, and left. The condition for diagonal movementgiven above is: Hi,j = Hi−1,j−1 + Si,j , so for the diagonal box (9,16)to have contributed to (10,17), H9,16 + S10,17 would have to equal the Hvalue of our box, -21. Since (-29 + -2) does not equal -21, the diagonalbox is not a “predecessor”, so we can’t move in that direction. We trythe rule for the box to the left: Hi,j = Hi−1,j − d Since -37 - 8 does notequal -21, we also can’t move left. Our last chance is moving up. Wetest Hi,j = Hi,j−1 − d. Since -21 = (-13 - 8) we can move up! Draw anarrow from the lower right box, (H10,17 = −21, S10,17 = −2) to the boxjust above it, (H10,16 = −13, S10,16 = 8) .
• Continue moving squares, drawing arrows, and circling each new squareyou land on, until you have reached the upper right corner of the matrixIf the path branches, follow both branches.
• Write down the alignment(s) that corresponds to your path(s) by writingthe the letter codes on the margins of each position along your circled path.Aligned pairs are at the boxes at which the path exits via the upper-leftcorner. When there are horizontal or vertical movements movements alongyour path, there will be a gap (write as a dash, “-”) in your sequence.
• Now to check your results against a computer program. We have prepareda pairwise Needleman-Wunsch alignment program, pair, which you willapply to the same sequences which you have just manually aligned.
• Go to /Workshop/bioinformatics-tutorial/bioinformatics, or downloadBioinformatics.tar from the following website:
http://www.scs.uiuc.edu/∼schulten/bioinformatics.html
• Unzip it using the following command at a UNIX prompt:>tar zxvf Bioinformatics.tar
• Change your directory by typing at the Unix prompt:cd ~/Bioinformatics/pairDataUse the ls command to view the contents of your directory.Notice that there are three different pair files, distinguished by operatingsystem (i.e. pair-linux, pair-macosx, and pair-sgi).Then start the pair alignment appropriate for your operating system bytyping one of the following commands:pair-linux targlistpair-macosx targlistpair-sgi targlist
5 SEQUENCE ALIGNMENT ALGORITHMS 17
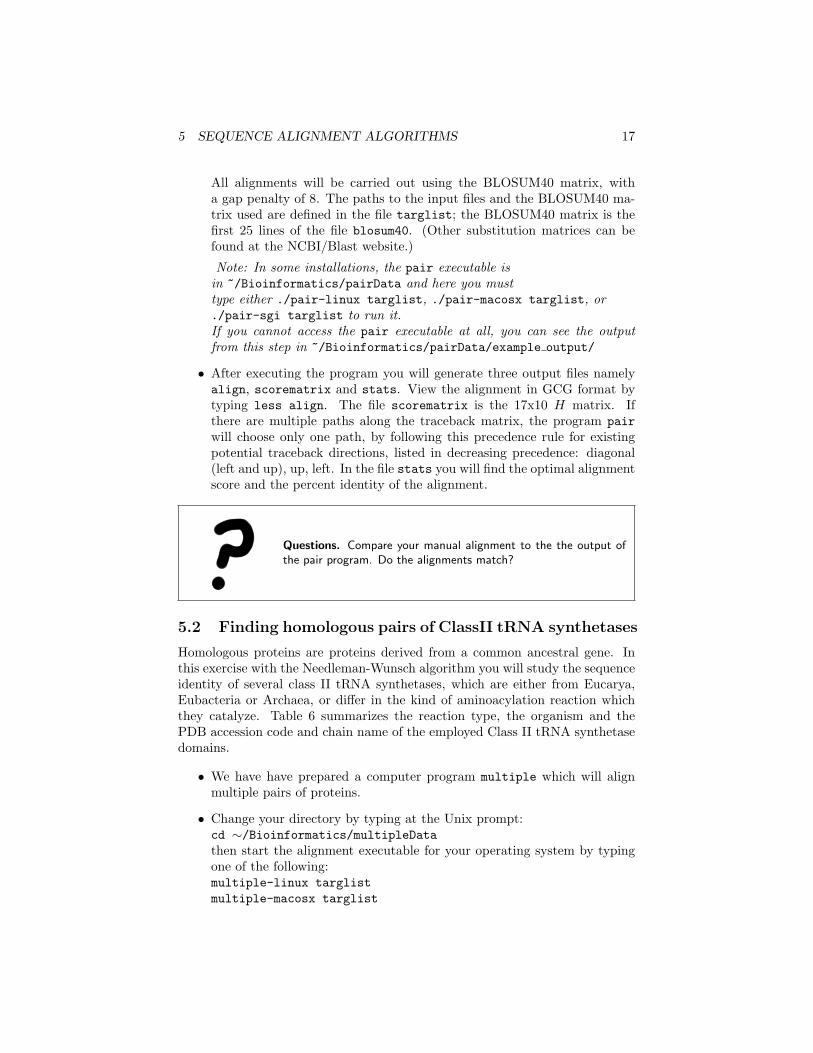
All alignments will be carried out using the BLOSUM40 matrix, witha gap penalty of 8. The paths to the input files and the BLOSUM40 ma-trix used are defined in the file targlist; the BLOSUM40 matrix is thefirst 25 lines of the file blosum40. (Other substitution matrices can befound at the NCBI/Blast website.)
Note: In some installations, the pair executable isin ~/Bioinformatics/pairData and here you musttype either ./pair-linux targlist, ./pair-macosx targlist, or./pair-sgi targlist to run it.If you cannot access the pair executable at all, you can see the outputfrom this step in ~/Bioinformatics/pairData/example output/
• After executing the program you will generate three output files namelyalign, scorematrix and stats. View the alignment in GCG format bytyping less align. The file scorematrix is the 17x10 H matrix. Ifthere are multiple paths along the traceback matrix, the program pairwill choose only one path, by following this precedence rule for existingpotential traceback directions, listed in decreasing precedence: diagonal(left and up), up, left. In the file stats you will find the optimal alignmentscore and the percent identity of the alignment.
Questions. Compare your manual alignment to the the output ofthe pair program. Do the alignments match?
5.2 Finding homologous pairs of ClassII tRNA synthetases
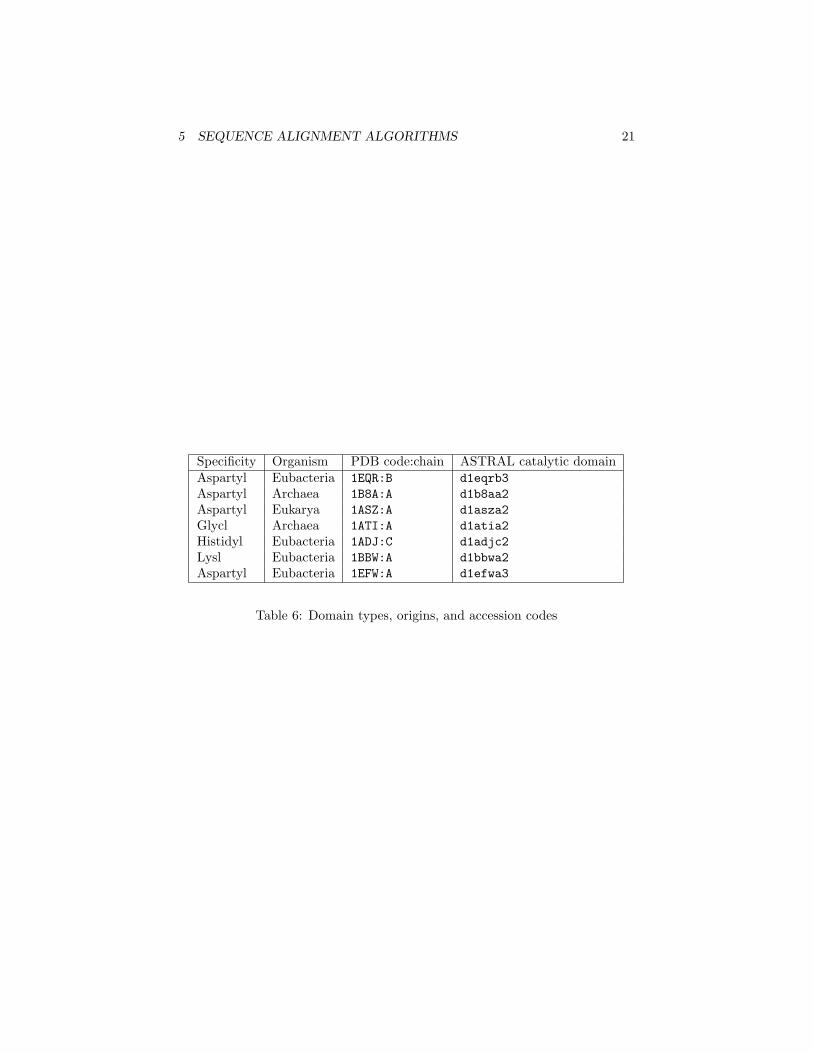
Homologous proteins are proteins derived from a common ancestral gene. Inthis exercise with the Needleman-Wunsch algorithm you will study the sequenceidentity of several class II tRNA synthetases, which are either from Eucarya,Eubacteria or Archaea, or differ in the kind of aminoacylation reaction whichthey catalyze. Table 6 summarizes the reaction type, the organism and thePDB accession code and chain name of the employed Class II tRNA synthetasedomains.
• We have have prepared a computer program multiple which will alignmultiple pairs of proteins.
• Change your directory by typing at the Unix prompt:cd ∼/Bioinformatics/multipleDatathen start the alignment executable for your operating system by typingone of the following:multiple-linux targlistmultiple-macosx targlist
5 SEQUENCE ALIGNMENT ALGORITHMS 18
multiple-sgi targlist
Note: In some installations, the multiple executable isin ∼/Bioinformatics/multipleData and here you musttype ./multiple-linux targlist, ./multiple-macosx targlist,or ./multiple-sgi targlist to run it.If you cannot access the multiple executable at all, you can see the outputfrom this step in ∼/Bioinformatics/multipleData/example output/
• In the align and stats files you will find all combinatorial possible pairsof the provided sequences. On a piece of paper, write the names of the theproteins, grouped by ther domain of life, as listed in Table 6. Comparesequence identities of aligned proteins from the same domain of a life,and of aligned proteins from different domains of life, to help answer thequestions below.
• To study the evolution, look at multiple alignments of sequence and struc-ture. These alignments are more accurate than pairwise alignments. UseCLUSTALW for closely related proteins (30–40% identity); STAMP shouldbe used for more distantly related proteins. Structure and sequence givethe same tree for certain regions, creating congruence of structure andsequence-based phylogenies. We will learn sequence-based phylogeneticmehods for α-chain PheRS later, and structure-based for AARS in theEvolution of Protein Structure tutorial.
Questions. What criteria do you use in order to determine if twoproteins are homologous? Can you find a pattern when you evaluatepercent identities between the pairs of class II tRNA synthetases?Which is the most evolutionarily related pair, and which is the mostevolutionarily divergent pair according to the sequence identity?
5 SEQUENCE ALIGNMENT ALGORITHMS 19
H G S A Q V K G H G0 -8 -16 -24 -32 -40 -48 -56 -64 -72 -80
K -8−1−1
−9−2 0 −1 1 −2 6 −2 −1 −2
T -16−9−2
−3−2 2 0 −1 1 0 −2 −2 −2
E -240 −3 0 −1 2 −3 1 −3 0 −3
A -32−2 1 1 5 0 0 −1 1 −2 1
E -400 −3 0 −1 2 −3 1 −3 0 −3
M -481 −2 −2 −1 −1 1 −1 −2 1 −2
K -56−1 −2 0 −1 1 −2 6 −2 −1 −2
A -64−2 1 1 5 0 0 −1 1 −2 1
S -72−1 0 5 1 1 −1 0 0 −1 0
E -800 −3 0 −1 2 −3 1 −3 0 −3
D -880 −2 0 −1 −1 −3 0 −2 0 −2
L -96−2 −4 −3 −2 −2 2 −2 −4 −2 −4
K -104−1 −2 0 −1 1 −2 6 −2 −1 −2
K -112−1 −2 0 −1 1 −2 6 −2 −1 −2
H -12013 −2 −1 −2 0 −4 −1 −2 13 −2
G -128−2 8 0 1 −2 −4 −2 8 −2 8
T -136−2 −2 2 0 −1 1 0 −2 −2 −2
Table 4: Alignment score worksheet. In all alignment boxes, the similarityscore Si,j from the BLOSUM40 matrix lookup is supplied (small text, bottomof square). Four alignment scores are provided as examples (large text, top ofsquare), try and calculate at least four more, following the direction providedin the text for calculating Hi,j .
5 SEQUENCE ALIGNMENT ALGORITHMS 20
H G S A Q V K G H G0 -8 -16 -24 -32 -40 -48 -56 -64 -72 -80
K -8−1
−1
−9
−2
−16
0
−24
−1
−31
1
−39
−2
−42
6
−50
−2
−58
−1
−66
−2
T -16−9
−2
−3
−2
−7
2
−15
0
−23
−1
−30
1
−38
0
−44
−2
−52
−2
−60
−2
E -24−16
0
−11
−3
−3
0
−8
−1
−13
2
−21
−3
−29
1
−37
−3
−44
0
−52
−3
A -32−24
−2
−15
1
−10
1
2
5
−6
0
−13
0
−21
−1
−28
1
−36
−2
−43
1
E -40−32
0
−23
−3
−15
0
−6
−1
4
2
−4
−3
−12
1
−20
−3
−28
0
−36
−3
M -48−39
1
−31
−2
−23
−2
−14
−1
−4
−1
5
1
−3
−1
−11
−2
−19
1
−27
−2
K -56−47
−1
−39
−2
−31
0
−22
−1
−12
1
−3
−2
11
6
3
−2
−5
−1
−13
−2
A -64−55
−2
−46
1
−38
1
−26
5
−20
0
−11
0
3
−1
12
1
4
−2
−4
1
S -72−63
−1
−54
0
−41
5
−34
1
−25
1
−19
−1
−5
0
4
0
11
−1
4
0
E -80−71
0
−62
−3
−49
0
−42
−1
−32
2
−27
−3
−13
1
−4
−3
4
0
8
−3
D -88−79
0
−70
−2
−57
0
−50
−1
−40
−1
−35
−3
−21
0
−12
−2
−4
0
2
−2
L -96−87
−2
−78
−4
−65
−3
−58
−2
−48
−2
−38
2
−29
−2
−20
−4
−12
−2
−6
−4
K -104−95
−1
−86
−2
−73
0
−66
−1
−56
1
−46
−2
−32
6
−28
−2
−20
−1
−14
−2
K -112−103
−1
−94
−2
−81
0
−74
−1
−64
1
−54
−2
−40
6
−34
−2
−28
−1
−22
−2
H -120−99
13
−102
−2
−89
−1
−82
−2
−72
0
−62
−4
−48
−1
−42
−2
−21
13
−29
−2
G -128−107
−2
−91
8
−97
0
−88
1
−80
−2
−70
−4
−56
−2
−40
8
−29
−2
−13
8
T -136−115
−2
−99
−2
−89
2
−96
0
−88
−1
−78
1
−64
0
−48
−2
−37
−2
−21
−2
Table 5: Traceback worksheet. The completed alignment score matrix H (largetext, top of each square) with the BLOSUM40 lookup scores Si,j (small text,bottom of each square). To find the alignment, trace back starting from thelower right (T vs G, score -21) and proceed diagonally (to the left and up), left,or up. Only proceed, however, if the square in that direction could have been apredecessor, according to the conditions described in the text.
5 SEQUENCE ALIGNMENT ALGORITHMS 21
Specificity Organism PDB code:chain ASTRAL catalytic domainAspartyl Eubacteria 1EQR:B d1eqrb3Aspartyl Archaea 1B8A:A d1b8aa2Aspartyl Eukarya 1ASZ:A d1asza2Glycl Archaea 1ATI:A d1atia2Histidyl Eubacteria 1ADJ:C d1adjc2Lysl Eubacteria 1BBW:A d1bbwa2Aspartyl Eubacteria 1EFW:A d1efwa3
Table 6: Domain types, origins, and accession codes
6 MOLECULAR PHYLOGENETIC TREE. 22
6 Molecular phylogenetic tree.
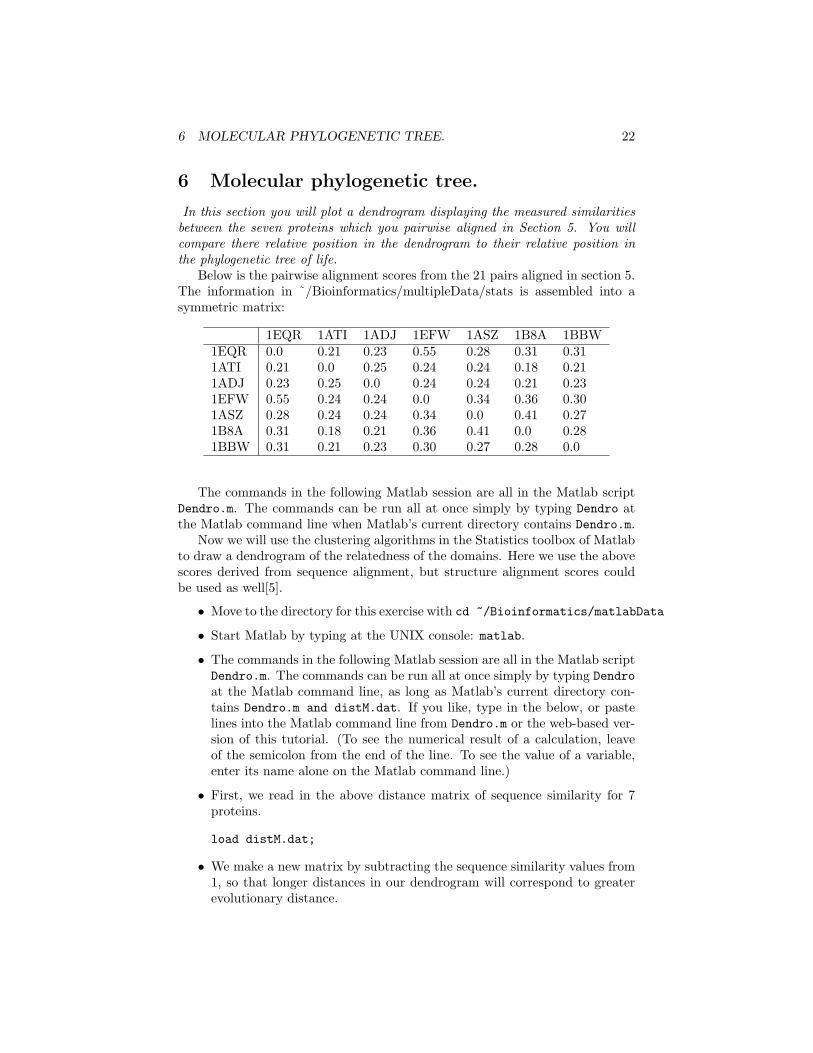
In this section you will plot a dendrogram displaying the measured similaritiesbetween the seven proteins which you pairwise aligned in Section 5. You willcompare there relative position in the dendrogram to their relative position inthe phylogenetic tree of life.
Below is the pairwise alignment scores from the 21 pairs aligned in section 5.The information in ˜/Bioinformatics/multipleData/stats is assembled into asymmetric matrix:
1EQR 1ATI 1ADJ 1EFW 1ASZ 1B8A 1BBW1EQR 0.0 0.21 0.23 0.55 0.28 0.31 0.311ATI 0.21 0.0 0.25 0.24 0.24 0.18 0.211ADJ 0.23 0.25 0.0 0.24 0.24 0.21 0.231EFW 0.55 0.24 0.24 0.0 0.34 0.36 0.301ASZ 0.28 0.24 0.24 0.34 0.0 0.41 0.271B8A 0.31 0.18 0.21 0.36 0.41 0.0 0.281BBW 0.31 0.21 0.23 0.30 0.27 0.28 0.0
The commands in the following Matlab session are all in the Matlab scriptDendro.m. The commands can be run all at once simply by typing Dendro atthe Matlab command line when Matlab’s current directory contains Dendro.m.
Now we will use the clustering algorithms in the Statistics toolbox of Matlabto draw a dendrogram of the relatedness of the domains. Here we use the abovescores derived from sequence alignment, but structure alignment scores couldbe used as well[5].
• Move to the directory for this exercise with cd ~/Bioinformatics/matlabData
• Start Matlab by typing at the UNIX console: matlab.
• The commands in the following Matlab session are all in the Matlab scriptDendro.m. The commands can be run all at once simply by typing Dendroat the Matlab command line, as long as Matlab’s current directory con-tains Dendro.m and distM.dat. If you like, type in the below, or pastelines into the Matlab command line from Dendro.m or the web-based ver-sion of this tutorial. (To see the numerical result of a calculation, leaveof the semicolon from the end of the line. To see the value of a variable,enter its name alone on the Matlab command line.)
• First, we read in the above distance matrix of sequence similarity for 7proteins.
load distM.dat;
• We make a new matrix by subtracting the sequence similarity values from1, so that longer distances in our dendrogram will correspond to greaterevolutionary distance.
6 MOLECULAR PHYLOGENETIC TREE. 23
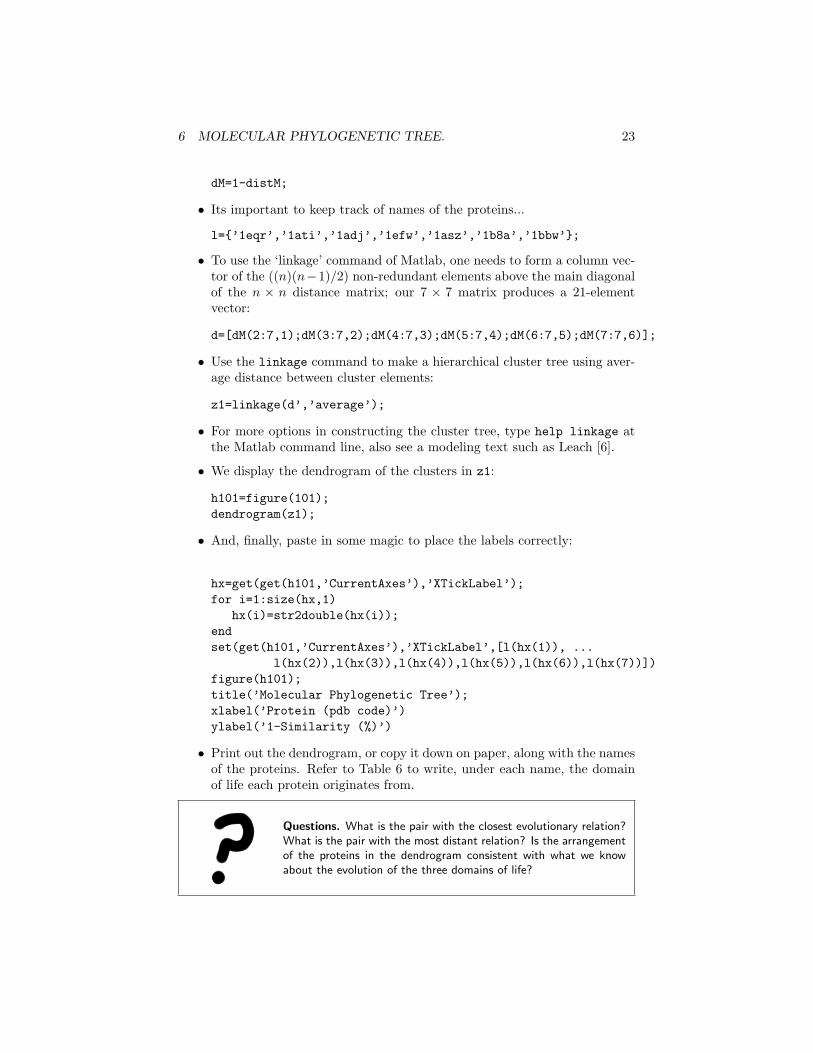
dM=1-distM;
• Its important to keep track of names of the proteins...
l={’1eqr’,’1ati’,’1adj’,’1efw’,’1asz’,’1b8a’,’1bbw’};
• To use the ‘linkage’ command of Matlab, one needs to form a column vec-tor of the ((n)(n−1)/2) non-redundant elements above the main diagonalof the n × n distance matrix; our 7 × 7 matrix produces a 21-elementvector:
d=[dM(2:7,1);dM(3:7,2);dM(4:7,3);dM(5:7,4);dM(6:7,5);dM(7:7,6)];
• Use the linkage command to make a hierarchical cluster tree using aver-age distance between cluster elements:
z1=linkage(d’,’average’);
• For more options in constructing the cluster tree, type help linkage atthe Matlab command line, also see a modeling text such as Leach [6].
• We display the dendrogram of the clusters in z1:
h101=figure(101);dendrogram(z1);
• And, finally, paste in some magic to place the labels correctly:
hx=get(get(h101,’CurrentAxes’),’XTickLabel’);for i=1:size(hx,1)
hx(i)=str2double(hx(i));endset(get(h101,’CurrentAxes’),’XTickLabel’,[l(hx(1)), ...
l(hx(2)),l(hx(3)),l(hx(4)),l(hx(5)),l(hx(6)),l(hx(7))])figure(h101);title(’Molecular Phylogenetic Tree’);xlabel(’Protein (pdb code)’)ylabel(’1-Similarity (%)’)
• Print out the dendrogram, or copy it down on paper, along with the namesof the proteins. Refer to Table 6 to write, under each name, the domainof life each protein originates from.
Questions. What is the pair with the closest evolutionary relation?What is the pair with the most distant relation? Is the arrangementof the proteins in the dendrogram consistent with what we knowabout the evolution of the three domains of life?
7 PHYLOGENETIC TREE OF α-CHAIN PHERS 24
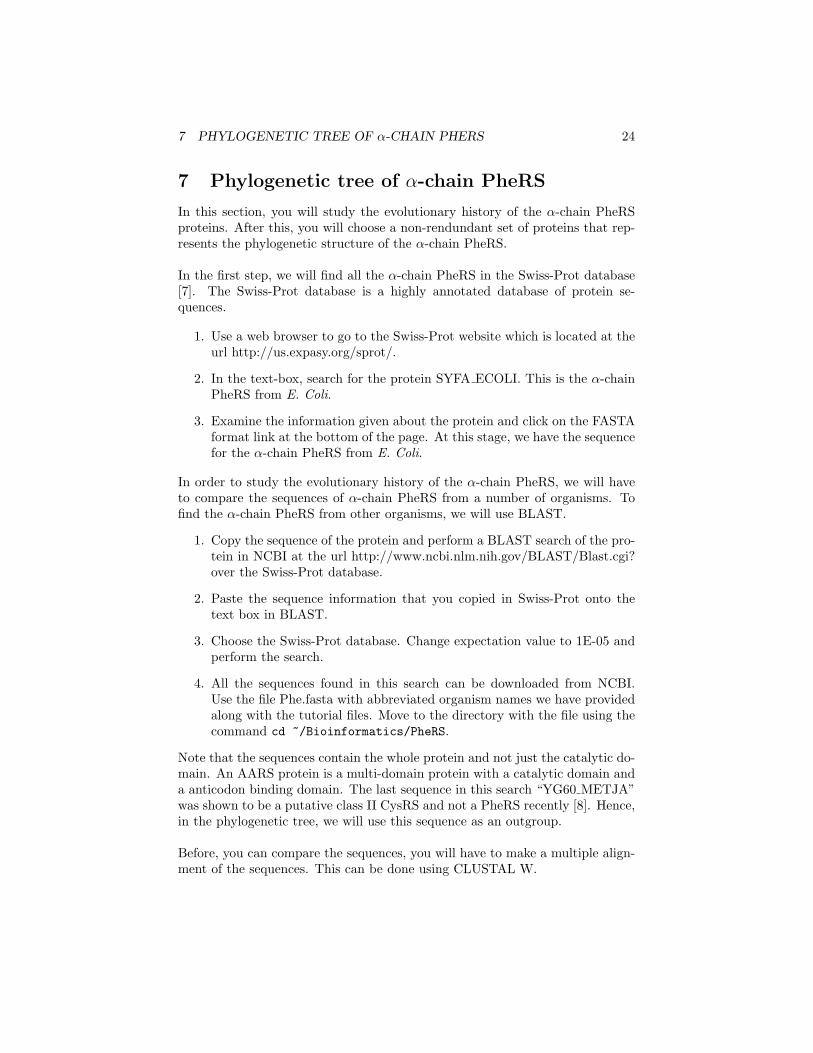
7 Phylogenetic tree of α-chain PheRS
In this section, you will study the evolutionary history of the α-chain PheRSproteins. After this, you will choose a non-rendundant set of proteins that rep-resents the phylogenetic structure of the α-chain PheRS.
In the first step, we will find all the α-chain PheRS in the Swiss-Prot database[7]. The Swiss-Prot database is a highly annotated database of protein se-quences.
1. Use a web browser to go to the Swiss-Prot website which is located at theurl http://us.expasy.org/sprot/.
2. In the text-box, search for the protein SYFA ECOLI. This is the α-chainPheRS from E. Coli.
3. Examine the information given about the protein and click on the FASTAformat link at the bottom of the page. At this stage, we have the sequencefor the α-chain PheRS from E. Coli.
In order to study the evolutionary history of the α-chain PheRS, we will haveto compare the sequences of α-chain PheRS from a number of organisms. Tofind the α-chain PheRS from other organisms, we will use BLAST.
1. Copy the sequence of the protein and perform a BLAST search of the pro-tein in NCBI at the url http://www.ncbi.nlm.nih.gov/BLAST/Blast.cgi?over the Swiss-Prot database.
2. Paste the sequence information that you copied in Swiss-Prot onto thetext box in BLAST.
3. Choose the Swiss-Prot database. Change expectation value to 1E-05 andperform the search.
4. All the sequences found in this search can be downloaded from NCBI.Use the file Phe.fasta with abbreviated organism names we have providedalong with the tutorial files. Move to the directory with the file using thecommand cd ~/Bioinformatics/PheRS.
Note that the sequences contain the whole protein and not just the catalytic do-main. An AARS protein is a multi-domain protein with a catalytic domain anda anticodon binding domain. The last sequence in this search “YG60 METJA”was shown to be a putative class II CysRS and not a PheRS recently [8]. Hence,in the phylogenetic tree, we will use this sequence as an outgroup.
Before, you can compare the sequences, you will have to make a multiple align-ment of the sequences. This can be done using CLUSTAL W.
7 PHYLOGENETIC TREE OF α-CHAIN PHERS 25
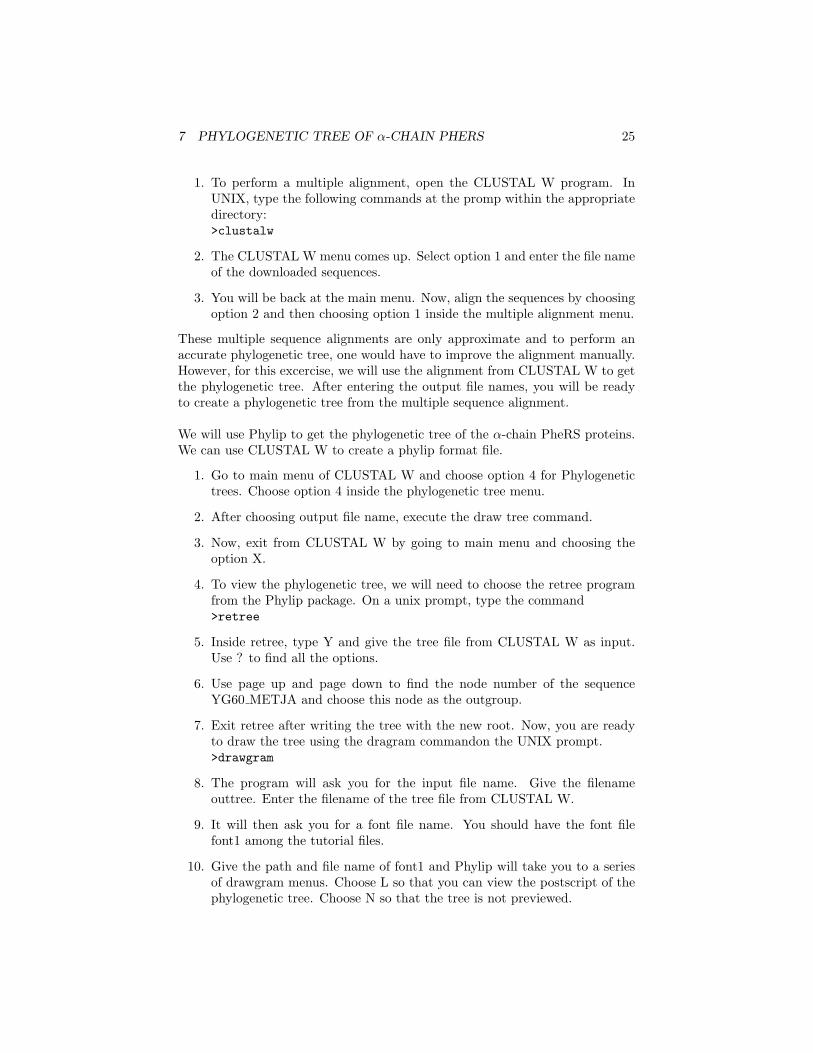
1. To perform a multiple alignment, open the CLUSTAL W program. InUNIX, type the following commands at the promp within the appropriatedirectory:>clustalw
2. The CLUSTAL W menu comes up. Select option 1 and enter the file nameof the downloaded sequences.
3. You will be back at the main menu. Now, align the sequences by choosingoption 2 and then choosing option 1 inside the multiple alignment menu.
These multiple sequence alignments are only approximate and to perform anaccurate phylogenetic tree, one would have to improve the alignment manually.However, for this excercise, we will use the alignment from CLUSTAL W to getthe phylogenetic tree. After entering the output file names, you will be readyto create a phylogenetic tree from the multiple sequence alignment.
We will use Phylip to get the phylogenetic tree of the α-chain PheRS proteins.We can use CLUSTAL W to create a phylip format file.
1. Go to main menu of CLUSTAL W and choose option 4 for Phylogenetictrees. Choose option 4 inside the phylogenetic tree menu.
2. After choosing output file name, execute the draw tree command.
3. Now, exit from CLUSTAL W by going to main menu and choosing theoption X.
4. To view the phylogenetic tree, we will need to choose the retree programfrom the Phylip package. On a unix prompt, type the command>retree
5. Inside retree, type Y and give the tree file from CLUSTAL W as input.Use ? to find all the options.
6. Use page up and page down to find the node number of the sequenceYG60 METJA and choose this node as the outgroup.
7. Exit retree after writing the tree with the new root. Now, you are readyto draw the tree using the dragram commandon the UNIX prompt.>drawgram
8. The program will ask you for the input file name. Give the filenameouttree. Enter the filename of the tree file from CLUSTAL W.
9. It will then ask you for a font file name. You should have the font filefont1 among the tutorial files.
10. Give the path and file name of font1 and Phylip will take you to a seriesof drawgram menus. Choose L so that you can view the postscript of thephylogenetic tree. Choose N so that the tree is not previewed.
7 PHYLOGENETIC TREE OF α-CHAIN PHERS 26
11. In the main drawgram menu, choose 1, choose phylogram, and then giveoption P and choose 4 and then give an angle of 90 degrees to get thestandard format for phylogenetic trees.
12. The output of the phylogenetic tree is given in plotfile in ps format. Youcan view the phylogenetic tree using the command ghostview. Take aprint out of the phylogenetic tree.
Question:. What kind of phylogenetic pattern is shown by the α-chain PheRS? Is there any horizontal gene transfer? Are there moreproteins from some domains of life than from others? Which do-mains of life have more proteins than others? To view the organisminformation for each protein, you can use Swiss-Prot.
As you can see, the databases have bias towards certain domains of life. To geta nonredundant set of sequences that provide the phylogenetic structure of thePheRSs, we will use the newly developed Sequence QR algorithm. The theoryfor the multidimensional QR algorithm and it’s applications to sequences andstructures is provided in [9, 10, 8]. To run Sequence QR, we will have to givethe following command on the UNIX prompt:>clustalw -infile=<alignment file.aln> -convert-output=fasta -outfile=<alignmentfile.fasta>>seqqr -p 0.28 <alignmentfile.fasta> <QRalignment.fasta>
The first command converts the alignment file of the proteins you found inBLAST into FASTA format. After executing the first command, make sure toremove the YG60 METJA protein from the sequence alignment as this proteinis not a PheRS. The second command finds the QR representative set for theproteins. The -p option specifies the percentage identity threshold for the nonre-dundant set. In this case, 28% gives a protein from the Eucarya, Bacteria andArchaea domains of life and one from the mitochrondria of a eucarya. As youincrease the the percentage threshold, the redundancy in the QR set increase.
Question:. Draw the phylogenetic tree of the QR non-redundantset. Does the non-redundant set represent the major evolutionarychanges in the α-chain PheRS equally? Does the non-redundant setreproduce the structure of the phylogenetic tree? What happens asyou increase the percentage identity threshold for the QR algorithm?
Question:. Look at the alignment of all the PheRS and the non-redundant set of PheRS. Are there any conserved positions in thealignment? In [9], it was shown that both classes of AARSs havesome conserved elements. Is PheRS a class I or class II AARS?Mark the conserved regions in the non-redundant set of PheRS andsubmit the alignment along with the homework.
8 OTHER BIOINFORMATICS TOOLS 27
8 Other bioinformatics tools
So far in this tutorial, you have made use of only a small selection of bioin-formatics techniques and tools. In the last exercise we invite you to exploreadditional tools and resources by yourself. Results of aligning sequences can beimproved by systematically building up profiles from multiple sequences.
• Try using the multisequence alignment servers such as ClustalW or serversemploying Hidden Markov methods to build a profile from the four as-partyl AARSs sequences.
• Align the histidyl AARS to the profile.
• Check if you can obtain an alignment closer to the structure-based align-ment you will see in VMD next week.
Tools, resources, and link collections:
ClustalW (http://bioweb.pasteur.fr/seqanal/interfaces/clustalw.html)Perform a multi-sequence or profile-profile alignment with the program ClustalW.Just access the website directly and paste in all or a selection of your Class IItRNA synthetases in order to execute the program. ClustalW is the most widelyused tool in bioinformatics for carrying out multi-sequence alignments.
Psipred (http://bioinf.cs.ucl.ac.uk/psipred/)Predict the secondary structure of one of your Class II tRNA synthetases withthe Psipred Protein Structure Prediction Server. Paste your sequence in theinput sequence window, provide your email address and you will receive after afew minutes a secondary structure prediction of your chosen tRNA synthetase.Sequence and structural alignments as well as secondary predictions form theframework for a successful modeling project.
3D PSSM (http://www.sbg.bio.ic.ac.uk/~3dpssm/)A web-based method method for protein fold recognition using sequence profilescoupled with secondary structure.
TMpred (http://www.ch.embnet.org/software/TMPRED form.html)A database scoring-based method to predict the transmembrane portions ofmembrane proteins.
TMHMM (http://www.cbs.dtu.dk/services/TMHMM-2.0/)A hidden Markov method to predict the transmembrane portions of membraneproteins.
European Bioinformatics Inst. (http://www.ebi.ac.uk/services/index.html)An up-to-date and well-organized collection of links to bioinformatics tools,databases, and resources. The site provides advice as to the best or most pop-ular tools in a category, and provides short descriptions of all entries.
ExPASy Molecular Biology Server (http://ca.expasy.org/)Another well-organized directory of online analysis tools, databases, and otherresources, with a greater focus on proteins. “The ExPASy (Expert Protein Anal-ysis System) proteomics server of the Swiss Institute of Bioinformatics (SIB) isdedicated to the analysis of protein sequences and structures...” With this
8 OTHER BIOINFORMATICS TOOLS 28
server you can start your own homology modeling project of an unknown classII tRNA synthetase, namely Alanyl-tRNA synthetase. You can obtain the se-quence in FASTA format from the SwissProt database which can be accesseddirectly from the ExPASy server with the accession number SYA ECOLI. Asstructural template choose one of the provided catalytic domain structures ofclass II tRNA synthetases. You can also model the other domains for which youneed to find an appropriate template from the provided PDB structures.
SwissModel (http://swissmodel.expasy.org/)For model generation use SwissModel, where you can thread your sequence uponone or several of your chosen templates. SwissModel provides you with an on-line tutorial and will perform refinements on initial models you submit to itsserver.
Dynamic Programming in Java(http://www.dkfz-heidelberg.de/tbi/bioinfo/PracticalSection/AliApplet/index.html)
This is an alternative Smith-Waterman tutorial which will provide you witha web-based interface for dynamic programming, an animated version of thepaper-and-pencil exercise in section 5.
Biology WorkBench (http://workbench.sdsc.edu)This website allows you to search popular protein and nucleic acid sequencedatabases. Sequence retrieval is integrated with access to a variety of analysistools as for example the multi-sequence alignment program ClustalW. The ad-vantage of the Biology Workbench is that all analysis tools are interconnectedwith each other eliminating the tedious file conversion process, which often needsto be done when accessing tools from distinct locations.
CASP5 (http://predictioncenter.llnl.gov/casp5/Casp5.html)Every two years a community-wide protein structure prediction contest takesplace,where groups complete for prediction of unpublished protein structures.One can check out how well has our Resource done in the last year contest. Justsearch for Zan Schulten Group results on this site.

REFERENCES 29
References
[1] Michael S. Waterman. Introduction to Computational Biology: Maps, Se-quences, and Genomes. CRC Press, 1995.
[2] M. Leavitt S.E. Benner, P. Koehl. The astral compendium for sequenceand structure analysis. Nucleic Acid Research, pages 254–256, 2000.
[3] Z. Feg G. Gilliland T.N. Bhat H. Weissig I.N. Shindyalov P.E. BourneH.M. Berman, J. Westbrook. The protein data bank. Nucleic Acid Re-search, (28).
[4] T. Hubbard C. Chothia A.G. Murzin, S.E. Brenner. Scop: a structuralclassification of protein databases for the investigation of sequences andstructures.
[5] P. O‘Donoghue and Z. Luthey-Schulten. On the evolution of structure inaminoacyl-trna synthetases. Microbiol Mol Biol Rev., 67(4), 2003.
[6] A.R. Leach. Molecular Modelling: Principles and Applications (2nd edi-tion). Prentice Hall, Upper Saddle River, New Jersey, 2001.
[7] B Boeckmann, A Bairoch, R Apweiler, M-C Blatter, A Estreicher,E Gasteiger, M J Martin, K Michoud, C O’Donovan, I Phan, and et al.The SWISS-PROT protein knowledgebase and its supplement TrEMBL in2003. 31:365–370, 2003.
[8] A Sethi, P O’Donoghue, and Z Luthey-Schulten. Evolutionary profiles fromthe qr factorization of multiple sequence alignments. PNAS, 2005. In Press.
[9] Patrick O’Donoghue and Zaida Luthey-Schulten. Evolution of Structure inAminoacyl-tRNA Synthetases. Microbiol Mol Biol Rev, 67:550–573, 2003.
[10] P O’Donoghue and Z Luthey-Schulten. Evolutionary profiles derived fromthe QR factorization of multiple structural alignments gives an economy ofinformation. 2004. In press.