Biogeochemical processes related to the unusual nutrient limitations in the Eastern Mediterranean...
31
Biogeochemical processes related to the unusual nutrient limitations in the Eastern Mediterranean Co-investigators Philippe van Cappellen, Helen Powley, Kay Emeis, Nurit Kress, Kent Fanning, and Rob Mortimer
-
Upload
jonah-watkins -
Category
Documents
-
view
218 -
download
2
Transcript of Biogeochemical processes related to the unusual nutrient limitations in the Eastern Mediterranean...

Biogeochemical processes related to the unusual nutrient limitations in the
Eastern Mediterranean
Co-investigators Philippe van Cappellen, Helen
Powley, Kay Emeis, Nurit Kress, Kent Fanning, and Rob Mortimer

I wish to dedicate this lecture to my good friend and former colleague
Tommy Berman (1934-2013)
My first research on the Eastern Mediterranean was carried out together with Tommy. He inspired me into being curious about this unusual part of the global ocean and showed me what great science can be done in the area.

16:1
23:1
28:1
There is a highly unusual Nitrate:Phosphate ratio in deep water of the E. Mediterranean
Krom, M.D., Brenner, S., Kress, N. and Gordon, L.I. (1991) Phosphorus limitation of Primary Productivity in the E.Mediterranean sea. Limnol. Ocean. 36 (3): 424-432.

NUTRIENT EASTERN MEDITERRANEAN
N. ATLANTIC
N. PACIFIC
Nitrate 6 16 50
Phosphate 0.25 1 3
The nutrient concentration in the EMS is unusually low compared with other oceans

The Eastern Med is also special because it is ultra-oligotrophic
• The annual productivity in the Sargasso Sea is 120-130 gC m-2 y-1
• The annual productivity in the E. Med is 60-80 gC m-2 y-1

• This is despite a large increase in nutrient supply due to pollution over the past 60 years
• The present flux of N & P is comparable to the Baltic sea which is considered Eutrophic.
These patterns are due to the unusual anti-estuarine circulation in the basin in which low nutrient surface water flows in and enriched intermediate water flows out.

Krom, M.D., Emeis K-C, van-Cappellan, P. (2010) Why is the Eastern Mediterranean P limited? Progress in Oceanography. Vol
85; p236-244.
• The reason for the unusually high N:P ratio is because the external inputs of N & P all have N:P ratios greatly in excess of the Redfield (16:1) ratio.
• In the global ocean any excess N above the Redfield ratio is removed by denitrification

Krom, M.D., Emeis K-C, van-Cappellan, P. (2010) Why is the Eastern Mediterranean P limited? Progress in Oceanography. Vol
85; p236-244.
• In the EMS, because of its very low Organic Matter production, there are only very limited areas of sediment which are anoxic.
• That means that the high N:P in the supply is preserved throughout the basin
• The high N:P ratio has nothing to do with N-fixation which is very low throughout the basin

The Eastern Mediterranean is P limited during the winter bloom
• In winter when nutrients are mixed into surface waters, there is a phytoplankton bloom. The bloom stops when the system runs out of phosphate while there is still nitrate present.
Cyprus Eddy centre: Feb 1989
0
200
400
600
800
1000
1200
0 0.1 0.2 0.3
P (M) and Chl-a (g/l)
De
pth
(m
)
0
200
400
600
800
1000
1200
0 2 4 6 8
N (M)
P
Chl
N

Seasonal Changes in nutrient limitation
• However the CYCLOPS P addition to the EMS showed that the system becomes N & P co-limited in summer as the excess bioavailable nitrate in winter is converted to non-bioavailable DON through spring.
Nature of Phosphorus Limitation in the Ultraoligotrophic Eastern Mediterranean by Thingstad, Krom, Mantoura et al. Science Vol 309 1068-1071
Silica cycle in the EMS
• Silica is another important nutrient which despite being analysed routinely has been barely studied over the past 50 years.
• It also has some unusual properties.

0 1 2 3 4 5 6 7 8 9 10
-3000
-2500
-2000
-1500
-1000
-500
0
Dissolved Silica vs Depth
Silica (uM)
Dept
h (m
)
Typical silica-depth on ocean
-6000
-5000
-4000
-3000
-2000
-1000
0
0 20 40 60 80 100 120 140
Silica (umoles/kg)
dep
th (
m)
Typical silica-depth on ocean
Typical silicic acid vs depth profile for a station in the EMS Levantine basin
But there are essentially no diatoms in the offshore waters

NUTRIENT EASTERN MEDITERRANEA
N
N. ATLANTIC
N. PACIFIC
Nitrate 6 16 50
Phosphate 0.25 1 3
Silicic Acid 12 20 160
Like N & P it has unusually low dissolved concentration compared with other oceans

Increase in Phosphate = ~0.007 μM
Increase in Nitrate = ~0.8 μM
Increase in Silicicacid = ~4.5 μM

Why is the Silicic acid distribution unusual?
• The key to understanding silicic acid distribution is to realise that nutrient supply to the photic zone across most of the EMS is below the THRESHOLD for diatom growth.
• Diatoms only grow in locations where there is nutrient upwelling into the photic zone from turbulence, mesoscale features or underlying sediment (coastal regions)

Particulate BSi and Fucoxathin across the EMS from recent BOUM cruise(Crombet et al., 2011)

Increased nitrate but no longer phosphate in surface waters upwelled from below

Increased silica in surface waters upwelled from below
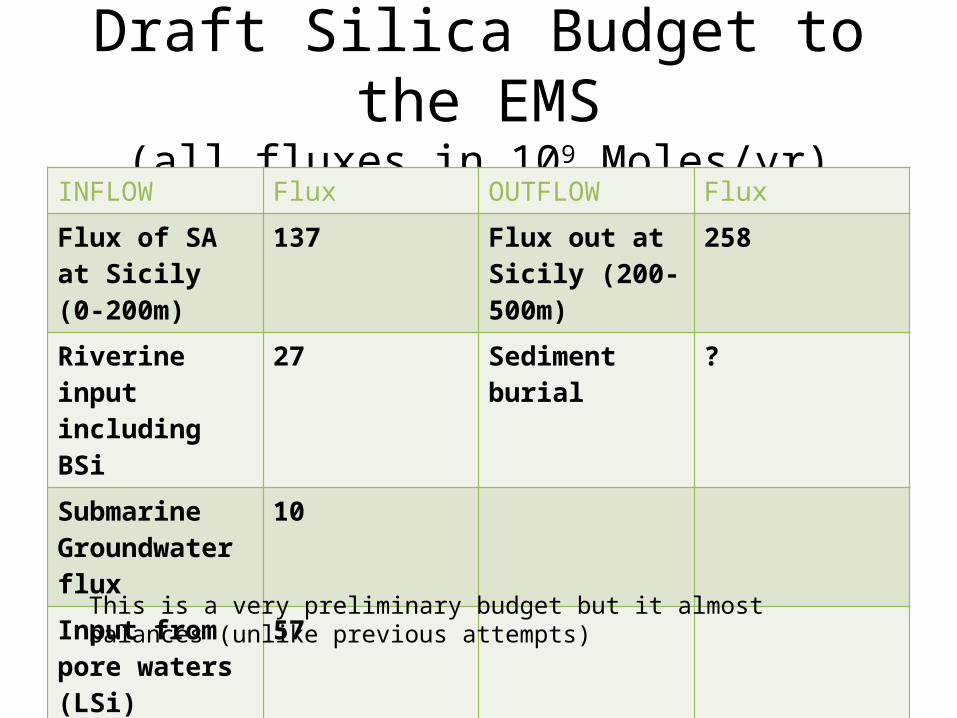
Draft Silica Budget to the EMS(all fluxes in 109 Moles/yr)
INFLOW Flux OUTFLOW FluxFlux of SA at Sicily (0-200m)
137 Flux out at Sicily (200-500m)
258
Riverine input including BSi
27 Sediment burial ?
Submarine Groundwater flux
10
Input from pore waters (LSi)
57
Total inflow 231 Total outflow 258
This is a very preliminary budget but it almost balances (unlike previous attempts)

The Micronutrient Iron
• By contrast with the other nutrients, the concentration of dissolved Fe in the EMS is unusually high (1.5-2 nM; Statham and Hart 2005)
• This is probably because of the high input of Saharan dust
• The EMS is NOT Fe limited

N& P cycling in the EMS
• Based on the new qualitative understanding of processes in the EMS we have created a coupled mass balance N&P model which represents a quantitative description of our understanding of how nutrient cycling works in the EMS and includes the changing external nutrient supply.

N& P model for the EMSThe water cycle in the EMS
• The model relies of a 3 layer representation of the water column
• Surface water (0-200m) which is also the photic zone and is flowing in at the Straits of Sicily
• Intermediate water (200-500m) which flows out at Sicily
• Deep water (>500m) which can be formed in S.Adriatic (EMDW) or in the Aegean (CSOW)

Surface Water(0-200 m)
Levantine Intermediate Water
200-500 m
Eastern Mediterranean Deep Water
> 500 m
Wes
tern
Med
iterr
anea
n
Adriatic Sea Aegean SeaCalculated water residence times
7.7 years
8.7 years
150 yearsRoether and Well (2002) Roether et al., (1998)

N& P cycling in the EMS
• As you will see this unusual circulation is key to a quantitative understanding of the N & P cycling processes.
• The model uses measurements of chemical N & P species and published biogeochemical studies to compute average reservoir size and fluxes calculated for 1950.
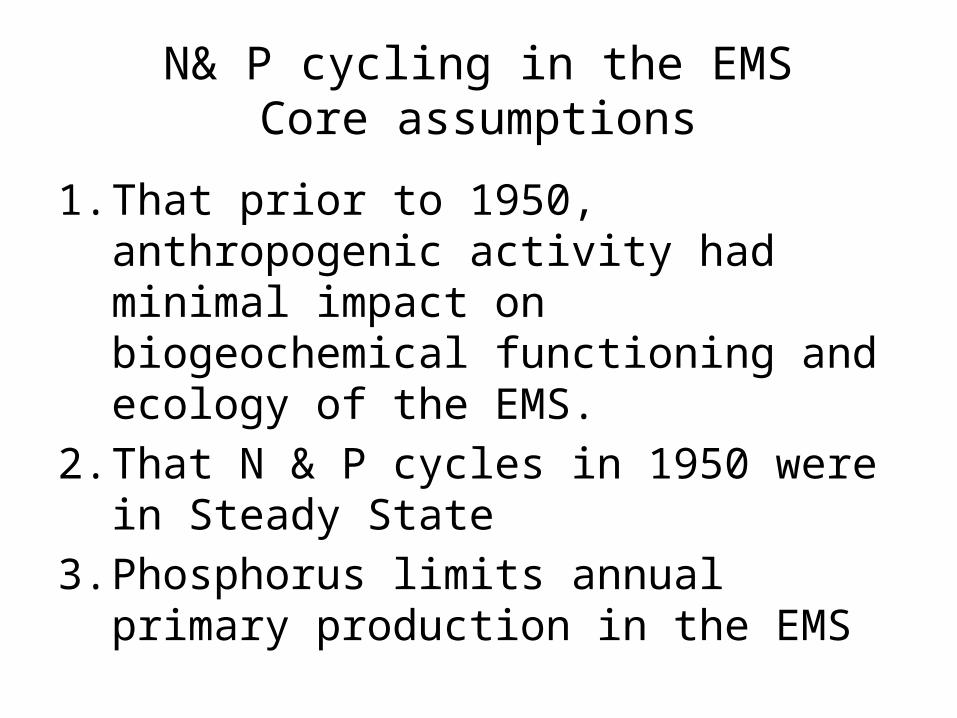
N& P cycling in the EMSCore assumptions
1. That prior to 1950, anthropogenic activity had minimal impact on biogeochemical functioning and ecology of the EMS.
2. That N & P cycles in 1950 were in Steady State
3. Phosphorus limits annual primary production in the EMS

N & P cycling in the EMSHighlights
• Externally supplied nutrients are rapidly utilized by primary productivity in the surface waters
• 93 and 83-88% of P and N respectively are recycled in the Surface Water.
• Such efficient recycling of the limiting nutrient (>90%) is common in oligotrophic systems.

N & P cycling in the EMSHighlights
• Approximately 10% (POP) and 17% (PON) sink into Intermediate Water. There they are exported as inorganic nutrients by the anti-estuarine circulation.
• This is the key process which causes the EMS to be ultra-oligotrophic and its low nutrient content
• The main input into EMS is DOP while the main export is as Phosphate
N & P cycling in the EMSHighlights
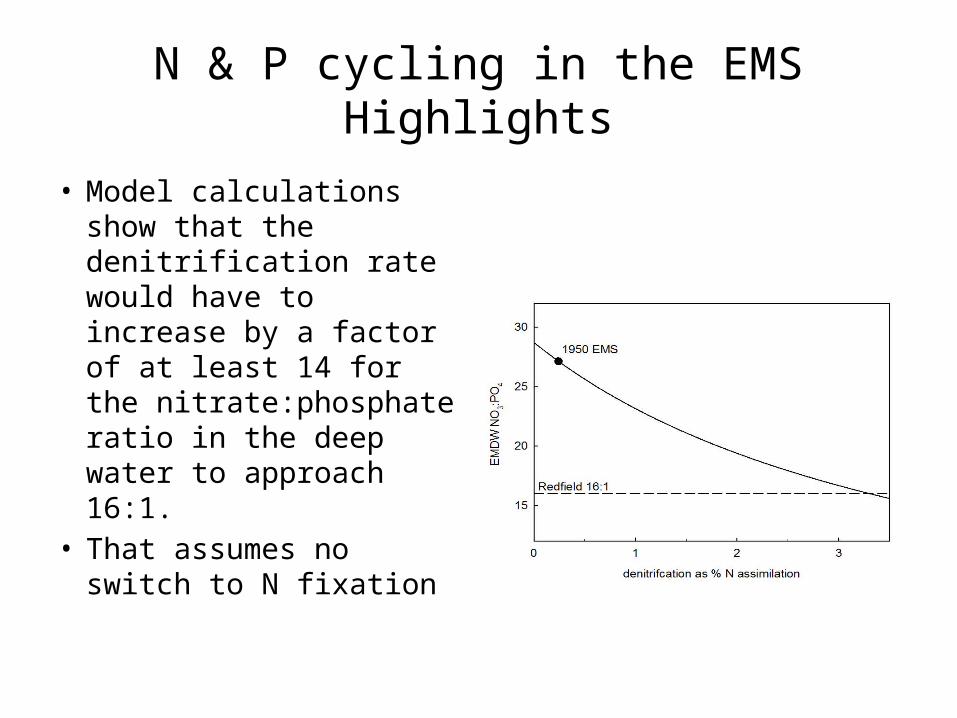
• Model calculations show that the denitrification rate would have to increase by a factor of at least 14 for the nitrate:phosphate ratio in the deep water to approach 16:1.
• That assumes no switch to N fixation
Current Model

N & P cycling in the EMSHighlights
• The model explains the high nitrate:phosphate ratio of 28:1 in the deep water despite Redfield uptake in SW as being due to
1. more efficient cycling of P than N (93% compared to 83-87% for P and N respectively)
2. Preformed Nitrate in sinking water due to P limited bloom in winter, an unusual characteristic of the EMS.
• The model is in balance without nitrogen fixation confirming it can only play a minor role

Summary
• The EMS has low nutrients and low productivity. It also has a high N:P ratio.
• These two properties are linked together since it is the very low O.M. which results in low denitrification
• The Silica distribution in the water column is explained as being mainly due to inputs from silicate from the sediment pore waters
• Our N&P model can explain the major features of the nutrient distribution and how it changes with time.

Have I put you to sleep or are there any Questions?