Biogeochemical North Sea Climatology€¦ · University of Hamburg . 2. Institute of Coastal...
20
Iris Hinrichs 1 , Viktor Gouretski 1 , Johannes Pätsch 1 , Manfred Bersch 1 , Kay Emeis 1,2 , Detlef Stammer 1 1 CEN (Center for Earth System Research and Sustainability), University of Hamburg 2 Institute of Coastal Research, Helmholtz Center Geesthacht Biogeochemical North Sea Climatology
Transcript of Biogeochemical North Sea Climatology€¦ · University of Hamburg . 2. Institute of Coastal...

Iris Hinrichs1, Viktor Gouretski1, Johannes Pätsch1,
Manfred Bersch1, Kay Emeis1,2, Detlef Stammer1
1CEN (Center for Earth System Research and Sustainability),
University of Hamburg
2Institute of Coastal Research, Helmholtz Center Geesthacht
Biogeochemical North Sea Climatology

Motivation and Goals Biogeochemical North Sea Climatology • Continuation of the NOWESP data set
• Analysis of data,
e.g. natural variability, anthropogenic effects
• Reference and validation data set for biogeochemical
modelling in the North Sea region
• Make data products available for users
*
* NOWESP: North Western European Shelf Programme, Research Data Base

Biogeochemical North Sea Climatology
Set of Parameters: • Ammonium • Chlorophyll-a • Nitrate(+Nitrite) • Dissolved Oxygen • Phosphate • Silicate • Temperature • Salinity
Time period: 1960-2014 Spatial dimensions: 3D
65°N
47°N
15°W 15°E
Bersch, Manfred; Gouretski, Viktor; Sadikni, Remon; Hinrichs, Iris; (2013): KLIWAS North Sea Climatology of Hydrographic Data (Version 1.1); World Data Center for Climate (WDCC). doi:10.1594/WDCC/KNSC_hyd_v1.0
*
KLIWAS North Sea Climatology *
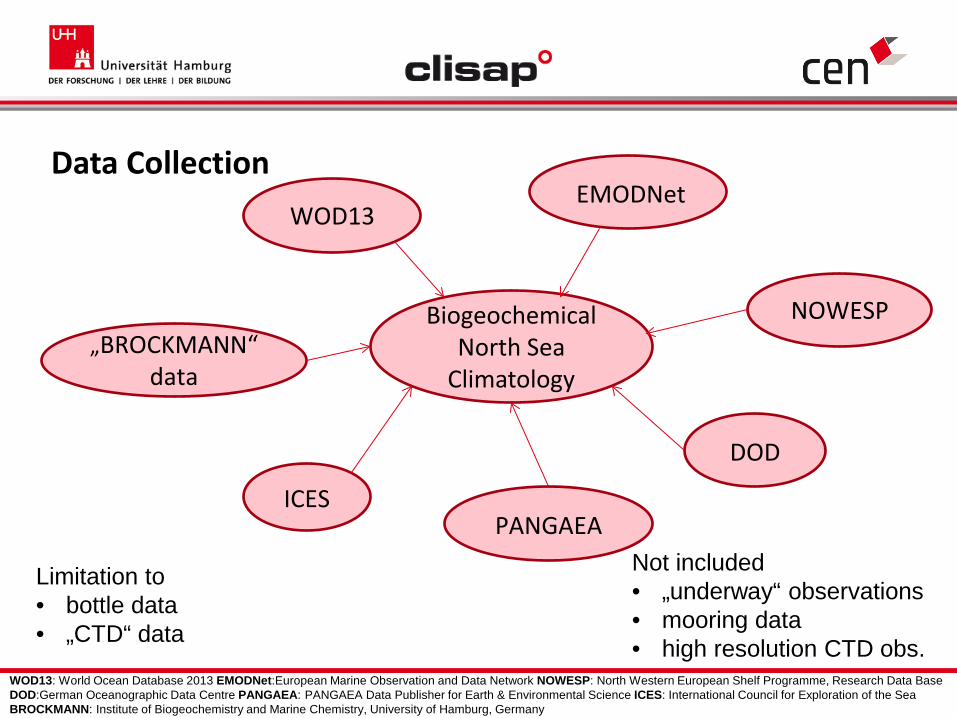
Data Collection
Biogeochemical North Sea
Climatology
WOD13
PANGAEA
DOD
EMODNet
„BROCKMANN“ data
NOWESP
ICES
Limitation to • bottle data • „CTD“ data
Not included • „underway“ observations • mooring data • high resolution CTD obs.
WOD13: World Ocean Database 2013 EMODNet:European Marine Observation and Data Network NOWESP: North Western European Shelf Programme, Research Data Base DOD:German Oceanographic Data Centre PANGAEA: PANGAEA Data Publisher for Earth & Environmental Science ICES: International Council for Exploration of the Sea BROCKMANN: Institute of Biogeochemistry and Marine Chemistry, University of Hamburg, Germany

Necessary Steps of Data Processing Goal: Merge observations from different data sources to one data set
• 7 different data sources means 7 different data formats
⇒ Unification of data formats
• Observations are likely to occur in more than one data source
⇒ Elimination of duplicate observations
• Observations can be erroneous
⇒ Quality control and flagging
Biogeochemical North Sea
Climatology
WOD13
PANGAEA
DOD
EMODNet
„Brockmann“ data
NOWESP
ICES

Overview Merged Data Set

Overview Merged Data Set -data density
high
low

Quality control (QC)
• automatic, objective and tunable
• 9 different quality checks applied to all observations
• Only observations passing all checks are flagged as “good quality“
• Expert quality control in the future

Application of Data Set Comparison: QCed observations monthly mean values
Phosphate
*
* courtesy of Biologische Anstalt Helgoland

Application of Data Set Comparison: QCed observations monthly mean values
Helgoland Roads observations not included
* courtesy of Biologische Anstalt Helgoland
Phosphate
*

Application of Data Set Comparison: QCed observations monthly mean values
* courtesy of Biologische Anstalt Helgoland
dx = abs(monthly_mean - observation)
d2
d3
d5
d4
d1
time-averaging of dx in lat-lon bins

Application of Data Set Comparison: QCed observations monthly mean values
1960-2014 Helgoland Roads
phosphate, time-averaged dx
dx = abs(monthly_mean - observation)

* courtesy of Biologische Anstalt Helgoland
Nitrate
*
Application of Data Set Comparison: QCed observations monthly mean values

Helgoland Roads observations not included
* courtesy of Biologische Anstalt Helgoland
*
Nitrate
Application of Data Set Comparison: QCed observations monthly mean values

Summer (MAMJJA)
Winter (SONDJF)
all months (1960-2014)
Application of Data Set Comparison: QCed observations monthly mean values

Overview
• Data for 6 different BGC-parameters + temperature and salinity from different sources are
- unified
- merged
- quality controlled (ongoing)
- creation of data products (ongoing)
• first application of QCed phosphate data , comparison to Helgoland Road time series

Example of a product: Interpolated monthly mean phosphate concentration
Outlook: data products

Outlook: data products
Example of a product: Interpolated monthly mean nitrate concentration

Acknowledgements The authors would like to thank the data centers of
NODC, PANGAEA, EMODNet, DOD, ICES,
Institute of Biogeochemistry and Marine Chemistry,
and Biologische Anstalt Helgoland
for giving access to the respective data and for their user support,
and
U. Brockmann, M. Schütt, J. Van Beusekom, M. Scharfe, H. Thomas, F. Nast, H.-J. Lenhart, T. Boyer for support with data, fruitful discussions and helpful comments.
This work was partly funded by Clisap.
Contact: [email protected]

BROCKMANN Institute of Biogeochemistry and Marine Chemistry, University of Hamburg, Germany DOD German Oceanographic Data Centre, BSH EMODnet European Marine Observation and Data Network ICES International Council for Exploration of the Sea NOWESP NOWESP Research Data Base, https://wiki.zmaw.de/ifm/ECOHAM/DATA_NOWESP PANGAEA PANGAEA Data Publisher for Earth & Environmental Science Alfred Wegener Institute, Helmholtz Center for Polar and Marine Research (AWI), Bremerhaven, Germany WOD13 Boyer, T.P., J. I. Antonov, O. K. Baranova, C. Coleman, H. E. Garcia, A. Grodsky, D. R. Johnson, R. A. Locarnini, A. V. Mishonov, T.D. O'Brien, C.R. Paver, J.R. Reagan, D. Seidov, I. V. Smolyar, and M. M. Zweng, 2013: World Ocean Database 2013, NOAA Atlas NESDIS 72, S. Levitus, Ed., A. Mishonov, Technical Ed.; Silver Spring, MD, 209 pp., http://doi.org/10.7289/V5NZ85MT