Biogenic emissions from Citrus species in Californianature.berkeley.edu/ahg/pubs/Fares et al 2011...
12
Biogenic emissions from Citrus species in California Silvano Fares a, b, * , Drew R. Gentner c , Jeong-Hoo Park a , Elena Ormeno a, d , John Karlik e , Allen H. Goldstein a, c a University of California, Berkeley, Division of Ecosystem Sciences, Department of Environmental Science, Policy, and Management, CA, USA b CRA (Agricultural Research Council) e Research Center for the Soil-Plant System, Rome, Italy c University of California, Berkeley, Department of Civil and Environmental Engineering, CA, USA d CNRS e INEE e IMEP (National Center of Scientific Research, Institute of Ecology and Environment e Mediterranean Institute of Ecology and Paleoecology), Marseille, France e University of California Cooperative Extension, Kern County, CA, USA article info Article history: Received 29 December 2010 Received in revised form 25 May 2011 Accepted 26 May 2011 Keywords: BVOC emissions OVOC Terpene Basal emission rate Citrus abstract Biogenic Volatile Organic Compounds (BVOC) emitted from plants are the dominant source of reduced carbon chemicals to the atmosphere and are important precursors to the photochemical production of ozone and secondary organic aerosols. Considering the extensive land used for agriculture, cultivated Citrus plantations may play an important role in the chemistry of the atmosphere especially in regions such as the Central Valley of California. Moreover, the BVOC emissions from Citrus species have not been characterized in detail and more species-specific inputs for regional models of BVOC emissions are needed. In this study, we measured the physiological parameters and emissions of the most relevant BVOC (oxygenated compounds, monoterpenes, and sesquiterpenes) for four predominant Citrus species planted in California (Citrus sinensis var. ‘Parent Navel’, Citrus limon var. ‘Meyer’, Citrus reticulata var. ‘W. Murcott’ and ‘Clementine’). We used two analytical techniques to measure a full range of BVOC emitted: Proton Transfer Reaction Mass Spectrometry (PTR-MS) and gas chromatography with mass spectrometry. Methanol, followed by acetone and acetaldehyde, were the dominant BVOC emitted from lemon and mandarin trees (basal emission rates up to 300 ng(C) g(DW) 1 h 1 ), while oxygenated monoterpenes, monoterpenes, and sesquiterpenes were the main BVOC emitted from orange trees (basal emission rates up to ¼ 2500 ng(C) g(DW) 1 h 1 ). Light and temperature-dependent algorithms were better predictors of methanol, acetaldehyde, acetone, isoprene and monoterpenes for all the Citrus species. Whereas, temperature-dependent algorithms were better predictors of oxygenated mono- terpenes, and sesquiterpenes. We observed that flowering increased emissions from orange trees by an order of magnitude with the bulk of BVOC emissions being comprised of monoterpenes, sesquiterpenes, and oxygenated monoterpenes. Chemical speciation of BVOC emissions show that the various classes of terpene emissions among all Citrus species are dominated by ocimenes, b-caryophyllene, and linalool, respectively. In addition to utilizing our reported emission factors in BVOC emission models, we recommend that future BVOC emission models consider additional emissions from flowering and harvest, which occur seasonally and may have a significant impact on regional atmospheric chemistry. Ó 2011 Elsevier Ltd. All rights reserved. 1. Introduction Plants emit biogenic volatile organic compounds (BVOC) to the atmosphere at an estimated global rate of 1e 1.5 Pg C yr 1 (Guenther et al., 1995). These emissions account for 2e3% of the total carbon exchange between biota and the atmosphere (Crutzen et al., 1999; Kesselmeier and Staudt, 1999). In the presence of sunlight and nitrogen oxides (NO x ), the oxidation of BVOC leads to tropospheric ozone formation (Chameides et al., 1988; Papiez et al., 2009), a greenhouse gas with detrimental effects on plant carbon assimi- lation and growth (Guderian et al.,1985), as well as human health (for a reference list, see EPA, 2009). BVOC are also precursors to atmo- spheric aerosol (Kanakidou et al., 2005; Henze and Seinfeld, 2006), accounting for a significant fraction of secondary organic aerosol (SOA) produced in the atmosphere (Goldstein and Galbally, 2007). Leaves are the main sources of BVOC emission into the atmo- sphere (Guenther et al., 1995). Because of the role of BVOC emission in ozone and aerosol atmospheric chemistry, modeling efforts have * Corresponding author. CRA (Agricultural Research Council) e Research Centre for the Soil-Plant System, Via della Navicella, 2-4 00184 Rome, Italy. Tel.: þ39 06 7005413 224; fax: þ39 06 7005711. E-mail address: [email protected] (S. Fares). Contents lists available at ScienceDirect Atmospheric Environment journal homepage: www.elsevier.com/locate/atmosenv 1352-2310/$ e see front matter Ó 2011 Elsevier Ltd. All rights reserved. doi:10.1016/j.atmosenv.2011.05.066 Atmospheric Environment 45 (2011) 4557e4568
Transcript of Biogenic emissions from Citrus species in Californianature.berkeley.edu/ahg/pubs/Fares et al 2011...

lable at ScienceDirect
Atmospheric Environment 45 (2011) 4557e4568
Contents lists avai
Atmospheric Environment
journal homepage: www.elsevier .com/locate/atmosenv
Biogenic emissions from Citrus species in California
Silvano Fares a,b,*, Drew R. Gentner c, Jeong-Hoo Park a, Elena Ormeno a,d, John Karlik e,Allen H. Goldstein a,c
aUniversity of California, Berkeley, Division of Ecosystem Sciences, Department of Environmental Science, Policy, and Management, CA, USAbCRA (Agricultural Research Council) e Research Center for the Soil-Plant System, Rome, ItalycUniversity of California, Berkeley, Department of Civil and Environmental Engineering, CA, USAdCNRS e INEE e IMEP (National Center of Scientific Research, Institute of Ecology and Environment e Mediterranean Institute of Ecology and Paleoecology), Marseille, FranceeUniversity of California Cooperative Extension, Kern County, CA, USA
a r t i c l e i n f o
Article history:Received 29 December 2010Received in revised form25 May 2011Accepted 26 May 2011
Keywords:BVOC emissionsOVOCTerpeneBasal emission rateCitrus
* Corresponding author. CRA (Agricultural Researchfor the Soil-Plant System, Via della Navicella, 2-4 007005413 224; fax: þ39 06 7005711.
E-mail address: [email protected] (S. Fares).
1352-2310/$ e see front matter � 2011 Elsevier Ltd.doi:10.1016/j.atmosenv.2011.05.066
a b s t r a c t
Biogenic Volatile Organic Compounds (BVOC) emitted from plants are the dominant source of reducedcarbon chemicals to the atmosphere and are important precursors to the photochemical production ofozone and secondary organic aerosols. Considering the extensive land used for agriculture, cultivatedCitrus plantations may play an important role in the chemistry of the atmosphere especially in regionssuch as the Central Valley of California. Moreover, the BVOC emissions from Citrus species have not beencharacterized in detail and more species-specific inputs for regional models of BVOC emissions areneeded. In this study, we measured the physiological parameters and emissions of the most relevantBVOC (oxygenated compounds, monoterpenes, and sesquiterpenes) for four predominant Citrus speciesplanted in California (Citrus sinensis var. ‘Parent Navel’, Citrus limon var. ‘Meyer’, Citrus reticulata var.‘W. Murcott’ and ‘Clementine’). We used two analytical techniques to measure a full range of BVOCemitted: Proton Transfer Reaction Mass Spectrometry (PTR-MS) and gas chromatography with massspectrometry. Methanol, followed by acetone and acetaldehyde, were the dominant BVOC emitted fromlemon and mandarin trees (basal emission rates up to 300 ng(C) g(DW)�1 h�1), while oxygenatedmonoterpenes, monoterpenes, and sesquiterpenes were the main BVOC emitted from orange trees (basalemission rates up to ¼ 2500 ng(C) g(DW)�1 h�1). Light and temperature-dependent algorithms werebetter predictors of methanol, acetaldehyde, acetone, isoprene and monoterpenes for all the Citrusspecies. Whereas, temperature-dependent algorithms were better predictors of oxygenated mono-terpenes, and sesquiterpenes. We observed that flowering increased emissions from orange trees by anorder of magnitude with the bulk of BVOC emissions being comprised of monoterpenes, sesquiterpenes,and oxygenated monoterpenes. Chemical speciation of BVOC emissions show that the various classes ofterpene emissions among all Citrus species are dominated by ocimenes, b-caryophyllene, and linalool,respectively. In addition to utilizing our reported emission factors in BVOC emission models, werecommend that future BVOC emission models consider additional emissions from flowering andharvest, which occur seasonally and may have a significant impact on regional atmospheric chemistry.
� 2011 Elsevier Ltd. All rights reserved.
1. Introduction
Plants emit biogenic volatile organic compounds (BVOC) to theatmosphere at an estimated global rate of 1e1.5 Pg C yr�1 (Guentheret al., 1995). These emissions account for 2e3% of the total carbonexchange between biota and the atmosphere (Crutzen et al., 1999;
Council) e Research Centre184 Rome, Italy. Tel.: þ39 06
All rights reserved.
Kesselmeier and Staudt, 1999). In the presence of sunlight andnitrogen oxides (NOx), the oxidation of BVOC leads to troposphericozone formation (Chameides et al., 1988; Papiez et al., 2009),a greenhouse gas with detrimental effects on plant carbon assimi-lation and growth (Guderian et al.,1985), aswell as humanhealth (fora reference list, see EPA, 2009). BVOC are also precursors to atmo-spheric aerosol (Kanakidou et al., 2005; Henze and Seinfeld, 2006),accounting for a significant fraction of secondary organic aerosol(SOA) produced in the atmosphere (Goldstein and Galbally, 2007).
Leaves are the main sources of BVOC emission into the atmo-sphere (Guenther et al., 1995). Because of the role of BVOC emissionin ozone and aerosol atmospheric chemistry, modeling efforts have

S. Fares et al. / Atmospheric Environment 45 (2011) 4557e45684558
been done to characterize BVOC emissions on a regional and globalbasis (Lamb et al., 1993; Benjamin et al., 1997; Guenther et al., 1995,2006). These models can predict emissions of a range of BVOC,including those in this study, parameterized by integrating envi-ronmental data, plant distribution, biomass density, using emissionalgorithms which incorporate the basal emission factor (BEF) of themodeled species while accounting for either the light andtemperature dependence (Monson et al., 1992; Niinemets et al.,2004), or just the temperature dependence (Tingey et al., 1980;Harley et al., 1996). BEF come from direct emission measurementsperformed at leaf, branch, or canopy scales using different samplingtechniques, and they are defined at standardized conditions of30 �C and 1000 mmol m�2 s�1 of photosynthetically active radiation(PAR). Robust compound-specific information on basal emissionfactors improves the accuracy of emission models since not allBVOC are emitted in the same way.
Isoprene emission, the dominant BVOC emitted to the atmo-sphere (Guenther et al., 1995) primarily responds to light andtemperature because its formation pathway is primarily in the leafchloroplast, strictly related to photosynthesis, and is releasedimmediately after production (Lichtenthaler et al., 1997).
Monoterpenes are 10-carbon isoprenoids whose emissions aredependent on temperature and, in some cases, on light as well.Monoterpene emissions from many plants have been described astemperature-dependent because their emission is mainly the resultof volatilization from storage organs (Kesselmeier and Staudt, 1999;Niinemets et al., 2004).
Sesquiterpenes are another important class of isoprenoids whoseemissions depend primarily on temperature, but they are formed bya different biosynthetic pathway than isoprene and monoterpenes(for a reviewseeDuhl et al., 2008). Thesehydrocarbons, containing15carbon atoms, have previously been considered to account for a smallpercentage of global BVOC emissions (Guenther et al., 1995), butrecent results suggest their total emission rates are similar tomonoterpenes (Ormeño et al., 2010). Sesquiterpene emissions are ofgreat interest since they contribute to secondary organic aerosol evenmore than monoterpenes (Lee et al., 2006a,b; Ng et al., 2006).
Unlike emissions of isoprene and monoterpenes, which havebeen extensively studied, themain knowledge of oxygenated volatileorganic compounds (in this paper described with the acronymOVOC) emissions only dates from the last decade (for a review, seeSteiner and Goldstein, 2007; Koppmann and Wildt, 2007). Similarlyto isoprenoids, OVOC can notably influence the oxidizing capacityand the ozone-forming potential of the atmosphere, while alsoincreasing concentrations of HOx and peroxyacetyl nitrates, andpossibly contributing to the formation of organic aerosol (Singh et al.,2001). Methanol is a biogenic volatile emitted by plants to theatmosphere in large quantities from the demethylation of pectins incell walls (Obendorf, 1990) with global emissions estimated at100e240 Tg yr�1 (Galbally and Kirstine, 2002; Jacob et al., 2005;Millet et al., 2008). Methanol emissions occur under phenologicalmodification of leaf tissues during leaf expansion and senescence(Schade and Goldstein, 2002; Huve et al., 2007; Fall, 2003). Previousstudies reported methanol emission in response to oxidative stressfollowing cutting and during drying of grass (Karl et al., 2001) orfollowing leaf wounding (Loreto et al., 2006).
Acetone is the most abundant ketone in the atmosphere(Koppmann and Wildt, 2007); global emissions are estimated at95 Tg yr�1 (Jacob et al., 2002)with considerable sources in rural areas(Goldan et al., 1995; Riemer et al., 1998; Ciccioli et al., 1999).
This compound is emitted primarily from terrestrial ecosystemsand oceans, but is also produced in the atmosphere in large amountsfrom oxidation of hydrocarbons of both anthropogenic and biogenicorigin (Goldstein and Schade, 2000). While we know that biogenicacetone is released during senescence (de Gouw et al., 1999) and
oxidative stress on plants (e.g. from ozone) (Cojocariu et al., 2005),the biosynthetic pathway of acetone formation in leaves stilldeserves more investigation.
Acetaldehyde is another OVOC that is directly emitted fromoceanic and terrestrial sources, but is also a product of hydrocarbonoxidation in the atmosphere. An estimate of acetaldehyde emissionwas recently reported by Millet et al. (2009), with values which aresimilar to acetone. The emission of this OVOC from plants occursmainly under anoxic conditions in roots (Kreuzwieser et al., 1999)and in leaves (Karl et al., 2002; Graus et al., 2004). It is also emitted byleaves in large quantities during and after abiotic stresses (Fall et al.,1999; Loreto et al., 2006), or after light to dark transitions (Karl et al.,2002).
The objectives of this study were (1) determine the branch-levelBEF for each BVOC (including OVOC) emitted from Citrus species,and (2) test the performance of current algorithms to predict BVOCemission by comparing modeled vs observed measurements. Wefocused on four important Citrus varieties: orange (Citrus sinensis‘Parent Navel’), lemon (Citrus limon ‘Meyer’), and mandarin (Citrusreticulata ‘W. Murcott’ and ‘Clementine’). We chose these speciesand varieties because citrus cultivation often occurs close topolluted urban areas where urban emissions mix with agriculturalemissions. This is the case in the Central Valley of California,a region with extensive agriculture and anthropogenic pollutionfrom large nearby cities (e.g. Fresno, Bakersfield, and Sacramento)and regional agricultural activities, as well as inflow of pollutionfrom populated coastal regions (e.g. the San Francisco Bay area).
2. Material and methods
2.1. Choice of Citrus species and experimental set-up
Experiments were carried out in 2008 from the last week ofAugust to the first week of October in the Oxford Greenhouse at theUniversity of California, Berkeley, USA. For the 4 Citrus species, a setof 10 individuals of the same genotype were ordered froma commercial nursery (Willits and Newcomb) and placed in thegreenhouse in February to allow for adaptation to the environ-mental conditions of the greenhouse. Selected species were orange(C. sinensis var. ‘Parent Navel’ grafted on Volk rootstock), lemon(C. limon var. ‘Meyer’ on Volk rootstock), mandarins (C. reticulatavar. ‘W.Murcott’ and ‘Clementine’, both on C-35 rootstock). All treeswere 3 years old and potted in 19 L pots; they were irrigated dailyand fertilized weekly (Peters Professional, general purpose fertil-izer 20-20-20) to promote favorable growing conditions and avoidwater stress interference. Temperatures in the greenhouse werecontrolled with nighttime values around 17 �C and mid-day valuesup to 31 �C. Plants were exposed to natural sun light which filteredthrough the glass roof of the greenhouse facility. Photosyntheticallyactive radiation (PAR) ranged from 0 to 1400 mmol m�2 s�1. Relativehumidity was maintained in the range of 40e60%.
2.2. Enclosure systems to measure BVOC and photosyntheticparameters
Two identical dynamic branch enclosures were built to enablesampling BVOC emissions from two plants at a time (for a detailedexperimental design see Fares et al., 2010). For each measurementwe enclosed a single branch which contained 10e500 g of leaf freshbiomass, an amount large enough to ensure that BVOC concentra-tion inside the systemwas sufficient to achieve an adequate signal/noise ratio during BVOC emission monitoring (Tholl et al., 2006;Ortega and Helmig, 2008). The cylindrical enclosure (volume84 L) was made of a rigid Teflon frame and coated with transparentTeflon FEP film (0.025 mm thick, Richmond Air Craft products, Inc.)
S. Fares et al. / Atmospheric Environment 45 (2011) 4557e4568 4559
allowing good illumination to leaves. This structure was madecompletely of Teflon tominimize reactions of BVOC on the chamberwalls. The air flushed through the inlet of the enclosure was firstpurified using a zero air generator (Aadcomod. 737) to remove CO2,hydrocarbons, and ozone. After purification, it was enriched withCO2 from a pure cylinder connected to a mass-flow controller (MKSInstruments, Inc.) to simulate ambient CO2 concentration of380 ppm. The air flow at the enclosure inlet was maintained at8.5 L min�1 using a mass-flow controller (MKS Instruments, Inc.). Ashort section of ¼ inch Teflon tubing leading to a shower-basedTeflon ring with multiple holes allowed for a uniform distributionof the air flow inside the enclosure and facilitated air mixing. Underthese conditions, we calculated an air retention time in the enclo-sure of w10 min.
During plant enclosure, the stems were gently wrapped with theTeflon film to avoid mechanical damage as much as possible. In allcases,measurements started 24hafter plant enclosure to compensatefor potential enclosure effects. The pure air flowed in continuouslyduring the 2e3 days of measurements. Each enclosure was equippedwith a radiation sensor (LICOR quantum sensor mod. Li-190), a rela-tive humidity and temperature sensor (Omega engineering mod.HX93AV-RP1), and with a system of fine wire thermocouplestouching the abaxial side of the leaves to measure their temperature(Omega Engineering, Precision Fine Wire thermocouples).
Measurements of photosynthetic parameters and BVOC werecarried out by switching between the plant enclosure outflowsevery 15 min with a system of 2- and 3-way solenoid valves(TEQCOM Industries) controlled by a datalogger (Campbell Scien-tific, mod. CR10) that recorded data every minute. The first 3 min ofeach cycle were dedicated to the measurement of the zero airentering the enclosures. Fluxes were calculated using the differen-tial approach described by Fares et al. (2008). CO2 and waterexchanges were measured with a closed-path infrared gas analyzer(IRGA, LICORmod. 6262) and enclosed leaf areawas measured witha leaf area meter (LICOR mod. 3100C). The nocturnal CO2 exchangewas used to determine respiration rates. After BVOC sampling,enclosed leaves were dried by lyophilization and weighed in orderto express BVOC emission rates on a dry mass basis.
2.3. PTR-MS system
A PTR-MS was used for on-line measurements of BVOC. Fora detailed description of the instrument see Lindinger et al. (1998)or de Gouw andWarneke (2007). The instrument sampled from themain sampling line at 0.4 Lmin�1 andwas optimized to an E/N ratioof 128 Td using a drift tube pressure, temperature, and voltage of2.02 hPa, 45 �C, and 600 V, respectively. The reaction time was100 ms and the count rate of H3OþH2O ions was less than 3% of thecount rate of H3Oþ ions, which was w5 � 106 counts s�1. BVOCfluxes were calculated with a differential approach from fastconcentration measurements in multiple ion detection mode,including the following compounds with a dwell time of 1 s each:methanol (mass to charge ratio (m/z) 33), acetaldehyde (m/z 45),acetone (m/z 59), isoprene (m/z 69), monoterpenes (m/z 81 and137), and products of lipoxygenation (3-Z-hexenol, 2-E-hexenal,3-Z-hexenal, 2-E-hexenol at m/z 93, 97, 99, 101, respectively). Eachmeasurement cycle was repeated for an 11 min measuring time.The instrumental background was measured by directing thesample flow through a catalyst-based purifier for the first 3 minbefore starting the measurement of the sample air. The purifierconsisted of a stainless steel tube filled with platinum-coatedquartz wool (Shimadzu) heated to 350 �C, which efficientlyremoved the VOC but not the water vapor from the sample. This isimportant because the background compounds may depend on thehumidity of the sampled air.
Gravimetrically-prepared gas standard cylinders (Apel & Riemer)of pure nitrogen with small mixing ratios (4e5 ppm) of methanol,acetaldehyde, acetone, and a mixture of monoterpenes (a-pinene,D-limonene, D-3-carene) were automatically measured twice a dayby diluting with purified air to obtain concentrations in the range of10e50 ppb, which are similar to those expected in the plant enclo-sures. The count signalwas then transformed to ppb after subtractingthe averaged background levels and taking into account themeasured sensitivities for each calibrated compound (i.e.counts ppb�1, Davison et al., 2009). For oxygenated compoundconcentrations, we calculated normalized sensitivities (counts/concentration) based on calculated proton transfer reaction ratecoefficients and the instrument specific transmission coefficientcalculated from a transmission curve. This curve was determined atan array of masses from 33 to 219 m/z using our gas standards atconcentrations of 50 ppb. Due to poor transmission coefficients ofmasses abovem/z 150, we discardedmeasurements of masses abovethat molecular weight (e.g. oxygenated monoterpenes (m/z 155) andsesquiterpenes (m/z 205)). During measurements, markers of cellwall degeneration resulting from wounding effects (3-Z-hexenol,2-E-hexenal, 3-Z-hexenal, 2-E-hexenol, m/z 93, 97, 99, 101) weredetected in trace concentrations after inserting the branch in theenclosure. Therefore emission rates were only considered reliableafter observing negligible emission of these markers (enclosureconcentrations< 50 ppt, which is close to the instrumental detectionlimit); in most cases this was one day after the enclosure of the leafmaterial (data not shown).
2.4. GC/MS-FID system
In parallel with PTR-MS, hourly-resolved VOC concentrations andemissions were measured using an automated in-situ gas chro-matograph (Agilentmod. 5890) equippedwith both amass-selectivedetector (Agilentmod. 5971) and aflame ionization detector (GC/MS-FID) (further details on this instrument can be found in Millet et al.,2005). The instrument pre-concentrated w600 mL of the enclosureeffluent onto two separate adsorbent traps over a 30min period andthermally-desorbed them onto capillary columns; the FID-analyzedsample was collected on a glass bead/Carbopak B/Carboxen 1000adsorbent mix and injected onto a DB-624 column, while the MSD-analyzed sample was collected on Tenax-TA, then injected ontoa Rtx-5 column. Calibrations were performed using gas-phasemonoterpene standards and liquid standards for more reactivecompounds (e.g. sesquiterpenes and unstable monoterpenes).
We report emissions of monoterpenes, sesquiterpenes, andoxygenatedmonoterpenes using this instrumentation. A comparisonof isoprene and monoterpenes measured using both the GC/MS-FIDand the PTR-MS systems shows agreement within 20% (r ¼ 0.97,PTR-MS Flux ¼ 0.81 � GC/MS-FID Flux) calculated using a trust-region LevenbergeMarquardt least orthogonal distance regressionmethod to account for uncertainties in both the measurements. Dueto the poor transmission to the PTR-MS quadrupole, sesquiterpenesand oxygenated monoterpenes were consistently underestimatedwith PTR-MS (PTR-MS Flux¼ 0.20�GC/MS-FID Flux). Thus, for thesetwo classes of compounds, we solely considered emission valuesfrom GC/MS-FID.
2.5. Emission algorithms
Emissions of some BVOC species respond strongly to both lightand temperature, while emission of other BVOC species are almostcompletely dependent on temperature only, therefore two differentalgorithms are typically applied tomodel emissions (Niinemets et al.,2004). In the first case, BVOC can be emitted after being synthesizedin the leaves through an enzymatic control, which is dependent on
S. Fares et al. / Atmospheric Environment 45 (2011) 4557e45684560
light and temperature. To test for dependencies on light andtemperature, we modeled fluxes (EL þ T) using the algorithmproposed by Guenther et al. (1993) (hereafter called LþTalgorithm):
ELþT ¼ BEF
"aCLPARffiffiffiffiffiffiffiffiffiffiffiffiffiffiffiffiffiffiffiffiffiffiffiffi1þa2PAR2
p#�
2664
exp�CT1ðT�TSÞ
RTST
�
0:961þexp�CT2ðT�TMÞ
RTST
�3775 (1)
where the empirical coefficients are a (0.0027), CL (1.066), CT1(95,000 J mol�1), CT2 (230,000 J mol�1) and TM (314 K); R is theuniversal gas constant (8.314 J K�1 mol�1), T is the leaf temperature(K) and TS is the leaf temperature at standard conditions (303 K)(Guenther et al., 1993; Guenther, 1997). Basal emission factors (BEF)were calculated for each species as an average of the data that metthe following conditions: 1. Temperature ¼ 30 � 2 �C, 2.PAR> 800 mmolm�2 s�1, negligible concentrations of lipoxygenation
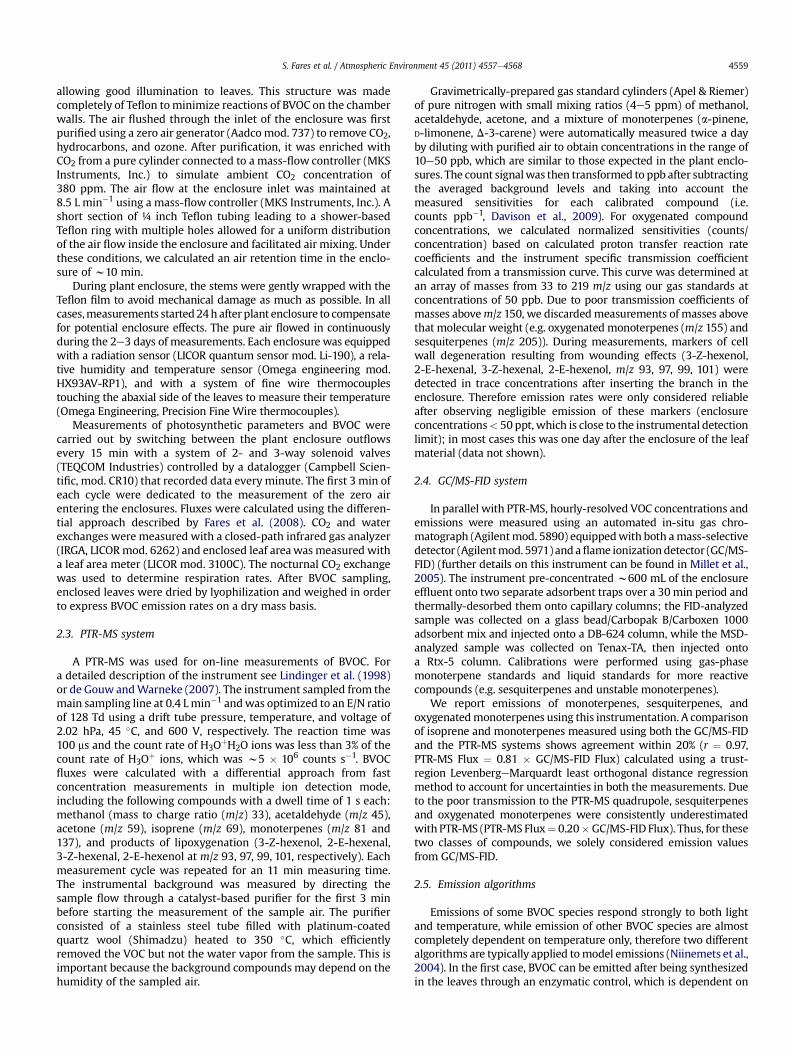
Fig. 1. Diurnal pattern of photosynthesis and stomatal conductance, and BVOC emission fromrefer to BVOC emission modeled with the T algorithm. Broken lines show BVOC modeled e
markers, andphotosynthetic rates comparable to literature andneverbelow 2 mmol m�2 s�1.
A second emission mechanism assumes BVOC are synthesizedand stored in specific pools inside the leaves and emitted to theatmosphere by volatilization. These diffusive processes are modeledassuming they depend only on temperature. Emissions of BVOCwere modeled with the algorithm (ET) proposed by Tingey et al.(1980) (hereafter called T algorithm):
ET ¼ BEFexp½bðT � TsÞ� (2)
Where b (K�1) is a coefficient that represents the exponentialdependence on temperature and was calculated inverting Eq. (2)and applying the measured BEF during the day.
Modeled fluxes were analyzed for linear correlation withmeasured observations, and the slope coefficient and R-square values(R2) were calculated with a statistical program (Matlab v. R2010a) in
Meyer lemon. Points (�std. error, n ¼ 4) refer to measured emissions. Continuous linesmission with the L þ T algorithm.

S. Fares et al. / Atmospheric Environment 45 (2011) 4557e4568 4561
order to estimate which modeled emissions better represent theactual BVOC emission from leaves.
3. Results and discussion
Our study is the first using PTR-MS to detect BVOC emission andBEF for Citrus species in California. We show the diurnal emissiondynamics for all BVOC and physiological parameters, includingphotosynthesis and stomatal conductance (Figs. 1e4). Photosyn-thesis was only weakly correlation with all the BVOC groups westudied (data not shown), in particular during flowering, suggestingthat photosynthesis cannot be considered a valid proxy for BVOCemission from citrus trees. Stomatal conductance was also notsignificantly correlatedwith BVOC emissions (data not shown). This
Fig. 2. Diurnal pattern of photosynthesis and stomatal conductance, and BVOC emissionContinuous lines refer to BVOC emission modeled with the T algorithm. Broken lines show
result is in agreement with published observations that stomatalclosure does not impede monoterpene emissions (Brilli et al.,2007). The lack of stomatal control over BVOC emission has beenpreviously described by Niinemets et al. (2004), who showed thatemission of some compounds like isoprenoids are less sensitivethan other compounds (e.g. organic acids) to stomatal opening dueto their partitioning to the gaseous phase and fast release into theatmosphere.
3.1. OVOC emissions: methanol
In lemon and mandarins, methanol was the oxygenatedcompoundwith the highest emissions (Fig.1) and a BEF ranging from140 to 300 ng(C) g(DW)�1 h�1 for ‘Meyer’ lemon and ‘Clementine’
from Clementine mandarin. Points (�std. error, n ¼ 4) refer to measured emissions.BVOC modeled emission with the L þ T algorithm.
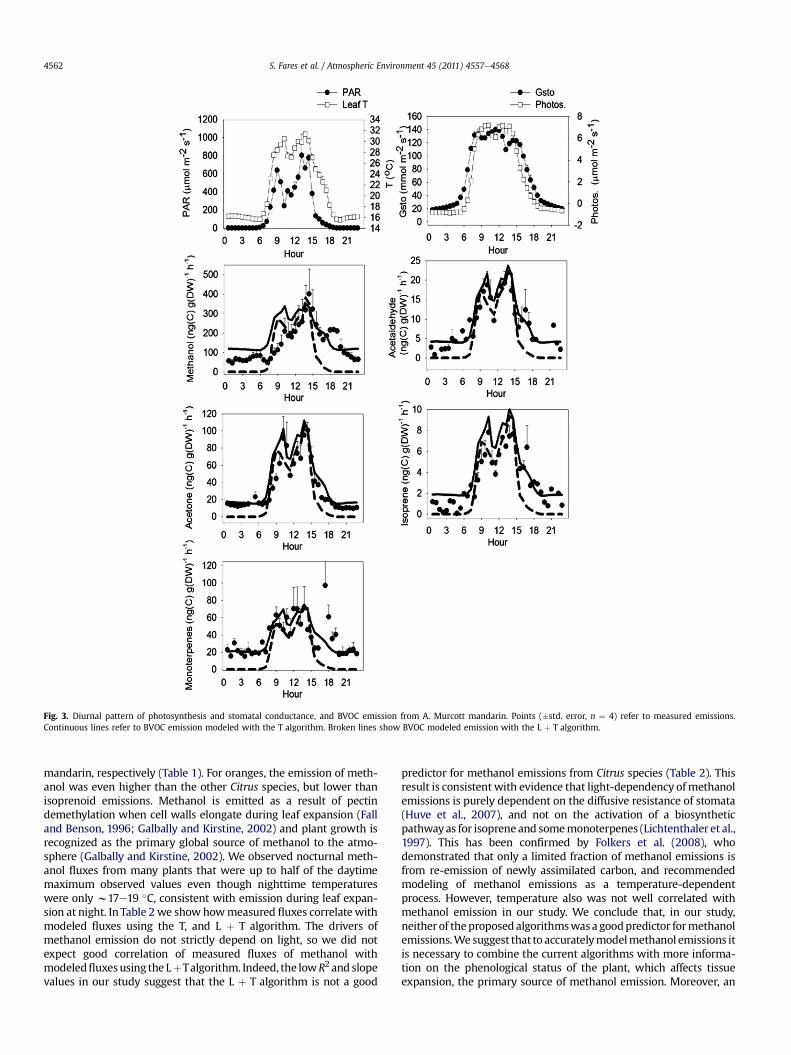
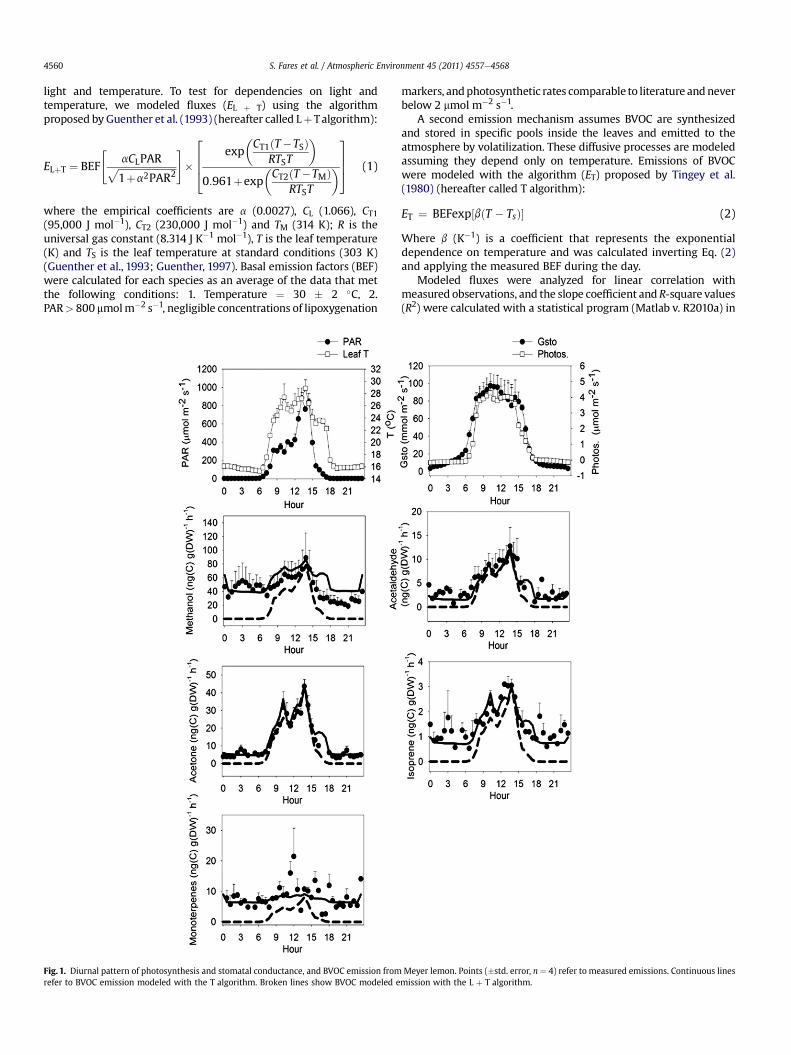
Fig. 3. Diurnal pattern of photosynthesis and stomatal conductance, and BVOC emission from A. Murcott mandarin. Points (�std. error, n ¼ 4) refer to measured emissions.Continuous lines refer to BVOC emission modeled with the T algorithm. Broken lines show BVOC modeled emission with the L þ T algorithm.
S. Fares et al. / Atmospheric Environment 45 (2011) 4557e45684562
mandarin, respectively (Table 1). For oranges, the emission of meth-anol was even higher than the other Citrus species, but lower thanisoprenoid emissions. Methanol is emitted as a result of pectindemethylation when cell walls elongate during leaf expansion (Falland Benson, 1996; Galbally and Kirstine, 2002) and plant growth isrecognized as the primary global source of methanol to the atmo-sphere (Galbally and Kirstine, 2002). We observed nocturnal meth-anol fluxes from many plants that were up to half of the daytimemaximum observed values even though nighttime temperatureswere only w17e19 �C, consistent with emission during leaf expan-sion at night. In Table 2we show howmeasured fluxes correlatewithmodeled fluxes using the T, and L þ T algorithm. The drivers ofmethanol emission do not strictly depend on light, so we did notexpect good correlation of measured fluxes of methanol withmodeledfluxesusing the LþTalgorithm. Indeed, the lowR2 and slopevalues in our study suggest that the L þ T algorithm is not a good
predictor for methanol emissions from Citrus species (Table 2). Thisresult is consistentwith evidence that light-dependency ofmethanolemissions is purely dependent on the diffusive resistance of stomata(Huve et al., 2007), and not on the activation of a biosyntheticpathwayas for isoprene and somemonoterpenes (Lichtenthaler et al.,1997). This has been confirmed by Folkers et al. (2008), whodemonstrated that only a limited fraction of methanol emissions isfrom re-emission of newly assimilated carbon, and recommendedmodeling of methanol emissions as a temperature-dependentprocess. However, temperature also was not well correlated withmethanol emission in our study. We conclude that, in our study,neither of theproposedalgorithmswasa goodpredictor formethanolemissions.We suggest that to accuratelymodelmethanol emissions itis necessary to combine the current algorithms with more informa-tion on the phenological status of the plant, which affects tissueexpansion, the primary source of methanol emission. Moreover, an

Fig. 4. Diurnal pattern of photosynthesis and stomatal conductance, and BVOC emission from Parent Navel orange. Points (�std. error, n ¼ 4) refer to measured emissions.Continuous lines refer to BVOC emission modeled with the T algorithm. Broken lines show BVOC modeled emission with the L þ T algorithm.
S. Fares et al. / Atmospheric Environment 45 (2011) 4557e4568 4563
improvedmodeling approach should consider increases of methanolemission in response to oxidative stress imposed by cutting (Karlet al., 2001) or leaf wounding (Loreto et al., 2006).
3.2. OVOC emissions: acetaldehyde and acetone
Our study demonstrates direct biogenic emission of acetalde-hyde and acetone from Citrus. Interestingly, past field studies ofcitrus (Ciccioli et al., 1999; Smith et al., 1996) attributed emissionsof acetaldehyde and acetone to atmospheric oxidation processes(e.g. photooxidation of linalool) because no detectable emissionwas observed from branch enclosures. Given the low retention timein our enclosures (w10 min) and the limited presence of reactiveoxidants (OH, ozone), we exclude gas-phase reaction as theproduction source in the enclosure, and thus associate fluxes of
acetone and acetaldehyde with direct plant emissions. We recog-nize that additional gas-phase chemistry in the ambient atmo-sphere may enhance the apparent emission of both compoundsduring field studies.
Acetaldehyde was emitted in considerable amounts, especiallyfrom navel orangewhen flowering (BEF¼ 1700 ng(C) g(DW) �1 h�1),while lemon and mandarins emitted at minimal rates(BEFw20ng(C) g(DW)�1 h�1) (Table1). Acetaldehyde emission fromleaves has been described as a product of catabolism and observed inlarge quantities during and after abiotic stresses (Fall et al., 1999;Loreto et al., 2006), or after light to dark transitions (Karl et al.,2002; Graus et al., 2004). In general, emissions are better repre-sented by the L þ T algorithm, with slopes closer to 1 in all Citrusspecies, with the exception of ‘Clementine’ mandarin, where nosignificant correlationwas found (Table 2). This suggests that light is

Table 1Photosynthesis (mg(C) g(DW)�1 h�1) and BVOC basal emission factors (ng(C) g(DW)�1 h�1) of Citrus species. The b value calculated from the Tingey (T) algorithm is reportedbelow each BVOC species. Data � standard errors refer to basal conditions of Temperature ¼ 30 � 2 �C and Photosynthetically Active Radiation (PAR) > 800 mmol m�2 s�1
extrapolated from the observations (note that temperatures rarely reached 30 �C in the greenhouse). PTR-MS was used to measure fluxes of methanol, acetaldehyde, acetone,isoprene, monoterpenes. GC/MS-FID was used to measure fluxes of sesquiterpenes and oxygenated monoterpenes. N ¼ 4 for all tree species for PTR-MS measurement exceptflowering Navel orange and mandarins (N ¼ 2). N ¼ 4 for Navel orange measured with GC/MS-FID. n.d. ¼ not detected; n.a. ¼ GC/MS-FID measurements not available.
Species ‘Meyer’ lemon ‘Clementine’ mandarin ‘W. Murcott’ mandarin ‘Parent Navel’orange (no flowers)
‘Parent Navel’orange (with flowers)
Photosynthesis 1.65 � 0.50 3.93 � 0.63 2.42 � 0.01 2.04 � 0.11 0.61 � 0.02Methanol 140 � 30 300 � 80 190 � 65 480 � 200 880 � 140b 0.046 � 0.006 0.087 � 0.030 0.064 � 0.018 0.059 � 0.011 0.059 � 0.004Acetaldehyde 18 � 4.5 23.3 � 10.8 16 � 3.5 650 � 415 1700 � 550b 0.13 � 0.013 0.068 � 0.008 0.11 � 0.015 0.13 � 0.007 0.15 � 0.007Acetone 50 � 7.15 54 � 18 69.4 � 20.5 240 � 90 500 � 65b 0.159 � 0.004 0.116 � 0.001 0.127 � 0.004 0.078 � 0.009 0.12 � 0.001Isoprene 3.16 � 0.05 4.72 � 0.05 8.4 � 0.84 13.22 � 1.90 45.32 � 23.62b 0.106 � 0.002 0.062 � 0.046 0.113 � 0.016 0.123 � 0.007 0.173 � 0.002Monoterpenes 22 � 9 26 � 7.4 63 � 12.5 2500 � 1700 7800 � 2150b 0.03 � 0.020 0.064 � 0.009 0.084 � 0.015 0.14 � 0.016 0.15 � 0.014Oxy. MT n.a. n.d. 150 � 95 1300 � 950 4600 � 650b n.a. n.d. 0.23 � 0.040 0.18 � 0.070 0.072 � 0.040Sesquiterpenes n.a. n.d. n.d. 1500 � 485 3200 � 274b n.a. n.d. n.d. 0.40 � 0.070 0.28 � 0.030
S. Fares et al. / Atmospheric Environment 45 (2011) 4557e45684564
related to those catabolic processes responsible for acetaldehyderelease, although we cannot provide a detailed explanation for thespecific pathway which is triggered by light and leads to acetalde-hyde emission.
Acetonewas also emitted from leaves, with the highest emissionobserved from oranges, with BEF> 200 ng(C) g(DW)�1 h�1. There isstill a lot of uncertainty about the biogenic sources of acetone, buta previous study showed that that acetone is released from leavesduring senescence (de Gouw et al., 1999). Another study showed anincrease in acetone release after and oxidative stress generated byozone exposure (Cojocariu et al., 2005), thus suggesting thatemission of acetone is not only correlated with temperature andlight, when these environmental factors are present that can triggeroxidative stress (e.g. heat stress, photooxidation). In our study,acetone emissions seemed to be better represented by the T algo-rithm for lemon and mandarins (i.e. slopes closer to 1 or better R2),while for oranges, acetone emissions correlated similarly with bothalgorithms; thus, such correlations do not allow us tomake a strongrecommendation regarding which algorithm better representsacetone emissions to the atmosphere for all species studied.
3.3. Isoprenoid emission: monoterpenes
Orange had the highest levels of monoterpene emissions(BEF ¼ 2500 ng(C) g(DW)�1 h�1, Table 1, Fig. 6). Clementinemandarin had twice the rate of photosynthesis of navel orange,but lower emission of BVOC. Lemon and mandarins emitted a low,if not negligible, amount of total monoterpenes (22, 26, and63 ng(C) g(DW)�1 h�1 for lemon, ‘Clementine’ mandarin, and‘W. Murcott’ mandarin, respectively) (Table 1). For mandarins, the
Table 2R-square (R2) coefficients of the linear correlation betweenmeasured andmodeled fluxes omodeled fluxes, while the right member shows correlation with fluxes according to thmodeled and measured values. n.s. ¼ non significant values (p > 0.05).
Species ‘Meyer’ lemon ‘Clementine’ mandarin ‘W
Methanol 0.11 (1.41)en.s. 0.50 (0.59)e0.53 (0.51) 0.Acetaldehyde 0.24 (0.86)e0.18 (0.65) n.s.e0.11 (0.17) 0.Acetone 0.87 (0.99)e0.90 (1.03) 0.63 (0.66)e0.60 (0.60) 0.Isoprene 0.35 (0.53)e0.34 (0.45) 0.44 (0.98)e0.45 (0.73) 0.S Monoterpenes n.s.en.s. n.s.en.s.S Oxy. Monot. n.s.en.s. n.s.en.s.S Sesquiterpenes n.s.en.s. n.s.en.s.
most abundant monoterpene species were b-cis and b-transisomers of ocimene with minor amounts of limonene, sabinene,and pinene. For all species, the diurnal pattern of monoterpeneemission (Figs. 1e4) was similar to that found by Ciccioli et al.(1999) for Citrus species, with peaks during the central hours ofthe day under the highest levels of light and temperature,and photosynthetic values for mid-day peaks between 4 and7 mmol m�2 s�1.
BEF values reported in this study are mostly within the sameorder of magnitude as those found in previous research. In a studyperformed with GC/MS, Winer et al. (1992) reported a leaf emissionrate for navel orange of 900 ng(C) g(DW)�1 h�1 at 21 �C, similar towhat we observed in our study if we normalize this value for basalconditions. Winer et al. also reported emissions for lemon var. ‘Lis-bon’ at 31 �C of 3600 ng g(DW)�1 h�1, which ismuch higher than ourobservations, but the difference may be attributed to genotypic andphenotypic dissimilarities. Ciccioli et al. (1999) performed fieldmeasurements using a branch enclosure and GC/MS measurementtechniques; they recorded emission rates from a Valencia orange onthe same order of magnitude as values presented in this study.
The correlations between measured and modeled BVOC emis-sions were highly significant for ‘Parent Navel’ orange (p < 0.001),both when emissions were modeled using the L þ T algorithm(R2¼ 0.57) and the Talgorithm (R2¼ 0.63, Table 2); correlation slopeswere also similar (0.64 vs 0.61). The possibility that some of the BVOCcompounds (e.g. those stored in secretory structures) are moretemperature-dependent, and other are more light dependent(e.g. those originated from de novo synthesis) seems the most likelyexplanation, as previously reported in Simon et al. (2005). Thisdifferent sensitivity to light and temperature can be explained by
f Citrus species cultivated in California. The left member shows correlationwith LþTe T algorithm. In parenthesis is the slope of each of the linear correlation between
. Murcott’ mandarin ‘Parent Navel’ orange(no flowers)
‘Parent Navel’ orange(with flowers)
31 (0.33)e0.32 (0.30) 0.19 (0.50)e0.40 (0.51) 0.19 (1.21)e0.16 (0.60)42 (0.65)e0.54 (0.65) 0.50 (0.79)e0.53 (0.61) 0.54 (0.81)e0.53 (0.58)59 (0.61)e0.67 (0.63) 0.62 (0.97)e0.73 (0.81) 0.74 (1.04)e0.74 (0.77)53 (0.85)e0.61 (0.80) n.s.en.s. 0.58 (1.28)e0.62 (0.91)
n.s.en.s. 0.57 (0.64)e0.63 (0.61) 0.60 (0.78)e0.61 (0.58)n.s.en.s. 0.44 (0.84)e0.68 (0.87) 0.43 (1.37)e0.37 (0.74)n.s.en.s. 0.88 (2.14)e0.80 (1.17) 0.92 (2.13)e0.89 (1.11)
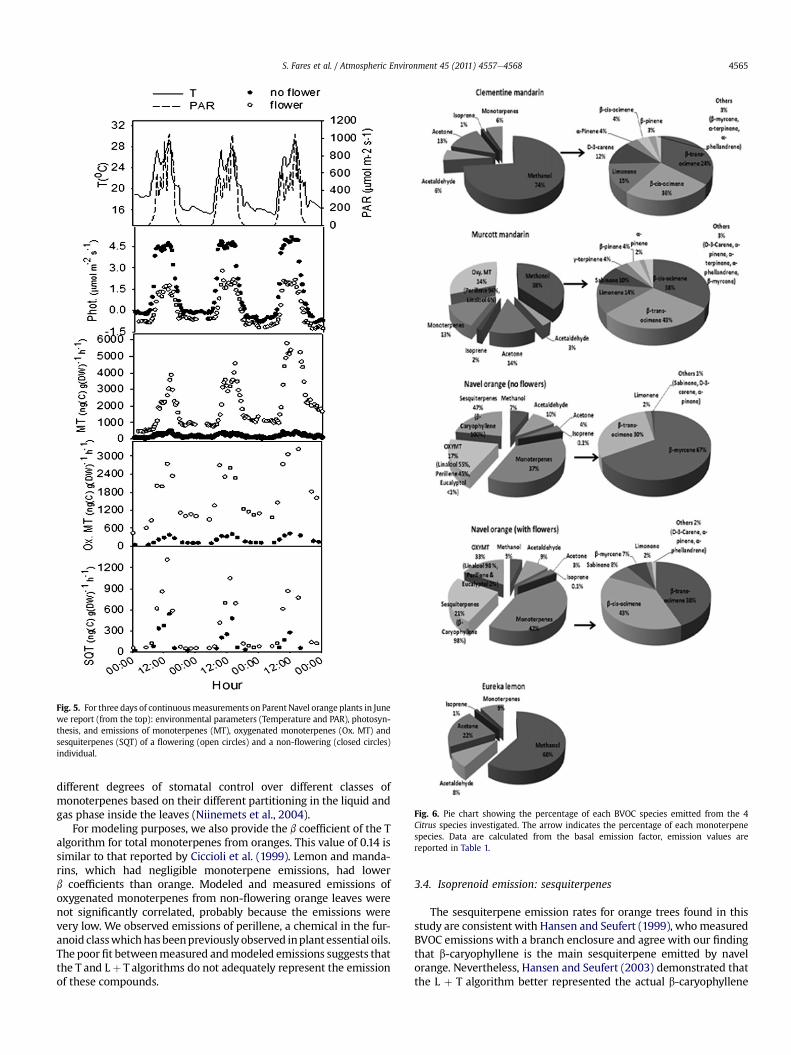
Fig. 5. For three days of continuousmeasurements on Parent Navel orange plants in Junewe report (from the top): environmental parameters (Temperature and PAR), photosyn-thesis, and emissions of monoterpenes (MT), oxygenated monoterpenes (Ox. MT) andsesquiterpenes (SQT) of a flowering (open circles) and a non-flowering (closed circles)individual.
Fig. 6. Pie chart showing the percentage of each BVOC species emitted from the 4Citrus species investigated. The arrow indicates the percentage of each monoterpenespecies. Data are calculated from the basal emission factor, emission values arereported in Table 1.
S. Fares et al. / Atmospheric Environment 45 (2011) 4557e4568 4565
different degrees of stomatal control over different classes ofmonoterpenes based on their different partitioning in the liquid andgas phase inside the leaves (Niinemets et al., 2004).
For modeling purposes, we also provide the b coefficient of the Talgorithm for total monoterpenes from oranges. This value of 0.14 issimilar to that reported by Ciccioli et al. (1999). Lemon and manda-rins, which had negligible monoterpene emissions, had lowerb coefficients than orange. Modeled and measured emissions ofoxygenated monoterpenes from non-flowering orange leaves werenot significantly correlated, probably because the emissions werevery low. We observed emissions of perillene, a chemical in the fur-anoid classwhichhasbeenpreviously observed inplant essential oils.The poorfit betweenmeasured andmodeled emissions suggests thatthe T and L þ T algorithms do not adequately represent the emissionof these compounds.
3.4. Isoprenoid emission: sesquiterpenes
The sesquiterpene emission rates for orange trees found in thisstudy are consistent with Hansen and Seufert (1999), whomeasuredBVOC emissions with a branch enclosure and agree with our findingthat b-caryophyllene is the main sesquiterpene emitted by navelorange. Nevertheless, Hansen and Seufert (2003) demonstrated thatthe L þ T algorithm better represented the actual b-caryophyllene

S. Fares et al. / Atmospheric Environment 45 (2011) 4557e45684566
emissions than the T algorithm, and suggested that light enhancesvolatilization of b-caryophyllene from storage pools by triggeringoxidative process which lead to membrane degradation. Our resultsinstead reveal that slopes are closer to 1 with the T algorithm thanwith L þ T algorithm. This suggests that temperature is a moreimportant environmental parameter controlling the emission ofsesquiterpenes in orange plants as traditionally stated for an iso-prenoid- storing species (Tingey et al., 1991).
The b coefficient for sesquiterpenes in oranges was 0.34 onaverage, twice the value adopted in recent literature calculated bycombining all the recent information on existing plant functionaltypes in which a temperature dependency has been described(Sakulyanontvittaya et al., 2008). Our value is however in agreementwith previous estimates (Ciccioli et al., 1999) and justified by thehigher vaporization energy required to transfer sesquiterpenes fromthe liquid to the gas phase, owing to their lower vapor pressure incomparison with monoterpenes.
3.5. Isoprenoid emission: isoprene
Isoprene is the most abundant non-oxygenated BVOC emitted ona global scale (Guenther et al., 2006). Its production and emissiondepend directly on photosynthetic metabolism since specific leafreservoirs (as opposed to temporary pools in the intercellular-spaces) are never filled up with this compound. In our study,isoprene emissions were negligible in comparison with mono-terpenes (Table 1), suggesting that Citrus species are not significantisoprene emitters and that the methyl-erythritol-phosphatebiosynthetic pathway in the leaves (Hampel et al., 2005) producesmainly monoterpenes rather than isoprene in Citrus sp., especially innavel orange. Isoprene emissions correlated better with the L þ Talgorithm as would be expected based on its known production andemission mechanisms (Table 2, Fig. 4).
3.6. Emissions during flowering events
Flowering is an important phenomenon that occurs once peryear in most of the Citrus plantations in California’s Central Valley,with the largest production of flowers occurring during a 2-weekevent between late March and April. In Fig. 5 we show photosyn-thesis and emission dynamics over 3 days for 2 orange treesmeasured at the same time, one flowering and onewithout flowers.During flowering, net photosynthesis rates decreased more than50%, Based on the analysis of gas exchange at night, we observedhigher mitochondrial respiration activity in the flowering plantsaveraging 0.93 � 0.04 mmol m�2 s�1 vs 0.3 � 0.05 mmol m�2 s�1 innon-flowering plants, demonstrating that during the floweringprocesses Citrus spp. decreases its net carbon uptake. Flowers mayrepresent a respiratory surface not included in the total leaf area,but the contribution of flowers to the total area wasw5%, thereforewe considered the flower area negligible. Our results are consistentwith a previous study in grapefruit which showed that net carbonuptake was decreased because flowering respirationwas enhancedrather than photosynthesis being decreased (Bustan andGoldschmidt, 1998).
A decoupling between photosynthesis and BVOC emissions inflowering orangeswas observed, mainly due to the role of flowers asstrong BVOC emitters to the atmosphere. Emissions from plantspecies that have the ability to store BVOC, such as Citrus, mainlyoriginate from the volatilization of BVOC accumulated withinspecific leaf reservoirs. Thus emissions should depend more ontemperature than on plant physiology, but OVOC emission fromflowering oranges was better predicted by the L þ T algorithm, thussuggesting that light stimulates OVOC emissions by promotinga biosynthetic pathway unrelated to photosynthesis. We found that
flowering dramatically increased emissions of monoterpenes fromnavel orange to 7800 ng(C) g(DW)�1 h�1, in agreement withprevious studies (Ciccioli et al.,1999; Hansen and Seufert,1999; Areyet al., 1991). Monoterpene species emitted from flowering and non-flowering branches were substantially different. For non-floweringplants, b-myrcene was the main monoterpene emitted (67%), fol-lowed by b-E-ocimene (Fig. 6). For flowering plants, 81% of the totalmonoterpene emissions were b-Z- and b-E-ocimene, a compoundpreviously reported in emissions from flowering Citrus trees andknown to attract pollinators (Dudareva and Pichersky, 2000).Linalool was the dominant oxygenatedmonoterpene observed fromflowering plants (98%), in agreementwithfindings fromCiccioli et al.(1999) and Arey et al. (1991), and also consistent with the reportedpresence of linalool synthase in flowers (Pichersky et al., 1994).Interestingly, we identified perillene, representing 45% of theoxygenatedmonoterpene emissions fromnon-flowering plants. Thisis the first time this furanoid has been identified as an emission fromCitrus. Volatile furanoids are very rarely found in plants. To ourknowledge, Z- and E-linalool oxide and now perillene are the onlyfuranoids found in plant BVOC emissions (Noe et al., 2006).
For flowering oranges, it is unclear whether the T or L þ Talgorithm best describes the emission of monoterpenes, a similarsituation to that for non-flowering oranges. With regard to sesqui-terpenes, b-caryophyllene was the main sesquiterpene emitted fromflowering oranges and the T algorithm better predicted emissions ofthis compound rather than the Lþ T algorithm (slope of 1.11 vs 2.13).The T algorithm was also preferred for non-flowering oranges. Thisresult is in agreement with current opinion that sesquiterpeneemissions respond primarily to temperature rather than to light(Sakulyanontvittaya et al., 2008).
4. Conclusions
The aim of this study was to provide new data on the basalemission factors and the daily emission dynamic of dominant Citrusspecies cultivated in Californiawhichmay also be applicable to citrusin other regions, especially those with Mediterranean climate.
We found that oxygenated VOC (methanol, acetaldehyde, andacetone) represented the dominant fraction of the total BVOC emis-sion for mandarin and lemon. For orange, monoterpenes were themajor BVOC emitted. Emissions of all compounds including OVOC,monoterpenes, sesquiterpenes and oxygenated monoterpenes wereup to one order of magnitude higher during flowering.
It is important to include crop emissions in models of BVOCemissions at regional and global scales, and the predictive capabil-ities of the model depend on the correct parameterization of thespecies-specific emission potential. In this study, we provide BEFsfor principal Citrus species and varieties, and report the observedtemperature and light dependencies of emissions for each BVOC.Light and temperature-dependent algorithms were better predic-tors ofmethanol, acetaldehyde, acetone, isoprene andmonoterpeneemissions for all the Citrus species, while only temperature-dependent algorithms were better predictors for oxygenatedmonoterpene and sesquiterpene emissions. Our results will beuseful in atmospheric chemistry models to estimate whether BVOCemitted from these crop species play a significant role in regional airquality, especially when Citrus plantations are close to urban andpolluted areas as found in the Central Valley of California, whereBVOC can combine with anthropogenic emissions to contribute toozone and secondary aerosol production.
Acknowledgments
This project was supported by the Citrus Research Board, theCalifornia Air Resources Board, and the EU program IOF-PEOPLE

S. Fares et al. / Atmospheric Environment 45 (2011) 4557e4568 4567
2008. Megan McKay and the staff of the Oxford greenhouse facilityare acknowledged for their help during data collection. Dr. FrancescoLoreto is acknowledged for helpful advice on the manuscriptpreparation.
References
Arey, J., Corchnoy, S.B., Atkinson, R., 1991. Emission of linalool from Valencia orangeblossoms and its observation in ambient air. Atmos. Environ. 25, 1377e1381.
Benjamin, M.T., Sudol, M., Vorsatz, D., Winer, A.M., 1997. A spatially and temporallyresolved biogenic hydrocarbon emissions inventory for the California SouthCoast Air Basin. Atmos. Environ. 31, 3087e3100.
Brilli, F., Barta, C., Fortunati, A., Lerdau, M., Loreto, F., Centritto, M., 2007. Response ofisoprene emission and carbon metabolism to drought in white poplar saplings.New. Phytol. 175, 244e254.
Bustan, A., Goldschmidt, E.E., 1998. Estimating the cost of flowering in a grapefruittree. Plant Cell Environ. 21, 217e224.
Chameides, W.L., Lindsay, R.W., Richardson, J., Kiang, C.S., 1988. The role of biogenichydrocarbons in urban photochemical smog: Atlanta as a case study. Science241, 1473e1475.
Ciccioli, P., Brancaleoni, E., Frattoni, M., Di Palo, V., Valentini, R., Tirone, G., Seufert, G.,Bertin, N., Hansen, U., Csik, O., Lenz, R., Sharma, M., 1999. Emission of reactiveterpene compounds from orange orchards and their removal by within-canopyprocesses. J. Geophys. Res. 104, 8077e8094.
Cojocariu, C., Esher, P., Heinz-Haberle, K., Matyssek, R., Rennemberg, H.,Kreuzwieser, J., 2005. The effect of ozone on the emission of carbonyls fromleaves of adult Fagus sylvatica. Plant Cell Environ. 28, 603e611.
Crutzen, P.J., Fall, R., Galbally, I., Lindinger, W., 1999. Parameters for global ecosys-tems model. Nature 399, 535.
Davison, B., Taipale, R., Langford, B., Misztal, P., Fares, S., Matteucci, G., Loreto, F.,Cape, J.N., Rinne, J., Hewitt, C.N., 2009. Concentrations and fluxes of volatileorganic compounds above a Mediterranean macchia ecosystem inwestern Italy.Biogeosciences 6, 1655e1670.
De Gouw, J.A., Howard, C.J., Custer, T.J., Fall, R., 1999. Emissions of volatile organiccompounds from cut grass and clover are enhanced during the drying process.Geophy. Res. Lett. 26 (7), 811e814.
de Gouw, J., Warneke, C., 2007. Measurements of volatile organic compounds in theearth’s atmosphere using proton-transfer reaction mass spectrometry. MassSpectrom. Rev. 26, 223e257.
Dudareva, N., Pichersky, E., 2000. Biochemical and molecular aspects of floralscents. Plant Physiol. 122, 627e634.
Duhl, T.R., Helmig, D., Guenther, A., 2008. Sesquiterpene emissions from vegetation:a review. Biogeosciences 5, 761e777.
EPA, 2009. Reference List of Deleterious Effect of Ozone on Human Health. http://www.epa.gov/o3healthtraining/refsfigs.html#refs Last access on November10, 2010.
Fall, R., Benson, A.A., 1996. Leaf methanol e the simplest natural product fromplants. Trends Plant Sci. 1, 296e301.
Fall, R., Karl, T., Hansel, A., Jordan, A., Lindinger, W., 1999. Volatile organiccompounds emitted after leaf wounding: on-line analysis by proton-transfer-reaction mass spectrometry. J. Geophys. Res. e Atmos. 104, 15963e15974.
Fall, R., 2003. Abundant oxygenates in the atmosphere: a biochemical perspective.Chem. Rev. 103, 4941e4951.
Fares, S., Loreto, F., Kleist, E., Wildt, J., 2008. Stomatal uptake and stomatal depo-sition of ozone in isoprene and monoterpene emitting plants. Plant Biol. 10,44e54.
Fares, S., Park, J.H., Ormeno, E., Gentner, D.R., McKay, M., Loreto, F., Karlik, J.,Goldstein, A.H., 2010. Ozone uptake by citrus trees exposed to a range of ozoneconcentrations. Atmos. Environ. 44, 3404e3412.
Folkers, A., Huve, K., Ammann, C., Dindorf, T., Kesselmeier, J., Kleist, E., Kuhn, U.,Uerlings, R., Wildt, J., 2008. Methanol emissions from deciduous tree species:dependence on temperature and light intensity. Plant Biol. 10, 65e75.
Galbally, I.E., Kirstine, W., 2002. The production of methanol by flowering plantsand the global cycle of methanol. J. Atmos. Chem. 43, 195e229.
Goldan, P.D., Kuster, W.C., Fehsenfeld, F.C., Montzka, S.A., 1995. Hydrocarbonmeasurements in the southeastern United States e the rural oxidants in thesouthern environment (ROSE) program 1990. J. Geophys. Res. 100, 25945e25963.
Goldstein, A.H., Schade, G.W., 2000. Quantifying biogenic and anthropogeniccontributions to acetone mixing ratios in a rural environment. Atmos. Environ.34, 4997e5006.
Goldstein, A.H., Galbally, I.E., 2007. Known and unexplored organic constituents inthe earth’s atmosphere. Environ. Sci. Technol. 41 (5), 1514e1521.
Graus, M., Schnitzler, J.P., Hansel, A., Cojocariu, C., Rennenberg, H., Wisthaler, A.,Kreuzwieser, J., 2004. Transient release of oxygenated volatile organiccompounds during light-dark transitions in Grey poplar leaves. Plant Physiol. 135(4), 1967e1975.
Guenther, A., Zimmerman, P.R., Harley, P.C., Monson, R.K., Fall, R., 1993. Isoprene andmonoterpene emission rate variability e model evaluations and sensitivityanalyses. J. Geophys. Res. e Atmos. 98 (D7), 12609e12617.
Guenther, A., Hewitt, C.N., Erickson, D., Fall, R., Geron, C., Graedel, T., Harley, P.,Klinger, L., Lerdau, M., McKay, W.A., Pierce, T., Scholes, B., Steinbrecher, R.,Tallamraju, R., Taylor, J., Zimmerman, P., 1995. A global model of natural volatileorganic compounds emissions. J. Geophys. Res. 100, 8873e8892.
Guenther, A., 1997. Seasonal and spatial variations in natural volatile organiccompound emissions. Ecol. Appl. 7, 34e45.
Guenther, A., Karl, T., Harley, P., Wiedinmyer, C., Palmer, P.I., Geron, C., 2006. Estimatesof global terrestrial isoprene emissions using MEGAN (Model of Emissions ofGases and Aerosols from Nature). Atmos. Chem. Phys. 6, 3181e3210.
Guderian, R., Tingey, D.T., Rabe, R., 1985. Effects of photochemical oxidants onplants. In: Guderian, R. (Ed.), Air Pollution by Photochemical Oxidants.Ecological Studies, vol. 52. Springer, Berlin-Heidelberg-New York, pp. 129e333.
Hansen, U., Seufert, G., 2003. Temperature and light dependence of b-caryophylleneemission rates. J. Geophys. Res. 108. doi:10.1029/2003JD003853 Art. No. 4801.
Hansen, U., Seufert, G., 1999. Terpenoid emission from Citrus sinensis (L.) OSBECKunder drought stress. Phys. Chem. Earth B e Hydrol. Oceans Atmos. 24 (6),681e687.
Hampel, D., Mosandl, A., Wust, M., 2005. Biosynthesis of mono- and sesquiterpenesin carrot roots and leaves (Daucus carota L.): metabolic cross talk of cytosolicmevalonate and plastidial methylerythritol phosphate pathways. Phytochem-istry 66, 305e311.
Harley, P., Guenther, A., Zimmerman, P., 1996. Effects of light, temperature andcanopy position on net photosynthesis and isoprene emission from sweetgum(Liquidambar styraciflua) leaves. Tree Physiol. 16 (1e2), 25e32.
Henze, D.K., Seinfeld, J.H., 2006. Global secondary organic aerosol from isopreneoxidation. Geophys. Res. Lett. 33, L09812. doi:10.1029/2006GL025976.
Huve, K., Christ, M., Kleist, E., Niinemets, U., Uerlings, R., Walter, A., Wildt, J., 2007.Simultaneous growth and emission measurements demonstrate an interactivecontrol of methanol release by leaf expansion and stomata. J. Exp. Bot. 58 (7),1783e1793.
Jacob, D.J., Field, B.D., Jin, E.M., Bey, I., Li, Q., Logan, J.A., Yantosca, R.M., Singh, H.B.,2002. Atmospheric budget of acetone. J. Geophys. Res. 107 (D10), 4100.
Jacob, D.J., Field, B.D., Li, Q., Blake, D.R., de Gouw, J., Warneke, C., Hansel, A.,Wisthaler, A., Singh, H.B., Guenther, A., 2005. Global budget of methanol:constraints from atmospheric observations. J. Geophys. Res. 110 (D8),D08303.
Kanakidou, M., Seinfeld, J.H., Pandis, S.N., Barnes, I., Dentener, F.J., Facchini, M.C.,Van Dingenen, R., Ervens, B., Nenes, A., Nielsen, C.J., Swietlicki, E., Putaud, J.P.,Balkanski, Y., Fuzzi, S., Horth, J., Moortgat, G.K., Winterhalter, R.,Myhre, C.E.L., Tsigaridis, K., Vignati, E., Stephanou, E.G., Wilson, J., 2005.Organic aerosol and global climate modelling: a review. Atmos. Chem. Phys.5, 1053e1123.
Karl, T., Guenther, A., Lindinger, C., Jordan, A., Fall, R., Lindinger, W., 2001. Eddycovariance measurements of oxygenated volatile organic compound fluxesfrom crop harvesting using a redesigned proton-transfer-reaction mass spec-trometer. J. Geophys. Res. e Atmos. 106 (D20), 24157e24167.
Karl, T., Curtis, A.J., Rosenstiel, T.N., Monson, R.K., Fall, R., 2002. Transient releases ofacetaldehyde from tree leaves-products of a pyruvate overflow mechanism?Plant Cell Environ 25, 1121e1131.
Kesselmeier, J., Staudt, M., 1999. Biogenic volatile organic compounds (VOC): anoverview on emission, physiology and ecology. J. Atmos. Chem. 33, 23e88.
Koppmann, R., Wildt, J., 2007. Oxygenated volatile organic compounds. Chapter 4.In: Koppmann, R. (Ed.), Volatile Organic Compounds in the Atmosphere.Blackwell Publishing Ltd, pp. 129e172.
Kreuzwieser, J., Scheerer, U., Rennenberg, H., 1999. Metabolic origin of acetaldehydeemitted by poplar (Populus tremula � P. alba) trees. J. Exp. Bot. 50, 757e765.
Lamb, B., Gay, D., Westberg, H., 1993. A biogenic hydrocarbon emission inventory forthe USA using a simple forest canopy model. Atmos. Environ. 27 (11), 1673e1690.
Lee, A., Goldstein, A.H., Keywood, M.D., Gao, S., Varutbangkul, V., Bahreini, R.,Ng, N.L., Flagan, R.C., Seinfeld, J.H., 2006a. Gas-phase products and secondaryaerosol yields from the ozonolysis of ten different terpenes. J. Geophys. Res. 111,D07302. doi:10.1029/2005JD006437.
Lee, A., Goldstein, A.H., Kroll, J.H., Ng, N.L., Varutbangkul, V., Flagan, R., Seinfeld, J.H.,2006b. Gas-phase products and secondary aerosol yields from the photooxi-dation of 16 different terpenes. J. Geophys. Res. 111, D17305. doi:10.1029/2006JD007050.
Lichtenthaler, H.K., Schwendler, J., Disch, A., Rohmer, M., 1997. Biosynthesis of iso-prenoids in higher plant chloroplasts proceeds via a mevalonate-independentpathway. FEBS Lett. 400, 271e274.
Lindinger, W., Hansel, A., Jordan, A., 1998. On-line monitoring of volatile organiccompounds at pptv levels by means of proton-transfer-reaction mass spec-trometry (PTR-MS). Medical applications, food control and environmentalresearch. Int. J. Mass. Spectrom. Ion. Process. 173, 191e241.
Loreto, F., Barta, C., Brilli, F., Nogues, I., 2006. On the induction of volatile organiccompound emissions by plants as consequence of wounding or fluctuations oflight and temperature. Plant Cell Environ. 29, 1820e1828.
Millet, D.B., Donahue, N.M., Pandis, S.N., Polidori, A., Stanier, C.O., Turpin, B.J.,Goldstein, A.H., 2005. Atmospheric volatile organic compound measurementsduring the Pittsburgh Air Quality Study: results, interpretation, and quantifi-cation of primary and secondary contributions. J. Geophys. Res. 110 (D7),D07S07.
Millet, D.B., Jacob, D.J., Custer, T.G., de Gouw, J.A., Goldstein, A.H., Karl, T., Singh, H.B.,Sive, B.C., Talbott, R.W., Warneke, C., Williams, J., 2008. New constraints onterrestrial and oceanic sources of atmospheric methanol. Atmos. Chem. Phys. 8,6887e6905.
Millet, D.B., Atlas, E.L., Blake, D.R., Blake, N.J., Diskin, G.S., Holloway, J.S., Hudman, R.C.,Meinardi, S., Ryerson, T.B., Sachse, G.W., 2009. Halocarbon emissions from theUnited States and Mexico and their global warming potential. Environ. Sci.Technol. 43 (4), 1055e1060.

S. Fares et al. / Atmospheric Environment 45 (2011) 4557e45684568
Monson, R.K., Jaeger, C., Adams, W., Driggers, E., Silver, G., Fall, R., 1992. Relationshipamong isoprene emission rate, photosynthesis and isoprene synthase activityas influenced by temperature. Plant Physiol. 92, 1175e1180.
Ng, N.L., Kroll, J.H., Keywood, M.D., Bahreini, R., Varutbangkul, V., Flagan, R.C.,Seinfeld, J.H., Lee, A., Goldstein, A.H., 2006. Contribution of first- versus second-generation products to secondary organic aerosols formed in the oxidation ofbiogenic hydrocarbons. Environ. Sci. Technol. 40 (7), 2283e2297.
Niinemets, U., Loreto, F., Reichstein, M., 2004. Physiological and physico-chemicalcontrols on foliar volatile organic compound emissions. Trends Plant Sci. 9,180e186.
Noe, S.M., Ciccioli, P., Brancaleoni, E., Loreto, F., Niinemets, U., 2006. Emissions ofmonoterpenes linalool and ocimene respond differently to environmentalchanges due to differences in physico-chemical characteristics. Atmos. Environ.40, 4649e4662.
Obendorf, R.L., 1990. Methanol accumulation in maturing seeds. J. Exp. Bot. 41,489e495.
Ormeño, E., Gentner, D.R., Fares, S., Karlik, J., Park, J.H., Goldstein, A.H., 2010. Ses-quiterpenoid emissions from agricultural crops: correlations to monoterpenoidemissions and leaf terpene content. Environ. Sci. Technol. 44, 3758e3764.
Ortega, J., Helmig, D., 2008. Approaches for quantifying reactive and low-volatility biogenic organic compound emissions by vegetation enclosuretechniques e part A. Chemosphere 72, 343e364.
Papiez, M.R., Potosnak, M.J., Guenther, A.B., Matsunaga, S.N., Stockwell, W.R., 2009.The impacts of reactive terpene emissions from plants on air quality in LasVegas, Nevada. Atmos. Environ. 43 (27), 4109e4123.
Pichersky, E., Raguso, R.A., Lewinsohn, E., Croteau, R., 1994. Floral scent productionin Clarkia (Onagraceae), localization and developmental modulation of mono-terpene emission and linalool synthase activity. Plant Physiol. 106, 1533e1540.
Riemer, D., Pos, W., Milne, P., Farmer, C., Zika, R., Apel, E., Olszyna, K., Kliendienst, T.,Lonneman, W., Bertman, S., Shepson, P., Starn, T., 1998. Observations of non-methane hydrocarbons and oxygenated volatile organic compounds at a ruralsite in the southeastern United States. J. Geophys. Res. 103 (D12), 28111e28128.
Sakulyanontvittaya, T., Duhl, T., Wiedinmyer, C., Helmig, D., Matsunaga, S.,Potosnak, M., Milford, J., Guenther, A., 2008. Monoterpene and sesquiterpeneemission estimates for the United States. Environ. Sci. Technol. 42 (5),1623e1629.
Schade, G.W., Goldstein, A.H., 2002. Plant physiological influences on the fluxes ofoxygenated volatile organic compounds from ponderosa pine trees. J. Geophys.Res. 107 (D10), 4082.
Simon, V., Dumergues, L., Solignac, G., Torres, L., 2005. Biogenic emissions fromPinus halepensis: a typical species of the Mediterranean area. Atmos. Environ.74, 37e48.
Singh, H., Chen, Y., Staudt, A., Jacob, D., Blake, D., Heikes, B., Snow, J., 2001. Evidencefrom the Pacific troposphere for large global sources of oxygenated organiccompounds. Nature 410 (6832), 1078e1081.
Smith, A.M., Rigler, E., Kwok, E.S.C., Atkinson, R., 1996. Kinetics and products of thegas-phase reactions of 6-methyl-5-hepten-2-one and trans-cinnamaldehydewith OH and NO3 radicals and O3 at 296 � 2 K. Environ. Sci. Technol. 30,1781e1785.
Steiner, A., Goldstein, A.H., 2007. Biogenic volatile organic compounds. In:Koppmann, R. (Ed.), Volatile Organic Compounds in the Atmosphere. BlackwellPublishing Ltd.
Tingey, D., Manning, M., Grothaus, L., Burns, W., 1980. Influence of light andtemperature on monoterpene emission rates from slash pine. Plant Physiol. 65,797e801.
Tingey, D.T., Turner, D.P., Weber, L.C., 1991. Factors controlling the emission ofmonoterpenes and other volatile organic compounds. In: Sharkey, T.D.,Holland, E.A., Mooney, H.A. (Eds.), Trace Gas Emissions by Plants, vol. 65.Academic, San Diego, California, pp. 797e801.
Tholl, D., Boland, W., Hansel, A., Loreto, F., Rose, U.S.R., Schnitzler, J.P., 2006. Practicalapproaches to plant volatile analysis. Plant J. 45, 540e560.
Winer, A., Arey, J., Atkinsons, R., Aschmann, S.M., Lomg, W.D., Morrison, L.,Olszyk, D.M., 1992. Emission rates of organics from vegetation in California’sCentral Valley. Atmos. Environ. 26, 2647e2659.