The Biogen Idec Approach to Managing Corrective and Preventive ...

TITLE OF PRESENTATION BIOGEN IDEC Q1 2013 FINANCIAL RESULTS & BUSINESS UPDATE
APRIL 25, 2013

Forward-Looking Statements This presentation contains forward-looking statements, including statements about potential product launches, 2013 financial guidance, growth prospects, regulatory submissions and agency actions, the anticipated financial and operational impact of our acquisition of TYSABRI rights from Elan, and the development, commercialization and therapeutic impact of new and potential treatments. These forward-looking statements may be accompanied by such words as “anticipate,” “believe,” “could,” “estimate,” “expect,” “forecast,” “intend,” “may,” “plan,” “potential,” “project,” “target,” “will” and other words and terms of similar meaning. You should not place undue reliance on these statements. These statements involve risks and uncertainties that could cause actual results to differ materially from those reflected in such statements, including our dependence on our three principal products, AVONEX, TYSABRI and RITUXAN, the importance of TYSABRI’s sales growth, uncertainty of success in executing our commercial launch of TECFIDERA, uncertainty of success in commercializing and developing other products, product competition, the occurrence of adverse safety events with our products, changes in the availability of reimbursement for our products, adverse market and economic conditions, our dependence on collaborations and other third parties over which we may not always have full control, problems with our manufacturing processes and our reliance on third parties, failure to comply with government regulation, our ability to protect our intellectual property rights and have sufficient rights to market our products together with the cost of doing so, the risks of doing business internationally, failure to manage our growth and execute our growth initiatives, charges and other costs relating to our properties, fluctuations in our effective tax rate, our ability to attract and retain qualified personnel, product liability claims, fluctuations in our operating results, the market, interest and credit risks associated with our portfolio of marketable securities, environmental risks, change of control provisions in our collaborations and the other risks and uncertainties that are described in the Risk Factors section of our most recent annual or quarterly report and in other reports we have filed with the SEC. These statements are based on our current beliefs and expectations and speak only as of the date of this press release. We do not undertake any obligation to publicly update any forward-looking statements. 2
2

BIIB Q1 2013 Earnings Call Agenda
INTRODUCTION CLAUDINE PROWSE, Ph.D., VP, Investor Relations
OVERVIEW GEORGE SCANGOS, Ph.D., Chief Executive Officer
COMMERCIAL UPDATE TONY KINGSLEY, EVP, Global Commercial Operations
R&D UPDATE DOUG WILLIAMS, Ph.D., EVP, Research & Development
FINANCIAL PERFORMANCE PAUL CLANCY, EVP, Chief Financial Officer
3

TITLE OF PRESENTATION GEORGE SCANGOS, Ph.D., CHIEF EXECUTIVE OFFICER
OVERVIEW

1.40
1.97
975
1,096
Q1 2013 Financial Performance
Non-GAAP Diluted EPS ($)* Total Revenues ($M) Product Revenues ($M)
Q1-12 Q1-13 Q1-12 Q1-13 Q1-12 Q1-13
+10% +41% +12%
1,292
1,415
*A RECONCILIATION OF OUR GAAP TO NON-GAAP RESULTS IS INCLUDED AT THE END OF THIS PRESENTATION 5
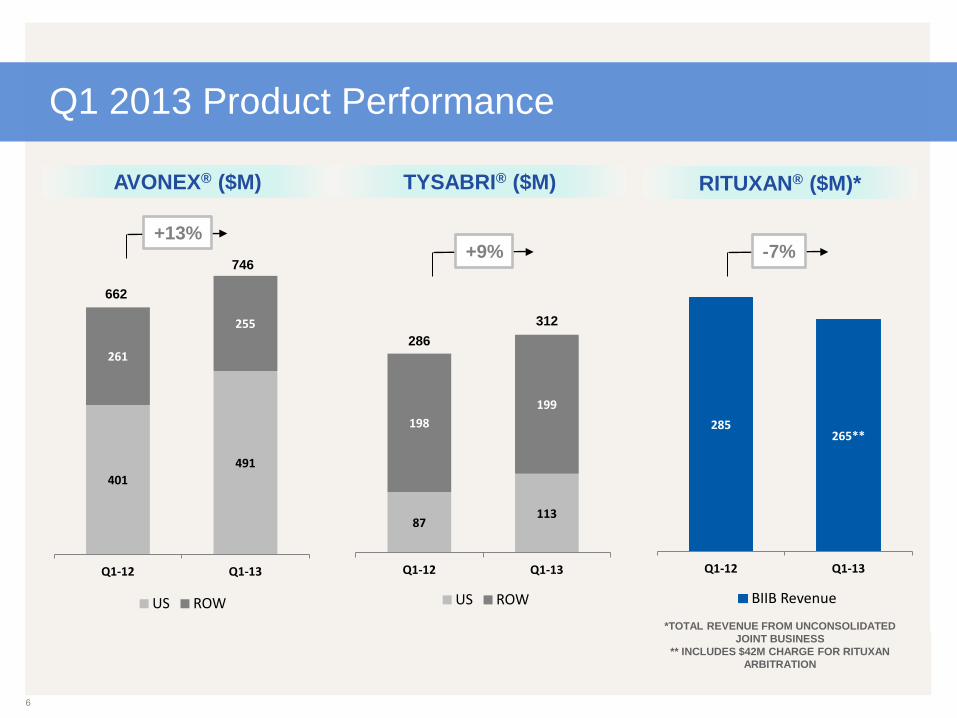
Q1 2013 Product Performance
AVONEX® ($M) TYSABRI® ($M) RITUXAN® ($M)*
401 491
261
255
Q1-12 Q1-13
US ROW
662
746
87 113
198 199
Q1-12 Q1-13
US ROW
285 265**
Q1-12 Q1-13
BIIB Revenue
286 312
*TOTAL REVENUE FROM UNCONSOLIDATED JOINT BUSINESS
** INCLUDES $42M CHARGE FOR RITUXAN ARBITRATION
+13% +9% -7%
6
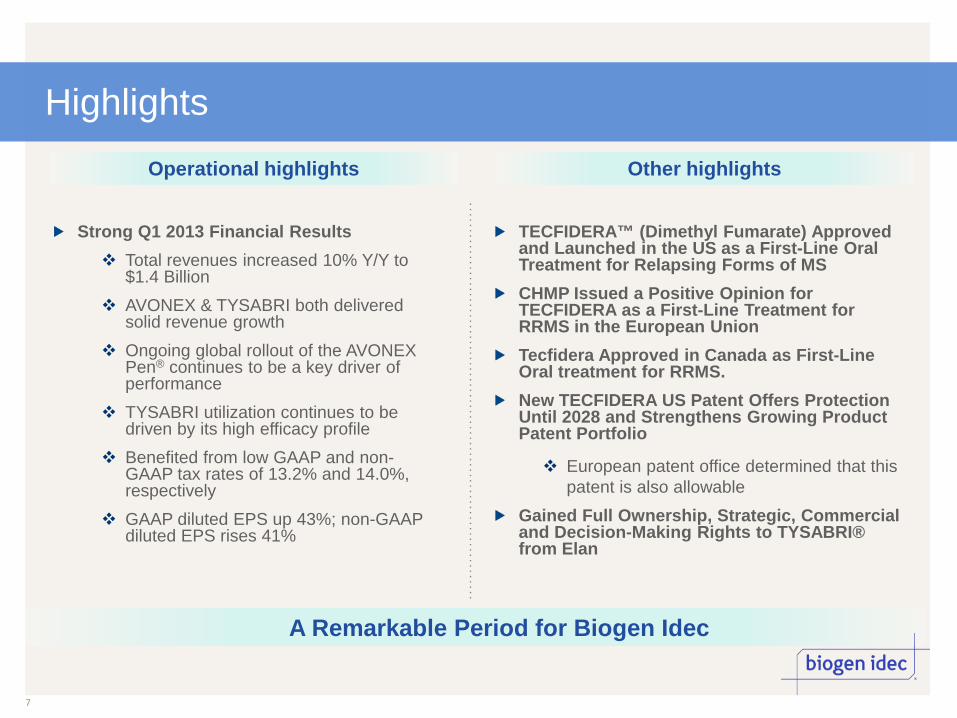
Highlights
Strong Q1 2013 Financial Results Total revenues increased 10% Y/Y to
$1.4 Billion AVONEX & TYSABRI both delivered
solid revenue growth Ongoing global rollout of the AVONEX
Pen® continues to be a key driver of performance
TYSABRI utilization continues to be driven by its high efficacy profile
Benefited from low GAAP and non-GAAP tax rates of 13.2% and 14.0%, respectively
GAAP diluted EPS up 43%; non-GAAP diluted EPS rises 41%
TECFIDERA™ (Dimethyl Fumarate) Approved and Launched in the US as a First-Line Oral Treatment for Relapsing Forms of MS CHMP Issued a Positive Opinion for TECFIDERA as a First-Line Treatment for RRMS in the European Union Tecfidera Approved in Canada as First-Line Oral treatment for RRMS. New TECFIDERA US Patent Offers Protection Until 2028 and Strengthens Growing Product Patent Portfolio
European patent office determined that this patent is also allowable
Gained Full Ownership, Strategic, Commercial and Decision-Making Rights to TYSABRI® from Elan
Operational highlights Other highlights
7
A Remarkable Period for Biogen Idec

TECFIDERATM (Dimethyl Fumarate): Providing a strong oral option for MS treatment
8 8
Strong efficacy Favorable safety profile Convenience of oral administration
High physician awareness
Anticipate broad appeal to a large segment of prescribing neurologists and MS patients
*Under Active Review with EMA
Improved IP offers protection until 2028

TYSABRI Asset Purchase
BIIB purchases full ownership of important therapy with positive share and revenue growth trajectory as well as expanding margins
Enables operational simplicity that will allow for more nimble and focused execution
Immediately and sustainably accretive to earnings
Offers fair valuation with significant potential operational and tax synergies
Eliminates change of control provision
Biogen Idec Purchased Full Rights and Control of TYSABRI from Elan for Upfront Cash and Contingent Payments
9

TITLE OF PRESENTATION TONY KINGSLEY, EXECUTIVE VICE PRESIDENT, GLOBAL COMMERCIAL OPERATIONS
COMMERCIAL UPDATE

Global AVONEX Performance
401464 462 467 491
261
298 274 286 255
662
762 736 753 746
Q1-12 Q2-12 Q3-12 Q4-12 Q1-13
US ROW
11
AVONEX Revenues ($M) Q1 2013 Highlights
Revenue vs. Q1 2012 and Q4 2012 WW* +13% and -1% US +23% and +5% ROW* -2% and -11%
Units vs. Q1 2012 and Q4 2012 WW +4% and -4% US +8% and +0% ROW +1% and -7%
AVONEX Pen is commercially available in 27 countries
Continued to gain market share during the first quarter in the ABCRE segment
11
Note: Numbers may not foot due to rounding
*Net of hedge
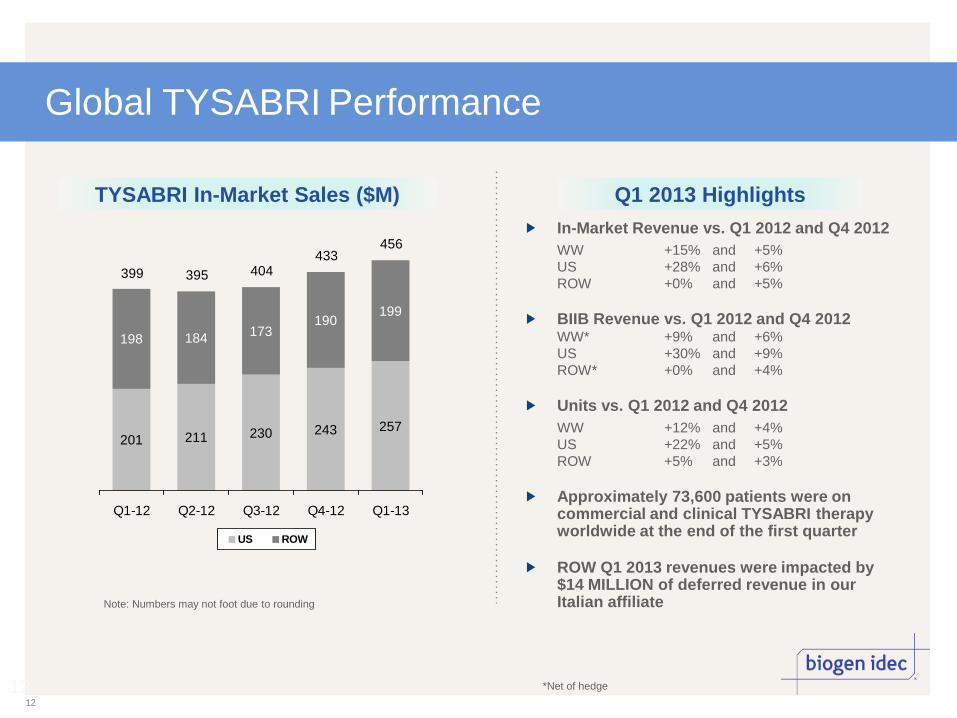
Global TYSABRI Performance
201 211 230 243 257
198 184 173190
199
399 395 404433
456
Q1-12 Q2-12 Q3-12 Q4-12 Q1-13
US ROW
12
TYSABRI In-Market Sales ($M) Q1 2013 Highlights In-Market Revenue vs. Q1 2012 and Q4 2012 WW +15% and +5% US +28% and +6% ROW +0% and +5%
BIIB Revenue vs. Q1 2012 and Q4 2012 WW* +9% and +6% US +30% and +9% ROW* +0% and +4%
Units vs. Q1 2012 and Q4 2012 WW +12% and +4% US +22% and +5% ROW +5% and +3%
Approximately 73,600 patients were on commercial and clinical TYSABRI therapy worldwide at the end of the first quarter
ROW Q1 2013 revenues were impacted by $14 MILLION of deferred revenue in our Italian affiliate
12
Note: Numbers may not foot due to rounding
*Net of hedge
13
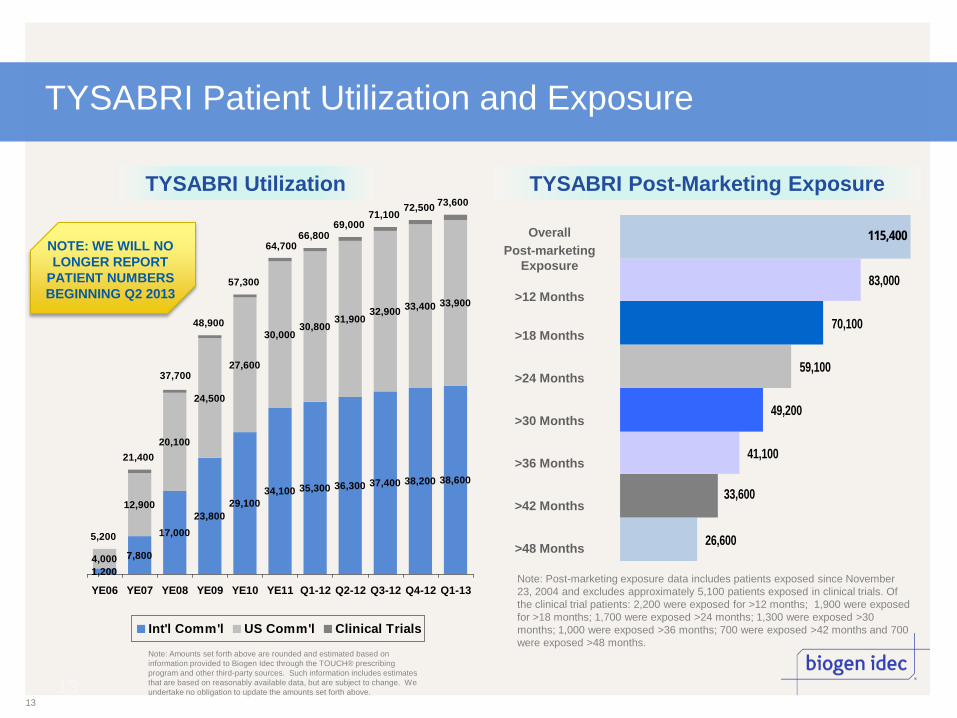
1,2007,800
17,00023,800
29,10034,100 35,300 36,300 37,400 38,200 38,600
4,000
12,900
20,100
24,500
27,600
30,00030,800
31,90032,900 33,400 33,900
5,200
21,400
48,900
69,00071,100
72,500 73,600
57,300
37,700
66,80064,700
YE06 YE07 YE08 YE09 YE10 YE11 Q1-12 Q2-12 Q3-12 Q4-12 Q1-13
Int'l Comm'l US Comm'l Clinical Trials
TYSABRI Patient Utilization and Exposure
26,600
33,600
41,100
49,200
59,100
70,100
83,000
TYSABRI Utilization TYSABRI Post-Marketing Exposure
Note: Post-marketing exposure data includes patients exposed since November 23, 2004 and excludes approximately 5,100 patients exposed in clinical trials. Of the clinical trial patients: 2,200 were exposed for >12 months; 1,900 were exposed for >18 months; 1,700 were exposed >24 months; 1,300 were exposed >30 months; 1,000 were exposed >36 months; 700 were exposed >42 months and 700 were exposed >48 months.
Note: Amounts set forth above are rounded and estimated based on information provided to Biogen Idec through the TOUCH® prescribing program and other third-party sources. Such information includes estimates that are based on reasonably available data, but are subject to change. We undertake no obligation to update the amounts set forth above.
Overall Post-marketing
Exposure
>12 Months
>18 Months
>24 Months
>30 Months
>36 Months
>42 Months
>48 Months
13
115,400 NOTE: WE WILL NO LONGER REPORT
PATIENT NUMBERS BEGINNING Q2 2013
14
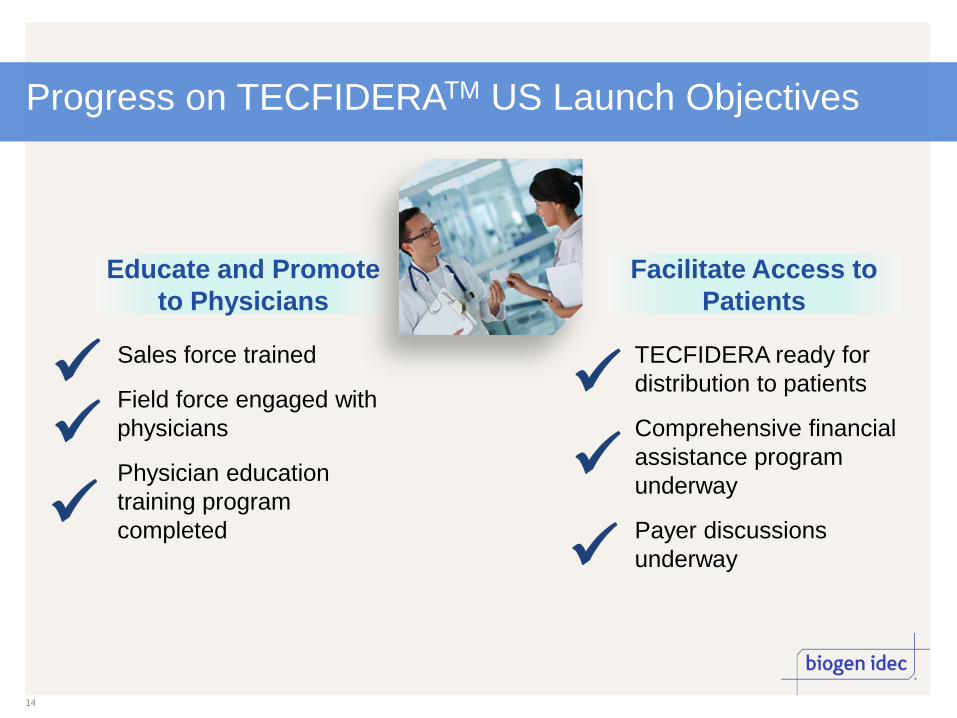
Progress on TECFIDERATM US Launch Objectives
Sales force trained
Field force engaged with physicians
Physician education training program completed
Educate and Promote to Physicians
TECFIDERA ready for distribution to patients
Comprehensive financial assistance program underway
Payer discussions underway
Facilitate Access to Patients

TITLE OF PRESENTATION R&D UPDATE DOUG WILLIAMS, Ph.D., EXECUTIVE VICE PRESIDENT, RESEARCH & DEVELOPMENT

Multiple Sclerosis (Ph. 1) Optic Neuritis (Ph. 2)
Lupus Nephritis
Idiopathic Pulmonary Fibrosis
General Lupus
Spinal Muscular Atrophy
Neuropathic Pain
Alzheimer's Disease
Pipeline
PHASE I PHASE II PHASE III FILED
16
Multiple Sclerosis
Daclizumab
Multiple Sclerosis TECFIDERA
Hemophilia A
rFIXFc rFVIIIFc
Hemophilia B
PLEGRIDY
Multiple Sclerosis
Chronic Lymphocytic Leukemia & Non-Hodgkin’s Lymphoma Obinutuzumab (GA101)
Secondary Progressive Multiple Sclerosis TYSABRI
Neublastin
Anti-TWEAK
Anti-LINGO
Anti-CD40 Ligand
STX-100
ISIS-SMNRx
BIIB037
*Under Active Review with EMA
FDA APPROVED*
FDA FILED
FDA FILED

Strong TECFIDERA US Label
17
Warnings and Monitoring Low treatment burden with limited monitoring
The most common adverse reactions seen in clinical studies were flushing and gastrointestinal events
A complete blood count is recommended to monitor Lymphopenia before starting treatment, annually, and as clinically indicated
No contraindications
Pregnancy Category C
Indication & Usage Label has broad patient appeal
First-line oral treatment for people with relapsing forms of multiple sclerosis
120 mg twice daily orally for the first 7 days, followed by 240 mg twice daily
Proven to reduce important measures of disease activity, including relapses and the progression of physical disability
2013: Significant Medical Meeting Presence
18
65th American Academy of Neurology Annual Meeting
More than 50 company-sponsored platform and poster presentations presented
Biogen Idec’s MS franchise strengthened with new data for novel treatment options
Data presented demonstrates Biogen Idec’s robust neurology research and development programs
Affirms the company’s decades-long leadership in multiple sclerosis
The 7th Annual Congress of the European Association for
Haemophilia and Allied Disorders Presented data from the Phase III trials of our rFVIIIFc and rFIXFc programs
The data from both studies indicate a potential transformation of the treatment of hemophilia A and B
Potential first long-lasting treatment for hemophilia A and B
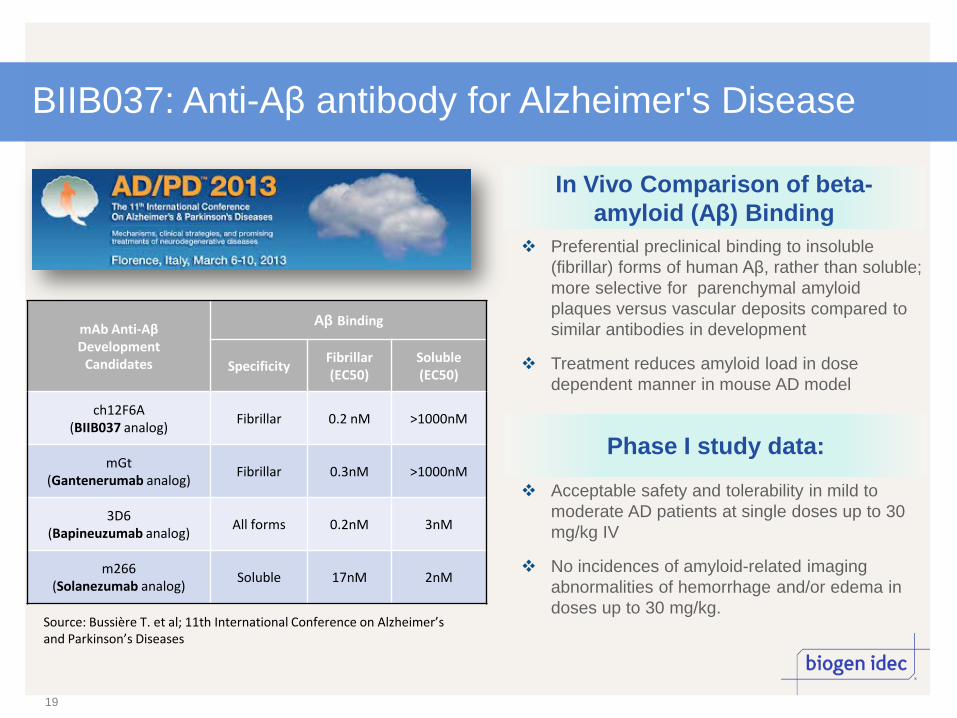
BIIB037: Anti-Aβ antibody for Alzheimer's Disease
19
In Vivo Comparison of beta-amyloid (Aβ) Binding
Preferential preclinical binding to insoluble (fibrillar) forms of human Aβ, rather than soluble; more selective for parenchymal amyloid plaques versus vascular deposits compared to similar antibodies in development
Treatment reduces amyloid load in dose dependent manner in mouse AD model
Acceptable safety and tolerability in mild to moderate AD patients at single doses up to 30 mg/kg IV
No incidences of amyloid-related imaging abnormalities of hemorrhage and/or edema in doses up to 30 mg/kg.
mAb Anti-Aβ Development
Candidates
Aβ Binding
Specificity Fibrillar (EC50)
Soluble (EC50)
ch12F6A (BIIB037 analog)
Fibrillar 0.2 nM >1000nM
mGt (Gantenerumab analog)
Fibrillar 0.3nM >1000nM
3D6 (Bapineuzumab analog)
All forms 0.2nM 3nM
m266 (Solanezumab analog)
Soluble 17nM 2nM
Source: Bussière T. et al; 11th International Conference on Alzheimer’s and Parkinson’s Diseases
Phase I study data:
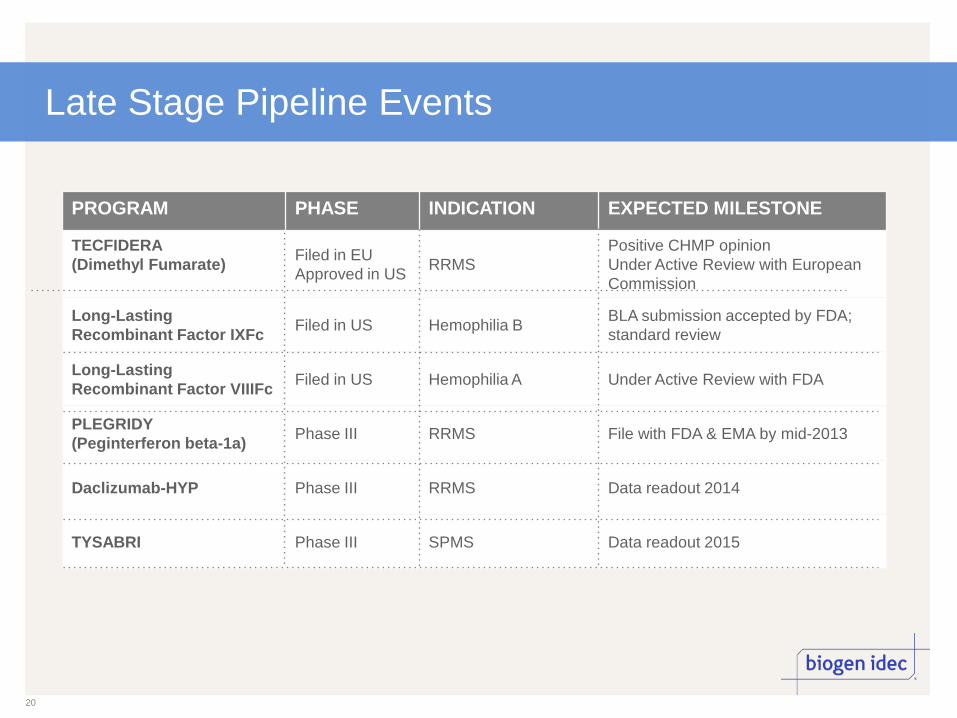
Late Stage Pipeline Events
PROGRAM PHASE INDICATION EXPECTED MILESTONE
TECFIDERA (Dimethyl Fumarate)
Filed in EU Approved in US RRMS
Positive CHMP opinion Under Active Review with European Commission
Long-Lasting Recombinant Factor IXFc Filed in US Hemophilia B BLA submission accepted by FDA;
standard review
Long-Lasting Recombinant Factor VIIIFc Filed in US Hemophilia A Under Active Review with FDA
PLEGRIDY (Peginterferon beta-1a) Phase III RRMS File with FDA & EMA by mid-2013
Daclizumab-HYP Phase III RRMS Data readout 2014
TYSABRI Phase III SPMS Data readout 2015
20

TITLE OF PRESENTATION PAUL CLANCY, EXECUTIVE VICE PRESIDENT, CHIEF FINANCIAL OFFICER
FINANCIAL PERFORMANCE
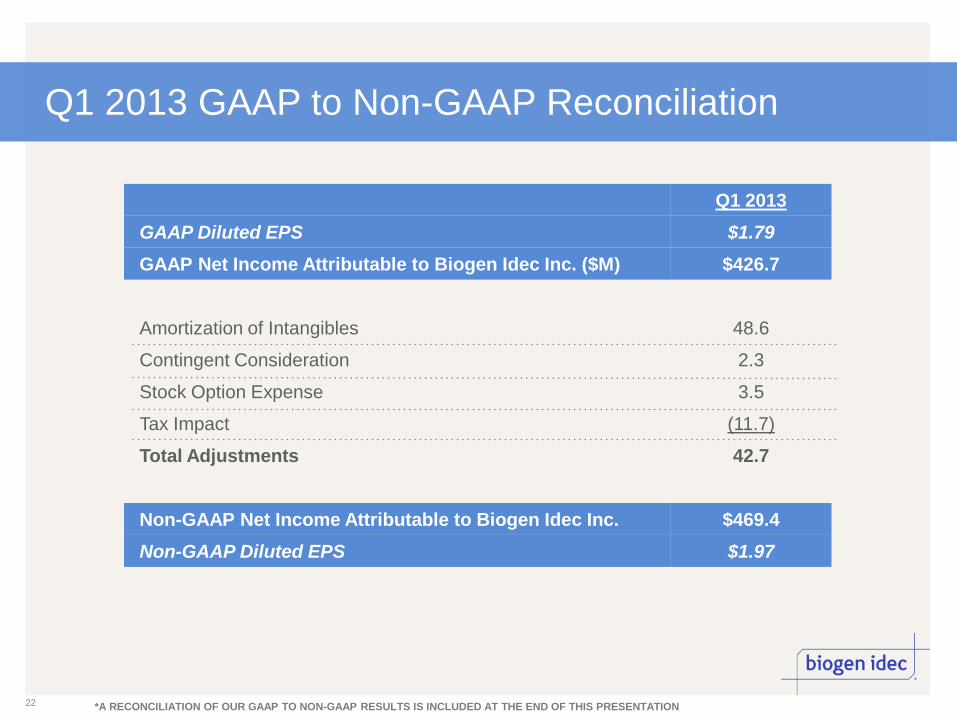
Q1 2013 GAAP to Non-GAAP Reconciliation
Q1 2013 GAAP Diluted EPS $1.79 GAAP Net Income Attributable to Biogen Idec Inc. ($M) $426.7
Amortization of Intangibles 48.6
Contingent Consideration 2.3
Stock Option Expense 3.5
Tax Impact (11.7)
Total Adjustments 42.7
Non-GAAP Net Income Attributable to Biogen Idec Inc. $469.4 Non-GAAP Diluted EPS $1.97
22 *A RECONCILIATION OF OUR GAAP TO NON-GAAP RESULTS IS INCLUDED AT THE END OF THIS PRESENTATION

Q1 2013 Financial Results Summary
Note: Numbers may not foot due to rounding. Percent changes represented as favorable & (unfavorable).
*Net of Hedge
**US Profit Share = US Profit Share + Expense Reimbursement
23
($) Millions Q1
2012 Q4
2012 Q1
2013 %∆ Q/Q
%∆ Y/Y
AVONEX US $401 $467 $491 5% 23%
AVONEX Int’l* $261 $286 $255 -11% -2%
Total AVONEX Sales* $662 $753 $746 -1% 13%
TYSABRI US $87 $104 $113 9% 30%
TYSABRI Int’l* $198 $191 $199 4% 0%
TYSABRI Rev to BIIB* $286 $295 $312 6% 9%
Other Product Sales $28 $26 $38 46% 36%
Total Product Sales $975 $1,075 $1,096 2% 12%
RITUXAN US Profit Share** $258 $257 $282 10% 9%
RITUXAN ex-US Revenues $27 $24 $(17) NMF NMF
Tot. Rev. from Unconsol. Joint Bus. (RITUXAN) $285 $281 $265 -6% -7%
Corporate Partner Revenues $3 $6 $22 NMF NMF
Royalty $29 $56 $33 -42% 14%
Total Revenue $1,292 $1,418 $1,415 0% 10%

RITUXAN Performance
27 25 29 24 (17)
258 259 259 257 282 285 285 288 281
265
792 784 787 769
865
Q1-12 Q2-12 Q3-12 Q4-12 Q1-13
ROW Royalty BIIB US Profit Share* BIIB Revenue US Net Sales
24
RITUXAN Results ($M) Q1 2013 Highlights
Revenue vs. Q1 2012 and Q4 2012 US Net Sales +9% and +12% US Profit Share* +9% and +10% ROW Royalty NMF and NMF BIIB Revenue -7% and -6%
Revenues driven by continued uptake in first line maintenance in follicular lymphoma
Q1 2013 results include $42M for arbitration charge $4M impacted US profit share $38M impacted ROW Royalties
Note: In collaboration with Roche and Genentech. *US Profit Share = US Profit Share + Expense Reimbursement 24
Note: Numbers may not foot due to rounding

Q1 2012 Q4 2012 Q1 2013 %∆ Q/Q
%∆ Y/Y
Cost of Sales1 $133 $134 $134 0% 0%
% of Total Revenues 10% 9% 9%
Non-GAAP R&D Expenses2 $354 $344 $283 18% 20%
% of Total Revenues 27% 24% 20%
Non-GAAP SG&A Expenses3 $300 $375 $351 6% -17%
% of Total Revenues 23% 26% 25%
Collaboration Profit Sharing1 (TYSABRI) $86 $78 $85 -10% 1%
Gain on Sale of Rights (BENLYSTA)
N/A $15 $5 NMF NMF
Note: Numbers may not foot due to rounding. Percent changes represented as favorable & (unfavorable).
1. For Q1‘12, Q4‘12, Q1’13 there were no adjustments between GAAP and non-GAAP cost of sales or collaboration profit sharing.
2. For Q1‘12 GAAP R&D expense was $356 million and 28% of Total Revenues, non-GAAP R&D expense excludes $1 million in stock option expense. For Q4‘12 GAAP R&D expense was $345 million and 24% of Total Revenues, non-GAAP R&D expense excludes $1 million in stock option expense. For Q1‘13 GAAP R&D expense was $284 million and 20% of Total Revenues, non-GAAP R&D expense excludes $1 million in stock option expense.
3. For Q1’12 GAAP SG&A expense was $300 million and 23% of Total Revenues, non-GAAP SG&A expense excludes less than $1M in stock option expense. For Q4’12 GAAP SG&A expense was $300 million and 22% of Total Revenues, non-GAAP SG&A expense excludes less than $2 million in stock option expense. For Q1'13 GAAP SG&A expense was $352 million and 25% of Total Revenues, non-GAAP SG&A expense excludes $1 million in stock option expense.
25
($) Millions
Q1 2013 Financial Results Summary

($) Millions except shares and EPS
Q1 2012
Q4 2012
Q1 2013
%∆ Q/Q
%∆ Y/Y
Other income (expense), net1 $14 $(14) $(14) -1% NMF
Non-GAAP Tax Rate2 22% 31% 14%
Equity in Loss of Investee, net of tax* - $3 $4 NMF NMF
Non-GAAP Net Income attributable to Biogen Idec3 $338 $335 $469 40% 39%
Weighted average diluted shares used in calculating diluted EPS (millions) 242 238 238 0% 1%
Non-GAAP EPS3 $1.40 $1.40 $1.97 41% 41%
Note: Numbers may not foot due to rounding. Percent changes represented as favorable & (unfavorable).
1. For Q1'12, Q4'12, Q1’13 other income (expense), net there were no adjustments between GAAP and non-GAAP.
2. For Q1'12 GAAP tax rate was 21%. For Q4'12 GAAP tax rate was 32%. For Q1‘13 GAAP tax rate was 13%. The difference between the GAAP and non-GAAP tax
rate for all periods is a result of the cumulative effects of the reconciliation that can be found on Table 3 from Biogen Idec’s Q1’13 earnings press release or the end of this presentation and the footnotes to the prior slide of this presentation.
3. GAAP diluted EPS was $1.25, $1.23, $1.79 in Q1’12, Q4'12, Q1’13 respectively. GAAP net income attributable to Biogen Idec Inc. was $303 million, $292 million, $427 million in Q1’12, Q4'12, Q1’13 respectively. See Table 3 from Biogen Idec's Q1‘13 press release or the end of this presentation for the most directly comparable GAAP net income attributable to Biogen Idec Inc. and diluted GAAP EPS, with a reconciliation to the non-GAAP net income attributable to Biogen Idec Inc. and diluted non-GAAP EPS.
26 *Represents our share of the results of operations related to our investment in Samsung Bioepis
Q1 2013 Financial Results Summary

2013 Full Year Financial Guidance Old
FY 2013 Guidance
New FY 2013
Guidance Comments
Revenues Approximately 10% growth
Approximately 16-18%
Revenue assumptions on core business remain unchanged. Included in this guidance is an additional $425 to 475 million from the TYSABRI asset purchase
Cost of Sales 8% to 10% of revenues
13% to 15% Includes TYSABRI contingent payments and 100% of 3rd party TYSABRI royalties
R&D Expense 22% to 23% of revenues
22% to 23% Now includes an additional $75 million earmarked for business development deals
SG&A Expense 24% to 26% of revenues
24% to 26% No Change
Tax Rate 24% to 26% 22% to 23% For the balance of the year, our effective tax rate is expected to be between 24% and 25%.
GAAP EPS Expected between $6.45 & $6.55
Expected between $6.69 & $6.79
Increase due to TYSABRI asset purchase, Q1 2013 discrete tax benefits, Q1 2013 core business strength offset by $75 million earmarked for business development deals
Non-GAAP EPS Expected between
$7.15 & $7.25 Expected between
$7.80 & $7.90
Increase due to TYSABRI asset purchase, Q1 2013 discrete tax benefits, Q1 2013 core business strength offset by $75 million earmarked for business development deals
Capital Expenditures $250 to $270 million $250 to $270 million No Change
27
Expense ratios apply to both GAAP and Non-GAAP 2013 Full Year Guidance.
27 *A RECONCILIATION OF OUR GAAP TO NON-GAAP RESULTS IS INCLUDED AT THE END OF THIS PRESENTATION
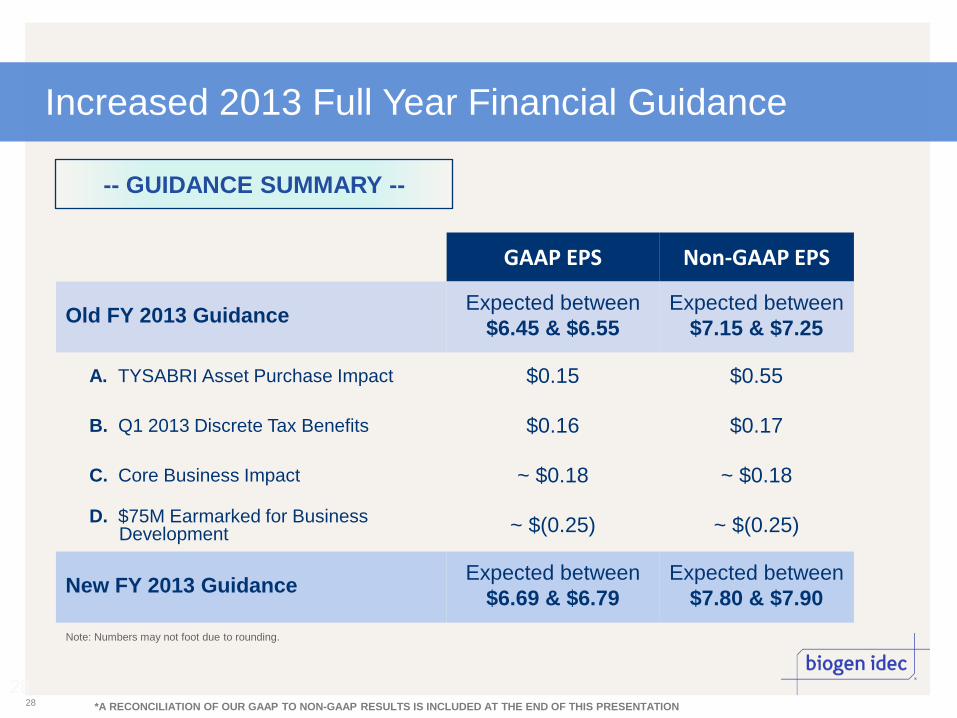
Increased 2013 Full Year Financial Guidance
28 28
GAAP EPS Non-GAAP EPS
Old FY 2013 Guidance Expected between $6.45 & $6.55
Expected between $7.15 & $7.25
A. TYSABRI Asset Purchase Impact $0.15 $0.55
B. Q1 2013 Discrete Tax Benefits $0.16 $0.17
C. Core Business Impact ~ $0.18 ~ $0.18
D. $75M Earmarked for Business Development ~ $(0.25) ~ $(0.25)
New FY 2013 Guidance Expected between $6.69 & $6.79
Expected between $7.80 & $7.90
*A RECONCILIATION OF OUR GAAP TO NON-GAAP RESULTS IS INCLUDED AT THE END OF THIS PRESENTATION
-- GUIDANCE SUMMARY --
Note: Numbers may not foot due to rounding.

TITLE OF PRESENTATION BIOGEN IDEC GEORGE SCANGOS, Ph.D., CHIEF EXECUTIVE OFFICER

Biogen Idec: A Bright Future
30
Strong near-term growth prospects driven by our core business
Entering into an era of significant long-term growth driven by multiple potential new product launches
Building an innovative pipeline to sustain longer-term value creation

TITLE OF PRESENTATION BIOGEN IDEC QUESTIONS & ANSWERS
TITLE OF PRESENTATION BIOGEN IDEC APPENDIX

Neurology Late Stage Programs
33
Molecule TECFIDERA
Dimethyl Fumarate
TECFIDERA Dimethyl Fumarate
PegInterferon β 1-A
TYSABRI
natalizumab TYSABRI
natalizumab Daclizumab
HYP Daclizumab
HYP Ocrelizumab* Ocrelizumab* Ocrelizumab*
Trial Name DEFINE CONFIRM ADVANCE ASCEND STRATIFY II SELECT DECIDE OPERA I OPERA II ORATORIO
Phase Phase III Phase III Phase III Phase IIIb Phase IV Phase II Phase III Phase III Phase III Phase III
Indication RRMS RRMS RRMS SPMS MS RRMS RRMS RMS RMS PPMS
Administration Oral Oral SC Injection IV/Infusion N/A SC Injection SC Injection IV/Infusion IV/Infusion IV/Infusion
Target Enrollment 1,000 1,200 1,500 850 >8,000 600 1,800 800 800 630
Design
1. 240mg BID
2. 240mg TID
3. Placebo
1. 240 mg BID
2. 240 mg TID
3. Placebo 4. Copaxone
20mg SC once daily
1. Placebo 2. 125 mcg
SC every 2 wks
3. 125 mcg SC every 4 wks
1. Placebo 2. 300 mcg IV
every 4 wks
Blood collection at enrollment and annually thereafter for up to two years
1. Placebo 2. 150 mcg
SC every 4 wks
3. 300 mcg SC every 4 wks
Active comparator trial versus Ifn β 1-A
Active comparator trial vs. Ifn β 1-A (Rebif)
Active comparator trial vs. Ifn β 1-A (Rebif)
Placebo comparator
Primary Endpoint
Proportion relapsing at 2 years
ARR at 2 years
ARR at 1 year Proportion of subjects experiencing confirmed progression of disability as measured by a composite endpoint
Correlation of PML incidence with JCV Ab status
ARR at 52 Weeks
ARR at 2-3 years
ARR at 96 Weeks
ARR at 96 Weeks
Time to sustained disability progression
Status EMA Filed,
FDA approved
EMA Filed, FDA
approved
Expect to file with FDA &
EMA by mid-2013
Data readout expected 2015 Ongoing Data readout
2011
Fully enrolled,
expect data 2014
Enrollment completed 1Q
2013
Enrollment completed 1Q 2013
Enrollment completed 1Q
2013
*Biogen Idec and Genentech, Inc. a member of the Roche Group have agreed that Genentech will have responsibility for the further development of ocrelizumab in multiple sclerosis. Genentech will fund 100% of the costs going forward and will be responsible for development and commercialization.
33

Anti-CD-20 Late Stage Programs
34
Molecule Rituxan
(Rituximab) Obinutuzumab (GA101)
Obinutuzumab (GA101)
Obinutuzumab (GA101)
Obinutuzumab (GA101)
Trial Name RATE CLL11 GADOLIN GALLIUM GOYA
Phase Phase IIIb Phase III Phase III Phase III Phase III
Indication Front-line Diffuse Large B-Cell or Follicular NHL
Front-line Chronic Lymphocytic Leukemia
Rituxan-refractory indolent Non Hodgkin’s Lymphoma Front-line indolent NHL Front-line Diffuse Large B-
cell lymphoma (DLBCL)
Administration IV Infusion IV Infusion IV Infusion IV Infusion IV Infusion
Target Enrollment 450 780 360 1,400 1,400
Design Prospective, open label, single arm study
Arm A: GA 101 plus Chlorambucil Arm B: Rituxan plus Chlorambucil Arm C: Chlrambucil alone
Arm A: GA101 plus Bendamustine Arm B: Bendamustine
Arm A: GA 101 plus chemotherapy followed by GA 101 maintenance Arm B: Rituxan plus chemotherapy followed by Rituxan maintenance
Arm A: GA101 plus CHOP Arm B: Rituxan plus CHOP
Primary Endpoint Incidence of Grade 3 or 4
infusion-related adverse events resulting from faster infusion
Progression-free survival Progression-free
survival Progression-free survival
Progression-free survival
Status sBLA approved October 2012
Stage 1a (ARM A vs. C) positive
Stage 1b (ARM B vs. C) futility analysis met
Data presentation expected at ASCO 2013
Filing expected in 2013
FPI Q2 2010 Expect data 2015
FPI Q3 2011
FPI Q3 2011 Data readout 2015
34

Hemophilia Late Stage Programs
Molecule Long-Lasting
Recombinant Factor IX Fc (rFIXFc)
Long-Lasting Recombinant Factor VIII Fc
(rFVIIIFc)
Long-Lasting Recombinant Factor IX Fc
(rFIXFc)
Long-Lasting Recombinant Factor VIII Fc
(rFVIIIFc)
Trial Name B-LONG A-LONG KIDS B-LONG KIDS A-LONG
Phase Phase III Phase III Phase III Phase III
Indication Hemophilia B Hemophilia A Hemophilia B Hemophilia A
Administration IV Injection IV Injection IV Injection IV Injection
Target Enrollment 123 ~150 ~20 ~50
Design
1. Weekly Prophylaxis 2. Individualized Interval
Prophylaxis 3. Episodic Treatment 4. Perioperative
Management
1. Individualized Prophylaxis
2. Weekly Prophylaxis 3. Episodic Treatment
1. Prophylaxis Regimen 1. Prophylaxis Regimen
Key Endpoints
• Incidence of Inhibitor Development
• Annualized Bleeding Rate • Response to Treatment
• Incidence of Inhibitor Development
• Annualized Bleeding Rate • Response to Treatment
• Incidence of Inhibitor Development
• Annualized Bleeding Rate • Response to Treatment
• Incidence of Inhibitor Development
• Annualized Bleeding Rate • Response to Treatment
Status Filed with the FDA 4Q 2012
Filed with the FDA 1Q 2013
Actively recruiting Actively recruiting
35 35

Q1 2013 Impact of Foreign Exchange
Q1 2013 FX / Hedge Impact Favorable / (Unfavorable)
Total Revenue $1,415 $(6)* (0)%
R&D Expenses $283 $1 0%
SG&A Expenses $351 $0 0%
Collaboration Profit Sharing $85 $0 0%
36
COMPARED WITH THE SAME QUARTER OF LAST YEAR
*Total revenue excluding the $4 million loss from hedging was lower by $2 million in the quarter versus a year ago due to foreign exchange rates. Numbers may not foot due to rounding.
36
Note: Amounts are in ($) Millions, except percentages. Expenses above are non-GAAP.

GAAP to Non-GAAP Reconciliation
37
Use of Non-GAAP Financial Measures We supplement our consolidated financial statements presented on a GAAP basis by providing additional measures which may be considered “non-GAAP” financial measures under applicable SEC rules. We believe that the disclosure of these non-GAAP financial measures provides additional insight into the ongoing economics of our business and reflects how we manage our business internally, set operational goals and forms the basis of our management incentive programs. These non-GAAP financial measures are not in accordance with generally accepted accounting principles in the United States and should not be viewed in isolation or as a substitute for reported, or GAAP, net income attributable to Biogen Idec Inc. and diluted earnings per share. Our “Non-GAAP net income attributable to Biogen Idec Inc.” and “Non-GAAP earnings per share - Diluted” financial measures exclude the following items from GAAP net income attributable to Biogen Idec Inc. and diluted earnings per share: 1. Purchase accounting and merger-related adjustments. We exclude certain charges related to the 2003 merger between Biogen Inc. and Idec Pharmaceuticals, Inc., certain acquisition-related items, and certain amounts in relation to the consolidation of variable interest entities for which we are the primary beneficiary. These adjustments include charges for in-process research and development, the amortization of certain acquired intangible assets and adjustments to the fair value of our contingent consideration obligations. The exclusion of these charges provides management and investors with a supplemental measure of performance which the Company believes better reflects the underlying economics of the business. 2. Stock option expense recorded in accordance with the accounting standard for share-based payments. We believe that excluding the impact of expensing stock options better reflects the recurring economic characteristics of our business. 3. Other items. We evaluate other items on an individual basis, and consider both the quantitative and qualitative aspects of the item, including (i) its size and nature, (ii) whether or not it relates to our ongoing business operations, and (iii) whether or not we expect it to occur as part of our normal business on a regular basis. We also include an adjustment to reflect the related tax effect of all reconciling items within our reconciliation of our GAAP to Non-GAAP net income attributable to Biogen Idec Inc. Numbers may not foot due to rounding.
37
*
EARNINGS PER SHAREMarch 31,
2013December 31,
2012March 31,
2012
GAAP earnings per share - Diluted 1.79$ 1.23$ 1.25$ Adjustments to net income attributable to Biogen Idec Inc. (as detailed below) 0.18 0.17 0.15 Non-GAAP earnings per share - Diluted 1.97$ 1.40$ 1.40$
GAAP net income attributable to Biogen Idec Inc. 426.7$ 292.1$ 302.7$ Adjustments:
Amortization of acquired intangible assets 48.6 49.1 43.3 Fair value adjustment of contingent consideration 2.3 3.6 1.3 SG&A: Stock option expense 1.9 1.3 0.4 R&D: Stock option expense 1.6 0.8 1.0 R&D: Restructuring and other - - 1.3 2010 Restructuring initiatives - - 0.3 Non-controlling interests - - (0.3) Income tax effect related to reconciling items (11.7) (12.3) (11.6)
Non-GAAP net income attributable to Biogen Idec Inc. 469.4$ 334.6$ 338.4$
2013 Full Year Guidance GAAP to non-GAAP adjustments
$ Shares Diluted EPSProjected GAAP net income attributable to Biogen Idec Inc. 1,608$ 239 6.74$
Adjustments:Stock option expense 8 Restructuring and other - Amortization of acquired intangible assets 314 Fair value adjustment of contingent consideration 16 Income tax expense: Income tax effect related to reconciling items (74)
Projected Non-GAAP net income attributable to Biogen Idec Inc. 1,872$ 239 7.85$
An itemized reconciliation between projected EPS on a GAAP basis and on a non-GAAP basis is as follows:
(unaudited, in millions, except per share amounts)
An itemized reconciliation between net income attributable to Biogen Idec Inc. on a GAAP basis and net income attributable to Biogen Idec Inc. on a non-GAAP basis is as follows:
Biogen Idec Inc. and SubsidiariesGAAP to Non-GAAP Reconciliation: Net Income and Net Income Per Share
For the Three Months