Biogas in Scandinavia - Tillsammans skapar vi en ... in Scandinavia Skandinavisk Biogaskonference,...
19
Biogas in Scandinavia Skandinavisk Biogaskonference, Skive, 7. november 2017, Knud Boesgaard, FREMSYN
-
Upload
nguyennhan -
Category
Documents
-
view
215 -
download
0
Transcript of Biogas in Scandinavia - Tillsammans skapar vi en ... in Scandinavia Skandinavisk Biogaskonference,...
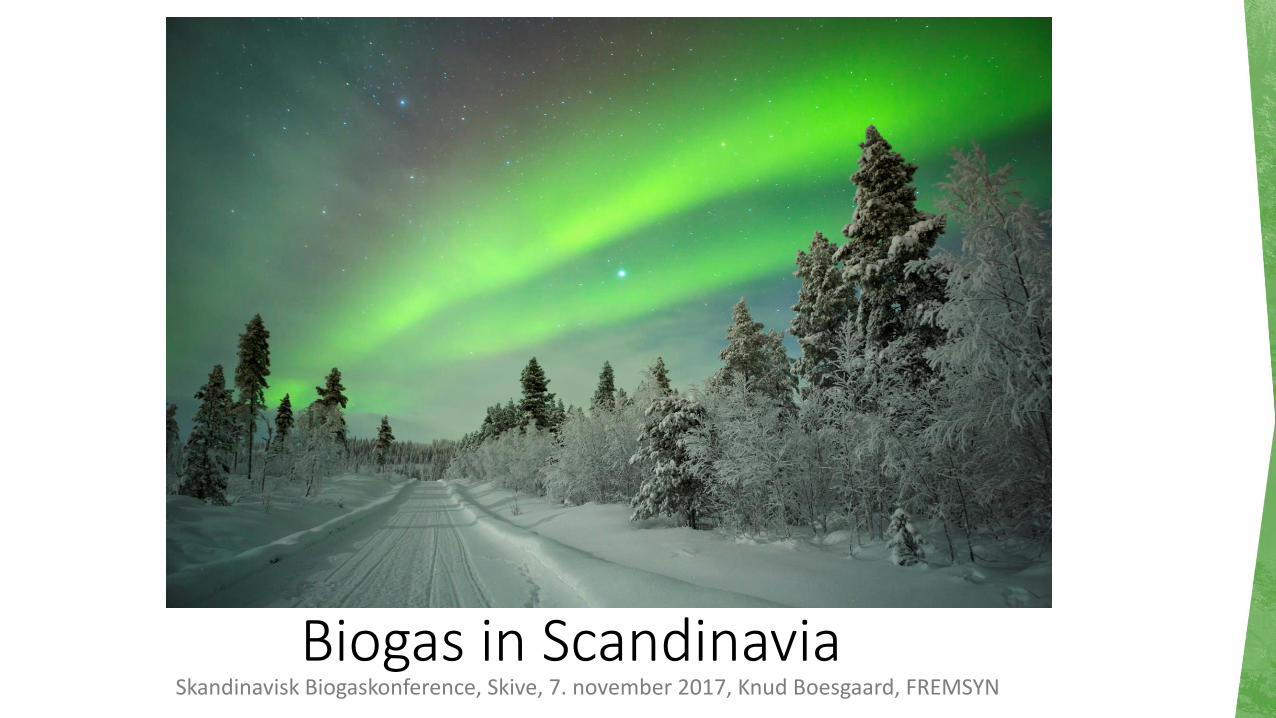
Biogas in Scandinavia Skandinavisk Biogaskonference, Skive, 7. november 2017, Knud Boesgaard, FREMSYN
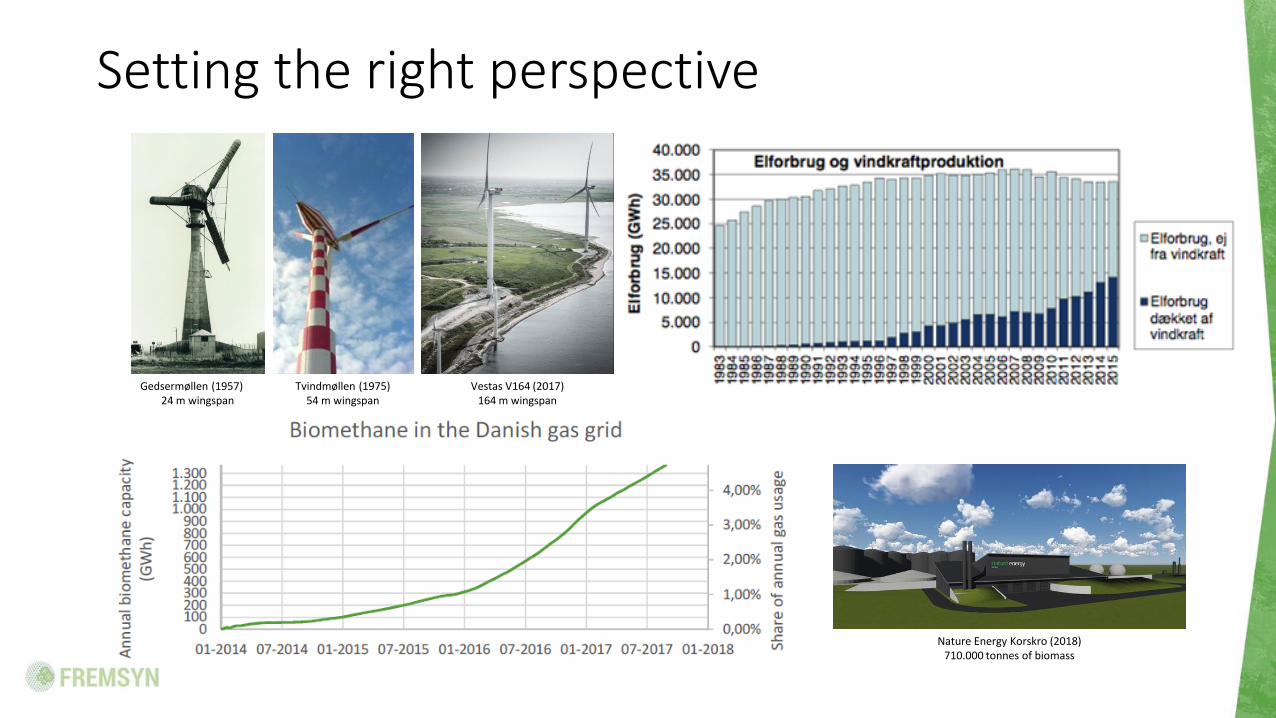
Setting the right perspective
Gedsermøllen (1957) 24 m wingspan
Vestas V164 (2017) 164 m wingspan
Nature Energy Korskro (2018) 710.000 tonnes of biomass
Tvindmøllen (1975) 54 m wingspan

Biogas status in Scandinavia
Denmark Sweden Norway Finland Number of biogas plants
165 282 40 84
Number of upgrading plants
12 61 9 10
Production Nm3 Production TWh
333,000,000 Nm3 3,3 TWh
202,000,000 NM3 2,1TWh
80,000,000 0,8 TWh
80,000,000 Nm3 0,8 TWh
09%
26%
15%
50%
Sweden
09%
26%
15%
50% Sweden Flare
Direct to heatand power
Grid injection,other
Grid injectionto transport
00%
46%
54%
01%
Denmark
11%
76%
09%
03%
Finland
20%
40%
20%
20%
Norway
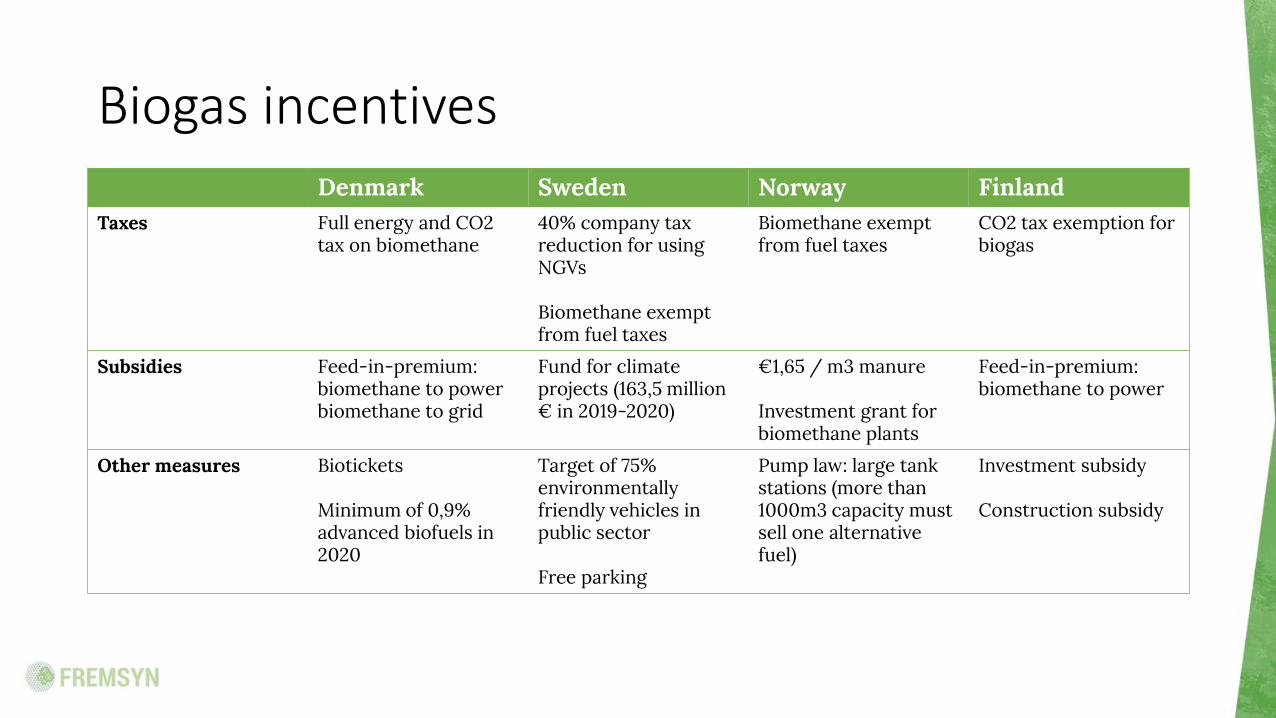
Biogas incentives Denmark Sweden Norway Finland
Taxes Full energy and CO2 tax on biomethane
40% company tax reduction for using NGVs Biomethane exempt from fuel taxes
Biomethane exempt from fuel taxes
CO2 tax exemption for biogas
Subsidies Feed-in-premium: biomethane to power biomethane to grid
Fund for climate projects (163,5 million € in 2019-2020)
€1,65 / m3 manure Investment grant for biomethane plants
Feed-in-premium: biomethane to power
Other measures Biotickets Minimum of 0,9% advanced biofuels in 2020
Target of 75% environmentally friendly vehicles in public sector Free parking
Pump law: large tank stations (more than 1000m3 capacity must sell one alternative fuel)
Investment subsidy Construction subsidy
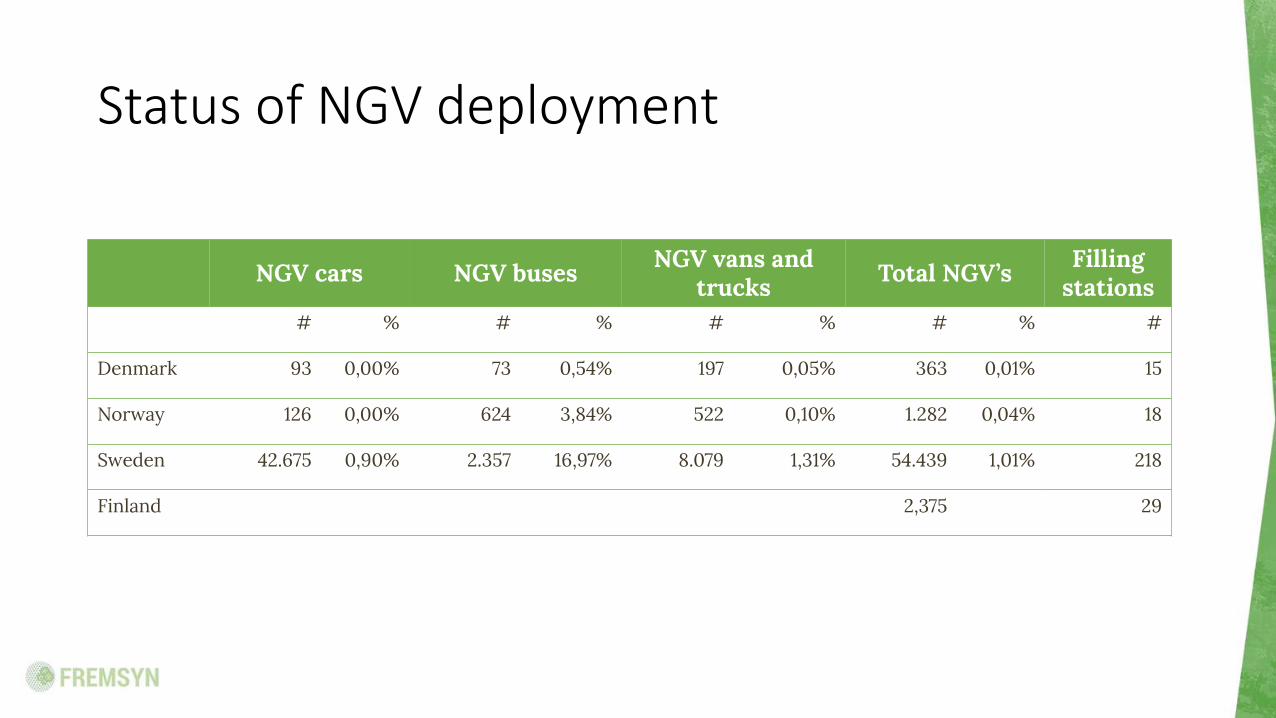
Status of NGV deployment
NGV cars NGV buses NGV vans and trucks Total NGV’s Filling
stations # % # % # % # % #
Denmark 93 0,00% 73 0,54% 197 0,05% 363 0,01% 15
Norway 126 0,00% 624 3,84% 522 0,10% 1.282 0,04% 18
Sweden 42.675 0,90% 2.357 16,97% 8.079 1,31% 54.439 1,01% 218
Finland 2,375 29

Biogas for transport in Denmark
0
1
2
3
4
5
6
7
8
9
2011 2012 2013 2014 2015 2016 2017
mio
. Nm
3
Development of gas consumption for transport in Denmark
Bionaturgas Naturgas FREMSYN estimates
Trends • Transition to bio nature gas • Sales of CBG almost exclusively runned by local
offers in the municipalities
Gas stations in Denmark Existing and planned gas stations – January 2016

Interessefællesskabet for biogas til transport *Interest community for biogas in transport
• Investigation of opportunities barriers for biogas in heavy transport
• Report series
• Send an e-mail to: [email protected]
Lots of potential … Cleaner than the alternatives ... And it’s cheaper …

Danish biogas potential in transport
Calculations for busses are based on numbers from The Danish Transport, Construction and Housing Authority Numbers City-transport og renovation are based The Danish Energy Agency’s ”Rammevilkår for gas til tung transport”
5%
10%
15%
An
del a
f dan
sk b
ræn
dsto
ffor
brug
-
100
200
300
400
500
600
700
800
2017 2018 2019 2020 2021 2022 2023 2024 2025 2026 2027 2028 2029 2030
Pote
ntie
lt å
rlig
t ga
sfor
brug
[
mio
. m3 ]
Højt scenarieCity-transportRenovationBusserENS fremskrivning af biogas i naturgasnettet
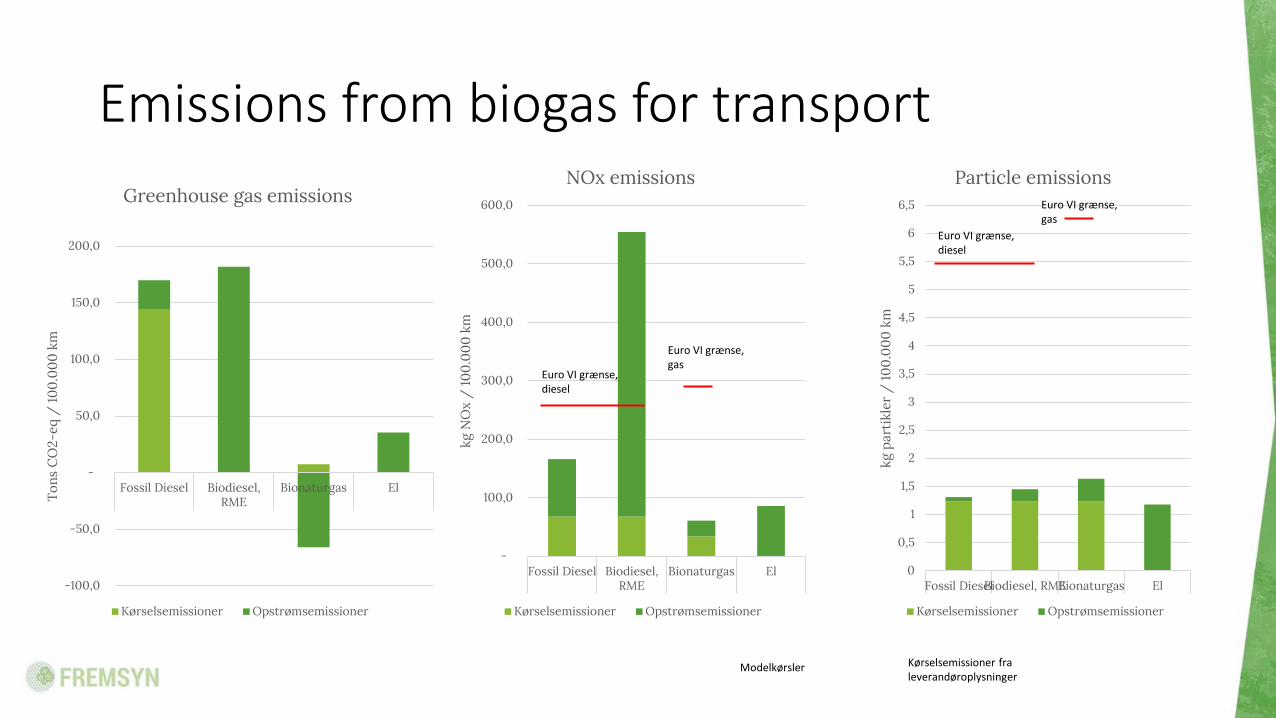
Emissions from biogas for transport
-100,0
-50,0
-
50,0
100,0
150,0
200,0
Fossil Diesel Biodiesel,RME
Bionaturgas El
Ton
s C
O2-
eq /
10
0.0
00
km
Greenhouse gas emissions
Kørselsemissioner Opstrømsemissioner
-
100,0
200,0
300,0
400,0
500,0
600,0
Fossil Diesel Biodiesel,RME
Bionaturgas El
kg N
Ox
/ 1
00
.00
0 k
m
NOx emissions
Kørselsemissioner Opstrømsemissioner
0
0,5
1
1,5
2
2,5
3
3,5
4
4,5
5
5,5
6
6,5
Fossil DieselBiodiesel, RMEBionaturgas El
kg p
arti
kler
/ 1
00
.00
0 k
m
Particle emissions
Kørselsemissioner Opstrømsemissioner
Euro VI grænse, gas
Euro VI grænse, diesel
Euro VI grænse, diesel
Euro VI grænse, gas
Kørselsemissioner fra leverandøroplysninger
Modelkørsler

Biofuels in Denmark
0
50000
100000
150000
200000
250000
2013 2014 2015 2016 2013 2014 2015 2016
Biodiesel Ethanol
m3
Palmeolie (1G) Rapsolie (1G) Canola (1G) Korn (1G) Sukker (1G ) Andet Animalsk fedt (2G)

2GA biofuels in the next RE Directive
New goal achievement from Ren Energi-pakken *Clean Energy regulatory
Existing goal achievement from the ILUC directive
- From 2020, Denmark introduces a requirement for advanced biofuels of 0.5%
- The EU Commissioncurrently discuss raising this requirement to 3.5% by 2030
- Økonominotatet (the financial note) examines the socioeconomic and state-financial effects of 3 alternatives to fulfillment of the requirement; Bio nature gas, Advanced Bioethanol and Advanced Biodiesel
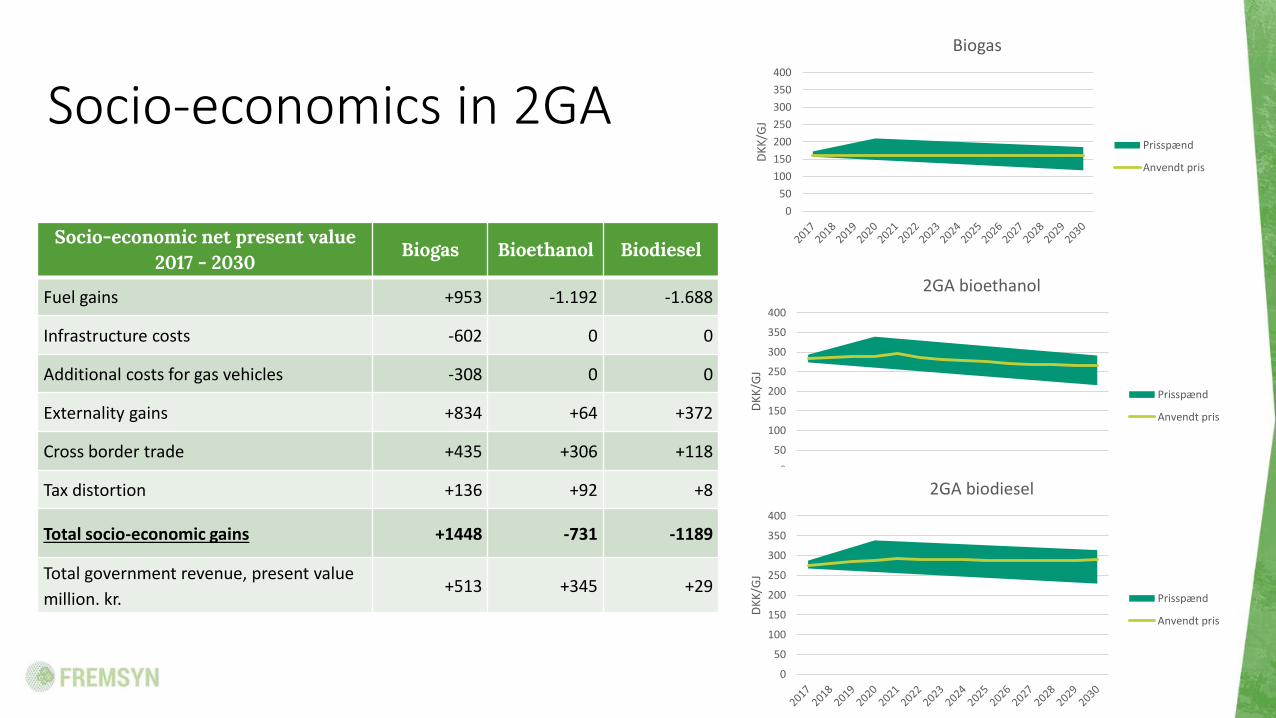
Socio-economics in 2GA
0
50
100
150
200
250
300
350
400
DK
K/G
J
Biogas
Prisspænd
Anvendt pris
0
50
100
150
200
250
300
350
400
DK
K/G
J
2GA bioethanol
Prisspænd
Anvendt pris
0
50
100
150
200
250
300
350
400
DK
K/G
J
2GA biodiesel
Prisspænd
Anvendt pris
Socio-economic net present value 2017 - 2030
Biogas Bioethanol Biodiesel
Fuel gains +953 -1.192 -1.688
Infrastructure costs -602 0 0
Additional costs for gas vehicles -308 0 0
Externality gains +834 +64 +372
Cross border trade +435 +306 +118
Tax distortion +136 +92 +8
Total socio-economic gains +1448 -731 -1189
Total government revenue, present value
million. kr. +513 +345 +29
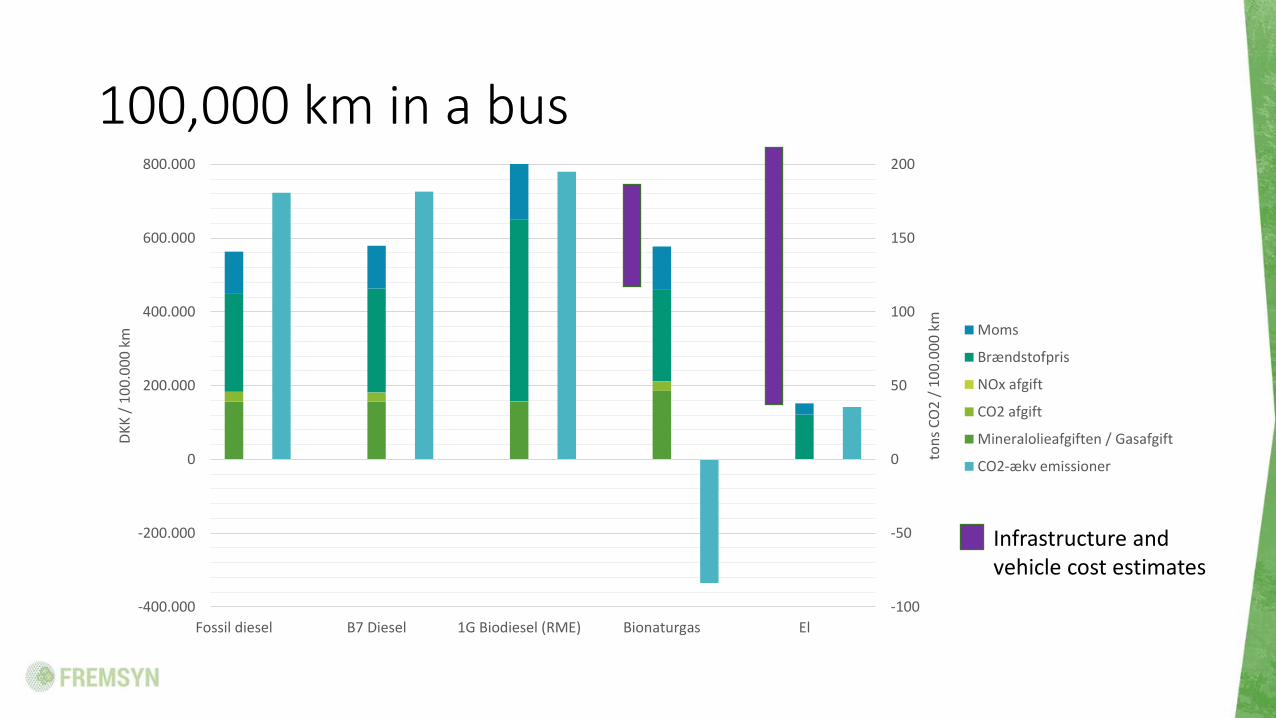
100,000 km in a bus
-100
-50
0
50
100
150
200
-400.000
-200.000
0
200.000
400.000
600.000
800.000
Fossil diesel B7 Diesel 1G Biodiesel (RME) Bionaturgas El
ton
s C
O2
/ 1
00
.00
0 k
m
DK
K /
10
0.0
00
km
Moms
Brændstofpris
NOx afgift
CO2 afgift
Mineralolieafgiften / Gasafgift
CO2-ækv emissioner
Infrastructure and vehicle cost estimates
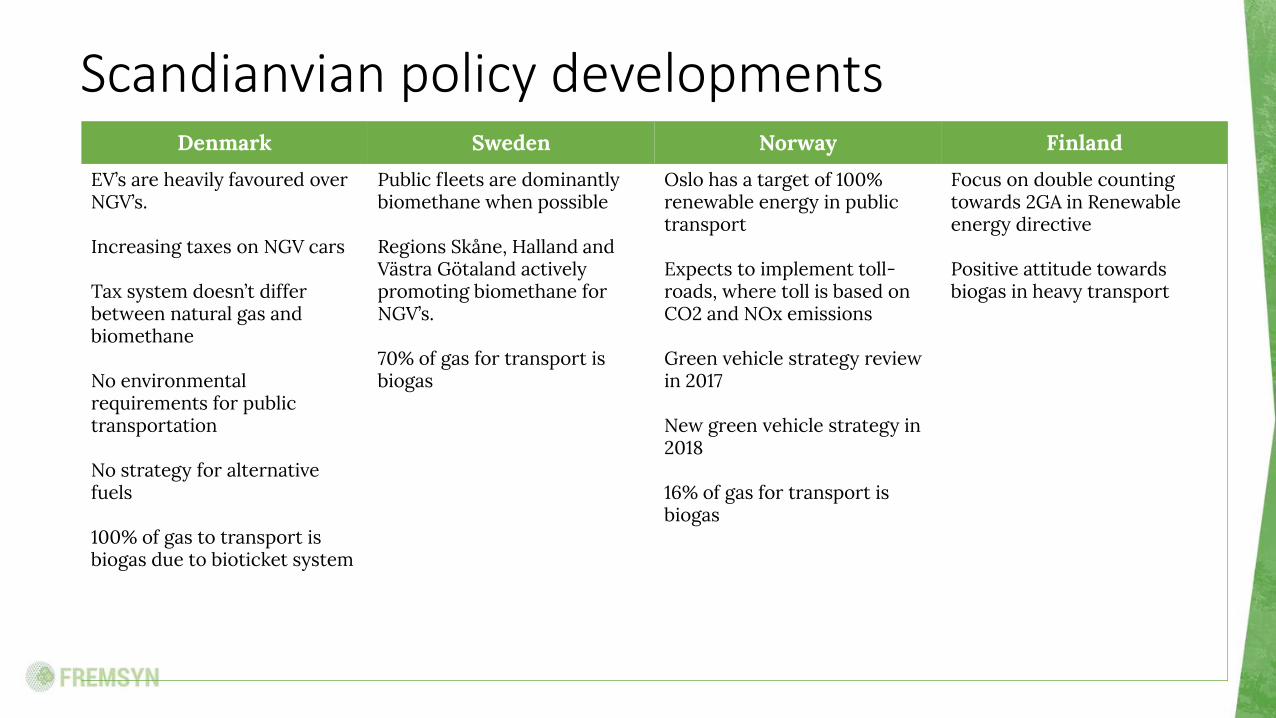
Scandianvian policy developments Denmark Sweden Norway Finland
EV’s are heavily favoured over NGV’s. Increasing taxes on NGV cars Tax system doesn’t differ between natural gas and biomethane No environmental requirements for public transportation No strategy for alternative fuels 100% of gas to transport is biogas due to bioticket system
Public fleets are dominantly biomethane when possible Regions Skåne, Halland and Västra Götaland actively promoting biomethane for NGV’s. 70% of gas for transport is biogas
Oslo has a target of 100% renewable energy in public transport Expects to implement toll-roads, where toll is based on CO2 and NOx emissions Green vehicle strategy review in 2017 New green vehicle strategy in 2018 16% of gas for transport is biogas
Focus on double counting towards 2GA in Renewable energy directive Positive attitude towards biogas in heavy transport
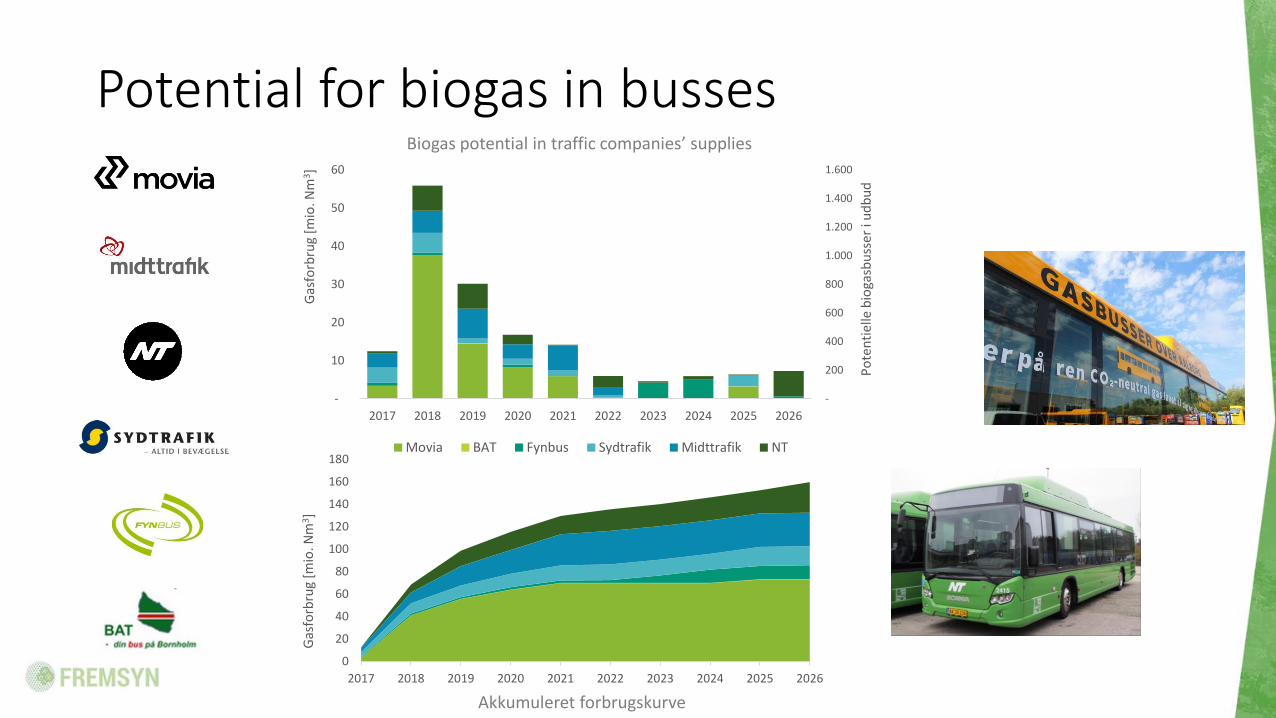
Potential for biogas in busses
-
200
400
600
800
1.000
1.200
1.400
1.600
-
10
20
30
40
50
60
2017 2018 2019 2020 2021 2022 2023 2024 2025 2026
Po
ten
tiel
le b
ioga
sbu
sser
i u
db
ud
Gas
forb
rug
[mio
. Nm
3]
0
20
40
60
80
100
120
140
160
180
2017 2018 2019 2020 2021 2022 2023 2024 2025 2026
Gas
forb
rug
[mio
. Nm
3]
Movia BAT Fynbus Sydtrafik Midttrafik NT
Biogas potential in traffic companies’ supplies
Akkumuleret forbrugskurve

Project developing
- Development of consortias - Applications - Implementation and reporting
Fleet analysis
- Consumption Needs - TCO (Total Cost of Ownership) - Assisting and support of
implementation
Environmental and climate analysis
- Climate scenarios - Emission inventories - Socioeconomic calculations

Technoeconomic parameters
0
200
400
600
800
1000
1200
Elbus Biogasbus Dieselbus
km
Range
-1500
-1000
-500
0
500
1000
1500
Bionaturgas Avanceret bioethanol Avanceret biodieselMio
. kr
Socioeconomic gain goal achievement with advanced biofuels 2017-2030 (DKK million)
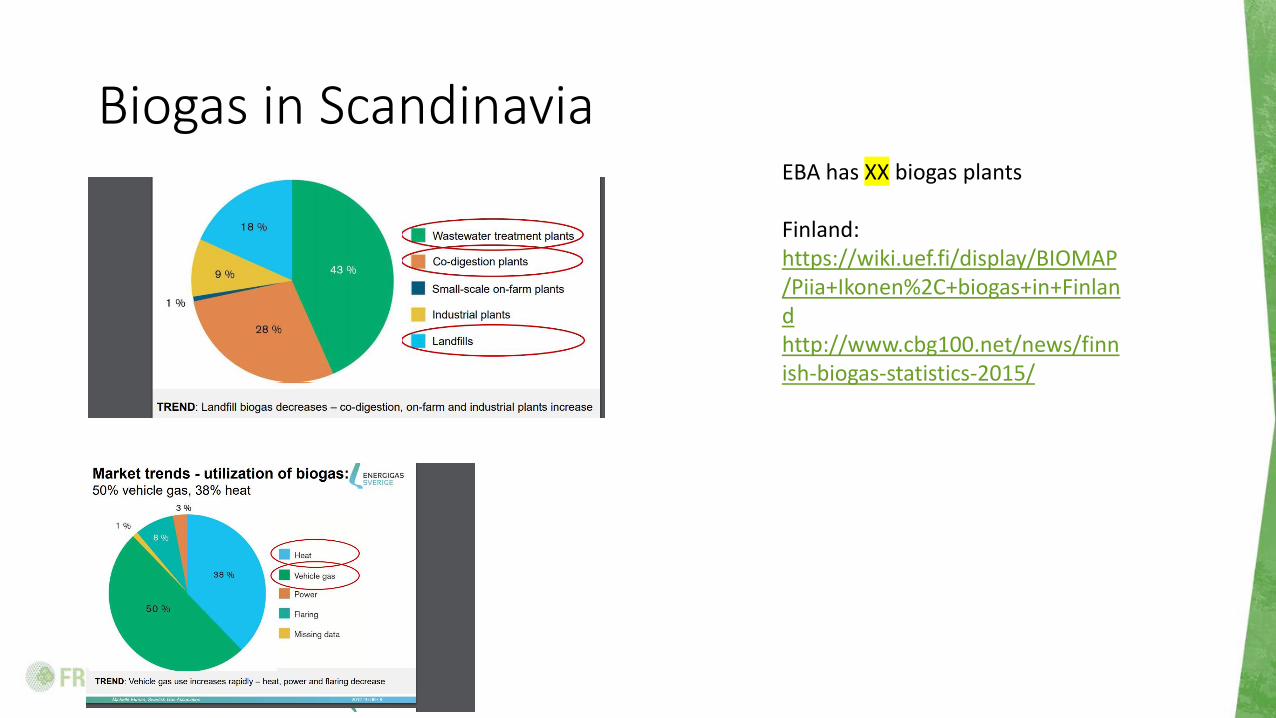
Biogas in Scandinavia EBA has XX biogas plants Finland: https://wiki.uef.fi/display/BIOMAP/Piia+Ikonen%2C+biogas+in+Finland http://www.cbg100.net/news/finnish-biogas-statistics-2015/