Biofuel Impacts on World Food Supply - MDPI
38
Energies 2008, 1, 41-78; DOI: 10.3390/en1010041 energies ISSN 1996-1073 www.mdpi.org/energies Review Biofuel Impacts on World Food Supply: Use of Fossil Fuel, Land and Water Resources David Pimentel *, Alison Marklein, Megan A. Toth, Marissa Karpoff, Gillian S. Paul, Robert McCormack, Joanna Kyriazis and Tim Krueger 5126 Comstock Hall, Cornell University, Ithaca, NY 14853, USA * Author to whom correspondence should be addressed; E-mail: [email protected] Received: 29 July 2008 / Accepted: 11 September 2008 / Published: 16 September 2008 __________________________________________________________________________________ Abstract: The rapidly growing world population and rising consumption of biofuels are increasing demand for both food and biofuels. This exaggerates both food and fuel shortages. Using food crops such as corn grain to produce ethanol raises major nutritional and ethical concerns. Nearly 60% of humans in the world are currently malnourished, so the need for grains and other basic foods is critical. Growing crops for fuel squanders land, water and energy resources vital for the production of food for human consumption. Using corn for ethanol increases the price of U.S. beef, chicken, pork, eggs, breads, cereals, and milk more than 10% to 30%. Keywords: agriculture, biofuels, energy, food security, fossil fuels, natural resources, renewable energy. __________________________________________________________________________________ 1. Introduction With shortages of fossil energy, especially oil and natural gas, and heavy biomass energy consumption occurring in both developed and developing countries, a major focus has developed worldwide on biofuel production [1-3]. Emphasis on biofuels has developed globally, including those made from crops such as corn, sugarcane, and soybean, considered by some researchers as renewable energy sources. Wood and crop residues also are being used as fuel [4]. Though it may seem beneficial to use renewable plant materials for biofuel, the use of crop residues and other biomass for biofuels raises concerns about major environmental impacts [5]. OPEN ACCESS
Transcript of Biofuel Impacts on World Food Supply - MDPI
Energies 2008, 1, 41-78; DOI: 10.3390/en1010041
energies ISSN 1996-1073
www.mdpi.org/energies
Review
Biofuel Impacts on World Food Supply: Use of Fossil Fuel, Land and Water Resources
David Pimentel *, Alison Marklein, Megan A. Toth, Marissa Karpoff, Gillian S. Paul, Robert McCormack, Joanna Kyriazis and Tim Krueger
5126 Comstock Hall, Cornell University, Ithaca, NY 14853, USA
* Author to whom correspondence should be addressed; E-mail: [email protected]
Received: 29 July 2008 / Accepted: 11 September 2008 / Published: 16 September 2008
__________________________________________________________________________________
Abstract: The rapidly growing world population and rising consumption of biofuels are
increasing demand for both food and biofuels. This exaggerates both food and fuel
shortages. Using food crops such as corn grain to produce ethanol raises major nutritional
and ethical concerns. Nearly 60% of humans in the world are currently malnourished, so
the need for grains and other basic foods is critical. Growing crops for fuel squanders land,
water and energy resources vital for the production of food for human consumption. Using
corn for ethanol increases the price of U.S. beef, chicken, pork, eggs, breads, cereals, and
milk more than 10% to 30%.
Keywords: agriculture, biofuels, energy, food security, fossil fuels, natural resources,
renewable energy.
__________________________________________________________________________________
1. Introduction
With shortages of fossil energy, especially oil and natural gas, and heavy biomass energy
consumption occurring in both developed and developing countries, a major focus has developed
worldwide on biofuel production [1-3]. Emphasis on biofuels has developed globally, including those
made from crops such as corn, sugarcane, and soybean, considered by some researchers as renewable
energy sources. Wood and crop residues also are being used as fuel [4]. Though it may seem beneficial
to use renewable plant materials for biofuel, the use of crop residues and other biomass for biofuels
raises concerns about major environmental impacts [5].
OPEN ACCESS

Energies 2008, 1
42
Conflicts exist today in the use of land, water, energy, and other environmental resources required
by both food and biofuel production. Although much of the land worldwide is occupied by grain and
other crops, malnutrition is still the leading cause of death in the world today [6]. The World Health
Organization [7] reports that more than 3.7 billion people (56% of the global population) are currently
malnourished and that number is steadily increasing. Grains make up more than 80% of the world food
supply, and unfortunately the Food and Agricultural Organization of the United Nations reports that
per capita grain production has been declining for the past 23 years [8,9]. This suggests that the
nutritional needs of the human population will require an increasing amount of agricultural resources
as food.
Food and biofuels are dependent on the same resources for production: land, water, and energy. In
the U.S., about 19% of all fossil energy is utilized in the food system, including about 7% for
agricultural production, 7% for processing and packaging foods, and about 5% for distribution and
preparation of food [10]. In developing countries, about 50% of wood energy is used primarily for
cooking in the food system [11]. Worldwide, the process of turning natural resources into food
requires large amounts of energy, land, and water resources. The objective of this article is to analyze:
(1) the reliance of both food and biofuel for the same land, water, and fossil energy resources in food
versus biofuel production and (2) the characteristics of the environmental impacts caused by food and
biofuel production.
2. Food supply and malnourishment in the world
Serious problems face the world food supply today. The human population faces serious food
shortages and malnutrition [7]. Considering this crisis, the Food and Agricultural Organization (FAO)
of the United Nations confirms that worldwide food available per capita has been declining
continuously based on availability of cereal grains during the past 23 years [8], which make up
alarmingly about 80% of the world’s food supply [9]. Although grain yields per hectare in both
developed and developing countries are still gradually increasing, the rate of increase is slowing, while
the world population and its food needs are rising rapidly [8,12]. For example, from 1950 to 1980,
U.S. grain yields increased at about 3% per year, but since 1980, the annual rate of increase for corn
and other other grains is only approximately 1% [13]. Therefore, the rate of increase in grain
production is not keeping up with the rapid rate of world population growth of 1.2% [12].
In 2005, the World Health Organization reported the largest number and proportion of
malnourished people, 3.7 billion [7]. This is the largest number and proportion of malnourished people
ever reported. Their assessment of malnutrition includes deficiencies in calories, protein, iron, iodine,
and vitamins A, B, C, and D [14,15]. Others, like FAO [16], report that 850 million people are
malnourished (based only on protein/calorie malnourishment). However, this estimate is low because it
does not account for the strenuous work and micronutrient deficiencies that affect billions of people
worldwide [17]. Malnutrition is especially difficult for children because of their rapid growth and
activity. Malnutrition is the underlying cause of more than half of the deaths of children under 5 years
old worldwide [18]. Furthermore, the UN reports over 9 million people die from starvation each year
[19]. Food shortages are also related to such problems as distribution, wars, droughts, and climate
change.

Energies 2008, 1
43
In order to solve the problem of malnutrition in the world, the U.S. must address over-consumption
of food, fuel, and other resources. The average American consumes more than 1,000 kg (2,200 lbs) of
food per year [20]. This is the equivalent of an average of 3,800 kcal per day, whereas the average
male only requires 2,400 kcal and female 2,000 kcal per day [20]. The U.S. over-consumption is
compounded by the massive use of fats and sweets in the diet [21].
Growing crops for biofuel will only exacerbate the problem of resource allocation, for biofuel
production depletes land, water, and energy resources for human food production.
3. World cropland resources
More than 99.7% of human food comes from the terrestrial environment, while less than 0.3%
comes from the oceans and other aquatic ecosystems [22]. Most of the suitable land for biomass
production is already in production. Worldwide, of the total 13 billion hectares of land area on earth
the percentages in use are: cropland, 11%; pasture land, 27%; forest land, 32%; urban, 9%; and other
21%. The remaining land (21%) is unsuitable for crops, pasture, and/or forests because the soil is too
infertile or shallow to support plant growth, or the climate and region are too cold, dry, steep, stony, or
wet [23]. Thus, most suitable land for production is already is in use.
In 1999 the United Nations reported that only 0.22 ha of cropland per capita was available
worldwide [24,25]; however, 0.5 ha is considered essential. In 1960, when the world population
numbered only 3 billion, approximately 0.5 ha per capita was available for the production of a diverse,
nutritious diet of plant and animal products [26].
As the human population continues to increase, there has been an expansion of diverse human
activities, which has reduced available cropland and pasture land. For example, vital cropland and
pasture land has been covered by transportation systems and urbanization. In the U.S., each person in
the population uses 0.4 ha (1 acre) of land for urbanization and highways [27]. China’s recent
explosion in development provides an example of rapid declines in the availability of per capita
cropland [28]. The current amount of available cropland in China is only 0.08 ha per capita (Table 1).
This relatively small amount of cropland provides the people in China with a predominantly vegetarian
diet, which requires less energy, land, and biomass than a typical American diet.
Table 1. Resources used and/or available per capita per year in the U.S., China, and the
world to supply basic human needs [23].
Resources U.S. China World Land
Cropland (ha) 0.48 0.08 0.22
Pasture (ha) 0.79 0.33 0.52
Forest (ha) 0.79 0.11 0.59
Total (ha) 2.78 0.46 1.97
Water (liters x 106) 2.0 0.46 0.60
Fossil fuel (BP, 2005)
Oil equivalents (liters) 9,500 1,400 2,100
Energies 2008, 1
44
As a result of world population growth, the average available cropland per capita worldwide has
now diminished to less than 0.22 ha (a total of 1.5 billion ha of cropland [25]. This is about half the
amount currently available in the U.S.; the average cropland per capita in the U.S. has also declined to
0.48 ha, or less than the critical land area essential for diverse food production (Table 1).
The availability of cropland influences the kinds and types of foods produced. For example, at
present, a total of 1,400 kg/yr per capita of agricultural product is produced to feed each American,
while the Chinese food supply averages only 800 kg/yr per capita [28]. By all available measurements,
the Chinese have reached or exceeded the limits of their agricultural system. Furthermore, the reliance
of the Chinese on large inputs of fossil-fuel based fertilizers to compensate for shortages of arable land
and severely eroded soils, and a limited fresh water supply, suggest severe problems looming in the
near future [28]. Today, China imports large amounts of grain from the United States and other nations
and is expected to further increase grain imports in the near future, because of land and water
shortages.
4. World water resources
Water is a vital resource for crop production and human survival [30]. The production of 9 t/ha of
corn requires about 7 million liters of water (about 700,000 gallons of water per acre) [31]. However,
world irrigation has declined about 10% during the past 10 years based on World Bank lending [32].
This is of critical importance because 17% of the crops that are irrigated provide 40% of the world
food supply [22]. Thus, the world’s capacity for food production is becoming limited by declining
water resources.
5. Energy resources
Humans have relied on various sources of power for centuries, but solar energy is the ultimate
source of global production. Biologically captured solar energy is vital to all natural ecosystems and to
maintaining the diversity of all life systems. Other energy sources have ranged from human power,
animal, wind, tidal, and water energy to wood, coal, gas, oil, and nuclear sources for fuel and power.
Since about the year 1700, abundant fossil fuel energy supplies have made it possible to augment
agricultural production to feed an increasing number of humans [9]. For example, energy availability
has made possible the purification and transport of water, reduced human diseases, and a generally
enhanced quality of human life.
Since the industrial revolution of the 1850’s, the total rate of energy use from all sources has been
growing even faster than world population growth. From 1970 to 1995, energy use increased at a rate
of 2.5% per year (doubling every 30 years) compared with the worldwide population growth of 1.7%
per year (doubling every 40 to 60 years) [9]. The use and availability of energy resources will start to
decline slowly and continuously until little or no oil and gas resources remain [33-35].
About 50% of all the solar energy captured by worldwide photosynthesis is used by humans for
food, forest products, and other systems. However, it is still inadequate to meet all current human
needs – namely, food needs [36]. To make up for this shortfall, about 473 quads (1 quad = 1 x 10¹⁵
BTU) of fossil energy, mainly oil, gas, coal, and a small amount of nuclear, are utilized worldwide
Energies 2008, 1
45
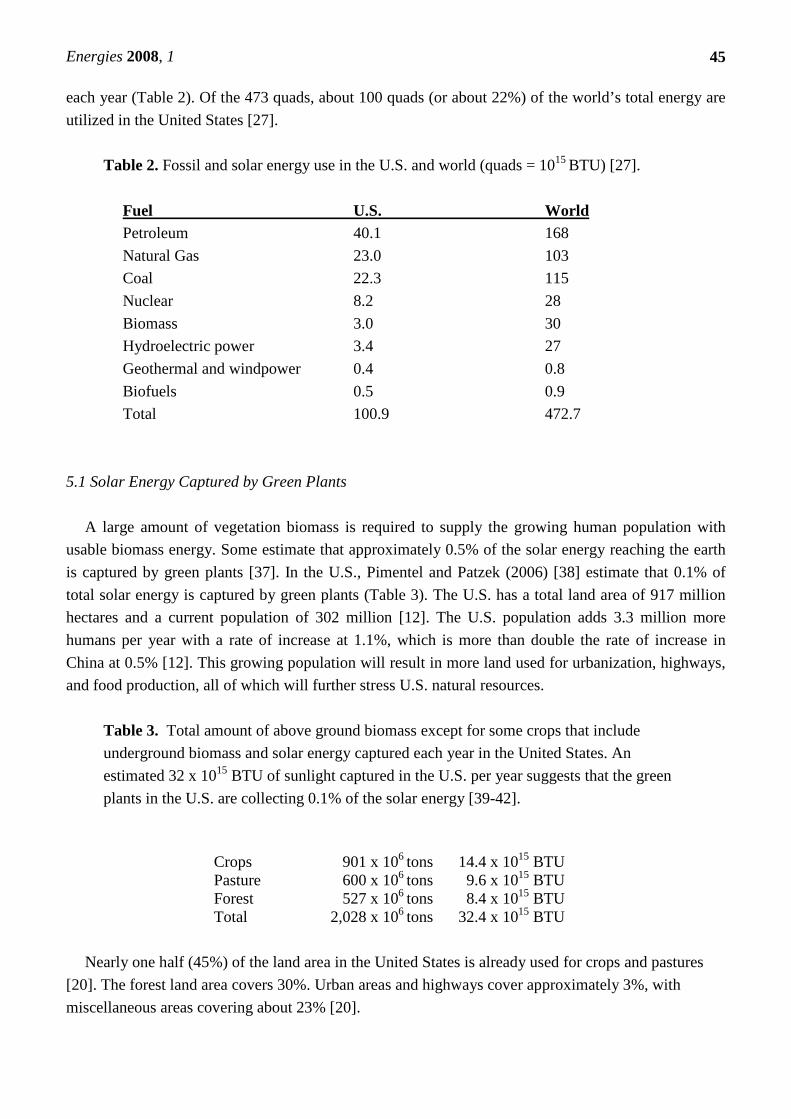
each year (Table 2). Of the 473 quads, about 100 quads (or about 22%) of the world’s total energy are
utilized in the United States [27].
Table 2. Fossil and solar energy use in the U.S. and world (quads = 1015 BTU) [27].
Fuel U.S. World Petroleum 40.1 168
Natural Gas 23.0 103
Coal 22.3 115
Nuclear 8.2 28
Biomass 3.0 30
Hydroelectric power 3.4 27
Geothermal and windpower 0.4 0.8
Biofuels 0.5 0.9
Total 100.9 472.7
5.1 Solar Energy Captured by Green Plants
A large amount of vegetation biomass is required to supply the growing human population with
usable biomass energy. Some estimate that approximately 0.5% of the solar energy reaching the earth
is captured by green plants [37]. In the U.S., Pimentel and Patzek (2006) [38] estimate that 0.1% of
total solar energy is captured by green plants (Table 3). The U.S. has a total land area of 917 million
hectares and a current population of 302 million [12]. The U.S. population adds 3.3 million more
humans per year with a rate of increase at 1.1%, which is more than double the rate of increase in
China at 0.5% [12]. This growing population will result in more land used for urbanization, highways,
and food production, all of which will further stress U.S. natural resources.
Table 3. Total amount of above ground biomass except for some crops that include
underground biomass and solar energy captured each year in the United States. An
estimated 32 x 1015 BTU of sunlight captured in the U.S. per year suggests that the green
plants in the U.S. are collecting 0.1% of the solar energy [39-42].
Crops 901 x 106 tons 14.4 x 10¹⁵ BTU Pasture 600 x 106 tons 9.6 x 10¹⁵ BTU Forest 527 x 106 tons 8.4 x 10¹⁵ BTU Total 2,028 x 106 tons 32.4 x 10¹⁵ BTU
Nearly one half (45%) of the land area in the United States is already used for crops and pastures
[20]. The forest land area covers 30%. Urban areas and highways cover approximately 3%, with
miscellaneous areas covering about 23% [20].
Energies 2008, 1
46
5.2 U.S. Energy Use
Each year, the U.S. population uses 3 times as much fossil energy as the total solar energy captured
by harvested U.S. crops, forest products, and other vegetation (Tables 1-3). Industry, transportation,
home heating and cooling, and food production account for most of the fossil energy consumed in the
United States [27]. Per capita use of fossil energy in the United States per year amounts to about 9,500
liters of oil equivalents -- more than 7-times the per capita use in China (Table 1). In China, most fossil
energy is used by industry, although a substantial amount, approximately 25%, is now used for
agriculture and in the food production system [28].
Taken together, developed nations annually consume about 70% of the fossil energy worldwide,
while the developing nations, which represent about 75% of the world population, use only 30% of
world fossil energy [43]. The United States, with only 4.5% of the world's population, is a major
consumer of fossil energy and annually consumes about 22% of the world's fossil energy output (Table
2).
Some developing nations that are experiencing especially high rates of population growth are
increasing fossil fuel use to help augment their agricultural production of food and fiber. For example,
since 1955 in China, there has been a 100-fold increase in fossil energy use in agriculture for
fertilizers, pesticides, and irrigation [28]. However, as fossil energy resources decline, the use of fossil
energy will become limited for food production, causing even more severe food shortages for the
rapidly growing world population.
Worldwide fertilizer use per capita has declined by more than 22% since 1989, especially in the
developing countries, due to fossil fuel shortages and high prices for fertilizers [44]. During the past 5
years, nitrogen fertilizer costs have more than doubled in the U.S. [45]. In addition, the overall
projections of available fossil energy resources for manufacturing fertilizers and all other purposes are
discouraging as the reserves of these finite fossil fuels rapidly diminish.
5.3 Fossil Fuel Supplies
World oil production has peaked and projections are that by 2040 oil will decline to about 62%
below peak (W. Youngquist, petroleum geologist, Eugene, OR, 30 April, 2008). The world supply of
oil is projected to last approximately 40-60 years, if use continues at current production rates [29].
Natural gas is considered adequate for about 30 years and coal for less than 100 years [29,46]. In the
U.S., natural gas is already in short supply; it is projected that the U.S. will deplete its natural gas
resources in about 20 years [33].
Initial drilling for oil and gas provided optimistic estimates of fossil fuel resources in the U.S. [46].
However, both the U.S. oil production rate and existing reserves have been declining for more than 30
years [27, 47]. To date, approximately 90% of U.S. oil resources have already been exploited (W.
Youngquist, personal communication, petroleum geologist, Eugene, Oregon, 2002) [48]. At present,
the United States is importing more than 65% of its oil [27], which puts the U.S. economy at risk due
to fluctuating oil prices and difficult international political situations.
Energies 2008, 1
47
6. Biomass Resources
Worldwide, most biomass is burned for cooking and heating; however, it can also be converted into
electricity. Assuming an optimal yield of 3 dry metric tons (t/ha) per year of woody biomass can be
harvested sustainably, this would provide a gross energy yield of 13.5 million kcal/ha [49,50].
Harvesting this wood biomass requires an energy expenditure of approximately 30 liters of diesel fuel
per ha, not including the embodied energy for cutting and collecting wood for transport to an electric
power plant. Thus, the energy input per output ratio for such a system is calculated to be 1:25 [51].
Fuelwood provides an important source of biomass energy used for industry and homes in the
United States, accounting for 3% of the total energy use in the U.S. [27]. About 60% of this biomass is
wood-waste fuel from paper producing plants, lumber mills, and furniture producing plants [27].
Approximately 30% of the wood is utilized in homes and power plants as fuel [52].
The cost of producing 1 kWh of electricity from woody biomass in the U.S. is about $0.06, which is
competitive with other electricity production systems that average $0.08 in the U.S. [27,53].
Approximately 3 kWh of thermal energy is expended to produce 1 kWh of electricity, an energy
input/output ratio of 1:3. Per capita consumption of woody biomass for heat in the U.S. amounts to 625
kilograms (kg) per year. The diverse biomass resources (wood, crop residues, and dung) used in
developing nations averages about 630 kg per capita per year [54]. Developing countries use only
about 500 liters of oil equivalents of fossil energy per capita compared with nearly 9,500 liters of oil
equivalents of fossil energy used per capita in the U.S. (Table 1) [55].
Woody biomass has the capacity to supply the U.S. with about 5 quads (1.5 x 10¹² kWh thermal) of
its total gross energy supply by the year 2050, provided that the amount of forest land stays constant
[56]. A city of 100,000 people using the biomass from a sustainable forest (3 t/ha per year) for
electricity requires approximately 200,000 ha of forest area, based on an average electrical demand of
slightly more than 1 billion kWh (electrical energy [e]) (860 kcal = 1 kWh) [56].
Environmental impacts of burning biomass are less harmful than those associated with coal, but
more harmful than those associated with natural gas [36]. Biomass combustion releases more than 200
different chemical pollutants, including 14 carcinogens and 4 co-carcinogens, into the atmosphere
[57]. As a result of this, but especially in developing nations where people cook with fuelwood over
open fires, approximately 4 billion people suffer from continuous exposure to smoke [58]. In the U.S.,
wood smoke kills 30,000 people each year [59], although many of the pollutants from electric plants
that use wood and other biomass can be mitigated. These controls include the same scrubbers that are
frequently installed on coal-fired plants.
6.1 Regional Benefits of Thermal Energy from Biofuels
Direct combustion is the most efficient use of wood biomass. Space heating in the U.S. is a major
component of both residential and commercial buildings. In total, the amount of energy used in these
sectors totals about 16 quads per year [27]. Currently, only an estimated 1% of U.S. homes are heated
with wood biomass [60]. If 10% of the forest biomass in the Midwest, Northeast, and Southeast (that
totals an estimated 100 million hectares) plus 10% of the grass biomass (that totals an estimated 26
million hectares) were harvested, this thermal energy would be a major asset to the nation [20]. The
estimated sustainable forest and grass biomass produced per hectare per year is about 2 t/ha/yr without
Energies 2008, 1
48
any fertilizer or other inputs (Table 3) [42]. Assuming half of the energy harvested from these biomass
areas is utilized for harvesting, transport, and processing, about 0.032 quads of thermal energy can be
utilized from the forest land, and 0.016 quads of thermal energy can be utilized from the grassland
area. This would total about 0.05% of total energy use in the U.S. (Table 2). Areas in the Northeast
that use wood for space heating, have become reforested as many farmlands were abandoned, and are
now major sources of wood biomass.
Increasing the use of wood biomass for heating homes will increase the number of illnesses, like
asthma and death [57]. Some communities, like Aspen, Colorado, already have banned the use of
wood fuels for heating, due to many adverse health effects [61].
7. World Forest Biomass The total sustainable world biomass energy potential has been estimated to be about 92 quads (1015
BTU) per year [62], which represents 19% of total global energy use (Table 2). The total forest
biomass produced worldwide is 38 quads per year [62], which represents 8% of total energy use (Table
2). In the U.S., only 1% to 2% home heating is achieved with wood [63]. Of the 106 million U.S.
homes that heat their homes, 2.0 million use wood as the main heating fuel (3%) [64].
Global forest area removed each year totals 15 million ha [65]. Global forest biomass harvested is
just over 1,431 billion kg per year, of which 60% is industrial roundwood and 40% is fuelwood [66].
About 90% of the fuelwood is utilized in developing countries [62]. A significant portion (26%) of all
forest wood is converted into charcoal [67]. The production of charcoal causes a 30% to 50% loss of
energy [68], and produces large quantities of smoke. The resulting charcoal is cleaner burning and
causes less smoke than burning wood fuel directly in the home [67]. Charcoal is dirty to handle but
light in weight.
In developing countries, about 2 kcal of wood are utilized in cooking 1 kcal of food [69]. Thus,
more biomass and more land and water are needed to produce the biofuel for cooking than the
resources needed to produce the food.
In the U.S., about 30% of the land area is forested and produces 239 billion kg of wood biomass
per year [20]. The total forest products harvested per year per person in the U.S. is 914 kg, but only 71
kg is used for firewood [70]. The rest is used for the production of lumber and pulp for paper
production.
The average yield of forest biomass in U.S. timberland is 1.93 dry metric tons/ha/yr [42]. Under
sustainable, moist, forest conditions in both temperate and tropical ecosystems, approximately 3 dry
metric tons (t/ha) per year of woody biomass can be harvested sustainably [50,71-73].
8. Cropland and Pasture Biomass
Of the total world land area in cropland, pasture, and forest, about 38% is cropland and pasture and
about 30% is forests [23]. Devoting a portion of this cropland and forest land to biofuels will stress
both managed ecosystems and will not be sufficient to solve the fuel problem [1].
Energies 2008, 1
49
8.1 Corn Ethanol and Energy Inputs
In the United States, ethanol constitutes 99% of all biofuels [74]. The average, energy and monetary
costs, for a large modern ethanol plant are enormous, about $65 million. For capital expenditures, new
plant construction costs from $1.05 to $3.00 per gallon of ethanol [75]. Fermenting and distilling corn
ethanol requires large amounts of water. The corn is finely ground and approximately 15 liters of water
are added per 2.69 kg of ground corn. After fermentation, to obtain a liter of 95% pure ethanol from
the 10% ethanol and 90% water mixture, 1 liter of ethanol must be extracted from the approximately
10 liters of the ethanol/water mixture. To be mixed with gasoline, the 95% ethanol must be further
processed and more water must be removed, requiring additional fossil energy inputs to achieve 99.5%
pure ethanol (Tables 4 and 5). Thus, a total of about 12 liters of wastewater must be removed per liter
of ethanol produced, and this relatively large amount of sewage effluent has to be disposed of at an
energy, economic, and environmental cost.
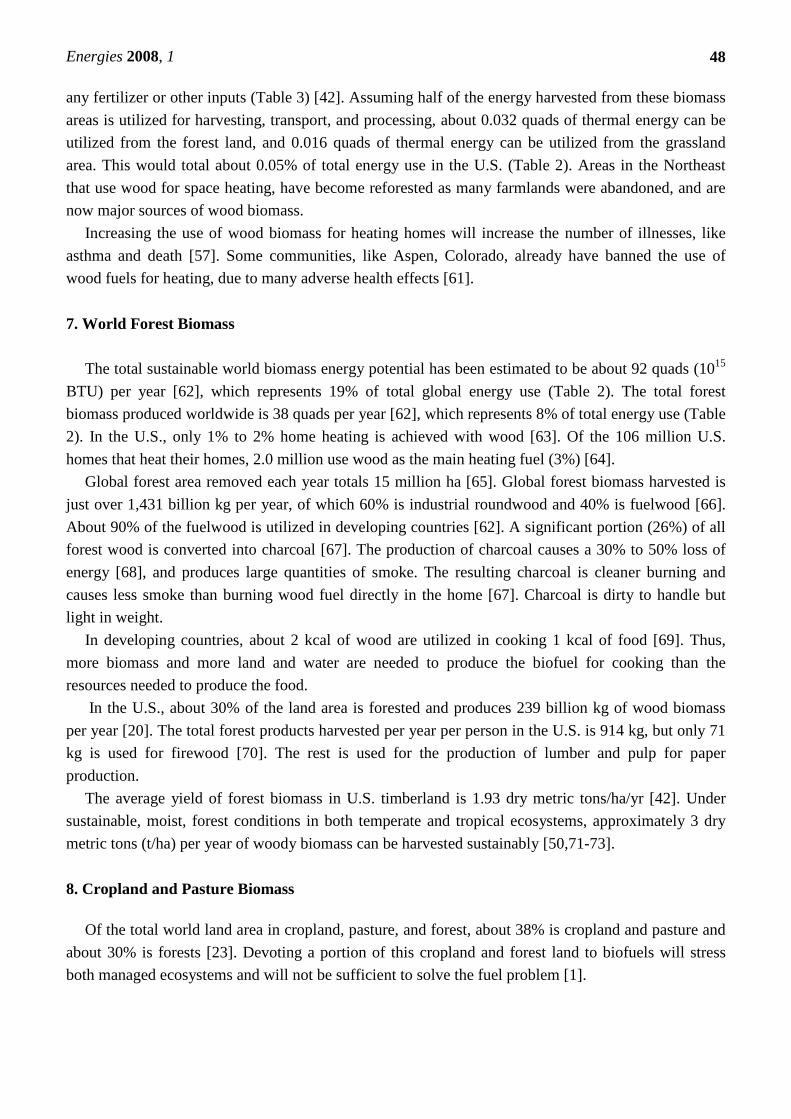
Table 4. Energy inputs and costs of corn production per hectare in the United States.
Inputs Quantity kcal x 1000 Costs $ Labor 11.4 hrsa 426b 300.00c Machinery 55 kgd 1,018e 310.00f Diesel 88 Lg 1,003h 500.00 Nitrogen 155 kgk 2,480l 255.00m Phosphorus 79 kgn 328o 150.00p Potassium 84 kgq 274r 78.00s Lime 1,120 kgt 315u 60.00 Seeds 21 kgv 520w 230.00x Irrigation 8.1 cmy 320z 350.00aa Herbicides 6.2 kgbb 620ee 372.00 Insecticides 2.8 kgcc 280ee 180.00 Electricity 13.2 Whdd 34ff 27.00 Transport 204 kggg 169hh 180.00 TOTAL 8,228 $2,992.00 Corn yield 9,400 kg/haii 33,840 kcal input:output 1:4.11
a) NASS, 2003 [76].
b) It is assumed that a person works 2,000 hrs per year and utilizes an average of 8,000 liters of
oil equivalents per year.
c) It is assumed that labor is paid $26.32 an hour.
d) Pimentel and Pimentel, 2008 [4].
e) Prorated per hectare and 10 year life of the machinery. Tractors weigh from 6 to 7 tons and
harvesters 8 to 10 tons, plus plows, sprayers, and other equipment.
f) Estimated.
g) Estimated.
h) Input 11, 400 kcal per liter.
i) Estimated
j) Input 10,125 kcal per liter.
Energies 2008, 1
50
k) NASS, 2003 [76].
l) Patzek, 2004 [77].
m) Cost $1.65 per kg.
n) NASS, 2003 [76].
o) Input 4,154 kcal per kg.
p) Cost $1.90 per kg.
q) NASS, 2003 [76].
r) Input 3,260 kcal per kg.
s) Cost $0.93 per kg.
t) Brees, 2004 [78]
u) Input 281 kcal per kg.
v) Pimentel and Pimentel, 2008 [4].
w) Pimentel and Pimentel, 2008 [4].
x) USDA, 1997 [79].
y) USDA, 1997 [80].
z) Batty and Keller, 1980 [81].
aa) Irrigation for 100 cm of water per hectare costs $1,000 (Larsen et al., 2002) [82].
bb) Larson and Cardwell, 1999 [83].
cc) USDA, 2002 [84].
dd) USDA, 1991 [85].
ee) Input 100,000 kcal per kg of herbicide and insecticide.
ff) Input 860 kcal per kWh and requires 3 kWh thermal energy to produce 1 kWh electricity.
gg) Goods transported include machinery, fuels, and seeds that were shipped an estimated 1,000
km.
hh) Input 0.83 kcal per kg per km transported.
ii) Average. [20,47].
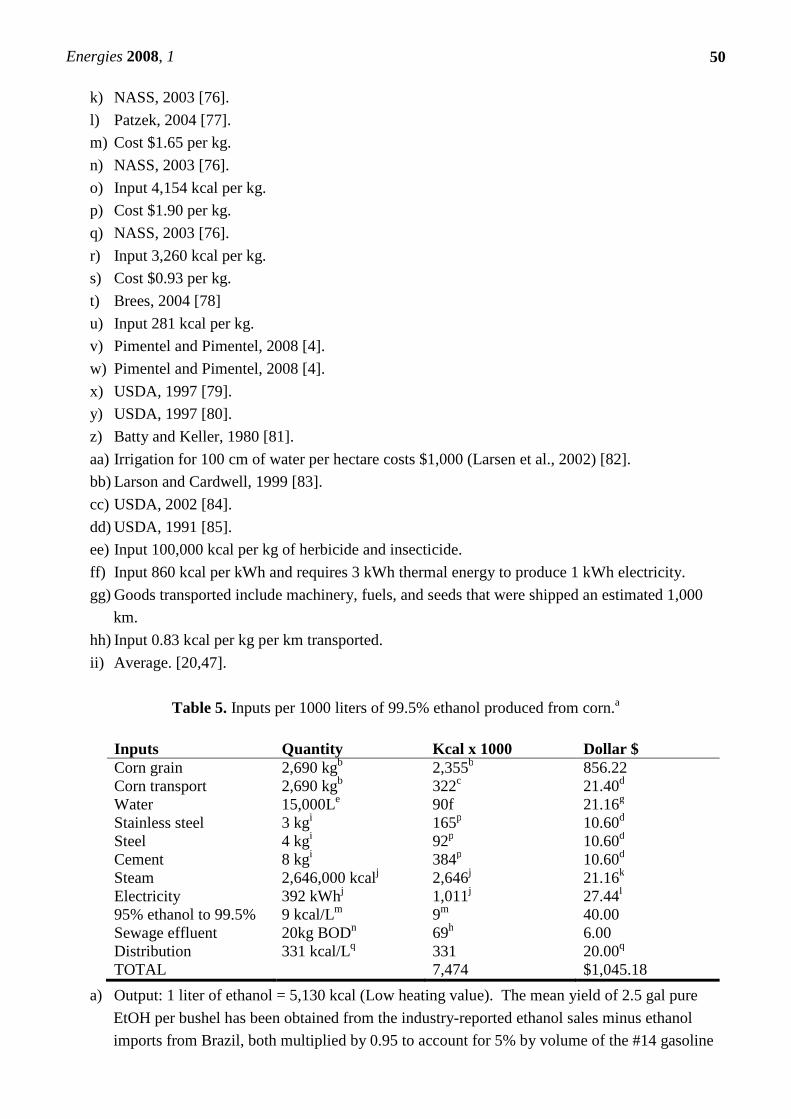
Table 5. Inputs per 1000 liters of 99.5% ethanol produced from corn.a
Inputs Quantity Kcal x 1000 Dollar $ Corn grain 2,690 kgb 2,355b 856.22 Corn transport 2,690 kgb 322c 21.40d Water 15,000Le 90f 21.16g Stainless steel 3 kgi 165p 10.60d Steel 4 kgi 92p 10.60d Cement 8 kgi 384p 10.60d Steam 2,646,000 kcalj 2,646j 21.16k Electricity 392 kWhj 1,011j 27.44l 95% ethanol to 99.5% 9 kcal/Lm 9m 40.00 Sewage effluent 20kg BODn 69h 6.00 Distribution 331 kcal/Lq 331 20.00q TOTAL 7,474 $1,045.18
a) Output: 1 liter of ethanol = 5,130 kcal (Low heating value). The mean yield of 2.5 gal pure
EtOH per bushel has been obtained from the industry-reported ethanol sales minus ethanol
imports from Brazil, both multiplied by 0.95 to account for 5% by volume of the #14 gasoline
Energies 2008, 1
51
denaturant, and the result was divided by the industry-reported bushels of corn inputs to ethanol
plants [86].
b) Data from table 4.
c) Calculated for 144 km roundtrip.
d) Pimentel, 2003 [87].
e) 15 liters of water mixed with each kg of grain.
f) Pimentel et al., 2004 [31].
g) Pimentel et al., 2004 [31].
h) 4 kWh of energy required to process 1 kg of BOD [88].
i) Estimated from the industry reported costs of $85 millions per 65 million gallons/yr dry grain
plant amortized over 30 years. The total amortized cost is $43.6/1000L EtOH, of which an
estimated $32 go to steel and cement.
j) Illinois Corn, 2004 [89]. The current estimate is below the average of 40,000 Btu/gal of
denatured ethanol paid to the Public Utilities Commission in South Dakota by ethanol plants in
2005.
k) Calculated based on coal fuel. Below the 1.95 kWh/gal of denatured EtOH in South Dakota,
see j).
l) $.07 per kWh [47].
m) 95% ethanol converted to 99.5% ethanol for addition to gasoline (T. Patzek, personal
communication, University of California, Berkeley, 2004).
n) 20 kg of BOD per 1000 liters of ethanol produced [90].
p) Newton, 2001 [91].
q) DOE, 2002 [92].
Manufacture of a liter of 99.5% ethanol uses 46% more fossil energy than it produces and costs
$1.05 per liter ($3.97 per gallon) (Table 5). The corn feedstock alone requires more than 33% of the
total energy input.
The largest energy inputs in corn-ethanol production are for producing the corn feedstock plus the
steam energy and electricity used in the fermentation/distillation process. The total energy input to
produce a liter of ethanol is 7,474 kcal (Table 5). However, a liter of ethanol has an energy value of
only 5,130 kcal. Based on a net energy loss of 2,344 kcal of ethanol produced, 46% more fossil energy
is expended than is produced as ethanol. The total cost, including the energy inputs for the
fermentation/distillation process and the apportioned energy costs of the stainless steel tanks and other
industrial materials, is $1,045 per 1000 liters of ethanol produced (Table 5).
The subsidies for corn ethanol total more than $6 billion per year (Koplow, 2006). This means that
the subsidies per liter of ethanol are 60 times greater than the subsidies per liter of gasoline. The actual
crux of state behavior regarding ethanol rests on federal subsidies. A calculation of the environmental
effects resulting from subsidizing ethanol production is difficult and the subsidy process itself is
complex and fluid. The basic methodology of such calculations, however, should be to first identify:
a) the amount and type of ethanol that would be produced in the U.S. in the absence of subsidies
and tariffs
Energies 2008, 1
52
b) the amount and type of ethanol that would be consumed in the U.S. in the absence of subsidies
and tariffs
c) the composition of energy that would most likely fill this void
d) the environmental costs and benefits of the current ethanol used in comparison to the
environmental costs and benefits of the most likely alternative energy scenario.
These calculations assume that the behavior of Americans and their overall energy is an inelastic
quantity, i.e. that energy consumption will neither increase nor decrease as a function of energy source.
This assumption likely amounts to a conservative estimate of ethanol’s environmental impact, as long
as consumption behavior can be expected to constrict in the instance of a domestic shortage of energy,
in other words, when a greater percentage of our energy comes from oil. The calculations also assume
that Americans will follow an ideal-rational behavior model and, if given the option between
purchasing ethanol and gasoline, will generally opt for whichever is cheaper. While there could be a
non-economic, normative value to ethanol, this would be nearly impossible to calculate, and could just
as easily exist as a normative value against ethanol.
In 2006, nearly 19 billion liters of ethanol were produced on 20% of U.S. corn acreage [27]. These
19 billion liters represents only 1% of total U.S. petroleum use.
However, even if we completely ignore corn ethanol’s negative energy balance and high economic
cost, we still find that it is absolutely not feasible to use ethanol as a replacement for U.S. oil
consumption. If all 341 billion kg of corn produced in the U.S. [20] were converted into ethanol at a
rate of 2.69 kg per liters of ethanol, then 129 billion liters of ethanol could be produced. This would
provide only 7% of total oil consumption in the U.S. Of course, in this situation there would be no corn
available for livestock or human consumption.
The environmental impacts of corn ethanol are enormous:
1) Corn production causes more soil erosion than any other crop grown [94].
2) Corn production uses more nitrogen fertilizer than any other crop grown and is the prime cause
of the dead zone in the Gulf of Mexico [94]. In 2006, approximately 4.7 million tons of
nitrogen was used in U.S. corn production [45]. In addition, about 1.7 million tons of
phosphorus was used in the U.S. for corn production in 2006.
3) Corn production uses more insecticides than any other crop grown [95]. (Total: 7,530 kg used
in corn in 2005 [96], or about 0.45 kg/ha.)
4) Corn production uses more herbicides than any other crop grown [77]. (Total: 186, 876 kg
applied in 2005 [96], or 6.4 kg/ha.)
5) More than 1,700 gallons of water are required to produce 1 gallon of corn ethanol [97].
6) Enormous quantities of carbon dioxide are produced during corn ethanol production by the
large quantity of fossil energy used in production, during fermentation, and when the soil is
tilled, leaving soil organic matter exposed and oxidized. In addition, the conversion of cropland
for biofuel production contributes to the release of greenhouse gases [98]. All this speeds
global warming [99].
7) Related to the total operation, including the burning of the ethanol, the air pollution problem is
significant [97, 100-102]. Burning ethanol emits pollutants into air such as peroxyacetyl nitrate
Energies 2008, 1
53
(PAN), acetaldhyde, alkylates, and nitrous oxide. These can have significant human health
effects, as well as impacts on other organisms and ecosystems [103].
8.2 Grass and Cellulosic Ethanol
Tilman et al. (2006) [104] suggest that all 235 million hectares of grassland, plus crop residues, can
be converted into cellulosic ethanol. This is a suggestion that causes concern among scientists. Tilman
et al. suggest that crop residues, like corn stover, can be harvested and utilized as a fuel source, but this
would be a disaster for the agricultural ecosystem because crop residues are vital for protecting topsoil.
Leaving the soil unprotected would intensify soil erosion by 10-fold or more [105], and may increase
soil loss as much as 100-fold [106]. Furthermore, even a partial removal of the stover can result in
increased CO2 emissions and intensify acidification and eutrophication due to increased runoff
[107,108]. Already, the U.S. crop system is losing soil 10 times faster than the sustainable rate [94].
Soil formation rates, at less than 1 t/ha/yr, are extremely slow [94,109]. Increased soil erosion caused
by the removal of crop residues for use as biofuels will facilitate the soil-carbon oxidation and
contribute to the greenhouse problem [110].
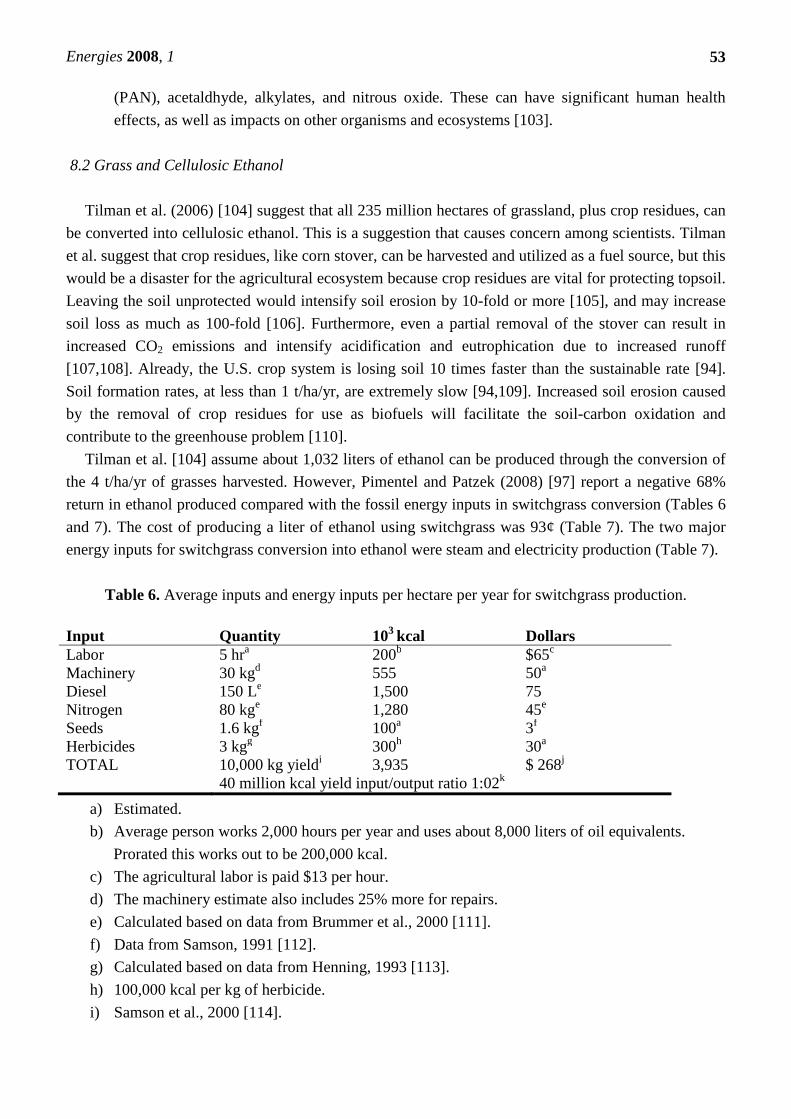
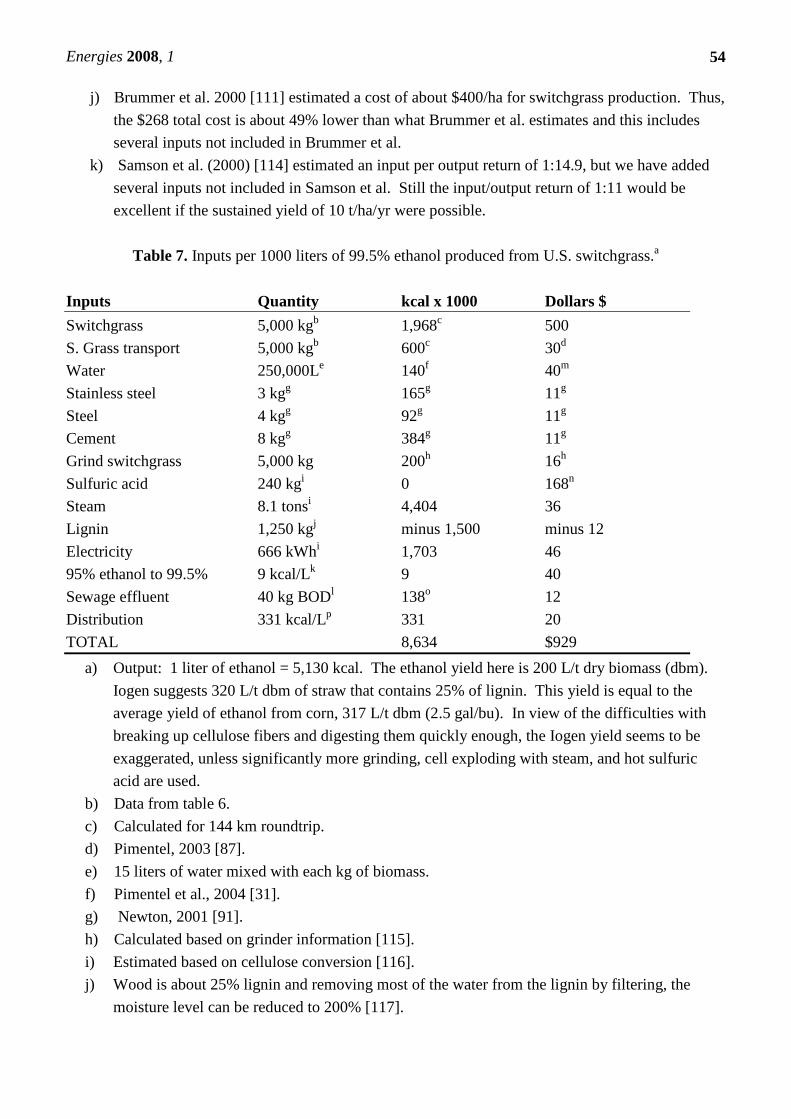
Tilman et al. [104] assume about 1,032 liters of ethanol can be produced through the conversion of
the 4 t/ha/yr of grasses harvested. However, Pimentel and Patzek (2008) [97] report a negative 68%
return in ethanol produced compared with the fossil energy inputs in switchgrass conversion (Tables 6
and 7). The cost of producing a liter of ethanol using switchgrass was 93¢ (Table 7). The two major
energy inputs for switchgrass conversion into ethanol were steam and electricity production (Table 7).
Table 6. Average inputs and energy inputs per hectare per year for switchgrass production.
Input Quantity 103 kcal Dollars Labor 5 hra 200b $65c Machinery 30 kgd 555 50a Diesel 150 Le 1,500 75 Nitrogen 80 kge 1,280 45e Seeds 1.6 kgf 100a 3f Herbicides 3 kgg 300h 30a TOTAL 10,000 kg yieldi 3,935 $ 268j 40 million kcal yield input/output ratio 1:02k
a) Estimated.
b) Average person works 2,000 hours per year and uses about 8,000 liters of oil equivalents.
Prorated this works out to be 200,000 kcal.
c) The agricultural labor is paid $13 per hour.
d) The machinery estimate also includes 25% more for repairs.
e) Calculated based on data from Brummer et al., 2000 [111].
f) Data from Samson, 1991 [112].
g) Calculated based on data from Henning, 1993 [113].
h) 100,000 kcal per kg of herbicide.
i) Samson et al., 2000 [114].
Energies 2008, 1
54
j) Brummer et al. 2000 [111] estimated a cost of about $400/ha for switchgrass production. Thus,
the $268 total cost is about 49% lower than what Brummer et al. estimates and this includes
several inputs not included in Brummer et al.
k) Samson et al. (2000) [114] estimated an input per output return of 1:14.9, but we have added
several inputs not included in Samson et al. Still the input/output return of 1:11 would be
excellent if the sustained yield of 10 t/ha/yr were possible.
Table 7. Inputs per 1000 liters of 99.5% ethanol produced from U.S. switchgrass.a
Inputs Quantity kcal x 1000 Dollars $
Switchgrass 5,000 kgb 1,968c 500
S. Grass transport 5,000 kgb 600c 30d
Water 250,000Le 140f 40m
Stainless steel 3 kgg 165g 11g
Steel 4 kgg 92g 11g
Cement 8 kgg 384g 11g
Grind switchgrass 5,000 kg 200h 16h
Sulfuric acid 240 kgi 0 168n
Steam 8.1 tonsi 4,404 36
Lignin 1,250 kgj minus 1,500 minus 12
Electricity 666 kWhi 1,703 46
95% ethanol to 99.5% 9 kcal/Lk 9 40
Sewage effluent 40 kg BODl 138o 12
Distribution 331 kcal/Lp 331 20
TOTAL 8,634 $929
a) Output: 1 liter of ethanol = 5,130 kcal. The ethanol yield here is 200 L/t dry biomass (dbm).
Iogen suggests 320 L/t dbm of straw that contains 25% of lignin. This yield is equal to the
average yield of ethanol from corn, 317 L/t dbm (2.5 gal/bu). In view of the difficulties with
breaking up cellulose fibers and digesting them quickly enough, the Iogen yield seems to be
exaggerated, unless significantly more grinding, cell exploding with steam, and hot sulfuric
acid are used.
b) Data from table 6.
c) Calculated for 144 km roundtrip.
d) Pimentel, 2003 [87].
e) 15 liters of water mixed with each kg of biomass.
f) Pimentel et al., 2004 [31].
g) Newton, 2001 [91].
h) Calculated based on grinder information [115].
i) Estimated based on cellulose conversion [116].
j) Wood is about 25% lignin and removing most of the water from the lignin by filtering, the
moisture level can be reduced to 200% [117].
Energies 2008, 1
55
k) 95% ethanol converted to 99.5% ethanol for addition to gasoline (T. Patzek, personal
communication, University of California, Berkeley, 2004).
l) 20 kg of BOD per 1000 liters of ethanol produced [90].
m) Pimentel, 2003 [87].
n) Sulfuric acid sells for $7 per kg.
o) 4 kWh of energy required to process 1 kg of BOD (Blais et al., 1995) [88].
p) DOE, 2002 [92].
Converting all 235 million ha of U.S. grassland into ethanol at the optimistic rate by Tilman et al.
would provide only 12% of annual consumption of U.S. oil [20,27]. Sound data, however, confirm that
the output in ethanol would require 1.5 liters of oil equivalents to produce 1 liter of ethanol (Tables 6
and 7). In addition, to achieve the production of this much ethanol, we would have to displace the 100
million cattle, 7 million sheep, and 4 million horses that are now grazing on 324 million ha of U.S.
grassland and rangeland [20]. Already, overgrazing is a serious problem on U.S. grassland and a
similar problem exists worldwide [118]. Thus, the assessment of the quantity of ethanol that can be
produced on U.S. and world grasslands by Tilman et al. (2006) [104] appears to be unduly optimistic.
Several problems exist the conversion of cellulosic biomass into ethanol. First, it takes from 2 to 5
times more cellulosic biomass to achieve the same quantity of starches and sugars as are found in the
same quantity of corn grain. Thus, 2 to 5 times more cellulosic material must be produced and handled
compared with corn grain. In addition, the starches and sugars are tightly held in lignin in the
cellulosic biomass. The starches and sugars can be released using a strong acid to dissolve the lignin.
Once the lignin is dissolved the acid action is stopped with an alkali. Now the solution of lignin,
starches, and sugars can be fermented.
Some claim that the lignin can be used as a fuel. Clearly, this would not be when dissolved in water.
The lignin in the water mixture can be extracted using various energy intensive technologies. Usually
less than 25% of the lignin can be extracted from the water mixture [97].
8.3 Methanol
Methanol can be produced from a gasifier-pyrolysis reactor using biomass as a feedstock [119,120].
The yield from 1 ton of dry wood is about 370 liters of methanol [121,122]. For a plant with
economies of scale to operate efficiently, more than 1.5 million ha of sustainable forest would be
required to supply this woody biomass annually [36]. However, biomass is not available in such
enormous quantities, even from extensive forests, at acceptable prices for methanol to compete as a
viable energy source. Most methanol today is produced from natural gas, not biomass [123]. About
10,402 kcal are required to produce 1 liter of methanol that contains 7,430 kcal.
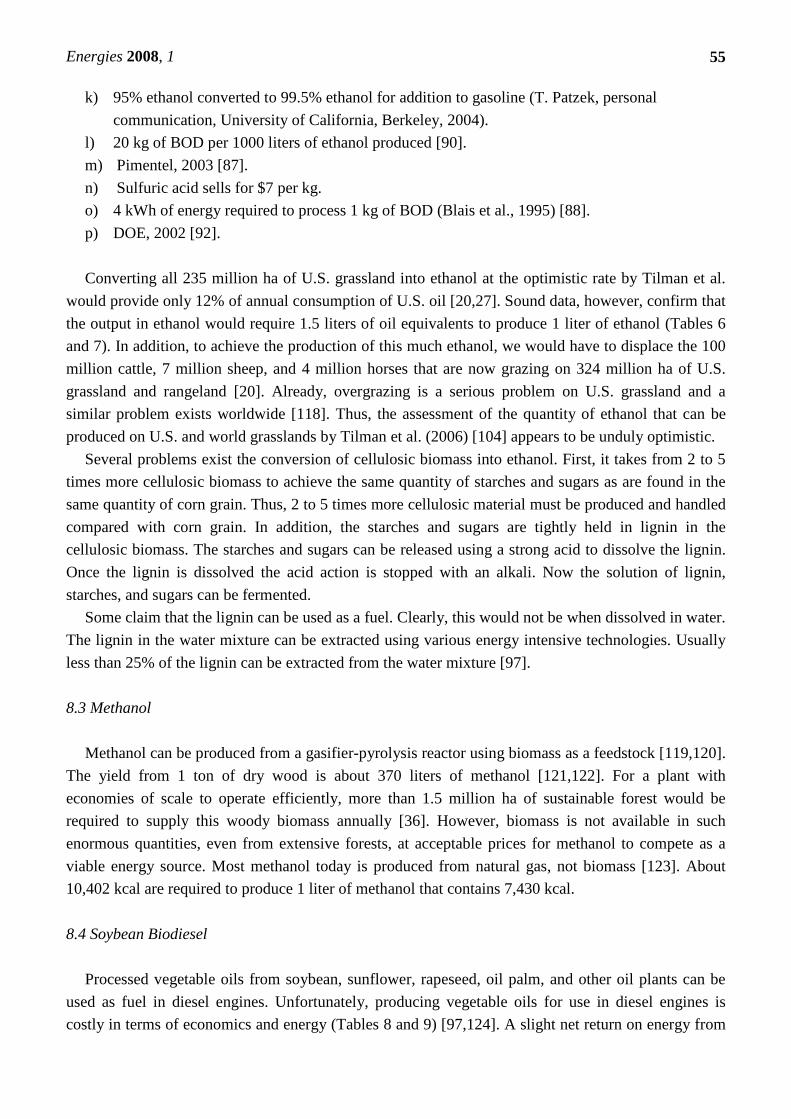
8.4 Soybean Biodiesel
Processed vegetable oils from soybean, sunflower, rapeseed, oil palm, and other oil plants can be
used as fuel in diesel engines. Unfortunately, producing vegetable oils for use in diesel engines is
costly in terms of economics and energy (Tables 8 and 9) [97,124]. A slight net return on energy from
Energies 2008, 1
56
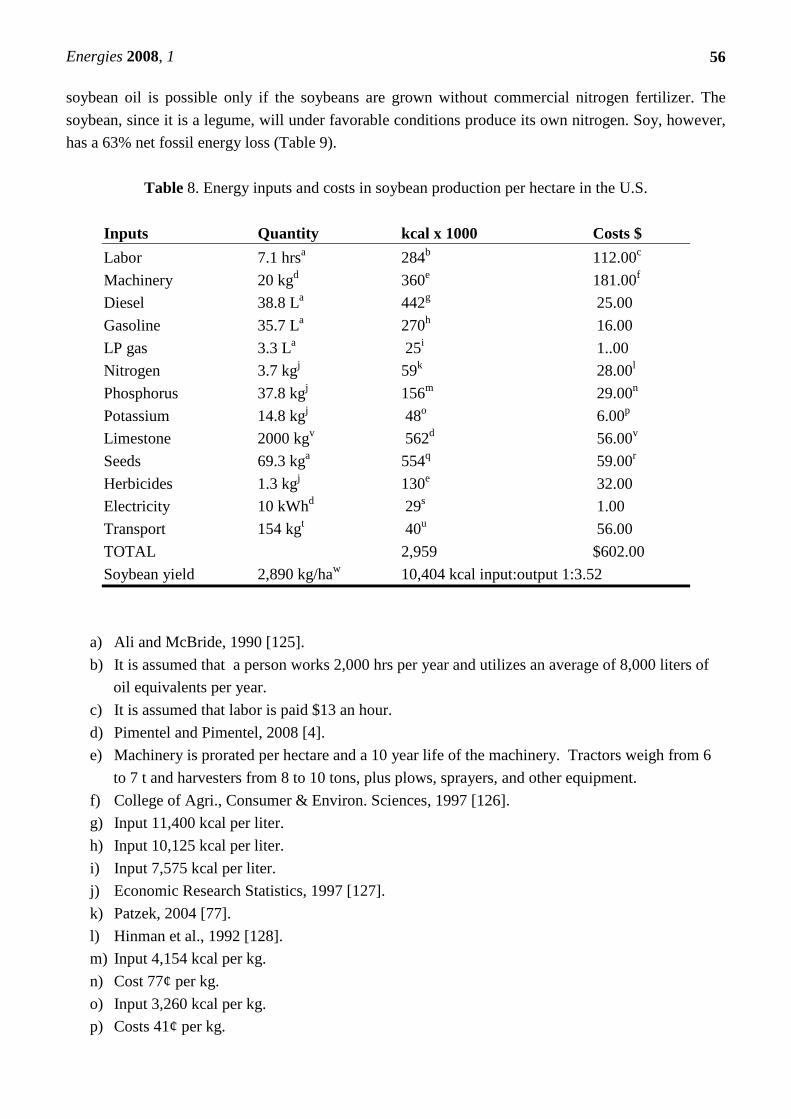
soybean oil is possible only if the soybeans are grown without commercial nitrogen fertilizer. The
soybean, since it is a legume, will under favorable conditions produce its own nitrogen. Soy, however,
has a 63% net fossil energy loss (Table 9).
Table 8. Energy inputs and costs in soybean production per hectare in the U.S.
Inputs Quantity kcal x 1000 Costs $
Labor 7.1 hrsa 284b 112.00c
Machinery 20 kgd 360e 181.00f
Diesel 38.8 La 442g 25.00
Gasoline 35.7 La 270h 16.00
LP gas 3.3 La 25i 1..00
Nitrogen 3.7 kgj 59k 28.00l
Phosphorus 37.8 kgj 156m 29.00n
Potassium 14.8 kgj 48o 6.00p
Limestone 2000 kgv 562d 56.00v
Seeds 69.3 kga 554q 59.00r
Herbicides 1.3 kgj 130e 32.00
Electricity 10 kWhd 29s 1.00
Transport 154 kgt 40u 56.00
TOTAL 2,959 $602.00
Soybean yield 2,890 kg/haw 10,404 kcal input:output 1:3.52
a) Ali and McBride, 1990 [125].
b) It is assumed that a person works 2,000 hrs per year and utilizes an average of 8,000 liters of
oil equivalents per year.
c) It is assumed that labor is paid $13 an hour.
d) Pimentel and Pimentel, 2008 [4].
e) Machinery is prorated per hectare and a 10 year life of the machinery. Tractors weigh from 6
to 7 t and harvesters from 8 to 10 tons, plus plows, sprayers, and other equipment.
f) College of Agri., Consumer & Environ. Sciences, 1997 [126].
g) Input 11,400 kcal per liter.
h) Input 10,125 kcal per liter.
i) Input 7,575 kcal per liter.
j) Economic Research Statistics, 1997 [127].
k) Patzek, 2004 [77].
l) Hinman et al., 1992 [128].
m) Input 4,154 kcal per kg.
n) Cost 77¢ per kg.
o) Input 3,260 kcal per kg.
p) Costs 41¢ per kg.
Energies 2008, 1
57
q) Pimentel et al., 2002 [129].
r) Costs about 85¢ per kg.
s) Input 860 kcal per kWh and requires 3 kWh thermal energy to produce 1 kWh electricity.
t) Goods transported include machinery, fuels, and seeds that were shipped an estimated 1,000
km.
u) Input 0.83 kcal per kg per km transported.
v) Mississippi State University Extension Service, 1999 [130].
w) USDA, 2004 [131].
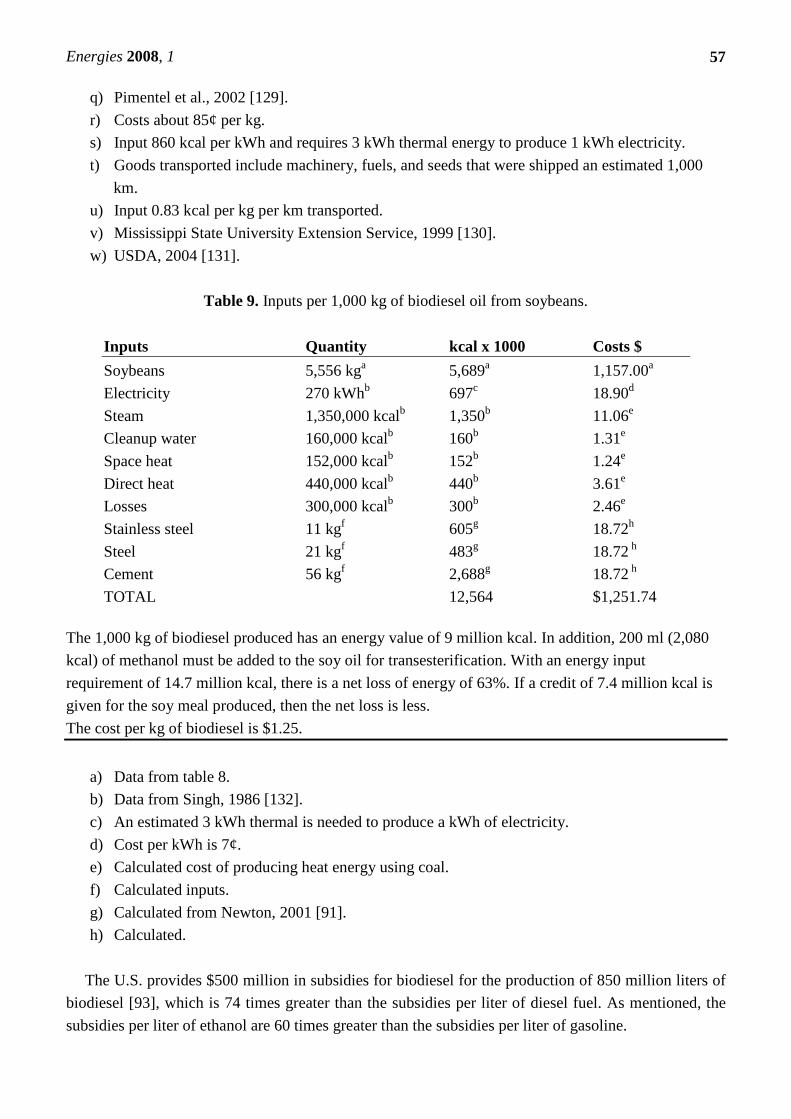
Table 9. Inputs per 1,000 kg of biodiesel oil from soybeans.
Inputs Quantity kcal x 1000 Costs $
Soybeans 5,556 kga 5,689a 1,157.00a
Electricity 270 kWhb 697c 18.90d
Steam 1,350,000 kcalb 1,350b 11.06e
Cleanup water 160,000 kcalb 160b 1.31e
Space heat 152,000 kcalb 152b 1.24e
Direct heat 440,000 kcalb 440b 3.61e
Losses 300,000 kcalb 300b 2.46e
Stainless steel 11 kgf 605g 18.72h
Steel 21 kgf 483g 18.72 h
Cement 56 kgf 2,688g 18.72 h
TOTAL 12,564 $1,251.74
The 1,000 kg of biodiesel produced has an energy value of 9 million kcal. In addition, 200 ml (2,080
kcal) of methanol must be added to the soy oil for transesterification. With an energy input
requirement of 14.7 million kcal, there is a net loss of energy of 63%. If a credit of 7.4 million kcal is
given for the soy meal produced, then the net loss is less.
The cost per kg of biodiesel is $1.25.
a) Data from table 8.
b) Data from Singh, 1986 [132].
c) An estimated 3 kWh thermal is needed to produce a kWh of electricity.
d) Cost per kWh is 7¢.
e) Calculated cost of producing heat energy using coal.
f) Calculated inputs.
g) Calculated from Newton, 2001 [91].
h) Calculated.
The U.S. provides $500 million in subsidies for biodiesel for the production of 850 million liters of
biodiesel [93], which is 74 times greater than the subsidies per liter of diesel fuel. As mentioned, the
subsidies per liter of ethanol are 60 times greater than the subsidies per liter of gasoline.
Energies 2008, 1
58
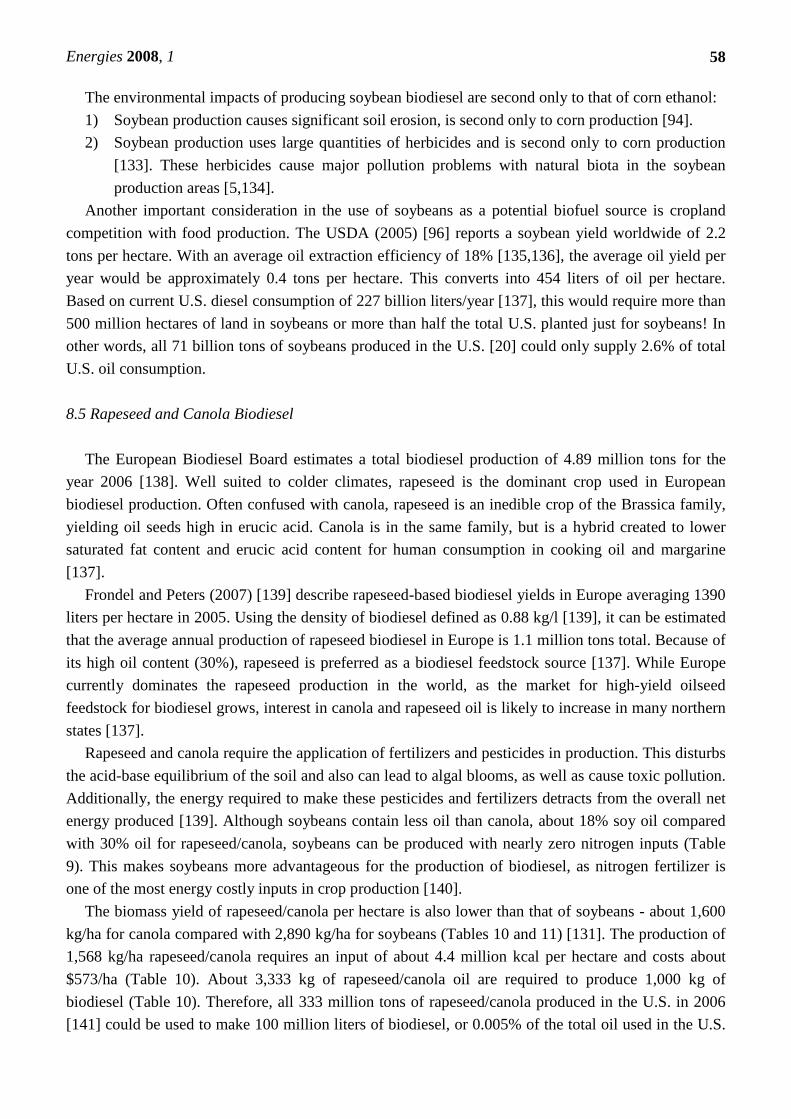
The environmental impacts of producing soybean biodiesel are second only to that of corn ethanol:
1) Soybean production causes significant soil erosion, is second only to corn production [94].
2) Soybean production uses large quantities of herbicides and is second only to corn production
[133]. These herbicides cause major pollution problems with natural biota in the soybean
production areas [5,134].
Another important consideration in the use of soybeans as a potential biofuel source is cropland
competition with food production. The USDA (2005) [96] reports a soybean yield worldwide of 2.2
tons per hectare. With an average oil extraction efficiency of 18% [135,136], the average oil yield per
year would be approximately 0.4 tons per hectare. This converts into 454 liters of oil per hectare.
Based on current U.S. diesel consumption of 227 billion liters/year [137], this would require more than
500 million hectares of land in soybeans or more than half the total U.S. planted just for soybeans! In
other words, all 71 billion tons of soybeans produced in the U.S. [20] could only supply 2.6% of total
U.S. oil consumption.
8.5 Rapeseed and Canola Biodiesel
The European Biodiesel Board estimates a total biodiesel production of 4.89 million tons for the
year 2006 [138]. Well suited to colder climates, rapeseed is the dominant crop used in European
biodiesel production. Often confused with canola, rapeseed is an inedible crop of the Brassica family,
yielding oil seeds high in erucic acid. Canola is in the same family, but is a hybrid created to lower
saturated fat content and erucic acid content for human consumption in cooking oil and margarine
[137]. Frondel and Peters (2007) [139] describe rapeseed-based biodiesel yields in Europe averaging 1390
liters per hectare in 2005. Using the density of biodiesel defined as 0.88 kg/l [139], it can be estimated
that the average annual production of rapeseed biodiesel in Europe is 1.1 million tons total. Because of
its high oil content (30%), rapeseed is preferred as a biodiesel feedstock source [137]. While Europe
currently dominates the rapeseed production in the world, as the market for high-yield oilseed
feedstock for biodiesel grows, interest in canola and rapeseed oil is likely to increase in many northern
states [137].
Rapeseed and canola require the application of fertilizers and pesticides in production. This disturbs
the acid-base equilibrium of the soil and also can lead to algal blooms, as well as cause toxic pollution.
Additionally, the energy required to make these pesticides and fertilizers detracts from the overall net
energy produced [139]. Although soybeans contain less oil than canola, about 18% soy oil compared
with 30% oil for rapeseed/canola, soybeans can be produced with nearly zero nitrogen inputs (Table
9). This makes soybeans more advantageous for the production of biodiesel, as nitrogen fertilizer is
one of the most energy costly inputs in crop production [140].
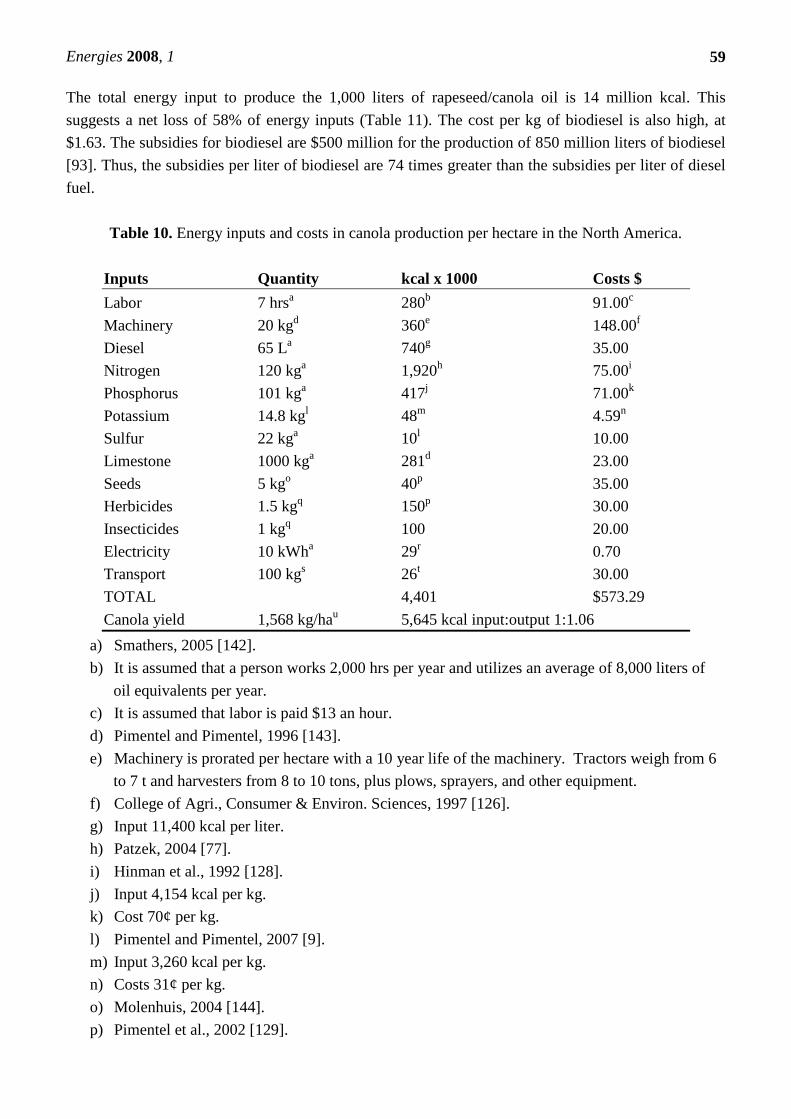
The biomass yield of rapeseed/canola per hectare is also lower than that of soybeans - about 1,600
kg/ha for canola compared with 2,890 kg/ha for soybeans (Tables 10 and 11) [131]. The production of
1,568 kg/ha rapeseed/canola requires an input of about 4.4 million kcal per hectare and costs about
$573/ha (Table 10). About 3,333 kg of rapeseed/canola oil are required to produce 1,000 kg of
biodiesel (Table 10). Therefore, all 333 million tons of rapeseed/canola produced in the U.S. in 2006
[141] could be used to make 100 million liters of biodiesel, or 0.005% of the total oil used in the U.S.
Energies 2008, 1
59
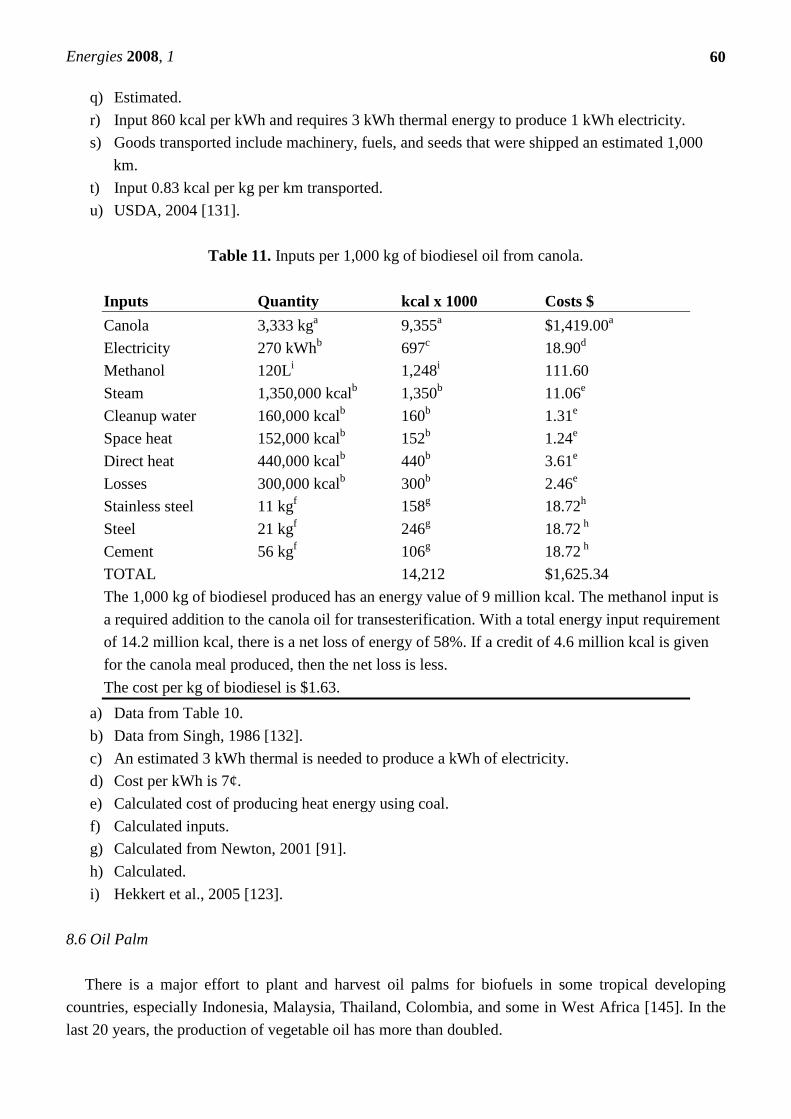
The total energy input to produce the 1,000 liters of rapeseed/canola oil is 14 million kcal. This
suggests a net loss of 58% of energy inputs (Table 11). The cost per kg of biodiesel is also high, at
$1.63. The subsidies for biodiesel are $500 million for the production of 850 million liters of biodiesel
[93]. Thus, the subsidies per liter of biodiesel are 74 times greater than the subsidies per liter of diesel
fuel.
Table 10. Energy inputs and costs in canola production per hectare in the North America.
Inputs Quantity kcal x 1000 Costs $
Labor 7 hrsa 280b 91.00c
Machinery 20 kgd 360e 148.00f
Diesel 65 La 740g 35.00
Nitrogen 120 kga 1,920h 75.00i
Phosphorus 101 kga 417j 71.00k
Potassium 14.8 kgl 48m 4.59n
Sulfur 22 kga 10l 10.00
Limestone 1000 kga 281d 23.00
Seeds 5 kgo 40p 35.00
Herbicides 1.5 kgq 150p 30.00
Insecticides 1 kgq 100 20.00
Electricity 10 kWha 29r 0.70
Transport 100 kgs 26t 30.00
TOTAL 4,401 $573.29
Canola yield 1,568 kg/hau 5,645 kcal input:output 1:1.06
a) Smathers, 2005 [142].
b) It is assumed that a person works 2,000 hrs per year and utilizes an average of 8,000 liters of
oil equivalents per year.
c) It is assumed that labor is paid $13 an hour.
d) Pimentel and Pimentel, 1996 [143].
e) Machinery is prorated per hectare with a 10 year life of the machinery. Tractors weigh from 6
to 7 t and harvesters from 8 to 10 tons, plus plows, sprayers, and other equipment.
f) College of Agri., Consumer & Environ. Sciences, 1997 [126].
g) Input 11,400 kcal per liter.
h) Patzek, 2004 [77].
i) Hinman et al., 1992 [128].
j) Input 4,154 kcal per kg.
k) Cost 70¢ per kg.
l) Pimentel and Pimentel, 2007 [9].
m) Input 3,260 kcal per kg.
n) Costs 31¢ per kg.
o) Molenhuis, 2004 [144].
p) Pimentel et al., 2002 [129].
Energies 2008, 1
60
q) Estimated.
r) Input 860 kcal per kWh and requires 3 kWh thermal energy to produce 1 kWh electricity.
s) Goods transported include machinery, fuels, and seeds that were shipped an estimated 1,000
km.
t) Input 0.83 kcal per kg per km transported.
u) USDA, 2004 [131].
Table 11. Inputs per 1,000 kg of biodiesel oil from canola.
Inputs Quantity kcal x 1000 Costs $
Canola 3,333 kga 9,355a $1,419.00a
Electricity 270 kWhb 697c 18.90d
Methanol 120Li 1,248i 111.60
Steam 1,350,000 kcalb 1,350b 11.06e
Cleanup water 160,000 kcalb 160b 1.31e
Space heat 152,000 kcalb 152b 1.24e
Direct heat 440,000 kcalb 440b 3.61e
Losses 300,000 kcalb 300b 2.46e
Stainless steel 11 kgf 158g 18.72h
Steel 21 kgf 246g 18.72 h
Cement 56 kgf 106g 18.72 h
TOTAL 14,212 $1,625.34
The 1,000 kg of biodiesel produced has an energy value of 9 million kcal. The methanol input is
a required addition to the canola oil for transesterification. With a total energy input requirement
of 14.2 million kcal, there is a net loss of energy of 58%. If a credit of 4.6 million kcal is given
for the canola meal produced, then the net loss is less.
The cost per kg of biodiesel is $1.63.
a) Data from Table 10.
b) Data from Singh, 1986 [132].
c) An estimated 3 kWh thermal is needed to produce a kWh of electricity.
d) Cost per kWh is 7¢.
e) Calculated cost of producing heat energy using coal.
f) Calculated inputs.
g) Calculated from Newton, 2001 [91].
h) Calculated.
i) Hekkert et al., 2005 [123].
8.6 Oil Palm
There is a major effort to plant and harvest oil palms for biofuels in some tropical developing
countries, especially Indonesia, Malaysia, Thailand, Colombia, and some in West Africa [145]. In the
last 20 years, the production of vegetable oil has more than doubled.

Energies 2008, 1
61
Palm oil makes up 30%, over 35% when including palm kernel oil, of biological oils and fats
produced worldwide [146]. Global oil palm production for the U.S. Department of Agricultures’ 2007-
2008 growing season totaled more than 45.3 million tons; of which about 4.7 million metric tons was
palm kernel oil [146]. Indonesia and Malaysia are the world’s leading producers. Together these
countries total over 84% of global palm oil production [147]. Relative to the world total agricultural
oil, over 84% is palm oil production [147]. Relative to world total agricultural oil export, both
Indonesia and Malaysia lead country exports with 15% and 14% respectively, the dominant majority
of which is palm oil [146].
The oil palm once established (after 4 years) will produce about 4,000 kg of oil per hectare per year
[148]. The energy inputs for maintaining the hectare of oil palm are indicated in Table 12. The data
suggest that about 7.4 million kcal are required to produce 26,000 kg of palm oil bunches. This 26,000
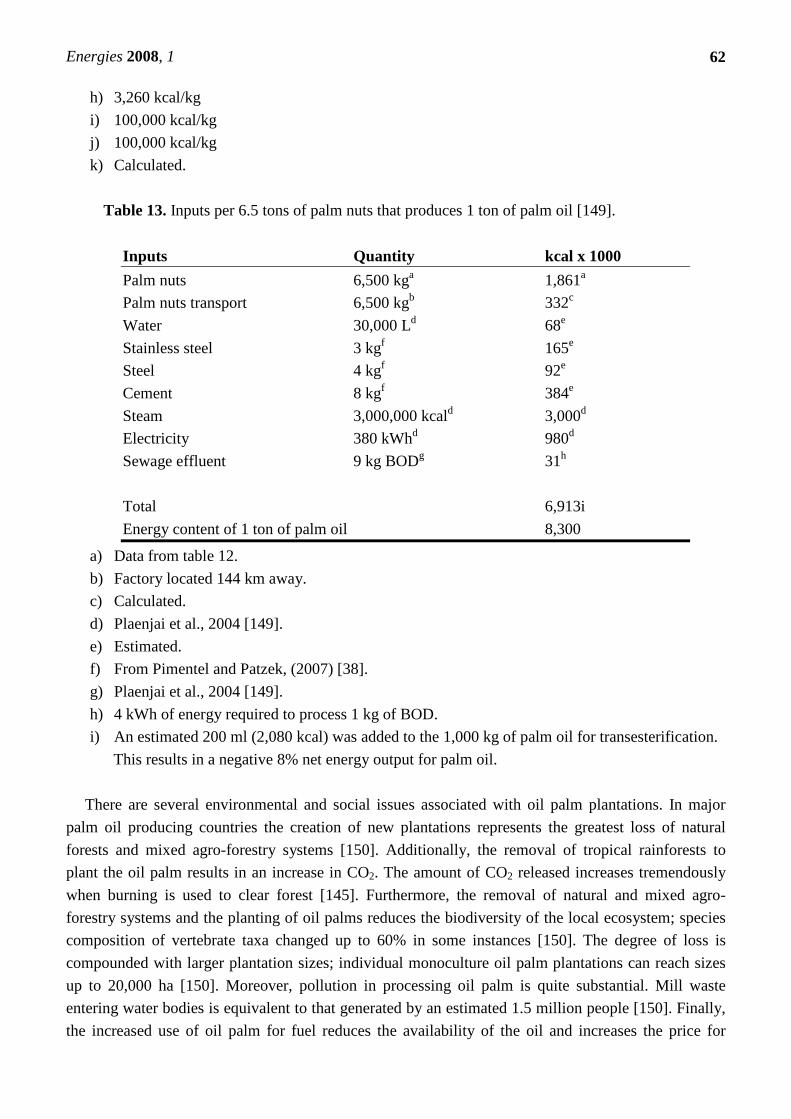
kg is a sufficient quantity of palm nuts to produce 4,000 kg of palm oil. A total of 6.9 million kcal are
required to process 6,500 kg of palm nuts to produce 1 ton of palm oil (Table 13). Thus, the net return
on fossil energy invested in production and processing totals 30%, which is clearly a better return than
corn ethanol and soybean biodiesel. However, an estimated 200 ml (2,080 kcal) of methanol is a
required addition to the 1,000 kg of palm oil, for transesterification. This results in a negative 8% net
energy output for palm oil (Table 13).
Table 12. Energy inputs for palm oil production in Thailand and Indonesia.
Inputs Quantity kcal x 1000
Labor 1,000 hrsa 700b
Machinery 55 kgc 1,018c
Diesel 130 Ld 1,430e
Nitrogen 150 kgd 2,400f
Phosphorus 81 kgd 336g
Potassium 206 kgd 672h
Magnesium 56 kgd 400a
Irrigation 8 cmd 320a
Herbicides 4.0 kgd 400i
Insecticides 1.0 kgd 100j
Transport 200 kga 166k
Total 7,445
Palm Oil Bunches 26,000 kgd
a) Estimated.
b) BP World Energy, 2005 [29].
c) Estimated.
d) Pleanjai et al., 2004 [149].
e) 11,430 kcal
f) 16,000 kcal/kg
g) 4,154 kcal/kg
Energies 2008, 1
62
h) 3,260 kcal/kg
i) 100,000 kcal/kg
j) 100,000 kcal/kg
k) Calculated.
Table 13. Inputs per 6.5 tons of palm nuts that produces 1 ton of palm oil [149].
Inputs Quantity kcal x 1000
Palm nuts 6,500 kga 1,861a
Palm nuts transport 6,500 kgb 332c
Water 30,000 Ld 68e
Stainless steel 3 kgf 165e
Steel 4 kgf 92e
Cement 8 kgf 384e
Steam 3,000,000 kcald 3,000d
Electricity 380 kWhd 980d
Sewage effluent 9 kg BODg 31h
Total 6,913i
Energy content of 1 ton of palm oil 8,300
a) Data from table 12.
b) Factory located 144 km away.
c) Calculated.
d) Plaenjai et al., 2004 [149].
e) Estimated.
f) From Pimentel and Patzek, (2007) [38].
g) Plaenjai et al., 2004 [149].
h) 4 kWh of energy required to process 1 kg of BOD.
i) An estimated 200 ml (2,080 kcal) was added to the 1,000 kg of palm oil for transesterification.
This results in a negative 8% net energy output for palm oil.
There are several environmental and social issues associated with oil palm plantations. In major
palm oil producing countries the creation of new plantations represents the greatest loss of natural
forests and mixed agro-forestry systems [150]. Additionally, the removal of tropical rainforests to
plant the oil palm results in an increase in CO2. The amount of CO2 released increases tremendously
when burning is used to clear forest [145]. Furthermore, the removal of natural and mixed agro-
forestry systems and the planting of oil palms reduces the biodiversity of the local ecosystem; species
composition of vertebrate taxa changed up to 60% in some instances [150]. The degree of loss is
compounded with larger plantation sizes; individual monoculture oil palm plantations can reach sizes
up to 20,000 ha [150]. Moreover, pollution in processing oil palm is quite substantial. Mill waste
entering water bodies is equivalent to that generated by an estimated 1.5 million people [150]. Finally,
the increased use of oil palm for fuel reduces the availability of the oil and increases the price for
Energies 2008, 1
63
human use [145]. Oil Palm production has a better net fossil energy return than many competing
biofuel crops. However, production is accompanied by various social, health, and environmental
consequences.
8.7 Jatropha
Jatropha is receiving a great deal of attention now as new source of biodiesel. The shrub, endemic
to Mexico [151], produces seeds that are 30% oil, which is excellent for biofuel use. The shrub will
grow in heavy rainfall regions as well as in arid regions. In arid regions, the yield is reduced to only
0.5 tons/ha per year [152]. A potential benefit of Jatropha is that it cannot be used for a food crop. This
allows the plant to be grown only for fuel. The most serious drawback to the shrub as a biofuel is that
it is highly toxic to humans and livestock, plus it uses land and water resources that are critical for food
crop production [153]. Therefore, further research is necessary to evaluate the long-term safety of
producing, handling, and processing this feedstock.
9. Algae for Oil Production
Some cultures of algae consist of 30% to 50% oil [154]. Thus, there is growing interest using algae
to increase U.S. oil supply based on the theoretical claims that 47,000 to 308,000 liters/hectare/year
(5,000 to 33,000 gallons/acre) of oil could be produced using algae [155,156]. The calculated cost per
barrel would be $15 [157]. Currently, oil in the U.S. market is selling for over $100 per barrel. If the
production and price of oil produced from algae were true, U.S. annual oil needs could theoretically be
met if 100% of all U.S. land were in algal culture!
Despite all the algae-related research and claims dating back to 1970’s, none of the projected algae
and oil yields has been achieved [154]. To the contrary, one calculated estimate based on all the
included costs using algae would be $800 per barrel, not $15 per barrel, as mentioned. Algae, like all
plants, require large quantities of nitrogen fertilizer and water. In addition, significant fossil energy
inputs would be needed for the functioning production system [158].
One difficulty in culturing algae is that the algae shade one another’s cells. There are, therefore,
different levels of light saturation in the cultures, even under optimal conditions such as in Florida
[159]. These differences influence the rate of growth of the algae. In addition, wild strains of algae
sometimes invade and dominate the algae culture strains, causing a decrease in oil production by the
algae [159].
Another major problem with the culture of algae in ponds or tanks, is the harvesting of the algae.
Since algae consist mostly of water, harvesting algae from the cultural tanks and separating the oil
from the algae are difficult and energy intensive processes. This problem was observed at the
University of Florida (Gainesville) when algae were being cultured in managed ponds for the
production of nutrients for hogs. After two years, the unsuccessful algal-nutrient culture was
abandoned.
The best algal biomass yields under tropical conditions are about 50 t/ha/yr [159]. However, the
highest yield of alga biomass produced per hectare, based on theoretical calculation, is 681 tons/ha/yr
[156]. For comparison, the total yield for rice (including rice and straw) grown in the tropics is nearly
Energies 2008, 1
64
50 t/ha/yr of continuous culture [160]. Rice production in the tropics can produce 3 crops on the same
hectare of land per year requiring about 400 kg/ha of nitrogen fertilizer and 240 million liters of water
[160]. Obviously, a great deal of laboratory and field research is needed for the algae and oil
theoretical system.
10. Impacts of Culturing Crops and Grasses for Biofuels
Managing crops and grasses for biofuels results in many and varied environmental impacts to the
land, water, and biodiversity. Some impacts of biofuel crop production on soil erosion and air pollution
are discussed below.
10.1 Soil Erosion Associated with Biofuels
Soil erosion and land degradation are of particular concern to agriculturalists and foresters because
of increasing biofuel production. Serious soil erosion is taking place in U.S. agricultural systems, with
an estimated soil loss that is 11 times faster than a sustainable rate [161]. The prime cause of high
erosion rates in the U.S. is due to the depletion of biomass cover that protects the soil from rainfall and
wind energy. In particular, row crops such as corn and soybeans are particularly susceptible to erosion
[5]. Tilling the soil for planting of row crops leaves the soil unprotected from wind and rainfall. After
harvesting, soybeans have little crop residue which covers only 20% of the cropland. Corn stover
covers about 60% of the land after harvest [162].
The intensive application of nitrogen fertilizers in corn production was perceived to sequester soil
organic carbon in the soil. However, after a 40 to 50 year application of synthetic nitrogen fertilizer in
Illinois, a net decline occurred in soil carbon despite the massive residue incorporation into the soil
[163].
Some investigators, like Tilman et al. (2006) [104] and Perlack et al. (2005) [164], suggest that crop
residues can be harvested for biofuel production. If this is done, soil erosion, with the removal of crop
residues, will increase from 10-fold to 100-fold [165]. Removing crop residues would therefore
devastate U.S. agriculture.
Close grown crops, like wheat with an average yield of 7 t/ha/yr, protect the soil from erosion with
an erosion rate of about 5 t/ha/yr. This is better than the soil erosion rate of row crops, like corn, with
an average soil erosion rate of 15 t/ha/yr [109]. After germinating, spring wheat has an early, fast
growing development of a relatively dense stand of vegetation cover of 150 to 200 plants/m2 that is
capable of protecting the soil from rain and wind energy. Unfortunately, wheat is not a good biofuel
crop because of its low yield [20].
Some crops, such as grass, provide nearly complete cover of the soil once established. These crops
are usually grown as perennials and cover the soil all year for about 5-year periods. The soil erosion
rate from continuous grass is reported to lose soil at only 0.1 to 1 t/ha/yr [110]. Yet, grass and other
such crops are unfortunately not generally productive as biofuel crops.
Some biofuel crops, like sugarcane, have high soil erosion rates, which are reported to be about 148
t/ha/yr in Australia [166].
Energies 2008, 1
65
No-till and ridge-till planting of corn and similar crops will reduce the soil erosion rates from 18
t/ha/yr to 2 t/ha/yr [167]. Herbicides and other pesticides are needed in no-till corn production, but
with ridge-till herbicides may not be necessary.
In addition, the water-holding capacity and nutrient levels of the soil decline when erosion occurs.
With conventional corn production, erosion reduced the volume of moisture in the soil about 50%
compared with organic corn production [168].
When conservation technologies, like organic agriculture, are employed, increased yields may
result because water, nutrients, and soil organic matter are retained. For example, in Pennsylvania,
yields of corn and soybeans were 33% to 50% higher in the organic systems when soil organic matter
increased in the organic systems over time even when drought conditions occurred [168].
In the U.S., annual estimates of soil loss were estimated to be 1 to 2 billion tons per year, and 10
years later the erosion rate had increased to 3 billion tons annually [169].
Undisturbed forests often have a dense cover over the soil consisting of leaves, twigs, and other
organic matter; these forest ecosystems have soil erosion rates that typically range from less than 0.1
t/ha/yr to 0.2 t/ha/yr [5]. The combination of organic mulch, tree cover, and tree roots makes most
natural forest soils, even on steep slopes of 70%, resistant to erosion and rapid water runoff. Forests
lose significant quantities of water, soil, and nutrients when cut and harvested [170]. In addition,
erosion rates increase. Therefore, the use of forests for producing biofuels will increase rates of soil
erosion. However, short-rotation woody-crops have been shown to improve groundwater quality and
soil-water runoff in comparison to row crops [171].
10.2 Air Pollution
Smoke produced when fuelwood and crop biomass are burned is a serious pollution hazard because
of the nitrogen, particulates, and other chemicals in the smoke. Although only 3% of U.S. heating
energy comes from wood, about 15% of the air pollutants in the U.S. are produced from the burning of
wood [172]. Emissions from burning wood and other biomass are a threat to public health because of
the highly respirable nature of the more than 200 chemicals that the emissions contain [173].
Of special concern are the relatively high concentrations of potentially carcinogenic poly cyclic
organic compounds (POMs, e.g. benzo{a}pyrene) and particulates. Sulfur and nitrogen oxides, carbon
monoxide, and aldehydes are also released, but usually in smaller quantities. According to Naeher et
al. (2007) [173], wood smoke contains an estimated 14 carcinogens and 4 co-carcinogens. Great
concern is expressed for the 4 billion people in developing countries who cook and heat with wood and
crop residues [6].
The burning of ethanol in automobiles also causes major pollution problems. Ethanol has only 66%
of the energy that gasoline has and, therefore, significantly more fuel has to be burned to travel the
same distance as gasoline [97]. In addition, ethanol produces more nitrous oxides and ozone than
gasoline as measured from the exhausts of automobiles [100,101]. These are serious air pollutants
affecting human health, and these pollutants and their impact on human health were recently
confirmed in new studies by Jacobson [102].
In addition, ethanol and other biofuels exacerbate the current global warming situation worse.
Nobel chemist Paul J. Crutzen [174] reported that biofuels made from corn and rapeseed release about
twice as many nitrous oxides as previously reported. The authors of the report from the University of
Energies 2008, 1
66
Edinburg, conclude that growing biofuels is probably of no benefit and is actually making the climate
situation worse.
11. Conclusion
The rapidly growing world population and rising consumption of fossil fuels is increasing demand
for both food and biofuels. This will exaggerate both food and fuel shortages. Producing biofuels
requires huge amounts of both fossil energy and food resources, which will intensify conflicts among
these resources.
Using food crops such as corn grain to produce ethanol raises major nutritional and ethical
concerns. Nearly 60% of humans in the world are currently malnourished, so the need for grains and
other basic foods is critical [7]. Growing crops for fuel squanders land, water, and energy resources
vital for the production of food for people. Using corn for ethanol increases the price of U.S. beef,
chicken, pork, eggs, breads, cereals, and milk from 10% to 30% [175]. In addition, Jacques Diouf,
Director General of the U.N. Food and Agriculture Organization, reports that using food grains to
produce biofuels is already causing food shortages for the poor of the world [176,177]. Growing crops
for biofuel not only ignores the need to reduce natural resource consumption, but exacerbates the
problem of malnourishment worldwide by turning precious grain into biofuel.
Recent policy decisions have mandated increased production of biofuels in the United States and
worldwide. For instance, in the Energy Independence and Security Act of 2007, President Bush set “a
mandatory Renewable Fuel Standard (RFS) requiring fuel producers to use at least 36 billion gallons
of biofuel in 2022.” This would require 1.6 billion tons of biomass harvested per year and would
require harvesting 80% of all biomass in the U.S., including all agricultural crops, grasses, and forests
(Table 3). With nearly total biomass harvested, biodiversity and food supplies in the U.S. would be
decimated!
The release of large quantities of carbon dioxide associated with the planting and processing of
plant materials for biofuels is reported to reduce the nutritional quality of major world foods, including
corn, wheat, rice, barley, potatoes, and soybeans. When crops are grown under high levels of carbon
dioxide, protein levels in the crops may be reduced as much as 15% [178].
Many problems associated with biofuels have been ignored by scientists and policy makers. For
one, the biofuels that are being created in order to diminish the dependence on fossil fuels, actually
depend on fossil fuels. In most cases, more fossil energy is required to produce a unit of biofuel
compared with the energy that is produced (Tables 4 – 11). Furthermore, the U.S. is importing oil and
natural gas to produce biofuels, which is not making the U.S. oil independent. Secondly, some
publications use incomplete or insufficient data to support the claims of the pro-biofuel publications.
For instance, claims that cellulosic ethanol provides net energy [104] have not been experimentally
verified because most of the calculations are theoretical. Finally, environmental problems such as
water pollution from fertilizers and pesticides, global warming, soil erosion and air pollution are
intensifying with biofuel production. There is simply not enough land, water, and energy to produce
biofuels.
Based on careful up-to-date analysis of all fossil energy inputs, most conversions of biomass into
ethanol and biodiesel result in a negative energy return. Four of the negative energy returns are: corn
Energies 2008, 1
67
ethanol (minus 48%); switchgrass (minus 68%) soybean biodiesel (minus 63%); and rapeseed (minus
58%). Conversely, palm oil production in Thailand suggests a positive 30% energy return.
Some balance and improvement in the food and biofuel situation is possible. There is desperate
need for petroleum and natural gas conservation as well as sound soil, water, and biological resource
conservation. There are many opportunities for implementing known sustainable agricultural and
forestry technologies. These include:
1) Soil conservation by leaving crop residues on the surface of the soil. Planting cover crops after
the main crop, like corn has been harvested. Other soil conservation technologies that should be
employed when possible are: planting on the contour; planting on terraces; using grass strips;
crop rotations; mulches; and similar technologies and combinations.
2) Water conservation is vital because of the enormous amounts of water crops utilize. In addition
to soil conservation technologies, increasing the organic matter in the soil will increase the
water holding capacity significantly and will increase the number and abundance of soil biota.
3) Planting trees as hedge-rows and wind breaks can significantly reduce soil loss, water runoff,
and evaporation.
4) Maintaining forest stands will conserve soil, water, biodiversity in the ecosystem.
Because the green plants in the U.S. collect a total of only 32 quads of solar energy per year, they
cannot provide the nation with a replacement of the more than 100 quads of fossil energy use per year.
This means that even if all available crops, forests, and grasses were harvested for biofuel, we would
still be dependent on oil and natural gas supplies, which are projected to disappear in about 40 years.
U.S. citizens should reduce their per capita energy use by one-half because this change will become a
reality when oil and natural gas supplies disappear in about 40 years. Instead of subsidizing corn
ethanol and soybean biodiesel by more than $10 billion per year, these funds should be invested in
research in renewable energy technologies.
Acknowledgements
The authors wish to thank Holli Edgley and Elizabeth Keokosky at Cornell University for their
contributions to the development of this paper. We are also grateful to the following people for their
comments and suggestions on earlier versions of the paper: Harry de Gorter, Department of Applied
Economics and Management, Cornell University, Ithaca, NY; Marcelo Dias De Oliveira, Rice
University, Houston, TX; Andrew Ferguson, Optimum Population Trust, Manchester, UK; Mario
Giampietro, Universitat Autonoma de Barcelona, Spain; David Hammer, Electrical and Computer
Engineering, Cornell University, Ithaca, NY; Roel Hammerschlag, Climate and Energy Program,
Stockholm Environment Institute (U.S.), Somerville, MA; Conly Hansen, Director Center for
Profitable Uses of Agricultural, Utah State University, Logan, UT; Phillip McMichael, Development
Sociology, Cornell University, Ithaca, NY; Rattan Lal, Ohio State University, Columbus, OH; Michele
Whitecraft, Cornell University, Ithaca, NY; Walter Youngquist, Petroleum Consultant, Eugene, OR. In
addition, we offer our sincere gratitude to the Cornell Association of Professors Emeriti for the partial
support of our research through the Albert Podell Grant Program.
Energies 2008, 1
68
References
1. Barbara, J.S. The False Promise of Biofuels. Special Report from the International Forum on
Globalization and the Institute for Policy Studies. 2007, 30 pages.
http://www.ifg.org/pdf/biofuels.pdf
2. Cleveland, C.J.; Costanza, R.; Hall, C.A.S.; R. Kaufmann, R. Energy and the United States
Economy: A Biophysical Perspective. Science 1983, 225, 890-897.
3. Hall, C.A.S.; Cleveland, C.J.; Kaufmann, R. Energy and Resource Quality: The Ecology of the
Economic Process. Wiley Interscience: New York, 1986. 577 pp.
4. Pimentel, D.; Pimentel, M. Food, Energy and Society. CRC Press. Taylor and Francis Group,
Boca Raton, Florida, 2008.
5. Pimentel, D. Soil Erosion: A Food and Environmental Threat. Environment, Development and
Sustainability 2006, 8, 119-137.
6. Pimentel, D.; Cooperstein, S.; Randell, H.; Filiberto, D.; Sorrentino, S.; Kaye, B.; Nicklin, C.;
Yagi, J.; Brian, J.; O’Hern, J.; Habas, A.; Weinstein, C. Ecology of Increasing Diseases:
Population Growth and Environmental Degradation. Human Ecology 2007, 35 (6), 653-668.
7. WHO. 2005. Malnutrition Worldwide. World Health Organization.
http://www.mikeschoice.com/reports/malnutrition_worldwide.htm. (12/7/07).
8. FAO. Food and Agricultural Organization of the United Nations. 1961-2006. FAO: Rome.
9. Pimentel, D.; Pimentel, M. Ecological Engineering: Growth of Human Population. Encyclopedia
of Ecology. Elsevier, 2007. In Press.
10. Pimentel, D.; Gardner, J.B.; Bonnifield, A.J.; Garcia, X.; Grufferman, J.B.; Horan, C. M.;
Rochon, E.T.; Schlenker, J.L.; Walling, E.E. Energy Efficiency and Conservation for Individual
Americans. Environment, Development and Sustainability 2008, DOI 10.1007/s10668-007-9128-
x.
11. Nonhebel, S. Renewable Energy and Food Supply: Will There Be Enough Land? Renewable and
Sustainable Energy Reviews 2005, 9 (2), 191-201.
12. PRB. World Population Data Sheet, 2007. Population Reference Bureau: Washington, DC.
13. USDA. 1980-2006. Agricultural Statistics. U.S. Department of Agriculture. Washington, DC.
14. Sommer, A.; West, K.P. Vitamin A Deficiency: Health, Survival and Vision. Oxford University
Press, New York, 1996.
15. Tomashek K.M.; Woodruff, B.A.; Gotway, C.A.; Bloland, P.; Mbaraku, G. Randomized
Intervention Study Comparing Several Regimens for the Treatment of Moderate Anemia among
Refugee Children in Kigoma Region, Tanzania. American Journal of Tropical Medicine and
Hygiene 2001, 64, 164–171.
16. Environment News Service. 850 Million Still Hungry on World Food Day. 2002.
http://www.ens-newswire.com/ens/oct2002/2002-10-16-03.asp. (11/4/07).
17. Svedberg, P. Poverty and Undernutrition: Theory, Measurement, and Policy. Oxford University
Press: New York, 2000.
18. Bryce, J.; Boschi-Pinto, C.; Shibuya, K.; Black, R.E. WHO Estimates of the Causes of Death in
Children. The Lancet 2005, 365 (9465), 1147-1152.
Energies 2008, 1
69
19. Kirby, A. UN Warns of Future Water Crisis. BBC News Online (March 5, 2003).m
http://news.bbc.co.uk/2/hi/science/nature/2818615.stm/ (4/5/08).
20. USDA. Agricultural Statistics, 2006. U.S. Department of Agriculture. U.S. Government Printing
Office: Washington, DC, 2006.
21. Blair, D.; Sobal, J. Luxus Consumption: Wasting Food Resources Through Overeating.
Agriculture and Human Values 2006, 23, 63-74.
22. FAO. The Salt of the Earth: Hazardous for Food Production. Food and Agricultural Organization
of the United Nations. World Food Summit. 2002.
http://www.fao.org/WorldFoodSummit/english/newsroom/focus/focus1.htm. (3/09/08).
23. FAOSTAT. Food and Agricultural Organization. 2001. United Nations: Rome.
24. UN. 1999. Population Division. Department of Economics and Social Affairs. United Nations
Secretariat. The World at Six Billion. Part 1.
http://www.un.org/esa/population/publications/sixbillion/sixbilpart1.pdf. (11/4/07).
25. IWMI. Global Irrigated Area. International Water Management Institute. 2007.
http://www.iwmigiam.org/stats. (3/09/08).
26. Giampietro, M.; Pimentel, D. Energy Utilization. In Encyclopedia of Agricultural Science.
Arntzen, C.J.; Ritter, E.M., Eds.; Academic Press: San Diego, CA, 1994; Vol. 2, 63-76.
27. USCB. Statistical Abstract of the United States, 2007. U.S. Census Bureau, U.S. Government
Printing Office: Washington, DC.
28. Pimentel, D.; Wen, D. China and the World: Population, Food and Resource scarcity. In Dare to
Dream: Vision of 2050 Agriculture in China; Tso, T.C. and Kang, H., Eds.; China Agricultural
University Press: Beijing, 2004, Chapter 8, 103- 16.
29. BP. BP Statistical Review of World Energy. British Petroleum: London, 2005, 41 pages.
30. Gleick, P.H. Basic Water Requirements for Human Activities: Meeting Basic Needs. Water
International 1996, 21, 83-92.
31. Pimentel, D.; Berger, B.; Filberto, D.; Newton, M.; Wolfe, B.; Karabinakis, E.; Clark, S.; Poon,
E.; Abbett, E.; Nandagopal, S. Water Resources: Current and Future Issues. BioScience, 2004, 54
(10), 909-918.
32. FAO. Agriculture, Food and Water. Chapter 2: How the World is Fed. FAO Corporate
Document Repository. 2001. Food and Agricultural Organization of the United Nations.
http://www.fao.org/docrep/006/y4683e/y4683e06.htm (8/28/08).
33. Youngquist, W.; Duncan, R.C. North American Gas: Data Show Supply Problems. Natural
Resources Research 2003, 12 (4), 229-240.
34. Campbell, C. Excel Spread Sheets of Oil and Gas of Production and Discovery. Oil Depletion
Analysis Centre: London, England, 2006.
35. Heinberg, R. Oil Apocalypse: What happens when demand for oil outstrips Supply? 2007.
http://www.richardheinberg.com/ (1/29/08).
36. Pimentel, D. 2001. The Limitations of Biomass Energy. In Encyclopedia of Physical Science and
Technology. 3rd ed.; Meyers, R., Ed.; Academic Press, San Diego, 2001; Vol. 2, 159-171. 37. Flow of Energy. Primary Production. 2005.
http://www.globalchange.umich.edu/globalchange1/current/lectures/kling/energyflow.html.
(12/17/06).
Energies 2008, 1
70
38. Pimentel, D.; Patzek, T. Ethanol Production: Energy and Economic Issues Related to U.S. and
Brazilian Sugarcane. Natural Resources Research 2007, 16 (3), 235- 42.
39. Jölli, D.; Giljum, S. 2005. Unused Biomass Extraction in Agriculture, Forestry and Fishery.
SERI Studies No. 3. Sustainable Europe Research Institute, Vienna.
40. Crop Production. National Agricultural Statistical Services. September 7, 2007. United Stated
Department of Agriculture. September 8, 2007. <http://www.usda.gov/
nass/PUBS/TODAYRPT/crop0907.txt>. (1/29/08).
41. Crop Harvest. Biological System Engineering: Crop Systems. Washington State University.
September 19, 2007. <http://www.bsyse.wsu.edu/cropsyst/manual/parameters/crop/harvest.htm>
(1/29/08).
42. Forest Service. The Forest Inventory and Analysis RPA Assessment Tables. U.S. Forest Service.
U.S. Department of Agriculture: Washington, DC. 2007.
43. IEA. International Energy Administration. International Energy Annual. USDOE: Washington,
DC, 2006.
44. IFIA. International Fertilizer Industry Association. Statistics. 2008.
http://www.fertilizer.org/ifa/statistics/IFADATA/summary.asp (6/27/08).
45. USDA. 2007. Major Land Uses. Economic Research Services. June 9, 2006. United States
Department of Agriculture. September 9, 2007. http://www.ers.usda.gov/data/majorlanduses/.
(1/29/08).
46. Youngquist, W. GeoDestinies. The inevitable Control of Earth Resources over Nations and
Individuals. National Book Company: Portland, Oregon, 1997.
47. USCB. Statistical Abstract of the United States, 2004-2005. U.S. Census Bureau, U.S.
Government Printing Office: Washington, DC.
48. Pimentel, D.; Pleasant, A.; Barron, J.; Gaudioso, J.; Pollock, N.; Chae, E.; Kim, Y.; Lassiter, A.;
Schiavoni, C.; Jackson, A.; Lee, M.; Eaton, A. U.S. Energy Conservation and Efficiency:
Benefits and Costs. Environment, Development and Sustainability 2004, 6, 279-305.
49. Ferguson, A.R.B. Biomass and Energy. Manchester (United Kingdom). Optimum Population
Trust 2001, 4 (1), 14-18.
50. Ferguson, A.R.B. Implications of the USDA 2002 Update on Ethanol From Corn. Manchester
(United Kingdom). Optimum Population Trust 2003, 3 (1), 11–15.
51. Hendrickson, O.Q.; Gulland, J.F. Residential Wood Heating: Forest, the Atmosphere and Public
Consciousness. Air and Waste Management Association Conference: The Emission Inventory:
Living in a Global Environment. New Orleans, Louisiana, 1993.
52. EIA. Energy Information Administration. Annual Energy Review. U.S. Department of Energy:
Washington, DC. 2007. http://www.eia.doe.gov/emeu/aer/pdf/aer.pdf (6/4/08).
53. Schill, S.R. Harnessing the Power of Biomass. Biomass Magazine. August, 2007.
http://www.biomassmagazine.com/article-print.jasp?article_id=1229. (2/7/08).
54. Kitani, O. Biomass Resources. In CIGAR Handbook of Agricultural Engineering; Kitani, O.;
Jungbluth, T.; Pearth, R.M.; Ramdani, A., Eds.; American Society of Agricultural Engineering:
St. Joseph, MI, 1999, 6-11.
55. Pimentel, D. (Ed.) Biofuels, Solar and Wind as Renewable Energy Systems: Benefits and Risks;
Springer: Dordrecht, The Netherlands, 2008, pp.504.
Energies 2008, 1
71
56. Pimentel, D. Ecological Footprint, World population, and the Environment. 2007.
http://www.brass.cf.ac.uk/uploads/fullpapers/Pimentel.pdf. (1/22/08).
57. Burning Issues. What Are the Medical Effects of Exposure to Smoke Particles? 2006.
http://burningissues.org/health-effects.html. (12/07/07).
58. Smith, K.R. Health impacts of household fuelwood use in developing countries. 2006.
http://ehs.sph.berkeley.edu/krsmith/publications/2006%20pubs/Uasylva.pdf. (1/29/08).
59. EPA. Wood smoke. U.S. Environmental Protection Agency. 2002 http://www.webcom.com/-
bi/brochure.pdf+wood+smoke+pollution-hl=ene=UTF-8. (10/20/02).
60. USCB. U.S. Census Bureau. Gas Most Popular Home Heating Fuel, Census Bureau Shows. U.S.
Census Bureau News. U.S. Department of Commerce, Washington, DC. Tuesday, November 16,
2004.
61. Health Effects of Wood Smoke. Department of Ecology. Air Quality Program. Washington State
Energy Office. Olympia, Washington, 1997.
http://www.michigan.gov/documents/Health_Effects_of_Woodsmoke_WA_2004_142269_7.pdf
(6/30/08).
62. Parikka, M. Global Biomass Fuel Reserve. Biomass Bioenergy 2004, 27, 613-620.
63. USCB. U.S. Census Bureau. Home Heating Fuels. 1990.
http://www.census.gov/apsd/cqc/cqc.27.pdf. (12/07/07).
64. EIA. Energy Information Administration “2001”. Residential Energy Consumption Survey.
Housing Characteristic Tables. 2002.
http://www.eia.doe.gov/emeu/recs/recs2001/detail_tables.html (2/15/08).
65. Forest Degradation Data. Forest Degradation Data. 2007.
http://home.alltel.net/bsundquist1/df0.html (1/21/08).
66. FAOSTAT. Food and Agricultural Organization. 2005. United Nations: Rome.
67. Arnold, J.E.M.; Jongma, J. Fuelwood and Charcoal in Developing Countries: An Economic
Survey. 2007. http://www/fap\o.org/docrep/12015e01.htm. (1/29/08).
68. Demirba, A. Biomass Resource Facilities and Biomass Conversion Processing for Fuels and
Chemicals. Energy Convers Mgmt. 2001, 42, 1357-1378.
69. Fujino, J., Yamaji, K.; Yamamoto, H. Biomass-balance table for evaluating bioenergy resources.
Applied Energy 1999, 62 (3), 75-89.
70. Howard, J.L. U.S. Timber Production, Trade, Consumption, and Price Statistics 1965 to 2002.
Research Paper FPL-RP-615. Madison, Wisconsin: U.S. Department of Agriculture, U.S. Forest
Service, Forest Products, Laboratory. 2003, 90 pages.
71. Birdsey, R.A. Carbon Storage and Accumulation in the United States Forest Ecosystems. USDA
Forest Service: Washington, DC, 1992.
72. Repetto, R. Accounting for Environmental Assets. Scientific American 1992, 263, 94-100. 73. Trainer, F.E. Can Renewable Energy Sources Sustain Affluent Society? Energy Policy 1995, 23,
1009-1026.
74. Farrell, A.E.; Plevin, R.J.; Turner, B.T.; Jones, A.D.; O’Hare, M.O.; Kammen, D.M.Ethanol Can
Contribute to Energy and Environmental Goals. Science 2006, 311, 506-508.
75. Shapouri, H.; Gallagher, P. USDA’s 2002 Ethanol Cost-of-Product Survey: Agricultural
Economic Report Number 841. U.S. Department of Agriculture, Washington, DC, 2005.
Energies 2008, 1
72
76. NASS. National Agricultural Statistics Service. 2003. http://usda.mannlib.cornell.edu (11/05/04).
77. Patzek, T.W. Thermodynamics of the Corn-Ethanol Biofuel Cycle. Critical Review in Plant
Sciences 2004, 23 (6), 519-567. http://petroleum.berkeley.edu/papers/patzek/CRPS416-Patzek-
Web.pdf
78. Brees, M. Corn Silage Budgets for Northern, Central and Southwest Missouri. 2004.
http://www.agebb.missouri.edu/mgt/budget/fbm-0201.pdf (9/1/04).
79. USDA. 1997. 1997 Census of Agriculture. U.S. Department of Agriculture.
http://www.ncfap.org. (8/28/2002).
80. USDA.1997. Farm and Ranch Irrigation Survey (1998). 1997 Census of Agriculture. Volume 3,
Special Studies, Part 1. 280 p.
81. Batty, J.C.; Keller, J. Energy Requirements for Irrigation. In Handbook Of Energy Utilization in
Agriculture; Pimentel, D., Ed.; CRC Press: Boca Raton, FL, 1980; pp. 35-44.
82. Larsen, K.; Thompson, D.; Harn, A. Limited and Full Irrigation Comparison for Corn and Grain
Sorghum. 2002.
http://www.colostate.edu/Depts/SoilCrop/extension/Newsletters/2003/Drought/sorghum.html
(9/2/2002).
83. Larson, W.E.; Cardwell, V.B. History of U.S. Corn Production. University of Minnesota:
Minneapolis, 1999.
84. USDA. Agricultural Statistics. U.S. Department of Agriculture. U.S. Government Printing
Office: Washington, DC, 2002.
85. USDA. Corn-State. Costs of Production. U.S. Department of Agriculture, Economic Research
Service, Economics and Statistics System, Washington, DC. Stock #94018, 1991.
86. Patzek, T. The Real Corn-Ethanol Transportation System. 2006.
http://petroleum.berkeley.edu/patzek/BiofuelQA/Materials/TrueCostofEtOH.pdf
87. Pimentel, D. Ethanol Fuels: Energy Balance, Economics, and Environmental Impacts are
Negative. Natural Resources Research 2003, 12 (2), 127-134.
88. Blais, J.F.; Mamouny, K.; Nlombi, K.; Sasseville, J.L.; Letourneau, M. Les Mesures Deficacite
Energetique dans le Secteur de Leau. J.L. In Les Mesures deficacite Energetique pour
Lepuration des eaux Usees Municipales; Sassville, J.L.; Balis, J.F., Eds.; Scientific Report 405,
Vol. 3., 1995, INRS-Eau: Quebec.
89. Illinois Corn. Ethanol’s Energy Balance. 2004.
http://www.ilcorn.org/Ethanol/Ethan_Studies/Ethan_Energy_Bal/ethan_energy_bal.html
(8/10/04).
90. Kuby, W.R.; Markoja, R.; Nackford, S. Testing and Evaluation of On-Farm Alcohol Production
Facilities. Acures Corporation. Industrial Environmental Research Laboratory. Office of
Research and Development. U.S. Environmental Protection Agency: Cincinnati, OH. 1984; 100
p.
91. Newton, PW. Human Settlements Theme Report. Australian State of the Environment Report,
2001. http://www.environment.gov.au/soe/2001/publications/theme-
reports/settlements/index.html (10/6/05).
Energies 2008, 1
73
92. DOE. 2002. Review of Transport Issues and Comparison of Infrastructure Costs for a Renewable
Fuels Standard. U.S. Department of Energy: Washington, D.C. 2002.
http://tonto.eia.doe.gov/FTPROOT/service/question3.pdf (10/8/2002).
93. Koplow, D. Biofuels – At What Cost? Government Support for Ethanol and Biodiesel in the
United States. The Global Studies Initiative (GSI) of the International Institute for Sustainable
development (IISD). 2006. http://www.globalsubsidies.org/IMG/pdf/biofuels_subsidies_us.pdf
(2/16/07).
94. NAS. Frontiers in Agricultural Research: Food, Health, Environment, and Communities;
National Academy of Sciences: Washington, DC, 2003. Also online: http://dels.
http://books.nap.edu/openbook.php?isbn=0309084946 (7/14/08).
95. McLaughlin, S.B.; Walsh, M.E. Evaluating Environmental Consequences of Producing
Herbaceous Crops for Bioenergy. Biomass and Bioenergy 1998, 14 (4), 317-324.
96. USDA. Statistics of Oilseeds, Fats, and Oils. USDA-NASS Agricultural Statistics, 2005.
Chapter III. http://www.usda.gov/nass/pubs/agr05/acro05.htm. (10/20/2007).
97. Pimentel, D.; T. Patzek. Ethanol Production Using Corn, Switchgrass and Wood; Biodiesel
Production Using Soybean. In Biofuels, Solar and Wind as Renewable Energy Systems: Benefits
and Risks; Pimentel, D., Ed.; Springer: Dordrecht,
The Netherlands, 2008, Chapter 15, 375-396.
98. Searchinger, T.; Heimlich, R.; Houghton, R.A.; Dong, F.; Elobeid, A.; Fabiosa, J.; Tokgoz, S.;
Hayes, D.; You, T. Use of U.S. Croplands for Biofuels Increases Greenhouse Gases Through
Emissions From Land-use Change. Science 2008, 319, 1238-1240.
99. Socolow, R.; Hotinski, R.; Greenblatt, J.B.; Pacala, S. Solving the Climate Problem.
Environment 2004, 46 (10), 8-19.
100. Hodge, C. Ethanol Use in US Gasoline Should be Banned, Not Expanded. Oil and Gas Journal
September 9, 2002, 20-30.
101. Hodge, C. More evidence mounts for banning, not expanding, use of ethanol in gasoline. Oil and
Gas Journal October 6, 2003, 20-25.
102. Jacobson, M.Z. Effects of Ethanol (E85) versus Gasoline Vehicles on Cancer and Mortality in
the United States. Environmental Science and Technology 2007, 41(11), 4150-4157.
103. Davis, J.M.; Thomas, V.M. Systematic Approach to Evaluating Trade-offs Among Fuel Options:
The lessons of MTBE. Annals of the New York Academy of Sciences. 2006, 498-515.
104. Tilman, D.; Hill, J.; Lehman, C. Carbon-negative Biofuels from Low-input High-diversity
Grassland Biomass. Science 2006, 314, 1598-1600.
105. Rasnake, M. Tillage and Crop Residue Management. 1999.
www.ca.uky.edu/agc/pubs/agr/agr99/agr99.htm (1/31/08).
106. Fryrear, D.W.; Bilbro, J.D. Wind Erosion Control With Residues and Related Practices. In
Managing agricultural residues. P.W. Unger, Ed., Lewis Publ.: Boca Raton, FL, 1994, 7–17.
107. Lal, R. World Crop Residues Production and Implications of its Use as a Biofuel. Environment
International 2005, 31 (4), 575-584.
108. Kim, S.; Dale, B.E. Life Cycle Assessment of Various Cropping Systems Utilized for Producing
Biofuels: Bioethanol and Biodiesel. Biomass Engineering 2005, 29, 426-439.

Energies 2008, 1
74
109. Troeh, F.R.; Hobbs, A.H.; Donahue. R.L. Soil and Water Conservation. Prentice Hall: New
Jersey, 2004.
110. Lal, R. Soil Carbon Sequestration Impacts on Global Climate Change and Food Security.
Science 2004, 34, 1623–1627.
111. Brummer, E.C.; Burras, C.L.; Duffy, M.D.; Moore, K.J. Switchgrass Production in Iowa:
Economic Analysis, Soil Suitability, and Varietal Performance. Iowa State University: Ames,
Iowa, 2000.
112. Samson, R. Switchgrass: A Living Solar Battery for the Prairies. Ecological Agriculture Projects,
Mcgill University (Macdonald Campus, Ste-Anne-de-Bellevue, QC, H9X 3V9 Canada.
Copyright @ 1991 REAP Canada.
113. Henning, J.C. Big Bluestem, Indiangrass and Switchgrass. Department of Agronomy, Campus
Extension, University of Missouri, Columbia, MO. 1993.
114. Samson, R.; Duxbury, P.; Drisdale, M.; Lapointe, C. Assessment of Pelletized Biofuels. PERD
Program, Natural Resources Canada, Contract 23348-8-3145/001/SQ, 2000.
115. Wood Tub Grinders. 2004. Wood Tub Grinders.
http://p2library.nfesc.navy.mil/P2_Opportunity_Handbook/7_III_13.html (8/3/04).
116. Arkenol. Our Technology: Concentrated Acid Hydrolysis. 2004.
www.arkenol.com/Arkenol%20Inc/tech01.html (8/2/04).
117. Crisp, A. Wood residue as an energy source for the forest products industry. Australian National
University. 1999. http://sres.anu.edu.au/associated/fpt/nwfp/woodres/woodres.html (7/10/06).
118. Brown, L.R. World’s Rangelands Deteriorating Under Mounting Pressure. Earth Policy Institute.
2002. http://www.earthpolicy.org/Updates/Updates6.htm. (1/24/08).
119. Hos, J.J.; Groenveld, M.J. Biomass Gasification. In Biomass; Hall D.O.; Overend, R.P., Eds.
John Wiley & Sons: Chichester, UK, 1987, 237-255.
120. Jenkins, B.M. Pyrolysis Gas. In CIGAR Handbook of Agricultural Engineering; Kitani, O.;
Jungbluth, T.; Pearth, R.M.; Ramdani, A., Eds.; American Society of Agricultural Engineering:
St. Joseph, MI, 1999, 222-248.
121. Ellington, R.T.; Meo, M.; El-Sayed, D.A. The Net Greenhouse Warming Forcing of Methanol
Produced from Biomass. Biomass and Bioenergy 1993, 4 (6), 405-418. 122. Osburn, L.; Osburn, J. Biomass Resources for Energy and Industry. 2001.
http://www.ratical.org/renewables/biomass.html (10/20/02).
123. Hekkert, M.P.; van Giessel, J.F.; Ros, M.; Wietschel, M.; Meeus, M.T.H. The Evolution of
Hydrogen Research: Is Germany Heading for an Early Lock-in? Journal of Hydrogen Energy
2005, 30, 1045-1052.
124. Ozaktas, T. Compression Ignition Engine Fuel Properties of a Used Sunflower Oil-
diesel Fuel Blend. Energy Sources 2000, 22 (4), 377-382.
125. Ali, M.B.; McBride, W.D. Soybeans: State Level Production Costs, Characteristics, and Input
Use, 1990. Economic Research Service. Stock no. ERS SB873. 1990; 48pp.
126. College of Agricultural, Consumer and Environmental Sciences. Machinery Cost Estimates:
Summary of Operations. University of Illinois at Urbana-Champaign. 1997.
www.aces.uiuc.edu/~vo-ag/custom.htm (11/8/01).
Energies 2008, 1
75
127. Economic Research Statistics. Soybeans: Fertilizer Use by State. Agricultural Chemical Usage:
1996 Field Crops Summary. 1997. http://usda.mannlib.cornell.edu/data-
sets/inputs/9X171/97171/agch0997.txt (11/11/01).
128. Hinman, H.; Pelter, G.; Kulp, E.; Sorensen, E.; Ford, W. Enterprise Budgets for Fall Potatoes,
Winter Wheat, Dry Beans and Seed Peas under Rill Irrigation. Farm Business Management
Reports, Columbia, Washington State University, Pullman, WA. 1992.
129. Pimentel, D.; Doughty, R.; Carothers, C.; Lamberson, S.; Bora, N.; Lee, K. Energy Inputs in
Crop Production: Comparison of Developed and Developing Countries. In Food Security &
Environmental Quality in the Developing World; Lal, R.; Hansen, D.; Uphoff, N.; Slack, S.,
Eds.; CRC Press: Boca Raton, FL, 2002, 129-151.
130. Mississippi State University Extension Service. Agronomy Notes. 1999.
http://msucares.com/newsletters/agronomy/1999/199910.html (7/10/06).
131. USDA. Agricultural Statistics, 2004. (CD-ROM) U.S. Department of Agriculture/ National
Agriculture Statistics Service: Washington, DC. A1.47/2:2004.
132. Singh, R.P. Energy Accounting of Food Processing. In Energy in Food Processing; Singh, R.P.,
Ed.; Elsevier: Amsterdam, 1986, 19-68.
133. Duffy, M. Does planting GMO seed boost farmer’s profits? Iowa State University, Leopold
Center for Sustainable Agriculture, Leopold Letter, 1999, Volume 11, No. 3.
134. Artuzi, J.P.; Contiero, R.L. Herbicides Applied in Soybean and the Productivity of Corn in
Succession. Pesquisa Agronpecuaria Brasilera 2006, 41 (7), 1119-1123. 135. USDA. Nutritive Value of American Foods. Agriculture Handbook No. 456. Agricultural
Research Service. U.S. Department of Agriculture: Washington, DC, 1975.
136. Fyksen, J. Soybean Issues Tackled: 2007 Season, Varieties for Biofuel, Foliar Fungicides. 2008.
http://agriview.com/articles/2008/01/24/crop_news/crops04.txt. (2/15/08). 137. Tickell J. Biodiesel America: How to Achieve Energy Security, Free America from Middle-east
Oil Dependence, and Make Money Growing Fuel; Murphy, M.; Graziano, C., Eds.; Yorkshire
Press, 2006, pp 121-140.
138. EBB. European Biodiesel Board. 2007. http://www/greencarcongress.com/2007/07european-
biodie.html. (1/29/08).
139. Frondel M.; Peters J. Biodiesel: A New Oildorado? Energy Policy 2007, 35, 1675-1684.
140. Chamsing, A.; Salokhe, V.M.; Singh, G. Energy Consumption Analysis for Selected Crops in
Different Regions of Thailand. (2004) Agricultural Engineering International: the CIGAR
Ejournal. Manuscript EE 06 013, Vol. VIII, November. 2006.
141. USDA. 2007. The Price of Urea, the Primary Solid Nitrogen Fertilizer Used in the U.S. , Rose
from $200 to $453 Per Ton.
http://www/ers.usda.gov/AmberWaves/November07/Findings/TightSupply.htm. (3/15/08).
142. Smathers, R.L. Winter Rapeseed after Summer Fallow. 2005 Northern Idaho Crop Costs and
Returns Estimate. College of Agriculture and Life Sciences. University of Idaho. EBB1-WR-05.
143. Pimentel, D.; Pimentel, M. Food, Energy and Society. Colorado University Press, Boulder, CO,
1996.
144. Molenhuis, J. Business Analysis and Cost of Production Program. Ontario Ministry of
Agriculture, Food and Rural Affairs. 2004.
Energies 2008, 1
76
http://www.omafra.gov.on.ca/english/busdev/bear2000/Budgets/Crops/Oilseeds/wcanolahybrid_
static.htm (7/10/06).
145. Thoenes, P. Biofuels and Commodity Markets – Palm Oil Focus. FAO Commodities and Trade
Division. Food And Agriculture Organization of the United Nations: Rome, 2007.
146. USDA. 2008. Foreign Agricultural Service. Oilseeds: World Markets and Trade Monthly
Circular. Major Vegetable Oils: World Supply and Distribution (Commodity View). February 8,
2008. U.S.Department of Agriculture. Washington, DC.
http://www.fas.usda.gov/oilseeds/circular/2008/February/Oilseeds0208.pdf (3/15/08).
147. MPOA. Malaysian Palm Oil Association and Sustainable Palm Oil: RSPO Public Forum on
Sustainable Palm Oil; 6 January 2005; Mont Kiara Business Centre, Kuala Lumpur. 148. Carter, C.; Finley, W.; Fry, J.; Jackson, D.; Willis, L. Palm Oil Markets and Future Supply.
European Journal of Lipid Science and Technology 2007, 109 (4), 307-314.
149. Pleanjai, S.; Gheewala, S.H.; Garivait, S. Environmental Evaluation of Biodiesel Production
from Palm Oil in a Life Cycle Perspective. Presented at the Joint International Conference on
“Sustainable Energy and Environment” in Hua Hin, Thailand, 1-3 December, 2004. 19 pages.
150. Donald, P.F. Biodiversity Impacts of Some Agricultural Commodity Production Systems.
Conservation Biology 2004, 18 (1), 17-38. 151. World Agroforestry Centre. 2007.
http://www/worldagroforestrycentre.org/sites?TreeDB/aft/speciesPrinterFriendly. asp?ID=1013
(11/4/07).
152. Haverkort, A.; Bindraban, P.; Bos, H. Food, Fuel or Forest? Proceedings of the seminary held at
Wageningen, the Netherlands March 2, 2007. 66 pages.
153. Pacific Island Ecosystems. Jatropha curcas: Risk Assessment Results. 2007.
http://www.hear.org/pier/wra/pacific/jatropha_curcas_htmlwra.htm. (11/4/07).
154. Dimitrov, K. GreenFuel Technologies: A Case Study for Industrial Photosythetic Energy
Capture. Brisbane, Australia. 2007. http://moritz.botany.ut.ee/~oilli/b/Dimitrov.pdf. (3/11/08).
155. Briggs, M. Widescale Biodiesel Production from Algae. 2004.
http://unh.edu/p2/biodielsel/article_algae.html. (1/7/08).
156. Vincent Inc. 2007. Valcent Products: Intial Data From the Vertigro Field Test Bed Plant Reports
Average Production of 276 Tons of Algae Bio Mass on a Per Acre/per Year Basis.
http://money.cnn.com/news.newsfeeds/articles/marketwire/0339181.htm. (1/7/08).
157. Green Car. Green Car Congress. 2006.
http://www.greencarcongress.com/2006/07/malaysia_and__in.html. (1/7/08).
158. Goldman, J.C.; Ryther, J.H. Mass Production of Algae: Engineering Aspects. In Biological Solar
Energy Conversion; Mitsui A. et al. Eds.; Academic Press: New York, 1977, 367–378.
159. Biopact. 2007. An In-Depth Look at Biofuels from Algae. http://biopact.com/2007/01/in-depth-
look-at-biofuels-from-algae-html. (1/7/08).
160. CIIFAD. 2007. More Rice with Less Water. Cornell International Institute for Food, Agriculture
and Development. http://ciifad.cornell.edu/SRI/estrmats/philmanual.pdf. (1/7/08).
161. Peak Soil. Peak Soil: Why biofuels are not sustainable and a Threat to America’s National
Security. 2008. http://www.ea2020.org/drupal/node/39. (1/31/08).
Energies 2008, 1
77
162. Leiting, K.B. Agronomy – Corn and Soybeans Crop Residue Management. Natural Resource
Conservation Service. Albuerque, New Mexico. 2007.
http://www/nm.nrcs.usda.gov/technical/tech-notes/agro/ag67.pdf. (10/9/07).
163. Khan, S.A.; Mulvaney, R.L.; Ellsworth, T.R.; Boast, C.W. The Myth of Nitrogen Fertilization
for Soil Carbon Sequestration. Journal of Environmental Quality 2007, 36, 1821-1832.
164. Perlack, R.D.; Wright, L.L.; Turhollow, A.F.; Graham, R.L.; Stokes, B.J.; and Erbach, D.C.
2005. Biomass as Feedstocks for a Bioenergy and Bioproducts Industry: The Technical
Feasibility of A Billion-Ton Annual Supply. (Report No. ORNL/TM-2005/66). Oak Ridge
National Laboratory.
165. Lal, R.; Pimentel, D. Biofuels from Crop Residues. Soil and Tillage Research 2007, 93 (2), 237-
238.
166. Prove, B.G.; Truong, P.N.; Evans, D.S. Strategies for Controlling Caneland Erosion in the Wet
Tropical Coast of Queensland. Proceedings. Australian Society Sugar Cane Technology, 1986
Conference, pp.77 – 84.
167. Wortmann, C.S.; Jasa, P.J. 2003. Choosing the Right Tillage System for Row Crop Production.
Institute of Agriculture and Natural Resources at the University of Nebraska: Lincoln, Nebraska.
168. Pimentel, D.; Hepperly, P.; Hanson, J.; Douds, D.; Seidel, R. Environmental, Energetic, and
Economic Comparisons of Organic and Conventional Farming Systems. Bioscience 2005, 55 (7),
573-582.
169. Liebman, M. New Cropping Systems for Cellulosic Feedstock Production and Environmental
Stewardship. 2008. http://129.186.41.143/20th/home.files/liebman.pdf. (1/31/08). 170. Mongabay. Forest Erosion. 2004. http://www.mongabay.co/0903.htm. (12/07/07).
171. Thornton, F. C.; Green, T. H.; Joslin, J. D.; Houston, A.; Bock, B. R., Schoenholtz, S.; Tyler, D.
D.; Pettry, D. Environmental Impacts of Converting Cropland to Short-rotation Woody Crop
Production: First Year Results. Proceedings of Bioenergy 1996 - The Seventh National
Bioenergy Conference. September 15-20, 1996, Nashville, TN, p. 210-216.
172. IEA. International Energy Administration. International Energy Annual. USDOE: Washington,
DC, 2001.
173. Naeher, L.P.; Brauer, M.; Lipsett, M.; Zelikoff, J.T.; Simpson, C.D.; Hoenig, J.Q.; Smith, K.R.
Woodsmoke Health Effects: A Review. Inhalation Toxicology 2007, 19, 67-106. 174. Crutzen, P.J.; Mosier, A.R.; Smith, K.A.; Winiwerter, W. N2O Release from Agro-biofuel
Production Negates Global Warming Reduction by Replacing Fossil fuels: Discussion.
Atmospheric Chemical Physics 2007, 7, 11191-11205.
175. Brown, L.R. 2008. Why ethanol production will drive world food prices even higher in Earth
Policy Institute. http://www.earthpolicy.org/Updates/2008/Update69.htm. (1/24/08).
176. Diouf, J. Biofuels a Disaster for World Food. In EU Coherence: EU Coherence Policy for
Development. 2007. http://eucoherence.org/renderer.do/clearState/false/menuld/227351/return.
(10/31/07).
177. United Nations Radio. Climate Change and Bio-Fuel Threaten Food Security, FAO Chief,
November 26, 2007, www.un.org/radio/news/html/16436.html (1/22/2008).

Energies 2008, 1
78
178. Southwestern University. Biology Research Finds Rising CO2 Levels Could Decrease the
Nutritional Value of Major Food Crops. 2008. http://www.blackwell-
synergy.com/doi/full10.1111/j.1365-2486.2007.01511.x. (2/15/08).
© 2008 by the authors; licensee Molecular Diversity Preservation International, Basel, Switzerland.
This article is an open-access article distributed under the terms and conditions of the Creative
Commons Attribution license (http://creativecommons.org/licenses/by/3.0/).