Biofeedback System for Propulsion Training February 22, 2007 Group Members: Noah Reding Nick...
20
Biofeedback System for Propulsion Training February 22, 2007 Group Members: Noah Reding Nick Chadwick Tom Soike Project Sponsor: Dr. Mark Richter, MAX Mobility Faculty Advisor: Dr. Paul King, Vanderbilt University
-
Upload
kelly-ramsey -
Category
Documents
-
view
218 -
download
1
Transcript of Biofeedback System for Propulsion Training February 22, 2007 Group Members: Noah Reding Nick...

Biofeedback Systemfor Propulsion Training
February 22, 2007
Group Members:Noah Reding
Nick Chadwick
Tom Soike
Project Sponsor: Dr. Mark Richter, MAX Mobility
Faculty Advisor: Dr. Paul King, Vanderbilt University

MAX Mobility Lab
• Operating Treadmill with possible incline
• Multiple PCs for data collection
• Radio transmitters for communication

Lab Safety Precautions
• Rising elevator for patients’ use
• Safety harness attached to chair on treadmill
• Discomfort scale for patients
• Emergency stop button for treadmill

Problem of Interest
Currently, there are over 2.5 million1 Americans who are confined to wheelchairs. Some users propel themselves improperly, leading to damage of their upper extremities later in life.

Project Goal
Develop software that works with an established propulsiometer to effectively “teach” new and existing wheelchair users proper propulsion methods, in hopes of reducing their chances of developing injuries of the upper extremities later on.

People Affected
• Approx. 65% wheelchair users experience upper extremity pain or injury2
• Research has linked a relationship between impact stresses placed upon the wrist, elbow, and shoulder during propulsion to upper extremity injury2

Market Analysis
• Currently, the personal mobility device industry is a $2-3 Billion operation3
• Constructive surgeries for extremities start at $10,000 and can greatly increase
• US demand for mobility devices and wheelchairs is projected to increase 6.9% annually and is expected to reach $7.4 Billion by 20124
• Our primary targets are physical therapist treating handicapped individuals, In the US alone there are more than 77,000 practicing physical therapists5

Population Change
050
100150200250300350400450
1970 1980 1990 2000 2010 2020
Year
Perc
en
tag
e C
han
ge
Wheelchair Users
US population

Performance Criteria
• To improve a pre-existing device for the capturing of real-time propulsion data
• Relay this data to a user-friendly interface, allowing for instantaneous alterations of one’s push tendencies.
• Data to be collected and analyzed:– Push frequency– Push angle– Peak force– Tangential force– Peak loading rate
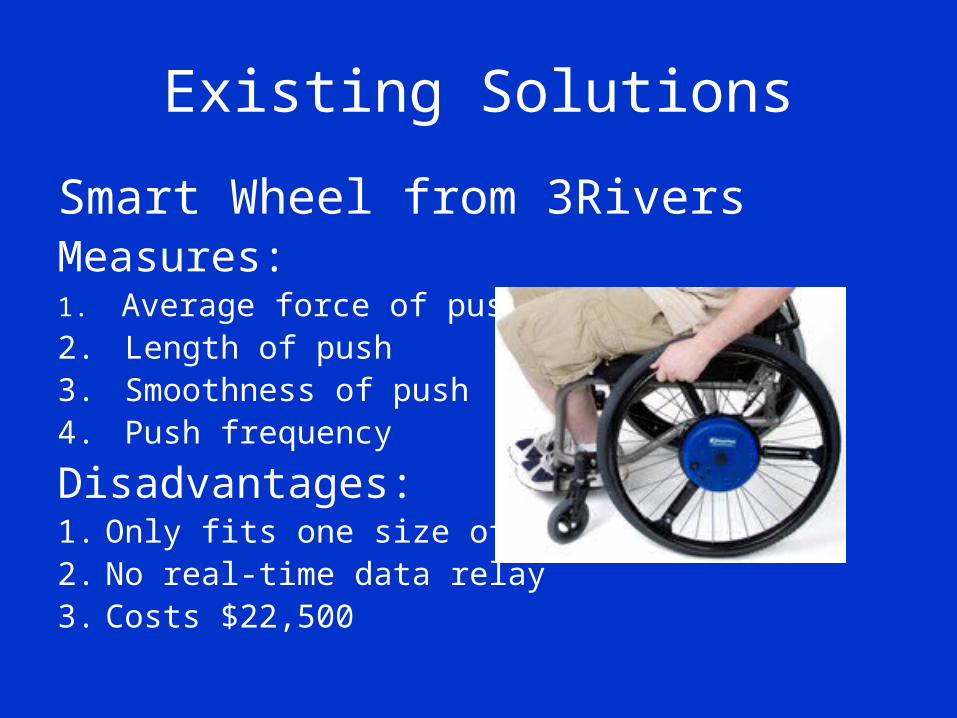
Existing Solutions
Smart Wheel from 3RiversMeasures:1. Average force of push2. Length of push 3. Smoothness of push4. Push frequency
Disadvantages:1. Only fits one size of wheel2. No real-time data relay3. Costs $22,500
Our Primary Objective
• Collect and analyze data in real-time
• Fits any size wheel
• Develop a program in LabVIEW that can collect and analyze real-time data from the device.
• The data will be compared to the proper propulsion technique determined from research companies in the future.

Hardware Work
• Mini-Dat Computer collects all data with load cells
• Radio transmitter sends data to PC
• Frame with hardware fits on all-size wheels
• Connected new angle sensor to existing hardware for data collection

Solution Description 7 Different Channels of Data
Separate Into Each Channel
Gather Offset Data for Each
Subtract Offset From Each
Perform Calculations
Obtain 5 Variables of Choice

Further Breakdown of Solution
• Offset Removal– Apply to each channel– Coincide with each angle
• Filtering of Data– If needed
• Calibration Matrix– Comes from manufacturer– Scales data

Factors Involved
1. New angle sensor• More sensitive measurements ($40)
2. Simplify software so that only one
application is needed• Enables faster data collection and calculation• Matlab and LabVIEW combined into one ($0)
3. Providing data to the user in an interface• Currently in developed stages

Performance Metrics
• Perform all calculations in < 1 sec.
• Sampling rate of 200 Hz
• Relay information through user-friendly interface
• Improving Cost/Benefit – New device will be cheaper than existing
technology ($22,500 vs. $12,000) and provide real time measurement
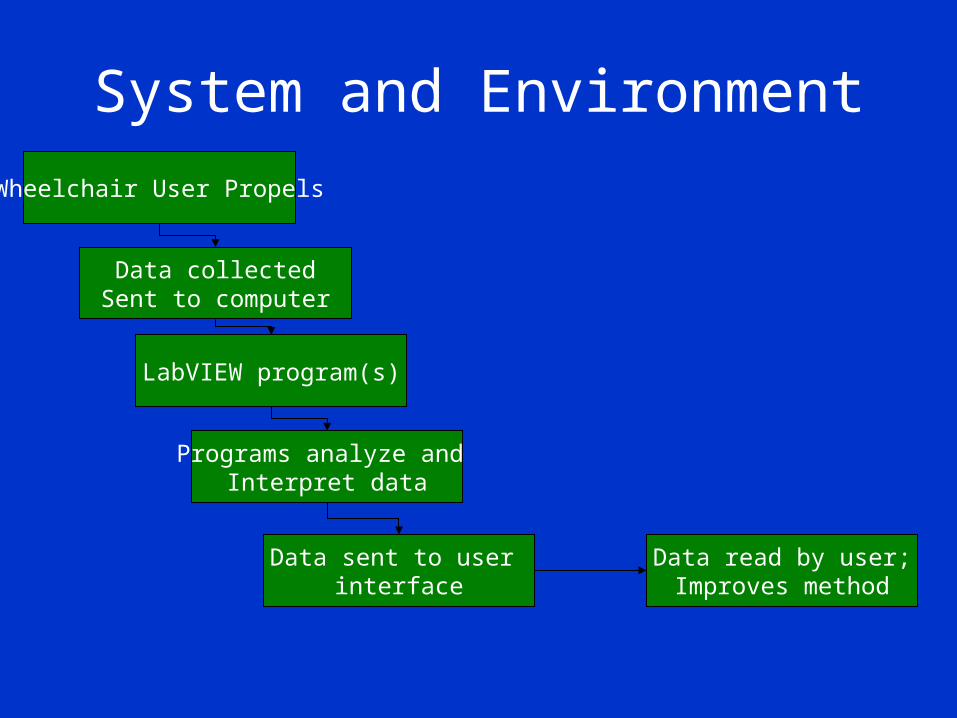
System and Environment
Wheelchair User Propels
Data collectedSent to computer
Programs analyze and Interpret data
LabVIEW program(s)
Data read by user;Improves method
Data sent to user interface

Project Flow Chart
Learn to use Programs
Collect Sample Data
Interpret Sample Data
Assess Problems / Concerns
Redesign Programs
Interpret Real Time Data
Assess Progress / Direction For Interface
Meet with Advisor / Discuss Direction and Programs
Divide Programs Among Members
Collect Real Time Data
Completed WorkCurrent Work Future Work

References
1. http://www.wsana.org/id115.html2. http://www.thewheelchairsite.com3. http://www.beneficialdesigns.com/BD/4. http://www.pages.drexel.edu/~garfinkm/
Scale.Mkt.html5. http://www.wheelchairfoundation.org/6. http://www.3rivers.com/swhome.php7. http://www.marketresearch.com/product/
display.asp?productid=1352736&xs=r&SID=55812406-375239627-353243901&curr=USD

Questions?
http://www.bme.vanderbilt.edu/srdesign/2006/group16