Bioenergy and Latin America: A Multi-Country Perspective · 2015-05-30 · Bioenergy & Latin...
200
Report EUR 27185 EN Editors: J.F. Dallemand, J.A.Hilbert, F.Monforti 2015 Bioenergy and Latin America: A Multi-Country Perspective
Transcript of Bioenergy and Latin America: A Multi-Country Perspective · 2015-05-30 · Bioenergy & Latin...

Report EUR 27185 EN
Editors: J.F. Dallemand, J.A.Hilbert, F.Monforti
2015
Bioenergy and Latin America: A Multi-Country Perspective

European Commission
Joint Research Centre
Institute for Energy and Transport
Contact information
Jean-François Dallemand Address: Joint Research Centre, Joint Research Centre, IET Via Enrico Fermi 2749
I-21027 Ispra (Va) Italy
E-mail: [email protected]
Tel.: +39 0332 789937
JRC Science Hub
https://ec.europa.eu/jrc
Legal Notice
This publication is a Technical Report by the Joint Research Centre, the European Commission’s in-house science service.
It aims to provide evidence-based scientific support to the European policy-making process. The scientific output expressed does not imply a
policy position of the European Commission. Neither the European Commission nor any person acting on behalf of the Commission is
responsible for the use which might be made of this publication.
JRC94707
EUR 27185 EN
ISBN 978-92-79-47240-4 (PDF) ISBN 978-92-79-47239-8 (print)
ISSN 1831-9424 (online) ISSN 1018-5593 (print)
doi:10.2790/246697
Luxembourg: Publications Office of the European Union, 2015
© European Union, 2015
Reproduction is authorised provided the source is acknowledged.
Abstract
This publication provides a description of the status of bioenergy (Use of biomass feedstock from agriculture, forest & waste for uses in
transport, heat & electricity) in several countries of Latin America. This Report has been edited by the JRC IET Renewables & Energy
Efficiency Unit in cooperation with the Agricultural Research Institute (INTA) of Argentina. This publication is partly based on the experience
of EUROCLIMA Project and on technical contacts developed through the JRC participation at the IEA (International Energy Agency) Bioenergy
Task 43 on Biomass feedstock for energy use. This Report includes papers on bioenergy status & perspectives from institutions from
Argentina, Brazil, Chile, Colombia, Costa Rica, Mexico, or from other international players such as IEA, FAO, INAAS & CEA France. Special
attention is paid to the status of bioenergy in Brazil & Argentina, but also in other Latin American countries with different resource
availability & policy drivers and to the agro-environmental assessment of bioenergy.
Report EUR 27185 EN
201 5
Editors: J.F. Dallemand, J.A.Hilbert, F.Monforti
Bioenergy and Latin America: A Multi-Country Perspective


Bioenergy & Latin America, a multi country dimension.
Table of Contents
- IEA Technology Roadmaps, Bioenergy for heat and power and biofuels for transport,
A.Eisentraut, International Energy Agency (IEA), Paris page 1
- Bioenergy & technology from a sustainable perspective: experience from Europe and global
context, U.Fritsche, L.Iriarte, International Institute for Sustainability Analysis and Strategy
(INAAS), Germany page 11
- Quantification of GHG emissions derived from biofuels and bioenergy, upgrading the state
of the art an N2O emissions from agricultural soils, M.A.Taboada,V.R.N. Cosentino, National
Agricultural Technology Institute of Argentina (INTA) page 23
- Argentine soybean oil biodiesel: GHG calculation for different agro-technologies and
productive areas of Argentina, J.A.Hilbert, I.Huerga, L.B.Donato, National Agricultural
Technology Institute of Argentina (INTA) page 39
- Field measurements of agricultural emissions, G.Posse, N.Lewczuk, K.Richter, J.A.Hilbert,
National Agricultural Technology Institute of Argentina (INTA) page 53
- Sustainability certification of argentine soybean based biodiesel, F.Pochat, Girobiz,
Estrategia Sustentable page 61
- Practical indicators on extensive agriculture production, F.C.Frank, National Agricultural
Technology Institute of Argentina (INTA) page 71
- Identification of biomass sustainability certification schemes in Argentina, challenges for
market access, S.Galligani , Imperial College, J.Hilbert, National Agricultural Technology
Institute of Argentina (INTA), C.Chiavirini, Peterson Control Union page 81
- The challenges of sugarcane ethanol in Brazil: past, present and future,
F.Scarpare, M.R.L.V.Leal, R.L.Victoria, Brazilian Bioethanol and Technology Laboratory
(CTBE) page 91
- Status and perspectives of renewable energy in Chile, the role of bioenergy in the Chilean
energy mix, V.Martinez, National Center for Innovation and Development of Sustainable
Energy (CIFES), V. Ávalos, Ministry of Energy of Chile page 105
- Bioenergy status in Colombia, P.Gauthier-Maradei, Industrial University of Santander
(UIS), Bucaramanga page 115
- Costa Rican experience in the field of biofuels for transport and bioenergy for heat &
electricity, P.Orozco, Refinadora Costariccense de Petroleo page 119
- Biofuels in Mexico, challenges for sustainable production & use, A.Flores Montalvo,
Instituto Nacional de Ecología (INE), México page 127
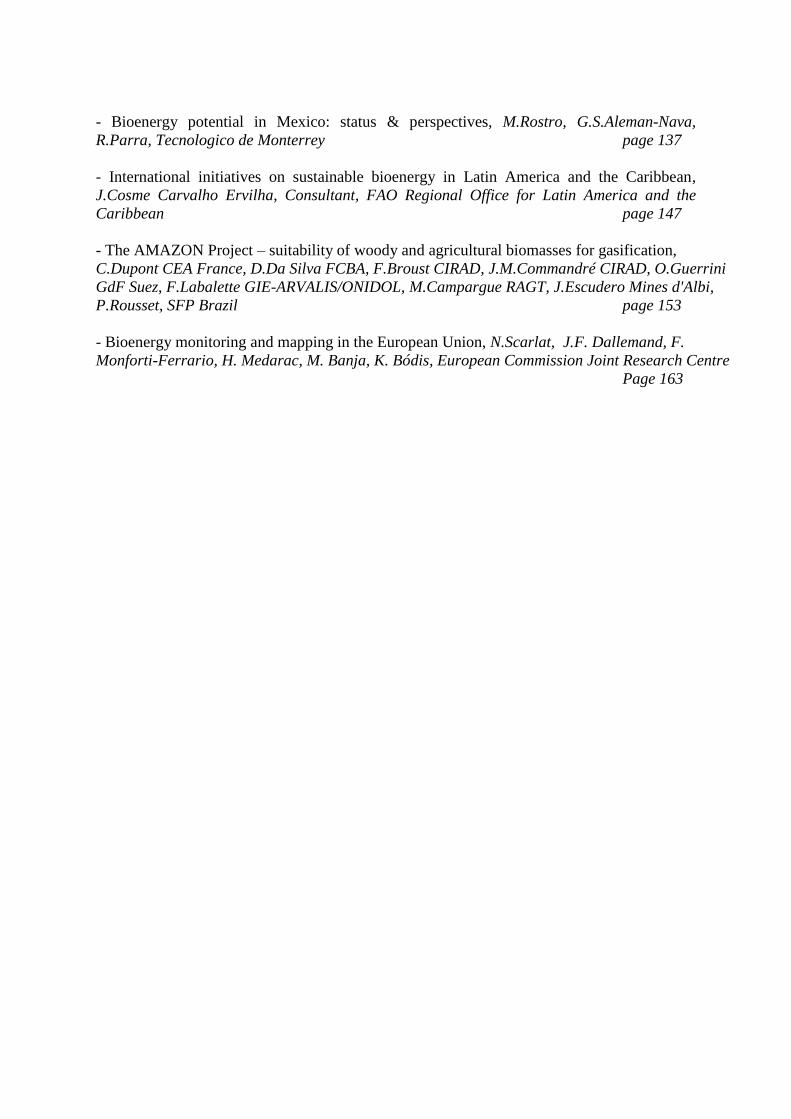
- Bioenergy potential in Mexico: status & perspectives, M.Rostro, G.S.Aleman-Nava,
R.Parra, Tecnologico de Monterrey page 137
- International initiatives on sustainable bioenergy in Latin America and the Caribbean,
J.Cosme Carvalho Ervilha, Consultant, FAO Regional Office for Latin America and the
Caribbean page 147
- The AMAZON Project – suitability of woody and agricultural biomasses for gasification,
C.Dupont CEA France, D.Da Silva FCBA, F.Broust CIRAD, J.M.Commandré CIRAD, O.Guerrini
GdF Suez, F.Labalette GIE-ARVALIS/ONIDOL, M.Campargue RAGT, J.Escudero Mines d'Albi,
P.Rousset, SFP Brazil page 153
- Bioenergy monitoring and mapping in the European Union, N.Scarlat, J.F. Dallemand, F.
Monforti-Ferrario, H. Medarac, M. Banja, K. Bódis, European Commission Joint Research Centre
Page 163

Foreword
This Report addresses Bioenergy in Latin America and is an attempt to discuss this issue from a multi-country
perspective. Bioenergy is intended here as the production of renewable energy from agriculture, forest & waste
for uses in transport, heat & electricity. This Report aims to provide some quantitative information about the
status and perspectives of bioenergy in Latin America. Examples are presented relating to targets, achievements,
main feedstock & conversion routes, environmental impact and sustainability issues. Bioenergy in Latin
America is an important topic for the European Commission due to exports to the European Union, for example
in relation to the implementation of the 2009 Renewable Energy Directive. Bioenergy also has clear connections
with other policies in Latin America as well as in Europe and the rest of the world. The main drivers for
bioenergy can be energy security, agriculture & rural development, environment & climate change, technology
& innovation. Bioenergy policies are now defined taking into account not only the 4Fs of agriculture (Food,
Feed, Fibre & Fuel), but also green chemistry & bio-materials in the wider framework of bioeconomy
development and resource use efficiency. Competitive uses for agriculture, forestry, waste and also possible
future options such as the use of algae for bioenergy need to be assessed and if possible quantified. Latin
America has specific characteristics due the role of Brazil as world leader in the field of bioethanol from sugar
cane, the experience of Argentina in the field of soya production and due to the large potential from other
feedstock categories than sugar cane or soya in other regions or countries of Latin America (for example the use
of residues for biogas). In a general context characterised by changing fossil energy prices, new technologies are
also emerging in Latin America as a further development of first generation biofuels. An example is given by
new bioethanol plants in Argentina using corn starch and co-products, where the integration of different
technologies results in reducing the energy consumption and environmental impact.
Scientific and Technical networking is an essential activity in the field of bioenergy due to the multi-
disciplinary dimension of bioenergy which relates to feedstock availability & mobilisation, conversion
mechanisms into energy, costs assessment, definition of markets and support mechanisms, sustainability
schemes selection & implementation….
This Report has been edited by the Joint Research Centre of the European Commission (Institute for Energy &
Transport, Renewable & Energy Efficiency Unit) in cooperation with the National Agricultural Technology
Institute (INTA) of Argentina. It is based on voluntary contributions from experts from specialised institutions
from 6 Latin American countries (Argentina, Brazil, Chile, Colombia, Costa Rica, Mexico) as well as on input
from international institutions or players such as IEA, UN FAO, INAAS & CEA France. We wish to thank
warmly all the contributors for their input. This Report benefited from the support of the Bioenergy component
of EUROCLIMA Project (European Commission Directorate Development). This allowed the organisation of
three Workshops in Buenos Aires, Campinas and Santiago de Chile in cooperation with INTA, the Centre for
Bioethanol Technology (CTBE) and the National Center for Innovation and Development of Sustainable
Energy (CIFES) of Chile. These three institutions had a key technical role in relation to the preparation of the
content of this Report. This activity also benefited from contacts established within the framework of IEA
Bioenergy Task on Biomass feedstock for energy markets.
This Report is a first step but considering the sensitivity and the complexity of energy and renewable energy
policies definition at national or international level, we hope this document will stimulate technical and
scientific cooperation between the European Union and Latin America, will become a useful reference for
policy support and will be updated and complemented in the future.
JF Dallemand, European Commission Joint Research Centre (EC JRC)
JA Hilbert, National Agricultural Technology Institute of Argentina (INTA)
F.Monforti, European Commission Joint Research Centre (EC JRC)


1
IEA Technology Roadmaps
Bioenergy for Heat and Power and Biofuels for Transport
A.Eisentraut
International Energy Agency, Renewable Energy Division,
9 Rue de la Fédération, 75739, Paris Cedex 15, France
1. BACKGROUND
Current trends in energy supply and use are unsustainable — economically, environmentally
and socially — and IEA analysis shows that, without decisive action, energy-related
greenhouse gas (GHG) emissions could more than double by 2050 and energy security could
be seriously compromised in many regions. To address these challenges, the International
Energy Agency (IEA), at the request of the G8, is developing a series of technology
roadmaps for some of the most important low-carbon technologies, needed to reduce global
energy-related CO2 emissions by 50 % in 20501 compared to 2005 levels. The basis for all of
the roadmaps is the 2 °C scenario (2DS) developed for the IEA publication Energy
Technology Perspectives (IEA, 2014a).
Two recently published roadmaps focus on using biofuels for transport, and using bioenergy
for heat and power. Each roadmap sets out a growth path for the relevant technologies from
today to 2050, and identifies technology, financing, policy and public engagement milestones
that need to be achieved to realise the technology’s full potential. (For more information and
to download the roadmaps visit: www.iea.org/roadmaps.) Please note that the scenario results
presented in this document differ slightly from those in the original technology roadmap on
biofuels for transport and bioenergy for heat and power. This is due to an update of the 2DS
for the 2014 edition of Energy Technology Perspectives.
2. CURRENT STATUS OF BIOENERGY AND BIOFUELS
Bioenergy is the largest single source of renewable energy today. In 2012, it provided
roughly 10 % (55 EJ, or 1300 Mtoe)2 of world total primary energy supply (IEA, 2014b).
Most of this was consumed in the buildings sector in developing countries, mainly in cooking
1 Energy-related CO2 emissions are cut by more than half in 2050, compared with 2009, and continue to fall
after that. This emissions trajectory is consistent with what the latest climate science research indicates are
needed to give a 80 % chance of limiting long-term global temperature increase to 2 °C, provided that non-
energy related CO2 emissions and other greenhouse gases are also reduced. 2 This figure is subject to some uncertainty, since no accurate data on current use of different biomass feedstocks
in the residential sector exist, in particular for developing countries. According to the Intergovernmental Panel
on Climate Change (2011), an estimated 6-12 EJ/year of biomass for the informal sector is not included in
official energy balances.

2
and space heating. This traditional use of biomass plays a crucial role in many developing
countries, but often has severe health and environmental impacts. In most OECD countries,
bioenergy plays only a minor role in buildings, although it has been increasingly used in a
number of countries due to supportive policies, and relatively high prices for heating oil and
natural gas. In some countries, such as Sweden, Finland, and Austria, the use of biomass for
district heating is common and other countries are now following this path.
Bioenergy electricity supply has risen steadily over the last decade and, in 2010, bioenergy
provided around 400 TWh of electricity globally, equivalent to almost 2 % of world
electricity production (IEA, 2014c). Power generation from biomass is still concentrated in
OECD countries, but China and Brazil are also becoming increasingly significant producers,
thanks to programmes to support biomass electricity generation. Models established in China
and Brazil could also become a viable way to promote bioenergy electricity generation in
other non-OECD countries.
While biofuels for transport have been produced since the late 19th century, it was only in the
1970s that commercial biofuel production gained momentum, with both the US (corn
ethanol) and Brazil (sugarcane ethanol) introducing ambitious support programmes. The
strongest growth in global production took place over the last decade, during which biofuel
production increased from 18 billion litres in 2001 to 116 billion litres in 2013 (IEA, 2014c).
This increase came mainly as a result of strong support policies.
3. VISION FOR BIOENERGY AND BIOFUELS
In the 2DS, which serves as the basis for the IEA technology roadmaps, bioenergy’s
contribution to the global primary energy supply increases from around 55 EJ in 2009 to
about 160 EJ in 2050. Bioenergy would then provide around one fifth of total primary energy
supply in 2050, compared to 10 % today. In the scenario, around 100 EJ of this primary
bioenergy supply are needed to provide electricity and heat, and another 60 EJ are needed to
produce transport fuels.
3.1 Technology options for heat and power
Realising this vision of bioenergy heat and electricity supply in a cost- and resource-efficient
manner will require a set of conversion technologies to be deployed, of varying scale. Small-
scale systems (<1 MW), including efficient biomass stoves, are best suited to providing heat.
In many cases, this heat can be provided at costs similar to or lower than fossil fuel-derived
heat. At larger scales, heat generation from biomass becomes competitive for both industry
and commercial buildings, and this competitive advantage could be further increased by
introducing a CO2 price for fossil fuels. Where a steady demand for heat exists, for example
in a district heating network, co-generation plants for heat and power can also be a viable and
very efficient option, justifying the higher capital costs in comparison to a heating or power-
only plant.
Small-scale power plants of less than 10 MW suffer from poor electric efficiency and high
capital costs per output unit. Generation costs for bioenergy electricity in those plants are
therefore only competitive if feedstock can be sourced at very low cost and if fossil-generated
electricity is relatively expensive. Large-scale electricity and co-generation plants will
therefore be key to achieving the roadmap targets outlined above, as they allow for higher
generation efficiency, and lower generation costs. But a solid CO2 price of around USD 90
per tonne of CO2 by 2030 or dedicated economic support measures would be needed, together
with further technology improvements, to make bioenergy electricity generation generally

3
competitive with coal and gas-generated electricity. New technologies that are currently on
the edge of commercialisation (such as biomass integrated gasification combined cycles,
biomass gasification and upgrading to biomethane) and highly efficient small-scale co-
generation systems will be needed in the longer term to meet the targets for bioenergy
electricity and, to a smaller extent, for heat supply that are envisioned in the roadmap.
3.2 Biofuel technologies
Conventional biofuels produced from starch-, sugar-, or oil-bearing crops and, to a smaller
extent, from waste cooking oil and animal fats account for virtually all biofuel in the market
today. In some cases, these fuels can be competitive with conventional gasoline and diesel,
but often production costs are higher than those for fossil fuels. One of the key factors is the
price of feedstock, which can account for up to 80 % in conventional biofuels. There is still
some scope to improve conversion efficiencies, reduce energy demand, and develop more
profitable co-product streams and production costs could improve as a result. However, in the
longer term, feedstock price volatility will threaten margins, and sustainability concerns such
as the potential for CO2 reduction will likely limit the role of conventional biofuels.
Advanced biofuels produced from lignocellulosic energy crops and residues will play a key
role in realising the vision set out in the IEA biofuel roadmaps. Lignocellulosic ethanol,
biomass-to-liquid fuels and bio-synthetic natural gas, currently at a pre-commercial stage,
still have potential to reduce production costs. Scaling up production units and making further
improvements in process efficiencies will be key to realising these cost reductions. Around
2030 several advanced biofuels could become competitive with fossil gasoline and diesel, or
at least be nearly so.
3.3 Vision for bioenergy electricity
With increasing economic growth, world electricity demand in the 2DS will grow rapidly,
from about 23000 TWh in 2013 to 40200 TWh in 2050. The proportion of renewable
electricity will increase from 22 % in 2013 to almost 65 % in 2050. The remaining 35 % is
expected to come from nuclear power and coal, natural gas and other fossil sources, most of
which are expected to be equipped with carbon capture and storage technology.
Based on this roadmap, global bioenergy electricity generation capacity is expected to
increase from around 90 GW in 2013 to 550 GW in 2050, 20 GW of which are expected to be
equipped with carbon capture and storage technology. Global bioenergy electricity generation
will increase significantly, from around 400 TWh in 2013 to 3 250 TWh in 2050, with around
140 TWh of this coming from plants equipped with carbon capture and storage technology.
Bioenergy electricity generation could provide around 8.4 % of world electricity generation,
compared to 1.7 % today (Figure 1).
3.4 Vision for bioenergy use in buildings
The buildings sector is the largest consumer of bioenergy today, and is expected to maintain
this position throughout the projection period. This is despite a considerable decrease in the
bioenergy demand for heating and cooking, projected to decline from 35 EJ in 2013 to 28 EJ
in 2050. Driven by a fast growing population, biomass use for cooking and heating will
remain a significant source of energy, particularly in rural areas of many developing countries
in Africa and Asia. The widespread deployment of efficient biomass cooking stoves and
household biogas systems and of alternative technologies (e.g. solar cookers and solar heating

4
installations) will be crucial to ensuring that this growing energy demand is met by clean and
efficient technologies. This switch to clean and more efficient fuels, in combination with
energy efficiency improvements in buildings, will eventually result in the expected reduction
in bioenergy demand in this sector. Bioenergy would, however, still account for around one
fifth of the total energy consumption in buildings by 2050, with the majority of this being
consumed in Africa and Asia. In OECD countries, bioenergy demand in the residential sector
will roughly double from 3 EJ in 2009 to 8 EJ in 2050, driven by demand for space heating
and water heating. Demand for cooling might also become a driver for bioenergy use in
buildings in the longer term, although the relative costs of thermally-driven cooling devices
might mean that cooling will be provided by electricity or other means.
3.5 Bioenergy consumption in industry
One of the fastest growing sectors in terms of bioenergy demand is the industry sector, where
this roadmap anticipates final bioenergy demand increasing from 8 EJ in 2013 to 24 EJ (17 %
of the total final energy demand in industry) in 2050 (Figure 1).
Biomass is already used to provide process heat in the wood processing and pulp and paper
industry, mainly from process residues. Considerable amounts of charcoal are also used to
provide high-temperature heat in the iron and cement industry in Brazil, where biomass
accounts for more than a third of the final energy consumption (UNIDO, 2011). To achieve
the roadmap’s vision, bioenergy consumption in these sectors needs to increase and become
more efficient. Other energy-intensive sectors (such as the cement industry or the chemical
and petrochemical industry) may also use a considerable proportion of bioenergy, but more
concerted effort would be required to achieve this, since these sectors are not currently
involved in biomass and bioenergy value chains. As the price for CO2 emissions rises over
the projection period, industrial demand for bioenergy will grow considerably. In the medium
term, the growth in demand in OECD countries is expected to slow down, but strong growth
is expected to continue throughout the projection period in non-OECD countries.
Figure 1: Industrial demand for bioenergy (left) and
bioenergy electricity generation (right) by region in the 2DS
3.6 Biofuels
Economic growth also leads to higher vehicle ownership rates, more shipping of goods and
more air travel. As a result, demand for transport fuel is growing rapidly, especially in

5
emerging economies. Despite the projected large improvements in vehicle efficiency and the
increase in deployment of electric and plug-in hybrid vehicles, the emission reduction targets
in the 2DS cannot be met without considerable use of low-carbon biofuels to replace fossil
fuels, in particular in the shipping and aviation industries. Globally, demand for biofuels is
expected to grow from 2.5 EJ in 2013 to 29 EJ in 2050, which means that biofuels will
eventually meet almost one third of the global demand for transport fuel.
Figure 2: Demand for biofuels in different world regions (left)
and the role played by different conversion technologies (right).
Note: Due to an update of the underlying model for the 2014 edition of Energy Technology Perspectives, these
numbers differ slightly from those in the original roadmap, published in 2011.
Over the next decade, demand for biofuel is expected to be highest in the OECD countries,
which together currently account for 70 % of global demand for biofuel. In the longer term,
however, non-OECD countries will account for more than 50 % of the global demand for
biofuel, with the strongest demand projected to be in China, India and the non-OECD
countries in Central and South America. Advanced biofuels will play a key role in achieving
the vision in the roadmap. The first commercial advanced biofuel projects are expected to
start between 2015-20 in the United States and Europe, as well as in Brazil and China, where
several pilot and demonstration plants are already operating. Conventional biofuels are
expected to play a role in increasing production in many developing countries, because the
technology needed is less costly and less complex than that needed for advanced biofuels.
Once the technologies have been tested and proven and feedstock supply plans have been
established, advanced biofuels will also be introduced to other emerging and developing
countries. Feedstock and biofuel trade will play an increasingly large role in regions with
limited land and feedstock resources, such as the Middle East and certain Asian countries.
4. FEEDSTOCK DEMAND — IMPLICATIONS FOR SUSTAINABILITY
4.1 Biomass demand in 2050
In 2050, an expected total of 100 EJ (i.e. roughly 5-7 billion dry tonnes) of biomass will be
required to meet the demand for heat and power outlined above, in addition to an expected 60
EJ (3-4 billion dry tonnes) needed to produce transport fuels. This is a considerable increase

6
on the estimated 55 EJ of biomass used for energy production today. Thorough analysis of
estimates of global bioenergy potential for 2050, for example those provided by the
Intergovernmental Panel on Climate Change in 2011, suggests that substantial amounts of
biomass could be sourced from agricultural and forestry residues and wastes. With substantial
investment to improve agricultural production, considerable amounts of land could be made
available for cultivating dedicated energy crops. Much of this potentially available land is
located in eastern Africa, South America and eastern Europe.
Residues and wastes will play an important role in supplying sufficient amounts of biomass
in a sustainable manner. However, complex logistics and costs related to their collection and
transport will likely constrain the amount of biomass that can be mobilised in a cost-efficient
manner. Dedicated energy crop plantations will therefore be needed to provide the necessary
amounts of biomass for large-scale power plants and the biofuel conversion units that are
needed to meet the demand for heat, power and transport fuel predicted in the 2DS. In total,
between 270 Mha and 400 Mha of land would be needed for energy crops to provide around
two thirds of the 160 EJ of biomass needed, with the remaining proportion expected to come
from residues and wastes. The amount of land needed will depend strongly on the land-use
efficiency, i.e. the yield per hectare, with which energy crops can be produced in the future.
Analysing biomass potentials over a 40-year period inevitably relies on assumptions on a
number of uncertain factors, which will always be subject to debate. This is particularly true
for bioenergy, since its development is influenced by trends in the agricultural and forestry
sectors, as well as the energy sector. In light of these uncertainties, rather than debating
whether the size of the global bioenergy potential in 2050 could reach 100 EJ or 500 EJ, a
more pragmatic approach — in the form of an intermediate target for biomass supply — is
needed, to plan the sector’s development in the short and medium term. A key milestone in
the IEA roadmaps is to find ways to validate, demonstrate, and mobilise another 50 EJ of
biomass for energy purposes (i.e. doubling current primary bioenergy supply) in a sustainable
manner by 2030. This should be done with a primary focus on ‘available’ feedstocks such as
residues and wastes, but will also need to include energy crops. Achieving this intermediate
goal will provide important lessons on the logistical, technical, ecological and economic
feasibility of large-scale biomass supply, as well as a better understanding of the positive and
negative environmental, social and economic effects, including effects on related sectors.
This experience is expected to then allow more realistic expectations of the role sustainable
bioenergy can play in the future energy system.
4.2 Need to ensure sustainability
One important driver for the development of heat and power generated from biomass and for
biofuels used in the transport sector is the need to reduce lifecycle GHG emissions compared
to the use of fossil fuels. These emission reductions could be achieved if biomass feedstocks
were sourced on a renewable basis and GHG emissions relating to cultivation, harvest,
transport and conversion into final energy are kept at as low as possible. Thorough lifecycle
analyses show that, under these conditions, bioenergy heat and power can provide significant
emissions reductions compared to fossil fuels.
Biofuels for transport can also have a very positive impact on emission reductions, but the
emission saving potential depends strongly on the feedstock type. Biofuels based on
agricultural crops that require intensive fertiliser and pesticide input, such as soy, canola, and
cereals, typically show lower potential for GHG emissions reduction than those based on
wastes (e.g. used cooking oil), or very efficient crops such as sugarcane. Advanced biofuels,
produced from lignocellulosic crops and residues, promise to offer significant GHG
7
emissions reductions, but reliable data from commercial production will be needed to verify
these predicated results.
While lifecycle GHG emissions of bioenergy heat and power and biofuels can be
significantly lower than those of fossil fuels, concerns have been raised that the GHG
emissions reduction benefits of bioenergy can be reduced or negated by CO2 emissions
caused by land-use change.3 The level of CO2 emissions depends on when and where the
changes take place, and how the respective carbon stocks (in form of standing biomass as
well as soil carbon) and emission cycles are modified when managed for bioenergy
feedstocks as compared to a business-as-usual scenario. Depending on the pace of plant
regrowth, it might take several decades to remove the initial atmospheric CO2 that is released
(if any) when establishing an energy crop plantation (Bird et al., 2011; Cherubini et al.,
2011). Some data on emissions from direct land-use change are available (see for instance
Fritsche et al., 2010), but the exact order of magnitude of emissions resulting from indirect
land-use change is still subject to intensive research efforts. Results from studies on
emissions relating to indirect land-use change, caused by conventional biofuels for transport,
indicate that GHG emissions can in some cases be very high (E4Tech, 2010; Edwards et al.,
2010; Tyner et al., 2010), but results vary between different studies and no consensus has yet
been reached.
It is therefore generally preferable to manage land-use so as to reduce large initial releases of
GHG and lead to additional biomass growth and carbon sequestration compared to the
previous land use. In some cases, however, it may make sense to put large bioenergy schemes
in place that cause a temporary decline in carbon stocks, if the scale of GHG savings by
replacing fossil fuels still allows for longer term emission reductions in the energy sector.
This approach should then lead to a stabilisation of atmospheric CO2 levels, as envisioned in
the 2DS that underlies the IEA technology roadmaps.
CO2 emissions are, however, not the only relevant topic to the sustainability of bioenergy and
biofuels. A variety of different environmental, social and economic issues also need to be
addressed to ensure that the envisioned supply of bioenergy for heat and power and the
production of biofuels outlined above have an positive impact overall compared to the use of
fossil fuels. Governments should therefore adopt sustainability requirements for bioenergy,
following internationally agreed sustainability criteria and evaluation methods, and making
use of existing certification schemes for forest products, and those for biofuels. International
harmonisation of certification schemes will be crucial, to provide credible certification
schemes and avoid market disturbance or creation of trade barriers.
Specific attention must be paid to including smallholders in certification schemes, since these
producers often cannot accommodate the additional costs of complying with certification. If
these concerns are addressed adequately, sustainability certification will likely become a
driver for the development of an international bioenergy market. However, additional
measures are also needed to address the unsustainable use of land and water resources and the
issues related to (indirect) land-use changes. Integrated land-use management schemes will
be key to tackling these issues, but to be effective they will ultimately need to address the
risks related to land-use change in the whole agricultural and forestry sector. This will be
necessary to ensure more efficient and sustainable production of food, feed, bioenergy and
other services.
3 The land-use change can be either direct, as when energy crops are grown on land that was previously used for
a different purpose, or was previously not managed at all; or indirect, when energy crop production in one place
displaces the production of other crops or increases the overall demand for biomass, which is then produced on
other land (perhaps in another region or country).

8
5. KEY ACTIONS IN THE NEXT 10 YEARS
Energy from biomass — whether this is electricity, heat or transport fuels — has the potential
to provide considerable GHG emissions reductions compared to fossil fuels, and can also
contribute substantially to increasing energy security and promoting socioeconomic
development. To ensure that these benefits can be realised, energy- and resource-efficient
technologies, a strong policy framework, and commitment by all stakeholders towards
sustainable production practices along the value chain will be needed.
In order to stimulate investment on the scale required to achieve the level of bioenergy heat
and power and biofuels in the 2DS, governments must lead on creating a favourable climate
for industry investments by taking action on policy, markets and international cooperation. In
particular, governments should:
- create a stable, long-term policy framework for bioenergy and biofuels to increase investor
confidence and allow for private sector investments in the sustainable expansion of bioenergy and
biofuel production;
- introduce efficient support mechanisms for bioenergy that effectively address the specifics of
both electricity and heat markets, and provide sound support for sustainable biofuels, including
dedicated measures to promote the production and use of advanced biofuels;
- link financial support schemes to the sustainable performance of bioenergy heat and power and
biofuels to ensure significant lifecycle GHG emission savings compared to fossil fuels;
- replace traditional biomass use through more efficient stoves and clean fuels (e.g. biogas) by the
creation of viable supply chains for advanced biomass cooking stoves and household biogas
systems;
- support the installation of more pilot and demonstration projects, such as innovative plans for
small-scale combined heat and power (CHP) plants, and advanced biofuel conversion routes,
including their complete supply chains;
- increase research efforts on developing energy crops and land suitability mapping to identify the
most promising feedstock types and locations for future scaling up;
- set medium-term targets for biofuels and bioenergy that will eventually lead to a doubling of
current primary biomass supply (i.e. to 100 EJ) by 2030, which will help to establish supply
chains, assess the impact on sustainability and identify viable options for effectively integrating
bioenergy production in biomass value chains;
- implement internationally agreed sustainability criteria, indicators and assessment methods for
bioenergy, which should provide a basis for developing integrated land-use management schemes
that aim for more resource-efficient and sustainable production of food, feed, bioenergy and other
services;
- introduce internationally aligned technical standards for biomass and biomass intermediates, in
order to reduce and eventually abolish trade barriers, enhance sustainable biomass trade and tap
new feedstock sources;
- support international collaboration on capacity building and technology transfer to promote the
adoption of best practices in sustainable agriculture, forestry and bioenergy production.
6. REFERENCES
- Bird, N., A. Cowie, F. Cherubini and G. Jungmeier (2011), Using a life-cycle assessment
approach to estimate the net greenhouse-gas emissions of bioenergy, IEA
Bioenergy:ExCo:2011:03
9
- Cherubini, F., G.P. Peters, T. Berntsen, A.H. Stromman, and E. Hertwich (2011),
‘CO2 emissions from biomass combustion for bioenergy: atmospheric decay and contribution
to global warming’, GCB Bioenergy, Vol. 3, No 5, pp. 413-426.
- E4Tech (2010), A causal descriptive approach to modelling the GHG emissions associated
with the indirect land use impacts of biofuels, Study for the UK Department for Transport,
E4Tech, London
- Edwards, R., D. Mulligan, and L. Marelli (2010), Indirect Land-use change from
increased biofuels demand. Comparison of models and results for marginal biofuels
production from different feedstocks, EC Joint Research Centre, Ispra
- IEA (2014a), Energy Technology Perspectives 2014, OECD/IEA, Paris
- IEA (2014b), Renewables Information 2014, OECD/IEA, Paris
- IEA (2014c), Medium Term Renewable Energy Market Report 2014, OECD/IEA, Paris
Tyner, W.E., F. Taheripour, Q. Zhuang, D. Birur and U. Baldos (2010), Land-use changes
and Consequent CO2 Emissions due to US Corn Ethanol Production: A Comprehensive
Analysis, Purdue University: West Lafayette
- UNIDO (United Nations Industrial Development Organisation) (2011), Renewable Energy
in Industry Applications, UNIDO, Vienna
- IPCC (Intergovernmental Panel on Climate Change) (2011), IPCC Special Report on
Renewable Energy Sources and Climate Change Mitigation, prepared by Working Group III
of the Intergovernmental Panel on Climate Change [O. Edenhofer, R. Pichs-Madruga, Y. —
Sokona, K. Seyboth, P. Matschoss, S. Kadner, T. Zwickel, P. Eickemeier, G. Hansen, S.
Schlömer, C. von Stechow (eds)], Cambridge University Press, Cambridge and New York


11
Bioenergy and technology from a sustainable perspective:
Experience from Europe and the global context
U.R.Fritsche and L.Iriarte
International Institute for Sustainability Analysis and Strategy (IINAS),
Heidelberger Str. 129 ½, D-64285 Darmstadt, Germany
Summary
This paper aims to provide an overview of the advantages of and the concerns raised by
increasing the use of biomass for bioenergy production and consumption. It begins by
describing the current situation for agricultural and forest biomass used in developing and
developed countries and analysing its future potential. The proportions of various types of
biomass used for bioenergy are given, with particular attention to the biomass-land nexus. The
paper shows global and European potential for producing biomass from various origins
(wastes/residues, degraded land, arable land and grassland). The paper then goes on to
examine sustainability factors, the alternatives to address them, and current challenges to
improving sustainability. The paper also considers the challenges for promoting sustainable
biomass, and the way ahead.
1. BIOMASS IN THE GLOBAL CONTEXT
The term biomass refers to any material that could be used for food, feed, fibre and fuel. As
biomass is needed for different sectors, complex links are generated between the various
sectors.
Figure 1 shows an overview of the generic biomass flows, from production to end-uses in the
agriculture and forestry sectors. In both sectors, traditional materials (those dedicated to the
food industry or the wood-related industries) and ‘new’ biomaterials and waste are produced.
Some of the materials produced in any biomass flow can be used in the energy sector,
regardless of the intended end-use of the energy (electricity, heat, transport).
In 2008, the largest agricultural biomass use was feed (74 %), followed by food (18 %) and
materials and bioenergy (4 % each), totalling about 10 billion tonnes (IINAS, IFEU 2012
based on nova 2012). In the forestry sector, 55% of biomass produced was used as fuelwood,
while material uses comprised 45 % of the total of 3.5 billion m3 produced (Faostat 2013).
Additional pressures on natural resources (e.g. on land and water) are expected in the coming
decades (FAO 2011), as a result of population growth and the corresponding increase in
demand for biomass. This could lead to increased competition, which could result in disputes
over the use of biomass potentials by various sectors or for different purposes (see Figure 2).
Alternatively, this additional pressure could create incentives for resource efficiency (IINAS,
IFEU 2012). The need for a balanced approach between the various competing uses lies at the
very heart of the response to these additional pressures.

12
Figure 1: Biomass flows from cultivation to bioenergy end-uses
(Source: Oeko-Institut, IINAS, Alterra 2012)
-
Figure 2: Competing uses of biomass
(Source: IINAS, IFEU 2012)

13
2. BIOENERGY: PRESENT AND FUTURE
2.1 Shares of global primary bioenergy
In 2008, biomass provided about 10.2 % of the total primary energy supply worldwide (50.3
EJ of 492 EJ consumed worldwide), with traditional biomass being the most commonly used
type of biomass, as shown in Table 1 (Chum et al. 2011). Worldwide, in 2010, bioenergy
provided 1.5 % of the electricity generated and 8 EJ of heat used in the industry sector (IEA
2012a), while biofuels totalled around 3 % of fuels used by road transport (IEA 2012b).
Despite a lack of accurate statistics, around 40 EJ (equalling about 75 % of the biomass used
for energy) is estimated to be used in traditional ways, mainly in developing countries,
primarily for cooking and heating. In many cases, this means open fires and small stoves with
very low efficiency, causing health problems and leading to the overexploitation of forest
resources in some places (IEA, UNDP, UNIDO 2010). In response, initiatives at various
levels have been launched, such as the UN Secretary General’s ‘Sustainable Energy for All’
programme (‘SE4All’) which includes the objectives of:
- universal access to modern energy services by 2030;
- doubling the global rate of improvement in energy efficiency; and
- doubling the proportion of renewable energy in the global energy mix (SE4All, 2012).
Average primary energy
(EJ/year)
Approximate average
efficiency (%)
Traditional bioenergy 37-43 10-20
Modern bioenergy 11.3 58
Table 1: Traditional and select modern biomass energy flows in 2008
(Source: Chum et al. 2011)
Fuelwood is the feedstock category most commonly used to produce bioenergy worldwide
(67 %), followed by charcoal (7 %), residues from various forestry activities (13 %),
agriculture (10 %) and MSW and landfill gas (3 %) (Chum et al. 2011).
2.2.The future: bioenergy in the global system
The future role bioenergy plays in providing heat, electricity and transport fuels depends on
several factors, including its relative competitiveness in comparison with other renewable
energies and its own merits in terms of efficiency and trade-offs. For some end-uses, other
renewable energy alternatives exist (such as PV and wind for electricity), but for certain
transport sectors such as marine ships, heavy-duty trucks and aircrafts, biofuels are the only
form of renewable energy that can be used in the coming decades (IINAS, IFEU 2012).
Bioenergy’s capacity for long-term reduction of greenhouse gases (GHG) emissions will
continue to be a key reason to promote it, limiting reliance on fossil fuels and supporting rural
development. The European Commission has reaffirmed its commitment to decarbonisation
and renewable energies in the post-2020 period (EC 2012 a-c; EC 2011).
Currently, almost all biofuels are ‘first generation’ biofuels (obtained from starch, sugar or
vegetable oils crops) that compete for resources (such as land) with other biomass uses.
Advanced — ‘second generation’ — biofuels can be made, using various conversion
technologies, from lignocellulosic materials such as cellulosic ethanol or Fischer-Tropsch
diesel. However, their costs will be relatively high, and a market introduction programme will
be necessary (IINAS, IFEU 2012).

14
By 2050, 7.5 % of world electricity generation and 46 EJ of heat in the industry and
construction sector is expected to be supplied from bioenergy, equalling 17.25 % of the total
supply (IEA 2012a). Large-scale power plants (>50 MW), co-firing plants, and smaller-scale
heating plants (<10 MW) will all have a role to play in reaching these targets.
At a global level, the IEA bioenergy roadmap for heat and power (IEA 2012a) envisages a
significant increase in the global bioenergy supply, of 160 EJ by 2050. Of this, 100 EJ will be
used for heat and power generation (5-7 billion dry tonnes) and 60 EJ for producing biofuels
(3-4 billion dry tonnes).
3. LAND USE FOR BIOMASS AND BIOENERGY
Currently, meat and dairy production accounts for about 92 % of agricultural land use, while
biofuels use 2 %. One of the main drivers for land use is, therefore, food demand. More
sustainable food consumption is therefore necessary, using fewer animal products and
optimising food supply chains to avoid waste.
Bioenergy is, however, much more land intensive (106-164 m2/GJel) than fossil fuels (<0.5
m2/GJel) or other renewable energies (<3 m
2/GJel) (Fritsche 2012a). Energy generation from
biomass is more than 300 times more land intensive than the EU-27’s current electricity mix.
Land use will therefore be a key criterion when considering different types of bioenergy.
There are several studies regarding global biomass potentials, which have produced very
different results depending on the assumptions made. It is not therefore possible to give one
single figure for bioenergy potential, and a range must be given instead, taking into account
questions of sustainability. Figure 3 provides an overview of the expected global energy
demand and bioenergy potentials in 2050. Global sustainable bioenergy potentials could reach
between 200 EJ and 500 EJ for the low and high scenarios, respectively. The various
categories assessed show that waste and residues (50-100 EJ) and degraded land (25-100 EJ),
which are the least risky categories in terms of overall environmental performance, could
supply a total of between 75 and 200 EJ of bioenergy without using additional agricultural
land, thus preventing indirect land use changes.
Depending on developments in yield and consumption, another 200 to 300 EJ from arable
land and grassland could become available, if this land were no longer needed for food and
feed production. These estimations should be treated with caution, however, as they are based
on uncertain factors such as yield increases.
By 2030, the total primary energy demand in the EU-27 is expected to decrease, while
demand in the transport sector is expected to remain at about 15 EJ, as shown in Figure 4.
According to calculations from the Biomass Futures project (IC et al. 2012), about 17 EJ of
bioenergy potential will be available by 2030 in the reference scenario, with a slightly smaller
amount available in the sustainable scenario, but at a lower cost. (In the sustainable scenario,
more restrictive sustainability criteria are set on the type of biomass that can be used, which
must meet binding sustainability criteria and higher GHG emissions savings.)
In both scenarios, the largest potential (66 % in the reference scenario and 68 % in the
sustainability scenario) for 2020 is available at a cost below 200 €/toe. This group includes
waste, primary residues and some dedicated cropping potential from the agriculture sector,
and secondary and tertiary residues from the forestry sector.

15
Figure 3: Global energy demand and bioenergy potentials by 2050
(Source: IINAS, IFEU 2012 based on IEA 2012c, IPCC 2011, Fritsche u.a. 2010)
Figure 4: European energy demand and bioenergy potentials by 2030
(Source: IINAS, IFEU 2012 based on IC 2012)

16
4. BIOENERGY AND SUSTAINABILITY: A MUST
4.1. Sustainability frameworks: global and EU
During recent decades, much work has been done to reduce pressure on ecosystems and to
introduce more rational use of natural resources. An early milestone in this process was the
development of voluntary forest certification schemes in the 1990s to ensure sustainable
forest management. When new international bioenergy markets were developed in the last
decade, mainly driven by European policies, stakeholders demanded that these should also
consider sustainability. Generally speaking, three main pillars have to be considered when
talking about sustainability: social, economic and environmental aspects, even if this point of
view is not universally shared. The following general principles should be considered
(Fritsche 2012b; IEA Bioenergy 2013; IINAS, CENBIO 2014):
- Resource efficiency: a minimum net energy yield should be achieved along the bioenergy
chain (production, conversion and logistics) for both cultivated feedstocks, and residues.
- GHG emissions reduction in comparison to fossil fuels: this is one of the main reasons for
promoting use of biomass. GHG emissions associated with indirect land use changes should
be also included in the life cycle analysis.
- Prevention of biodiversity losses: feedstocks should not come from certain types of land
(e.g. primary forests, protected areas, highly biodiverse grassland, areas with high C stocks, or
peatlands). Sustainable management in agricultural and forest areas is also needed. For
example, the EU Renewable Energy Directive (RED) requires agricultural feedstock to be
cultivated in accordance with the rules in the common agricultural policy. Supplies from
forests should be in line with the principles of sustainable forest management.
- Avoidance of other environmental impacts: impacts on soil (erosion, soil organic carbon,
and nutrient balance), water (quality, use efficiency) and airborne emissions (SO2 equivalents
and PM10) should be considered.
- Contribution to local prosperity and welfare: social well-being should be considered within
the bioenergy value chains. Since food security and woodfuels are key to meeting basic needs,
especially in developing countries, promotion of bioenergy should take into account pricing
and supply of the national food basket and woodfuels, land tenure and rights, livelihoods and
labour conditions.
The number of sustainability approaches in the bioenergy sector increased significantly in
recent years, leading to many schemes with varying purposes and goals. These schemes may
be grouped by the following variables:
- Type of regulation: mandatory or voluntary.
- Type of feedstock: forest biomass, agricultural crops, or all biomass.
- Type of bioenergy: liquid biofuels, solid biomass or all (including gaseous).
- Level at which the scheme applies: international, regional or national.
- Scope for sustainability: environmental or holistic approach (including consideration of
economic and social criteria).
- Sector of origin: energy or sectoral approach (forestry, agriculture). This affects the
approach taken and therefore the criteria to be included (for example, traditional forestry
schemes do not consider GHG emissions reductions but some schemes, e.g. PEFC, do attempt
to consider these).

17
In summary, the most relevant initiatives working towards more sustainable bioenergy
production are the following (IINAS, CENBIO 2014):
- EU RED (EU 2009). The consideration of binding sustainability criteria (e.g. ‘no-go’ areas
for biodiversity and carbon protection, GHG savings in comparison to fossil fuels) for
biofuels and bioliquids that contribute to meeting bioenergy targets has meant a decisive step
forward for sustainability regulation frameworks worldwide. Other concerns in the social
realm need only be reported periodically.
- National initiatives, e.g. initiatives from Brazil (e.g. environmental zoning), the Netherlands
(NTA 8080 and NTA 8081, and Biomass Protocol), Belgium (initiatives at regional level), the
UK (the ‘renewables obligation’) and the USA (the renewable fuel standard and the California
low carbon fuel standard).
- Voluntary guidelines that the European Commission recognises as compliant with the EU
RED. In May 2013, the Commission recognised 13 schemes. Some of these limit their criteria
to those set out in the RED, while others (such as the ISCC and the RSB) have a broader
scope.
- Other voluntary initiatives from the private sector, with varying degrees of ambition
depending on the stakeholder promoting them. These include specific guidelines developed
by utility companies (e.g. the initiative by wood pellet buyers), sectoral industries and NGOs
(e.g. voluntary forest certification schemes such as FSC or PEFC).
- The Global Bioenergy Partnership. In 2011, the partnership endorsed a list of 24 social,
environmental and economic indicators, aimed at guiding bioenergy analysis at national level.
- Other sectoral regulations and processes. The EU Timber Regulation, for example, aims to
ensure that illegally harvested wood and wood products do not enter EU markets, and it is
assumed that this will affect bioenergy from wood. This section also includes the ongoing
Forest Europe negotiations on binding SFM criteria and indicators.
- Standardisation committees: the International Standardisation Organisation is working on
developing a voluntary standard that will be applicable across all forms of bioenergy (ISO
13065). The CEN/TC 383 committee for sustainably produced biomass for energy
applications is also developing a European standard for sustainable biomass for energy
applications (prEN 16214), closely linked to the EU’s RED.
- Other international initiatives. These include the UN’s Food and Agriculture Organisation
(FAO) criteria and indicators for sustainable woodfuel, the FAO bioenergy and food security
analytical framework and related work, the Inter-American Development Bank biofuels
sustainability scorecard, the International Finance Corporation’s policy on environmental and
social sustainability and the UN-Energy bioenergy decision support tool.
This broad variety of approaches to meeting the sustainability indicators faces multiple
challenges. For example, the proliferation of certification schemes has caused confusion
among stakeholders, distorted the market, led to trade barriers and increased commodity costs.
As a result, in 2013, IEA Bioenergy suggested creating a global harmonised approach to
overcome these limitations and to develop an effective and cost-efficient system.
4.2 Sustainability: the way forward
In addition to the need for a common approach and the operational concerns facing
sustainability, other technical aspects are the subject of scientific debate and will influence
further bioenergy developments. These include:
- Promoting resource efficiency in using materials, especially wood (Kretschmer 2012). There
has been growing demand for both traditional biomaterials (in particular, wood used in
furniture and in the construction sector) and new biomaterials (such as bio-plastics and bio-

18
chemicals). The ‘cascading use’ approach to biomass aims to maximise the value extracted
from a given amount of biomass by meeting both material and energy needs from the same
feedstock. The approach encourages the use of biomass as materials, including reused and
recycled materials, and, therefore, the use of biomass to generate energy should come during
its end-of-life cycle. The merits of this approach include the creation of more jobs, adding
more value to the economy, and increased resource efficiency in comparison to
straightforward use of biomass to produce bioenergy (CEPI 2012).
- Carbon counting forest biomass (Fritsche et al. 2012, JRC 2013). Although life cycle
analyses of forest bioenergy generally show high GHG savings in comparison to fossil fuels,
there may be a carbon imbalance between the moment when biomass is combusted and the
point at which these emissions are reabsorbed by forests, due to the longer cycles of forest
growth. The time needed to absorb the same amount of carbon emitted by a bioenergy system
and a fossil reference is known as the ‘payback time’. It ranges from between 5 and 20 years
for forest residues, and up to centuries for stemwood. There are many variables that play a
role in these results, including the type of feedstock (i.e. forest residues, salvaged wood or
stemwood) and the reference systems used, including the forest baseline. The options for
determining temporal GHG accounting are highly controversial and are currently being
discussed by the international research community and other stakeholders.
- Ensuring the well-being of local communities. There has been much discussion about global
food security and liquid biofuels, with several studies arriving at different conclusions (e.g.
Ecofys et al. 2013, AETS 2013). The potential development of international trade in woody
biomass may create additional pressures on developing countries, in the competition for
woody resources and in relation to land tenure and land uses rights (see IINAS, CENBIO
2013). The principle of meeting local demand for food security, fuelwood, or other elemental
necessities (such as land and water) first should not be disregarded, and measures to avoid
distortions and displacements must be considered.
5. CHALLENGES FOR MOBILISING SUSTAINABLE BIOMASS
INTERNATIONALLY
EU markets will continue to be key international players with regard to international demand
for all types of biomass for bioenergy. The EU has significant domestic sustainable bioenergy
potential, but limited mobilisation capacity and high(er) final costs may lead to increasing EU
imports of various types of biomass for bioenergy and biomaterials. Factors that will affect
the EU demand for imports include:
- Revisions to the European Union emissions trading system (ETS) (EC 2012d). The ETS was
one of the EU’s flagship policies to mitigate climate change, introducing a ‘cap and trade’
emissions system (EU 2003). This directive provides one of the biggest incentives for large-
scale bioenergy heat and power generation in the EU, as bioenergy is considered CO2-neutral
if it complies with the sustainability requirements in the RED. The ‘back-loading’ of carbon
emission allowances, agreed in 2013 and currently being introduced, might increase the
impacts of the ETS, following the historically minimal CO2 certificate prices in place since
2011.
- Proposed amendments to the RED (EC 2012e). In 2012, the Commission proposed to reduce
the proportion of first generation biofuels derived from edible feedstocks from 10 % to 5 % in
the transport sector. In recent years, in addition to liquid biofuels, solid bioenergy has started
to play a role in international trade, mainly to feed large-scale co-firing utilities in some EU
countries, e.g. the UK and the Netherlands. Pellets have become the most internationally
traded solid biomass, thanks to their advantage in terms of density. The consumption of wood
pellets rose from almost 10 million tonnes in 2008 to 13.5 million tonnes in 2010, with an
19
estimated 3 million tonnes of wood pellets traded internationally in 2010 (IEA Bioenergy
2011).
Solid bioenergy’s external dimension could be similar to that of liquid biofuel, although from
different sourcing countries (for example Canada, the United States, Russia and Brazil),
resulting in varying advantages and risks. The extent to which this market evolves will greatly
depend on changes to the ETS within the EU and on policies to promote solid bioenergy in
other countries, such as China, South Korea or Brazil (IINAS, CENBIO 2014).
6. LOOKING AHEAD
To make the most of the biomass potentials for bioenergy in the bioeconomy sector, the
following challenges should be addressed:
- At the European level, revisions to the RED and the ETS show the limitations and
challenges that some policies may face. Therefore, a stable, long-term policy framework
needs to be created, allowing increased investor confidence and, as a result, subsequent
investment (IEA 2012a).
- Despite large potential, biomass is a limited resource that has to meet several demands and
goals, so must be used in the most efficient way possible. Encouraging cascading use for both
forest residues and crop residues will therefore be important.
- As biomass markets for bioenergy are becoming increasingly interlinked (for example,
lignocellulose for electricity/heat will compete with second generation biofuels, and the
transport sector will use electricity from biomass), consistent sustainability development is
needed. In the longer-term, a coherent set of rules ensuring the sustainability of all types of
biomass will be needed (IINAS, IFEU 2012).
- The development of second generation biofuels needs to be increased, as there is more risk
associated with first generation fuels because of their competition with other resources. From
2020 onwards, second generation biofuels are expected to enter the market, but suitable
conditions have to be created during this decade in order to achieve this (IINAS, IFEU 2012).
- The precarious reliance of people in many developing countries on inefficient and
unsustainable biomass requires attention. As part of addressing this, contributions to the
SE4All initiative to support global energy access should be encouraged.
7. REFERENCES
- AETS, 2013, Assessing the impact of biofuels production on developing countries from the
point of view of Policy Coherence for Development. Final report. Commissioned by the
European Commission; Diop D et al.
- CEPI (Confederation of European Paper Industries), 2012, Resource efficiency =
cascading use of raw material; Brussels
- Chum H et al., 2011, Bioenergy. In IPCC Special Report on Renewable Energy Sources
and Climate Change Mitigation; Edenhofer O et al. (eds); Cambridge University Press,
Cambridge, United Kingdom and New York, NY, USA.
- EC (European Commission), 2011, Energy Roadmap 2050; COM(2011) 885/2; Brussels
- EC (European Commission), 2012a, Communication — Renewable energy: a major player
in the European energy market (COM/2012/271); Brussels
- EC (European Commission), 2012b, Communication — Renewable energy: a major player
in the European energy market — Impact Assessment (SWD/2012/149); Brussels
- EC (European Commission), 2012c, Communication — Renewable energy: a major player
in the European energy market — Accompanying Staff Working Document
(SWD/2012/164); Brussels
20
- EC (European Commission), 2012d, Proposal for amending Regulation (EU) No
1031/2010 in particular to determine the volumes of greenhouse gas emission allowances to
be auctioned in 2013-2020
- EC (European Commission), 2012e, Proposal for a Directive of the European Parliament
and of the Council amending Directive 98/70/EC relating to the quality of petrol and diesel
fuels and amending Directive 2009/28/EC on the promotion of the use of energy from
renewable sources COM(2012) 595 final; Brussels
- Ecofys, Fraunhofer, BBH (Becher Büttner Held), EEG (Energy Economics Group),
Winrock International, 2013, Renewable energy progress and biofuels sustainability; EC
ENER/C1/463-2011-Lot2; Hamelinck et al.; Utrecht
- EU (European Union), 2003, Directive 2003/87/EC of the European Parliament and of the
Council establishing a scheme for greenhouse gas emission allowances trading within the
Community and amending Council Directive 96/61/EC; Brussels
- EU (European Union), 2009, Directive 2009/28/EC on the promotion of the use of energy
from renewable sources and amending and subsequently repealing Directives 2001/77/EC and
2003/30/EC; Brussels
- FAO (Food and Agriculture Organisation of the United Nations), 2011, Looking ahead
in world food and agriculture: Perspectives to 2050; Conforti P (ed.); Rome
- FAOSTAT-Forestry database 2013, Global production and trade of forest products in 2011;
FAO; Rome http://www.fao.org/forestry/statistics/80938/en/ - Fritsche U. u.a., 2010, Nachhaltige Bioenergie: Zusammenfassender Endbericht zum
Vorhaben ¨Entwicklung von Strategien und Nachhaltigkeitsstandards zur Zertifizierung von
Biomasse fur den internationalen Handel¨, Öko-Institut in Kooperation mit IFEU; i.A. des
UBA; Darmstadt, Heidelberg
- Fritsche U., 2012a, Own computation with GEMIS (Global Emission Model for Integrated
Systems); http://www.iinas.org/gemis-en.html
- Fritsche U., 2012b, Sustainable Bioenergy: Summary Report on Main Outcomes for Policy
Makers. Final D 4.4 Delivery of the Biomass Futures Project; Darmstadt
- Fritsche U. et al., 2012, Sustainability Criteria and Indicators for Solid Bioenergy from
Forests based on the Joint Workshops on Extending the RED Sustainability Requirements to
Solid Bioenergy; Darmstadt.
- IC (Imperial College) et al., 2012, Biomass Futures — Analysing Europe’s Future
Bioenergy Needs; collaborative EU-IEE project carried out by Alterra, CRES, ECN, IC,
ICCS, IEE P, IIASA and Oeko-Institut, London www.biomassfutures.eu
IEA (International Energy Agency), 2012a, Technology Roadmap. Bioenergy for Heat and
Power; Paris
- IEA (International Energy Agency), 2012b, Technology Roadmap. Biofuels for
Transport; Paris.
- IEA (International Energy Agency), 2012c, Energy Technology Perspectives 2012 —
Pathways to a Clean Energy System; Paris.
- IEA (International Energy Agency), Bioenergy 2011: Global Wood Pellet Industry
Market and Trade Study; Cocchi et al.; Florence.
- IEA (International Energy Agency), Bioenergy 2013: Strategic Intertask Study (Task
40/43/38): Monitoring Sustainability Certification of Bioenergy. Recommendations for
improvement of sustainability certified markets; Pelkmans L et al.
- IEA (International Energy Agency), UNDP (United Nations Development
Programme), UNIDO (United Nations Industrial Development Organisation), 2010,
Energy Poverty. How to make modern access universal? Special except of the World Energy
Outlook 2010 for the UN General Assembly on the Millennium Development Goals; Paris

21
- IINAS (International Institute for Sustainability Analysis and Strategy), IFEU
(Institute for Energy and Environmental Research), 2012, Biofuels — what role in the
future energy mix? Facts, trends and perspectives; commissioned by Shell Deutschland Oil;
Fritsche U et al.; Darmstadt, Heidelberg
- IINAS (International Institute for Sustainability Analysis and Strategy), CENBIO
(Centro Nacional de Referência em Biomassa, Brazil), 2014, Possibilities of sustainable
wood production, increase in sustainably produced wood energy and the impact on
developing and emerging countries; prepared for Deutsche Gesellschaft für internationale
Zusammenarbeit GmbH (GIZ); Fritsche U et al.; Darmstadt, Madrid, Sao Paulo.
http://www.iinas.org/tl_files/iinas/downloads/IINAS_CENBIO_2014_Sust_Woody_Bioenerg
y_GIZ_full.pdf
- IPCC (Intergovernmental Panel on Climate Change), 2011, IPCC Special Report on
Renewable Energy Sources and Climate Change Mitigation; Edenhofer O et al. (eds.); IPCC
Working Group III; New York
- JRC (Joint Research Centre), 2013, Carbon accounting of forest bioenergy. Conclusions
and recommendations from a critical literature review; Agostini A et al., Petten, Ispra
- Kretschmer B., 2012, Cascading Use: A Systematic Approach to Biomass beyond the
Energy Sector; Biomass Futures Final Workshop, 20 March 2012, European Parliament,
Brussels; IEEP (Institute for European Environmental Policy); Brussels
- nova (nova-Institut für Ökologie und Innovation GmbH), 2012, Stoffliche Nutzung von
Biomasse — Basisdaten fur Deutschland, Europa und die Welt; Raschka A, Carus M; Erster
Teilbericht zum F+E-Projekt, Ökologische Innovationspolitik — mehr Ressourceneffizienz
und Klimaschutz durch nachhaltige stoffliche Nutzung von Biomasse‘ i.A. des UBA; Hürth
- Oeko-Institut, IINAS, Alterra, 2012, Sustainable Bioenergy: Summary Report on Main
Outcomes for Policy Makers; Final D 4.4 Delivery of the Biomass Futures Project under the
Intelligent Energy Europe funding; Darmstadt, Wageningen
- SE4All (Sustainable Energy for All), http://www.sustainableenergyforall.org/objectives;
Accessed 20 May 2013


23
Quantifying GHG emissions derived from biofuels and bioenergy:
Upgrading the state of the art on N2O emissions from agricultural soils
M.A. Taboada and V.R.N. Cosentino
INTA, CIRN, Institute of Soils and CONICET
Los Reseros & Las Cabañas S/N, (1686) Hurlingham, Province of Buenos Aires,
Argentina
1. NATIONAL INVENTORY OF GREENHOUSE GASES AND CALCULATION
OF N2O EMISSIONS IN ARGENTINA (USING IPCC GUIDELINES, 1996 &
2003)
Nitrous oxide (N2O) is the main greenhouse gas (GHG) emitted by agriculture in
Argentina. It is produced from all the nitrogen that enters agricultural soils annually, the
main sources of which are synthetic fertilisers and crop residues, which contribute to
soil organic matter. In soils used for livestock production, animal manure and urine are
also a major source of nitrogen (N). N2O emissions from these sources occur naturally
in soils through the microbial processes of nitrification and denitrification.
Nitrification is the production of nitrate (NO3-) from soil organic matter, or more
precisely from the nitrogen it contains. Denitrification is the process of nitrate reduction
which may result in the production of nitrogen in various gaseous forms. N2O is a
by-product of both of these processes, as shown in Figure 1.
Figure 1: Structural equation model of N2O production mechanisms in the soil
(Dalal et al., 2003)
As explained above, both nitrification and denitrification produce N2O. The extent to
which each affects N2O emissions depends on the concentration of O2 in the soil, among
other factors. As the water-filled porosity of the soil increases and O2 content decreases,

24
more denitrification takes place than nitrification. When water-filled porosity exceeds
70 %, denitrification becomes responsible for all N2O emissions from the soil (Bateman
and Baggs, 2005). Anaerobic conditions usually occur when water-filled porosity is
high. This is typical of poorly drained soils, or agricultural soil which has been exposed
to high rainfall over a short period of time, e.g. low-lying fields which suffer from
flooding due to increased groundwater (Taboada and Panuska, 1985; Taboada and
Lavado, 1986; Vepraskas and Sprecher, 1997).
N2O emissions can be direct or indirect. Direct N2O emissions are caused by
nitrification or denitrification, while indirect N2O emissions are produced when N is
volatilised from fertiliser or animal urine, or leaches from the soil into rivers and
streams. It is generally thought that direct sources are responsible for more N2O
emissions than indirect sources. Not everyone agrees, however. For example, Crutzen
et al. (2007) have argued that, in some cases, indirect emissions can far outweigh direct
emissions, thus negating the alleged advantages of biofuels as a means of mitigating
global warming.
Figure 2 is a diagram showing the factors on which N2O emissions from soil depend.
These factors can be classified as proximal or distal, depending on their level of
influence (Rochette, 2010). See Snyder et al., (2007) for a recent and comprehensive
review of the influence of these factors.
1.1 Proximal factors
Figure 2: Proximal and distal factors affecting N2O emissions
from agricultural soils (Rochette, 2010)
Proximal factors have a direct effect on N2O emission rates. There are two main factors:
the soil conditions (redox potential, temperature, soil water content and soil pH) and the
Situation:
Soil properties:
Texture
Structure
Porosity OM
Landscape
Climate / weather
Management: Tillage Liming Irrigation Drainage Crop type: Fallow N Fertilizers (amount /type) Organic manures
Crop residues
Environment: Redox Temperature Soil moisture
pH
Proximal
factors
Distal Factors
Substracts
N
C
N2O production
(Micro-organisms)

25
proportion of C and N in the substrate in which the nitrifying and denitrifying
microorganisms are active.
N2O emission rates are affected by various environmental factors, including NO3
concentration, carbon availability, temperature, water-filled porosity, and redox
potential. An increase in water-filled porosity also increases denitrification rates, as this
process occurs more readily in ponded or waterlogged soils, provided the nitrates are at
risk of reduction. So denitrification usually happens sporadically, when previously
well-aerated soils become moist or saturated following rainfall or irrigation (Glinski and
Stepniewski, 1985; Snyder et al., 2007). N2O emissions may also be caused by
nitrification reactions rather than collateral products (Figure 1). It has been reported that
between 0.04 % and 0.45 % of the N applied as fertiliser can be lost as N2O during
nitrification (Bremer and Blackmer, 1978; quoted by Snyder et al., 2007).
Redox potential is a measure of the concentration of oxygen in the soil and is inversely
proportional to water content, although soil moisture is not the only determining factor.
Views differ on the relationship between redox potential and N2O emissions. For
Almaraz et al. (2009) the relationship is a positive one, with N2O emissions at their
highest when the soil is close to saturation point. For Dobbie and Smith (2001),
however, emissions are highest when water-filled porosity is between 60 % and 80 %
and at their lowest when water-filled porosity exceeds 95 %.
As for the effects of soil temperature on N2O emissions, some authors like Dobbie and
Smith (2001) and Schindlbacher et al. (2004) found that there was a positive
relationship while Almaraz et al. (2009) found a negative relationship. A low pH (close
to 4), however, would appear to increase N2O emission rates (Flessa et al., 1998).
There is a positive relationship between nitrogen content and N2O flow. In agricultural
soils, crop residues are a major source of N, as they are the substrate on which the
microorganisms act. Different types of waste differ in their carbon-to-nitrogen (C/N)
ratio, and so generate different amounts of nitrogen credits for future growing (Mayer et
al., 2003). Legume crop residues usually generate a higher nitrogen credit as there is a
higher concentration of nitrogen in those plants (Gentry et al., 2001) which is closely
related to the C/N ratio (N> 1.5 %). By contrast, residues from grasses or sunflowers (N
< 1.5 %) are comparatively poor in N, since they have a high C/N ratio.
The waste decomposition rate and the amount of cycling nutrients are mainly influenced
by the C/N ratio and the amount of time that the waste is in contact with the
microenvironment (Baker et al., 2001). Decomposition is faster when the N
concentration in the waste increases and the C/N ratio decreases (Jensen et al., 2005).
Synthetic nitrogen fertilisers, such as urea (46 % N) or UAN (32 % N), are another
major source of N in agricultural soils.
1.2 Distal factors
Distal factors may be situational or management-related (Figure 8). In general, their
influence is not direct or easy to identify, because there are several possible interactions
that affect their incidence. Situational factors, including geographical features that
collect water (depressions, low-lying fields) and soil textures or structures that impede
drainage, can contribute to increased N2O emissions from the soil.
Soil texture is one of the main factors that determine the time that elapses between the
end of a rain or irrigation event and the point at which nitrification and denitrification
peak. That period of time is lower in sandy soils than in clay (Sexstone et al., 1985) and
is related to the speed at which oxygen is depleted from the soil (Dobbie and Smith,
2001). Increasing water-filled porosity decreases the diffusion of oxygen within
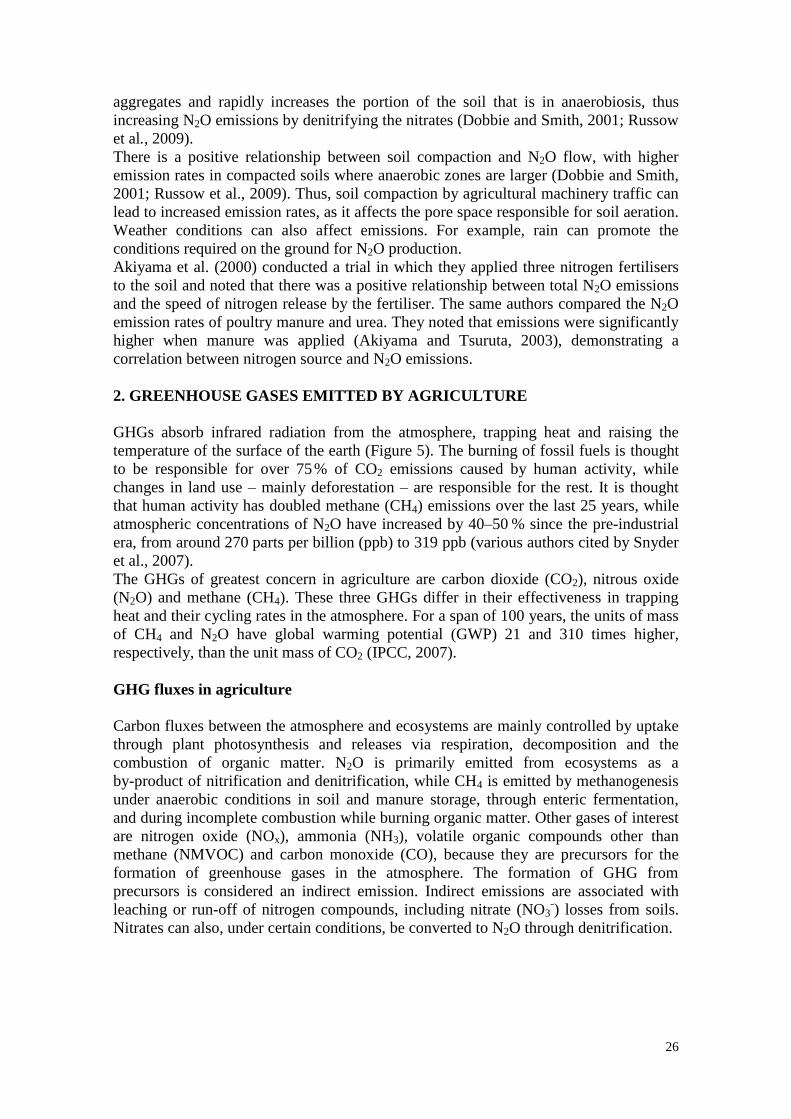
26
aggregates and rapidly increases the portion of the soil that is in anaerobiosis, thus
increasing N2O emissions by denitrifying the nitrates (Dobbie and Smith, 2001; Russow
et al., 2009).
There is a positive relationship between soil compaction and N2O flow, with higher
emission rates in compacted soils where anaerobic zones are larger (Dobbie and Smith,
2001; Russow et al., 2009). Thus, soil compaction by agricultural machinery traffic can
lead to increased emission rates, as it affects the pore space responsible for soil aeration.
Weather conditions can also affect emissions. For example, rain can promote the
conditions required on the ground for N2O production.
Akiyama et al. (2000) conducted a trial in which they applied three nitrogen fertilisers
to the soil and noted that there was a positive relationship between total N2O emissions
and the speed of nitrogen release by the fertiliser. The same authors compared the N2O
emission rates of poultry manure and urea. They noted that emissions were significantly
higher when manure was applied (Akiyama and Tsuruta, 2003), demonstrating a
correlation between nitrogen source and N2O emissions.
2. GREENHOUSE GASES EMITTED BY AGRICULTURE
GHGs absorb infrared radiation from the atmosphere, trapping heat and raising the
temperature of the surface of the earth (Figure 5). The burning of fossil fuels is thought
to be responsible for over 75 % of CO2 emissions caused by human activity, while
changes in land use – mainly deforestation – are responsible for the rest. It is thought
that human activity has doubled methane (CH4) emissions over the last 25 years, while
atmospheric concentrations of N2O have increased by 40–50 % since the pre-industrial
era, from around 270 parts per billion (ppb) to 319 ppb (various authors cited by Snyder
et al., 2007).
The GHGs of greatest concern in agriculture are carbon dioxide (CO2), nitrous oxide
(N2O) and methane (CH4). These three GHGs differ in their effectiveness in trapping
heat and their cycling rates in the atmosphere. For a span of 100 years, the units of mass
of CH4 and N2O have global warming potential (GWP) 21 and 310 times higher,
respectively, than the unit mass of CO2 (IPCC, 2007).
GHG fluxes in agriculture
Carbon fluxes between the atmosphere and ecosystems are mainly controlled by uptake
through plant photosynthesis and releases via respiration, decomposition and the
combustion of organic matter. N2O is primarily emitted from ecosystems as a
by-product of nitrification and denitrification, while CH4 is emitted by methanogenesis
under anaerobic conditions in soil and manure storage, through enteric fermentation,
and during incomplete combustion while burning organic matter. Other gases of interest
are nitrogen oxide (NOx), ammonia (NH3), volatile organic compounds other than
methane (NMVOC) and carbon monoxide (CO), because they are precursors for the
formation of greenhouse gases in the atmosphere. The formation of GHG from
precursors is considered an indirect emission. Indirect emissions are associated with
leaching or run-off of nitrogen compounds, including nitrate (NO3-) losses from soils.
Nitrates can also, under certain conditions, be converted to N2O through denitrification.

27
According to the 2006 IPCC Guidelines for National Greenhouse Gas Inventories,
emissions/removals of GHGs from agricultural soils can be categorised as follows:
a) CO2 emissions and removals resulting from changes in carbon stocks, biomass, dead
organic matter and soil minerals
Biomass (above- and below-ground) is the primary means of C uptake from the
atmosphere. Large amounts of C are transferred between the atmosphere and terrestrial
ecosystems through photosynthesis and respiration.
b) CO2 and non-CO2 emissions from fire
Fires not only return CO2 to the atmosphere through the combustion of biomass, but
also emit other GHGs directly or indirectly, including CH4, N2O, NMVOC, NOx and
CO. Stubble burning is carried out to facilitate subsequent farming. This practice is
common in the Northwest Region of Argentina (NOA) and the Northeast Region of
Argentina (NEA). However, this category is not a major source of emissions in the
country. Sugarcane is the main crop contributing to this source, and source levels
depend upon crop production levels.
c) N2O emissions from agricultural land management
The increase in the amount of N in soils resulting from the application of synthetic
fertilisers and/or animal manure or urine leads to increased emissions of N2O, which is a
by-product of nitrification (conversion of ammonium to nitrates) and, in particular,
denitrification (conversion of nitrate to atmospheric nitrogen). Similarly, changes in
land use lead to increased N2O emissions if they are associated with high levels of
decomposition of soil organic matter and the subsequent mineralisation of the N
professional, as occurs with performing crop in wetlands, forests and grasslands.
Agricultural soils emit N2O directly and indirectly. Sources of direct emissions include:
(1) N applied to crops and (2) land devoted to animal production. Indirect N2O
emissions also result from the application of N in agricultural systems. Emissions of
N2O from agricultural soil have been identified as a major category in Argentina in the
most recent national communications and annual inventories.
d) CO2 emissions related to the application of lime and urea
The lime that is used to reduce soil acidity and improve plant productivity releases C to
the atmosphere when calcium carbonate deposits of limestone and dolomite are
removed and applied to soils where the carbonate ion evolves into CO2. Similarly, the
application of nitrogen fertiliser as urea (CO(NH2)2) leads to the release of CO2 into the
atmosphere.
e) CH4 emissions from rice cultivation
In flooded conditions, such as wetlands or in rice production systems with mantle
flooding, there is a large proportion of decaying organic matter which releases CH4 into
the atmosphere. This may be a major source of GHG emissions in countries where large
areas of land are given over to the production of lowland rice.
In Argentina, rice is grown in low-lying areas with climates ranging from temperate to
wet subtropical. Water is used to flood fields, but first the ground is prepared with
‘taipas’, or edges that mark the height of the overflowing water. The anaerobic
decomposition of organic matter in flooded rice fields releases methane (CH4) into the
atmosphere, mainly owing to transport through rice plants. Rice production is not one of
the major categories of CH4 emission sources in Argentina. There are other emissions
sources which are of little or no relevance in Argentina:
f) Emissions of CO2 and N2O from organic farmland
GHGs are emitted from the cultivation of organic soils (histosols, e.g. peat), which only
occupy a small area in Argentina and are not used for agriculture.

28
g) Emissions of CO2 and N2O emissions from cultivated wetlands
This is land which is under water for much of the year and is artificially drained and
used for agriculture. This is not a common practice in Argentina.
h) Emissions of CH4 and N2O from manure management
Unlike in most of Europe, or in Asia, the use of organic fertilisers on field crops in
Argentina is uncommon. Nevertheless, it is used in intensive cultivation, which takes up
little surface area even though it is not of great economic or social significance.
3. ESTIMATION OF N2O EMISSIONS USING IPCC GUIDELINES
Like other countries (Annex II of the Kyoto Protocol), when it carried out the GHG
inventory for its national communications, Argentina had no values for emission
factors, so inventories were carried out using emission factors default set by the IPCC
(1997, 2001). For N2O, the main gas emitted from agricultural soils, the emission factor
for temperate soils was 1.25 %, or 0.0125 kg of N2O emitted per kg of N entering the
soil. Note that in the new IPCC methodology (2007), which is still not used in national
communications, this default value has been decreased to 1 %. In addition, another
drawback of IPCC (1997) methodology is that it included four main sources of N for the
calculation of direct emissions:
- (i) mineral fertilisers;
- (ii) handling of animal manure and urine;
- (iii) N fixation crops (soya, alfalfa, etc.); and
- (iv) the burying of crop residues in the soil.
The emissions shown in Figures 5 and 6 were estimated using this methodology.
Figure 3 shows an increase in emissions of N2O from 1989 to 2008 from three main
sources. This increase was caused by an intensification of agriculture during the period,
which saw an increase in grain production, cropped area and crop yields, no-tillage
farming, GMOs, fertilisers, pesticides, and large-scale crop production systems.
Figure 3: Direct N2O emissions in Argentina estimated using the IPCC 1996
Guidelines, showing an increase from 60 Gg/year in 1990 to140 Gg/yr in 2008

29
However, not all sources contributed equally to N2O emissions. As you can see in
Figure 4, the contribution of N fertilisers is low and the contribution of biological
nitrogen fixation crops and forage is high.
Figure 4: Contribution to N2O emissions of the three main sources
The new IPCC (2007) methodology will lead to some changes in the way in which the
sources of N are accounted for, since it removes biological fixation as a source of N and
includes other sources of N, such as the faeces and urine of grazing animals, and the
mineralisation of N present in soil organic matter. Thus, the N sources of interest in
Argentinian agriculture are:
i) synthetic fertiliser;
ii) N present in faeces and urine deposited on pasture by grazing animals;
iii) N of waste above- and below-ground biomass, including non-N-fixing and N-fixing
crops and forage crops and pasture following renewal; and
iv) the mineralisation of N associated with the loss of organic matter resulting from
changes in land use or the management of mineral soils.
Two emissions factors are required for these sources:
- FE1: refers to the amount of N2O emitted from N fertiliser, waste and the
mineralisation of organic matter. In light of new evidence, this value has been modified.
A default value of 1 % (0.01) with a range of uncertainty of 0.003–0.03 has been
established.
- FE3PRP: estimate of N2O emitted from the urine and faeces of grazing animals. In the
case of cattle, the default value of FE3PRP, CPP is 0.02 (0.007–0.06). In the case of sheep
and other animals, the default FE3PRP, SO is 0.01 (0.003– 0.03).

30
Figure 5: Emissions of N2O from different sources 1990–2010
(Calculated using 2006 IPCC Guidelines)
As shown in Figure 5, crop residues remain the primary source of N2O emissions under
the IPCC Guidelines 2006, while nitrogen fertilisers are less significant.
Moreover, it is important to mention that there is a strong relationship between N2O
emissions and the cultivation of soybeans. As shown in Figure 6, soybean production is
responsible for about 95 % of N2O. Emissions of N2O have been estimated using IPCC
Guidelines (1996, 2003).
Figure 6: Correlation between the increase in N2O emissions from agricultural
soils and increased soybean production
Given the strong influence of soybeans (and N-fixing crops) in N2O emissions in
Argentina calculated according to the previous IPCC methodology (1997), it can be
expected that by simply eliminating a source of N for N-fixing crops, the country’s
y = 0,0022x + 44,032
R2 = 0,9459
0,00
20,00
40,00
60,00
80,00
100,00
120,00
140,00
160,00
0,0 10.000,0 20.000,0 30.000,0 40.000,0 50.000,0
Soybean production (Gg grain)
Gg
N2O

31
emissions would decrease significantly. Figure 7 compares direct emissions of N2O
from agricultural soils using both the IPCC 1997 and IPCC 2007 methodologies. Unlike
in other countries with a similar agricultural structure, the contribution of N from
synthetic fertilisers is far lower than that contributed by crop waste (Figure 8).
0
20
40
60
80
100
120
140
1990/91 1994/95 1997/98 2000/01 2005/06 2009/10
Gg
N2O
añ
o-1 IPCC 1996
IPCC 2006
Figure 7: Direct N2O emissions from agricultural soils,
using IPCC (1996) and IPCC (2006) methodologies. In the latter calculation,
changes in the carbon stock of soils are not included as a source of N
0
5
10
15
20
25
30
35
40
1990/91 1994/95 1997/98 2000/01 2005/06
Gg
N-N
2O
añ
o-1 Residuos de las cosechas
Fertilizante sintético
Figure 8: Contribution of crop residues and mineral fertilisers
to direct N2O emissions from soils
The data provided in Figures 9 and 10 is approximate, but will certainly be included in
the third national communication. However, it is unclear whether the fall in N2O
emissions is as sharp as shown in Figure 10, as the forthcoming inventory should also
reflect changes in carbon stocks in soil owing to changes in land use over the past 15
years (i.e. expansion of agricultural land), and the influence of N deposited by grazing
animals.
In relation to surface area, agricultural GHG emissions in Argentina were calculated to
be almost 3 kg N-N2O ha-1
yr-1
in 2005/06 (Table 1).

32
Area
Direct
Emissions
Direct emissions
per ha
ha (Gg N2O-N yr-1
) (kg N2O-N ha-1
yr-1
)
1990/91 16 618 450 35.84 2.16
1994/95 18 190 080 41.93 2.31
1997/98 21 566 860 54.39 2.52
2000/01 23 445 087 64.34 2.74
2005/06 26 839 693 78.30 2.92
Table 1: Direct N2O emissions per ha (IPCC 2007 Guidelines)
Despite the fact that soybean crops are responsible for almost 95 % of agricultural GHG
emissions in Argentina (Figure 6), the N2O emissions of soybean crops are lower than
those of maize crops (Figure 9). The reason that soybean crop emissions are so high is
because of the vast area over which it is cultivated rather than because the soybean crop
itself emits higher quantities of N.
Figure 9: N2O crop emissions in Argentina,
calculated using 2001 IPCC Guidelines and mean yields
Wheat and maize fertilised with 50 and 70 kg N ha-1
respectively.
4. N2O EMISSIONS FROM FIELD MEASUREMENTS
4.1 Methodology
Emissions of N2O from agricultural soils are generally sampled using gas storage
chambers installed in the field, which enable comparative analysis of different
environments and management practices (Mosier et al., 2006; Jantalia et al., 2008;
Almaraz et al., 2009).
The open chambers consist of two parts, an iron base that is anchored to the ground at
least 24 hours prior to gas collection and is inserted into the ground to a depth of at least
5 cm, and a plastic part that is put in place when taking the samples and removed
0
1
2
3
4
5
6
7
8
9
10
Wheat (4Mg ha-1) Maize (10 Mg ha-1) Soybean
Kg
N-N
2O
Direct N2O emissions per crop (IPCC 2006)
N residues N fertilizer

33
afterwards. The gas samples are taken from the upper chamber (Rochette and
Eriksen-Hamel, 2008; Hutchinson and Livingston, 2001).
The gas samples are collected using a vacuum pump and then injected into 25 mL vials.
The N2O collected is determined via gas chromatography. To establish whether N2O
emissions are present and to measure them, linear regression analysis is used where the
independent variable is time the gas was emitted from the soil to the atmosphere and the
dependent variable is the concentration of gas accumulated in the measuring chamber.
In recent years, papers have been published on the lateritic soils of southern Brazil
(Jantalia et al., 2008) and the temperate soils of Uruguay (Perdomo et al., 2009). Table
2 compares the various emissions.
Table 2: Summary of N2O emissions data from soils in Uruguay
(Perdomo et al., 2009) and southern Brazil (Jantalia et al., 2008)
managed using direct seeding (SD) and conventional tillage (LC).
In the work of Jantalia et al. (2008) and Perdomo et al. (2009) there is no clear
difference between emission rates from soils managed using no-tillage or conventional
tillage. On the other hand, the only reading taken on natural grassland, where there is an
abundance N-NO3- (the presence of which leads to denitrification), indicates very low
emissions in comparison to agricultural soils (Perdomo et al., 2009). On the whole,
emissions measured in the field were lower than the corresponding values in the
inventory of the agricultural sector. So it would seem that the methodology imposed by
the IPCC (1997, 2001) has led to direct emissions of N2O being over-estimated. It is
difficult to ascertain the scale of this over-estimation from the limited data available, but
if a value of 3 kg N-N2O ha-1
yr-1
is assumed for direct emissions in Argentina in
2005/06, it seem likely that actual emissions were 50 % to 66 % lower than in the
inventory.
Recently Ciampitti et al. (2008) examined N2O emissions from fields. The average
emission rate was found to be 1348 g N2O-N m-2
h-1
. The rate depended mainly on the
concentration of nitrates in the soil and peaked during grain filling. Previous studies
Author Crop rotation Tillage
N rate (kg
N ha-1
)
Average NT and CT
Grassland 0,07
Continuous cropping SD 0,44
Rotation with pasture SD 1,72 1,08 (0,64)
Continuous cropping LC 3,77
Rotation with pasture LC 1,35 2,56 (1,21)
Wheat/soybean SD 45 0,8
Soybean/vetch SD 0 1,48
maize/wheat SD 45 1,09
Trigo/soja SD 45 0,85
Wheat/soybean SD 0 1,92
Soybean/vetch SD 45 0,63 1,13 (0,18)
maize/wheat LC 0 1,09
Wheat/soybean LC 45 1,18
Soybean/vetch LC 45 1,38
maize/wheat LC 0 1,24
Soybean/vetch LC 45 1,75
maize/wheat LC 45 0,76 1,23 (0,12)
kg N-N2O ha-1
yr-1
Perdomo et al. (2009)
Jantalia et al. (2008)

34
measured the rate of denitrification in fields, but they did not consider the contribution
to emissions of N2O from nitrification (Palma et al., 1997; Sainz Rozas et al., 2001;
Echeverria et al., 2009).
Field studies are currently being carried out by the Institute for Soil, Climate and Water
at the National Institute of Agricultural Technology (INTA) in Castelar, Balcarce,
Manfredi and Corrientes, and the Faculty of Agronomy at the University of Buenos
Aires. Some of the findings are outlined below.
4.2 First results in Argentina
In Cordoba, Alvarez et al. (in preparation) measured emissions of N2O from plots of
land with silt loam Haplustoll soils were almost nil during the fallow to winter period, a
fact attributed to the lack of rainfall and low soil moisture. However, in the growing
season, emissions varied according to water-filled porosity of the soil and air
temperature. There were no differences in tillage (tillage and chisel ploughing) or crop
(soybean or maize), but some emissions peaks were detected after the application of
fertiliser (Figure 10).
In Buenos Aires, Cosentino et al. (2010) also found when rotating soybeans with wheat
and maize that there were no emissions in winter, and this was attributed to low
temperatures (below 15 C). However, it was noted during the crop cycle that emissions
were affected by crop type and, in particular, the associated management practices.
Higher emissions were observed in newly fertilised crops, which had higher nitrate
concentrations (Figure 11). When the availability of N in the soil (especially in nitrate
form) exceeds the N taken up by the crop, there is an increased risk of N2O emissions
(Snyder et al., 2007). This would explain the significant differences between crops
(maize > wheat) found in November. This can be attributed to different levels of nitrates
in the soil, as maize (State V5) had been recently fertilised, while wheat was close to
harvest, so most of the N mineral had been absorbed by the crop. Regression analysis of
data generated by the November sampling showed that the nitrate content and the
percentage of pores filled with water were the variables that best explained the N2O
emission rate with a determination coefficient of 62 % (Cosentino et al., 2010).
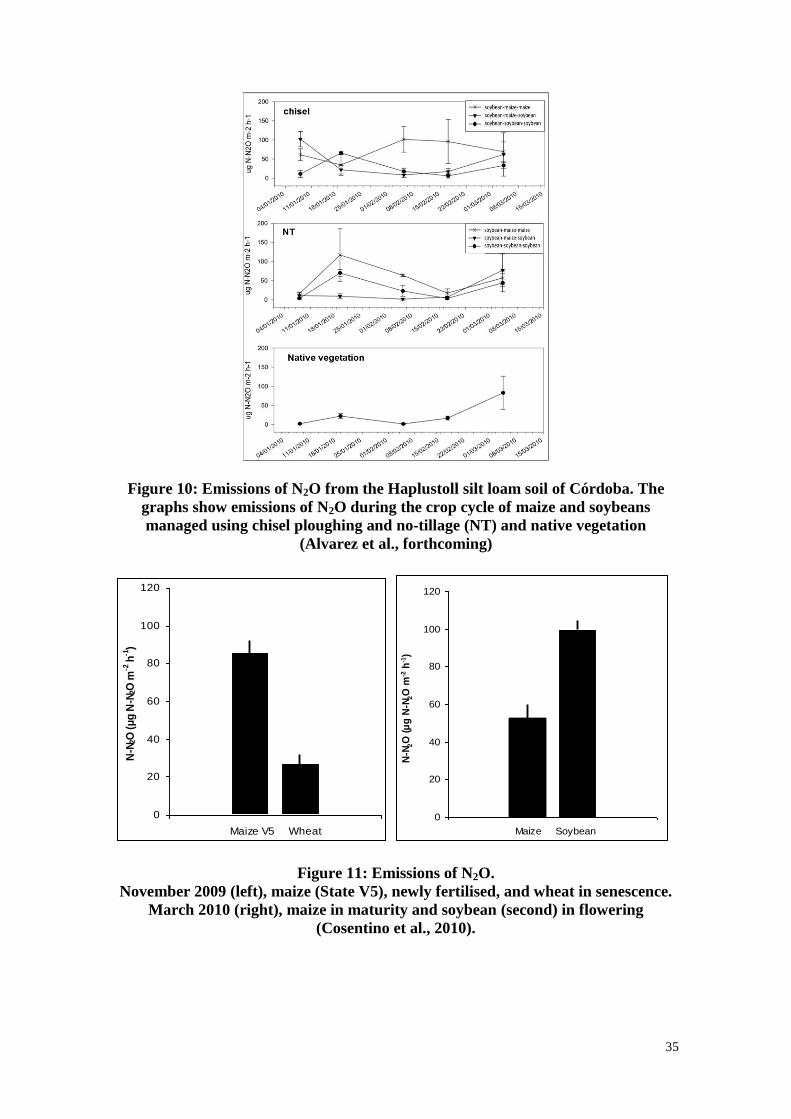
35
Figure 10: Emissions of N2O from the Haplustoll silt loam soil of Córdoba. The
graphs show emissions of N2O during the crop cycle of maize and soybeans
managed using chisel ploughing and no-tillage (NT) and native vegetation
(Alvarez et al., forthcoming)
0
20
40
60
80
100
120
Maize V5 Wheat
N-N
2O (μ
g N
-N2O
m-2
h-1
)
0
20
40
60
80
100
120
Maize Soybean
N-N
2O
(μ
g N
-N2O
m-2 h
-1)
Figure 11: Emissions of N2O.
November 2009 (left), maize (State V5), newly fertilised, and wheat in senescence.
March 2010 (right), maize in maturity and soybean (second) in flowering
(Cosentino et al., 2010).

36
5. CONCLUSIONS
- Direct emissions of N2O have almost reached 3 kg N-N2O/ha year, according to the
National Inventory (IPCC 1996, 2004).
- Direct N2O emissions may decrease when new IPCC Guidelines (IPCC 2006) are
adopted.
- N2O determinations using field chamber and chromatography were recently started in
Pampean agricultural soils.
- There is high variability in N2O emissions on account of climatic conditions (rainfall,
air temperature and topsoil temperature), edaphic conditions (water-filled porosity,
NO3), and crop type.
- Only limited data is available but the figures seem to be clearly lower than IPCC
estimations.
6. REFERENCES
- Akiyama H. and Tsuruta H., 2003, Nitrous Oxide, Nitric Oxide, and Nitrogen
Dioxide Fluxes from Soils after Manure and Urea Application. Journal of
Environmental Quality. 32: 423-431.
- Akiyama H., Tsuruta H. and Watanabe T., 2000, N2O and NO emissions from soils
after the application of different chemical fertilizers. Chemosphere — Global Change
Science. 2: 313-320.
- Almaraz J. J., Zhou X., Mabood F., Madramootoo C., Rochette P., Mae B.L. and
Smith D. L., 2009, Greenhouse gas fluxes associated with soybean production under
two tillage systems in southwestern Quebec. Soil and Tillage Research. 104: 134-139.
- Baker T. T., Lockaby B. G., Conner W. H., Meier C. E., Stanturf J. A. and Burke
M. K., 2001, Leaf Litter Decomposition and Nutrient Dynamics in Four Southern
Forested Floodplain Communities. Soil Science Society of America Journal. 65: 1334-
1347.
- Bateman E. J. and Baggs E. M., 2005, Contributions of nitrification and
denitrification to N2O emissions from soils at different water-filled pore space. Biology
and Fertility of Soils. 41: 379-388.
- Ciampitti I. A., Conti M. E and Ciarlo E., 2008, Nitrous oxide emissions from soil
during soybean {(Glycine max (Merrill)} crop phenological stages and stubbles
decomposition period. Biology and Fertility of Soils. 44: 581-588.
- Cosentino V. R. N., Alvarez C. R., Figueiro Aureggi S. A. and Taboada M. A.,
2010, Emisiones de óxido nitroso en suelos pampeanos bajo distintos cultivos. IV
Reunión Binacional de Ecología.
- Cosentino V. R. N., Figueiro Aureggi S. A. and Taboada M. A., 2010, Afectan la
intensidad del tránsito y el momento de la rotación a los factores reguladores de las
emisiones de N2O desde los suelos agrícolas? XXII Congreso Argentino de la Ciencia
del Suelo. pp 289.
- Crutzen P. J., Mosier A. R., Smith K. A. and Winiwarter W., 2007, N2O release
from agro-biofuel production negates global warming reduction by replacing fossil
fuels. Atmospheric Chemistry and Physics Discussions. 7: 11191-11205.
- Dalal R. C., Wang W., Robertson G. P. and Parton W. J., 2003, Nitrous oxide
emission from Australian agricultural lands and mitigation options: a review. Australian
Journal of Soil Research. 41: 165-195.

37
- Dobbie K. E. and Smith K. A., 2001, The effects of temperature, water-filled pore
space and land use on N2O emissions from an imperfectly drained gleysol. European
Journal of Soil Science. 52: 667-673.
- Echeverría H., Reussi N., Calvo and García F. O., 2009, Mejores prácticas de
manejo para nitrógeno: Un camino para mejorar la eficiencia de uso en los cultivos.
Simposio Fertilidad, pp. 25-34.
- Flessa H., Wild U., Klemisch M. and Pfadenhauer J., 1998, Nitrous oxide and
methane fluxes from organic soils under agriculture. European Journal of Soil Science.
49: 327-335.
- Gentry L. E., Below F. E., David M. B. and Bergerou J. A., 2001, Source of the
soybean N credit in maize production. Plant and Soil. 236: 175-184.
- Glinski J. and Stepniewski W., 1985, Soil aeration and Its Role for Plants. CRC
Press. Boca Raton, Florida. 138.
- Hutchinson G.L. and Livingston G.P., 2001, Vents and seals in non-steady-state
chambers used for measuring gas exchange between soil and the atmosphere. Eur J Soil
Sci 52, 675-682.
- IPCC, 1997. Revised 1996 IPCC Guidelines for National Greenhouse Inventories.
NGGIP Publications; Japan (htpp:// www.ipcc-nggip.iges.or.jp).
- IPCC, 2001, Good Practice Guidance and Uncertainty Management in National
Greenhouse Gas Inventories. NGGIP Publications; Japan (htpp:// www.ipcc-
nggip.iges.or.jp
- IPCC, 2006, Guidelines for National Greenhouse Gas Inventories. Volume 4.
Agriculture, Forestry and Other Land Use (htpp://www.ipcc-
nggip.iges.or.jp/public/2006gl/vol4.html)
- IPCC, 2007, Climate change 2007: Synthesis Report. An Assessment of the
Intergovernmental Panel on Climate Change. WMO-UNEP, Geneva.
- Jantalia C. P., dos Santos H. P., Urquiaga S., Boddey R. M. and Alves B. J. R.,
2008, Fluxes of nitrous oxide from soil under different crop rotations and tillage
systems in the South of Brazil. Nutrient Cycling in Agroecosystems. 82: 161-173.
- Jensen L. S., Salo T., Palmason F., Breland T. A., Henriksen T. M., Stenberg B.,
Pedersen A., Lundström C. and Esala M., 2005, Influence of biochemical quality on
C and N mineralisation from a broad variety of plant materials in soil. Plant and Soil.
273: 307-326.
- Mayer J., Buegger F., Jensen E. S., Schloter M. and Heß J., 2003, Residual
nitrogen contribution from grain legumes to succeeding wheat and rape and related
microbial process. Plant and Soil. 255: 541-554.
- Mosier A. R., Halvorson A. D., Reule C. A. and Liu X. J., 2006, Net Global
Warming Potential and Greenhouse Gas Intensity in Irrigated Cropping Systems in
Northeastern Colorado. Journal of Environmental Quality. 35: 1584-1598.
- Palma, R. M., Rímolo, M., Saubidet, M. I. and Conti, M., 1997, Influence of tillage
system on denitrification in maize-cropped soils. Biology and Fertility of Soils. 25: 142-
146.
- Perdomo C., Irisarri P. and Ernst O., 2009, Nitrous oxide emissions from and
Uruguayan Argiudoll under different tillage and rotation treatments. Nutrient Cycling in
Agroecosystems. 84: 119-128.
- Rochette P., 2010, Soil N2O Emissions. Possible refinements to the IPCC 2006
Guidelines. Presented at IPCC Expert Meeting on HWP, Wetlands and Soil N2O.
Geneva, October 2010.

38
- Rochette P. and Eriksen-Hamel N. S., 2008, Chamber measurements of soil nitrous
oxide flux: are absolute values reliable? Journal of the Soil Science Society of America.
72: 331-342.
- Russow R., Stange C. F. and Neue H. U., 2009, Role of nitrite and nitric oxide in the
processes of nitrification and denitrification in soil: Results from 15N tracer
experiments. Soil Biology and Biochemistry. 41: 785-795.
- Sainz Rozas H. R., Echevarria H. E. and Picone L. I., 2001, Denitrification in
maize under no-tillage. Soil Science Society of America Journal. 65: 1314-1323.
- Schindlbacher A., Zechmeister-Boltenstern S. and Butterbach-Bahl K., 2004,
Effects of soil moisture and temperature on NO, NO2, and N2O emissions from
European forest soils. Journal of Geophysical Research. 109: D17302.
- Sexstone A. J., Parkin T. B. and Tiedje J. M., 1985, Temporal response of
denitrification rates to rainfall and irrigation, Soil Science Society of America Journal.
pp 49: 99-103.
- Snyder C. S., Bruulsema T. W. and Jensen T. L., 2007, Greenhouse gas emissions
from cropping systems and the influence of fertilizer management. A literature Review.
International Plant Nutrition Institute. 1-25.
- Taboada M. A. and Lavado R. S., 1986, Características del régimen ácuico de un
Natracuol de la pampa deprimida, Ciencia del Suelo. 4: 66-71.
- Taboada M. A. and Panuska E. N., 1985, Evolución del potencial redox en tres
suelos del norte de la pampa deprimida, Ciencia del Suelo. 3: 102-108.
- Vepraskas M. J. and Sprecher S. W., 1997, Overview of aquic conditions and hydric
soils: the problem soils. p. 1-21. In M.J. and S.W. Sprecher (eds.) Aquic Conditions and
Hydric Soils: the Problem Soils. SSSA Special Publication 50. ASA, CSSA and SSSA.
Madison, WI, USA.

39
Argentine soybean oil biodiesel:
GHG calculation for different agrotechnologies
and productive areas of Argentina
J.A.Hilbert1, I. Huerga
2, L.B.Donato
3
1 Instituto de Ingeniería Rural, Centro de Investigaciones Agroindustria INTA
c.c. 25 (1712) Castelar Argentina 2 Estación Experimental Oliveros INTA , Argentina
3 Instituto de Ingeniería Rural, Centro de Investigaciones Agroindustria INTA
c.c. 25 (1712) Castelar Argentina
Summary
The objective of this paper is to present the calculation of the energy consumption and
greenhouse gas emissions of soybean biodiesel produced in Argentina under different
agronomic technologies and agroecological regions of the country. For the calculation of the
energetic consumption and GHG emissions in the production of biodiesel from soy in
Argentina, the software “Greenhouse gas calculator for biofuels” Version 2.1b (available at:
http://www.senternovem.nl/gave_english/co2_tool/index.as and developed by the
SenterNovem Agency of the Dutch Government) was used. In this comparative study, the
following parameters change: energy consumption (No Till Farming vs. Conventional
Agriculture in different areas of reference of Argentina), quantity of fertilizers used per
hectare (idem), distance with respect to the location for processing the soybean feedstock
(which depended on each respective zone of reference), energy consumption for the drying of
the grain. On the other hand, the energy consumption for the industrial stage was kept
constant for all different scenarios according to surveys performed in Argentina. The scenario
that showed most GHG emissions was the scenario of South East of Buenos Aires (0,0447 Kg
CO2 eq/km). Compared in percentage with conventional diesel, its GHG emissions were of
24,5% and its reductions of GHG emissions 75,5 %. The scenario that showed less GHG
emissions was South of Córdoba (0,0464 Kg CO2 eq/km). Compared in percentage with
conventional diesel, its GHG emissions was 23,5% and its reductions of GHG emissions
76,5%. There was an important annual saving of CO2 emissions (ton CO2/ha/year) for the
scenarios of North of Buenos Aires/South of Santa Fe (1,8 ton CO2/ha/year) and the scenario
of West of Buenos Aires (1,8 ton CO2/ha/year). Sea transportation’s impact, despite the
significant distance between the port of origin and the final destination of the product in
Europe, was relatively low.
Key words: biofuels for transport, GHG emissions, Life Cycle Analysis, biodiesel from
soybean oil, agro-environmental assessment
40
1. INTRODUCTION
During the recent years, the global energetic context has been increasingly influenced by
uncertainties linked to climate change and to the vulnerability caused by a gradual exhaustion
of fossil fuels versus an increasing demand for energy. This has provoked an intense search
for alternative energy sources, able to replace continuously diminishing fossil reserves.
Among these alternative sources, biofuels have gained special importance due to their use in
vehicles and internal combustion engines without necessitating important modifications.
Governments have reacted to this situation by promoting biofuels through laws, decrees and
regulations that in many cases have created a mandatory blend for internal markets as well as
tax and credit incentives. These actions have created a new market for this type of products,
strongly influenced by public intervention.
The action of different research centers, environmental NGOs and several stakeholders has
raised the issue of the possible threats caused by an uncontrolled expansion of biofuels
production in the world. The public sector has reacted to this problem by requesting its
regulatory agencies to rule this activity. These agencies developed cooperation with research
centers and other groups in search of suitable tools to provide a foundation and scientific
criteria to the regulations being prepared.
The current situation shows that speeds are asymmetrical and there are still lots of doubts and
unsolved problems in the scientific field which forces parties to move forward with a great
degree of uncertainty. This reality exists in all areas and although the advance of regulations
has not stopped, certain measures are being taken in order to correct possible mistakes due to
a lack of solid and strong support.
Studies focused on the energetic balances of each alternative, greenhouse gas emissions and
global impact caused by the expansion of each feedstock used to produce these biofuels are
being carried out by several agencies.
During the last six years, activity on this issue has been very intense, with different initiatives
from governments as well as national and international institutes and organisations. Among
them, we can mention the ones promoted by the European Commission, the Government of
the United States, the Global Bioenergy Partnership (GBEP) and the Roundtable on
Sustainable Biofuels (RSB).
Since 2005, INTA has participated in different technological and scientific forums that have
committed to study biofuels sustainable production around the world. It has consolidated
partnerships with the main research centers working on the subject and it has worked on
exchanging knowledge and information about Argentina, which in most cases was unknown.
In spite of the uncertain economic, financial and environmental outlook, within the European
Union the desire to make the production, marketing and finally the consumption of biofuels
more environmentally friendly gained strength, influenced by a general and increasing
concern from citizens and private and public organisations, in view of the rise in greenhouse
gas emissions.
Hence, to all the requirements that biofuels have to meet, like abiding to quality standards,
being economically competitive, or being available in enough volume necessary to meet mass
consumption, we can add a number of analyses that take into account the extremes of the
chain, like planting of the crops and final use by consumers.
Due to all of this, it is important that possible environmental benefits of biofuels can be
measured, in order to be improved and compared with traditional fuels for their replacement.
This type of measurement and analysis, known as Life Cycle Analysis (LCA), allows
quantifying all consequences for the environment (from the origin of feedstock up to the final
use of the product) related to the production and use of alternative fuels, making possible the
evaluation of their feasibility.

41
In this context, Argentina has become a relevant party for the world market, exceeding a
production capacity of 4 million tonnes of biodiesel with exports of over 1300 million dollars
in 2012. The main feedstock used for the production of these significant volumes is a by-
product from the production of soy meal. This oil by-product is turned into biodiesel. Due to
the volume, future projections and export market towards which the country’s production is
directed, it is very important to establish the environmental characteristics of the production in
order to show the fulfilling of goals and regulations being created both in Europe and the
United States markets.
These are the reasons why INTA has been carrying out specific studies that cover the main
parameters with special emphasis on biodiesel, given its strategic importance as a
manufactured product for exports.
2. OBJECTIVES
The general objective of this study was to determine, analyze, compare and evaluate the
energetic consumption and greenhouse gas (GHG) emissions of biodiesel production from soy
throughout different scenarios within Argentina.
The specific objectives were:
- Start using the methodology for the calculation of the energetic consumption and GHG
emissions of the software “The CO2 Bioenergy Tool”. Version 2.1b.
- Compare different scenarios of energetic consumption and GHG emissions in the production
of biodiesel from soy in Argentina, establishing whether there were significant differences
among them, and on what stage(s) of the production chain these significant differences were
more obvious.
- Give a “reality” context to the national biodiesel production from soy with respect to the
energetic consumption and GHG emissions, in order to be able to compare domestic scenarios
with those proposed by different organizations from the European Union.
- Compare the base data used in different studies in Argentina with those used by the
European Commission Joint Research Centre (JRC).
3. MATERIALS AND METHODS
For the calculation of the energetic consumption and GHG emissions in the production of
biodiesel from soy in Argentina, the software “Greenhouse gas calculator for biofuels”
Version 2.1b (available at: http://www.senternovem.nl/gave_english/co2_tool/index.as and
developed by the SenterNovem Agency of the Dutch Government) was used. The
development of this software took place within the GAVE Program (Climate Neutral Gaseous
and Liquid Energy Carriers) of the Dutch Government. Its main objective was to stimulate
collaboration between different governmental agencies and other stakeholders in order to
reach the production, marketing and consumption of biofuels within Netherlands and the
European Union in a sustainable and environmentally friendly manner.
For the analysis of the energy consumption and GHG emissions, this software makes the
following assumptions (Hamelinck et al., 2008):
- Energy efficiencies are equal between the biofuel and the fossil fuel they replace. In this
way and comparatively, in order to travel any given distance, the same amount of fuel is
needed, whether biofuel or traditional fuel. For traditional diesel fuel the energy efficiency is
of 2,08 MJ/km, being the same efficiency applicable to biodiesel from soy.
- The analysis in the energy consumption and GHG emissions is comparative between the
entire production chain and transportation of biofuels and the entire production chain and
transportation of the fossil fuel it replaces.

42
The production chain of biodiesel from soy is not completely known until now, neither in
Argentina nor the United States. This means that more studies and additional information are
required in order to strength the data and presumptions that the energy consumption and GHG
emissions studies throw.
All the tables of parameters used by the software can be calculated from three different types
of values:
- Conservative values, which are the worst case values available in the market.
- Typical values, which are medium values available in the market.
- Best practice values, which are the best values available in the market or the values provided
by the user. Different local values were introduced in this study, taking into account
Argentine reference values derived from our own research and from industry’s surveys for
each analysed situation.
A change in the results due to the modification in any of the parameters or conservative,
typical or best practice values of 5% or more is considered significant:
- If the results of the calculation of GHG emissions change at least 2% or more in comparison
with the reference fossil fuel (in the case of biodiesel from soy it would be traditional diesel).
- If the result of the parameter or value changes 20% or more, this variation contributing
greatly to the change of the final results.
Based on a relative scale, where the lower energy consumption or GHG emissions scenario in
any of the stages represents 100% of the energy consumption or emission, percentage
differences with respect to the highest energy consumption or emissions scenario were
determined. Based on this and according to the software assumptions, these differences were
used as a tool to consider as significant or not differences between the parameters and values.
For the purpose of this study, three different agricultural practices systems were taken into
account. They were defined considering the principal soybean agroecological areas of the
country which produce the largest amount of feedstock used for the generation of oil for
conversion into biodiesel. The practices selected were conventional tillage and no till with
low and high rate input levels.
The areas under research within this study (Figures 1 and 2) represent around 85% of total
soybean production in Argentina, which gives a significant value to the conclusions. Input
data were obtained from INTA research activities on farm productions and from a survey of
the principal soybean processing plants in Argentina.
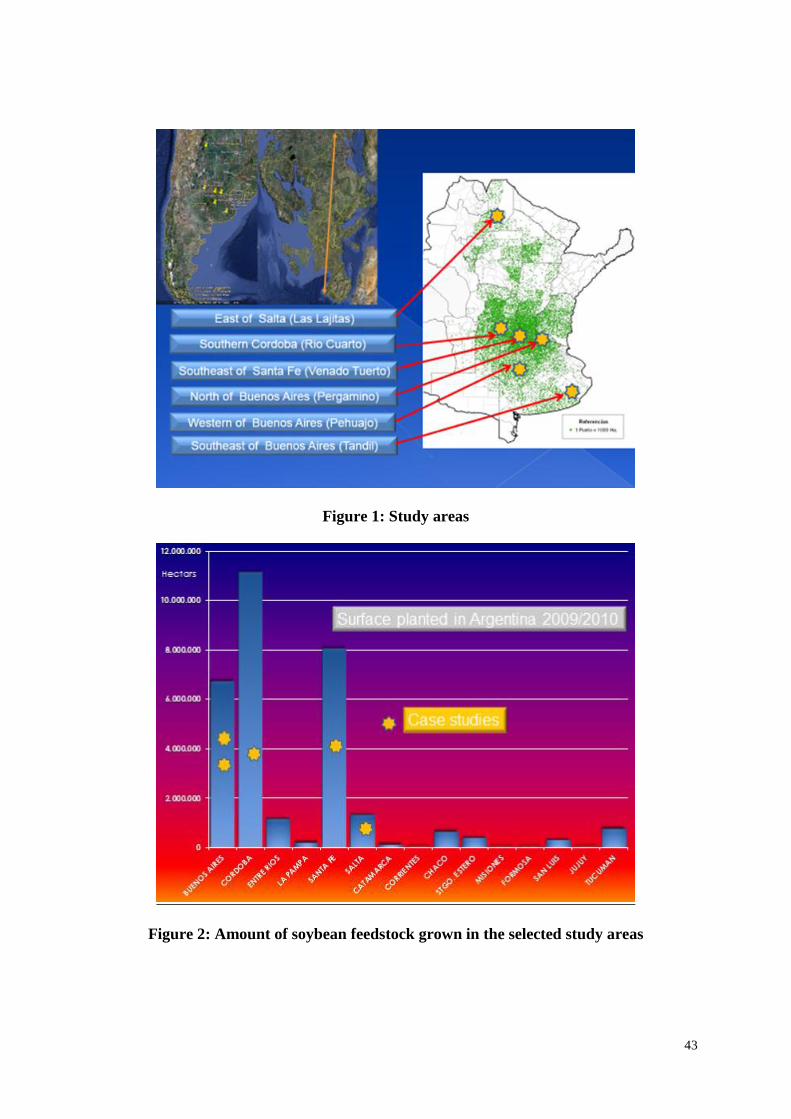
43
Figure 1: Study areas
Figure 2: Amount of soybean feedstock grown in the selected study areas

44
Parameters used for the Argentine case
Type of Agriculture*1 CA NT SAT NT NT NT NT
Stage Zone of reference
Agrícola SE of Bs.
As.
(Tandil)
S of Sta Fe
(Venado
Tuerto)
N of Bs.
As./S of Sta.
Fe
(Pergamino)
W of Bs.
As.
(Pehuajo)
S of
Córdoba
(Rio
Cuarto)
Salta
Feedstock
(Kg/ha/year)*2
Soybean 2.800 4.500 3.600 3.600 2.750 2.750
Energy
consumption
(MJ/ha/year) *3
Diesel 1.575 998 998 998 998 998
Fertilizers*4
(Kg/ha/year)
Nitrogen 10 14 4,4 4,4 0 0
P2O5 23 78 21 21 0 0
K2O 0 0 0 0 0 0
Feedstock
transportation*5
Transport (km) Conv. Diesel
truck
614 191 139,9 436 395 1130
Drying and
storage
Feedstock
(Kg/Kg)
Soybean 1 1 1 1 1 1
Energy
Consumption
Electricity*6a
(KWh/ton)
1,2 1,2 1,2 1,2 1,2 1,2
Natural gas*6b
(MJ/ton) 141 141 141 141 141 141
Conv.
Diesel*7
(MJ/ton)
3 3 3 3 3 3
Crushing
By-product
(Kg/Kg of seed)
Vegetable oil 0.194 0,194 0,194 0,194 0,194 0,194
Meal 0,714 0,714 0,714 0,714 0,714 0,714
Energy
Consumption8
Electricity
(KWh/ton s)
34,3 34,3 34,3 34,3 34,3 34,3
Natural Gas
MJ/ton9
4770 4770 4770 4770 4770 4770
Hexane10
(MJ/ton )
4,66 4,66 4,66 4,66 4,66 4,66
Estherification
By-product
(Kg/Kg oil)
Biodiesel 0,95 0,95 0,95 0,95 0,95 0,95
(Kg/Kg oil) Glycerine11 0,12 0,12 0,12 0,12 0,12 0,12
Energy use Electricity
(KWh/ton
bio12
34,8 34,8 34,8 34,8 34,8 34,8
Natural gas
MJ/Ton biod13
1499 1499 1499 1499 1499 1499
Methanol
(Kg/ton seeds)
99 99 99 99 99 99
Biodiesel
transportation
Transport (km)*14 Diesel ship 12.091 12.091 12.091 12.091 12.091 12.091
Diesel
truck*15
15 15 15 15 15 15
Table 1: Input for the agriculture stage, feedstock transportation, drying and storage,
crushing, estherification and transport of biodiesel
for different production scenarios in Argentina.
45
*1 Type of Agriculture: CA: Conventional Agriculture, NT SAT: No Till with State of the Art
Technology, NT: No Till
*2 Average yields for each area according to Márgenes Agropecuarios Magazine (2008)
*3 Energy consumption for the agriculture stage estimated by Donato & Huerga (2007)
*4 More frequent use of fertilizers for each zone according to Márgenes Agropecuarios magazine
(2008)
*5
Distance calculated with Guía YPF (www.guiaypf.com.ar) from feedstock production area to Port
complex at Pto. San Lorenzo/Pto. Gral. San Martín (Prov. of Santa Fe)
*6a
Electricity consumption 1 Kwh/T estimated by de Dios Carlos Grains drying and dryers (2000)
Editorial Hemisferio Sur 244 pages. Diego de la Torre quotes values for 0,6 in seven districts of
Argentina
*6b
Estimated energy consumption for grain drying at the agricultural stage according to de la Torre &
Bartosik(2008). (25 % is dried at storage and 75 % at the industry with 3 and 2 points of drying
respectively over a total of 40,4 million tonnes.
http://www.inta.gov.ar/balcarce/info/indices/tematica/agric/posco/gral.htm . Diego de la Torre
personal communication quotes efficiencies in Argentine dryers between 982 to 2046 Kcal/kg of water
and taking a reference value of 1900 Kcal/kg of water in the calculation which is conservative for
Argentina reality.
*7
Estimated energy consumption for grain drying at the agricultural stage according to de la Torre &
Bartosik(2008). (8 % a gasoil over a total of and 92 % a gas GLP y GN *8
IIR-BC-INF-03-09 Energy Balances of Argentine Biodiesel Production with local industrial data I
Huerga; J.A.Hilbert;L.Donato 2009 *9
1,45 kg steam/tonnes of oil – Maximum value for the two surveyed companies 785,7 kcal/kg of
steam – average consumption value in Argentina Raúl Bernardi UnitecBio personal communication.
*10 Corresponds to 981 Kcal/kg of hexane and to 24 MJ/T of oil. IIR-BC-INF-03-09
*11 Corresponds to the average value registered on the survey of biodiesel production companies in
Argentina 0,121 T crude glycerine moist base/T biodiesel IIR-BC-INF-03-09 *12
Corresponds to the average value registered on the survey of biodiesel production companies in
Argentina 34,79 Kwh/T biodiesel given the high dispersion of results IIR-BC-INF-03-09 *13
Corresponds to the average value registered on the survey of four biodiesel production companies
in Argentina 0,456 T.vapor/Tbiodiesel IIR-BC-INF-03-09. This gives a value of 1499 MJ/T of oil *14
Distance calculated from the Port complex Pto. San Lorenzo/Pto. Gral. San Martín (Prov. of Santa
Fe) to the Port of Rotterdam, Holland (Ciani et al., 2007, Panichelli, 2005)L. *15
Argentine production companies for export are located near the ports and biodiesel transport is
performed through pipes from the plants to the terminal ports. Smaller production ones are located not
further than 30 km away.

46
4. RESULTS OBTAINED BY USE OF THE CALCULATING TOOL
The following results obtained are detailed and commented upon for each of the production
scenarios stated for Argentina and use the values detailed in Table 1 as inputs into the system.
Energy consumption (per km) GHG emissions (Kg/km)
Zone of
reference
MJ per
km
% of the
reference *16
% of
reductions*16
Kg
CO2-eq
% of the
reference *16
% of
reductions*16
South East of
Bs. As. (Tandil)
0,6450
26,8
73,2
0,047
24,5
75,5
South of Sta. Fe
(Venado
Tuerto)
0,5715
23,8
76,2
0,0385
21,1
78,9
North of Bs.
As./South of
Sta. Fe
(Pergamino)
0,5435
22,6
77,4
0,0342
18,7
81,3
West of Bs. A.s
(Pehuajo)
0,5745
23,9
76,9
0,0344
19,9
80,1
South of
Córdoba (Río
Cuarto)
0,5648
23,5
76,5
0,0341
18,7
81,3
Salta
(Las Lajitas)
0,6419
26,7
73,3
0,0394
21,6
78,4
Table 2: Energy consumption and GHG emissions for the different scenarios. *16 In comparison to conventional diesel, of fossil origin, expressed in MJ/km having as reference for gasoil
2,08 MJ/km
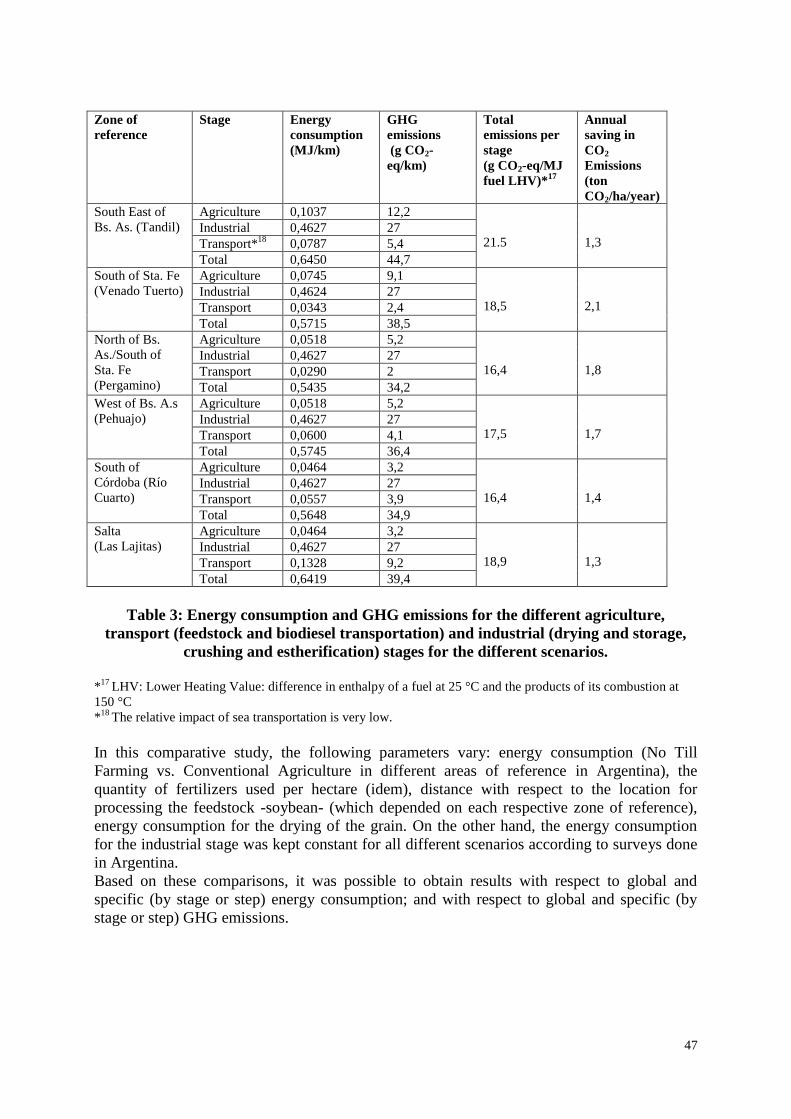
47
Zone of
reference
Stage Energy
consumption
(MJ/km)
GHG
emissions
(g CO2-
eq/km)
Total
emissions per
stage
(g CO2-eq/MJ
fuel LHV)*17
Annual
saving in
CO2
Emissions
(ton
CO2/ha/year)
South East of
Bs. As. (Tandil)
Agriculture 0,1037 12,2
21.5
1,3 Industrial 0,4627 27
Transport*18
0,0787 5,4
Total 0,6450 44,7
South of Sta. Fe
(Venado Tuerto)
Agriculture 0,0745 9,1
18,5
2,1 Industrial 0,4624 27
Transport 0,0343 2,4
Total 0,5715 38,5
North of Bs.
As./South of
Sta. Fe
(Pergamino)
Agriculture 0,0518 5,2
16,4
1,8 Industrial 0,4627 27
Transport 0,0290 2
Total 0,5435 34,2
West of Bs. A.s
(Pehuajo)
Agriculture 0,0518 5,2
17,5
1,7
Industrial 0,4627 27
Transport 0,0600 4,1
Total 0,5745 36,4
South of
Córdoba (Río
Cuarto)
Agriculture 0,0464 3,2
16,4
1,4 Industrial 0,4627 27
Transport 0,0557 3,9
Total 0,5648 34,9
Salta
(Las Lajitas)
Agriculture 0,0464 3,2
18,9
1,3 Industrial 0,4627 27
Transport 0,1328 9,2
Total 0,6419 39,4
Table 3: Energy consumption and GHG emissions for the different agriculture,
transport (feedstock and biodiesel transportation) and industrial (drying and storage,
crushing and estherification) stages for the different scenarios.
*
17 LHV: Lower Heating Value: difference in enthalpy of a fuel at 25 °C and the products of its combustion at
150 °C
*18
The relative impact of sea transportation is very low.
In this comparative study, the following parameters vary: energy consumption (No Till
Farming vs. Conventional Agriculture in different areas of reference in Argentina), the
quantity of fertilizers used per hectare (idem), distance with respect to the location for
processing the feedstock -soybean- (which depended on each respective zone of reference),
energy consumption for the drying of the grain. On the other hand, the energy consumption
for the industrial stage was kept constant for all different scenarios according to surveys done
in Argentina.
Based on these comparisons, it was possible to obtain results with respect to global and
specific (by stage or step) energy consumption; and with respect to global and specific (by
stage or step) GHG emissions.

48
In this way and taking into account the software’s assumptions (see Materials and Tools),
with respect to the energy consumption (MJ/km), at a global level, it appeared that:
- The scenario that showed the highest energy consumption was Salta (0,6419 MJ/km).
Compared to conventional diesel, savings of energy consumption was 73,3 %. If we
determine a relative scale, where the lowest energy consumption scenario (North of Buenos.
Aires./South of Santa. Fe) represents 100% of the energy consumption, its percentage
difference with the highest relative energy consumption scenario (Salta) was:
ΔSalta- NBUE S Sta. Fe./NBUE S Sta. Fe = 17,3 %.
In spite of the fact that several of the assumptions from the software are fulfilled (yields
between each scenario vary by 200%, the use of fertilizers between 100 and 11,5% and the
distance to the location for processing the feedstock by 463%) these differences are
considered not significative.
- The scenario that showed the lowest energy consumption was North of Buenos Aires/South
of Santa. Fe (0,5435 MJ/km). Compared to conventional diesel, savings in energy
consumption were 77,4 %.
With respect to energy consumption (MJ/km) for the Agricultural Stage:
- The scenario that showed the highest energy consumption for the Agricultural Stage, was
South East of Bs. As (0,1037 MJ/km). If we determine a relative scale, where the scenario for
the lowest energy consumption for the agricultural stage (South of Cordoba 0,0464 MJ/km)
represents 100% of the energy consumption, its percentage difference with the scenario with
the highest relative energy consumption for the agricultural stage (South East of Bs. As.) was:
ΔSouthEast of Bs. As-South of Córdoba. = 125,4 %.
Having fulfilled the assumptions of the software (yields between each scenario vary in 4,0%,
the energy consumption varies in 57% and use of fertilizers in 100%) these differences were
considered significant.
- The scenario that showed the lowest energy consumption for the Agricultural Stage was
South of Córdoba. (0,0464 MJ/km).
With respect to the energy consumption (MJ/km) for the Transport Stage:
- The scenario that showed the highest energy consumption for the Transport Stage was Salta
(0,1328 MJ/km). If arbitrarily we determine a relative scale, where the scenario of the lowest
energy consumption for the Transport Stage (North of Buenos Aires./South of Santa. Fe)
represents 100% of the energy consumption, its percentage difference with the scenario with
the relative highest energy consumption for the Transport Stage (South West of Bs. As.) was:
ΔSalta-Norte de Bs. As./Sur de Sta. Fe = 355,5 %.
Having fulfilled the assumptions of the software (distance between the different scenarios and
the location where the feedstock is processed varies in 491%), theses differences were
considered significant.
- The scenario that showed the lowest energy consumption for the Transport Stage was North
of Buenos Aires/South of Santa. Fe (0,0290 MJ/km).
With respect to GHG emissions (Kg CO2 eq/km), at a global level we concluded that:
- The scenario that showed most GHG emissions was South East of Buenos Aires (0,0447 Kg
CO2 eq/km). Comparing in percentage with conventional diesel, its GHG emissions were
21,5% and its reductions of GHG emissions reached 75,5 %.
- The scenario that showed less GHG emissions was South of Córdoba (0,0464 Kg CO2
eq/km). Comparing in percentage with conventional diesel, its GHG emissions were 23,5%
and its reductions of GHG emissions reached 76,5%.

49
- There is an important annual saving of CO2 emissions (ton CO2/ha/year) on the scenarios of
North of Buenos Aires./South of Santa. Fe (1,8 ton CO2/ha/year) and the scenario of West of
Buenos Aires. (1,8 ton CO2/ha/year).
Impact of sea transportation from Argentina
Sea transportation’s impact, in spite of the distance between the port of origin and the final
destination of the product in Europe being significant, is relatively low. An exercise was
performed by lowering the transportation distance of the product to 0 in order to evaluate its
impact over the final numbers for the best and worst scenarios. For the case of North of
Buenos Aires the reduction in energy consumption of MJ/km went up from 77,4 to 77,9% and
of GHG emissions (Kg/km) from 81,3 to 81,8 %.
With respect to GHG emissions (g CO2 eq/km) for the Agricultural Stage, the following
observations were made:
- The scenario that showed more GHG emissions for the Agricultural Stage was South East of
Buenos Aires. (12,2 g CO2 eq/km). If we determine a relative scale, where the scenario of
least GHG emissions for the Agricultural Stage (South of Córdoba and Salta) represent 100%
of the GHG emissions, its percentage difference with the scenario with relatively more GHG
emissions (scenario of South of Santa Fe) was:
ΔS of S.Fe.-West of Bs.As. = 284%.
Having fulfilled the assumptions of the software (yields between each scenario vary in 103%
and the use of fertilizers varies in 100%) these differences were considered significant.
- The scenario that showed less GHG emissions is the scenario of West of Buenos Aires and
Salta with 3,2 g CO2 eq/km.
With respect to GHG emissions (g CO2 eq/km) for the Transport Stage the following
observations were made:
- The scenario that showed more GHG emissions for the Transport Stage was Salta (9,2 g CO2
eq/km). If arbitrarily we determine a relative scale, where the scenario with less GHG
emissions for the Transport Stage (North of Buenos Aires./South of Sta. Fe) represented
100% of GHG emissions, its percentage difference with the scenario with relatively more
GHG emissions (Salta) was:
ΔSalta. –North of Bs. As./South of Sta. Fe = 360%.
Having fulfilled the assumptions of the software (distance between the different scenarios and
the location where the feedstock is processed varies in 463%) these differences were
considered significant.
- The scenario that showed least GHG emissions for the Transport Stage is the scenario of
North of Buenos Aires./South of Santa. Fe (2 g CO2 eq/km).
5. DISCUSSION AND CONCLUSION
- In general, the Industrial Stage, in first place, together with the Agricultural Stage, in second
place, were the stages that jointly generated higher energy consumption.
- Among possible domestic scenarios, the scenario of South East of Buenos Aires. (Tandil)
was specifically where a higher energy consumption was detected (with GHG reductions in
the order of 73,2% in comparison with conventional diesel. The scenario of North of Buenos
Aires./South of Santa. Fe (Pergamino) was specifically the context where the lowest energy
consumption (with GHG reduction of 77,4% ) was observed.

50
- Among possible domestic scenarios, the scenario of South East of Bs. As. (Tandil) was
specifically the context where the highest energy consumption for the Agricultural Stage
(0,1037 MJ/km) was observed. The scenario of South of Córdoba (Rio Cuarto) was
specifically the context where the lowest energy consumption for the Agricultural Stage
(0,0464 MJ/km) was observed. The differences between both scenarios seem to stem from the
fact that in the scenario of South East of Buenos Aires–Tandil, they use a conventional
agriculture system, with a higher energy consumption per hectare (1.575 MJ/ha/year) than
using No-Till farming (998 MJ/ha/year).
- A direct relation between a higher consumption of fertilizers per hectare in the Agricultural
Stage (although this does not necessarily mean an increase in yield per hectare) and a lower
efficiency in energy consumption in that same stage (West of Buenos Aires-Pehuajo) does not
seem to exist. The efficiency in energy consumption seems to be related to high yields and
low energy consumption per hectare (No-Till Farming vs. Conventional Agriculture).
- Among possible domestic scenarios, the scenario of Salta (Las Lajitas) was specifically the
context where the highest energy consumption for the Transport Stage (0,1328 MJ/km) was
observed. The scenario of North of Buenos Aires/South of Santa. Fe (Pergamino) was
specifically the context where the lowest energy consumption for the Transport Stage (0,0290
MJ/km) was observed. This is due to the larger distance that separates the area of Salta from
the location where feedstock is processed (Port complex of Puerto San Lorenzo/Puerto
General San Martín, Province of Santa Fe). This has changed in the last years since a new
soybean conversion plant was installed in the region, changing the equation.
- In general, the Industrial Stage in first place, together with the Agricultural Stage, in second
place, are the stages that jointly generate more GHG emissions.
- Among possible domestic scenarios, the scenario of South of Córdoba (Rio Cuarto) and of
North of Buenos Aires (Pergamino) were specifically the contexts where the highest reduction
in GHG emissions (with savings of 81,3% in GHG emissions compared to conventional
diesel) was observed. The scenario of South East of Buenos Aires (Tandil) was specifically
the context where the lowest reduction of GHG emissions (with savings of 75,5% in GHG
emissions) was observed.
- Among possible domestic scenarios, the scenario of South East of Buenos Aires (Tandil)
was specifically the context where the highest GHG emissions for the Agricultural Stage
(12,2 g CO2 eq/km) was observed. The scenarios of South of Córdoba and Salta (Rio Cuarto
and Las Lajitas) were specifically the contexts where the lowest GHG emissions for the
Agricultural Stage (3,2 g CO2 eq/km) was observed. It is very likely that the differences
observed are due to different types of farming and use of fertilizers between scenarios.
- In the case of large distance between the location where the feedstock (soybean) is obtained
and the location where it is processed, the impact of the Transport Stage on global GHG
emissions increases (Example: scenario of Salta).
- Among possible domestic scenarios, the scenario of Salta (Las Lajitas) was specifically the
context where the highest GHG emissions for the Transport Stage (9,2 g CO2 eq/km) was
observed. The scenario of North of Buenos Aires/South of Santa Fe (Pergamino) was
specifically the context where the lowest GHG emissions for the Transport Stage (2 g CO2
eq/km) was observed. The difference between both scenarios lies in the large distance
between the location where feedstock (soybean) is obtained and the location where it is
processed (Example: scenario of Salta –Las Lajitas- 1130 km).
During the last years new studies were performed on actual plants considering all stages with
real and traceable figures obtained from the companies. Final results indicate an overall GHG
reduction of over 70 %.

51
6. RECOMMENDATIONS
Since the majority of soybean production is focused on the central agricultural areas were the
results were more favorable, a single number for the characterisation of Argentine production
would be closer to the results obtained for North of Buenos Aires/South of Santa Fe
(Pergamino). Calculations made allow the identification and characterization of Argentine
production in order to be able to compare it with other agricultural industry systems
worldwide.
Another important issue is the need for a deep study over the yield variations between
different years and regions since this is a key factor affecting the final results.
7. REFERENCES
- Abanades García J.C., Cuadrat Prats J.M., Castro Muňoz De Lucas M;., Fernández
García F., Galasategui Zulaica C., Garrote de Marcos L., 2007, El Cambio Climático en
España. Estado de Situación. Documento Resumen. Instituto para la Diversificación y el
Ahorro de Energía (IDEA). Oficina Española de Cambio Climático (OECC). 50 pp.
- Ciani R., Petri G., Nebbia F., 2007, Informe preliminar del transporte de granos en
Argentina. Dirección de Mercados Agroalimentarios, Infraestructura Comercial y Regímenes
Especiales. Subsecretaría de Política Agropecuaria y Alimentos. Secretaria de Agricultura,
Ganadería, Pesca y Alimentos (SAGPyA). 12 pp.
- Clery D., 2007, A Sustainable Future, If We Pay Up Front. Science, 315:782-783.
- Donato L.B. & I.R. Huerga I.R., 2007, Principales Insumos en la Producción de
Biocombustibles. Un Análisis Económico. Balance Energético de los Cultivos Potenciales
para la Producción de Biocombustibles. Instituto de Ingeniería Rural, Centro de
Investigación en Agroindustria, Centro Nacional de Investigaciones Agropecuarias, Instituto
Nacional de Tecnología Agropecuaria (INTA). 78 pp.
- Della Torre R., 2008, Cuanto combustible se consume en argentina para secar granos EEA
INTA Balcarce http://www.inta.gov.ar/balcarce/info/indices/tematica/agric/posco/gral.htm
- European Commission Joint Research Centre (EC JRC), Institute for Energy &
Transport, Input data relevant to calculating default GHG emissions from biofuels according
to RE Directive Methodology, http://re.jrc.ec.europa.eu/biof/html/input_data_ghg.htm
- FAO, 2008, Conferencia de Alto Nivel Sobre la Seguridad Alimentaria Mundial: Los
Desafíos del Cambio Climático y la Bioenergía. Bioenergía, Seguridad y Sostenibilidad
Alimentarias: hacia el Establecimiento de un Marco Internacional. Roma, Italia. 21 pp.
- Farrell A.E, Plevin R.J., Turner B.T., Jones A.D., O’Hare M., Kammen D.M., 2006,
Ethanol Can Contribute to Energy and Environmental Goals, Science, 311:506-508
- Figueroa de la Vega F. A., 2008, Tablero de comando” para la promoción de los
biocombustibles en Ecuador. Comisión Económica para América Latina y el Caribe
(CEPAL), Naciones Unidas (ONU), Ministerio Federal de Cooperación Económica y
Desarrollo de Alemania (BMZ). 162 pp.
- FMI., 2007, Perspectivas de la Economía Mundial. Desbordamientos y ciclos de la
economía mundial. Fondo Monetario Internacional (FMI). 344 pp.
- Goldemberg J., 2007. Ethanol for a Sustainable Energy Future. Science, 315:808-810.
- Hamelink C., Koop K., Croezen H., Koper M., Kampman B. & Bergma G., 2008,
Technical Specification: Greenhouse Gas Calculator for Biofuels. The CO2 Bioenergy Tool.
Versión 2.1b. ECOFYS-SenterNovem. 103 pp.
- Karlsoon M., 2007, Bioenergía sostenible: un marco para la toma de decisiones. Naciones
Unidas (ONU-Energía). Traducción de la Oficina de la FAO en América Latina y el Caribe.
69 pp.
52
- Lechón Y., Cabal H., Lago C., De la Rúa C., Sáez R.& M. Fernández M., 2005, Análisis
de Ciclo de Vida de combustibles alternativos para el transporte. Fase I. Análisis de Ciclo de
Vida comparativo del etanol de cereales y de la gasolina. Energía y cambio climático. Centro
de Investigaciones Energéticas, Medio ambientales y Tecnológicas. Ministerio de Medio
Ambiente y Ministerio de Educación de España. 114 pp.
- Panichelli L., 2006, Análisis de Ciclo de Vida (ACV) de la producción de biodiesel (B100)
en Argentina. Especialización en Gestión Ambiental de Sistemas Agroalimentarios. Escuela
para Graduados “Alberto Soriano”, Facultad de Agronomía, Universidad de Buenos Aires,
Buenos Aires, Argentina. 90 pp.
- Revista Márgenes Agropecuarios, September 2008, Año 24. Nro. 279
- Steiner A., 2008, Anuario 2008: Un panorama de nuestro cambiante medio ambiente.
Naciones Unidas. Programa de las Naciones Unidas para el Medio Ambiente (PNUMA),
Naciones Unidas (ONU). 60 pp.
Aknolowdgements
We thank the input, criticisms and corrections from key consultants from the public and
private sector, on different issues consulted. Their contribution and observations allowed us to
improve this work by consolidating and revealing the database and results obtained.

53
Field measurements of agricultural emissions
G.Posse 1, N.Lewczuk
1,2, K. Richter
1 and J. Hilbert
3
1 Instituto de Clima y Agua. CIRN- INTA Castelar, Argentina
2 CONICET, Argentina
3 Ingenieria Rural. INTA Castelar, Argentina
Summary
Nitrous oxide plays an important role for the balance of greenhouse gases (GHG) on
agricultural soils, followed by carbon dioxide and methane. The methods that are used to
calculate the GHG balance include theoretical estimations based on data taken from literature,
and the application of different models by using default emissions factors values or local data.
It is recommended that local data are used because they improve the model results and lead to
better estimations of the nitrous oxide emissions. In Argentina several groups of INTA have
begun to carry out field measurements to obtain carbon dioxide, nitrous oxide and methane
emissions by using the static chamber methodology. On one site, we are measuring with the
eddy covariance methodology, that allows us to obtain continuous data on a large study area,
which typically comprises hundreds of m2. On the contrary, emissions measured with static
chambers refer to areas of less than a square meter and a high variability has been found at
different sites. N2O emission rates depend on soil type, soil management, moisture in the soil
and soil temperature. The variability of these parameters leads to variable emissions. The
implementation of micrometeorological techniques with sensors which measure the N2O net
exchange at the scale of an entire field is thus necessary to reduce uncertainty.
1. INTRODUCTION
There is a growing interest in investigations of the changes of atmospheric concentrations of
carbon dioxide (CO2) and their potential impacts on global climate change. The increasingly
frequent extreme events that are registered worldwide and the change of precipitation patterns
and mean temperatures have begun to cause concerns in the international community. In this
context, several trace gases such as nitrous oxide and methane are receiving attention because
of their effects on the radiation balance in the atmosphere. Although the industrial activities
have a high responsibility for the increase of the CO2 atmospheric concentration, land use and
land use change also have a great impact on the atmosphere composition. The main
greenhouse gases are carbon dioxide (CO2), nitrous oxide (N2O) and methane (CH4).
Agriculture soils are the main source of CO2 and N2O. Livestock and paddy soils are the main
source of CH4. To quantify the so-called carbon footprint of a product or process, it is
necessary to take into account all GHG emissions in the course of the production process.

54
Cultivated areas occupy about 40% of the terrestrial surface (FAO, 2003) and this proportion
is increasing (Green et al. 2005; Betts and Falloon 2007), with the consequence that
agricultural ecosystems play a major role in the GHG balance (Salinger, 2007). In countries
like Argentina, where agriculture is one of the main commercial activities, data from GHG
emissions from agricultural soils have a high impact on national inventories of GHG
emissions. These inventories are elaborated with models of different complexity and are based
on different assumptions and emission factors measured on the field.
Worldwide great efforts are undertaken to describe the carbon fluxes in different ecosystems.
A measurement network called FLUXNET was created, consisting of flux towers which use
the eddy covariance method to estimate the balance of carbon and water. This methodology
allows for a continuous quantification of the CO2 sequestration and respiration on large areas
and does not interfere with the behaviour of the ecosystem. The participants of the network
share information and many works have been carried out to obtain a synthesis of the data
(Canadell et al. 2000, Baldocchi et al. 2001, Tupek et al. 2010). The data from this network
have let to an improvement of the knowledge about the impact of seasonal variability, inter-
annual variability, the management of agricultural and other areas, as well as on gains and/or
loss of carbon and water in different ecosystems.
Agricultural soils are a major source of nitrous oxide emissions. Nitrous oxide has a 298 times
higher warming potential than CO2. It is emitted naturally from microbial processes of
nitrification and denitrification in the soil (Davidson 1991, Conrad 1996). The use of nitrogen
fertilizer and the return of animal dung and urine in agricultural activities increase the content
in mineral soil nitrogen. In turn, this increases the rate at which bacteria release N2O. It is also
known that emission rates are highly variable, depending on soil type, type of management
and environmental variables such as humidity in air, soil temperature, water content in the soil
and soil porosity are important. Based on the results of some studies, several models have
been developed to simulate the behaviour of nitrogen in ecosystems, especially in agriculture.
Most of these models have a strong theoretical component and are supported by some
empirical data (Li et al. 1992, Parton et al. 1998). Some papers have compared model results
with values obtained from field measurements. These studies have shown that in some cases
the model estimations are acceptable but in some situations the models overestimate or
underestimate the measured values (Abdalla et al. 2010, Frolkin et al. 1998, Li et al. 2000).
So, it is necessary to enlarge the database of nitrous oxide emissions measured in the field in
order to check the model results.
Non steady-state chambers are widely used for measuring soil to atmosphere fluxes of N2O.
Chamber measurements provide many of the data used in “bottom-up” assessments of
regional and global N2O emissions and are used to calibrate emission models (Del Grosso et
al. 2005). There is some diversity in the characteristics of chamber measurements, e.g. there
are vented or non-vented chambers (with or without air flow), as described in Livingston &
Hutchinson (1995) (Fig. 1). Chambers have two parts: the anchor which is buried in the
ground a few days before the measurement and a cup that confines a portion of soil. Different
research groups have agreed a common methodology to make their measurements
comparable.
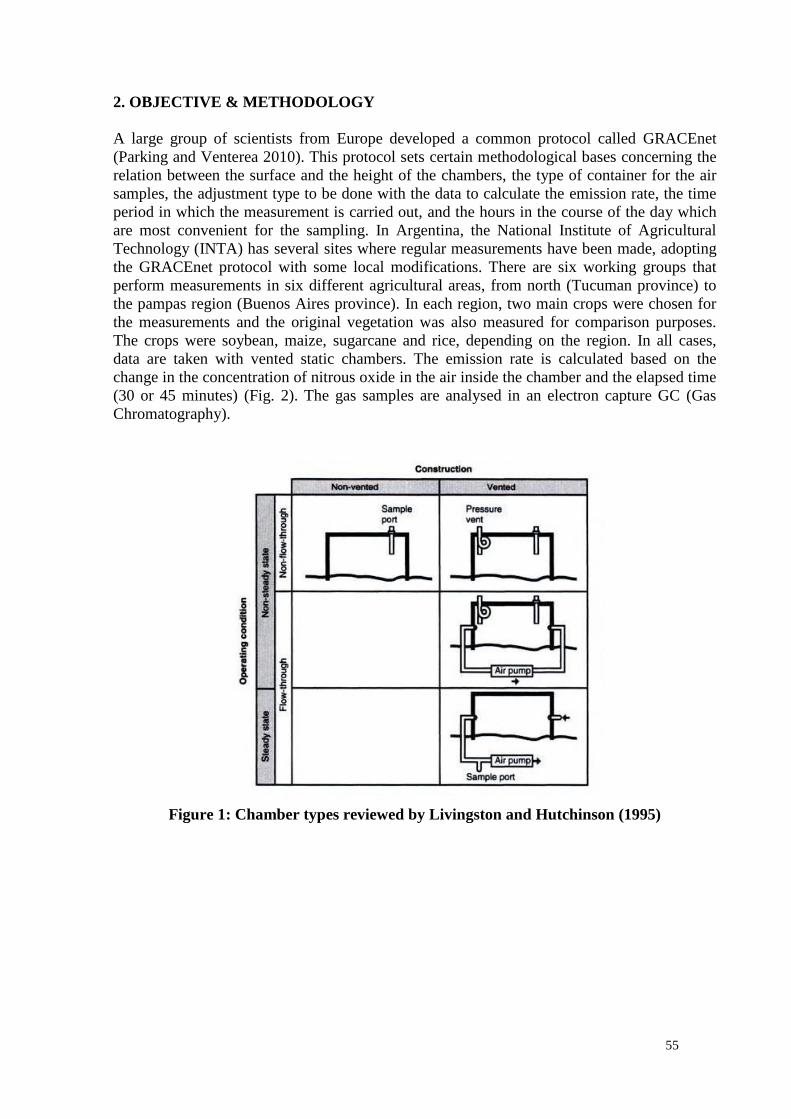
55
2. OBJECTIVE & METHODOLOGY
A large group of scientists from Europe developed a common protocol called GRACEnet
(Parking and Venterea 2010). This protocol sets certain methodological bases concerning the
relation between the surface and the height of the chambers, the type of container for the air
samples, the adjustment type to be done with the data to calculate the emission rate, the time
period in which the measurement is carried out, and the hours in the course of the day which
are most convenient for the sampling. In Argentina, the National Institute of Agricultural
Technology (INTA) has several sites where regular measurements have been made, adopting
the GRACEnet protocol with some local modifications. There are six working groups that
perform measurements in six different agricultural areas, from north (Tucuman province) to
the pampas region (Buenos Aires province). In each region, two main crops were chosen for
the measurements and the original vegetation was also measured for comparison purposes.
The crops were soybean, maize, sugarcane and rice, depending on the region. In all cases,
data are taken with vented static chambers. The emission rate is calculated based on the
change in the concentration of nitrous oxide in the air inside the chamber and the elapsed time
(30 or 45 minutes) (Fig. 2). The gas samples are analysed in an electron capture GC (Gas
Chromatography).
Figure 1: Chamber types reviewed by Livingston and Hutchinson (1995)

56
Figure 2: Change of N2O concentration inside the chamber space over time.
The slope of the regression represents the emission rate.
3. RESULTS & DISCUSSION
At the Institute of Climate and Water (INTA-ICyA), we began to make field measurements
with static chambers in 2009. After some proof comparison of results between different
chamber size and forms, we decided to use a rectangular chamber with a 37 × 25.5 cm base
area (943.5 cm2) and a height of 14 cm
(Fig. 3).
Figure 3: Non steady-state chambers used by the Institute of Climate and Water
(INTA Argentina) on a soybean field.
The cup of the chamber had a sampling port with a key for closing and opening the port. Air
samples were taken from the chamber headspace at intervals of 0, 15 and 30 minutes after
closing the chambers. Air samples, from which the concentration of nitrous oxide was
determined, were sampled in glass vials of 10 cc (which were evacuated before taking the
sample with a manual vacuum pump). Based on the increase of the concentration in the
measurement period, we calculated the emission rate per unit area. Each measurement
included collection of data on air temperature and soil. A soil sample was taken in each
chamber site at the end of the measurements, in order to analyse water filled pore space and
nitrate and ammonium content. Presently, we are carrying out measurements at two sites.
Both sites are in Buenos Aires province, but they have different soil structures. Field site 1,

57
situated in the north-east of the province, is an area of clay soils with high water retention.
There, we took measurements during two soybean growing seasons and maize growing
seasons. Measurements after harvest were also carried out. The nitrous oxide emissions were
in average 83 microgram N-N2O m-2
h-1
. Only on one date, we could record an emission peak,
with more than 300 microgram N-N2O m-2
h-1
. In the second field site, we began to take
measurements in November 2012. There, we use to measure N2O fluxes non steady state
chambers and eddy covariance methodology. This site is located in the west of the province of
Buenos Aires where the texture is coarser than at site 1. We followed the more typical
rotations made in this region: soybean I - wheat - soybean II rotation. So far, the average
values were 12 microgram N-N2O m-2
h-1
during the soybean I and II campaign and 10
microgram N-N2O m-2
h-1
in a wheat field (Fig. 5).
Dec Jan Feb Mar Apr May Jun Jul
ug N
-NO
2 m
-2 h
-1
-20
0
20
40
60
80
100
120
140
160
soybean harvest
bc
c
a
ab
ab
ab
c cbc
Figure 4: Average N2O emissions obtained with static chambers over a complete
soybean growing season, from sowing to post harvest on a fallow field at field site 1.
The bars are standard deviations.
Figure 5: Average N2O emissions in soybean I, stubble soybean, soybean II and wheat
obtained with static chambers at field site 2. The bars are standard deviations.
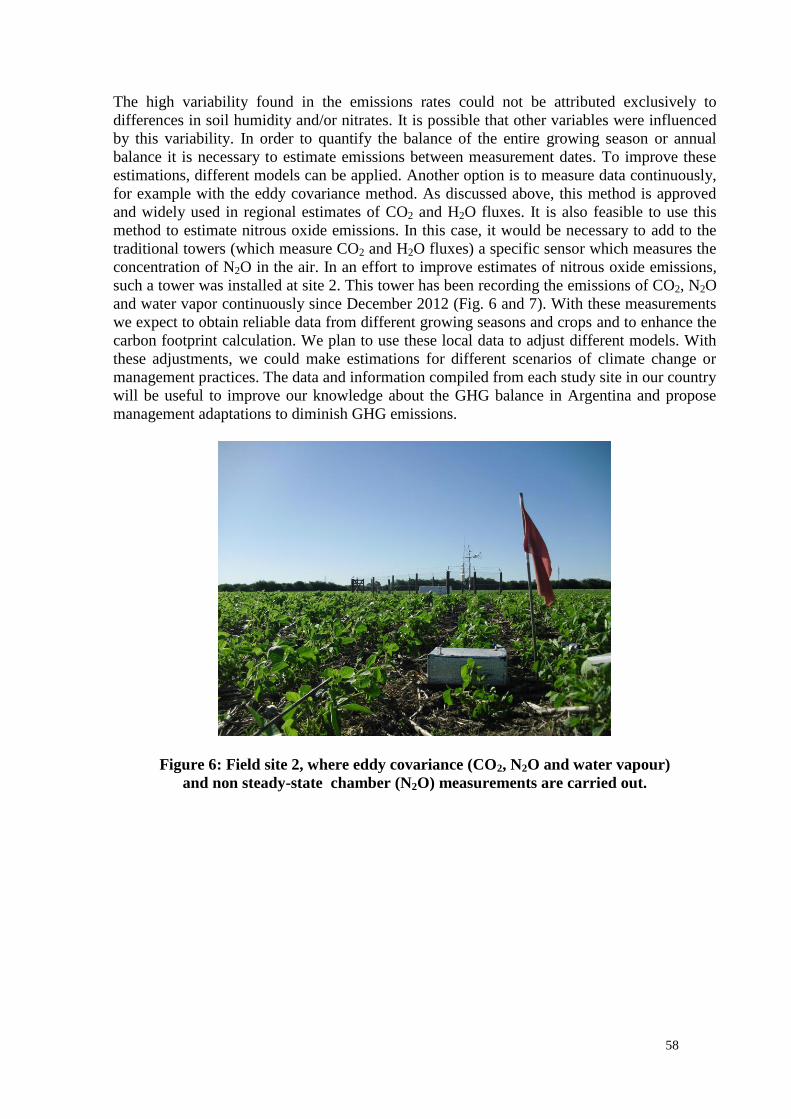
58
The high variability found in the emissions rates could not be attributed exclusively to
differences in soil humidity and/or nitrates. It is possible that other variables were influenced
by this variability. In order to quantify the balance of the entire growing season or annual
balance it is necessary to estimate emissions between measurement dates. To improve these
estimations, different models can be applied. Another option is to measure data continuously,
for example with the eddy covariance method. As discussed above, this method is approved
and widely used in regional estimates of CO2 and H2O fluxes. It is also feasible to use this
method to estimate nitrous oxide emissions. In this case, it would be necessary to add to the
traditional towers (which measure CO2 and H2O fluxes) a specific sensor which measures the
concentration of N2O in the air. In an effort to improve estimates of nitrous oxide emissions,
such a tower was installed at site 2. This tower has been recording the emissions of CO2, N2O
and water vapor continuously since December 2012 (Fig. 6 and 7). With these measurements
we expect to obtain reliable data from different growing seasons and crops and to enhance the
carbon footprint calculation. We plan to use these local data to adjust different models. With
these adjustments, we could make estimations for different scenarios of climate change or
management practices. The data and information compiled from each study site in our country
will be useful to improve our knowledge about the GHG balance in Argentina and propose
management adaptations to diminish GHG emissions.
Figure 6: Field site 2, where eddy covariance (CO2, N2O and water vapour)
and non steady-state chamber (N2O) measurements are carried out.

59
Figure 7: N-N2O emissions average in soybean I/soybean II/wheat rotation,
with Eddy Covariance tower at field site 2.
4. REFERENCES
- Abdalla M., Jones M., Yeluripati J., Dmith P., Burke J. & Williams M., 2010, Testing
DayCent and DNDC model simulations of N2O fluxes and assessing the impacts of climate
change on the gas flux and biomass production from a humid pasture. Atmospheric
Environment 44: 2961-2970.
- Baldocchi D.D., Falge E., GU L., Olson R., Hollinger D.Y, Running S.W., Anthoni P,
Bernhofer CH., Davis K.J., Evans R., Fuentes J., Goldstein A., Katul G., Law B.E., Lee
X., Malhi Y., Meyers T.P., Munger J.W., Oechel W.C., Paw U.K.T., Pilegaard K.,
Schmid H.P., Valentini R., Verma S., Vesala T., Wilson K. B. & Wofsy S.C., 2001,
FLUXNET: a new tool to study the temporal and spatial variability of ecosystem-scale carbon
dioxide, water vapor and energy flux densities. Bulletin of the American Meteorological
Society 82: 2415-2434.
- Canadell J.G., Mooney H.A., Baldocchi D.D., Berry, J.A., Ehleringer J.R., Field C.B.,
Gower S.T., Hollinger D.Y., Hunt J.E., Jackson R.B., Running S.W., Shaver G.R.,
Steffen W., Trumbore S.E., Valentini R. & Bond B.Y., 2000, Carbon metabolism of
terrestrial biosphere. Ecosystems 3, 115-130.
- Conrad R., 1996, Soil microorganisms as controllers of atmospheric trace gases (H2, CO,
CH4, OCS, N2O, and NO), Microbiology Rev. 60, 609–640.
- Davidson E.A., 1991, Fluxes of nitrous oxide and nitric oxide from terrestrial ecosystems.,
In Microbial Production and Consumption of Greenhouse Gases: Methane, Nitrogen Oxides,
and Halomethanes, edited by J. E. Rogers and W. B. Whitman, pp. 219–235, American
Society for Microbiology, Washington D. C.
- Del Grosso S.J., Mosier A.R., Parton W.J. & Ojima D.S., 2005, DAYCENT model
analysis of past and contemporary soil N2O and net greenhouse gas fluxes fro major crops in
the USA. Soil Tillage Res. 83: 9-24.
- Frolking S.E., Mosier A.R., Ojima D.S., Li C., Parton W.J., Potter C.S., Priesack E.,
Stenger R., Haberbosch C., Dorsch P. Flessa H. & Smith K.A., 1998, Comparison of N2O

60
emissions from soils at three temperate agricultural sites: simulations of year-round
measurements by four models. Nutrient Cycling in Agroecosystems 52: 77-105.
- Li C., Frolking S. & Frolking T.A., 1992a, A model of nitrous oxide evolution from soil
driven by rainfall events: 1. Model structure and sensitivity. J. Geophys. Res. 97: 9759_9776.
- Livingston G.P., &. Hutchinson G.L., 1995, Enclosure-based measurement of trace gas
exchange: Applications and sources of error. p. 14–51. In P.A. Matson and R.C. Harriss (ed.)
Methods in Ecology. Biogenic trace gases: Measuring emissions from soil and water.
Blackwell Science, Malden, MA.
- Parkin T.B. & Venterea R.T., 2010, Sampling protocols. Chapter 3. Chamber-Based Trace
Gas Fluxes Measurements. In: Sampling Protocols. R.F. Follet, edior. P: 3.1 to 3.39.
(www.ars.usda.gov/research/GRACEnet)
- Parton W.J., Hartman M.D., Ojima D.S. & Schimel D.S., 1998, DAYCENT: its land
surface submodel-description and testing. Global Planet. Change 19: 35_48.
- Tupek B., Zanchi G., Verkerk P.J., Churkina G., Viovy N., Hughes J.K. & Lindner M.,
2010, A comparison of alternative modelling approaches to evaluate the European forest
carbon fluxes. Forest Ecology and Management 260: 241-251.
Acknowledgement
This work was supported by INTA Projects AERN 3632, PNNAT 1128023 and extra INTA
project with SOLIDARIDAD. We thank Los Grobo for allowing us to make measurements in
their crop lands.
61
Sustainability Certification of Argentine Soybean-Based Biodiesel
F. Pochat
Girobiz – Estrategia Sustentable
San Vladimiro 3056 – San Isidro – Buenos Aires – Argentina
Summary
As of 2012, Argentina was the third largest producer and the biggest exporter of biodiesel in
the world, with the European Union (EU) being its main export market. To certify the
sustainability of its biodiesel production and comply with the requirements of the EU’s
Renewable Energy Directive (Directive 2009/28/EC, the RED), the Argentine biofuels
industry developed the Carbio Sustainability Certification Scheme (CSCS).
Under the CSCS, soybeans for biodiesel can only be produced on land which was being used
for agricultural production before 1 January 2008. A mapping system developed by the
National Agricultural Technology Institute (INTA) is used to ensure compliance with this
land-related criterion and to provide proof of origin for sustainable soybeans. It is based on
satellite imagery, soil charts, land registers, and site surveys. Greenhouse gas (GHG)
emissions savings are calculated using both default and actual values, in accordance with
Annex V to the RED. All members participating in the CSCS are required to use a mass
balance approach to keep track of the chain of custody (traceability).
Keywords: biodiesel; sustainability certification; soybean; RED.
1. INTRODUCTION
Energy consumption in the transport sector in the EU depends almost entirely on imported
fossil fuels. The transport sector is crucial to the functioning of the whole economy, and is
forecast to grow more rapidly than any other sector up to 2020 and beyond (DG Energy,
2011).
The EU recognised these facts and took into account the contribution of the transport sector
to climate change and the increase in GHG emissions. As far back as 2003, the EU set itself
the goal of attaining a 5.75 % share of renewable energy in the transport sector by 2010
(Directive 2003/30/EC). Under the new RED, this goal is increased to a minimum of 10 % in
every Member State in 2020 (Directive 2009/28/EC). The RED also aims to ensure that, as
Europe increases its use of biofuels, sustainability requirements are met in order to generate a
clear net GHG saving and have no negative impact on biodiversity or land use.
The Directive recognises that the increased use of energy from renewable sources, together
with energy savings and greater energy efficiency, are important parts of the package of
measures needed to reduce GHG emissions and comply with the Kyoto Protocol to the UN
Framework Convention on Climate Change. These factors also have an important part to play
in safeguarding EU energy supplies, promoting technological development and innovation,
and providing opportunities for employment and regional development, especially in rural
and isolated areas

62
The RED applies to both EU production and imported biofuels, and Member States cannot
set additional criteria (Van Erck, 2010). It requires that any biofuel used in the EU, in order
to count toward the EU targets (10 % in transport) and be eligible for financial support, has to
save at least 35 % GHG emissions relative to fossil fuels.1 Biofuel crops must not be grown
on land with high biodiversity, such as primary forest or highly biodiverse natural grassland,2
or land with high carbon stock (wetlands, continuously forested areas, peatland).3
Finally, a
mass balance approach must be used for the chain of custody. Book and claim systems are
not allowed.
The European Commission may certify voluntary national or international schemes as
demonstrating compliance. Where evidence has been produced under such a scheme,
Member States may not demand further evidence from the supplier.4
Argentine biodiesel
Over a period of four years (from 2007, when the first industrial-scale biodiesel facility
became operational, to 2011) Argentina became the third largest producer and the biggest
exporter of biodiesel in the world. In 2011, Argentina produced more than 2.3 million tonnes
of high quality biodiesel, of which 0.8 million tonnes were consumed domestically, and the
rest was exported worldwide, the EU being the main destination. 100 % of Argentine
biodiesel is produced from soybean oil (a by-product of the processing of soybeans for the
production of protein-rich soybean meal).5
This remarkable growth was achieved on the basis of a set of competitive advantages unique
to Argentine production. Argentina has vast and fertile plains – known as the Pampas – with
a warm climate and above-average productivity. These areas are ideal for crop production.
Argentina is recognised as having one of the most sustainable and efficient agricultural
systems in the world.
Sustainable agriculture in this country implies a virtuous circle of good agricultural practices
including no-till farming, crop rotation, integrated pesticide/herbicide management, nutrient
recuperation, and the rational use of agricultural machinery. Good agricultural practices
increase productivity, conserve natural resources, contribute to carbon sequestration and
natural nutrient replacement, and prevent soil exhaustion. Soybeans, as most Leguminosae,
fix nitrogen from the atmosphere, thus avoiding the use of artificial fertilisers, another source
of GHG emissions.
No-till farming techniques not only reduce GHG emissions, since they promote year-round
soil cover, but also minimise water losses from direct soil evaporation, minimise residue
disturbance and erosion losses, and favour biodiversity. This has a favourable impact on the
carbon and water footprint of the crop.
Three recent studies by leading international research institutes and consultancies based in
the UK, Germany and Argentina confirm that Argentine biodiesel produced from local
soybean feedstock reduces GHG emissions by at least 56 % compared to fossil fuels.6
These
1 Only applies to existing installations producing biofuels from April 2013. Minimum saving rises to
50 % from 2017. New installations producing biofuels from 2017 must meet 60 % minimum (Article
17(2)). 2 Article 17(3).
3 Article 17(4).
4 Article 18(7).
5 Of each tonne of soybeans processed at crushing facilities, almost 80 % in weight is converted into
soybean meal, a natural source of protein and essential amino acids. Less than 20 % is converted into
soybean oil (the rest is soybean hulls). 6 Greenhouse gas savings of typical Argentine soy biodiesel pathway according to:
INTA — Argentina: 75 % (Hilbert et al., 2009)

63
studies use the methodology for calculating the GHG savings of biofuels laid down by the
European Commission in Annex V to the RED.
The 56–75 % emissions savings range from the three studies is significantly higher than the
‘default’ 31 % saving provided for in the RED for soy biodiesel.7
The main reason for this
difference is that the RED default value was calculated based on the fact that biodiesel is
typically produced in Europe from Brazilian soybeans. Argentine soybean biodiesel
production has three distinct characteristics compared with this benchmark, resulting in much
lower greenhouse gas emissions:
- Reduced local transport: in Argentina, distances between the main soy farming areas, the
main biodiesel plants and the main port export facilities are relatively short (250 km on
average).
- Lower biodiesel production emissions: most Argentine biodiesel plants have lower GHG
emissions from power generation compared with the value assumed in the RED.
- No-till farming: Argentine soybeans are typically cultivated using no-till techniques. No-till
involves planting seeds without turning over the soil, using specialist drilling equipment
capable of cutting through carbon-rich surface crop residues. No-till techniques, properly
applied under the climatic and soil conditions typical of Argentine soy cultivation areas, can
thus significantly reduce GHG emissions.
About Carbio
Carbio is the Argentine Biofuels Chamber, a non-profit Argentine association whose main
objective is the development and promotion of the production and commercialisation of
biofuels and the related industry, with the purpose of actively contributing to the economic
and sustainable growth of the country. Carbio’s mission is to generate and add sustainable
value to the economic sector of biofuels production in Argentina. The chamber is made up of
the largest biodiesel producer companies in Argentina.
The total production capacity of Carbio’s members exceeds 4 million tonnes per year of
biodiesel. To date they have invested more than USD 1billion in capital expenditure, and a
similar value in working capital. Carbio’s members account for 95 % of total Argentine
biodiesel production and 99 % of its exports.
Carbio Sustainability Certification Scheme
In view of the sustainable advantages of Argentine biodiesel and with the aim of complying
with the RED’s requirements (Articles 17 to 19 in particular), Carbio decided to develop its
own voluntary certification scheme.
The CSCS was developed to allow all members of Carbio to demonstrate the sustainability of
the soybean biodiesel they produce and compliance with the RED. It has been designed to
cover all the requirements laid down in the Directive and related communications.
Key features of the CSCS are:
- Land-use change: as of 1 January 2008, the CSCS does not allow non-agricultural land to
be converted to soybean production;
- GHG savings: these are calculated as the sum of default values from the RED (for
cultivation and transport) + actual processing value;
- Chain of custody: track and trace from farm to port, mass balance approach.
ISCC — Germany: 56 % (ISCC, 2009)
E4tech — UK: 57 % (E4Tech, 2008). 7 Directive 2009/28/EC, Annex V.

64
2. MATERIALS AND METHODS
Land-related criteria: ‘Go’ areas
To prove and certify feedstock origin, the CSCS follows the European Commission’s
communication on the practical implementation of the sustainability scheme, which states
that: ‘evidence of compliance with the land-related criteria could take many forms, including
aerial photographs, satellite images, maps, land register entries/databases (…) and site
surveys’(European Commission, 2010).
Evidence can be positive or negative. For example, compliance with the criterion on primary
forest could be shown by:
- an aerial photograph of the land, showing it to be planted with sugarcane (positive);
- or a map of all the primary forests in the region, showing the land to fall outside them
(negative)
‘The criteria refer to the status of the land in January 2008. But the use of earlier evidence is
not ruled out. For example, if it is shown that land was cropland a little earlier than 2008, e.g.
in 2005, this may be enough to show compliance with some or all of the land-related criteria’
(European Commission, 2010).
Even though the RED does not permit the conversion of certain areas after 1 January 2008
for the production of certified biofuel feedstock (such as high biodiversity areas, high carbon
stock areas, and high conservation value areas), the CSCS is stricter in relation to land than
the EU: no conversion whatsoever of non-agricultural areas into cropland (after January
2008) is permitted. If a particular area was used for agricultural production before this date, it
is considered a ‘Go’ area. By contrast, any land that was not used for agriculture before
January 2008 is considered a ‘No go’ area.
As mentioned above, the RED does not require feedstock for certified biodiesel to come only
from areas used for agricultural production before January 2008. The CSCS has chosen a
stricter and more targeted approach to certify feedstock origin. In this way, the CSCS
demonstrates that the production of biodiesel from soybean oil does not trigger changes in
land use.
Evidence of compliance with the land-related criterion required by the RED is ensured with
the help of maps showing the approved ‘Go’ Areas. These maps are based on aerial pictures,
satellites images, soil charts, land registry databases, and site surveys. On-site checks are
performed to verify the accuracy of these maps. The maps identify minimum administrative
regions such as districts, cuarteles, and pedanias, which are equivalent to or even smaller
than EU NUTS 3 (nomenclature of territorial units for statistics). Only areas that comply
with the requirements of the RED (and thus those of the CSCS) as regards land-related
criteria are defined as approved ‘Go’ areas.
Maps are prepared by INTA. The classification of land use is based on images captured by
the American Landsat 5 satellite using the Landsat Thematic Mapper. The spectral resolution
of this satellite consists of seven bands covering a range of the electromagnetic spectrum
from 0.45 µm (blue) to 2.35 µm (medium-infrared). Band 6 has a spatial resolution of 120 m
resampled to 30 m pixels.
This type of satellite enables very large areas to be examined and is particularly effective in
the classification of the vegetation and cultivation cover of areas exceeding 5 ha. In the case
of regions where mini-fields prevail, the information will need to be complemented with
higher-resolution images (Ikonos satellite or similar) (Carballo and Hilbert, 2010).
A satellite image is impossible to tamper with, both in terms of capture date and the data
recorded. The satellite imagery covering any part of the world is identified with a path and

65
row number (indicating the scanning line and capture order), coded prior to the launch of
each satellite.
For the classification of each satellite image, the crops present throughout an agricultural
season (presenting low or zero cloud cover within the selected period, before January 2008)
are considered, as is land planted for grazing or with evidence of extensive or intensive
livestock activity. The methodology used was developed by INTA (‘Forecast of Grain and
Oilseed Harvests in the Pampa Region’, INTA-JNG-INDEC-SAGPYA agreement, 1991–
1995, later used in the Technology Transfer Area of the INTA Institute of Climate and Water
for the surveillance of crops in Argentina and by the Mercosur countries in relation to the
Specific Project on External Agriculture, 2005–2009).
For the classification of each image (path and row) and date, Landsat Thematic Mapper
images are taken in three bands of the electromagnetic spectrum 3, 4 and 5 (red, near-
infrared, and medium-infrared) which, based on experience of agricultural land cover, have
proven to render the most information and make it possible to work with unsupervised
classifications with the highest degree of accuracy (indispensable when classifying historical
images in the absence of a ground survey).
Band 3 captures the spectral responses of the various types of land cover to the red portion of
sunlight received, enabling recognition of the chloroplast content of the different vegetation
coverage. The near-infrared band (4) permits the interpretation of the phytosanitary
conditions of the plant, and the medium-infrared band (5) enables the assessment of the
differences between various types of cover in terms of moisture content, which, in the case of
plants, is determined by their cellular structure. These three factors generate a certain spectral
signature for each cover which will vary throughout its phenological cycle and will be
possible to detect through a multi-spectral and multi-temporal classification.
The images will be geo-referenced to the UTM projection,8 band 21, taking as a basis for this
geo-referencing the images available in the Earth Science Data Interface (ESDI) of the
Global Land Cover Facility, which have excellent geospatial precision. The base images may
be downloaded from the webpage: http://glcfapp.umiacs.umd.edu:8080/esdi/index.jsp
The method of ‘the closest neighbour’ will be used to perform the process of
geo-referencing, as it is the only one that preserves the original values of the images to be
used in the image classification. ERDAS IMAGINE 8.4 software will be used for the
classification. The classification is carried out using the unsupervised classification method,
based on the ISODATA algorithm. The ‘Isolda clustering’ method uses the minimum
spectral distance formula to form clusters (spectral classes). The method starts with an
arbitrary average cluster or with the average of a set of existing spectral signatures (spectral
response pattern). Each time the process of cluster formation is repeated, the average is
modified. The new average is used in the subsequent interaction, and the procedure is
repeated until the number of requested interactions is reached (six or more), with a certain
convergence threshold.
The system starts the image classification process using a scene taken on one of the dates,
generating a number of pre-determined classes according to the diversity observed in the
image (20 to 30 classes). The original classification generates a file of statistics through
which the response curves of each of the classes may be plotted.
Each class is assigned to a certain type of land cover present in the classified scene. There are
‘pure’ classes (where all the pixels have been correctly assigned to one category) and others
which present pixels corresponding to more than one type of land cover.
8 Universal Transverse Mercator geographic coordinate system.

66
The classes which present confusion are reassigned to the corresponding category through
the utilisation of other dates and a model structure created using the ERDAS ‘Modeler’
programme module.
Using this model, other dates and bands deemed indispensable for assigning the pixels to the
various categories of land use in the best possible way are integrated into the original image
classification through a ‘conditional’ function which allows pixel reassignment.
The reassignment process consists of applying a series of conditions according to reflectance
values in the different electromagnetic spectrum bands which characterise a certain type of
cover (assignment through thresholds of spectral response). The digital value in just one of
the bands of any of the additional images used for the classification may be enough for the
pixels which had been assigned to the wrong class to be reassigned to the correct one.
These conditions are decided based on the contrast between a crop’s response to the sunlight
received at a certain phonological stage of its cycle (captured by instruments on board the
satellites) and the rest of the coverage which is observed in frequency histograms. For
instance, if a pixel that should belong to the ‘soybean’ class has been wrongly assigned, it
can be reassigned to the ‘soybean’ class on the basis of a digital value determined in one or
more bands on one or more dates. The opposite problem may be solved in the same way: a
pixel wrongly assigned to the ‘soybean’ class may be eliminated. Using the same
methodology, band quotients or other combinations which improve separation may be
analysed.
Once the final classification is obtained and if it is combined with ground survey
information, the results may be assessed using a confusion matrix.9
The classified image will
be incorporated into the geographical information system to be related to and intersected with
the administrative division layer being considered, thus enabling the generation of statistics
on the different areas of land use at the level of each administrative unit (Carballo, 2010).
Greenhouse gases calculation
Any batch of biomass or biodiesel under the CSCS must have GHG emissions calculated as
per Annex V to the RED and the related communications.10
GHG emissions savings must
meet the GHG savings requirements laid down in Article 17(2) of the RED. Exceptions –
such as the grandfather clause for biodiesels produced by installations that were in operation
on 23 January 200811
– are not allowed under this scheme.
The CSCS requires that the GHG emissions value be calculated as the sum of the factors of
the formula referred to in point 1 of part C of Annex V to the RED, whereas disaggregated
default values in part D of Annex V should be used for cultivation and for transport and
distribution (eec and etd, as defined in part C of that Annex) and actual values, calculated in
accordance with the methodology laid down in the RED, for the processing factor.
9 A confusion matrix is a numerical matrix that relates field data (taken in surveillance transects) to data
from the classification to determine the margin of error. 10 Communication from the European Commission on the Practical Implementation of the EU Biofuels
and Bioliquids Sustainability Scheme and on Counting Rules for Biofuels. 11
Article 17(2) of the RED.

67
The CSCS calculates GHG emissions from the production and use of biodiesel as:12
E = eec + el + ep + etd + eu — esca — eccs — eccr — eee
where E = total emissions from the use of the fuel;
eec = emissions from the extraction or cultivation of raw materials;
el = annualised emissions from carbon stock changes caused by land-use change;
ep = emissions from processing;
etd = emissions from transport and distribution;
eu = emissions from the fuel in use;
esca = emission saving from soil carbon accumulation via improved agricultural
management;
eccs = emission saving from carbon capture and geological storage;
eccr = emission saving from carbon capture and replacement; and
eee = emission saving from excess electricity from cogeneration.
Greenhouse gas emissions from fuels, E, are expressed in terms of grams of C02 equivalent
per MJ of fuel (gCO2eq/MJ.)
The CSCS uses the following figures to certify the total GHG emissions of soybean
biodiesel:
E = ∑ of figures below (in gCO2eq/MJ)
eec = 19 gCO2eq/MJ
el = 0 gCO2eq/MJ13
ep = to be calculated by each processing plant
etd = 13 gCO2eq/MJ (or actual value)
eu = 0 gCO2eq/MJ
esca = 0 gCO2eq/MJ
eccs = 0 gCO2eq/MJ
eccr = 0 gCO2eq/MJ
eee = 0 gCO2eq/MJ
The values for eec = emissions from the extraction or cultivation of raw materials = 19 gCO2eq/MJ;
and for
etd =emissions from transport and distribution = 13 gCO2eq/MJ;
are the disaggregated default GHG emissions as listed in part D of Annex V to the RED.
12
In accordance with Annex V to the RED. 13
Since RED-complaint soybean crops can only be produced in approved ‘Go’ areas where no land-use
change has occurred since 1 January 2008, el (annualised emissions from carbon stock changes caused by
land-use change) is equal to 0.

68
Calculating GHG emissions from processing (ep)
Each conversion unit (crushing facility, biodiesel refinery) has to calculate its own GHG
emissions from processing (ep). ep includes emissions from the processing itself; from waste
and leakages; and from the production of chemicals or products used in processing.
To calculate the GHG emissions from processing (ep), the following formula is used:
year
kgproductMain
year
COkgEm
year
COkgEm
year
COkgEm
year
COkgEm
ep
eqeqeqeq
effluentsinputspoweryelectricit
2222
Each term has to be calculated as follows:
kWh
kgCOE
year
kWhnConsumptioE
eq
gridtyelectricit fm
2
typefuel
fmkgl
kgCOE
year
kglE
eq
fuelpower ;
;2
inputs
fmkgl
kgCOE
year
kglE eq
inputinputs ;
;2
kWh
kgCOE
year
lEffluentsE eq
effluentseffluents fm
2
Where:
Em = GHG emissions
Ef = Emission factor
The GHG emissions are calculated per unit mass of main product (e.g. CO2 eq emissions
[kg] / soybean oil [kg]).
A priori estimations for Argentine soybased biodiesel GHG emissions are:
E(gCO2eq/MJ) = eec (default) + ep (actual) + etd (default)
12.5 (*)
From 44.5 to 50 gCO2eq/MJ E(gCO2eq/MJ) = 19 + ….. + 13 =
18 (*)
» 44.5 gCO2eq/MJ means 47 % savings of GHG emissions
» 50 gCO2eq/MJ means 40 % savings of GHG emissions
(*) These figures need to be measured for each plant. (E4tech estimation is 12.5 gCO2eq/MJ;
ISCC 13.2 gCO2eq/MJ; and JRC 18 gCO2eq/MJ)
Carbio calculates GHG emission savings from soybean biodiesel as:
SAVING = (EF - EB)/EF
where
EB
= total emissions from the soybean biodiesel; and
EF = 83.8 gCO2eq/MJ14
14
Point 19 of part C of Annex V to the RED.
69
Chain of custody
In the CSCS, the monitoring of the chain of custody is based on the records kept by the
scheme members. These records have to link each batch to a document proving its
sustainability.
Based on these records, the products (soybeans, soybean oil and soybean biodiesel) must be
able to be traced back and forth throughout the chain. At any given time it must be known
how and where they have been stored, transported and/or processed.
The tracing process is achieved using the mass balance approach. Members’ internal
documents, official documents (such as those for taxation purposes) and/or delivery orders
are used for verifying the tracing process. Records are kept throughout each stage of the
chain of custody.
Batches of approved origin products and products of non-approved origin (soybeans, soybean
oil and biodiesel) can be mixed within the internal process of a member. In the bookkeeping
system, information from batches of approved ‘Go’ areas and products of non-approved
origin must be kept separately.
3. CONCLUSIONS
The European market remains the most important export market for Argentine biodiesel. In
order to maintain this position, Argentine producers introduced their own voluntary
certification scheme, the Carbio Sustainability Certification Scheme (CSCS) in order to fully
comply with the RED requirements.
Argentina has a number of competitive advantages that ensure its agricultural production is
recognised as one of the most sustainable and efficient in the world.
Good agricultural practices such as no-till techniques; short distances from the production
areas to the ports, and large and highly efficient crushing and biodiesel plants mean that
Argentine biodiesel (made from locally produced soybeans) reduces GHG emissions by at
least 56 % as compared with fossil fuels. The CSCS is a reliable tool for proving biodiesel
sustainability and ensuring compliance with the RED.
4. REFERENCES
- Carballo S., Hilbert J.A., 2010, Methodology proposal for defining go areas of soybean
biodiesel production in Argentina, INTA BC-INF-03-11
http://www.inta.gov.ar/info/bioenergia/boletines/2011
- Carbio, 2010, Carbio Sustainability Certification Scheme (CSCS) for EU–RED
Compliance – Certification Scheme for Argentine Soybean Biodiesel. Camara Argentina de
Biocombustibles, Buenos Aires, Argentina. Dec. 2010
- European Union, Directive 2003/30/EC of the European Parliament and of the Council of
8 May 2003 on the promotion of the use of biofuels or other renewable fuels for transport
- European Union, Directive 2009/28/EC: Directive 2009/28/EC of the European
Parliament and of the Council of 23 April 2009 on the promotion of the use of energy from
renewable sources (RED)
- European Commission, 2010, Communication from the Commission on the Practical
Implementation of the EU Biofuels and Bioliquids Sustainability Scheme and on Counting
Rules for Biofuels, Official Journal of the European Union, 2010/C 160/02, 19.6.2010
- E4tech, 2009, Assessment of greenhouse gas savings from soya biodiesel using the
Renewable Energy Directive. E4tech, London, UK

70
- Hilbert, J.A., Donato L.B., Muzio J. and Huerga. I., 2009, Comparative Analysis of
Energetic Consumption and Greenhouse Gas Emissions from the Production of Biodiesel
from Soy under Conventional and No Till Farming Systems. INTA BC-INF-15-10
http://www.inta.gov.ar/info/bioenergia/boletines/2010
- ISCC, International Sustainability & Carbon Certification, 2009, Pilot Project, Certification
of Biomass and Bioenergy Calculation of GHG Emissions. Additional calculations for the
process of overseas distribution for the Argentinian biodiesel production – Meó Corporate
Development GmbH and German Biomass Research Centre GmbH
- Van Erck R., 2010, EU biofuels policy, 5th International Conference of the RTRS. São
Paulo, Brazil, 9 June 2010.
71
Practical indicators on extensive agricultural production
F.C. Frank
Instituto Nacional de Tecnología Agropecuaria,
Estación Experimental “Ing. Agr. Guillermo Covas”
Universidad Nacional de La Pampa, Facultad de Ciencias Exactas y Naturales
Ruta 5 km 580 (6326) Anguil, La Pampa, Argentina
Summary
Agriculture expanded worldwide at the expense of natural forests and rangelands. In
Argentina, it also expanded during the last 50 years from the Pampas to the North West of
the country. In parallel, productivity was boosted through the increasing application of
external inputs, modern technology and management practices. This situation raised several
concerns about the impacts of agriculture on the ecosystems. A valid way to assess these
impacts is the use of agro-ecological indicators. The AgroEcoIndex® model is a set of 18
indicators, covering several critical aspects in agro-ecosystems (energy, nutrients, pollution,
water and biodiversity). In this paper, the model is presented and briefly explained, and some
examples of its use are shown. In comparison with international figures, the impacts of
agriculture in Argentina (e.g. soil erosion, nutrient balance, energy use) have been less
significant than those recorded in most intensive-farming countries. Argentinian farmers
have developed the capacity to produce under relatively low-input/low-impact schemes, but
this may change in the near future if the global food demand drives additional expansion and
intensification.
Keywords: Pampas Region, Argentina, AgroEcoIndex model, agricultural expansion,
intensification
1. INTRODUCTION
From nearly 10,000 years ago until around 1950, the increases in global food production
came almost exclusively from the expansion of agriculture over natural areas (Stewart and
Robinson, 1997). This expansion has been carried out at the expense of other lands, mainly
forests and grasslands. Since then, as a more intensive model of agriculture expanded across
industrialized countries, most of the surpluses corresponded to increases in productivity. The
so-called Green Revolution has been both credited and severely criticized. (Rodrigues et al.,
2003). In any case, the environmental impact of these changes became a source of
controversy (Tilman et al., 2002; Ewers et al., 2009). Meanwhile, low-input, rotational cattle-
crop production schemes prevailed in the Argentine Pampas (Solbrig, 1997). Until the early
1980s, production in the Pampas increased through expansion on natural lands. Once this
possibility was exhausted, additional increases were achieved through more intensive use of
external inputs, technology and management (Viglizzo et al., 2001). The production model of
the Pampas later expanded over other regions dominated by natural (mostly woody)
vegetation in the north of Argentina (Carreño and Viglizzo, 2007).
In the last 50 years, a significant increase in annual crops (around 60%) occurred in the
whole agricultural region of Argentina. The boundaries of cultivation did not extend

72
homogenously throughout the country (Figure 1), with a rapid expansion towards the North
West, a stable situation in the West and a retraction in the Flooding Pampas (Viglizzo et al.,
2011). On the other hand, due to recent migration of cattle from the Pampas and Espinal
(Rearte, 2007; SENASA, 2008), pastures showed a persistent increase in the Chaco, Atlantic
Forest and Iberá wetlands. The natural forests suffered a significant reduction during this
period, and only in Espinal a slight increase of the woody area has been noticed (Dussart et
al., 1998).
Figure 1: Dynamics of the agricultural border in Argentina (Viglizzo et al., 2011).
From the point of view of the Strategic Area of Environmental Management in INTA
(Zaccagnini, 2011), the greatest impacts of agriculture on the environment are usually carried
out over i) the energy fluxes (e.g. more consumption of fossil fuels), ii) the nutrient cycles
(e.g. soil nutrients losses or, on the other hand, pollution due to excess of N), iii) degradation
and pollution (soil erosion, pesticide contamination, greenhouse gases emission), iv) changes
in water use and its efficiency, and v) habitat and biodiversity losses.
2. THE AGROECOINDEX® MODEL
In order to assess the extent and severity of these impacts, it is crucial to establish the
consequences of human activities on the ecosystems, and a way to do so is to use agro-
ecological indicators. An agro-ecological indicator is a tool (that can be a number or an
equation) we can use, first, to simplify the analysis of an agricultural system, and then, to
diagnose and interpret the relevant processes. This can help us to improve decision making
and, finally, to give transparency and certify the quality of the environmental management in
agricultural enterprises.
In order to be sound, and to be of any use to a range of potential users (from farmers to
broad-scale decision makers), an indicator must have some attributes (Pieri et al. 1996;
Girardin et al., 1999; Huffman et al., 2000) including:
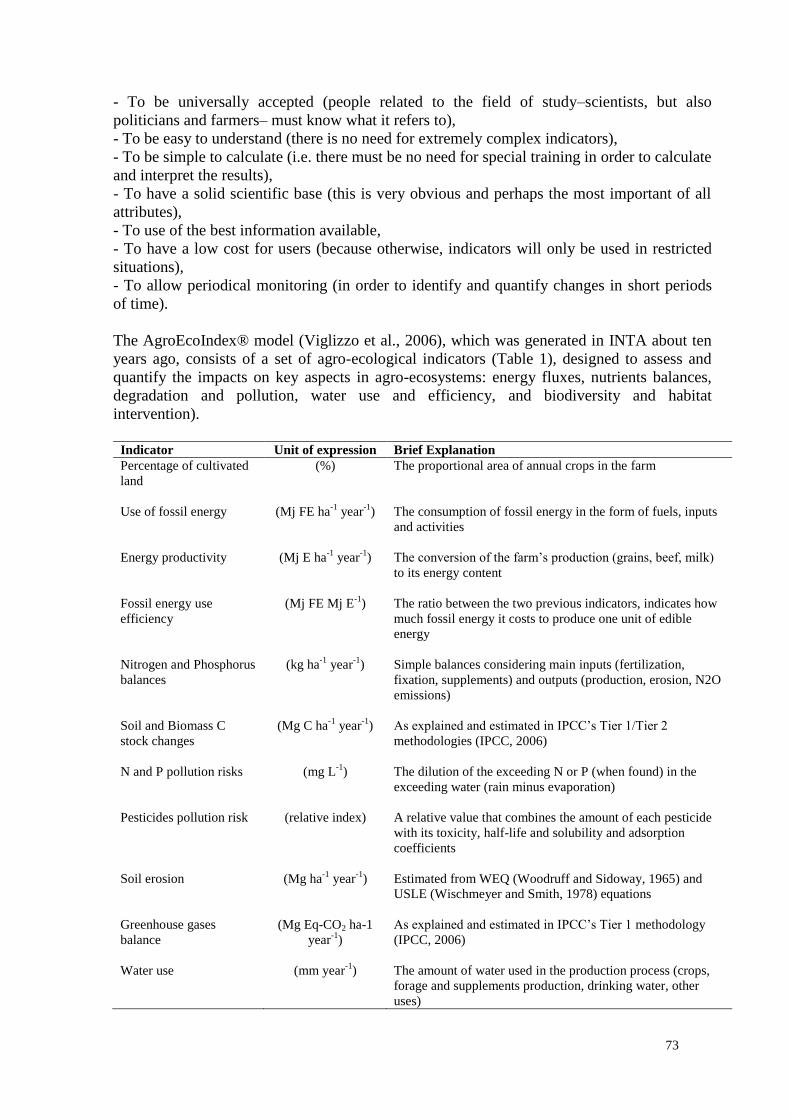
73
- To be universally accepted (people related to the field of study–scientists, but also
politicians and farmers– must know what it refers to),
- To be easy to understand (there is no need for extremely complex indicators),
- To be simple to calculate (i.e. there must be no need for special training in order to calculate
and interpret the results),
- To have a solid scientific base (this is very obvious and perhaps the most important of all
attributes),
- To use of the best information available,
- To have a low cost for users (because otherwise, indicators will only be used in restricted
situations),
- To allow periodical monitoring (in order to identify and quantify changes in short periods
of time).
The AgroEcoIndex® model (Viglizzo et al., 2006), which was generated in INTA about ten
years ago, consists of a set of agro-ecological indicators (Table 1), designed to assess and
quantify the impacts on key aspects in agro-ecosystems: energy fluxes, nutrients balances,
degradation and pollution, water use and efficiency, and biodiversity and habitat
intervention).
Indicator Unit of expression Brief Explanation
Percentage of cultivated
land
(%) The proportional area of annual crops in the farm
Use of fossil energy
(Mj FE ha-1
year-1
) The consumption of fossil energy in the form of fuels, inputs
and activities
Energy productivity
(Mj E ha-1
year-1
) The conversion of the farm’s production (grains, beef, milk)
to its energy content
Fossil energy use
efficiency
(Mj FE Mj E-1
) The ratio between the two previous indicators, indicates how
much fossil energy it costs to produce one unit of edible
energy
Nitrogen and Phosphorus
balances
(kg ha-1
year-1
) Simple balances considering main inputs (fertilization,
fixation, supplements) and outputs (production, erosion, N2O
emissions)
Soil and Biomass C
stock changes
(Mg C ha-1
year-1
) As explained and estimated in IPCC’s Tier 1/Tier 2
methodologies (IPCC, 2006)
N and P pollution risks
(mg L-1
) The dilution of the exceeding N or P (when found) in the
exceeding water (rain minus evaporation)
Pesticides pollution risk
(relative index) A relative value that combines the amount of each pesticide
with its toxicity, half-life and solubility and adsorption
coefficients
Soil erosion
(Mg ha-1
year-1
) Estimated from WEQ (Woodruff and Sidoway, 1965) and
USLE (Wischmeyer and Smith, 1978) equations
Greenhouse gases
balance
(Mg Eq-CO2 ha-1
year-1
)
As explained and estimated in IPCC’s Tier 1 methodology
(IPCC, 2006)
Water use
(mm year-1
)
The amount of water used in the production process (crops,
forage and supplements production, drinking water, other
uses)
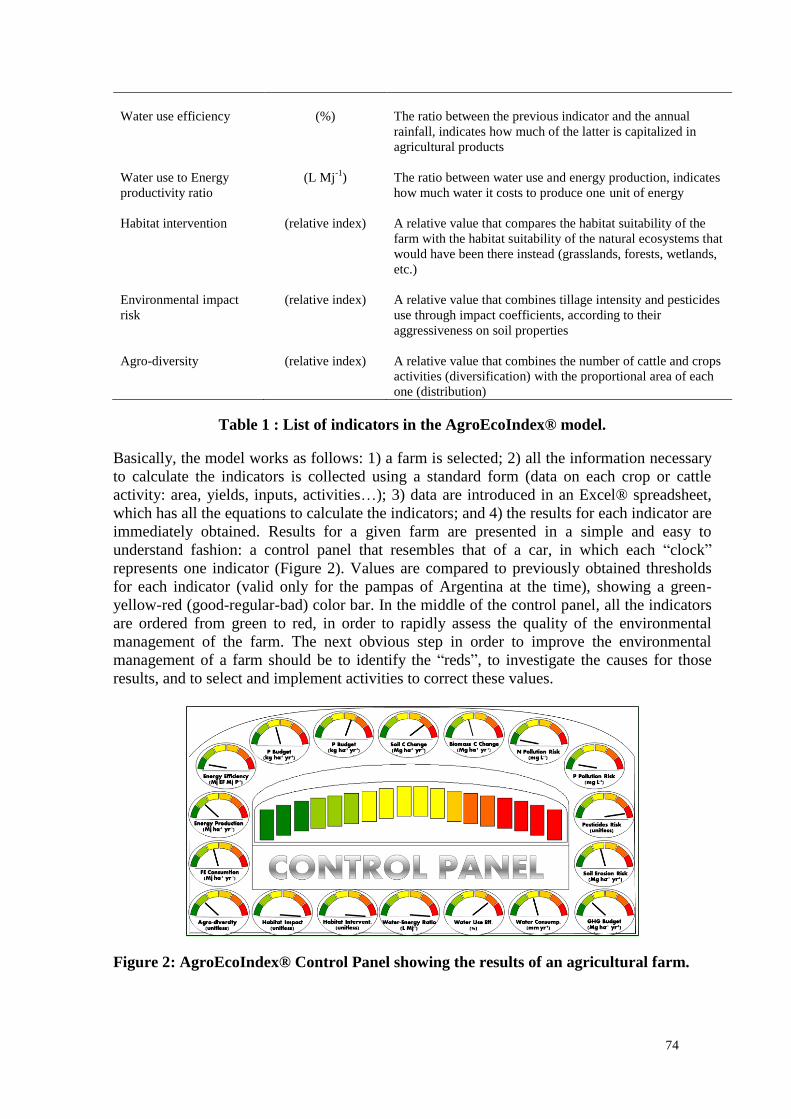
74
Water use efficiency
(%) The ratio between the previous indicator and the annual
rainfall, indicates how much of the latter is capitalized in
agricultural products
Water use to Energy
productivity ratio
(L Mj-1
) The ratio between water use and energy production, indicates
how much water it costs to produce one unit of energy
Habitat intervention
(relative index) A relative value that compares the habitat suitability of the
farm with the habitat suitability of the natural ecosystems that
would have been there instead (grasslands, forests, wetlands,
etc.)
Environmental impact
risk
(relative index) A relative value that combines tillage intensity and pesticides
use through impact coefficients, according to their
aggressiveness on soil properties
Agro-diversity (relative index) A relative value that combines the number of cattle and crops
activities (diversification) with the proportional area of each
one (distribution)
Table 1 : List of indicators in the AgroEcoIndex® model.
Basically, the model works as follows: 1) a farm is selected; 2) all the information necessary
to calculate the indicators is collected using a standard form (data on each crop or cattle
activity: area, yields, inputs, activities…); 3) data are introduced in an Excel® spreadsheet,
which has all the equations to calculate the indicators; and 4) the results for each indicator are
immediately obtained. Results for a given farm are presented in a simple and easy to
understand fashion: a control panel that resembles that of a car, in which each “clock”
represents one indicator (Figure 2). Values are compared to previously obtained thresholds
for each indicator (valid only for the pampas of Argentina at the time), showing a green-
yellow-red (good-regular-bad) color bar. In the middle of the control panel, all the indicators
are ordered from green to red, in order to rapidly assess the quality of the environmental
management of the farm. The next obvious step in order to improve the environmental
management of a farm should be to identify the “reds”, to investigate the causes for those
results, and to select and implement activities to correct these values.
Figure 2: AgroEcoIndex® Control Panel showing the results of an agricultural farm.

75
3. USE OF THE AGROECOINDEX® MODEL – SOME EXAMPLES
At a given farm, the AgroEcoIndex® model can be used to simulate possible changes in
future times, such as different crop rotations, different levels of inputs use, and estimate the
response of the indicators. It can also be used to compare among different farms, in order to
discriminate those paying more attention to their environmental management from those who
do not care as much. For example, this can be done by a bank or governmental institution in
order to distribute loans, or to select “green” suppliers, thus, giving them a strategic
advantage.
At a different scale of application, results obtained using the model provide more information
than the mere identification and quantification of “greens” and “reds” for each evaluated
farm. In an extensive survey conducted on 2002/03, 200 agricultural enterprises were
analyzed (Frank, 2007). These farms ranged from 100 to 10.000 ha, and from optimal to very
restricted growing conditions. They also represented different systems of production: 100%
croplands, mixed cattle-crop systems, exclusively cattle systems and dairies (Figure 3).
Figure 3: Approximate location of the 200 farms surveyed in 2002/03
in the Pampas Region (Frank, 2007).
By putting these 200 farms in an XY graph using the percentage of annual crops as
independent variable, it is possible to assess the impact of crop expansion on the rest of the
indicators. In the case of P balance in the Pampas (Figure 4), a clear negative relationship
was found (this is due to more extraction, not always counterbalanced with fertilization).
However, when the farms were separated according to the agro-ecological areas, different
behaviours could be found (i.e. is not the same to increase cultivation in Rolling than in
Flooding pampas). Moreover, cultivation was not the only factor determining P balance,
different systems of production (crops, mixed, cattle and dairies) also showed different
values of P balance, regardless of their percentage of annual crops (Frank, 2007).
Indicators can also be used to assess the impact of a given technology. In Figure 5, the same
farms from Frank (2007) were divided in two groups, those which used no-tillage (direct
seeding) and those which used conventional tillage. Even when the farms come from
different regions, and regardless of the system of production, significant differences could be
appreciated in the behavior of a) N balance and b) Pesticides pollution risk.

76
Figure 4: Phosphorus balance in 200 farms in the Pampas Region using AgroEcoIndex®
model. a) all farms together; b) grouped by agro-ecological area and
c) grouped by system of production (Frank, 2007).
Figure 5: N balance and Pesticides pollution risk in 200 farms (Frank, 2007).
Farms were separated into No-tillage (SD, green dots) and Conventional tillage (LC,
orange dots).
These analyses can also be carried out at broader temporal and spatial scales, using statistical
data instead of farm surveys. In another study, indicators were analyzed in three contrasting
time periods from 1960 to 2005 (Viglizzo et al., 2011). For example, erosion risk showed a
dramatic decrease in response to the expansion of no-till agriculture in the last two periods of
that study (Figure 6). However, pesticides contamination risk also decreased, not because of
less usage of pesticides, but because of lower toxicity (as organo-chlorinated products were
replaced by phosphorated products and, later, by hypermetrines).
Balance de P
(Kg ha-1
año-1
)
y = -0,1545x + 5,1559
R2 = 0,238
-20
-15
-10
-5
0
5
10
15
20
0 20 40 60 80 100
Porcentaje de cultivos anuales
Balance de P
(Kg ha-1
año-1
)
-20
-15
-10
-5
0
5
10
15
20
Agricolas Mixtos Ganaderos Tambos
Tipo predominante de producción
Balance de P
(Kg ha-1
año-1
)
Austral = -0,0889x + 3,2153
R2 = 0,0655
Deprimida = 0,0681x + 1,5203
R2 = 0,0553
Ondulada = -0,2712x + 12,5
R2 = 0,4981
Semiárida = 0,0224x - 3,7217
R2 = 0,0246
Subhúmeda = -0,2309x + 3,5354
R2 = 0,5219-20
-15
-10
-5
0
5
10
15
20
0 20 40 60 80 100
Porcentaje de cultivos anuales
LC = -0,0076x2 + 0,3765x + 18,369
R2 = 0,2243
SD = -0,0141x2 + 0,4731x + 67,746
R2 = 0,4798
-90
-60
-30
0
30
60
90
120
150
180
0 20 40 60 80 100
LC = 0,0017x2 - 0,0045x + 9,5446
R2 = 0,0248
SD = 0,0061x2 - 0,2988x + 36,909
R2 = 0,0637
0
40
80
120
160
200
0 20 40 60 80 100

77
Figure 6: Relationships between a) pesticide contamination risk, b) soil erosion and
cultivation intensity (%) for three studied periods (Viglizzo et al., 2011).
In comparison with other countries, Argentina has shown relatively smaller environmental
impacts associated to agricultural expansion and intensification (Frank, 2007; 2014; Frank
and Viglizzo, 2012; Viglizzo et al., 2011). For example, through the use of the
AgroEcoIndex® model, Viglizzo and Frank (2014) showed that Greenhouse Gasses
Emission in annual crops were relatively lower in Argentina than in Canada, USA, Italy,
China, Japan, New Zealand, and Western European countries (Figure 7).
Figure 7: Comparison of GHG emissions in main crop systems in Argentina
(grey diamonds) and other countries (black lines and error bars).
Source: Viglizzo and Frank (2014).
0.0
0.5
1 .0
1 .5
2 .0
2 .5
3 .0
3 .5
4 .0
4 .5
5 .0
Win ter Su m m er Rota t ion s
GH
G E
mis
sio
ns
(Mg
CO
2-e
q h
a-1
yea
r-1
)

78
4. CONCLUDING REMARKS
The results of several studies showed that the AgroEcoIndex® model is a sound way to
assess the environmental impacts of agricultural expansion and intensification. Compared
with international figures, most of these impacts have been less significant in Argentina than
those recorded in several other countries. Apparently, farmers in Argentina developed the
capacity to produce under relatively low-input/low-impact schemes during the last decades.
This, however, may change in the near future if the global food demand drives additional
expansion and intensification. Although the model and the information used have analytical
limitations, the results provide information that, if sensibly used, can potentially be helpful to
orientate land-use policies and agricultural strategies.
5. REFERENCES
- Carreño L., Viglizzo E.F., 2007, Provisión de Servicios Ecológicos y Gestión de los
Ambientes Rurales en Argentina. Ediciones INTA. Buenos Aires.
- Dussart E., Lerner P., Peinetti R., 1998, Long term dynamics of two populations of
Prosopis caldenia Burkart. Journal of Range Management 51: 685-691.
- Ewers R.M., Scharlemann J.P.W., Balmford A., 2009, Do increases in agricultural yield
spare land for nature ? Global Change Biology 15:1716-1726.
- Frank F., 2007, Impacto agroecológico del uso de la tierra a diferentes escalas en la
región pampeana de Argentina. Magister Scientiae Thesis. Balcarce, Buenos Aires.
- Frank F., 2007, Flujos de agua y energía en 42 años de agricultura en Argentina. Doctor
of Sciences Thesis. Balcarce, Buenos Aires, Argentina.
- Frank F., Viglizzo E., 2012, Water use in rain-fed farming at different scales in the
Pampas of Argentina. Agricultural Systems 109:35–42.
- Girardin P., Bockstaller C., Van der Werf H., 1999, Indicators: Tools to evaluate the
environmental impacts of farming systems. Journal of Sustainable Agriculture 13:5–21.
- Huffman E., Eilers R., Padbury G., Wall G., MacDonald K., 2000, Canadian agri-
environmental indicators related to land quality: integrating census and biophysical data to
estimate soil cover, wind erosion and soil salinity. Agriculture, Ecosystems & Environment
81:113–123.
- IPCC, 2006, Revised 2006 IPCC Guidelines for National Greenhouse Gas Inventories.
Reference Manual, Prepared by the National Greenhouse Gas Inventories Programme, (Eds
Eggleston HS, Buendia L, Miwa K, Ngara T and Tanabe K). IGES, Japan.
http://www.ipcc-nggip.iges.or.jp/
- Pieri C., Dumanski J., Hamblin A., Young A., 1996, Land quality indicators. World Bank
Discussion Papers 315.
- Rearte D., 2007, Situación Actual de la Producción de Carne Vacuna, Documento
SAGPyA/INTA, http://www.sagpya.mecon.gov.ar/
- SENASA, 2008, Movimiento de Hacienda 2007, Informe Estadístico Nº 2. Servicio
Nacional de Sanidad Agropecuaria de la República Argentina,
http://www.sagpya.mecon.gov.ar/
- Solbrig O.T., 1997, Ubicación histórica: Desarrollo y problemas de la pampa húmeda. In:
Argentina Granero del Mundo? Hasta Cuándo? (eds. Morello J, Solbrig OT), pp. 29-40.
Orientación Gráfica Editora, Buenos Aires.
- Stewart B., Robinson C., 1997, Are agroecosystems sustainable in semiarid regions ?
Advances in Agronomy 60:191– 228.

79
- Stachetti Rodrigues G., Campanhola C., Choji Kitamura P., 2003, An environmental
impact assessment system for agricultural R&D. Environmental Impact Assessment 23:219–
244.
- Tilman D., Cassman K., Matson P., Taylor R., Polasky S., 2002, Agricultural
sustainability and intensive production practices. Nature 418:671–677.
- Viglizzo E., Frank F., 2006, Energy use in agriculture: Argentina compared with other
countries. In: S Reiter (Ed.) Energy Consumption: impacts of human activity, current and
future challenges, environmental and socio-economic effects. NOVA Science Publishers,
New York, pp 77-97.
- Viglizzo E., Frank F., Bernardos J., Buschiazzo D., Cabo S., 2006, A rapid method for
assessing the environmental performance of commercial farms in the pampas of Argentina.
Environmental Monitoring and Assessment 117:109–134.
- Viglizzo E.F., Frank F., Carreño L., Jobbágy E., Pereyra H., Clatt J., Pincén D.,
Ricard F., 2011, Ecological and environmental footprint of 50 years of agricultural
expansion in Argentina. Global Change Biology 17: 959–973.
- Viglizzo E.F., Lértora F.A., Pordomingo A.J., Bernardos J., Roberto Z.E., Del Valle H.,
2001, Ecological lessons and applications from one century of low external-input farming in
the pampas of Argentina. Agriculture, Ecosystems & Environment 81: 65-81.
- Wischmeyer W., Smith D., 1978, Predicting rainfall erosion losses. A guide to
conservation planning. U.S. Department of Agriculture. Agriculture Handbook Nº 537.
Washinton DC, Estados Unidos.
- Woodruff N., Siddoway F., 1965, A wind erosion equation. Soil Science Society of
America Journal 29:602–608.
- Zaccagnini M.E., 2011, Visión Estratégica del Área de Gestión Ambiental de INTA.
http://www.inta.gov.ar/invest/doc/gambiental.pdf
Aknowledgement
The research activities related to the AgroEcoIndex® model were part of INTA National
Projects AEGA-223012 (2009-2012) and PNNAT-1128052 (2012-present).

81
IDENTIFICATION OF BIOMASS SUSTAINABILITY
CERTIFICATION SCHEMES IN ARGENTINA,
CHALLENGES FOR MARKET ACCESS
S.Galligani 1, J.Hilbert
2, C.Chiavirini
3,
1 Imperial College London
2 INTA Instituto de Ingeniería Rural, Centro de Investigaciones Agroindustria
INTA c.c. 25 (1712) Castelar, Argentina 3 Peterson Control Union Argentina
Urquiza 556, 1 - San Lorenzo – Santa Fe - Argentina
Summary
The main objective of this paper is to identify the biomass sustainability certification schemes
required by global markets and their respective strengths and weaknesses in regard to
Argentina. This paper provides a technical contribution that would allow to better characterize
the productive sector with the aim of helping the country to adapt to the new demands of
international markets. This paper highlights the current requirements for the certification of
the sustainability of biofuels, along with the core "historical" drivers of sustainability and
their links with EU anti-dumping procedures.
1. INTRODUCTION
Food and in particular agriculture are one of the markets most controlled and regulated at
worldwide level and all countries are concerned about possible negative impacts of measures
on food security. Depending on how the production is developed, bioenergy will contribute
(or not) to food security, poverty reduction or climate change mitigation.
Presently, an evolution of paradigms sometimes questioned the production of 1st generation
biofuels from food crops by-products and this resulted in a limitation of 1st generation
biofuels. Nevertheless, it is important to take into account that these 1st generation biofuels
have considerable advantages over the so-called second-generation biofuels, such as:
- Provision of significant quantities of high quality food for humans or animals,
- Flexibility to stop the transformation into biofuels and devote the entire biomass to food
under changes in trade rules, legislation, pests, diseases or disorders that affect climate food
production,
- Technical development with strong scientific basis as well as practices and agricultural
machinery highly developed.
- Exploitation of all the logistics chain and transformation.
Biofuels have penetrated the world markets thanks to various instruments of promotion such
as mandatory blending, tax benefits and subsidies. A large part of these measures were based
on promoting an alternative energy source to reduce the negative impacts of fossil fuels. The
administrations seek to ensure that these premises are met by requiring an analysis and entry

82
restrictions for biofuels that do not comply with given criteria. These institution rely on
institutes and research groups in the search for suitable tools that give background and
scientific approach to the sustainability regulations.
This growing concern about biofuel sustainability has led to scientific institutions, academia,
as well as to certain governments and institutions to work intensively on these matters. Given
the significant participation of Argentina as the world's leading exporter of biodiesel, its
evolution is analyzed carefully as well as other possible sources of biomass.
The current reality is that there are still many doubts and unresolved problems in the scientific
field. Nevertheless, regulatory measures are moving forward and measures are being taken to
correct possible errors in the absence of solid answers.
If the volumes of resources and the corresponding bioenergy production areas are analysed
and compared, the impact of bioenergy is low even if it can be important in some specific
areas. The situations are different depending on the region and the country concerned. For
example, the European Union based the development of its bioenergy using agricultural
products benefiting from public support. On the other end, many African countries have a
traditional agriculture with low yields and high losses. In this situation, the acreage dedicated
to the production of biomass for bioenergy production could damage food security.
In the case of Argentina, given its level of agricultural development, its capacity to feed more
than 300 million people, as well as the wide availability of land in medium term, there are no
foreseeable conflicts of interest for the use of crops and residues.
2. BIOMASS SUSTAINABILITY CERTIFICATION
This paper addresses the new demands of the market in terms of certification of the
agriculture sustainability. The market has seen certification as a type of private governance
and a first step to coordinate sustainable agriculture. The situation is presently fragmented
between conventional and certified production. (Aapresid, 2013)
To address the subject in greater depth, it is first necessary to provide an overview about the
steps to be followed for sustainability certification.
When companies have to demonstrate their quality standards, they need an organism with the
credibility to ensure that their products or processes meet the expected quality requirements.
This is precisely the aim of the certifications schemes that have spread so widely in the
business world. In general terms, to certify is to issue a document attesting that a product,
person or company conforms to a set of certain technical standards. (González, 2004).
However, emphasis should be not only on the need for certification as a commercial
opportunity but as a response to the need to respond to a scenario that requires both
environmental sustainability with the commercial objectives (Darts, 2008)
According to Hilbert (2008), certification has direct benefits for the agricultural entrepreneur,
both in technical management and business development. On the one hand, certification
involves the use of records and ranked information. Together with the survey of the quality
indicators, this adds value to the agronomic management, making it more reliable, accurate
and professional. On the other hand, as certification is based on principles and general
standards with local adaptation, the certificate allows a differentiation of the processes.
In this context, standards bodies and management protocols emerge. Good Agricultural
Practices (GAP’s) are starting to be implemented. They consist in applying the knowledge
available to the sustainable use of basic natural resources for the production of agricultural
products.
On the other hand, international quality requirements, in many cases can be translated as tariff
barriers to trade, especially to the extent that is advanced in the specialization, differentiation
and added value, thus GAP’s are the "first link" in the path of the quality (FAO, 2004).

83
Existing certification schemes aim essentially to the certification of a product linked to a crop
or specific feedstock. This a limitation in the sense that they do not consider farming systems
that have particular characteristics linked to the rotation of crops or the interaction with
specific soil and climate factors for each region.
Many results are also based on static and specific determinations and do not take into
consideration the annual variations. The results achieved after three years of monitoring plants
and co-products used for biofuels indicate the importance of a historical study. Variations in
sensitive values such as crop yields can significantly alter the results (Hilbert 2014).
2.1 State of the art regarding Sustainable Agriculture in Argentina
Argentina has an important and sophisticated network of institutions involved in agriculture
and agribusiness. This network includes for example INTA (Instituto Nacional de Tecnología
Agropecuaria), AACREA (Asociación Argentina de Consorcios Regionales de
Experimentación Agrícola), PROSOJA y AAPRESID (Asociación Argentina de Productores
en Siembra Directa), that focuses in primary production. INTI (Instituto Nacional de
Tecnología Industrial), ACSOJA (Asociación de la Cadena de la Soja de Argentina),
ASAGA (Asociación Argentina de Grasas y Aceites) y CARBIO (Cámara Argentina de
Biocombustibles) are more oriented towards industry and agribusiness. (Jorge Hilbert 2012a).
There has been a growing awareness regarding sustainability from the public side (municipal,
provincial and Federal Governments levels) and private sector. The development of this trend
has been institutionalized with specific tools to address this issue (IARSE) (Diaz-Chavez
2011; Jorge Hilbert 2012a). Important advances have been reflected in concrete actions such
as good agricultural and agro-industrial practices, certified agriculture (AAPRESID),
predictors of environmental sustainability (CREA), biofuels certification schemes or
initiatives from CARBIO, Global Bioenergy Partnership (GBEP) and the Roundtable on
Sustainable Biofuels (RSB), among others, and regulatory advances allowing a better land
use management.
Sustainable production and use of crops should be considered from a national interest point of
view for present and future generations. An agro-industrial framework based on sustainable
development should therefore be promoted. The most challenging part is probably the
integration of the economic, social and environmental aspects taking into account various
stakeholders in order to generate policies promoting a sustainable management.
2.2 National initiatives on sustainability
Argentina is a Member, among other initiatives, of GBEP (Global Bioenergy Partnership). At
the beginning of 2010, Argentina joined the Global Alliance of research on agricultural
greenhouse gases. This Alliance was established in order to increase, with international
cooperation:
- the investment in the sector and to contribute to the reduction of the intensity of emissions
coming from the agricultural production,
- the potential for soil carbon sequestration; (Joseph, 2012)
These efforts, together with the demands of the market, have helped the biodiesel sector to
fight for energy efficiency and a sustainable production chain. The Argentine biofuels
industry has also elaborated its own Sustainability Certification Scheme. (CARBIO, 2010),
several times not accepted under EU RED.

84
The Law Number 26.331 (Minimum Budgets of Native Forests) was approved at the end of
2007. It is an important step about the use of land through the creation of a participative
territorial code. It is structured on the basis of two central measures aiming to:
- immediate stop of the deforestation,
- preparation of an environmental territorial code of land use categories (including the native
forests) for each province.
Its objective is to achieve the conservation, sustainable use of forests and payment for
environmental services to the local community.
Therefore, the code should reflect the different conservation categories I (red), II (yellow) and
III (green) reflecting the environmental value of the native forest and the environmental
services units. In February 2009, the national authorities issued the Decree No. 91/2009 for
the implementation of the Law about the native forest. Unfortunately, this Decree does not fit
to the finances of the National Fund for the enrichment and preservation of native forests,
whose purpose is to contract for the payment of environmental services (Di Paola, 2012). This
point is thus the cause of concerns regarding the application of the Law Number 26.331.
Argentine environmental planning process (Environmental Land Use) is an instrument of
national environmental policy and environmental management established in the
Environment's General Law Number 25.675 in 2002. This corresponds to a set of technical,
political and administrative actions, including studies, proposals for the organization of a
given territory and its adaptation to the effects of policies and development objectives,
including the Law on native forest.
The rights and duties associated to the land ownership are determined at local level, in
accordance with the general interest. This requires a strong participation of the citizens and
stakeholders. It includes both aquatic and terrestrial territories that should also be the subject
of strategic planning. Unfortunately, while the Law number 25.675 was approved a decade
ago, it has yet to be implemented. (Di Paola, 2012)
Currently there are two major challenges about the Law on native forest. The first is to obtain
the correct allocation and distribution of financial resources to support its implementation and
to achieve a substantial, transparent and consolidated payment for the environmental services
provided by forests. Secondly, Argentina envisages the development of intersectorial and
participatory environmental planning at the national level. Twelve provinces have completed
their forest management plans and are therefore able to claim the payment for the
environmental services, through the Secretariat of Environment and Sustainable Development
(INTA, 2011)
2.3 Biomass Sustainability Certification in Argentina
To date, there are several international programs for biomass certification, based on the
products final destination and target market. These programs can be based on public
requirements (such as the ones from the 2009 European Union Directive on Renewable
Energy) or private requirements (such as the Unilever Code of Sustainable Agriculture, the
AAPRESID Program of certified agriculture, the Cefetra Responsible Soy Programme or
Phillip Morris Agricultural Labour Practices).
For biomass producers the main drivers for sustainability certification include:
- Prices,
- Access to markets,
- Increase in the market share,
- Technical advice,
- Personal commitment.

85
The Argentine biodiesel industry, including the soybean supply chain, is extremely
competitive and sustainable due to a number of factors:
- Large scale of the production,
- Updated level of the technology used,
- High level of integration level (normally biodiesel plants are in the same cluster as the oil
plants),
- Massive use of no-tillage and biotechnology,
- Proximity between the area of soybean production and the industrial cluster of Gran Rosario.
In Argentina, sustainability certification has been closely linked to the production and sale of
biodiesel recognized as sustainable under the EU Renewable Energy Directive (EU RED,
28/2009). The European blending opened up an attractive biodiesel export market. As a result,
there has been in Argentina a continuous investment in refineries, even small and medium-
sized, for the production of biodiesel.
From the 27 of November 2013, the EU imposed anti-dumping duties on imports from
Argentinean biodiesel. Anti-dumping measures are (since they remain in effect) an additional
duty of 24.6%. It corresponds to a rate that varies between 22 and 25.7% between 216 and
245 Euros per tonne). This measure is currently under dispute at WTO level (WTO, 2014).
Apart from antidumping, there are other EU related issues Argentina has to deal with in the
field of biofuels, e.g. the EU amended Directive 98/70/EC on the quality of petroleum and
diesel fuels and the amended Directive 2009/28/EC on the promotion of the use of energy
from renewable energy sources. These measures were enacted to reduce the use of biofuels
from food crops, allegedly because of indirect land use change and life cycle GHG emissions.
These actions had an adverse effect on the Argentinean biodiesel industry. At the same time,
the EU actions do not seem to consider the soybean meal that is imported (biodiesel being its
co-product). In addition to the EU obstacles, the Spanish Government in December 2013
excluded Argentine biodiesel plants from the sales to this country. As a result of these
measures, the production of biodiesel fell in Argentina, the sustainable biodiesel production
being affected in the first place.
According to an article published by J.Calzada from the Commerce Chamber of Rosario,
Argentina has lost the first place as a biodiesel producer (Calzada, 2014). Up to 2012, the
biodiesel industry in Argentina ranked first at world-wide level as producer of biodiesel based
on soybean oil. The measures previously mentioned generated a gradual fall in the level of
activity of the Argentine biodiesel industry, which led in 2013 to lose the first place to the US.
For the present year of 2014, Oil World estimates show that Argentina would also lose the
second place to Brazil (Causeway, 2014). In 2012 the Argentine soybean biodiesel production
exceeded 2.4 million tons out of which 1.56 million were exported (1,386 million to the EU),
while in 2013 the production was slightly below 2 million, with exports around 1.3 million
(0.55 million to the EU). Similar amounts of production and export are estimated for 2014 (or
slightly higher), but with the European market almost blocked.
A business opportunity is open to Argentine biodiesel in the United States market. The US
applies the RFS-II programme (Renewable Fuel Standard II) (US EPA, 2011). This standard
considers soy biodiesel as sustainable. The traceability of the raw material is tested starting
from the farms and then for the factories intermediate products. More than 18,000 tons were
exported from Argentina during 2013 and several shipments (estimate of 650,000 tons) took
place during 2014. Although this standard does not require the certification of the chain of
custody, it generates for the producers certain costs for traceability and segregation.
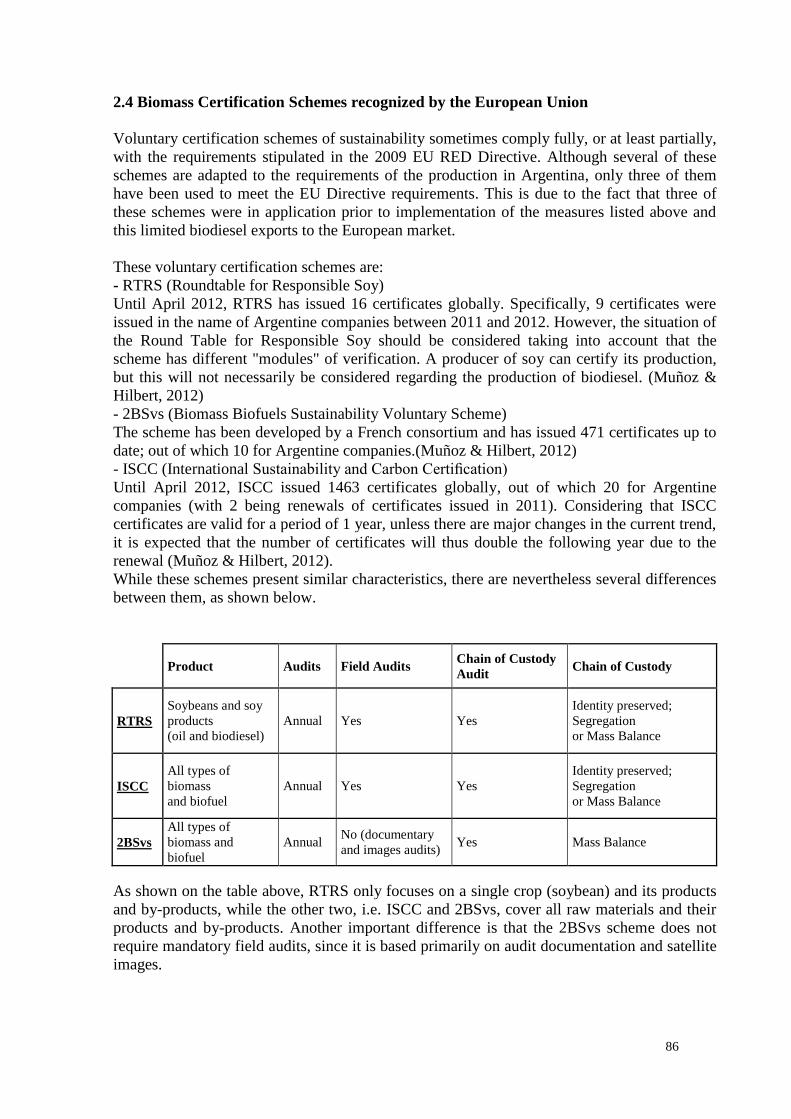
86
2.4 Biomass Certification Schemes recognized by the European Union
Voluntary certification schemes of sustainability sometimes comply fully, or at least partially,
with the requirements stipulated in the 2009 EU RED Directive. Although several of these
schemes are adapted to the requirements of the production in Argentina, only three of them
have been used to meet the EU Directive requirements. This is due to the fact that three of
these schemes were in application prior to implementation of the measures listed above and
this limited biodiesel exports to the European market.
These voluntary certification schemes are:
- RTRS (Roundtable for Responsible Soy)
Until April 2012, RTRS has issued 16 certificates globally. Specifically, 9 certificates were
issued in the name of Argentine companies between 2011 and 2012. However, the situation of
the Round Table for Responsible Soy should be considered taking into account that the
scheme has different "modules" of verification. A producer of soy can certify its production,
but this will not necessarily be considered regarding the production of biodiesel. (Muñoz &
Hilbert, 2012)
- 2BSvs (Biomass Biofuels Sustainability Voluntary Scheme)
The scheme has been developed by a French consortium and has issued 471 certificates up to
date; out of which 10 for Argentine companies.(Muñoz & Hilbert, 2012)
- ISCC (International Sustainability and Carbon Certification)
Until April 2012, ISCC issued 1463 certificates globally, out of which 20 for Argentine
companies (with 2 being renewals of certificates issued in 2011). Considering that ISCC
certificates are valid for a period of 1 year, unless there are major changes in the current trend,
it is expected that the number of certificates will thus double the following year due to the
renewal (Muñoz & Hilbert, 2012).
While these schemes present similar characteristics, there are nevertheless several differences
between them, as shown below.
Product Audits Field Audits Chain of Custody
Audit Chain of Custody
RTRS
Soybeans and soy
products
(oil and biodiesel)
Annual Yes Yes
Identity preserved;
Segregation
or Mass Balance
ISCC
All types of
biomass
and biofuel
Annual Yes Yes
Identity preserved;
Segregation
or Mass Balance
2BSvs
All types of
biomass and
biofuel
Annual No (documentary
and images audits) Yes Mass Balance
As shown on the table above, RTRS only focuses on a single crop (soybean) and its products
and by-products, while the other two, i.e. ISCC and 2BSvs, cover all raw materials and their
products and by-products. Another important difference is that the 2BSvs scheme does not
require mandatory field audits, since it is based primarily on audit documentation and satellite
images.
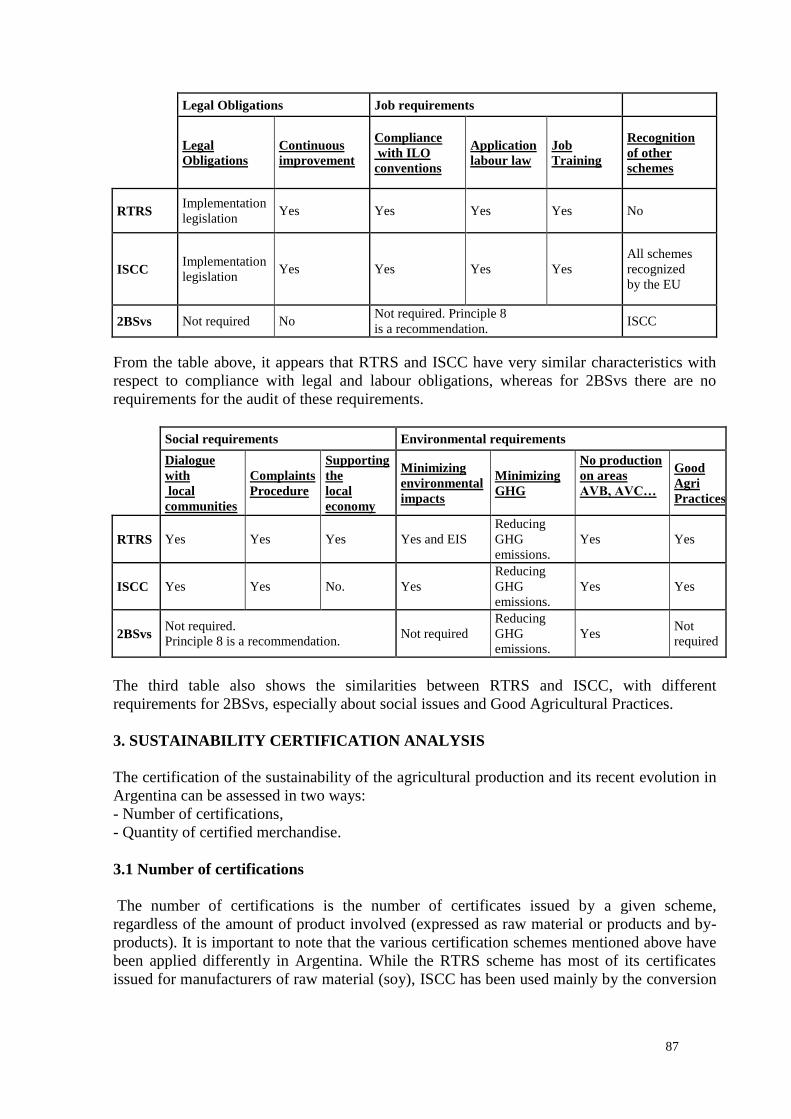
87
Legal Obligations Job requirements
Legal
Obligations
Continuous
improvement
Compliance
with ILO
conventions
Application
labour law
Job
Training
Recognition
of other
schemes
RTRS Implementation
legislation Yes Yes Yes Yes No
ISCC Implementation
legislation Yes Yes Yes Yes
All schemes
recognized
by the EU
2BSvs Not required No Not required. Principle 8
is a recommendation. ISCC
From the table above, it appears that RTRS and ISCC have very similar characteristics with
respect to compliance with legal and labour obligations, whereas for 2BSvs there are no
requirements for the audit of these requirements.
Social requirements Environmental requirements
Dialogue
with
local
communities
Complaints
Procedure
Supporting
the
local
economy
Minimizing
environmental
impacts
Minimizing
GHG
No production
on areas
AVB, AVC…
Good
Agri
Practices
RTRS Yes Yes Yes Yes and EIS
Reducing
GHG
emissions.
Yes Yes
ISCC Yes Yes No. Yes
Reducing
GHG
emissions.
Yes Yes
2BSvs Not required.
Principle 8 is a recommendation. Not required
Reducing
GHG
emissions.
Yes Not
required
The third table also shows the similarities between RTRS and ISCC, with different
requirements for 2BSvs, especially about social issues and Good Agricultural Practices.
3. SUSTAINABILITY CERTIFICATION ANALYSIS
The certification of the sustainability of the agricultural production and its recent evolution in
Argentina can be assessed in two ways:
- Number of certifications,
- Quantity of certified merchandise.
3.1 Number of certifications
The number of certifications is the number of certificates issued by a given scheme,
regardless of the amount of product involved (expressed as raw material or products and by-
products). It is important to note that the various certification schemes mentioned above have
been applied differently in Argentina. While the RTRS scheme has most of its certificates
issued for manufacturers of raw material (soy), ISCC has been used mainly by the conversion

88
industry (oils, biodiesel). 2BSvs has been used more for the certification of the units of origins
(stockpiles, cooperatives…).
Figure 1: Number of sustainability certificates issued
Elaborated by from ISCC 2014, RTRS 2014, 2BSvs 2014
Figure 1 presents the number of sustainability certificates delivered in Argentina, with an
initial growth and a decline after the measures restricting the access to the European market.
Given the fact that the current barrier to the European market does not seem to be taken out in
the near future, it is expected that the number of 2BSvs certifications will continue to
decrease. The other two standards mentioned (RTRS and ISCC) have maintained their levels
since they are not intended to certify only the production for the EU. At worldwide level,
ISCC had at the date of preparation of this report 2721 valid certificates and the 2BSvs
Consortium 633.
3.2 Quantity of certified merchandise
The volume of certified goods (in the Argentinean case mainly soy and its co-products) has
been affected by the restrictions previously mentioned. If we estimate a drop in the European
market of 1.4 million tons of biodiesel, this corresponds to more than 7.5 million tons of
soybeans.
𝑆𝑜𝑦𝑏𝑒𝑎𝑛 𝑡𝑜𝑛𝑠 =𝐵𝑖𝑜𝑑𝑖𝑒𝑠𝑒𝑙 𝑡𝑜𝑛𝑠
𝑓𝑎𝑡𝑡𝑦 𝑚𝑎𝑡𝑡𝑒𝑟 𝑦𝑖𝑒𝑙𝑑 ∗ 𝑏𝑖𝑜𝑑𝑖𝑒𝑠𝑒𝑙 𝑦𝑖𝑒𝑙𝑑
1400000
0,19∗0,97 = 7596000
Considering the average yield in the last few years, this is equivalent to about 3 million
hectares planted. During the year 2013, Argentina certified around 200.000 tons of RTRS soy.
In 2014, it is considered that the quantity finally certified will be greater due to a change in
the policy of the RTRS. From this year onwards, the fee of 0.30 euro per ton will not be paid
per ton produced but per ton certified and actually sold. Given this cost reduction, many
2011 20122013
2014
4 15 53
25 9 14
17
19 9 19
21
19
2BSvs RTRS

89
producers announced their total production and not only the component possible to sell as
certified.
Despite this increase, the area remains low when considering the 2013 area, when the peak of
certification was achieved. As discussed in the preceding statements, the demand of certified
biomass has changed in Argentina since the period of a biofuels market mainly targeted
towards Europe. 'Conscious' buyers are now willing to pay more for their products, but
unfortunately, there has been a market reduction.
As an example, we can mention the decision of the ARLA Danish company (dairy sector)
corresponding to a soybean demand of 480,000 tons from its chain. This company has entered
the market of RTRS credits and purchased so far some 98.000 credits, at a value of US$ 2.50
per credit (1 credit = 1 ton of soy).
4. CONCLUSION AND FINAL REMARKS
Environmental considerations, national and international regulations constrain and define the
market development for all the bioenergy products. In-depth studies are still required to better
understand the complexity of agro-ecosystems and the impact of biomass use at medium and
long-term.
The agricultural sector will be protagonist of a new revolution with the incorporation of a
non-traditional market such as energy. Bioenergy has already advanced significantly with
biodiesel and bioethanol, as well as with other options such as pellets and biogas. Producers
and researchers have to be prepared for this new scenario. In this context, Argentina has the
advantage of having an important and sophisticated network of institutions linked to
agriculture and agribusiness (Hilbert 2012). There has been a growing awareness of
sustainability both from the public side (municipalities, provincial and federal levels) and
from the private sector. The development of this trend has been institutionalized with specific
tools to address this topic (Diaz-Chavez 2011; Jorge Hilbert 2012a).
These advances resulted in concrete actions such as for example: Good Agricultural Practices,
the AAPRESID certified agriculture scheme, the CARBIO biofuels certification scheme, the
Global Bioenergy Partnership (GBEP) and the Roundtable on Sustainable Biofuels (RSB). In
addition, regulatory advances allow a better land-use management. To ensure the
sustainability of production practices is a requirement that is becoming more demanding in
order to have access to a global market.
In the case of Argentina biodiesel, the difficulties and opportunities are the following:
- The main historical driver for sustainability has been stopped by the anti-dumping measures
of the EU,
- In case of lifting by the EU of the anti-dumping measures, the choice of the certification
scheme to be used is going to modify the practices for the original product,
- The possibility for the EU to incorporate new sustainability requirements to the already
existing ones is considered as risk (for example, in relation to Indirect Land Use Change
quantification; to an increase in the percentage of GHGs savings to be achieved, to
food/feed/fuel competition assessment…).
- Another potential difficulty in the US is the request from the National Biodiesel Board to the
Environmental Protection Agency to raise the tariff for imported biodiesel and the expansion
of sustainability certification schemes to other markets apart from biofuels.
- Companies which wish to certify their biofuels production can make it without major
obstacles,

90
5. REFERENCES
- 2BSvs., 2014, Biomass Biofuel, Sustainability Voluntary Scheme, http://en.2bsvs.org
- AAPRESID, 2013, Asociación Argentina de Productores en Siembra Directa,
Sustentabilidad agrícola: el futuro del mercado de las certificaciones,
http://www.aapresid.org.ar
- Calzada J., 2014, Argentina pierde el primer lugar en la producción mundial de biodiesel
en base a soja, Bolsa de Comercio de Rosario, http://www.bcr.com.ar/
- Darts C., 2008 , Agricultura sustentable una Perspectiva Moderna.
- Di Paola M. E., 2012, .Informe Ambiental FARN 2012, http://www.farn.org.ar
- Diaz-Chavez R., 2011, A. Assessing biofuels: Aiming for sustainable development or
complying with the market ?.EnergyPolicy, vol. 39, no 10, p. 5763-5769.
- Ekins P. and Voituriez T., 2010, Trade, Globalization and Sustainability Impact
Assessment: A Critical Look at Methods and Outcomes (1st ed., pp. 368), Routledge.
- EU, European Union, 2013, Directive of the European Parliament and of the Council
amending Directive 98/70/EC relating to the quality of petrol and diesel fuels and amending
Directive 2009/28/EC on the promotion of the use of energy from renewable sources
- FAO, 2004, Food & Agriculture Organisation, Las buenas prácticas agrícolas. Oficina
Regional de la FAO para América Latina y el Caribe, Santiago de Chile.
- González F.J.M., Chamorro Mera A. and Rubio Lacoba S., 2004, Clarificando el
concepto de certificación. El caso español, Boletín Económico de ICE 2825: 3-16.
- Hilbert J., 2012, Producción de biodiesel a partir de aceite de soja. Contexto y evolución
reciente, INTA Buenos Aires, http://inta.gob.ar
- Hilbert J.A., 2008, Sustentabilidad de la producción de biocombustibles, certificación de la
producción, http://inta.gob.ar
- Hilbert J.A., 2012, Biocombustibles: el avance de la certificación de sustentabilidad en la
Argentina
- INTA, Instituto Nacional de Tecnología Agropecuaria, 2011, Ejes conceptuales para un
posicionamiento institucional ante el fenómeno de la soja. Documento de Uso Interno.
Buenos Aires.
- ISCC, International Sustainability and Carbon Certification, 2014, ISCC System,
http://www.iscc-system.org/en/
- Muñoz, L., & Hilbert, J., 2012, Biocombustibles: El avance de la certificacion de
sustentabilidad en la Argentina, http://inta.gob.ar
- Joseph K., 2012, Global Agricultural Information Network (GAIN) Report, Argentina,
Biofuels Annual. USDA, Foreign Agricultural Services, http://gain.fas.usda.gov
- RTRS, 2014, Round Table on Responsible Soy, http://www.responsiblesoy.org/
- US EPA, Environmental Protection Agency, 2011, Renewable Fuel Standard (RFS),
http://www.epa.gov - WTO, World Trade Organisation, 2014, WTO|Dispute settlement-the disputes-DS473. http://www.wto.org
Acknowledgement
We wish to thank L.Muñoz who collaborated with INTA for its important work on
sustainability certification in Argentina.

91
Sugarcane ethanol in Brazil: challenges past, present and future
F.V. Scarpare, M.R.L.V. Leal, R.L. Victoria,
Brazilian Bioethanol Science and Technology Laboratory
(CTBE/CNPEM), Campinas, Brazil
Summary
In Brazil, over 85 % of total sugarcane production is concentrated in the southern central
region. More specifically, 58–63 % of the country’s production in recent years has come from
the south-eastern state of São Paulo. However, cultivation is gradually expanding into the
Cerrado1 biome (savannas), mainly in Goiás State, where it is complicated by different water
supply patterns and soil characteristics. It is expected that the sugarcane will be irrigated in
order to increase yields and ensure stable production. In addition, the expansion has come up
against technological bottlenecks as regards management practices. Existing sugarcane
varieties were not developed for the Cerrado environment. Also, it has been claimed that
mechanical harvesting has reduced crops’ productive life and yield. Apart from these matters,
this review also addresses some economic issues that have arisen since sugarcane ethanol was
first introduced as a light-duty vehicle fuel in Brazil.
1. INTRODUCTION
Sugarcane ethanol has been promoted as a light-duty vehicle fuel in Brazil since the
beginning of the 20th century. Proponents were inspired by similar efforts in Europe,
especially Germany and France, to reduce the strong dependence on US and Russian oil
(Kovarik, 2006). They encountered several problems, from ethanol quality and availability to
its unsuitability for Otto cycle engines (designed to run on gasoline). The quest for other uses
for excess cane in Brazil was an additional motivating factor (Walter et al., 2014).
In the 1920s, the Brazilian government decided:
- to promote the use of ethanol to displace imported gasoline; and
- to support the adaptation of existing gasoline engines to ethanol, while addressing the
teething problems, i.e. poor performance, corrosion and the low quality of the fuel.
By 1931, improvements in ethanol production and use enabled the government to mandate the
blending of 5 % ethanol into all imported gasoline, with a view to:
- reducing cash outflows due to gasoline imports; and
- helping the sugar sector develop an alternative product to reduce the chronic surplus of cane
and sugar, which was leading to low sugar prices on the international market (Walter et al.,
2014).
The use of fuel ethanol increased considerably with the mandate. At the end of the Second
World War, oil prices were low, driving down interest in ethanol, but ethanol continued to be
used in a roughly 5 % mix with gasoline for Otto cycle engines. In the early 1970s Brazil
produced about 600 million litres of it.
1 Cerrado is a complex ecosystem characterised by stratified vegetation (grasses, shrubs and trees) and flora
and fauna suited to a seasonal climate (i.e. a dry season and a rainy season).

92
The oil crisis in 1973 put Brazil’s balance of payments under immense pressure, as the
country imported around 80 % of its oil consumption. In 1975, the government launched a
national alcohol programme (Proalcool) aimed at reducing dependency on imported oil. Soft,
low-interest loans and price controls that kept ethanol competitive vis-à-vis gasoline fostered
the expansion of ethanol production and consumption reached 11.9 billion litres in 1985.
Brazil’s experience of producing and using fuel ethanol stood it in good stead. The rapid
growth was achieved mainly by adding ethanol distilleries to existing sugar mills.
In 1985, oil prices fell sharply and the Brazilian oil company (Petrobrás) stepped up
production considerably, thus reducing demand for ethanol and increasing the need for
subsidies to keep it competitive. This had a big impact on the Proalcool programme and
ethanol production stagnated at around 11 billion litres/year until 2002, when oil prices started
to rise again (see Figure1).
Figure 1: Ethanol production in Brazil (Source: MAPA 2012)
In a context of highly competitive ethanol prices and a fresh increase in the price of gasoline,
the flex-fuel vehicle (FFV) concept introduced in 2003 was a huge stimulus to car production
(see Figure 2).
Figure 2: Development of the Brazilian car fleet (Source: ANFAVEA 2014)

93
In 2004, sugarcane and ethanol production entered a new phase of expansion that differed in
various ways from traditional growth; it was based on:
- the enlargement of existing mills/distilleries;
- the building of new mills and distilleries (green-field projects);
- the use of state-of-the-art technology in the plants; and
- a new frontier for sugarcane cultivation (mostly in the Cerrado), often far from traditional
production areas, with many investors from outside the sugar/ethanol sector.
These differences and the accelerated growth brought a series of problems that, together with
the 2007-08 economic crisis, changed the climate in which the sector had to operate.
2. THE NEW CONTEXT
The years 2004 to 2008 were years of plenty, with foreign investment supplementing funding
from traditional national groups, and very fast growth averaging around 10 % a year (UNICA,
2012). Logically, sugarcane producers needed to push back the frontiers. Economies of scale
and the mood of optimism resulted in the building of large mills (green-field projects) with
high-pressure boilers and turbine generators that made surplus power into a major new by-
product.
With the 2007-08 crisis, the sector fell deeply into debt and was unable to raise money from
the banks. It was forced to reduce crop inputs (fertilisers, herbicides and diesel), cut its
workforce and change important agricultural management practices (e.g. seed production,
cane-field renewal and mechanisation). Yields fell as a result (see Figure 3) and the situation
was exacerbated by a run of bad weather: excess rain in the 2009 harvesting season, drought
in 2010, frost and flowering in 2011 (UNICA, 2012). Oil price rises at this time also pushed
up prices for certain commodities (Kline, 2014), including diesel, fertiliser, herbicides and
other inputs. The fast pace of mechanisation led to soil compaction, high cane losses and
ratoon2 damage, contributing significantly to the loss in yield.
Figure 3: Average sugarcane yields in Brazil (Source: IBGE 2014)
In identifying the main reasons for lower yields and gradually restoring acceptable
agricultural practices (UNICA, 2012), the sector has become more aware of the importance of
yields as a factor in determining sugar and ethanol production costs, of which feedstock
represents about two thirds. Sales of surplus power generated from sugarcane have also
2 Ratoon: cane sprout after it has been harvested.

94
slowed, as it is not competitive with wind power. It has some key advantages over wind
power, such as dispatchability, a higher power factor and lower transmission costs (because it
is generated closer to the loads), but it seems that these do not carry much weight.
In summary, the current situation of the sugar/ethanol sector is characterised by:
- many mills in bad financial health;
- sugarcane yields below historical averages;
- higher production costs due to more expensive energy, input, land and labour, and lower
yields;
- a production slowdown after the 2010/11 season (see Table 1);
- a lack of competitiveness in renewable electricity auctions;
- negative impacts of fast mechanisation (soil compaction, cane losses, ratoon damage);
- gasoline prices kept artificially low by the government, reducing the competitiveness of
ethanol; and
- the lack of a long-term policy perspective for ethanol and electricity in Brazil’s energy mix.
Season 2007/08
*
2008/09
*
2009/10
*
2010/11
*
2011/12
*
2012/13
**
2013/14
**
Cane (Mt) 495.8 572.7 601.4 623.9 560.5 588.9 658.8
Sugar (Mt) 31.3 31.5 33.0 38.1 36.0 38.3 37.9
Ethanol (GL) 22.5 27.7 25.7 27.6 22.7 23.6 28.0
Table 1: Sugarcane, sugar and ethanol production (2007/08-2013/14)
(Sources MAPA 2013* and CONAB 2014)**
The sector is struggling to emerge from the crisis and has realised the urgency of returning to
historical sugarcane yields. Key issues include:
- a return to traditional good practice in cane production;
- the recovery of cane straw to increase surplus power generation;
- the search for other feedstock (e.g. sweet sorghum and corn) to extend the processing season
beyond the sugarcane harvest;
- lobbying for better prices for electricity from the mills;
- reducing the negative impacts of mechanisation through qualified labour and better
technology (use of GPS, optimising cane-field layout, etc.); and
- developing varieties better suited to the new production environment (soil and climate) and
resistant to drought.
One very important tool for increasing yield is irrigation, which could be used in the Cerrado
region, where longer periods of dry weather create stress and reduce yields and cane-field
longevity. Another important consideration is the impact of irrigation in mitigating the
business risks associated with the kind of bad weather seen in the past four harvesting
seasons. The main sustainability issues associated with irrigation will be discussed in the
following sections.
3. SUGARCANE LAND USE
Currently, Brazil has the largest sugarcane area in the world (9.7 Mha) and accounts for
approximately a third of global harvested area and production (IBGE, 2014). Most of its
sugarcane is grown in the Paraná River basin, where the Cerrado biome (savannas) is
dominant (see Figure 4).
At 204 Mha, the Cerrado is the second largest biome in Brazil and covers almost 25 % of the
country. Located mainly in the central highlands, it plays an important role in water
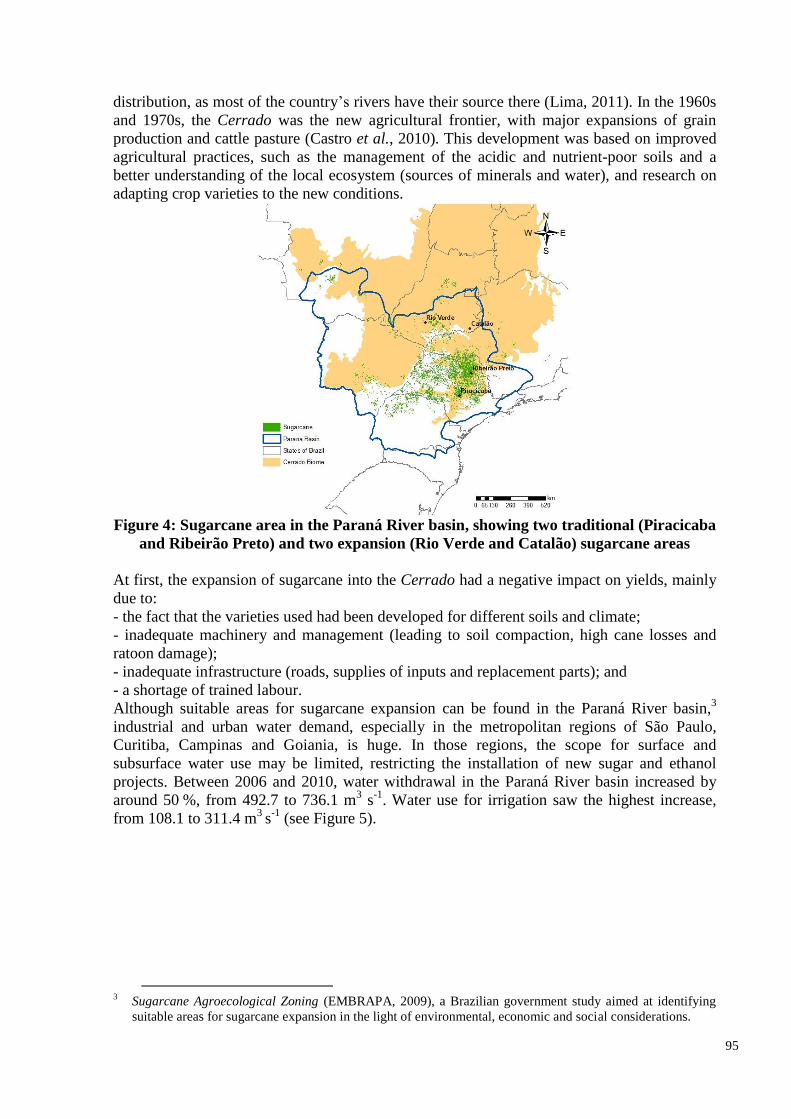
95
distribution, as most of the country’s rivers have their source there (Lima, 2011). In the 1960s
and 1970s, the Cerrado was the new agricultural frontier, with major expansions of grain
production and cattle pasture (Castro et al., 2010). This development was based on improved
agricultural practices, such as the management of the acidic and nutrient-poor soils and a
better understanding of the local ecosystem (sources of minerals and water), and research on
adapting crop varieties to the new conditions.
Figure 4: Sugarcane area in the Paraná River basin, showing two traditional (Piracicaba
and Ribeirão Preto) and two expansion (Rio Verde and Catalão) sugarcane areas
At first, the expansion of sugarcane into the Cerrado had a negative impact on yields, mainly
due to:
- the fact that the varieties used had been developed for different soils and climate;
- inadequate machinery and management (leading to soil compaction, high cane losses and
ratoon damage);
- inadequate infrastructure (roads, supplies of inputs and replacement parts); and
- a shortage of trained labour.
Although suitable areas for sugarcane expansion can be found in the Paraná River basin,3
industrial and urban water demand, especially in the metropolitan regions of São Paulo,
Curitiba, Campinas and Goiania, is huge. In those regions, the scope for surface and
subsurface water use may be limited, restricting the installation of new sugar and ethanol
projects. Between 2006 and 2010, water withdrawal in the Paraná River basin increased by
around 50 %, from 492.7 to 736.1 m3 s
-1. Water use for irrigation saw the highest increase,
from 108.1 to 311.4 m3
s-1
(see Figure 5).
3 Sugarcane Agroecological Zoning (EMBRAPA, 2009), a Brazilian government study aimed at identifying
suitable areas for sugarcane expansion in the light of environmental, economic and social considerations.

96
Figure 5: Water withdrawal in the Paraná River basin, by sector (2006 and 2010)
(Source: ANA 2013)
Brazil’s irrigation potential (estimated at 29.3 Mha) is the fourth largest in the world (FAO,
2000). Over a third is in Cerrado areas and only a tenth is actually used (Christofidis, 2006).
Therefore, given favourable market and credit conditions, irrigation expansion has great
potential in this biome.
Information from several (official and unofficial) sources indicates that the area equipped for
irrigation (all crops) in Brazil has increased over the past 60 years (see Figure 6).
Figure 6: Area equipped for irrigation (all crops)
(Sources: Christofidis 2013, IBGE 2006, ANA 2003,
Christofidis 2003, Werneck et al. 1999)
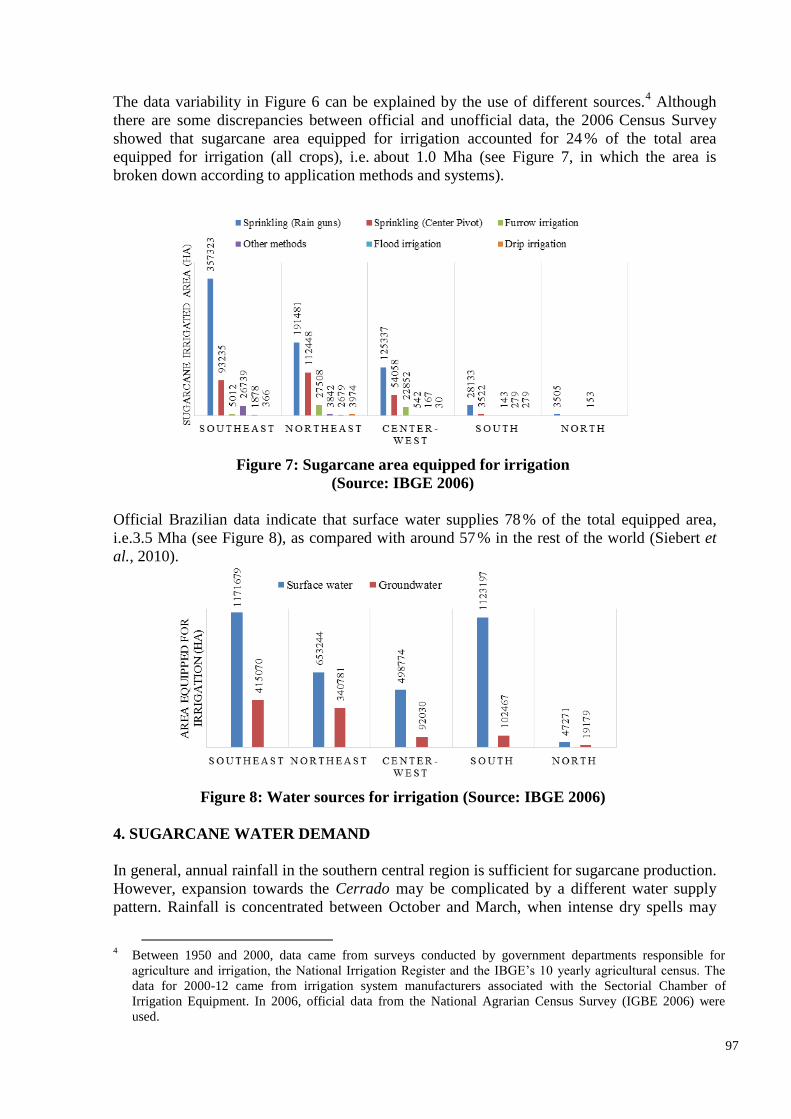
97
The data variability in Figure 6 can be explained by the use of different sources.4 Although
there are some discrepancies between official and unofficial data, the 2006 Census Survey
showed that sugarcane area equipped for irrigation accounted for 24 % of the total area
equipped for irrigation (all crops), i.e. about 1.0 Mha (see Figure 7, in which the area is
broken down according to application methods and systems).
Figure 7: Sugarcane area equipped for irrigation
(Source: IBGE 2006)
Official Brazilian data indicate that surface water supplies 78 % of the total equipped area,
i.e.3.5 Mha (see Figure 8), as compared with around 57 % in the rest of the world (Siebert et
al., 2010).
Figure 8: Water sources for irrigation (Source: IBGE 2006)
4. SUGARCANE WATER DEMAND
In general, annual rainfall in the southern central region is sufficient for sugarcane production.
However, expansion towards the Cerrado may be complicated by a different water supply
pattern. Rainfall is concentrated between October and March, when intense dry spells may
4 Between 1950 and 2000, data came from surveys conducted by government departments responsible for
agriculture and irrigation, the National Irrigation Register and the IBGE’s 10 yearly agricultural census. The
data for 2000-12 came from irrigation system manufacturers associated with the Sectorial Chamber of
Irrigation Equipment. In 2006, official data from the National Agrarian Census Survey (IGBE 2006) were
used.

98
occur. Also, despite their clayish consistency, oxisols can behave like sandy soils in some
cases (available water capacity between 70 and 100 mm) because of iron oxides, which favour
the formation of stable small aggregates similar to sand (Resende et al., 1995).
Soil and climate characteristics are key factors affecting water demand estimates for specific
regions. Figure 9 shows the water balance5 for two traditional sugarcane areas (Piracicaba and
Ribeirão Preto) and two expansion sugarcane areas (Rio Verde and Catalão).
Figure 9: Annual water balance for two traditional (Piracicaba and Ribeirão Preto) and
two expansion (Rio Verde and Catalão) sugarcane areas (based on 100 mm of water
capacity in the soil)
Even assuming the same water retention capacity in the soil (100 mm), there is clearly a larger
water deficit in expansion areas in Goiás (Cerrado). Therefore, irrigation is called for in these
expansion areas if yields are to be sustainable. Moreover, water surplus in these areas in the
summer shows that this is possible. The caveat is that irrigation investments require discipline
and knowledge. Relevant factors include access to electricity, water storage in dams,
identifying the best areas for irrigation, and varieties to be planted.
Given sugarcane’s semi-perennial cycle (five or six harvests on average), it may be subject to
seasonal changes in water availability. To achieve a high dry-matter yield and sucrose
content, it is important to manage planting so that the plants’ initial development is
accompanied by appropriate weather conditions (sun and rainfall). This allows for maximum
5 Based on the volumes of water entering and leaving a given amount of soil over a given period; Thornthwaite
and Matter, 1955.

99
vegetative growth in this phase and better accumulation of sucrose in the stems in the dry
period (maturation phase).
In the southern central region of Brazil, sugarcane is planted between February and April,
resulting in a harvest of 15-18 month plant-cane6, and either in the winter (July/August) or the
spring (September-November), resulting in 12-month plant-cane. Looking at water balance
and planting seasons together gives us a good understanding of the why and how of sugarcane
irrigation management (see Figure 10).
After emergence and establishment, crops planted in the summer enter a period in which
water usage combines with low and infrequent rainfall to produce a considerable water
deficit. Although sugarcane has a high drought tolerance, it spends energy maintaining its
metabolism in periods of low water supply and this results in low biomass growth, or even
none at all. This can be addressed by deficit irrigation (normally with five to ten ‘irrigation
events’ in the most critical development phases) or full irrigation (‘irrigation events’ daily or
every other day to satisfy water demand over the season).
For crops planted in the winter and ratoon crops, the initial development phase (emergence
and establishment) starts in the most critical period. Here, salvage irrigation (normally one or
two ‘irrigation events’) is usually carried out to ensure that plants survive and become
established. In most cases, vinasse7 is applied, generally using rain guns. This is the most
common sugarcane irrigation strategy in Brazil and the method used for over 70 % of the
irrigation in the south-east (see Figure 7).
When properly managed, irrigation can be economically feasible, especially with efficient
application methods such as drip irrigation. In addition to direct benefits, i.e. yields increased
by an average of 30 % (Gava et al., 2011) and crop longevity (up to nine cuts), the indirect
benefits include a reduced need for new areas and thus shorter transportation distances and
lower transport costs (these represent about 10 % of total production costs).
6 Plant-cane: first cane cycle.
7 Vinasse: final by-product of ethanol distillation.

100
Figure 10: Piracicaba water balance and sugarcane planting season (summer, winter
and spring) and development during plant-cane cycle

101
5. CANE VARIETIES AND MANAGEMENT SYSTEM
Brazilian sugarcane yields increased dramatically from 46 Mg ha-1
in 1970 to 83 Mg ha-1
in
2010 (IPEADATA, 2013). The increase of around 930 kg ha-1
year-1
can be attributed to
better agricultural techniques and large-scale genetic breeding programmes supported by the
government and the private sector, particularly in the 1970s and 1980s.
Four such programmes are currently active in Brazil:
- IAC: Campinas Agronomics Institute (publicly funded) has had a breeding programme since
1930 (varieties with the IAC acronym);
- CTC: the Sugarcane Technology Centre (varieties with the CTC acronym), formerly
Copersucar Technology Centre (varieties with the SP acronym), a private company that
maintains the world’s largest and most complete germplasm bank, with more than 5 000
clones of commercial and wild species of sugarcane;
- RIDESA: the Inter-University Network for the Development of the Sugarcane Sector.
Formerly known as Planalsucar (National Sugarcane Improvement Programme), this was set
up by the government in 1971 (varieties with the RB acronym). It is currently made up of ten
federal universities and is the largest genetic breeding programme in Brazil; and
- CANAVIALIS: a private company established in 2003 that has developed a large
programme to breed genetically modified crops (Walter et al., 2013).
These institutes seek to produce sugarcane varieties suited to the production system, and soil
and climate characteristics, in order to find the best match between the variety and its
environment. In traditional sugarcane areas, there are specific varieties for different regions –
over 550 varieties of sugarcane have been developed in the past 80 years, mostly since 1970.
Apart from increasing yields, continuous genetic improvement has meant that the harvest
period has been extended from four months, as was the case until the 1960s, to seven/eight
months today.
The 2012 Varietal Census Survey (Chapola et al., 2013) shows that the main producing states
in the southern central region mostly use the same varieties. The varietal concentration index
(VCI) reflects the percentage share of the three major varieties (see Figure 11).8 The VCI
values for the southern central region indicate a need for better varietal management to match
varieties to the environment.
8 The VCI indicates the degree of dependence on the main varieties used and hence the associated risks.
According to CTC (2012), VCI values above 50 % indicate a high level of risk and are not recommended;
values between 40-50 % are intermediate and values below 40 % are considered low risk.

102
Figure 11: Most planted sugarcane varieties in southern central states and their VCI
(SP-São Paulo, PR-Paraná, MG-Minas Gerais, MS-Mato Grosso do Sul and GO-Goiás)
(Source: Chapola et al. 2013)
The expansion into different edaphoclimatic areas will require the development of new
varieties, because simply transferring genetic material from one region to another does not
ensure good productive performance. Therefore, the production of varieties better suited to
Cerrado conditions (i.e. drought-resistant) and to ‘green cane management’ (see below) is the
key. Some breeding research institutes are currently releasing such varieties.
As regards management techniques, for centuries sugarcane was harvested manually and the
fields were burned to remove sugarcane straw (the tops and leaves of the plant), drive away
snakes and other potentially poisonous animals, and facilitate harvesting. For environmental
reasons, however, this approach has gradually been replaced by ‘green cane management’,
i.e.the mechanical harvesting of unburned cane, with the dry leaves and tops (straw) being left
on the ground (Leal et al., 2013). In São Paulo State, the largest producer with around 370
million Mg, a semi-mechanised system is used, with mechanical harvesting in 83 % of the
production area but mechanised planting being used less (in only around 45 % of the area)
(UNICA, 2014). Despite the advantages of mechanical harvesting, it is claimed that (due to
harvest losses, soil compaction and ratoon damage) it has reduced the productive life and
yield of the sugarcane as compared with the manual harvesting of burned cane.
6. FINAL COMMENTS
The significant increase in ethanol production in the Cerrado regions in the coming years will
throw up major challenges in terms of its impacts on biodiversity, agricultural productivity
and water availability.
It is becoming clear that sugarcane irrigation has an important role to play in the sustainability
of the ethanol production chain, but research involving modelling and field measurements
need to be developed and the growing commercial application of the technology needs to be
pursued.
Recent expansion has led to lower productivity, at least initially, due to the limited availability
of varieties suited to local conditions and generally poor edaphoclimatic properties. In
addition, new technologies (e.g. intensive mechanisation) and agronomic practices (e.g.
103
disposing of straw in the soil and not tilling) will be used in coming years, and their impacts
are uncertain.
Despite its long experience and relative success, Brazil will need to make major efforts to
expand the sugarcane industry, intensify activity in new production areas, change agronomic
practices and diversify production methods. To ensure sustainable growth, however, new
technology has to do more than boost productivity: it also has to satisfy the requirements of
environmental conservation. All environmental services provided by a specific landscape
should be maintained or improved, or – at the very least – negative impacts should be kept at
an acceptable level.
7. REFERENCES
- ANFAVEA, 2014, Brazilian Automotive Industry Association. Brazilian Automotive
Industry Yearbook http://www.anfavea.com.br/anuario.html
- ANA, 2003, National Water Agency, Plano Nacional de Recursos Hídricos
http://www.ana.gov.br/pnrh/index.htm
- ANA, 2013, National Water Agency, Conjuntura dos recursos hídricos no Brasil: Informe
2013, Brasília, Brasil. Available at http://arquivos.ana.gov.br/
- Castro S.S., Abdala K., Silva A.A., Bôrges V.M.S., A expansão da cana-de-açúcar no
Cerrado e no Estado de Goiás: elementos para uma análise espacial do processo. Boletim
Goiano de Geografia, 30:171-191, 2010.
- CTC, 2012, Sugarcane Technology Centre, Censo varietal e de produtividade em 2012
http://www.ctcanavieira.com.br/downloads/Censo2012.pdf
- Chapola R.C., Cruz J.A., Nunes I.K., Fernandes Júnior A.R., Censo varietal 2012.
Editora CCA-UFSCar, Araras, 55, 2013.
- Christofidis D., 2013, Água, irrigação e agropecuária sustentável. Revista Política
Agrícola, 1:115-136, 2013.
- Christofidis D., 2006, Oportunidades de irrigação no Cerrado: recursos hídricos dos
cerrados e seu potencial de utilização na irrigação. Item; Irrigação e Tecnologia Moderna
69:87-97. 2006.
- Christofidis D., 2003, Recursos hídricos, irrigação e segurança alimentar. In: Freitas
M.A.V. O estado das águas no Brasil, 2001-2002. Brasília, DF: Agência Nacional de Águas
111-134, 2003.
- CONAB, 2014, National Supply Company, Acompanhamento da Safra Brasileira: Cana-
de-Açúcar, Safra 2013/14, Quarto Levantamento, 2014. http://www.conab.gov.br
- EMBRAPA, 2009, Brazilian Agricultural Research Corporation, Zoneamento
agroecológico da cana-de-açúcar 2009, Rio de Janeiro.
- FAO, 2000, Food and Agriculture Organisation of the United Nations
http://www.fao.org/nr/water/aquastat/countries_regions/brazil/index.stm
- Gava G.J.C., Silva M.A., Silva R.C., Jeronimo E.M., Cruz J.C.S., Kolln O.T.,
Produtividade de três cultivares de cana-de-açúcar sob manejos de sequeiro e irrigado por
gotejamento. Revista Brasileira de Engenharia Agrícola e Ambiental, 15:250-255, 2011.
- IBGE, 2006, Brazilian Institute of Geography and Statistics, 2006. Agricultural Census
Survey
http://www.ibge.gov.br/home/estatistica
- IBGE, 2014, Brazilian Institute of Geography and Statistics, Municipal Agricultural
Production http://www.sidra.ibge.gov.br/
- IPEADATA, 2013, Institute for Applied Economic Research. http://www.ipeadata.gov.br/
104
- Kline K.L., Food security and biofuels: Can policy flexibility reduce food price crises for
the poor? Part 2: USA and global markets, RCN Pan-American Biofuel and Bioenergy
Sustainability Conference, Recife, PE, Brazil, 23-25 July 2014.
- Kovarik W., Ethanol’s First Century: Fuel Blending and Substitution Programme in
Europe, Asia, Africa and Latin America, Proceedings of the XVI International Symposium on
Alcohol Fuels (ISAF), Rio de Janeiro, RJ, Brazil, 26-29:269-286, 2006.
- Leal M.R.L.V., Galdos M.V., Scarpare F.V., Seabra J.E., Walter A., Oliveira C.,
Sugarcane straw availability, quality, recovery and energy use: A literature review. Biomass
and Bioenergy, 53:11-19, 2013.
- Lima J.E.F.W., Situação e perspectivas sobre as águas do Cerrado. Ciência e Cultura
63:27-29, 2011.
- MAPA, 2012, Ministry of Agriculture, Livestock and Food Supply, Anuário estatístico da
bioenergia 2012, Brasília.
- MAPA, 2013, Ministry of Agriculture, Livestock and Food Supply, Statistical Yearbook of
Agrienergy, Brasília.
- Resende M., Curi N., Rezende S.B., Corrêa G.F., Pedologia: base para distinção de
ambientes. Viçosa: NEPUT, 1995, 304.
- Siebert S., Burke J., Faures J.M., Frenken K., Hoogeveen J., Döll P., Portman, F. T.,
Groundwater use for irrigation — a global inventory. Hydrology and Earth System Sciences
14:1863–80, 2010.
- Thornthwaite C.W., Mather J.R., The water balance. Publications in Climatology, New
Jersey, Drexel Inst. of Technology, 104 p., 1955.
- UNICA, 2012, Sugarcane Industry Association, Panorama do Setor Sucroenergético no
Brasil: Os desafios para a próxima década, F.O. Lichts 8th Sugar & Ethanol Brazil, São
Paulo, SP, 26-28, 2012.
- UNICA, 2014, Sugarcane Industry Association, O setor sucroenegético;
http://www.unica.com.br/
- Walter A., Galdos M.V., Scarpare F.V., Seabra J.E., Leal M.R.L.V., Cunha M.P.,
Oliveira C., Brazilian sugarcane ethanol: Developments so far and challenges for the future.
WIREs Energy Environment 3:70-92, 2013.
- Werneck J.E.F., Ferreira R.S.A., Christofidis D., O uso da água para irrigação. 1999
http://www.cf.org.br/cf2004/irrigacao.doc, 10.8.2006.
Abbreviations
ANA National Water Agency
CONAB National Supply Company
CTC Sugarcane Technology Centre
EMBRAPA Brazilian Agricultural Research Corporation
FAO Food and Agriculture Organisation of the United Nations
FFV flex-fuel vehicle
GPS Global Positioning System
IAC Campinas Agronomics Institute
IPEADATA Institute for Applied Economic Research
IBGE Brazilian Institute of Geography and Statistics
MAPA Ministry of Agriculture, Livestock and Food Supply
RIDESA Inter-University Network for the Development of the Sugarcane Sector
UNICA Sugarcane Industry Association
VCI Varietal Concentration Index

105
Status and perspectives of renewable energy in Chile,
the role of bioenergy in the Chilean energy mix
V.Martinez,
National Center for Innovation and Development of Sustainable Energy, (CIFES),
V.Ávalos,
Renewable Energy Division, Ministry of Energy, Santiago de Chile
1. INTRODUCTION
Over the past few decades, Chile has experienced stable economic growth, allowing it to
improve the quality of life of its inhabitants, drastically reducing poverty levels and tripling its
GDP in only 20 years (World Bank, 2013). This dramatic economic and social development
has been accompanied by an increasing demand for energy, which has been satisfied by an
energy mix dominated by (mostly imported) traditional fuels such as oil, coal and natural gas,
although hydroelectricity makes a big contribution: nearly 35 % of total electricity production
in 2012.
Currently, the country has installed capacity of approximately 17 000 MW. Economic growth
trends indicate that a further 8 000 MW will be needed by 2020 (Ministry of Energy, 2012). In
February 2012, in response to this challenge, the government launched the 2012-30 National
Energy Strategy, which sets out guidelines for the years ahead. Among the priorities identified
are increasing the non-conventional renewable energy (NCRE) component in Chile’s energy
mix and taking measures to address the barriers to the large-scale development of NCRE
projects, which vary according to the sources and their associated technologies.
Given its rich forestry resources and land for growing wood for energy, its vast experience in
agriculture and forestry, and the commercial availability of energy conversion technologies,
Chile is well placed to boost the efficient and sustainable development of bioenergy beyond
current levels. Biomass has traditionally been used in Chile as firewood for residential
heating, but the extreme inefficiency of the equipment has led to serious environmental
problems as a result of local emissions. Biomass has also been used in industry as fuel for
producing process steam, although in the past few years electricity production has also been
boosted by large forestry companies using combined heat and power systems.
International experience shows that biomass could make a much greater contribution to
energy production than is currently the case in Chile. This would allow it to diversify its
energy mix with its own renewable resource, thus reducing greenhouse gas emissions from
the energy sector and generating numerous jobs along the biomass value chain.
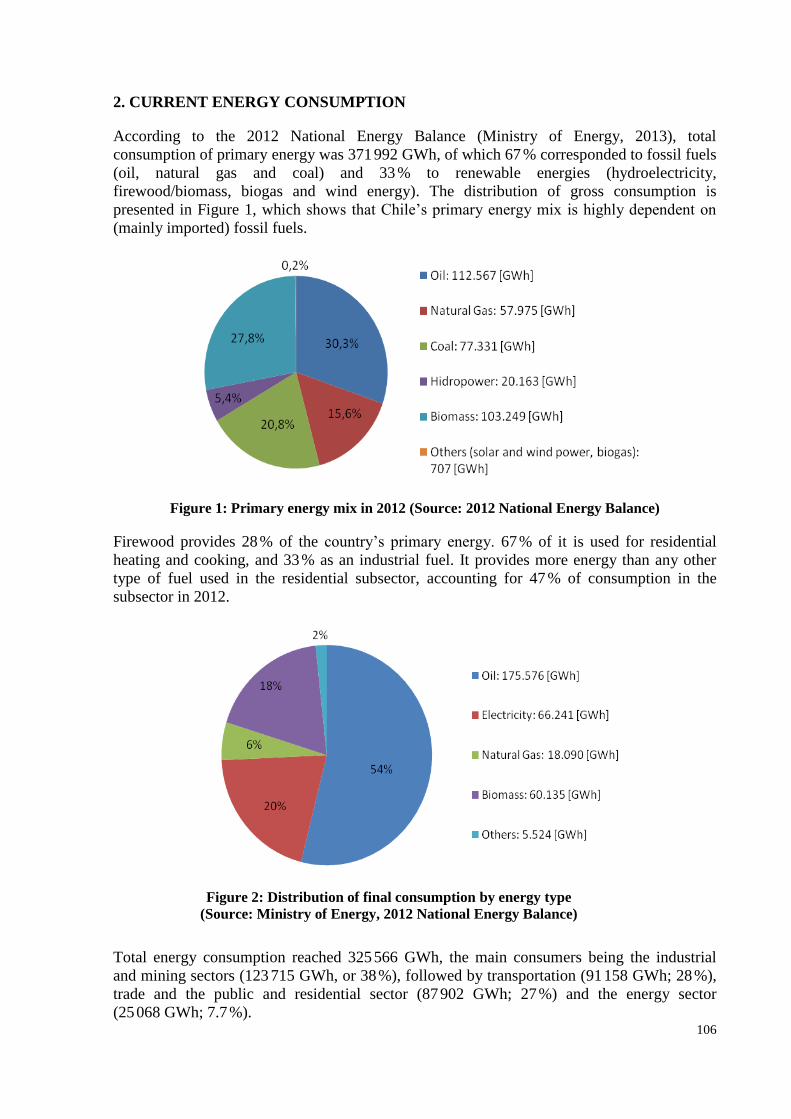
106
2. CURRENT ENERGY CONSUMPTION
According to the 2012 National Energy Balance (Ministry of Energy, 2013), total
consumption of primary energy was 371 992 GWh, of which 67 % corresponded to fossil fuels
(oil, natural gas and coal) and 33 % to renewable energies (hydroelectricity,
firewood/biomass, biogas and wind energy). The distribution of gross consumption is
presented in Figure 1, which shows that Chile’s primary energy mix is highly dependent on
(mainly imported) fossil fuels.
Figure 1: Primary energy mix in 2012 (Source: 2012 National Energy Balance)
Firewood provides 28 % of the country’s primary energy. 67 % of it is used for residential
heating and cooking, and 33 % as an industrial fuel. It provides more energy than any other
type of fuel used in the residential subsector, accounting for 47 % of consumption in the
subsector in 2012.
Figure 2: Distribution of final consumption by energy type
(Source: Ministry of Energy, 2012 National Energy Balance)
Total energy consumption reached 325 566 GWh, the main consumers being the industrial
and mining sectors (123 715 GWh, or 38 %), followed by transportation (91 158 GWh; 28 %),
trade and the public and residential sector (87 902 GWh; 27 %) and the energy sector
(25 068 GWh; 7.7 %).

107
3. STATUS OF NON-CONVENTIONAL RENEWABLE ENERGIES IN CHILE
a. Potential
Given its geography and climatic diversity, Chile has significant potential when it comes to
using renewable natural resources. In 2011, the Advisory Commission for Electrical
Development (CADE) undertook a thorough review of NCRE potential in the country, which
involved:
- analysing the quality of the resource from a ‘biogeophysics’ point of view; simulation
models were calibrated with information gathered on site to collect baseline data on the
amount (and seasonality) of water, wind, geothermal energy, land for producing biomass and
ocean currents;
- identifying barriers to using the resource, e.g. land gradients may be critical to the suitability
of sites for gathering solar energy; and
- analysing the data, also in the light of other types of barrier, such as legal ones (e.g. water
rights) or infrastructure (e.g. access to roads).
In addition, the Ministry of Energy has carried out various studies complementing the CADE
work. The results of this research are summarised in the following chart.
Resource
Identified
potential
(MW)
Observations
Small hydroelectric
plants (< 20 MW)
1 400 Irrigation projects (theoretical irrigation potential)
3 380 River basins from the regions of Valparaiso to Los Lagos, based on
National Water Board data on instream water rights
Geothermal 3 500 Geothermal concessions
Wind power 181 390 1 813 898 ha between the regions of Arica y Parinacota and
Los Lagos (a ratio of 10 ha/MW is applied)
Biomass
320 Residues from production forests (1 792 million tonnes dry basis)
387 Residues from sawmills (2 178 million tonnes dry basis)
2.597 Residues from native forests (theoretical potential)
Biogas 266 to 362 Urban solid residues, slurry, wastewater treatment plants, agricultural
residues, etc.
Photovoltaic solar 1 318 429 6 592 144 ha between Arica y Parinacota and Los Lagos
Concentrated solar
power 2 636 000
Marine energy 165 GW
for waves Wave power technology
Chart 1: Gross renewable energy potential in Chile
(Source: CADE 2011, Ministry of Energy 2013)

108
b. Regulatory framework
Since 1 April 2008, with the entry into force of Law 20 257, electrical companies selling
energy to end users have had to demonstrate that a percentage of that energy comes from
NCRE.1 More specifically, in 2010-14, every electrical company generating energy from
electrical systems with an installed capacity of over 200 MW has had to demonstrate that 5 %
of its annual production comes from its own or contracted non-conventional renewable
sources. As of 2015, the compulsory rate will increase by 0.5 percentage points a year until it
reaches 10 % in 2024.
Figure 3 illustrates compliance with the obligation under Law 20 257 to generate NCRE on
supply contracts. The 5 % rate required by law has been exceeded in the past two years and
projections based on current projects suggest that the obligation will continue to be met.
Figure 3: Compliance with Law 20 257 (Source: CER, 2013)
In September 2013, Congress approved Law 20/25, which raised the 10 % NCRE rate for
2024 to 20 % by 2025, thus giving a considerable additional boost to the development of
NCRE. The Law is in the final legislative stage before being enacted and entering into force.
c. Development of project portfolio
To date, there are 1 072 MW of installed capacity from NCRE sources. 442 MW comes from
bioenergy (mostly from the direct combustion of forestry residues), 302 MW from wind
energy, 323 MW from small hydroelectric plants and 5.7 MW from solar energy.
1
The definition of NCRE in Chile excludes hydroelectric plants with an installed capacity of over 20 MW.

109
Figure 4: Development of installed NCRE capacity in Chile (Source: CER, 2013)
NCRE plants generated 3 158 GWh in 2012 (see Figure 7), which represents 4.28 % of total
production.
Figure 5 : Development of NCRE production in Chile (Source: CER, 2013)
As regards the medium-term development of NCRE installed capacity, gradual growth has
been seen since 2004 thanks to the appearance of biomass plants. In 2009, there was a
significant new increase following the addition of wind farms and in 2012 an increase in
installed biomass capacity. Since the entry into force of Law 20 257, installed NCRE capacity
subject to the Law has grown from 319 MW (2010) to 1 072 MW (2013), an increase of 753
MW.

110
A large number of non-constructed or non-operating NCRE projects have been submitted to
the Environmental Impact Evaluation System (SEIA). This is mandatory for electrical
generation projects over 3 MW, but the granting of permission does not ensure immediate
implementation, as other (sectoral environmental, electrical, etc.) permits are required and
financing and commercialisation issues have to be solved.
As of September 2013, there were projects in the pipeline for 13 336 MW. Most, representing
53 % of the total (7 080 MW), are solar energy projects. These are followed by wind projects,
accounting for 5 513 MW (41 %). The remaining 6 % is from small-hydro, geothermal and
biomass projects.
Status Operating
(MW)
Under
construction
(MW)
Approved RCA,
without construction
(MW)
Under
evaluation
(MW)
Bioenergy 442 10 106 26
Wind power 302 490 3 486 1 537
Small-hydro 323 76 268 139
Solar 5.7 127 4 901 2 052
Geothermal 0 0 120 0
Total 1 072* 703 8 881 3 754
Chart 2: NCRE projects in Chile (Source: CER, 2013)
4. PROSPECTS FOR BIOENERGY
a. Current uses
Firewood/biomass adds 27.8 % to Chile’s primary energy mix. The main use for firewood,
which comes mainly from native forest, is residential heating and cooking (67 %). The other
33 % is used as industrial fuel, for thermal and electrical production, and co-generation
(Ministry of Energy, 2013).
The main environmental issues relating to the use of firewood arise at each end of the
commercial chain – during the extraction process and in the energy conversion processes.
Inefficient use of firewood has led to serious environmental consequences, such as the illegal
exploitation of native forest and air pollution. The latter has been caused mainly by the high
humidity content of firewood, the low quality and inefficiency of stoves, misuse and poor
domestic insulation.
The main industrial consumer of biomass is forestry, which covers most of its thermal and
electrical requirements with self-produced biomass (sawdust, cropped ends, crust, shavings,
black liquor, tall oil, tall oil soaps and residues from production forests) and sells surplus
electricity to the grid.
In Chile, biomass comes primarily from firewood, waste firewood from primary processing
(sawmills, boards and paper), residues from the secondary wood industry (timber yards and
other production plants) and forestry waste (handling and harvest).
In the past five years, the use of residues from forest management (pruning, thinning and
cropping) has shown sustained growth, boosted by increasing demand for electrical and
thermal production, especially from the largest consumption centres. The demand has been
boosted by high electricity prices. Also, the use of lignocellulosic agricultural waste (wheat
straw) has grown steadily in the past two years.

111
The market for biomass from production forests is influenced in particular by the big forestry
companies, which are large consumers and owners of much of the forest estate. The market is
dominated by large multinationals and its structure does not allow small and medium-sized
owners to sell their products at competitive prices or potential users from SMEs to gain easy
access.
The biogas industry in Chile is in its initial development phase. Various projects for
generating heat, combined heat and power or flaring are being studied, under construction or
already in operation. The flaring projects are linked to the use of mud from water treatment
plants, landfills and projects in small and medium-sized agro-industrial firms, adding an
installed electrical capacity of 37.9 MW (CER, 2013). The emergence of a national biogas
industry is worth noting, with companies expanding the construction of projects using the
potential of farming waste, a significant productive sector.
As regards research and development, bioenergy is the area with the most research projects
(166 of the 257 initiatives identified); these are led by universities and technology centres
(Ministry of Energy, 2012). There is strong support for developing second-generation
biofuels, which do not compete with food. Two calls for proposals, in 2008 and 2009, resulted
in five biofuels partnerships researching and developing a great part of the biofuel value
chain, including the production of biomass (micro- and macro-algae, energy forestry) at lower
cost, biomass logistics and processes and technologies for producing biofuels and by-
products. Finally, the Fund for the Promotion of Scientific and Technological Development
(Fondef) set up a specific programme in 2010 for bioenergy research projects aimed at
increasing the competitiveness of bioenergy and the proportion of bioenergy in the energy
mix by addressing critical issues in the biofuel value chain (liquid, solid and gaseous).
b. Barriers to bioenergy growth
Despite the great potential and ongoing initiatives, there are still numerous barriers to the
efficient and sustainable development of bioenergy. These have been identified and
inventorised in recent years by the Ministry of Energy and the Renewable Energy Centre (see
Figure 6).
Figure 6: Main barriers to the development of bioenergy in Chile

112
c. Development opportunities
Even with the barriers described above, bioenergy is already an attractive alternative in
certain markets. It offers energy at competitive prices, the possibility of supplying energy
from native resources and opportunities for the development of local economies.
Given the potential impact or speed of implementation, the main development opportunities
are :
- Thermal use of biomass in industry and public buildings
Replacing fossil-fuel boilers with lignocellulosic biomass in SMEs is particularly attractive in
economic terms (see Chart 3), given Chile’s high oil and gas prices. Achieving significant
penetration of these technologies in the industrial/public/business sectors could create a
demand for biomass that boosts this market, structuring stable, safe and sustainable supply
chains.
Boiler type Size
(kW)
Replaced
fuel
Biomass
type
Investment
(USD)
Investment return
period
Residential
building heating 150 Natural gas Pellet 90 000 2.5 years
Hotel heating and
domestic hot water 300 Liquefied gas Pellet 160 000 1 year
Process steam 2 500 Diesel oil Chips 750 000 < 1 year
Chart 3: Economic evaluation of biomass boilers for thermal use
(Source: Universidad de Concepción, 2013)
The use of biomass in boilers can help significantly to relegate fossil fuels, because it
represents massive stable consumption throughout the year. Therefore, it can also help to
establish a stable, transparent and competitive biomass energy market.
- Promoting the development of biogas projects
Although locally the vast majority of biogas projects seem economically attractive in theory,
one of the main difficulties in implementation is the substrate owners’ unfamiliarity with
anaerobic digestion technologies. In addition, anaerobic biomass processing projects involve a
large number of players with various areas of expertise in the value chain, so business models
are generally complex.
Therefore, as Chile’s biogas industry is at an early stage of development, it is of the utmost
importance that projects be implemented that can serve as an example for future initiatives,
demonstrate an attractive economic return and have environmental or social benefits. Such
projects could involve reducing residual biomass for landfills, generating new jobs for an
equivalent installed capacity, selling or using by-products (heat and/or digestate), maintaining
public spaces (using the biomass they create) and using more energy-efficient technology.
- District heating as an alternative for improving air quality in saturated areas
One of the main biomass challenges facing Chile is reducing current negative impacts, mainly
in residential heating. Its traditional use as firewood has caused serious air pollution problems
in many cities in southern Chile. This has heightened the urgency of developing modern
systems such as district heating and improving insulation in new houses.

113
A new regulatory framework is needed to promote these projects and bring about the
improvements required to support widespread implementation. Also required are strong
efforts at regional level to incorporate such projects into regional development plans and
familiarise end users with the systems, as their involvement is crucial to sustainability.
5. CONCLUSIONS
Given Chile’s natural resources and the commercial availability of technologies, bioenergy is
an attractive option for diversifying the country’s energy mix and reducing its dependency on
imported fossil fuels. In addition, bioenergy has comparative advantages over other NCRE
sources, such as the variety of final uses of various biofuels, which differ from those of
electricity, and the positive impact of its development at local level.
Although bioenergy is an established part of Chile’s energy mix, particularly in the NCRE
market, greater penetration at primary level and in the electricity market depends on finding
efficient and sustainable alternatives for producing the diverse raw materials and using the
final energy.
The Ministry of Energy, the Renewable Energy Centre and other public agencies are making
great efforts – through promotion, capacity-building and establishing an appropriate
regulatory framework – to remove the barriers that have constrained this industry’s
development and allow it to really take off.
6. BIBLIOGRAPHY
- Ministry of Energy, 2012-30 National Energy Strategy, Santiago de Chile
www.minenergia.cl/estrategia-nacional-de-energia-2012.html
- Ministry of Energy, 2013, 2012 National Energy Balance, Santiago de Chile
www.minenergia.cl/documentos/balance-energetico.html
- Ministry of Energy, 2011, Advisory Commission for Electrical Development Report
(CADE), Santiago de Chile, www.minenergia.cl
- Renewable Energy Centre (CER), Electricity Market Report, Santiago de Chile
http://cer.gob.cl/en/sobre-las-ernc/datos-y-estadisticas/ and www.cer.gob.cl
- Universidad de Concepción, 2013, Recommendations for developing a National Bioenergy
Strategy, Technology Development Unit, Chile, www.minenergia.cl


115
Status of biofuels in Colombia
P.Gauthier-Maradei
INTERFASE, Chemical Engineering School
Industrial University of Santander (UIS)
Cra 27 Cll 9, Ciudad Universitaria
Bucaramanga (Colombia)
1. INTRODUCTION
In 2006, the Planning Unity for Mines and Energy (UPME) attached to the Ministry of Mines
and Energy of the Colombian Government elaborated the National Energy Plan in accordance
with the National Plan of Development. This Energy Plan describes the situation of Colombia
in the field of energy since 1990 and presents a prospective study on the energy development
of the country, taking into account economic variables, prices estimate of different energy
sources, production plans and government policies (UMPE, 2007).
The total energy production in Colombia has grown at an average rate of 3.5% between 1990
and 2005 but stayed stable after 1999. The growth was driven by a production increase in oil,
coal and natural gas while the other resources (hydro-energy, firewood, others) had a low
influence in the primary energy production. Figure 1 shows the 2006 primary energy matrix
for Colombia in which only 24% correspond to renewable energies (hydro-energy, bagasse
and firewood).
Figure 1: Primary energy matrix of Colombia
(2006 data, Source National Energy Plan, UMPE, 2007)
The primary energy consumption in Colombia was 297.487 Tcal in 2006, the main energy
resource consumed being oil (47%). However, since 1990, the oil contribution has decreased,
as well the use of firewood, due to an increase in the use of natural gas and LPG in rural and
peri-urban areas. The most important sector for energy consumption is the transport sector,
known also as the most important emitter of CO2 (IPCC, 2007). It uses at least 36.5% of the
primary energy, mainly from the oil resource. Industry is responsible for less than a third of
the final energy consumption in the country (second after the transport sector) supplied
mainly as natural gas (26.5%) and electricity (16.3%).
48%
21%
14%
7% 3%
6%
1%
oil natural gas hidroenergy firewood
Bagasse Mineral coal others
116
In Colombia, the perspectives of consumption of liquid fuels are oriented towards diesel with
a decrease of gasoline consumption. This is the result of the modification of the structural
characteristics of the Colombian economy that is associated with the transport of more people
and goods (and use of trucks).
The recent statistics about oil reserves and fuel production in Colombia, as well as the low
rate of new discovered oil wells, allow to predict an energy emergency in the next years. As
of 2012, Colombia had about 2 billion barrels of proven crude oil reserves, according to the
US Energy Information Administration (EIA, Country Analysis, 2012). However, the
National Hydrocarbons Agency has estimated in 2011 that this crude oil reserves allows the
self-sufficiency of the country for only the next 7 years (ANH, 2013). This is the reason for
which Colombia must develop its biofuel production by taking advantage of its conditions as
agro-industrial country.
2. FIRST GENERATION BIOFUELS
In Colombia, biofuels reach the domestic market thanks to the government policies (Laws
697/2001, 693/2001, 939/2004, 048/2005). The goal of these policies was to support the
production of biofuels and build biofuel plants competitive in the international market. The
bioethanol market began in 2002 thanks to the 2001 Law No.693 which requires the
mandatory utilization of gasoline-bioethanol blends. Since 2005, Colombia implemented the
use of 8% of bioethanol (E8). On the other hand, the 2004 Law 939 authorizes the use of B5
biodiesel blends in Colombia. Even if the use of B20 biodiesel blends was not possible as
initially planned, mainly due to the oil palm bud rot disease, Colombia is one of the countries
with the highest percentage fuel blends; B10 fuels being currently used both for gasoline and
diesel (Garcia-Romero et al., 2012).
According to UN FAO, in 2011, Colombia was the 12th
sugarcane producer and the 5th
oil
palm producer in the world (FAOSTAT, 2013). According to Fedebiocombustibles (2013), in
Colombia, in 2012, 5 bioethanol plants produced 362.14 million L/year of bioethanol and 2.19
million tons/year of sugar from 227.748 ha planted. The bioethanol produced is used
completely in Colombia and covers 70% of the local supply while for sugar, only 750
kton/year are exported. Fedecombustibles (2013) also presents the figures for biodiesel, with
7 plants located in Colombia producing a total of 490 kton/year of biodiesel (2013 data) from
452.435 ha planted with oil palm. In this case, the brut oil palm production is 973 kton/year.
Only 439 kton/year are used to produce biodiesel, while the rest are either being used in the
food industry or exported (18%).
According to these data, Colombia can be considered as a self-sufficient producer of 1st
generation biofuels. This biofuel market is assured only for maximum B10 mixing for
transport use and does not include other energy uses such as electrical supply, utility industrial
supply and others.
In addition, there is a lot of research oriented towards finding efficient native yeasts for the
fermentation step. Most industrial plants use European yeasts, which are problematic since
they lead to a constant technological dependence. Likewise, there are works investigating the
use of other biomass waste available in Colombia which has not been however valorized so
far with the goal to produce biofuel. This is the case for example of cassava and banana for
bioethanol and of castor and jatropha for biodiesel (Zumaché et al., 2009, Ruiz et al., 2011,
Sánchez et al., 2013, Peña-Serna et al., 2012, Salazar et al., 2012, Pedraza Sánchez et al.,
2010).

117
3. SECOND GENERATION BIOFUELS
According to Escalante et al. (2010), the Energy Potential (EP) of agro-industrial residues
biomass in Colombia is approximately of 331.645 TJ/year. This includes palm oil, sugarcane,
coffee, corn, rice and two species of banana. Approximately 215.647 TJ/year correspond to
palm oil and sugar cane.
Even if biomass residues can be used to produce biofuels, in Colombia, the greatest part of
sugarcane bagasse is used to produce electrical energy and steam for the bioethanol
production. Similarly, the other part of sugarcane residues, is used directly by the industry to
generate heat (Sánchez et al., 2013).
In the case of palm oil residues, two different residues are obtained: empty fruit bunch and
palm kernel shells. The shells are mostly sold to be used as fuel in boilers in order to produce
steam (i.e. in vegetable oil production for food). Empty fruit bunches does not has a particular
use and is generally disposed as fertilizer despite its high energy potential (HHV of 20.85
kJ/kg) (Escalante et al.).
Some studies have evaluated the possibility to use these agro-industrial residues to produce
more bioethanol in Colombia (Cardona et al., Quintero et al.). This transformation includes
pre-treatment methods, detoxification methods and biological processes. In the case of
bagasse, this residue has proven to be a feasible raw material for fuel ethanol production due
to its relative low lignin content and high production of sugars in the case of appropriate pre-
treatments. According to Quintero et al. (2013), the total cost calculated using Aspen
economic analyser to produce bioethanol from bagasse in Colombia is approximately 0.76
US$/L. This value can be reduced to 0.68 US$/L if the ethanol production is coupled with a
cogeneration system using the non-converted material. These results show the potential
interest of this option of biofuel production if compared with the recent price of gasoline in
Colombia (approximately 1.24 US$/L). However, there is not as this stage an industrial
development of second generation biofuels.
4. REFERENCES
- ANH-ACP, (Agencia Nacional de Hidrocarburos, Asociación Colombiana de
Pétroleos), 2013, Bogotá, Colombia, http://www.acp.com.co
- Cardona C.A., Quintero J.A, Paz I.C., 2010, Production of bioethanol from
sugarcane bagasse: Status and perspectives. Bioresource Technology. 2010; 101: 4754-
4766.
- EIA (Energy Information Administration), 2012, Country Analysis, Colombia, US
EIA, http://www.eia.gov/countries
- Escalante H., Orduz J., Zapata H., Cardona M., Duarte M., 2010, Atlas del
Potencial Energético de la Biomasa Residual en Colombia. Ediciones UIS.
- Fedebiocombustibles, 2013, Cifras Informativas del Sector Biocombustibles.
Etanol de Caña Anhidro, http://www.fedebiocombustibles.com
- Fedecombustibles, 2013, Cifras significativas del Sector Biocombustibles, biodiesel
de palma de aceite, http://www.fedebiocombustibles.com
- FAOSTAT, 2013, Food and Agriculture Organization of the United Nations,
Statistics, http://faostat.fao.org/site/339/default.aspx
- Garcia-Romero H. and Calderon-Etter L., 2012, Evaluación de la política de
biocombustibles en Colombia, http://www.asorinoquia.org/DPN/Evaluacion.pdf
- IPCC (Intergovernmental Panel on Climate change), 2007, 4th Assessment Report:
Climate Change, http://www.ipcc.ch/publications

118
- Pedraza Sánchez E., Cayón Salinas D., 2010, Morphophysiologial characterization
of Jatropha curcas L. variety Brazil in two areas of Colombia. Acta Agron. 2010; 59(1):
30-36.
- Peña-Serna C., Castro-Gil C., Peláez-Jaramillo C., 2012, Evaluation of ethanol
production from two recombinant and a commercial strains of Saccharomyce Cerevisiae
(fungi: Ascomycota) in sugarcane molasses and rejected banana juice from Urabá
(Antioquia), Colombia. Actu Biol. 2012; 34(96): 21-31.
- Quintero J.A., Moncada J., Cardona C.A., 2013, Techno-economic analysis of
bioethanol production from lignocellulosic residues in Colombia: A process simulation
approach. Bioresource Technology. 2013; 139: 300-307.
- Ruiz M., Sánchez C., Torres R., Molina D., 2011, Enzymatic hydrolysis of cassava
starch for production of bioethanol with a Colombian wild yeast strain. Journal of the
Brazilian Chemical Society. 2011; 22(12): 2337-2343.
- Salazar F., Cavazos J., Martínez J., 2012, Methodology based on the supply chain
operations reference model to analyze the production process of biodiesel from Castor
Oil Plant. Inf. Tecnol. 2012; 23(1): 47-56.
- Sánchez O., Cardona C., 2008, Trends in biotechnological production of fuel ethanol
from different feedstocks. Bioresource Technology. 2008; 99(13):5270-5295.
- Sánchez Castro Z., Gauthier-Maradei P., Escalante Hernandez H., 2013, Effect of
particle size and humidity on sugarcane bagasse combustion in a fixed bed furnace.
Rev.ION, 2013; 26(2): 73-85.
- UMPE (Unidad de Planeación Minero Energética), 2007, Boletín Estadístico de
Minas y Energía 2002-2007, Ministerio de Minas y Energía, Bogotá Colombia.
- UMPE (Unidad de Planeación Minero Energética), 2007, Plan Energético
Nacional, Contexto y Estrategias 2006-2025, Ministerio de Minas y Energía, Bogotá,
Colombia.
- Zumaqué L.O., Lara Mantilla C. and Mizger Pantoja M., 2009, Levaduras
autóctonas con capacidad fermentativa en la producción de etanol a partir de pulpa de
excedente de plátano Musa (AAB Simmonds) en el Departamento de Córdoba,
Colombia. Rev. Colomb. Biotecnol. 2009; 11(1): 40-47.

119
Costa Rican experience in the field of biofuels
for transport and bioenergy for heat or electricity
P. Orozco
Refinadora Costarricense de Petróleo S.A., Energy and Research Unit,
Postal Code No4351-1000, San José, Costa Rica
Summary
The objective of this paper is to provide information about the Costa Rican experience in the
production and consumption of biofuels and bioenergy for transport, heat or electricity. It also
provides an insight on the legislative framework for biofuels and the studies developed in this
country in order to assess GHG emissions from biofuels and bioenergy.
This paper has been prepared as complementary information for the Expert Consultation on
Green House Gases Emissions from Biofuels and Bioenergy, hosted by the Ministry of
Agriculture, Livestock and Fisheries of Argentina and the Joint Research Centre of the
European Commission, on March 2011 at Buenos Aires, Argentina.
Key words: Biofuels for transport, bioenergy for heat and electricity, assessment of GHG from
biofuels and bioenergy.
1. INTRODUCTION
The objective of this paper is to provide some information about the Costa Rican experience in
the production and consumption of biofuels and bioenergy for transport, heat or electricity. The
document has four sections: the first one presents an overview of the regulatory framework of
biofuels in Costa Rica, the second one introduces some facts about ethanol and biodiesel
production and development potentials, the third one highlights the main national experiences
on the use of biofuels and bioenergy and the fourth one contains some information about
theoretical assessments on GHG emissions from biodiesel and ethanol in Costa Rica.
1.1 Biofuels and bioenergy Legislative framework, perspectives and targets
The use of biofuels in Costa Rica is regulated by the Executive Decree No. 35091-MAG-
MINAET published on 17 March 2009 in the Official Journal. This Decree provides for the
development, production, transport, storage, distribution and marketing of biofuels (wholesale
and retail). According to this Decree the fossil fuels distributed within the country must be
mixed with oxygenated components such us biodiesel or bioethanol with the amount and
quality that the Executive Power will demand. The initial addition of biofuels to the fossil fuels
will range from 0%-8% (%V/V) in the case of the mixtures of ethanol and gasoline and from
0%-5% (%V/V), for mixtures of biodiesel and diesel.

120
According to the Decree No. 35091-MAG- MINAET, the Ministry of Environment, Energy
and Telecommunications (MINAET) had the responsibility to coordinate the actions that
needed to be taken by the different actors on biofuels chain in order to reach the goals proposed
by the Decree. Simultaneously, the Ministry of Agriculture and Livestock had the
responsibility to promote the agro-industial production of raw materials for biofuels
production.
The beginning of the implementation of the mixture of fossil fuels and biofuels was attributed
to the Costa Rican Petroleum Refinery (RECOPE), which is the State owned company in
charge of the monopoly of the importation, refining, mixing and wholesale distribution of
fossil fuels and its mixtures in the country. RECOPE, with the support of MINAET and MAG,
had to develop the infrastructure needed to guarantee the supply of biofuels and the
sustainability and profitability of the biofuels program and then propose the chronogram of
implementation of biofuels.
Despite the Decree was promulgated in 2009, the leadership of the Ministries and Public
Enterprises responsible for the implementation of the national biofuels program has been very
weak and it has not had the effect intended. Currently, in 2014, Costa Rica is using ethanol in a
very reduced percentage in one of its seven provinces and biodiesel usage is relegated to a few
producers that make it for self-consumption.
The fact is that the government hasn’t found yet the means to acquire or produce biofuels
whose prices be the same or less than the fossil fuels they will replace, and there is not either a
political commitment to produce biofuels that may have a higher cost than fossil fuels.
After the arrival of the new government, productive sectors have seen a new opportunity for
the development of the biofuels industry and have started to push to transform this Decree into
a mandatory Law. In such a way that the Ministries, the public enterprises and the government
itself will not have any other option than accomplishing the targets stated in the law.
Due to the inherence of RECOPE, MAG and several public universities there is a biofuels law
project currently going through discussions in the Legislative Assembly. This law project has
the objective to empower some investments from public entities that today have no legal base.
In the case of bioenergy for heat and electricity, Costa Rica does not have any specific
regulation or target, although the Costa Rican Electricity Institute (ICE) has a pilot project for
distributed generation of electricity for auto consumption which objective is to study new
power generation technologies at the same time that the effects of distributed generation over
the existent network are determined. This pilot plan covers sources of power as: biomass, wind,
sun, hydro, and cogeneration of heat and electricity. Till October 2013, ICE had approximately
600.975 kW of renewable energies, small projects interconnected to its network.
2. POTENTIAL SUPPLY OF BIOFUELS AND BIOMASS
2.1 Biodiesel potential production
2.1.1 Crops
Despite the fact that Costa Rica has a natural potential to grow several oil crops; the only crop
that is presently developed at an industrial scale is oil palm. According to the National
Association of Palm Oil Producers (CANAPALMA) by 2010 Costa Rica has 64 000 hectares

121
planted with oil palm in hands of more than 2500 producers1. 68 % of these plantations are
located in the South Pacific region of the country, 27% in the Central Pacific region and 5% on
the North Atlantic region.
The plantations reach peak production at the eighth year with an average yield of 20-26 metric
tons of fruit per hectare per year. This yield of fruit per hectare allows obtaining around 4
metric tons of oil per hectare per year2.
Considering the actual conditions of the plantations the maximum national production of palm
oil could reach 220 000 tons of oil per year. The local market consumes around 35% of the oil
production (143 000 metric tons approximately) and the rest is exported to Mexico. The
amount of oil that the country is currently exporting would be enough to produce 2 800 barrels
of biodiesel per day, which today will represent more than 15% of the transport diesel
consumption. Besides, a study from FAO3 indicates that the country has around 800 000
hectares of land with good or moderate aptitude to grow oil palm.
2.1.2 Palm oil extraction
By 2014, the country has six oil extraction complexes, 3 in the South Pacific Region, 2 in the
Central Pacific and 1 in the Atlantic Region, with a total capacity of 210 metric tons per hour
(1.663.200 metric tons per year). It should be noted that the oil production in the country is
limited by the extent of the plantations and not by the extraction capacity 4. In the prior section
it was pointed out that excluding the national consumption of palm oil, the country might have
enough oil to produce a B15, nevertheless this has not been possible because the prices of the
oil expected by the extractors, equivalent to CIF Rotterdam, would not allow RECOPE or any
other actor to produce a biodiesel with a price similar to fossil diesel.
2.1.3 Biodiesel plants
Costa Rica has presently an installed capacity to produce 2000 barrels of biodiesel per day
4. At
the present stage, this would correspond to enough biodiesel to reach a B10 in transport diesel.
Despite of this, the actual capacity of biodiesel production isn’t fully exploited due to the high
cost of raw materials (mainly palm oil). Taking into account the situation described in the
previous paragraphs it appears that the main obstacle to biodiesel mixture implementation in
Costa Rica is the barrier of costs.
2.2 Ethanol
2.2.1 Crops
Costa Rica has an agricultural potential to grow several crops for ethanol production such as
sugar cane, sorghum and cassava. Nevertheless, only sugar cane has been developed to an
industrial scale for ethanol production.
1 Ministerio de Agricultura y Ganadería “Boletín Estadístico Agropecuario No. 20: Serie Cronológica 2006-2009
2 Roldán, C.; Estudio a nivel de perfil de una planta de extracción de aceite y producción de biodiesel con posible
integración vertical con la refinería en Moín. RECOPE S.A. 2011. 3Roldán, C.; Análisis de precios de indiferencia y prefactibilidad técnico-económica del Biodiesel a partir de Palma
Aceitera. FAO, 2007. 4 O. Vega y otros, “Atlas de la Agroenergía y los biocombustibles en las Américas”, IICA 2010.

122
In the period 2006-2013, the hectares grown with sugar cane account 53 000–56 000. There
has not been a significant increase in the area planted with sugar cane in the past few years.
Unlike palm oil, there are not recent studies showing the potential to further develop sugarcane
crops in the country. It is necessary to point out that most of the production of sugarcane in the
country is used mainly to produce sugar and not ethanol.
2.2.2 Ethanol production
There are three main producers of ethanol in Costa Rica:
- CATSA, a distillery with capacity to produce 240.000 liters per day of ethanol, located in
Guanacaste.
- Taboga, a distillery with capacity to produce and dehydrate 340.000 liters of ethanol per day,
located also in Guanacaste.
- LAICA, a dehydration and rectification plant with capacity to produce 630.000 liters of
anhydrous ethanol per day, located in Puntarenas, which isn’t currently operating due to an
imposition of a 2,5% tax over imports from the US.
According to CATSA and Taboga, during 2012-2013, the ethanol production was of 31 million
of liters, all of it was obtained from molasses. About 2 million liters of this ethanol is used for
human consumption and the rest is exported to Europe. The amount of ethanol actually
exported to Europe represents the ethanol that Costa Rica may possibly be able to use on its
own internal market of biofuels. These 29 million of liters of ethanol will approximately allow
producing and distributing an E3 blend within the country. This might require some
investments on the national fuels distribution system in order to create the capacities required.
3. EXPERIENCE IN THE FIELD OF BIOFUELS FOR TRANSPORT AND
BIOENERGY FOR HEAT OR ELECTRICITY
3.1 Biodiesel
The present use of biodiesel is restricted to self producers and to some enterprises which use
used cooking oil as raw material and sell the biodiesel to bus companies. Bus companies
prepare their own mixes of diesel and biodiesel up to B30. According to RECOPE´s
knowledge of the quality of the biodiesel produced by the present producers within Costa Rica,
none of them achieve the quality required by the corresponding Centroamerican Technical
Regulations (RTCA 75.02.43:06).
3.2 Ethanol
The present use of ethanol in Costa Rica is restricted to the North Pacific Region and it only
refers to one of the two types of gasoline (¨Gasoline Plus 91¨) distributed in the country. The
mixing of “Gasoline Plus 91” with ethanol was started by RECOPE in 2006 as a demonstration
project. The aim of this project was to test operations, logistics and impact of the
implementation of the blending of gasoline and ethanol in this region and then, gradually
expand the operation to the rest of the country. Despite the fact that the demonstration project
in the North Pacific Region is still operating, the expansion to the rest of the country hasn’t
been possible due to several factors such as: prices issues and coordination between national
authorities.
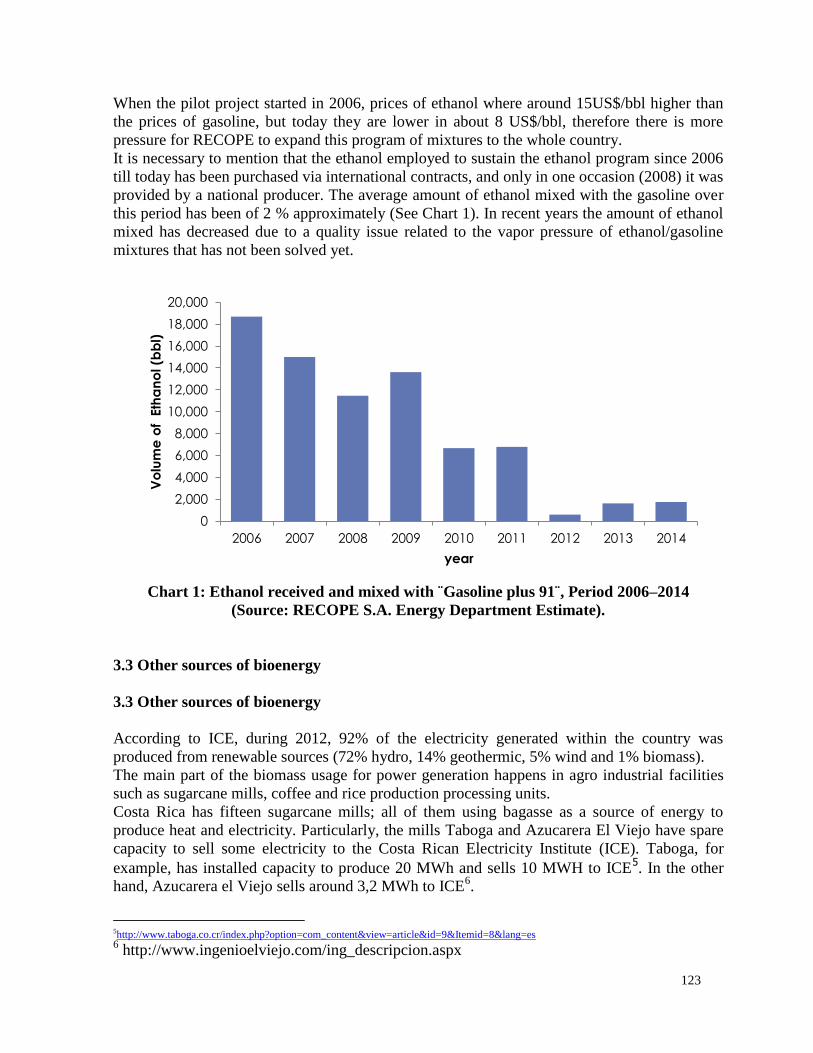
123
When the pilot project started in 2006, prices of ethanol where around 15US$/bbl higher than
the prices of gasoline, but today they are lower in about 8 US$/bbl, therefore there is more
pressure for RECOPE to expand this program of mixtures to the whole country.
It is necessary to mention that the ethanol employed to sustain the ethanol program since 2006
till today has been purchased via international contracts, and only in one occasion (2008) it was
provided by a national producer. The average amount of ethanol mixed with the gasoline over
this period has been of 2 % approximately (See Chart 1). In recent years the amount of ethanol
mixed has decreased due to a quality issue related to the vapor pressure of ethanol/gasoline
mixtures that has not been solved yet.
Chart 1: Ethanol received and mixed with ¨Gasoline plus 91¨, Period 2006–2014
(Source: RECOPE S.A. Energy Department Estimate).
3.3 Other sources of bioenergy
3.3 Other sources of bioenergy
According to ICE, during 2012, 92% of the electricity generated within the country was
produced from renewable sources (72% hydro, 14% geothermic, 5% wind and 1% biomass).
The main part of the biomass usage for power generation happens in agro industrial facilities
such as sugarcane mills, coffee and rice production processing units.
Costa Rica has fifteen sugarcane mills; all of them using bagasse as a source of energy to
produce heat and electricity. Particularly, the mills Taboga and Azucarera El Viejo have spare
capacity to sell some electricity to the Costa Rican Electricity Institute (ICE). Taboga, for
example, has installed capacity to produce 20 MWh and sells 10 MWH to ICE5. In the other
hand, Azucarera el Viejo sells around 3,2 MWh to ICE6.
5http://www.taboga.co.cr/index.php?option=com_content&view=article&id=9&Itemid=8&lang=es 6 http://www.ingenioelviejo.com/ing_descripcion.aspx
0
2,000
4,000
6,000
8,000
10,000
12,000
14,000
16,000
18,000
20,000
2006 2007 2008 2009 2010 2011 2012 2013 2014
Vo
lum
e o
f E
tha
no
l (b
bl)
year

124
In the field of rice production, Arrocera El Pelón de la Bajura, has its own biomass plant to
produce energy out of rice husks, with a nominal capacity of 1.500kWh, which is enough to
cover the whole energy needs of the rice processing. Arrocera El Pelón de la Bajura has
recently certified its process as carbon neutral under INTE ISO 14064 standard7.
There are as well some experiences on coffee processes employing coffee husks to produce
electricity. Cooperativa de Caficultores de Dota (Coopedota), recently was certified as a
carbon neutral company by Carbon Clear and the British Standards Institution. Coopedota
produces presently around 50% of its electricity with coffee husks8 .
Costa Rica also has had an experience on electricity generation using landfill gas. ICE group is
currently operating a thermoelectric plant on Rio Azul Landfill. Rio Azul Landfill started its
operations in 1972 and was closed in 2005. During its operation, the landfill wasn’t optimally
managed and therefore the actual electricity production of the project is lower than expected.
The thermoelectric plant on Rio Azul had and installed capacity to produce 3.5 MW but its
operating near to a 25% of its capacity9.
On the other hand, biomass is also used for heat generation, as wood, for domestic use. Global
biomass use accounts for 19%, wood representing approximately 50% of biomass use.
4. STUDIES OF REFERENCE IN THE FIELD OF ASSESSMENT OF GHG
EMISSIONS FROM BIOFUELS AND BIOENERGY
Table 1 shows some estimates about carbon prints from biofuels (ethanol and biodiesel) made
with different feedstock.
It appears that ethanol produced from sugarcane generates the lowest amount GHG emissions
between the feedstock that have been considered for the production of ethanol in Costa Rica.
On the other hand, jatropha production has the lowest GHG emissions between the feedstock
considered for biodiesel.
Some further estimates were made to compare GHG emissions of the gasoline (production and
consumption) equivalent to the amount of ethanol produced by one hectare of sorghum,
sugarcane and cassava. The results show reductions of 4000 kgCO2e and 8038 kgCO2e per
hectare for sorghum and sugarcane, respectively. In the case of cassava, there is a net
increment of emissions of almost 4000 kg of CO2e per hectare.
There are not available comparisons in the case of diesel and biodiesel.
7 http://tiopelon.cr/index-4.html
8 http://reddccadgiz.org/noticia.php?id=20 9 http://wvw.nacion.com/ln_ee/2007/agosto/17/pais1207232.html

125
GHG Emissions Carbon Print in Ethanol
Production
Carbon Print in Biodiesel
Production
Sorghum Sugarcane Cassava Palm Jatropha Castor oil
Total, kg CO2e /hectare 516 994 11908 988 488 735
Total, kg CO2e /liter 0.184 0.178 2.205 0.198 0.163 0.408
Productive process: Fuels, % 35 31 2 9 28 25
Productive Process: Fertilizers, % 55 64 3 80 55 65
Transport, % 10 5 0 5 10 7
Industrial process, % 0 0 95 6 7 3
Crops Energy Efficiency in Ethanol
Production
Energy Efficiency in biodiesel
production
Sorghum Sugarcane Cassava Palm Jatropha Castor oil
Energy consumption, MJ 9056 18071 165042 19248 8574 13423
Energy produced, MJ 75600 151200 145800 118800 71280 42768
Eficiency (Ep/Ec) 8.35 8.37 0.88 6.17 8.31 3.19
Table 1: Carbon print estimates for ethanol and biodiesel
production from different feedstock.
(Source IMN, 2007)
5. CONCLUSIONS
The use of biofuels in Costa Rica is presently regulated by the Executive Decree No. 35091-
MAG-MINAET. This Decree establishes that the fossil fuels distributed within the country
must be mixed with oxygenated components such us biodiesel or bioethanol within the amount
and quality that the Executive Power will demand. The initial addition of biofuels to the fossil
fuels will range from 0%-8% (%V/V) in the case of the mixtures of ethanol and gasoline and
from 0%-5% (%V/V), for mixtures of biodiesel and diesel.
Despite the Decree was promulgated in 2009, the leadership of the Ministries and Public
Enterprises responsible for the implementation of the national biofuels program has been weak
and it has not had the effect intended. Currently, in 2014, Costa Rica is using ethanol in a very
reduced percentage in one of its seven provinces and biodiesel usage is relegated to a few
producers that make it for self consumption.
Actually there is a biofuels law project currently going through discussions in the Legislative
Assembly so the goals that were established in the Decree mentioned above will become
mandatory. This law project has the objective to empower some investments from public
entities that today have no legal base.
The country does not have any regulation regarding the use of biomass for heat and electricity.
The main biofuels to be used within Costa Rica at short term are ethanol from sugarcane and
biodiesel form palm oil. At the present stage, the country exports enough palm oil to reach a
B15 on diesel for transport. Despite of this; biodiesel is not produced due to cost issues.
In the case of ethanol, the country produces enough ethanol from molasses to have an E3 mix
on gasoline all over the country, but right now the mixtures are limited to the North Pacific
region of the country due to lacking coordination between sectors and infrastructure
development.
126
The main experiences on biofuels use in the country come from the implementation of ethanol
blends with gasoline in the North Pacific region since 2006, handling an average E3 mixture.
The Executive Power, through MINAET is coordinating the energy sector stakeholders to
increase the ethanol mixture percentage in the North Pacific Region to later extend the program
to the whole national territory. Biodiesel is also used in some buses fleets and by self
consumers.
Regarding the biomass use for electricity and heat generation, the country has had some
experiences in sugar mills with cogeneration, the use of rice husks to produce electricity for
rice processing, the use of coffee husks to produce electricity for coffee processing, electricity
generation from landfill gas and the domestic use of wood for heat generation.
6. REFERENCES
- IMN (Instituto Meteorológico Nacional), 2007, Huella de carbono y eficiencia energética de
los biocombustibles, November 2007.
- MIDEPLAN, 2010, Plan Nacional de Desarrollo 2011-2014 “María Teresa Obregón
Zamora”. Gobierno de Costa Rica, December 2010
- MINAET, 2008ª, Programa Nacional de Biocombustibles. Coordinador: Ministerio del
Ambiente, Energía y Telecomunicaciones, Participantes: Ministerio de Agricultura y
Ganadería, Comisión Nacional de Biocombustibles, RECOPE, ARESEP.
- Ministerio de Agricultura y Ganadería; Boletín Estadístico Agropecuario No.20: Serie
Cronológica 2006-2009.
- Poder Ejecutivo, 2009, Decreto No. 35091-MAG-MINAET Reglamento de Biocombustibles.
- Roldán C., Estudio a nivel de perfil de una planta de extracción de aceite y producción de
biodiesel con posible integración vertical con la refinería en Moín. RECOPE S.A. 2011.
- Roldán, C., Análisis de precios de indiferencia y prefactibilidad técnico-económica del
Biodiesel a partir de Palma Aceitera, FAO, 2007.
- Vega O. et al., Atlas de la Agroenergía y los biocombustibles en las Américas, IICA. 2010.

127
Biofuels in Mexico: challenges for sustainable production and use
A. Flores Montalvo
INE-Instituto Nacional de Ecología
Periférico Sur 5000, Col. Insurgentes Cuicuilco, 04530 México D.F., México
Summary
This paper presents a discussion on the debate over the potential development of a biofuel
industry in Mexico, which has taken place particularly over the last three years. The main
argument for promoting biofuel production in Mexico has been the potential increase in jobs and
the potential income creation for the agricultural sector, which are important for economic and
social reasons. It has also been argued that biofuels offer environmental benefits in comparison
with fossil fuels, including fewer greenhouse gas (GHG) emissions. However, there are several
instances in which this has been proven not to be the case, and environmental authorities have
issued a strong word of caution in this respect, promoting the application of environmental
criteria to the production and use of biofuels, instead. Concerns from the energy sector include
fuel quality and whether supplies can be guaranteed to allow for the use of certain amounts of
biofuel in the transportation fuel mix. Mexico is an oil producer and exporter, so concerns over
energy security that would support greater use of biofuels have not been prominent to date,
despite the decline in fossil fuel production. In any case, policies and regulations have been
introduced to promote the production and use of bioenergy in Mexico, following international
trends, although these have not been fully implemented, given the concerns and the technical
limitations that exist. The particular conditions and circumstances in Mexico should determine
what solutions it puts in place. These solutions should address stakeholder concerns and try to
achieve sustainability.
1. INTRODUCTION
This paper aims to discuss some of the issues that have been raised in the recent debate over
whether to go ahead with more aggressive policies to promote the production and use of biofuels
in Mexico. The main arguments have come from:
- the agricultural sector, who are in favour of substantially increasing biofuel production and use
to promote more favourable conditions for farmers and to improve employment in rural areas;
- the energy sector, who are concerned about the limited biofuel production potential in Mexico,
securing fuel supplies and the quality of products to be commercialised;
- the environmental sector, worried about minimising the environmental impacts of biofuel
production and use, and looking for ways to take advantage of the potential environmental
benefits of this technology.
At the core of the issue, there is the fact that Mexico is an oil producer and exporter, so one of
the traditional arguments in favour of biofuels —energy security — has had practically no
relevance in this debate. Biofuels in Mexico have mainly been promoted because they are seen as
a potential source of employment and a potential provider of a higher income for the agricultural
128
sector. Agriculture has historically been an important part of the Mexican economy, and has also
been a major factor in ensuring social stability, which underlines the importance of the sector.
The country’s economic and social development is a priority for policymakers, and having both a
sound agricultural sector and a strong energy sector are fundamental to achieving this. The
Mexican energy sector mainly comprises the activities of the oil (and other fossil fuel) industry
and the electricity industry. Both these industries are mostly state-owned, although private sector
participation, including from international firms, has been allowed for some specific activities
within these sectors, especially over the last decade.
Currently, Mexico is the tenth largest producer of energy in the world, providing roughly 2 % of
energy worldwide. It is a net exporter of energy, and is the 15th largest energy consumer,
accounting for 1.4 % of total worldwide consumption. Hydrocarbons account for around 90 % of
all sources of primary energy production. Of these, crude oil accounts for almost 61.5 % of the
total primary energy production, followed by natural gas, which contributes around 28.2 %. Coal
accounts for an additional 2.2 % of all primary energy produced in Mexico, and has lost relative
importance in recent years, due to a decrease in the production of coal for thermal industrial
processes, particularly for the steel industry. The remaining energy produced comes from other
sources, such as fuel oil (SENER, 2010).
Mexico is important for international energy markets for two main reasons: it is a large producer
and exporter of oil (although production is declining), and it is believed to have relatively large
reserves of natural gas, although it currently is a net importer of natural gas. Use of these
resources has played an important role in Mexico’s economic development and will, in all
likelihood, continue to be crucial for its future.
2. CURRENT USE OF BIOFUELS IN MEXICO
Mexico has a relatively small biofuels industry, and it is only recently that several projects have
been launched to produce feedstocks and to build biorefineries. Around 45 million litres (Masera
et al., 2005) of ethanol is produced annually, mainly from sugarcane. This is used mostly as an
input in the pharmaceutical and chemical industry and in the food and drinks industry, and is also
used — to a very limited extent — as a transportation fuel. The country is not self-sufficient in
ethanol. It needs 164 million litres of ethanol per year and, consequently, imports about 119
million litres annually, mainly from Brazil, the United States and Cuba.
Domestic consumption of ethanol has increased steadily, which could create an incentive to
increase production in sugar refineries domestically (Bravo, 2006). If sufficient production of
ethanol was guaranteed, it could be used as a substitute for at least part of the metil-terbutil-eter
currently widely used as a fuel oxigenant in Mexico. The main question is whether there would
be sufficient land available to produce the feedstocks for ethanol without jeopardising food
production or inducing land use changes that would lead to deforestation. In addition, current
sugarcane prices and a very precarious sugar refining industry are not conducive for a switch to
ethanol production.
Mexico has also considered other possible feedstock categories for ethanol, like maize and
sorghum, of which Mexico is a large producer. In the case of maize, regulations are very clear
that ethanol production from this grain is not allowed unless there is a surplus in production. The
law is not specific on whether this requirement refers to an overall surplus at national level,
although it is widely interpreted that this is its intent. Nevertheless, interpreting the law to their
advantage, some states that have an overabundance in maize production have used some of their
surplus for ethanol production and promoted investment in refineries that produce ethanol from
maize, even when the country as a whole is not self-sufficient and is relying on imports.

129
Maize is of particular value for Mexicans, culturally and historically, so its use as an input for
fuel will probably always be controversial, regardless of the potential economic and
environmental sense of such a use. Sorghum, on the other hand, is a feedstock worth considering
in Mexico, as the country produces significant amounts of this grain, although currently not of
the particular species required to produce bio-ethanol.
Biodiesel production in Mexico is very limited, in the order of 190 barrels per day (SENER,
2009), and is scattered around the country in small-scale plants using crops or various sorts of
wastes. Use of jatropha curcas has been studied and tested in some projects and is believed to
have great potential, particularly in arid areas of Mexico where it would not compete with
agriculture for land or water (Castellanos et al., 2010). There has been significant disagreement
on whether biofuel from this crop would make economic sense in Mexico without being
subsidised, and this issue has not been resolved, since figures from the various pilot and incipient
projects differ greatly.
In addition to ethanol and biodiesel, other biomass products that could qualify as biofuels (such
as sugar bagasse, organic sediments, and residues from alcohol distillation) are also being used in
Mexico, but the scale of use is not well documented and is probably not significant.
The authorities are evaluating various scenarios exploring prospects and targets for the biofuel
industry, taking into consideration national circumstances, current and potential production
capacity, current and projected demand, and sustainability criteria, among other factors. The
Ministry of Energy carried out an analysis which sets out three possible scenarios for the
introduction of bio-ethanol (SENER, 2006). The most conservative of the three scenarios
proposes the introduction of bio-ethanol as an additive to gasoline in the three major
metropolitan areas of the country: Mexico City, Guadalajara and Monterrey. The intermediate
one considers the introduction of a 2 % mix in gasoline throughout the country. The third
scenario, the most aggressive, considers a mix of 10 % bio-ethanol in gasoline throughout
Mexico.
A pilot project was proposed to test the technical and economic feasibility of at least the most
conservative scenario. An initial pilot project would provide limited distribution of a 2 % mix of
bio-ethanol in gasoline in a specific municipality in the suburbs of Monterrey, followed by a
much larger pilot project distributing the mix across the entire metropolitan area of Guadalajara.
The first pilot went relatively well, but there was no way to satisfy the demand for the second
pilot project, which required a guaranteed supply of much larger amounts of bio-ethanol,
domestically produced using national inputs (a requirement set by the agricultural sector).
PEMEX, the state-owned national entity responsible for supplying fuel in Mexico, ended up
indefinitely postponing the plan to introduce a 2 % mix of bio-ethanol in Guadalajara, as they
have no guarantee of national suppliers for the necessary amount of biofuel.
The Guadalajara pilot was seen as a crucial step to test the capacity of the domestic agricultural
sector to provide the necessary amounts of feedstocks to produce enough biofuels to satisfy at
least the need for a 2 % mix in gasoline at national level. It would also have been important for
clarifying some doubts over vehicle performance using a mix of bio-ethanol under national
conditions and answering other technical questions, mainly posed by PEMEX. Environmental
authorities were also concerned about how to measure atmospheric emissions and the energy
balance of these fuels in practice. However, the supply of ethanol was not guaranteed and it did
not make any sense to import it, since the fundamental reason to promote its use in Mexico was
to economically stimulate the rural sector and particularly, in the case of bio-ethanol, the sugar
industry.
In conclusion, as has been indicated above and as will be further explored in the rest of this
paper, there are still several challenges and barriers to biofuel production and use in Mexico. It is
believed that these could, however, be overcome and that domestic production has the potential

130
to increase significantly in the near future, taking advantage of national characteristics and
strengths (SENER, 2006).
3. LEGAL FRAMEWORK
There has been increasing interest in exploring the potential benefits of large-scale production of
biofuels in Mexico, particularly from farmers, the sugar industry and investors. This has brought
authorities from different areas of the federal government together to:
- try to prevent interested parties from taking any steps further on this matter without the proper
institutional and legal framework to regulate the nascent biofuels industry;
- coordinate government activities in support of this industry, particularly as concerns started to
grow and the public sector was worried that the industry might do things improperly.
Congress shared this concern and, in February 2008, they published the main legal instrument to
date on regulating biofuels in Mexico, the federal Law for the Promotion and Development of
Bioenergy. This legal instrument sets out the design and implementation of two specific federal
government programmes:
- the programme for the introduction, design and implementation of bioenergy which would be
coordinated by the Ministry of Energy;
- the programme for the sustainable production of inputs for bioenergy, which would be
coordinated by the Ministry of Agriculture, Cattle, Fisheries and Food.
In addition to these two programmes, the law gave the Ministry of Environment and Natural
Resources responsibility for developing a set of sustainability criteria to be applied both to the
production of inputs and to the production and use of bioenergy (DOF, 2008).
The law identified a division of tasks. The programme for the introduction of bioenergetics was
intended to identify concrete actions to integrate the energy sector with the providers of inputs
for bioenergy in the agricultural and cattle raising sectors, with a view to promoting links
between the public, social and private sector spheres. This would increase the likelihood of
sustainable production, with particular attention being paid to not threatening national food
security in any way (SENER, 2009). The programme’s objective is to provide certainty for the
development of a biofuels production and consumption chain that is integrated and competitive,
making biofuels a viable option for the transportation sector. Specific activities within this
programme include:
- promoting research and development;
- creating clusters of mid- and medium-scale firms in the sector;
- drafting quality standards;
- applying sustainability criteria, which were to be developed by the Ministry of Environment
and Natural Resources.
The programme for the sustainable production of inputs for bioenergy has the objective of
promoting the production and commercialisation of inputs for bioenergetics to farmers, aiming to
improve productivity and increase profitability, especially in the poorest rural areas in the
country (SAGARPA, 2009). To achieve this, the programme included activities such as: -
promoting scientific and technological development;
- developing and implementing integrated technology-intensive strategies that take account of
sustainability criteria;
- promoting producers’ associations, which should result in stable and well-paid employment
opportunities that will help transform rural areas in Mexico.
In 2008, the Federation set up an institutional arrangement at the highest levels of decision-
making to provide coherence to the instruments mandated by the law and to implement other
initiatives that were put together by the government. This is called the Inter-ministerial
Commission for Bioenergy, and its core members are the Ministry of Finance; the Ministry of

131
Economy, the Ministry of Agriculture, Cattle Raising, Fisheries and Food, the Ministry of
Energy, and the Ministry of the Environment and Natural Resources. They meet regularly to
assess progress in implementing the two programmes described above, and to give direction on
everything in the field of bioenergy that is legally the responsibility of the federal government.
The Inter-ministerial Commission for Bioenergy agreed on an inter-ministerial strategy for
bioenergetics, which was drafted to create a conceptual framework for the implementation of the
two programmes required by the law, but which could also serve as the basis for other policies
that were deemed necessary in order to guarantee the sustainable production and use of
bioenergy in Mexico. The strategy focuses particularly on liquid biofuels, and indicates some of
the general social, economic, energy-related and environmental elements and criteria to be
considered when promoting liquid biofuels in Mexico. The strategy identifies the following focal
areas:
- development of short- and medium-term concrete measures to be taken by the public sector, by
bodies in the three levels of government (federal, state and municipal), and by the private sector;
- design of guidelines for their application in areas relating to production, processing,
distribution and use of bioenergy;
- capacity building on issues such as knowledge management, information sharing, technological
integration, production chains, and resources and restrictions for the development of this
industry.
Further detail is given in the next section on the environmental and sustainability criteria that the
Ministry of the Environment and Natural Resources has proposed, as required by legislation and
by the different programmes in place.
4. ENVIRONMENTAL CONCERNS
The Mexican environmental authorities consider that biofuel production and use can be
promoted, provided that these are carried out in a sustainable manner. They have produced a set
of guidelines on promoting biofuel production and use appropriately, which will ensure the
protection of the environment during the production of raw materials and the development and
use of biofuels, while encouraging consideration of social and environmental issues.
With this objective in mind, sustainability and environmental protection criteria have been
proposed to cover the entire product cycle, from the production of feedstock to the use of
biofuels. These criteria are intended to serve as guidelines for promoting and developing biofuels
in Mexico. According to environmental authorities, these criteria should be considered one of the
core tools for preventing and mitigating possible harm to diverse ecosystems and to plant and
animal habitats, taking a preventive approach that would offer certainty for the development of
projects to produce raw materials and to produce and use biofuels.
The most significant environmental criteria, considered at the different stages of biofuel
production and use in Mexico, are set out below. They relate to several concerns that have arisen
from the public debate about biofuels, among which the most prevalent are the competition for
land, potential degradation of natural ecosystems and resources (including deforestation),
competition for water, and atmospheric emissions, particularly GHG emissions.
4.1 Land use
Mexican environmental authorities have decided that crops intended for producing biofuels
should be developed in zones destined solely for agricultural and livestock use, those that have
low profitability, or those located in deserted or marginal land. Biofuel crop production must not
cause deforestation or cause any disturbance to the natural vegetation cover, including forests,
grasslands, shrub lands, or any other type of vegetation and ecosystem.
132
Land use must not be changed from forest to agricultural use to produce biofuel raw materials, as
set out in the Law for the Promotion and Development of Bioenergy, approved by Congress.
Geographical regions with a natural vocation must not be used for creating farming zones for
biofuel production, in order to avoid erosion and land degradation.
Indirect land use changes were not mentioned explicitly in the law, but the environmental criteria
proposed by the Ministry of the Environment and Natural Resources took these into account.
4.2 Biodiversity
According to the criteria proposed, farming zones for the production of biofuels must not be
created in natural protected areas or in any area that is part of a federal, state, or municipal
conservation scheme, since there would be a high risk of deforestation, pollution, and the
introduction of invasive species, among other potential environmental problems for existing
ecosystems and habitats.
According to the General Law for Ecological Balance and Environmental Protection (which is
the main piece of environmental legislation in Mexico) (DOF, 2011), agricultural activities
carried out within what the Law defines as ‘sustainable use sub-zones’ should be of low impact
and consistent with any conservation activities taking place in those areas. Intensive farming for
large-scale production of biofuel raw materials cannot be developed in a natural protected area.
Farming for the production of biofuels must not take place in areas where the climatic and
biophysical conditions are unfavourable for their development, stressing habitats and ecosystems
due to the increased demand for natural resources such as water and fertile soils. Crop species
must also not be cultivated if they do not suit the area in which they would be planted.
Biodiversity conservation and the improvement of the quality of natural resources must be
promoted through sustainable use. For this, an analysis must be carried out, prior to sowing crops
for biofuels, of any potential environmental impacts on ecosystem diversity and on animal and
plant habitats. Conservation in areas of biofuel crop production is a top priority in areas in which
endemic flora and fauna species are endangered, near extinction, or subject to special protection.
Sustainable production of any raw material for biofuels depends on good agricultural and
environmental practices. Therefore, one of the proposed criteria relies on an integrative
assessment of the crop species to be used, taking into account the production lifecycle and the
use and disposal of waste. This will help promote the use of raw materials from species that can
be produced in a sustainable manner in any given region of Mexico.
The use of genetically modified crops must comply with all the criteria and rules set out in the
Law for Biosecurity relating to Genetically Modified Organisms and the related regulations
(DOF, 2005). The use of biotechnology may be promoted to improve the efficiency of biofuel
production, for example, by using lignin regulation in the cellulose biosynthesis process. The use
of genetically modified crops is not allowed in the production of biofuels if the genetic
modification could alter the nutritional properties of the crop in question.
Species destined for use in biofuel production must be monitored and controlled to avoid
introducing invasive species that could threaten ecosystems. This is to avoid ecological
imbalance among wildlife populations, changes in species composition and changes in the
trophic structure, displacement of native species, biodiversity loss, and the spread of a number of
diseases such as agricultural and forest pests.
4.3 Water use
When analysing the feasibility of the establishment of biofuel crop production projects, water
availability must be considered, with a view to avoiding developing these projects in areas with
limited water availability or where watersheds are overexploited.
133
Water availability for human consumption must not be threatened or compromised due to water
use in activities relating to biofuel production, and measures must be established to promote the
efficient use, treatment, and recycling of water.
Water is undoubtedly the limiting factor for several activities in Mexico, including agriculture.
Scarcity problems have been frequent, particularly in the central and northern parts of the
country, where most of the population lives and where most of Mexico’s GDP is generated from
activity such as industry, services and agriculture, which have a high demand for water. Under
most climate change scenarios, water scarcity in these areas will increase, as the hydrological
cycle intensifies and the country experiences more frequent droughts and floods, and issues with
water quality.
4.4 Carbon footprint and atmospheric emissions
Prior to launching any project to produce biofuel raw materials, the environmental potential of
the relevant agricultural area needs to be assessed and the potential for using that land to
cultivate the crop in question needs to be evaluated, indicating characteristics such as: climate
(water deficit, flooding, or excess water); and soil (effective soil depth, depth of the waterbed
surface, stoniness, salinity, and type of soil).
The Ministry of the Environment and Natural Resources’ preferred option is for the Ministry of
Agriculture, Cattle Raising, Fisheries and Food to carry out this evaluation, working with any
other bodies that have the relevant technical capacity, including the developer of a project in due
course.
Disposal of waste, toxic materials and substances produced throughout the biofuel lifecycle must
avoid polluting surface- and ground-water, in line with the criteria set out in the General Law for
Ecological Balance and Environmental Protection, and in the corresponding state and federal
regulations.
5. BIOFUELS IN THE CONTEXT OF GREENHOUSE GAS MITIGATION IN MEXICO
Mexico is a developing country and a non-Annex I Party to the United Nations Framework
Convention on Climate Change (UNFCCC), and as such it has no obligatory GHG mitigation
target. Nevertheless, Mexico has been a very active player in international climate negotiations,
and it voluntarily associated itself with the Copenhagen Accord. Under this agreement, Mexico
committed to a target of a 30 % reduction in emissions below a business-as-usual baseline by
2020, provided that there is sufficient international support and financial resources to achieve
this goal.
One of the specific methods Mexico has used to work towards its voluntary commitment is by
implementing a special programme for climate change for the current federal administration
(CICC, 2009), which set quantitative mitigation and adaptation goals for the 2008-12 period. The
programme contains several short-term actions through which Mexico expects to mitigate its
emissions by nearly 50 million tonnes of CO2eq annually by 2012, which is substantial
considering that its total GHG emissions reached 709 million tonnes of CO2eq in 2006 (INE,
2009).
For its mid- and long-term targets, Mexico has been relatively successful in identifying some of
the technological changes needed to cut GHG emissions in the most relevant sectors, but it has
not yet made significant progress on prioritising the technologies available or on identifying and
analysing policy options to encourage their implementation. Another crucial issue for the
development of concrete national GHG mitigation strategies for the longer term is identifying the
technical, economic, legal and institutional barriers to implementation and working out how best
to overcome them.
134
The starting point for identifying potential for mitigating national GHG emissions is the national
inventory of GHG emissions. From this, we know that one of the largest sources of GHG
emissions in Mexico is energy consumption (INE, 2009). There is significant potential for
mitigating these emissions through using renewable energy and through improvements in
technology on the supply side of the energy sector (specifically improvements to reduce energy
leaks and to increase efficiency), and on the demand side (particularly with regard to industry,
the commercial and residential sectors, and transportation). According to the National
Commission for the Efficient Use of Energy, Mexico has significant potential to save energy
through a combination of measures and technologies. It is estimated that this could account for as
much as 20 % of the country’s total energy consumption and that GHG emissions would
decrease accordingly as a result.
Regarding renewable energy’s potential contribution to GHG mitigation, bioenergy, and
particularly biofuels, is a technology that has had a lot of attention over the last three years.
However, it still requires further research and development — particularly with regard to
domestic conditions — and, in due course, will require projects demonstrating and deploying
renewable energy, in order to assess its real potential for contributing to national GHG mitigation
targets.
The most important study underlying the decision on the national 2020 mitigation target was the
mitigation abatement curves analysis (INE, 2010), which assessed the cost and mitigation
potential of 131 measures across all sectors, given certain assumptions. According to this study,
with the options already available, Mexico could mitigate as much as 261 megatonnes of CO2eq
annually by 2030 (out of 872 in the baseline projections) with most measures having a cost of
less than 30 euros/tonne CO2eq. It is interesting to note in this analysis that, under the
assumptions made for this study, biofuels have negative costs or very small costs (less than 5
euros/tonne CO2eq abated) and an abatement potential of roughly 5 Mt CO2eq annually by 2020.
6. CONCLUSIONS
One of the reasons most frequently given for promoting biofuels in Mexico has been their
environmental benefits, and particularly their potential to mitigate GHG emissions. It is now
clear that the switch to biofuels does not always achieve this, and that sometimes it even leads to
increased GHG emissions. We must therefore be careful when assessing the lifecycle
sustainability implications of any proposed policies or measures in this area, so that we
implement those that produce a benefit to society and help us move towards sustainable
development.
Mexico has a large potential for renewable energy use (including bioenergy). However, several
constraints have impeded full-scale implementation of renewable energy, even though the
country has advanced steadily in implementing projects in this field, particularly projects relating
to geothermal and wind energy. Nevertheless, to develop its potential to its fullest, Mexico must
evaluate the costs and benefits of projects, particularly weighing barriers to project development,
any technological, social, economic, environmental and political implications, and any potential
incentive schemes.
Although policies and regulations have already been put in place to promote the production and
use of bioenergy in Mexico, in line with international trends, these have not been fully
implemented, as a result of concerns raised and some technical limitations. Ultimately, the
particular conditions and circumstances in Mexico should determine what solutions it puts in
place. These should address the concerns of stakeholders, and support sustainable development
in Mexico.

135
7. REFERENCES
- Bravo, E., 2006, Biocombustibles, cultivos energéticos y soberanía alimentaria:
encendiendo el debate sobre biocombustibles. Acción Ecológica, Quito, Ecuador.
- Castellanos, A., J. Llano, M. Esqueda, L. Medina, and O. Téllez, 2010, El uso de
especies vegetales de zonas áridas en México como fuentes de insumo para biodiesel.
Universidad de Sonora. Hermosillo, Sonora, Mexico.
- CICC (Comisión Intersecretarial de Cambio Climático), 2009, Programa Especial de
Cambio Climático, México, D.F.
- DOF, 2005, Ley de Bioseguridad de Organismos Genéticamente Modificados. Diario
Oficial de la Federación. 18 March 2008. México, D.F.
- DOF, 2008, Ley de Promoción y Desarrollo de Bioenergéticos. Diario Oficial de la
Federación. 1 February 2008. México, D.F.
- DOF, 2011, Ley General del Equilibrio Ecológico y la Protección al Ambiente. Diario
Oficial de la Federación. Updated version of 4 July 2011. México, D.F.
- INE (Instituto Nacional de Ecología), 2009, Cuarta Comunicación Nacional de México
ante la Convención Marco de las Naciones Unidas para el Cambio Climático, México,
D.F.
- INE (Instituto nacional de Ecología), 2010, Potencial de Mitigación de Gases de Efecto
Invernadero en México al 2020 en el contexto de la Cooperación Internacional, México,
D.F.
- Masera, O., J. Aguilar and B. Gamino, 2005, Estimación del recurso y prospectiva
tecnológica de la biomasa como energético renovable en México. UNAM. México, D.F.
- SAGARPA, 2009, Programa para la Producción Sustentable de Insumos para
Bioenergéticos y de Desarrollo Científico y Tecnológico 2009-2012. Secretaría de
Agricultura, Ganadería, Pesca y Alimentación. México, D.F.
- SENER, 2006, Potencialidades y Viabilidad del Uso de Bioetanol y Biodiesel para el
Transporte en México. Secretaría de Energía. México, D.F.
- SENER, 2009, Programa de Introducción de Bioenergéticos. Secretaría de Energía.
México, D.F.
- SENER, 2010, Balance Nacional de Energía 2009. Secretaría de Energía. México, D.F.


137
Bioenergy Potential in Mexico: Status and Perspectives
M.Rostro, G.S. Alemán-Nava, R.Parra
Centro del Agua para América Latina y el Caribe, Tecnológico de Monterrey,
Monterrey 64849, México.
Summary
Mexico ranks 9th in the world in crude oil reserves, 4th in natural gas reserves in America and
it is also highly rich in renewable energy sources (solar, wind, biomass, hydropower and
geothermal). Currently, it is estimated that 88.70% of its power is generated from fossil fuels
and 6.97% from renewable sources. Mexico’s Government has stated a Law for Climate
Change very ambitious on a worldwide level because it establishes targets of greenhouse gas
reductions at the same level as developed countries, despite Mexico being an emerging
country.
Energy policies in Mexico in recent years have tried to promote the use and development of
renewable energies; in 2012 the installed capacity for electricity generation from renewable
sources was primarily from hydropower with 80.8%, followed by wind energy with 8.5% and
geothermal energy with 6.7%. Biomass energy represented 3.8%, however this energy
represents the highest potential. Attempts to exploit biomass energy in Mexico have
encouraged the development of various technologies, focused mainly on the production of
biogas, biodiesel and improvement of wood stoves and charcoal furnaces. These technologies
correspond to particular projects throughout the country. This paper presents an overview of
the bioenergy potential, its current status and perspectives.
Key words: bioenergy, renewable energy sources, Mexico.
1. INTRODUCTION
Energy resources have been classified into three categories: fossil fuels, renewable resources
and nuclear resources. Fossil fuels have been by far the dominant energy source especially oil,
coal and natural gas. The reserves of fossil fuels are limited, and their use is associated with
environmental deterioration. Renewable energy sources (RES) can be defined as sustainable
resources available over the long term at a reasonable cost that can be used without negative
effects (Valdez-Vazquez et al., Demirbas).
There are three main legal instruments to promote renewable energy in Mexico. One is the
Energy Reform approved in 2013 by Congress of the Union (REEP, 2007). The second is the
General Law for Climate Change adopted in May 2012 which sets the goal that 35% of
energy generated in the country should come from renewable sources by 2024 (Cámara de
Diputados, 2008). Finally, the Law for the Use of Renewable Energy and Finance of the
Energy Transition, recently modified and approved. This Law establishes, among other
issues, the legal aspects and conditions for the use of renewable energy and clean technologies
as well as reducing the use and dependency of fossil fuels (SENER, 2011). These three legal
instruments are expected to create a better framework to support renewable energy in general
and also a future green economy in Mexico. This paper summarises the current status of the

138
use of bioenergy in Mexico and its regulatory framework. It provides a baseline approach for
the discussion of the barriers and opportunities for new and improved implementation of
bioenergy projects.
1.1 Economic and energy status of Mexico
Energy production is one of the most important economic activities in Mexico that contributes
to 3% of Gross Domestic Product (GDP). Oil-related taxes account for 37% of the Federal
budget and oil commercialisation represents 8% of total exports (SENER, 2001).
Mexico is one of the largest oil producers, ranked ninth in the world in reserves of crude oil.
Mexican Petroleum Company (PEMEX) is the seventh largest petroleum company
worldwide; however, this resource has been depleted (SENER, 2003).
In terms of electricity generation, Mexico ranks sixteenth in the world, and the Federal
Electricity Commission (CFE) is the sixth largest energy company worldwide. Electricity
coverage reaches 95% of the national population, one of the highest coverage rates in Latin
America (SENER, 2003).
Mexico´s total energy consumption is mainly based on oil and natural gas, where the latter
increasingly replaces oil as fuel in power generation. The country ranks fourth in natural gas
reserves in America, after the United States, Venezuela and Canada (SENER, 2003).
According to the national databases on energy, Mexico produced 219.5 million tons of oil
equivalent energy in 2011. It is estimated that 88.70% came from fossil fuels, 6.97% from
renewable sources, 3.17% from charcoal and 1.16% from nuclear sources (Figure 1, SENER
2011).
Figure 1: Global energy production in Mexico, 2011
(Source SENER, 2011)
1.2 The use and potential of renewable energy in Mexico for power generation
Power generation in Mexico is dependent on fossil fuels with a 78.20% share and is followed
by renewable energy at 19%. The distribution of consumption is presented in Figure 2.
According to the national databases on energy, Mexico produced 260,525 GWh during 2012,
and the national consumption was 206,480 GWh. The largest consumer of energy was the
industrial sector, which consumed 58.8%, followed by the residential sector with 25.2% and
services plus the agricultural sector with 16%. Electricity generation from RES increased

139
from 26 Terawatts (TW) in 2003 to 39 TW in 2012, however RES contribution to the global
power generation has remained at an average of 16% (SENER 2011).
Figure 2: Renewable energy contribution to power generation
(Source REN 21, 2013)
RES include biomass, hydropower, geothermal, solar, wind and marine energies. Renewable
energy provided about 19% of the global final energy demand and 9.7% came from modern
renewable sources such as hydropower, wind, solar, geothermal and biofuels. Traditional
biomass, which is mainly used for cooking and heating in rural areas, accounts for 9.3% of the
total final energy demand while hydroelectric power supplied about 3.7%. The rest of modern
renewable energy provided about 6% of the final energy demand in 2011, and has
experienced rapid growth in many developed and developing countries (REN 21, 2013).
In 2012, the installed capacity for electricity generation from renewable sources was 14,501
MW, of which 86% was owned by the public sector and 14% were from the private sector. In
this capacity 80.8% belongs to hydropower, 8.5% to wind energy, 6.7% to geothermal energy,
3.8% to biomass energy and 0.2% to solar energy (REN 21, 2013).
It is estimated that by 2026, the total installed capacity of electricity generation from
renewable sources will have surpassed 30,000 MW. An increase of 20,544 MW in the period
2012-2026, is expected in the existing installed capacity, led by wind and hydropower, with a
share of 59% and 28% respectively. To satisfy the total demand for electric energy to 2026,
the Federal Electricity Commission (CFE) estimates an increase of 44,532 MW in the
National Electric System (SEN). The public sector has planned to install 8,531 MW from
renewable energy sources, representing 19.2% of the national electric grid (Lozano, 2013).
The country has 253 stations in operation and under construction for power generation from
renewable sources. Renewable energy projects are present in 90% of the states where Oaxaca
(wind) and Veracruz (biomass) that have the highest number of projects. Mexico has a
capacity of 5,951 MW, taking into account stations in operation and under construction.
About 75% of the capacity is concentrated in the states of Oaxaca, Baja California,
Tamaulipas and Veracruz (Lozano, 2013).
It is expected that the potential of renewable resources in Mexico will increase by 2030.
(Table 1) (Lozano, 2013).
.

140
TYPE OF ENERGY POTENTIAL (MW)
Wind 40,268
Geothermal 40,000
Hydro 53,000
Solar 24,300
Biomass 83,500 - 119,498
Table 1: Renewable Resources potential in Mexico
(Source: SENER/Electrical Research Institute, 2013,
*Estimated potential by 2030)
1.3 The use of bioenergy in Mexico
Mexico is the third largest country in Latin America and the Caribbean in terms of crop land
area, after Brazil and Argentina (CEPAL, 2008). The cultivated area in 2007 was 21.7 million
ha with an agricultural production of 270 million tons (SAGARPA, 2008). Currently, the
residual biomass generated from these crops has several uses such as animal feed and
bedding, mulch and burning to produce energy and compost (Demirbas, 2008). The use of
biomass for energy is an attractive option because of its many benefits, so investment in
bioenergy research in Mexico has been increasing in recent years.
Thus, Mexico has become a focal point for the production of biofuels, a field that is still in the
early stages of research. To promote the production of biofuels, it is first necessary to evaluate
the natural potential of biomass as a starting point for strategic planning to ensure a stable
food supply and adequate environmental protection standards (Alemán et al., 2014).
In 2012, 60 projects operating electricity self-supply and cogeneration were recorded.
Bioenergy has an operational capacity of 645 MW installed, of which 598 MW are from
bagasse and the rest from biogas. Figure 3 presents the plants using biomass for power
generation.
Figure 3: Biomass stations for electricity generation
(Source SE Renewables Energies 2013)
141
2. STATUS OF THE DEVELOPMENT OF BIOENERGY IN MEXICO
2.1 Regulatory Framework
Energy policies in recent years have tried to promote the use and development of renewable
energy, which represents the highest bioenergy potential. According to the National Strategic
Development Plan (NDP) formulated during the last presidential period (2006-2012), the
pathway for the penetration of renewable energy in the national energy strategy recognises
and promotes four specific guidelines (Poder Ejecutivo Federal, 2007):
- Energy is a resource in relation to human development according to the Development
Program of the United Nations.
- Increase of the power generation capacity from 23 to 26% based on renewable energy, with
respectively 17% from hydroelectric power above 70 MW, 3% and 6% through small
hydropower and other renewables energies.
- Use of renewable energy and biofuels in economically, environmentally and socially
responsible forms.
- Mitigation of the increase of greenhouse gas emissions by reducing emissions from 14
MtCO2eq in 2006 to 28 MtCO2eq in 2012, 261 MtCO2eq in 2020 and 523 MtCO2eq in 2030.
The share of agricultural biomass and organic municipal waste shows a preferred vocation for
electricity production worldwide. Biomass projects focused on liquid and gaseous fuels would
face obstacles imposed by the market structure of fossil fuels in Mexico, a country with vast
natural reserves of oil and gas. However, the high dependence and consumption of finite
fossil fuels opens unique opportunities to offset carbon emissions and obtain carbon credits
with bioenergy (Columbia Law School, 2014).
2.2 Bioenergy technologies in Mexico
Landfill biogas and liquid biofuels offer a higher economic benefit than other renewables.
Waste biomass participation in cogeneration offers a direct and increased option to obtain
simultaneous economic benefits and greenhouse gas (GHG) emissions mitigation, although
competition with recycling and composting reduces the effective biomass availability for
energy uses (Aguilar et al., 2014).
The need to harness energy from biomass in Mexico has raised the development of different
technologies mainly focused on the production of biogas, biodiesel and improvement of wood
stoves and charcoal furnaces. There are several pathways for direct combustion, gasification,
fermentation and anaerobic digestion allowing the use of biomass as a sustainable energy
source. There is also extensive experience in the area of bio-digesters, methane capture,
electricity generation in landfills and efficient cooking stoves in rural areas in Mexico
(Aguilar et al., UNFCC 2014, Cerutti et al., 2010).
Firewood as a heating and cooking source is widely used in Mexico. The development of this
technology has also played a major role in exploitation of bioenergy as well as the
improvement of charcoal furnaces. Moreover, there are emerging initiatives for liquid
biofuels, especially biodiesel and research groups in materials and processes for biofuels for
the first, second and third generation. Biodiesel has been produced from different sources
such as oleaginous crops, recycled oil or animal tallow (Demirbas, 2008).

142
2.3 Bioenergy sources in Mexico
2.3.1 Biogas
Gaseous biofuels are classified according to their generation processes. Such processes may
be biological, for generating biogas or thermochemical to produce syngas or synthesis gas.
Biogas can be used as fuel in stoves and boilers, for domestic heating and lighting, to fuel
internal combustion engines or gas turbines and to generate power. In the case of Mexico, the
country has relevant experience in biological methods for the production of biogas. Biogas
generation has been performed using landfills, swine waste and wastewater (Cerutti et al.,
2010).
PROJECT LOCATION START DATE CAPACITY SOURCE OF
ENERGY
Biogas from swine waste Cadereyta,
Nuevo Leon
2005 65 kW Pig farm manure
Biogas from wastewater
treatment
León, Guanajuato 2008 2 plants of 55 kW Cattle manure
Biogas from landfill Salinas Victoria,
Nuevo León
2009 7.4 MW (2003)
12.72 MW (2007)
15.9 MW (2010)
Biogas from
municipal waste
Table 2: Projects for biogas production.
(Source: Cerutti et al., 2010)
2.3.2 Biofuels
Biodiesel is a mixture of fatty acid esters with short chain alcohols resulting from the reaction
of vegetable oils or animal fats with methanol or ethanol at atmospheric pressure. It can
completely replace petroleum diesel, or be used in mixtures with different percentages. Its
main advantage is that it can be produced from renewable sources (Demirbas, 2008; Cerutti et
al., 2010).
PROJECT LOCATION START
DATE
CAPACITY SOURCE OF
ENERGY
Biocombustibles
Internacionales
S.A. de C.V.
Nuevo Leon 2005 1.5 million L/d Animal tallow and
recycled oil
Bioenergetic
Chiapas
Chiapas 2009 2,000 L/d (Tuxtla Gutierrez)
8,000 L/d (Puerto Chiapas)
20,000 L/d (Puerto Chiapas)
Palm oil and
Jatropha curcas
Table 3: Projects for biodiesel production
(Source: Cerutti et al., 2010)
2.3.3 Efficient wood stoves
In Mexico, the use of firewood represents about 10% of primary energy and contributes 46%
of the energy demand of the residential sector. In Mexico, wood is used by over 27 million
people, 89% of the rural population uses wood as the main fuel for cooking, and urban wood
users account for 11% of the population (Cerutti et al., 2010).

143
PROJECT LOCATION START
DATE
CHARACTERISTICS
Patsari stove Michoacán
and 15 more States
2003 The exterior is made of brick which includes an
optimized combustion chamber and tunnels to
reduce the production of emissions.
Size 105 cm X 70 cm X 27 cm.
Mexalitl stove Nuevo Leon, Chihuahua,
State of Mexico and Yucatan
2008 The exterior is made of concrete with a combustion
chamber of ceramic.
Size 35 cm X 70 cm.
ONIL stove Chiapas, Oaxaca, Veracruz,
Puebla, Hidalgo, State of
Mexico, Queretaro
and Guanajuato
2010 Stove made from cement, sand and iron with a
volume of 15 L.
Size 80 cm X 54 cm X 20 cm.
Table 4: Projects for use of wood stoves
(Source: Cerutti et al., 2010)
2.3.4 Efficient charcoal furnaces
Improved technologies offer the opportunity to reduce the consumption of wood in the
manufacture of coal, to mitigate greenhouse gas emissions, to improve the working conditions
and the income of the farmers and, in general terms, create a more sustainable bioenergy
production process(Cerutti et al., 2010).
PROJECT LOCATION START
DATE
CAPACITY CHARACTERISTICS
Brick furnaces Tamaulipas,
Jalisco,
Queretaro,
Hidalgo,
Guanajuato,
Campeche,
Tabasco y
Quintana Roo
2003 6 m3 of wood. Productivity:
1,300 - 2,300 kg of charcoal,
depending on moisture of
wood.
Internal diameter: 3.2 m
Internal height: 2.20 m
Capacity: 6 m3 of wood
Table 5: Project for use of charcoal furnaces
(Source: Cerutti et al., 2010)
2.4 Development of the Projects Portfolio
Bioenergy potential of Mexico continues to be exploited. The biomass to biogas projects in
rural and agro-industrial applications have placed Mexico as the second country in Latin
America (LAC), after Brazil, with more registered in the Clean Development Mechanism
(CDM) projects (UNFCC, 2014).
Particularly, CEMEX the Mexican company and leader of the world cement industry, and
multifunctional PROACTIVE, which operates several municipal landfills throughout the
territory of Mexico, own the nearly totality of the great-scale Mexican bioenergy CDM. Both
industrial groups are seriously engaged in the use of bioenergy to obtain Certified Emissions
Reductions (CERs) by offsetting of fossil carbon from the national grid. Recently, "Ingenio
Tres Valles, SA", a company of the Industrial group "Piasa" involved in the milling of
sugarcane, presented a CDM project with the capacity to reduce 46,728 tCO2 / year in a 40
MW combined heat and power cogeneration system (Rios et al., 2014).

144
Currently a consolidated inventory for bioenergy sources in Mexico is not available.
However, the cooperation among Mexico’s National Council for Science and Technology
(CONACYT), German Academic Exchange Service (DAAD) and the Institute of
Environmental Technology and Energy Economics (Technical University of Hamburg) aim to
build a model to assess the sustainable biomass potential in Mexico. This model should be the
basis upon which to investigate the impacts of regulatory frameworks, strategies of
penetration of biomass energy projects and their potential contribution in achieving GHG
reductions (Rios et al., 2014). Mexico also participates in the Global Methane Initiative which
aims to obtain consolidated data about biogas energy potential, especially in the waste sector,
with mitigation projects through biogas capture related to the US carbon markets (Global
Methane Initiative, 2014).
3. PERSPECTIVES FOR DEVELOPING BIOENERGY IN MEXICO
3.1 Barriers and solutions to bioenergy development
Investment opportunities for improving the use of RES are very high, because even though
Mexico has a high potential for RES development, only a small percentage of this energy has
been used. However there are also some barriers that prevent their expansion (Alemán-Nava
et al., 2014).
The lack of an energy strategy based on methodologies that evaluate RES feasibility in short
terms and the natural market tendency to consume the cheapest energy source, usually fossil
fuels, inhibits the RES promotion (INECC-SEMARNAT, 2012).
Bioenergy is the most vulnerable RES to these barriers, because bioenergy sources are diffuse
- producing small generation projects - and their supply-chains are complex and vulnerable to
fossil carbon inputs mainly associated with feedstock transport.
Nowadays, the most important barrier for bioenergy development is the relative higher
marginal costs of CO2 abatement compared to actions in other sectors. For liquid biofuels the
estimated cost ranges from 7 to 12 US$/tCO2e, while for biogas and upgraded waste water
treatment plants the cost is around 60 US$/tCO2e. Presently, there are no biofuels production
projects included in the first consolidated Mexican portfolio of mitigation activities, although
a mitigation capacity of 15 MtCO2e in 2030 through biofuels use is projected. From this
perspective, to date only biogas landfill projects might result competitive in the bioenergy
sector due to the relatively neutral cost of this kind of mitigation action (INECC-
SEMARNAT, 2012).
In order to overcome these barriers a series of solutions have been proposed (Alemán-Nava et
al., 2014):
- Adoption of a general national plan for renewable energy in Mexico by explicit
establishment of RES participation in the country´s energy production.
- Definition of financial schemes that help small renewable energy producers through
economical and/or fiscal incentives.
- Promotion of educational, research and development programs with funding from Public-
Private Partnership.
3.2 Development Opportunities
The development of industry in Mexico has been promoted by the adaptation of the regulatory
framework, the creation of funds for development related to energy efficiency and renewable
energy programs, support for research and development of new technologies in the sector,
open season processes, funding for the development of such projects and the establishment of

145
goals for the short and long term. However, the country's great potential must be realised, as
well as its platform for export to the United States and a broad network of trade agreements,
which would result in a better performance of the industry through more incentives for
foreign investment to develop new projects including completing the supply chain sector.
Finally, the Mexican market is large and attractive, not only because of its huge potential in
renewable resources, but by the opportunity to manufacture equipment for the industry
(extensive experience in the country in electricity generation and distribution).
4. CONCLUSIONS
The potential of renewable energy in Mexico is considerable. Energy policy in Mexico has
strengthened the development of renewable energy in recent years but still needs to define
protocols to follow. One of the most promising sources of renewable energy is biomass.
Biomass conversion technologies in Mexico are mainly based on biogas and biofuels, wood
stoves and coal furnaces with representative projects in different states.
Local industry and academia are called to lead the introduction of renewable energy sources,
and in particular to improve the share of energy from biomass in the local energy mix.
5. REFERENCES
- Aguilar-Virgen Q., Taboada-González P., Ojeda-Benítez S. & Cruz-Sotelo S., Power
generation with biogas from municipal solid waste: Prediction of gas generation with in situ
parameters. Renewable & Sustainable Energy Reviews 30, 2014.
- Alemán-Nava G.S, Casiano-Flores V.H., Cárdenas-Chávez D.L., Díaz-Chavez R.,
Scarlat N., Mahlknecht J., Dallemand J.F., Parra R., Renewable energy research progress
in Mexico: A review. Renewable & Sustainable Energy Reviews, 32, 140–153, 2014.
- Cámara de Diputados, Law for the Use of Renewable Energy and Finance of the Energy
Transition. D. Of. la Fed. 1–12, 2008, Mexico.
- CEPAL, Comisión Económica para América Latina, Statistical year book for Latin
America and the Caribbean 2007- 2008.
- Cerutti O. M., Prehn M. & Cumana I., La bioenergía en Mexico, Estudios de Caso 1, Red
Mexicana de Bioenergía, A.C. 2010.
- Columbia Law School, Center for Climate Change, Climate Change Laws of the World,
2014.
- Demirbas A., Recent advances in biomass conversion technologies. Energy, Education,
Science & Technology 6, 19–40, 2000.
- Demirbas A., Biofuels sources, biofuel policy, biofuel economy and global biofuel
projections. Energy Conversion & Management 49, 2106–2116, 2008.
- Fridleifsson I. B., Geothermal energy for the benefit of the people. Renewable &
Sustainable Energy Reviews 5, 299–312, 2001.
- GMI, Global Methane Initiative, Partner country: México, 2014, .
https://www.globalmethane.org/partners/mexico.aspx
- INECC-SEMARNAT, Instituto Nacional de Ecologia y Cambio Climático, Secretaría de
Medio Ambiente y Recursos Naturales, Bases for a low emission development strategy in
Mexico. 120, 2012.
- Lozano Cardona W., Renewable Energies, Ministry of Economy, 2013
- Poder Ejecutivo Federal, National Strategic Plan for Development 2007-2012, Mexico.
- REEP, Renewable Energy and Energy Efficiency Partnership, Sustainable energy policy
initiative for Latin America and the Caribbean Report, 2007,
http://www.oas.org/dsd/reia/Documents/SEPIreportFINAL_spanish.pdf

146
- REN 21, Renewables 2013 - Global Status Report 2013.
- Rios M. & Kaltschmitt M., Biomass for energy in Mexico: A technical, economic and
environmental analysis. Institute of Environmental Technology and Energy Economics.
University of Hamburg-TUHH, 2014.
- SAGARPA, Secretaría de Agricultura, Ganadería, Desarollo Rural, Pesca y Alimentación,
Food and Fisheries Information Service 2008, Mexico.
- SENER, Secretaría de Energía de México, Anhydrous Ethanol Program Introduction, 2011.
- SENER, Secretaría de Energía de México, Energy Sector Programme 2001–2006.
- SENER, Secretaría de Energía de México, Electricity Sector Prospective 2003–2012.
- SENER, Secretaría de Energía de México, Energy and Environment Towards Sustainable
Development.(2003), http://www.energia.gob.mx
- SENER, Secretaría de Energía de México, National Energy Balance 2011,
http://sie.energia.gob.mx
- UNFCCC, United Nations Framework Convention on Climate Change, Status of CDM
project activities. (2014).
- UNFCCC, United Nations Framework Convention on Climate Change, Mitigation-
NAMAs, Nationally Appropriate Mitigation Actions. (2014).
- Valdez-Vazquez I., Acevedo-Benítez J. A. & Hernández-Santiago C., Distribution and
potential of bioenergy resources from agricultural activities in Mexico. Renewable &
Sustainable Energy Reviews, 14, 2147–2153 (2010).

147
International initiatives on sustainable bioenergy
in Latin America and the Caribbean
J.Cosme Carvalho Ervilha
FAO/RLC Bioenergy Consultant
Agrifood/System Production and Agrifood Chain
FAO Regional Office for Latin America and the Caribbean
Av. Dag Hammarskjöld 3241, Vitacura, Santiago de Chile
Summary
An increase in energy demand and unstable oil prices encouraged the development of new
technologies in order to improve energy efficiency or, in some cases, to replace the energy
source. Renewable energies have emerged as an alternative option to cover this new demand
and biofuels in particular are considered feasible options for the short and medium term.
Latin America and the Caribbean have several local options to produce renewable energy,
which are economically viable and have significant potential to expand. Bioenergy production
for the region has shown remarkable progress during the last decade, reaching maturity and
consistency, following a model that can be adapted and implemented in similar contexts to
ensure both food security and economic development.
The UN’s Food and Agriculture Organisation (FAO) promotes actions for agricultural
development leading to food security and sustainable development. It has developed several
initiatives through its regional office for Latin America and the Caribbean. These initiatives
aim to strengthen local capacity and increase local sources of information to develop
strategies and government policies on promoting bioenergy as a driver for economic
development, poverty reduction and ensuring energy security.
The FAO’s main activities in the bioenergy area include coordination of high-level policy
forums, technical seminars, publication of regulatory milestones, and other events at national
and regional level to present and discuss policies and strategies.
1. INTRODUCTION
Energy supply and consumption has been a central theme in the global economic and
geopolitical agenda since the first oil crisis in the early 70s. Concentration of oil reserves in a
small number of countries and evidence of the environmental impact of fossil fuel use,
particularly their effects on climate change, has made the energy question even more complex
and urgent. According to an International Energy Agency (IEA) scenario, in the next 20 years,
the energy demand will increase by about 30 %. Despite the growing importance of renewable
energy, energy supply will continue to be dependent on fossil sources (IEA, 2012).
Over the last decade, interest in the diversification of the energetic matrix, rural development,
concern about climate change, and oil price volatility have resulted in the implementation of
public policies to develop biofuels.
Latin America, in particular, has several advantages (agricultural tradition, feedstock
availability and climate condition) which allow the expansion of agriculture-energy
production both regionally and globally. The resource potential in Latin America and the
Caribbean, together with developments in bioenergy, provide a significant opportunity for
economic development, employment generation and hunger reduction.

148
These conditions have turned the region into one of the most significant for public policy on
bioenergy, especially for policies relating to social development and research and innovation
in renewable energy and sustainability.
Currently, 174 million people live in poverty in Latin America and the Caribbean, 70 % of
whom live in rural areas (FAO, 2012). Bioenergy is also a significant driver for agricultural
development in areas other than energy, including increasing product supply, ensuring energy
security and creating access to food by improving income generation in farms.
The bioenergy potential for the region is based on highly competitive sectors of agricultural
production, which can be used to produce first generation biofuels (for example from
sugarcane and oilseeds), second generation biofuels (from agricultural waste or
lignocellulosic materials), and third generation biofuels (from algae).
2. FOOD SECURITY AND BIOFUELS
FAO defines food security as follows: ‘Food security exists when all people, at all times, have
physical and economic access to sufficient, safe and nutritious food that meets their dietary
needs and food preferences for an active and healthy life’ (FAO, 1996).
According to the FAO’s definition, therefore, food security involves four dimensions: access,
availability, utilisation and stability.
- Food availability is ‘the availability of sufficient quantities of food of appropriate quality,
supplied through domestic production or imports (including food aid)’.
- Food access is ‘access by individuals to adequate resources (entitlements) to acquire
appropriate food for a nutritious diet’. Entitlements are defined as the set of commodity
bundles over which a person has control, given the legal, political, economic and social
arrangements of the community in which they live. They include traditional rights, such as
access to common resources. This is a key point for developing biofuels in the region and it is
still limited. According to the FAO, 49 million people are currently affected by hunger and
biofuels can be a mechanism for encouraging rural development, which will provide access to
food by generating income for small-scale farmers. However, to achieve this goal, some
changes need to be made to the process of developing biofuels policies, especially in light of
the lack of long-term policies in most countries. These policies ensure the necessary stability
for developing a new production chain and market schemes like those that currently exist for
bioenergy in some countries.
- Utilisation is ‘the use of food to reach a state of nutritional well-being where all
physiological needs are met, through the provision of an adequate diet, clean water, sanitation
and health care’. This highlights the importance of non-food elements of food security.
- Stability: to be ‘food secure’, a population, household or individual must have access to
adequate food at all times and should not face the risk of losing access to food as a
consequence of sudden shocks (e.g. an economic or climatic crisis) or cyclical events (e.g.
seasonal food insecurity). The concept of stability can therefore relate to both the availability
and access aspects of food security. Long-term policies are required to ensure the stability of
biofuel development, in order to have sustainable production of raw materials. Achieving
food security means developing mechanisms which allow the four aspects of food security
proposed to be met. Bioenergy, in this context, is seen as a way to reduce poverty and hunger
and to increase access to energy.

149
The development of new opportunities, especially in relation to bioenergy, requires designing
four strands of policies:-
- Policies for development and territorial organisation. These will allow the development of
incentives for using bioenergy, taking into account the agro-ecological constraints on the
sustainable development of the sector.-
- Policies on technology. These will support research on potential feedstock for sustainable
production, which requires analysis at different levels and the preparation of market schemes
for agricultural and industrial production.
- Policies to regulate markets, products and services. These require setting out a framework
for developing a bioenergy production chain, as well as market schemes and tax policies.
- Policies to improve contractual relations. These include developing policies to structure the
bioenergy production chain, taking into account the needs of small-scale farmers and the need
to protect labour rights.
3. GUIDELINES FOR ACTION IN LATIN AMERICA AND THE CARIBBEAN
Bioenergy provides an opportunity to achieve several goals, including encouraging
agricultural development, mitigating climate change and ensuring energy security. However,
the way in which bioenergy is supported and regulated will affect its sustainability. Several
Latin American countries have begun research into and commercial production of biofuels
from a variety of raw materials, in order to meet the domestic demand created by
governments or by the international market. Several raw materials are being used, including
oilseeds, sugarcane, animal fats, waste oils and agricultural waste. Regional bioenergy options
are site-specific and depend on the availability of local resources. The FAO, and in particular
the regional office for Latin America and the Caribbean on bioenergy development, have
developed projects which mainly focus on strengthening national strategies and developing
regional capabilities with regard to sustainability, as set out below.
3.1 Strengthening national capacities and regional policies: programmes with an
emphasis on sustainable bioenergy in Latin America and the Caribbean
- Course on vegetable oil and biodiesel production chains: the use and management of the
FAO’s biodiesel software as a tool to support decision-making’
In 2009, the FAO developed a system to support decision-making relating to biodiesel.
Training has been provided for 180 professionals from 17 countries, who are involved in
biodiesel production chains. Participants have come from several sectors, including
agricultural production, research, national governments and industry. The training course
covers 1) setting up a biodiesel/vegetable oil project, including evaluating agricultural and
industrial levels by economic and social analysis, and 2) using the FAO’s bioenergy and food
security rapid appraisal methodology to evaluate the project’s sustainability.
- Development of an input chain for biodiesel and vegetal oils, North of Minas Gerais
The purpose of this publication is to share the experience of implementing a biodiesel
production chain in a poor region of Brazil, where over 70 % of the farmers work in small
areas and in vulnerable conditions. Biodiesel production created an opportunity for
agricultural development, with a focus on ensuring food security. Several options evaluated
also supported food production through the by-products obtained from the industrial process.
This specific project was part of a strategic plan developed by the Brazilian Government as
part of the national biodiesel production programme, which aimed to increase the social
inclusion of poor farmers in the biodiesel production chain.

150
- Publication of a Biogas Manual
This publication was jointly produced by the Ministry of Energy in Chile, the FAO and the
UNDP to support the use and promotion of non-conventional renewable energy. It includes
information about biogas production and technology, technical aspects, implementation and
biodigester maintenance. Biogas is a bioenergy source that has been the subject of increasing
interest in recent years, and it is one of the simplest bioenergy technologies to implement,
especially for small farmers. The potential for development is related not to biogas production
itself but to bio-fertiliser and to treating some health problems. Replicating and disseminating
biogas projects in areas with available organic waste is, therefore, an attractive opportunity. It
can deliver fast results, and savings on production costs if biogas production is integrated with
other farm activities, especially food production. This publication aims to support the
sustainable development and implementation of biogas projects in Latin America and the
Caribbean. It provides an opportunity to build links between different countries through
‘south-south’ cooperation.
- Workshop/technical meeting in Viçosa, Brazil
This technical meeting was organised by the FAO, the Brazilian Centre for Agricultural
Research, the University of La Frontera and the Federal University of Viçosa. At the meeting,
participants discussed a proposal for technical cooperation between the participants on
developing a biogas project based on dairy cattle manure management in Brazil and Chile,
specifically in the Minas Gerais and Temuco areas.
- Project to develop an International Renewable Energy Centre focusing on biogas
(CIER/Biogas)
This project involved a cross-institutional team working to develop an international centre
focusing on biogas for Brazil and Paraguay, aiming to boost production, research and
sustainable use of biogas. The team’s main goal is to allow biogas development relating to
animal production in Brazil and to develop research and support projects on biogas
production.
- Probiomass project, Argentina
This project aims to increase the energy production from biomass at local, provincial and
national level. It also aims to support the development of renewable, clean, reliable and
competitive feedstock, while diversifying the energy matrix, creating opportunities to develop
several sectors of the economy (such as agroforestry) and contributing to climate change
mitigation and regional development. The Probiomass project represents an opportunity to
create an institutional platform that covers the three main aspects of bioenergy: energy,
agriculture and environment. The project works to catalyse innovation in an industrial
process, implementing the biorefineries concept.
3.2 Technical and policy advice to governments and national programmes for
sustainable bioenergy development and agribusiness
- Bioenergy technical event held during the FAO’s regional conference in Argentina
This event consisted of a workshop held during the FAO regional conference, with
representatives of organisations from Latin America and the Caribbean discussing the
following issues:
- second generation biofuels from lignocellulosic feedstock;
- energy production from biomass, including the Probiomass project in Argentina;
- technological innovation for efficient agriculture;
- reflections, myths and state-of-the-art of agricultural biotechnology, with a focus on
small-scale agriculture.

151
- Seminar with OLADE, IICA, the FAO and Mexico’s Ministry of Energy, with the support
of the Brazilian MME, BIO 2012
This seminar involved the key players in technological development and promotion and use
of biofuels in Latin America and the Caribbean Representatives of organisations researching
advanced technologies and supporting agricultural development, business enterprises and
energy authorities also attended the seminar.
- Seminar on strategic partnerships to increase the inclusive development of agribusiness,
involving several national and international institutions in Latin America and the Caribbean
This seminar was attended by representatives of regional economic organisations, service
providers key to the development of agribusiness, UN agencies and representatives of the
Ministries of Agriculture, Finance and Industry. Presentations were given on public
institutions, public-private partnerships, programmes supporting the competitive development
of agribusiness and small and medium agribusinesses. This seminar also explored
participants’ experiences, facilitating an exchange on these topics and others relating to the
development of agribusiness and agro-industry. It encouraged dialogue, exchange of best
practice, discussion of priorities for action for an alliance, and strategies to:
- support inclusive agribusiness development in the region;
- discuss possible follow-up to the seminar; and
- support partnerships between the organisations that attended the seminar.
The event’s goals were to:
- support the formation of regional alliances to promote inclusive agribusiness
development in the Americas;
- identify scope for joint strategies to help the Ministries of Agriculture work together
on supporting agribusiness, which would require institutional strengthening;
- offer input on developing guidelines to promote public-private partnerships to
develop agribusiness and the agricultural value chain.
- Seminar on biogas opportunities, 2012
FAO worked with the Chilean Government to give a seminar on renewable energy for the
agrifood sector and biogas opportunities. At this event, knowledge was shared and successful
case studies on using biogas in the region were presented to the audience.
Biogas is a biofuel that represents a great opportunity in the food production chain. Farmers
can treat waste from biogas production, solving an environmental problem, while generating
energy for their own consumption or to sell the surplus to companies. This helps to reduce
energy production costs, as well as producing electricity. This seminar concluded that the
region has a great potential for biogas production, especially taking advantage of agricultural
production waste. Regional policies are also needed, in order to attract large biogas projects,
promote clean energy, share information to train more experts and invest in new technologies.
- Seminar on the challenges in expanding bioenergy use in Chile
This event was organised by the University of Chile, the Catholic University of Valparaiso
and the FAO. The theme of the conference was ‘challenges in expanding bioenergy use in
Chile’. The main topics were:
- challenges in domesticating and expanding the growth of energy crops;
- energy plantations and sustainability;
- using algae biomass for bioenergy.

152
4. CURRENT STATUS OF BIOENERGY IN LATIN AMERICA AND THE
CARIBBEAN
Several countries in Latin America and the Caribbean are promoting and implementing
policies for bioenergy production, based on a variety of current and potential feedstock
categories. Biofuels, in particular, are emerging as a strategic opportunity for local
development and diversifying energy matrixes. These countries are promoting bioenergy
policies following proposals to diversify the energy matrix (associated with rural
development, use of marginal areas and/or degraded land in order to avoid competition with
food production) and concerns about fossil fuel dependence and the environment. Several
bioenergy options are possible, and each region or country has local resources that can be
used to promote sustainable development and increase opportunities for vulnerable
communities in the region. FAO (whose mandate is to support agricultural production and
strengthen family farming and sustainable rural development) published a compendium that
brings together experiences across Latin America and the Caribbean. This is intended as a
guide to share information on projects with countries that are less active in the field of
bioenergy and to provide high quality information that can be consulted and that will support
exchanges of experience between the countries in Latin America and the Caribbean.
FAO collected this information to:
- describe the current status of bioenergy in specific countries in the region and to report on
recent experiences in producing and using biofuels;
- develop proposals for developing bioenergy in countries in the region to improve sustainable
production, with a focus on food security.
The information collected can be accessed on the following website:
http://www.rlc.fao.org/es/temas/recursos-naturales/bioenergia/
5. CONCLUSION
The actions developed by the FAO on bioenergy have demonstrated the importance of the
organisation’s role as a centre of excellence in this area, participating in several regional
projects. The FAO’s main focus is on using bioenergy as a regional development opportunity
for farmers. Bioenergy is therefore one of the tools available to help reduce poverty and
hunger in Latin America and the Caribbean, and to support sustainable development in
agriculture and industrial activities. It is also an option that allows the region to reduce its
dependence on fossil fuels, increase energy security and achieve food security.
6. REFERENCES
- FAO, 1996, Rome Declaration on World Food Security and World Food Summit Plan of
Action. World Food Summit 13-17 November 1996. Rome.
- FAO, 2012a, FAO Support Package to Decision-Making for Sustainable Bioenergy, Rome,
Italy, http://www.fao.org/energy/82318/en/.
- FAO, 2012b, FAO Support Package to Decision-Making for Sustainable Bioenergy, Rome,
Italy, http://www.fao.org/energy/36660-081b221d0df4b02e5a78540bf2ca53553.pdf
- FAO, 2012c, Panorama de la Seguridad Alimentaria y Nutricional en America Latina y el
Caribe 2012, ISBN 978-92-5-307357-3.
- FAO, 2012d, Manual de Biogas, http://www.rlc.fao.org/es/publicaciones/manual-biogas/
- FAO, 2013, Biodiesel FAO Software.
- IEA, 2012, Energy Outlook 2012, International Energy Agency, Paris, France.
153
The AMAZON project – suitability of woody and agricultural biomasses
for gasification
C.Dupont, CEA Grenoble — LITEN France
D.Da Silva Perez, FCBA, France
S.Jacob, FCBA, France
F.Broust, CIRAD, France
J.M.Commandré, CIRAD, France
O.Guerrini, GdF-SUEZ, France
F.Labalette, GIE-Arvalis/ONIDOL, France
M.Campargue, RAGT, France
J.Escudero, RAPSODEE Mines d’Albi, France
P.Rousset, SFB, Brazil
1. INTRODUCTION
Second-generation biofuels processes based on gasification are currently at a pre-industrial
stage, as shown for example by the European demonstration units in Austria (Güssing) and
Germany (Bioliq), and projects in Sweden (Gobigas) and France (BioTfueL, Gaya).
Until now, the feedstock used in such gasification processes has mostly been wood. Wood is
regarded as the lignocellulosic material of reference and its properties and thermal behaviour
are the best known. This is due to its abundance and suitability for gasification, since it
contains little ash and more generally few impurities, is produced in an acceptable form and is
quite homogeneous and relatively dense as compared with other biomass types. Moreover,
other processing industries, such as the paper industry, are familiar with it, which facilitates
the management of wood supply and the modelling of wood behaviour (crucial for designing
industrial units).
However, the wood market is subject to increasing tensions, so conversion processes must be
more flexible and able to deal with a range of biomass feedstock. Otherwise, there will not be
enough biomass to convert or its cost will be prohibitive, which would prevent the large-scale
roll-out of the processes. It is therefore crucial to ensure a supply of biomass feedstock that is
suitable for the processes in question and to extend the acceptable range of feedstocks to other
resources, such as agricultural residues, which are available in significant quantities, and new
agricultural and silvicultural energy crops.
Due to the limited availability of biomass, processes need to be more flexible and to convert
the widest possible range of resources. It is therefore vital to ensure a good match between the
various biomasses and the conversion processes, in order to extend the acceptable range of
feedstocks to agricultural residues as well as. The AMAZON project aims to study in a
systematic way the suitability of biomasses for gasification for the production of
second-generation biofuels. The idea is to cover the whole feedstock/process chain through
joint work between biomass producers and process actors, and to associate modelling and
experiments on different scales. The ultimate aim is to work from both sides to improve
biomass quality and process flexibility.
For some years now, teams have been working on the systematic characterisation of various
biomass samples in the context of thermochemical conversion. This has led to the
development of public databases such as ECN’s Phyllis 2 (ECN, 2014). A major drawback of
these databases, however, is that they are mostly based on data obtained by different authors,
which means potential differences in characterisation methods and poor information on

154
biomass history. One database, developed in the framework of the collaborative REGIX
project in France, contains properties of a large range of biomass types cultivated by the
partners themselves (so that the biomass history is well known) using the same
characterisation method. However, this project has studied the suitability of the feedstock for
gasification only theoretically (Dupont et al., 2010).
The suitability of feedstock for gasification has been studied through comparative tests on
various biomass types. Interesting results have been obtained on achievable yields and the
technical feasibility of use in processes. However, these tests have been performed on a
limited number of biomass samples: generally two or three species, or at best ten (Van der
Drift, 2001). As these are ‘process studies’, they produce only a characterisation of the
feedstock properties in relation to process, but no information or evaluation in terms of
production techniques, collection, storage or even preparation. The absence of an integrated
feedstock-to-process approach makes it impossible to identify any correlation between
properties and biomass feedstock.
All existing studies focus on one step of the process, i.e. torrefaction, pyrolysis or
gasification, and one reactor technology, e.g. fluidised bed (Van der Drift, 2001). Apart from
Van der Drift, authors usually conduct lab-scale experiments (e.g. Zanzi, 2001; Zhang et al.,
2008), which allow for a wide range of operating conditions to be tested, but not for account
to be taken of all technological issues associated with processes, such as ash management in
gasifiers. Also, the reaction modelling associated with the tests is generally feedstock-specific
and very few authors have attempted to make quantitative links between biomass properties
and thermal behaviour (Ranzi et al., 2008; Zhang et al., 2008; Dupont et al., 2011).
This ‘state-of-the-art’ shows the lack of systematic study of the suitability of biomass
feedstocks for gasification processes along the whole feedstock-to-process conversion chain,
involving both biomass producers and process users, associating modelling and experiments
on different scales, and producing economic and environmental assessments of conversion
routes and recommendations as to how biomass quality and process flexibility can be
improved. The AMAZON project sought to conduct such a study through a collaborative
partnership between France and Brazil. The project lasted from 2008 to 2012 and involved 12
French and Brazilian partners from both the feedstock and the process side – from France:
CEA, CIRAD, FCBA (coordinator), GIE ARVALIS/ONIDOL, GdF-SUEZ, RAGT and
RAPSODEE; and from Brazil: Arcelor-Mittal, Bioware, EMBRAPA, SFB (coordinator) and
UFPA. Unfortunately, due to insoluble administrative issues, it was possible to carry out only
the French side of the project (partially) and some tests on three Brazilian feedstocks. The
approach followed and the main results are described below.
2. SCIENTIFIC AND TECHNICAL APPROACH
In order to achieve its goal, the AMAZON project was based on the following tasks (see
Figure 1):
- selecting promising woody and agricultural biomass feedstock categories and evaluating
their quality through the production, collection and systematic characterisation of a large
number of samples;
- setting out process specifications, then testing the behaviour of the biomass samples in
analytical devices during two key steps of the process (torrefaction and gasification) and, on
the basis of these experimental results, developing predictive models able to correlate thermal
behaviour and biomass properties, in order to select the most promising biomass resources;
and
- pilot tests on the biomass feedstock categories selected after lab-scale experiments; this
included tests of several process chain options, involving several pretreatments, including

155
combinations (thermal: drying, torrefaction, fast pyrolysis; and mechanical: grinding,
pelletisation), and gasification by means of two reactor technologies (fluidised bed and
entrained flow reactor). From the results, it was possible to draw conclusions as to the
suitability of biomass feedstocks for gasification.
On the basis of the conclusions, a task was then planned which involved the improvement, in
parallel, of resource quality and process flexibility. This consisted of an economic and
environmental assessment of the various conversion routes by biomass type, in order to
evaluate the potential for industrial-scale roll-out. However, due to administrative issues (see
above), only the first three tasks could be carried out. The results are shown below.
Figure 1: AMAZON project – general approach
3. RESULTS
3.1 Biomass selection and characterisation
The partners from the resources field drew up a list of ten biomass categories, according to
several previously developed criteria (e.g. yield and water consumption), for characterisation
and testing: tall fescue, miscanthus, wheat straw, triticale, switchgrass, wood chips from
hardwood and softwood, short rotation forestry (SRF) of poplar, short rotation coppice (SRC)
of poplar, and SRF of eucalyptus. Alfalfa was added (due to its specific ash composition), as
were three woody Brazilian biomasses (angelim, faveira and maçaranduba).
Between 200 kg and 5 tonnes of each biomass were produced and then collected by the
feedstock partners (GIE-Arvalis/ONIDOL for the agricultural part and FCBA for the woody
part). Woody biomass moisture was close to 50 w% at harvesting, so it was dried by FCBA.
GIE-Arvalis/ONIDOL then milled all the biomass species in a pilot hammer mill.
Particular attention was paid to the traceability of the samples. An online interactive table was
developed to track their movement between partners in the course of the various treatments.
The feedstock partners characterised the samples according to the properties identified with
the process partners, i.e. composition in terms of major elements (carbon, hydrogen and
oxygen), minor elements, ash and moisture content, particle size, density and chemical
composition (sugars).

156
The results corroborated those from previous studies (Dupont et al., 2010): homogeneity in
terms of major elements and marked differences between forestry wood, SRF/SRC, perennial
crops and straws in terms of ash content (see Figure 2) and composition.
Figure 2: Ash content of the main biomass ‘families’
3.2 Tests in analytical devices
CEA carried out torrefaction tests in a thermobalance on 5 mg of each sample under identical
conditions, in order to study the solid mass loss kinetics. As shown in Figure 3, different
behaviours could be observed for mature wood, SRF/SRC and perennial crops, and the other
agricultural biomass types. These were satisfactorily modelled using the Di Blasi two-step
semi-global mechanism (Di Blasi and Lanzetta, 1997) and four parameters were derived for
each biomass ‘family’.
Softwood, Short Rotation Forestry / Coppice and perennial crops
Hardwood
Agricultural by-products
Figure 3: Solid mass loss of biomass during torrefaction at 280 °C

157
CIRAD conducted torrefaction tests in the ALIGATOR lab-scale facility on 1.5 g of solid, in
order to obtain complete mass balances, i.e. yields of torrefied solid, gas (CO, CO2) and
condensable species (H2O, acids, etc.). The results confirmed the thermobalance results in
terms of solid mass loss. They also showed that the biomass type influences the composition
of condensable species released during torrefaction (see Figure 4). As regards mass loss
kinetics, three ‘families’ appear, with clear differences between wood, perennial crops and
agricultural residues. However, the properties of torrefied solid that were measured (carbon,
hydrogen, oxygen, nitrogen, volatile matter, ash content and heating value) seem relatively
independent of biomass type and more sensitive to operating conditions, i.e. temperature and
residence time.
Figure 4: Composition of dry condensable species obtained during biomass
torrefaction at 250 °C
CEA conducted steam gasification tests in a thermobalance on 5 mg of chars (pyrolysis
residue) from the various biomass species in order to characterise steam gasification kinetics.
Reactivity differences of up to a factor of 30 were observed among the samples; these may
have a major impact on process design and control (see Figure 5). Two conversion profiles
were also observed as regards the potassium/silicon ratio in biomass. Scanning electronic
microscopy coupled with observed energy-dispersive X-ray seemed to indicate that the
catalytic action of potassium would be progressively inhibited by its being encapsulated by
silicon in the case of silicon-rich biomass.

158
X 30
Figure 5: Average reaction rate of steam gasification of biomass chars
(800 °C; PH2O=0.2bar)
3.3 Tests in pilots
3.3.1 Pretreatment tests
CIRAD carried out fast pyrolysis tests on several biomass species under identical conditions
in a fluidised bed pilot with a solid flowrate of 1 kg.h-1
. The bio-oil mass yield and quality did
not appear to vary among the wood samples tested, but were much degraded in the case of
wheat straw. An intermediate situation seemed to emerge for energy crops, with results closer
to those for wood.
RAGT conducted pelletisation tests on several samples in its pilot, operating at a solid
flowrate of 20 kg.h-1
. Nearly all biomass species (fescue, wheat straw, switchgrass, SRC of
poplar, triticale) could be pelletised with no major difficulty. However, some adjustments had
to be made to the operating conditions in order to treat miscanthus and, surprisingly, the SRF
of eucalyptus could not be pelletised, although this biomass has no peculiar properties.
3.3.2 Gasification tests
CEA gasified the pelletised samples in a bubbling fluidised bed at a solid flowrate of
0.5 kg.h-1
. No significant differences were observed as regards main gas species (H2, CO,
CO2, CH4), nor light hydrocarbons and tars. However, emissions of NH3 and H2S varied
according to feedstock and were clearly correlated to the initial amounts of nitrogen and
sulphur in the biomass (see Figures 6 and 7). As regards the other inorganic species,
thermodynamic calculations established that biomass species behaved in one of two different
ways in terms of alkaline release. Thus, as illustrated in Figure 8, an empirical criterion was
derived in order to predict the agglomeration tendency of ash depending on potassium/silicon
and calcium/silicon ratios in the biomass.

159
Figure 6: H2S concentration in gas versus S concentration in biomass
Figure 7: NH3 concentration in gas versus N concentration in biomass
Risk of agglomeration
Figure 8: Ca/Si and K/Si ratios of biomass tested in the fluidised bed gasifier
4. CONCLUSIONS
The objective of the AMAZON project was to conduct a systematic study on the suitability of
French and Brazilian biomass feedstocks for gasification processes for BtL and SNG
applications. Insoluble administrative issues meant that only the French side of the project
could be (partially) carried out, and some tests on three Brazilian feedstock categories.
However, the work produced several interesting conclusions:
- As regards resources, the characterisation of various woody and agricultural biomass species
confirmed the wide variability of physico-chemical properties of relevance to gasification

160
processes, in particular ash content and composition in inorganic elements. Biomass species
can be clearly classified in three main ‘families’: mature wood, SRF/SRC and perennial crops,
and other agricultural biomass.
- As regards the conversion process, the tests showed that relevant biomass properties varied
with the processing steps. During torrefaction, mass loss kinetics and product yields can be
predicted according to the main ‘families’ (see above), with a difference between deciduous
and resinous wood, probably as a function of the macromolecular constituents (cellulose,
lignin, etc.). During gasification, the inorganic elements contained in biomass, in particular
calcium, potassium and silicon, appear as crucial parameters determining kinetics and the
agglomeration tendency of the ash.
- In general, the biomass appeared relatively suitable for gasification. It was possible
successfully to pretreat and gasify most of the samples tested with no major technical
difficulty and with similar yields in syngas after gasification. However, the use of agricultural
biomass as feedstock may be more problematic than the use of wood, with lower bio-oil
yields in fast pyrolysis and higher pollutant emissions and risks of ash agglomeration in
gasification due to its inorganic constituents.
5. FURTHER WORK
In the light of the results, it would now appear important to work on:
- improving feedstock quality through enhanced cultivation techniques, e.g. new approaches
to agricultural biomass collection could be based on collection in dry modality with on-site
milling;
- improving process flexibility, in particular by using biomass mixtures, to allow for the use
of problematic biomass types such as agricultural biomass species; and
- the economic and environmental assessment of the BtL and SNG routes by biomass type, in
order to characterise the biomass/process relationship and gauge the potential for
industrial-scale implementation.
6. REFERENCES
- Di Blasi C. and Lanzetta M., 1997, Intrinsic Kinetics of Isothermal Xylan Degradation in
Inert Atmosphere, Journal of Analytical and Applied Pyrolysis 40-41: 287–303
- Dupont C., Nocquet T., Da Costa J.A. jr, and Verne-Tournon C., 2011, Kinetic
Modelling of Steam Gasification of Various Woody Biomass Chars: Influence of Inorganic
Elements, Bioresource Technology 102 (20): 9743–48
- Dupont C., Rougé S., Berthelot A., Da Silva Perez D., Graffin A., Labalette F.,
Laboubée C., Mithouard J.C. and Pitocchi S., 2010, Suitability of Wood Chips and
Different Biomass Feedstocks for Use in a Semi-Industrial Plant of BtL Production by
Gasification, International Journal of Chemical Reactor Engineering 8 (A74)
- ECN, 2014, Phyllis2 — Database for Biomass and Waste, https://www.ecn.nl/phyllis2/
- Ranzi E., Cuoci A., Faravelli T., Frassoldati A., Migliavacca G., Pierucci S. and
Sommariva S., 2008, Chemical Kinetics of Biomass Pyrolysis, Energy and Fuels
- Van der Drift A., Van Doorn J. and Vermeulen J.W., 2001, Ten Residual Biomass Fuels
for Circulating Fluidised-Bed Gasification, Biomass and Bioenergy 20: 45–56
- Zanzi, R., 2001, Pyrolysis of Biomass: Rapid Pyrolysis at High Temperature; Slow
Pyrolysis for Active Carbon Preparation, Stockholm Royal Institute of Technology
- Zhang Y., Ashizawa M., Kajitani S. and Miura K., 2008, Proposal of a Semi-Empirical
Kinetic Model to Reconcile with Gasification Reactivity Profiles of Biomass Chars, Fuel 87
(4–5): 475–81

161
Acknowledgment
The AMAZON project was funded by the French National Research Agency (ANR,
Bioenergy Programme, Project No. ANR 08-BIOE-010).


163
Bioenergy monitoring and mapping in the European Union
N. Scarlat, J.F. Dallemand, F. Monforti-Ferrario, H. Medarac, M. Banja, K. Bódis
Renewables & Energy Efficiency Unit,
Institute for Energy & Transport,
Joint Research Centre of the European Commission (EC JRC)
Ispra (Va) Italy
1. Introduction and legal framework
The objective of this paper is to present and discuss some activities performed by the Joint
Research Centre of the European Commission (Institute for Energy & Transport) in the field
of renewable energy mapping & monitoring, with a specific focus on bioenergy. The main
activities selected and presented in this paper are:
- Statistical monitoring of the deployment of renewable energy and bioenergy in the European
Union;
- Status of bioeconomy in the European Union;
- Assessment of the availability of agricultural crop residues, optimal energy use of crop
residues and preservation of Soil Organic Carbon (SOC) stocks;
- Use of Municipal Solid Waste (MSW) for energy production in Waste-to-Energy (WtE)
plants.
It is considered that these topics are directly or indirectly linked to bioenergy development in
Latin America and that R&D in this field benefits from international cooperation (regarding
exchange of expertise & data between partners).
In 2007, the European Commission proposed an integrated Energy and Climate Change
package on the European Union (EU):
- Energy policy for Europe (COM, 2007),
- Limiting Global Climate Change to 2 degrees Celsius - The way ahead for 2020 and beyond
(COM 2007).
This included an EU commitment to achieve at least a 20% reduction of GreenHouse Gas
(GHG) emissions by 2020 compared to 1990 levels and a mandatory EU target of 20%
renewable energy, including a 10% target for renewable energy for 2020. A major milestone
for the development of renewable energy in the EU was set by the Renewable Energy
Directive 2009/28/EC (RED) on the promotion of renewable energy sources, which required
Member States (MS) to increase the share of renewable energy to 20% of gross final energy
consumption and 10% renewable energy in transport by 2020. The RED also includes the
requirement for the EU MS to prepare National Renewable Energy Action Plans (NREAPs)
with detailed roadmaps and measures taken to reach the RES (Renewable Energy Sources)
targets and develop the energy infrastructure.

164
In order to reach the climate change target below 2°C, the European Council and the
European Parliament have also set the objective of reducing GHG emissions between 80%
and 95% by 2050, compared to 1990 levels. In 2011, the European Commission adopted the
Roadmap for moving to a competitive low carbon economy in 2050 (COM, 2011) and Energy
Roadmap 2050 (COM, 2011). The Roadmap for moving to a competitive low carbon
economy in 2050 set key elements for the climate action,intermediate milestones for a cost-
efficient pathway and identified policy challenges, investment needs and opportunities in
different sectors. The Energy Roadmap 2050 investigatedpossible pathways towards a
decarbonisation of the energy system and the associated impacts, challenges and opportunities.
The Roadmap includes a decrease of primary energy demand between 16% to 20% by 2030
and 32% to 41% by 2050, as compared to maximum levels reached in 2005-2006. The RES
share is projected to rise substantially in all proposed scenarios, reaching between 55% and
75% of gross final energy consumption in 2050.
For a medium term perspective, the Communication “Renewable Energy: a major player in
the European energy market” (COM, 2012) examined the conditions for a further
development of renewable energy beyond 2020. It aimed to ensure that renewable energy
contributes to security and diversity of energy supply, environment and climate protection, as
well as economic growth, regional development and innovation. The Communication calls for
a coordinated approach in the reform of support schemes to ensure greater consistency in
national approaches and avoid fragmentation of the internal market. The Communication
(COM, 2014) on a policy framework for climate and energy in the period from 2020 to 2030
has proposed an integrated framework to drive progress towards a low-carbon economy. The
European Council Conclusions on 2030 Climate and Energy Policy Framework endorsed in
October 2014 a binding EU target of 40% reduction in GHG emissions by 2030 compared to
1990, a binding target of at least 27% for the share of renewable energy in 2030 and a 27%
energy efficiency indicative target.
2. Renewable energy and bioenergy contribution in the European Union
The use of renewable energy is projected to increase substantially in the EU, to reach a share
of 20% renewable energy in final energy consumption and 10% in transport by 2020. The EU
has made significant progress since 2005 and is on track to reach its 2020 renewable energy
targets.
2.1 Renewable energy and bioenergy projections for 2020
The EU MS have prepared NREAPs setting out national targets for the share of renewable
energy used in electricity, heating and cooling and in transport, and measures for achieving
them (EC, 2009).The use of renewable energy is projected to increase from 4,181 PJ in 2005
to 10,255 PJ in 2020. The EU had a share of renewable energy source of 8.1% in the final
energy consumption in 2005 and it is expected to exceed 20% in 2020. The RES has seen a
significant growth recently, reaching 14,17 % of final energy consumption in 2012, well on
track to achieve its 2020 targets. The contribution of different renewables is expected to
change significantly until 2020, due to increased contribution of wind, solar and heat pumps,
changing the whole energy mix and contributing to the diversification of energy sources.The
share of bioenergy in the final energy consumption will increase from 5.0% in 2005, 8.6 % in
2012 to almost 12% in 2020 (EC, 2014b; Banja et al., 2013).

165
2005* 2010 2010* 2012 2012* 2015 2020
Hydro 1,230 1,245 1,223 1,255 1,182 1,278 1,331
Geothermal 38 51 42 61 46 83 150
Solar 34 137 146 224 336 347 634
Marine 2 2 2 2 2 3 23
Wind 253 597 559 785 715 1,109 1,760
Heat pumps 25 169 183 227 288 305 514
Bioenergy 2,598 3,594 4,127 3,967 4,057 4,510 5,841
Total RES 4,181 5,794 6,283 6,520 6,621 7,636 10,255
RES share [%] 8.1 11.5 12.6 12.9 14.1 15.1 20.6
Table 1: Final renewable energy consumption in the EU (PJ)
(* achieved, according to aggregated data from the MS Progress Reports)
2.1.1 Renewable electricity
The installed capacity of renewable electricity plants increased in the EU from 170 GW in
2005 to 312 GW in 2012, with a bioenergy capacity which almost doubled since 2005 to
reach 29 GW in 2012. Solid biomass plants have the highest share in biomass capacity, with
more than two thirds; the biogas plant capacity increased significantly and is well above the
projections for 2012, with good perspectives for reaching the targets. The development in the
use of bioliquids will depend on sustainability constraints. Despite the progress made, the
share of bioenergy in the renewable power capacity decreased from 2005 in 2012, due to the
faster developments in solar and wind. Even with a large increase in the biomass power
capacity expected until 2020, the share of bioenergy is expected to remain at about 9%.
2005 2010 2010* 2012 2012* 2015 2020
Hydropower 110,414 113,074 103,091 115,524 105,376 119,405 127,165
Geothermal 741 816 823 881 782 1,047 1,623
Solar 2,221 25,989 29,727 39,829 70,812 57,817 90,499
Marine 240 245 243 261 247 372 2,253
Wind 40,447 85,550 84,395 107,979 106,373 143,174 210,993
Biomass 15,741 22,686 25,093 25,978 29,003 32,665 43,717
Total RES 169,804 248,359 243,371 290,452 312,313 354,480 476,248
Biomass share in RES [%] 9.3 9.1 9.6 8.9 8.2 9.2 9.2
Table 2: Installed RES capacity in the EU (MW)
The renewable electricity production increased by 60% between 2005 and 2012, with a share
in the electricity use increasing in 2012, above the NREAPs projections. The renewable
electricity contribution in the EU is expected to reach 1,210 TWh in 2020, representing about
34% of final electricity consumption. Biomass electricity is expected to increase from 69
TWh in 2005 to 233 TWh in 2020(EC, 2014b; Banja et al., 2013); despite such progress, its
contribution would remain at around 19% of renewable electricity. Solid biomass is the main
contributor to biomass electricity; the share of biogas electricity is expected to increase until
2020, but recent developments already brought the share of biogas above the expected level
for 2020. The capacity of biomass plants is expected to rise from 44 GW in 2020 to 52 GW
by 2030 and could reach 87 GW in the reference scenario and between 106 and 163 GW in
different decarbonisation scenarios (Energy Roadmap 2050, EC, 2011). Biomass electricity
production is projected to further increase to 360 TWh in 2050 in the reference scenario and
to 460 - 494 TWh in 2050 in different decarbonisation scenarios. Biomass electricity
contribution could rise from 2.1% share in power generation in 2005 to 6.6% in 2020 and to
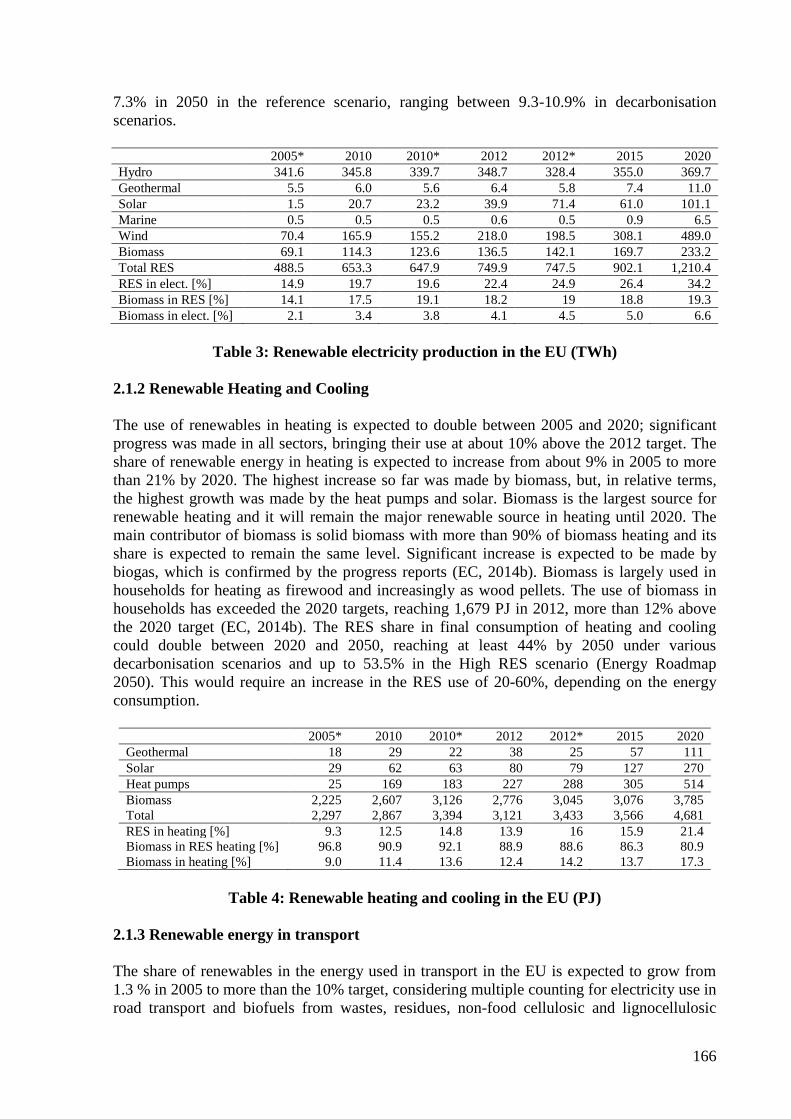
166
7.3% in 2050 in the reference scenario, ranging between 9.3-10.9% in decarbonisation
scenarios.
2005* 2010 2010* 2012 2012* 2015 2020
Hydro 341.6 345.8 339.7 348.7 328.4 355.0 369.7
Geothermal 5.5 6.0 5.6 6.4 5.8 7.4 11.0
Solar 1.5 20.7 23.2 39.9 71.4 61.0 101.1
Marine 0.5 0.5 0.5 0.6 0.5 0.9 6.5
Wind 70.4 165.9 155.2 218.0 198.5 308.1 489.0
Biomass 69.1 114.3 123.6 136.5 142.1 169.7 233.2
Total RES 488.5 653.3 647.9 749.9 747.5 902.1 1,210.4
RES in elect. [%] 14.9 19.7 19.6 22.4 24.9 26.4 34.2
Biomass in RES [%] 14.1 17.5 19.1 18.2 19 18.8 19.3
Biomass in elect. [%] 2.1 3.4 3.8 4.1 4.5 5.0 6.6
Table 3: Renewable electricity production in the EU (TWh)
2.1.2 Renewable Heating and Cooling
The use of renewables in heating is expected to double between 2005 and 2020; significant
progress was made in all sectors, bringing their use at about 10% above the 2012 target. The
share of renewable energy in heating is expected to increase from about 9% in 2005 to more
than 21% by 2020. The highest increase so far was made by biomass, but, in relative terms,
the highest growth was made by the heat pumps and solar. Biomass is the largest source for
renewable heating and it will remain the major renewable source in heating until 2020. The
main contributor of biomass is solid biomass with more than 90% of biomass heating and its
share is expected to remain the same level. Significant increase is expected to be made by
biogas, which is confirmed by the progress reports (EC, 2014b). Biomass is largely used in
households for heating as firewood and increasingly as wood pellets. The use of biomass in
households has exceeded the 2020 targets, reaching 1,679 PJ in 2012, more than 12% above
the 2020 target (EC, 2014b). The RES share in final consumption of heating and cooling
could double between 2020 and 2050, reaching at least 44% by 2050 under various
decarbonisation scenarios and up to 53.5% in the High RES scenario (Energy Roadmap
2050). This would require an increase in the RES use of 20-60%, depending on the energy
consumption.
2005* 2010 2010* 2012 2012* 2015 2020
Geothermal 18 29 22 38 25 57 111
Solar 29 62 63 80 79 127 270
Heat pumps 25 169 183 227 288 305 514
Biomass 2,225 2,607 3,126 2,776 3,045 3,076 3,785
Total 2,297 2,867 3,394 3,121 3,433 3,566 4,681
RES in heating [%] 9.3 12.5 14.8 13.9 16 15.9 21.4
Biomass in RES heating [%] 96.8 90.9 92.1 88.9 88.6 86.3 80.9
Biomass in heating [%] 9.0 11.4 13.6 12.4 14.2 13.7 17.3
Table 4: Renewable heating and cooling in the EU (PJ)
2.1.3 Renewable energy in transport
The share of renewables in the energy used in transport in the EU is expected to grow from
1.3 % in 2005 to more than the 10% target, considering multiple counting for electricity use in
road transport and biofuels from wastes, residues, non-food cellulosic and lignocellulosic

167
material (biofuels defined in article 21.2 of the RED) (EC RED, 2009). Despite certain
progress, the use of biofuels decreased in 2012, partly due to the delays in the implementation
of the sustainability criteria. Biofuels art. 21.2 are expected to be commercially available by
2020 and to reach a share of 9% of biofuels (EC, 2014b; Banja et al., 2013). The proposal to
cap the share of food-based biofuels to 7% (CE, 2014) might significantly impact the use of
renewable energy in transport. A significant amount of biofuels is expected to be imported in
2020 (almost 38% of biofuels). A part of biofuels could come from internal EU trade and the
rest could be imported from third countries. Some raw material (e.g. rapeseed, soy or palm
oil) is also expected to be imported and processed within the EU.
2005* 2010 2010* 2012 2012* 2015 2020
Biofuels 125.4 575.2 555.9 699.5 499.7 822.7 1,216.4
RES electricity 45.8 54.7 47.0 65.9 55.8 83.0 135.9
of which in road transport 0.6 0.9 0.3 2.1 0.8 6.3 29.6
Total RES (single counting) 171.2 630.7 605.1 765.5 555.5 905.9 1,352.4
Table 5: Expected use of renewable energy in transport in the EU (PJ)
At long term, biofuels use in transport in decarbonisation scenarios was projected to increase
to 25-36 Mtoe in 2030 and 68-72 Mtoe in 2050 (EC, Energy Roadmap 2050). The share of
renewables in transport (biofuels and renewable electricity) is expected to reach around 11%
in 2020 in all decarbonisation scenarios and it is expected to rise to 19-20% in 2030 and up to
62-73% in 2050.
2005* 2010 2010* 2012 2012* 2015 2020
Share of biofuels (double counting) 1.0 4.5 4.7 5.5 5.4 6.5 10.1
Share of art 21.2 in biofuels 1.2 3.1 4.3 3.4 18.3 4.9 9.0
Share of import biofuels 5.7 32.4 33.4 32.9 24.7 32.1 37.7
Share of RES in transport 1.3 4.9 5.1 6.1 6.0 7.2 11.4
Table 6: Estimated share of biofuels in transport in the EU (%)
2.2. Biomass demand, supply and potential
In a previous study (Scarlat et al., 2013) the biomass demand for all EU MS until 2020 has
been estimated and then compared with the biomass potential. Several studies provide
estimates of the biomass potential in the EU by addressing to a different extent forest,
agriculture and waste. The environmental constrained biomass potential was estimated by the
European Environment Agency (EEA 2006) at 9,839 PJ, of which 1,641 PJ from forestry,
4,007 PJ from agriculture and 4,181 Mtoe from waste (Scarlat et al., 2013). Another study,
performed by the Biomass Futures project (Elbersen, 2012), shows that the biomass
sustainable potential might be even larger in 2020, reaching 15,686 PJ, of which 7,006 PJ
from forestry, 6,604 PJ from agriculture and 2,076 PJ from waste. Thus, the biomass potential
of the EU is in principle large enough to ensure the biomass demand of 7,437 PJ needed to
reach the EU 2020 bioenergy targets.

168
Figure 1: Primary biomass demand in 2020 and biomass potential in EU MS
2.3. Conclusions
Considering the progress made on the deployment of renewable energy, the EU could reach
its 2020 targets, despite a reduction in the investments and the supporting schemes in several
MS. The recent framework for climate and energy endorsing the 27% renewable energy target
for 2030 should continue to support the development of renewable energy. Despite high
growth rates in PV and wind, biomass is expected to remain the main renewable source. Our
estimates show that domestic resources could provide enough feedstock for reaching the
bioenergy targets. The future of bioenergy will be defined by technological developments or
cost improvements for some technologies including advanced biofuels.
3. The role of biomass and bioenergy in the bioeconomy
The European Commission has set a long-term goal to develop a competitive, resource
efficient and low carbon economy by 2050. Bioeconomy is expected to play an important role
in the low carbon economy. New sectors are emerging, such as biomaterials and green
chemistry. The transition towards bioeconomy will rely on the technological advancement of
a range of processes, the achievement of a breakthrough in terms of technical
performances/cost effectiveness and will depend on the availability of sustainable biomass.
3.1. Bioeconomy in the EU: state of play and potential
The EU has a number of well-established traditional bio-based industries, ranging from
agriculture, food, feed, fibre, forest-based industries (including pulp and paper and wood
products), to biotechnology, chemicals, biofuels and bioenergy. Bioeconomy is one of the
largest and most important components of the EU economy. We estimated (Scarlat et al.,
2015) the annual bio-based economy turnover at about € 2.4 billion (including agriculture,
food and beverage, agro-industrial products, fisheries and aquaculture, forestry, wood
industry, biochemical, enzymes, biopharmaceutical and bioenergy), with 22 million persons
employed.
0
500
1,000
1,500
2,000
2,500
AT
BE
BG
CY
CZ
DE
DK
EE
EL
ES FI
FR
HU
HR IE IT LT
LU
LV
MT
NL
PL
PT
RO
SE SI
SK
UK
Bio
mass [P
J]
biofuels bioliquids
biogas solid biomass
biomass potential (EEA) biomass potential (Biomass Futures)

169
World European Union
[million tonnes] [million tonnes]
Food crops 7,573 684
Fibre crops 35 0
Fodder crops 1,078 564
Crops 8,686 1,248
Crop residues 2,359 212
Agricultural biomass 11,044 1,460
Wood 2,389 290
Agriculture and forest biomass 13,434 1,750
Meat and animal products 1,153 200
Aquatic biomass 181 14
Total biomass 14,768 1,965
Table 7: Biomass supply worldwide and in the EU (2011)
Significant amounts of biomass are used worldwide and in the European Union for various
uses; for the EU, almost 2 billion tonnes biomass were used in total (including agricultural
and forestry biomass, animal products and aquatic biomass) as shown in Table 7 (Faostat,
2014). The data, however, do not include various waste categories, such as waste from food
industry, food waste or other biogenic waste.
Figure 2: Use of biomass in the EU in 2011
(Source Faostat, 2014)
3.2. Bioenergy production
The mandatory targets for the use of renewable energy in transport have boosted the use of
biofuels in the EU, reaching 499.7 PJ in 2012 and this should increase to about 1,216 PJ Mtoe
in 2020 (more than 90% of the renewable energy to be used in transport) (EC, 2014b).
Presently, biofuels are largely produced from crops also used for food (sugar and starch crops
for bioethanol, oil crops for biodiesel). For the EU, we estimated (Scarlat et al., 2015) that
about 40 Mt of biomass feedstock were used in 2012 to produce biofuels (21 Mt for
bioethanol and 19 Mt for biodiesel). A significant share of the feedstock for domestically
produced biodiesel (rapeseed, soybean) came from import, together with vegetable oil (mainly
palm oil). For 2020, about 63 Mt of biomass could be used for food crop-based biofuels and
about 15 Mt of lignocellulosic feedstock for advanced biofuels. Significant amounts of by-
products e.g., Distillers Dried Grains (DDGs), oil meals… are produced and generally used
for feed and this is expected to increase accordingly.
12.5%
48.6%
21.5%
0.9%
1.4%
1.3% 13.7%
The use of biomass from agriculture and forestry
food
feed
processing
seed
other
waste
energy
20.8%
44.1%
19.2%
0.8%
1.6%
1.2%
12.2%
Total biomass
food
feed
processing
seed
other
waste
energy

170
Figure 3: Feedstock use for biofuel production in the EU in 2012
For the EU, bioenergy is expected to account for about 57% of the renewable energy use in
2020, of which 45% will consist in heat and electricity and 12% will be provided by biofuels
(Ecofys, 2012, Banja et al., 2013). We estimate (Scarlat et al., 2015) that about 280 Mt
biomass was used in 2012 for bioenergy, out of which 240 Mt biomass was used for heating
and electricity production. Of this, about 178 Mt came from forestry, 32 Mt from agriculture
and 30 Mt from waste. Based on the projections made for 2020 on the use of biomass for
energy generation, we estimated about 420 Mt biomass would be used for heating and
electricity. Of this, about 224 Mt came from forestry, 136 Mt from agriculture and about 60
Mt from waste.
2012 2020
Forestry biomass 178 224
Wood biomass (wood fellings etc.) 100 144
Wood residues and co-products 78 80
Agricultural biomass 72 136
Energy crops 40 84
Agricultural by-products / residues 32 52
Waste 30 60
Total 280 420
Table 8: Biomass use for bioenergy in the EU
(Mt) Source: own calculation
3.3. Bio-based industries
The contribution of biotechnology to the EU economy is currently modest, but growing
rapidly. Biotechnology makes use of biological systems and processes to manufacture
products in industry (white biotechnology), medicine (red biotechnology), agriculture (green
biotechnology), aquaculture (blue biotechnology). The EU chemical industry produces a wide
range of products, such as base chemicals (petrochemicals and basic inorganics), polymers
(plastics, rubber, fibres), speciality chemicals (paints and inks, crop protection products, dyes
and pigments) and consumer chemicals (detergents, perfumes and cosmetics). From a market
point of view, white biotechnology has a larger long-term business potential than red
biotechnology. More than 20% of all chemicals coming from the traditional chemistry sector
could be produced by biotechnology in 2020 (Meyer and Werbitzky, 2011). There are already
18.8%
19.8%
1.8%
1.7%
57.9%
Feedstock use for bioethanol production in the EU
wheat
maize
barley
rye
sugar beet 65.9%
9.7%
8.4%
7.6%
4.0%
2.9%
1.4%
Feedstock use for biodiesel production in the EU
rapeseed oil
palm oil
recycled vegetableoil
soybean oil
animal fat
sunflower oil
other

171
several bio-based products on the market and the chemical industry has used about 8.6 Mt
renewable raw materials in 2011 in the EU in comparison with 90 Mt feedstock used for
various chemicals (Cefic, 2014b).
Figure 4: Chemical industry market and use of bio-materials in the EU in 2011
(Cefic, 2014)
3.4 Biomass demand, supply and potential
Biomass availability and the competition between the alternative use of biomass (food, feed,
fibre, bio-based materials and bioenergy) are major concerns for the development of
bioeconomy. The assessment of the future biomass availability is difficult to perform and
dependent on the assumptions made regarding the future demand for various uses, including
food and feed (translated into land requirements) as well as the industrial products and energy.
The estimates for the potential of energy crops depend on the land area expected to be
available, which depends on the assumptions about population growth, diet and crop yield
developments.
Current potential 2020 potential 2030 potential
[PJ] [PJ] [PJ]
Forestry 1,779-4,490 1,717-4,605 2,303-4,647
Agriculture 1,968-2,135 3,684-4,019 2,931-5,945
Waste 4,145-6,029 4,145-7,411 4,019-7,201
Total 7,892-13,105 9,546-16,035 9253-17,794
Table 9: Biomass potential for energy use in the EU
(From EEA 2006 and Elbersen 2012)
The biomass supply for bioenergy production (electricity and heating) is expected to further
increase, to reach about 6,045 PJ in 2030 and 6234 PJ in 2050 in the reference scenario of the
Energy Roadmap 2050, ranging between 5765 PJ and 6798 PJ in 2030 and between 7247 PJ
and 9603 PJ in different decarbonisation scenarios of the Energy Roadmap 2050. On long
term, biofuels consumption in transport was projected to increase to 1476 PJ in the Reference
scenario in 2030 and 1547 PJ in 2050, ranging between 1048-1100 PJ in 2030 and 2863-3033
PJ in 2050, in different scenarios (EC, 2011). Thus, we estimated (Scarlat et al., 2015) that the
use of biomass for bioenergy could increase to 420 Mt biomass in 2030 and 432 Mt in 2050 in
the reference scenario, ranging between 378 Mt and 439 Mt in 2030 and between 562 Mt and
702 Mt in different decarbonisation scenarios in 2050. This biomass demand can be met by
27.7
15.2
20.7
25.4
11.5
Chemical industry market by sector
petrochemicals
basic innorganics
polymers
specialty chemicals
consummerchemicals
18%
6%
10%
18%
19%
14%
6%
9%
The use of bio materials in chemical industry
vegetal oil
animal fat
chemical pulp
starch and sugar
bioethanol
natural rubber
glycerol
others

172
EU domestic biomass resources, but the biomass mobilisation from all sources is the key
factor and is depending on the cost of biomass.
3.5. Conclusions
Biomass is expected to contribute to almost 60% of the EU renewable energy targets in 2020.
Within this framework, biomass sustainability is thus a key issue. An important issue to
monitor is the competition of uses between traditional uses of biomass (food, feed and fibre),
bioenergy, traditional forest industries (wood panel, pulp and paper) and growing sectors such
as biomaterials and green chemistry. This might open perspectives for an integrated use of
biomass through a cascading approach or by setting up biorefineries. A significant growth in
the demand for biomass for bio-based materials and for energy will increase the competition
for natural resources, in particular for land and water resources with a potential impact to be
monitored e.g. on land use patterns and biodiversity.
4. Assessment of the availability of agricultural crop residues in the European Union
4.1. Production of agricultural crop residues in the EU27
In the EU, cereals (mainly wheat and maize) represent the highest share in agricultural crop
production. Sunflower and rapeseed are also important crops grown in certain EU regions for
oil production (food use), for feed, as well as for biofuel production. There are large
differences in terms of cultivated area, types of crops and yields, due to climate, soil and
farming practices between Member States (MS). Annual crops show high variations in yield
from one year to another, particularly at local level, depending on precipitations in rain-fed
conditions that lead to a large variability in the crop residues produced. Crop yields depend
upon specific local agro-ecological conditions (climate and precipitation patterns, soil
properties, etc.), plant varieties… Significant amounts of residues are generated from crop
production and partially remain in the field after harvest. Crop residue production also
depends on a number of factors that include the type of crop and plant variety, crop rotation,
crop mix, crop yield and harvesting techniques.
4.2 Assessment of crop residue availability
Data on crop yields are easily available, while data on the straw and stover yields are not
directly available, due to the complexity of the assessment and due to the fact that historically
the aim of agricultural production has been to maximise the yield of the main product, while
the total biomass yield was not considered important.
The estimation of the agricultural crop residues availability was performed taking into
account:
- crop type and area,
- crop yield (wheat, rye, barley, oats, maize, rice, rapeseed and sunflower),
- crop residue to yield ratios,
- crop residue removal rate according to environmental constraints and soil conservation
requirements,
- competitive uses of crop residues for animal bedding and mushroom production.

173
The estimates of crop residues include the major crop residues produced in EU 27, averaged
over a period of 10 years (1998-2007). Crop residue production was calculated for each year
and the average, minimum and maximum amounts of residues were determined in order to
take into account the large annual variation of the crop production.
4.2.1. Residue to crop production ratios
Crop residue production is even more variable than crop yields. Residue to crop production
ratios are influenced by climate, soil conditions and farming practices (tillage, density of
planting, fertilisation…) (Patterson et al., 1995; Summers et al., 2003; Graham et al., 2007). A
wide variation in residue to yield ratios is reported in the literature.
Crop correlation R2
Wheat y = -0.3629·Ln(x) + 1.6057 0.2795
Rye y = -0.3007·Ln(x) + 1.5142 0.2198
Oats y = -0.1874·Ln(x) + 1.3002 0.2121
Barley y = -0.2751·Ln(x) + 1.3796 0.3631
Maize y = -0.1807·Ln(x) + 1.3373 0.1732
Rice y = -1.2256·Ln(x) + 3.845 0.5727
Sunflower y = -1.1097Ln(x) + 3.2189 0.2551
Rapeseed y = -0.452·Ln(x) + 2.0475 0.1669
Table 10: Correlations for the residue-to-yield ratios for different crops
(Scarlat et al., 2010)
The relationship between the residue-to-yield ratios and crop yield can possibly be used for a
better estimation with higher accuracy of the crop residue production. In this study (Scarlat et
al., 2010) residue-to-yield ratios curves have been derived for each type of crop.
4.2.2. Crop residue collection
Agricultural crop residues play an important role in maintaining soil characteristics related to
the soil organic matter, mineral nutrients, water retention and erosion risk. An important issue
is to establish sustainable removal rates, which would allow maintaining soil conditions. The
residue removal rate varies depending on a combination of factors, including crop, plant
variety, farming practices (crop rotation, tillage, fertilisation), site conditions (soil type, soil
organic matter, moisture, erosion risk, etc.) (Walsh et al., 2000; Kadam and McMillan, 2003),
climate conditions (wind, precipitations), (Nelson, 2002; Wilhelm et al., 2004; Graham et al.,
2007), harvest height (Summers et al., 2003) and lower yields (Van der Sluis et al., 2007). A
number of studies provide estimates on the collection of crop residue from the land, generally
varying between 30-60%. This study considered crop residue collection rates of 40% for
wheat, barley, rye, oat and of 50% for maize, rapeseed and sunflower. This was considered as
sustainable with enough material left on the ground to maintain soil fertility. The choice of
these factors was based on experts estimations and derived from data reported in the literature
on sustainable rates (Kadam and McMillan, 2003; Katterer et al., 2004; Van der Sluis et al.,
2007).
4.2.3. Competitive uses of crop residues
In addition to the environmental constraints and economic considerations, the availability of
crop residues for bioenergy production depends on other competing uses (incorporation into
the soil, animal feed and bedding, mushroom cultivation, surface mulching in horticulture and

174
industrial uses (constructions, pulp and paper...) (Powlson, 2011). The demand of straw for
competitive uses is difficult to estimate since there are scarce data available. For the use of
straw in the EU for cattle bedding, a consumption of 1.5 kg of straw/day per head of cattle
was considered (used by a quarter of the cattle population and with a similar rate of straw
used by equines). For sheep, an average consumption of 0.1 kg straw/day per head was
considered and 0.5 kg of straw/day/head of pig for one-eighth of the pig population (Tuyttens,
2005).
4.3. Crop residue production
Crop residue yields were calculated using the residue to product ratio previously developed
(Scarlat et al., 2010) for all EU MS. Crop residue production was afterward established based
on crop residue yields and crop acreage. The amount of straw SPi available from the i crop
was estimated as:
SPi,j = GPi * CRi * SGRi,j *(1-StMi) / (1-SeMi)
Where GPi is the crop production; CRi is the collection rate for the straw of the i crop, StMi
and SeMi are the straw and seed moisture of the i cereal. SGRi is the straw-to-grain ratio
depending on the crop yield.
SGRi = ai* ln(xi) + bi
Residue to seed
ratio
Availability [%] Seed moisture [%] Straw moisture [%]
Wheat 0.8 - 1.6 40 15 15
Rye 0.9 - 1.6 40 15 15
Barley 0.8 - 1.3 40 15 15
Oats 0.9 - 1.4 40 15 15
Maize 0.9 - 1.2 50 15 30
Rice 1.2 - 2.2 50 20 25
Rapeseed 1.4 - 2.0 50 15 40
Sunflower 2.2 - 3.2 50 15 40
Table 11: Characteristics of agricultural crop residues
The average total amount of crop residues produced in EU 27 was estimated at 258 Mtons of
dry matter/year. The share of different crop residues in EU 27 was calculated (Fig. 5). The
results show that 111 Mt of dry matter of crop residues/year can be collected, on average, in
EU 27, but this amount can vary between 86–133 Mt dry matter/year (Fig.6).
Figure 5: Production of crop residues in
EU 27
Figure 6: Total collectable crop residues in
EU 27
Total production of crop residues in EU27
0
10
20
30
40
50
60
BE
BG
CZ
DK
DE
EE IE G
ES
FR IT
CY
LV
LT
LU H
MT
NL
AT
PL
PT R SI
SK FI
SE
UKCro
p r
esid
ue
s p
rod
uctio
n [
Mt
dry
/ye
ar]
Min Average Max
Total collectable crop residues in EU27
0
5
10
15
20
25
30
BE
BG
CZ
DK
DE
EE IE
GR
ES
FR IT
CY
LV LT
LU
HU
MT
NL
AT
PL
PT
RO SI
SK FI
SE
UK
Collecta
ble
cro
p r
esid
ues [
M d
ry t
/year]
Min Average Max
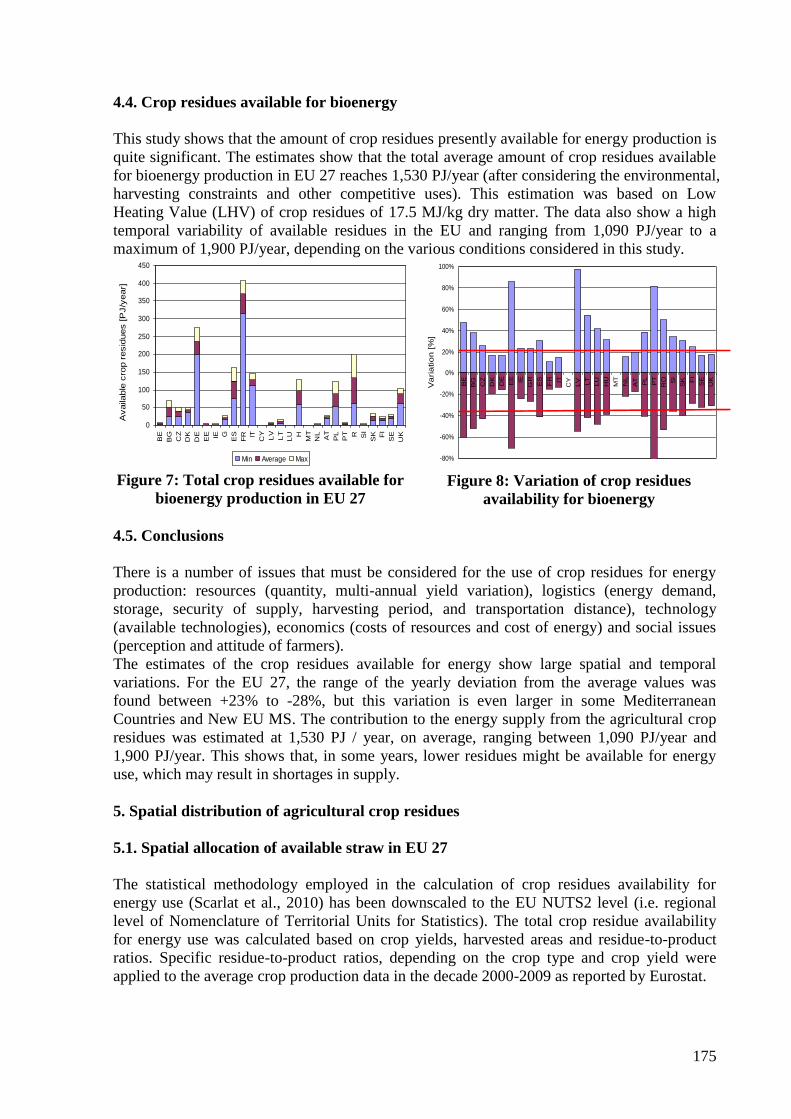
175
4.4. Crop residues available for bioenergy
This study shows that the amount of crop residues presently available for energy production is
quite significant. The estimates show that the total average amount of crop residues available
for bioenergy production in EU 27 reaches 1,530 PJ/year (after considering the environmental,
harvesting constraints and other competitive uses). This estimation was based on Low
Heating Value (LHV) of crop residues of 17.5 MJ/kg dry matter. The data also show a high
temporal variability of available residues in the EU and ranging from 1,090 PJ/year to a
maximum of 1,900 PJ/year, depending on the various conditions considered in this study.
Figure 7: Total crop residues available for
bioenergy production in EU 27
Figure 8: Variation of crop residues
availability for bioenergy
4.5. Conclusions
There is a number of issues that must be considered for the use of crop residues for energy
production: resources (quantity, multi-annual yield variation), logistics (energy demand,
storage, security of supply, harvesting period, and transportation distance), technology
(available technologies), economics (costs of resources and cost of energy) and social issues
(perception and attitude of farmers).
The estimates of the crop residues available for energy show large spatial and temporal
variations. For the EU 27, the range of the yearly deviation from the average values was
found between +23% to -28%, but this variation is even larger in some Mediterranean
Countries and New EU MS. The contribution to the energy supply from the agricultural crop
residues was estimated at 1,530 PJ / year, on average, ranging between 1,090 PJ/year and
1,900 PJ/year. This shows that, in some years, lower residues might be available for energy
use, which may result in shortages in supply.
5. Spatial distribution of agricultural crop residues
5.1. Spatial allocation of available straw in EU 27
The statistical methodology employed in the calculation of crop residues availability for
energy use (Scarlat et al., 2010) has been downscaled to the EU NUTS2 level (i.e. regional
level of Nomenclature of Territorial Units for Statistics). The total crop residue availability
for energy use was calculated based on crop yields, harvested areas and residue-to-product
ratios. Specific residue-to-product ratios, depending on the crop type and crop yield were
applied to the average crop production data in the decade 2000-2009 as reported by Eurostat.
Total crop residues available for bioenergy in EU27
0
50
100
150
200
250
300
350
400
450
BE
BG
CZ
DK
DE
EE IE G
ES
FR IT
CY
LV
LT
LU H
MT
NL
AT
PL
PT R SI
SK FI
SE
UK
Availa
ble
cro
p r
esid
ues [P
J/y
ear]
Min Average Max
Variation of crop residues availability in EU27
-80%
-60%
-40%
-20%
0%
20%
40%
60%
80%
100%
BE
BG
CZ
DK
DE
EE IE
GR
ES
FR IT
CY
LV LT
LU
HU
MT
NL
AT
PL
PT
RO SI
SK FI
SE
UK
Va
ria
tio
n [
%]

176
Figure 9: Estimated amounts of produced (left) and available (right) straw
in EU 27 NUTS2 regions
The resulting available straw amount for each NUTS2 region has been geographically
allocated on the basis of several spatial layers describing e.g. land cover, expected biomass
productivity based on soil parameters, climatic zones and topography (Tóth et al. 2011).
Figure 10: Tons of straw and crop residues
per km2
potentially available for energy
uses in EU 27
Figure 11: Energy content in GJ/ha of
straw potentially available for energy uses
in EU 27
The spatial allocation of straw was completed in five main geo-processing steps. At first, the
geographical area of cropland in general was identified based on the European land cover data,
version 13 (Corine Land Cover 2000, CLC2000) at 100 m resolution. The amount of available
straw calculated at NUTS2 regions level was evenly distributed in the corresponding cells in
the second processing step. The global dataset of net primary production, McGill M3 Crop
Data Level 2 dataset (Monfreda et al. 2008) has been applied in the third processing step

177
weighting between cell values having the average values of straw production within NUTS2
regions. In the fourth processing step the spatial distribution of straw has been modified using
the results of a complex European biomass productivity model (Tóth et al. 2011) in the
weighting. The 100 m resolution raster data set was aggregated in the final step using a
function that partitioned the input 100 m resolution grid into blocks (1 km) calculated the sum
of the values for the specified cells (defined by the neighbourhood parameters: 10 x 10)
within the blocks.
5.2. Power plants size and collection points
For the estimation of the number of straw plants that could be built in the EU and their
location, we have considered as "typical" a straw CHP plant with a capacity of 50 MW
thermal input and with a typical straw need of about 100 kt/year. Such a power plant is
expected to have an efficiency of 25-30% for electricity production and about 55-60% for
heat production. This plant capacity has been considered as an optimal size providing a good
balance between operational costs and revenues given the logistic and resource constraints.
We have considered suitable a location for this power plant if the necessary straw amount can
be found within a radius of 50 km, corresponding to a maximum travel distance of 70 km. In
order to identify the best suitable locations for the plants, two different procedures have been
developed.
- Optimized approach.
The straw map was scanned in order to identify the collection regions with the highest density
of straw in order to allow the use of the resources with the lowest logistic cost (Edwards et al
2005). The straw amount is calculated for each point with collection radius r increased by one
kilometre each time, until r reaches max 50 km. The zones containing at least the minimum
plant need (100 kt) were identified and a straw plant was placed in that point. Following plant
positioning, all the straw within the radius r is taken out from the map; map scanning is
repeated until it was not possible to find any area containing enough straw. This approach
relies on the idea that the main rationale for building a straw plant is the optimal use of
feedstock, i.e. building a plant firstly in the highest density areas. This is also the main
limitation, as it includes the assumption of a planning for large scale operation, which might
not always be the case.
- Randomized approach.
In the randomized approach, the potential plant locations are investigated in a random order.
The straw amount is calculated for circles with increasing radius, from 1 to 50 km. When the
area contains the requested 100 kt of straw, the procedure stops, and all the straw contained is
taken out form the map. Then, the next random location is examined. The procedure ends
when the last potential point is examined. Randomization incorporates the assumption of the
un-coordinated planning for plant location aiming optimal use of resources. Repeating the
procedure several times provides a range of plants numbers and a probability distribution of
locations, which is even more useful than the evaluation of optimal values.

178
5.3. Combined Heat & Power (CHP) plants and energy production
The optimized plant localization approach was compared with the Monte Carlo simulations
for the randomized localization approach where the full sequence of positioning procedure
was repeated 10 times. In the optimized approach, 808 plants were positioned all over EU
potentially using the 81.7 % of the straw for energy production, while the randomized
approach allowed to place between 834 and 852 plants with a collection capacity ranging
from 84.4% and 86.0% of the available straw.
Randomized allocation Optimized allocation
Number of plants 834-852 808
Primary energy 1.51 – 1.54 EJ 1.46 EJ
% of straw actually used for
energy production
84.4 – 86.0 % 81.7%
Table 12: Number of plants, energy produced and % of straw actually used
A less optimized approach allows more plants to be allocated on the map, which can exploit a
slightly higher amount of straw. This is due to the fact that in the optimised approach, a plant
is likely to be placed in the most dense production zones and leave other areas unexploited.
Randomly placed plants are more likely to exploit the less dense areas that are typically
neglected by the optimized procedure. Under these assumptions, the fraction of straw used
can vary between 0.8 and 0.95 for larger countries or for countries with higher straw resources.
Figure 12: Optimized (left) and randomized (right) distribution
of straw power plants in EU 27
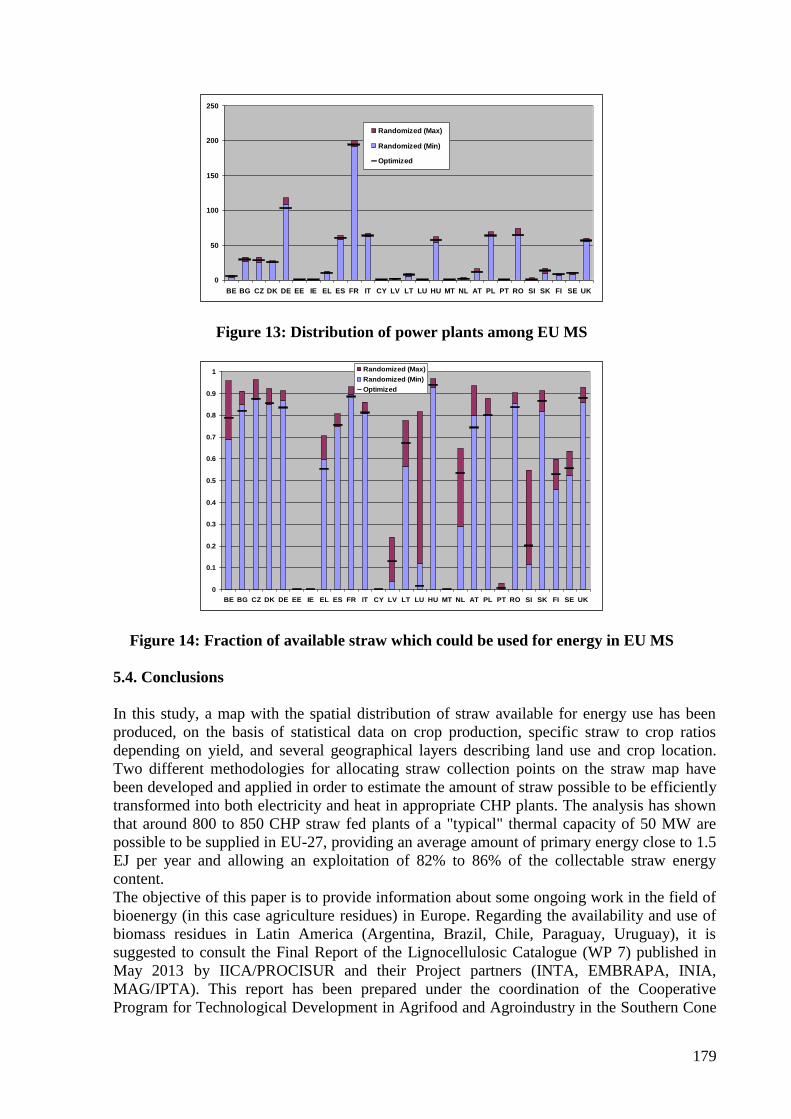
179
Figure 13: Distribution of power plants among EU MS
Figure 14: Fraction of available straw which could be used for energy in EU MS
5.4. Conclusions
In this study, a map with the spatial distribution of straw available for energy use has been
produced, on the basis of statistical data on crop production, specific straw to crop ratios
depending on yield, and several geographical layers describing land use and crop location.
Two different methodologies for allocating straw collection points on the straw map have
been developed and applied in order to estimate the amount of straw possible to be efficiently
transformed into both electricity and heat in appropriate CHP plants. The analysis has shown
that around 800 to 850 CHP straw fed plants of a "typical" thermal capacity of 50 MW are
possible to be supplied in EU-27, providing an average amount of primary energy close to 1.5
EJ per year and allowing an exploitation of 82% to 86% of the collectable straw energy
content.
The objective of this paper is to provide information about some ongoing work in the field of
bioenergy (in this case agriculture residues) in Europe. Regarding the availability and use of
biomass residues in Latin America (Argentina, Brazil, Chile, Paraguay, Uruguay), it is
suggested to consult the Final Report of the Lignocellulosic Catalogue (WP 7) published in
May 2013 by IICA/PROCISUR and their Project partners (INTA, EMBRAPA, INIA,
MAG/IPTA). This report has been prepared under the coordination of the Cooperative
Program for Technological Development in Agrifood and Agroindustry in the Southern Cone
0
50
100
150
200
250
BE BG CZ DK DE EE IE EL ES FR IT CY LV LT LU HU MT NL AT PL PT RO SI SK FI SE UK
Randomized (Max)
Randomized (Min)
Optimized
0
0.1
0.2
0.3
0.4
0.5
0.6
0.7
0.8
0.9
1
BE BG CZ DK DE EE IE EL ES FR IT CY LV LT LU HU MT NL AT PL PT RO SI SK FI SE UK
Randomized (Max)
Randomized (Min)
Optimized
180
(PROCISUR), a joint effort of the National Agricultural Research Institutes of the Southern
Cone and the Inter-American Institute for Cooperation on Agriculture (IICA).
6. Optimal energy use of agricultural crop residues and preservation of Soil Organic
Carbon stocks
Significant concerns exist on the potential depletion of Soil Organic Carbon (SOC) associated
with crop residues removal. The effect of residues management on SOC balance is
documented in some long-term experiments undergoing at EU and world level, generally
depicting small SOC change in response to either residues removal or incorporation (Powlson
et al., 2011). Biogeochemical models may provide useful information on SOC evolution
under different assumptions because of their ability to simulate SOC turnover in different
pedo-climatic conditions and with specific management practices. A decrease of SOC content
could deteriorate the soil physical properties and its nutrient cycle (Carter, 2002), leading to
lower resilience of agro-ecosystems and requiring higher external input (fertilisers) for
maintaining soil functions, with additional environmental and economic burdens.
6.1. Biomass removal and its effect on the soil carbon content
The SOC dynamics are influenced by soil texture, moisture and temperature and by the
farming practices. In this study, a sustainable collection rate has been defined as the
maximum collection rate of residues that ensure the preservation of the SOC. In order to
account for the spatial variability of soil and climate conditions, a simulation platform was
used to assess the effect of residue removal on SOC stock change. The simulation platform is
based on the integration of the agro-ecosystem CENTURY model (Parton et al., 1988) and
several spatial and numerical databases at the EU level (Lugato et al., 2014).
CENTURY is a model designed to simulate Carbon, Nitrogen, Phosphorus and Sulphur
dynamics in soils. It considers two litter pools, metabolic and structural and three SOC pools,
active, slow and passive. The simulation platform used the soil data from the European Soil
Data Centre (ESDAC) (Panagos et al, 2012), climatic data from the University of East Anglia,
UK (Mitchell et al., 2004) and CO2 emissions scenarios data from the Intergovernmental
Panel on Climate Change (IPCC) (Nakicenovic et al., 2000). In this study, the SOC values
were determined with two scenarios: HadCM3-A1FI (‘world markets-fossil fuel intensive’)
and PCM-B1 (‘global sustainability’) that encompass a wide range of climate variations.
For the specific objectives of this study, for the arable land class three scenarios of residues
management were considered:
- Business As Usual (BAU): the baseline management regime, 50% of straw removed from
land, except for fodder crops (all aboveground biomass removed) and grain maize (only grain
removed).
- No crop residue removal (R0): all straw left on the field and incorporated after the harvest.
- Total crop residue removal (R100): 100% of cereal straw removed from the field, except for
grain maize.
In this study, we only considered SOC and not nutrients balance or the erosion risk.
6.2. Calculation of the optimum collection rate of crop residues
The evolution of SOC stock of agricultural land was estimated for 2020 and 2050 under the
three different scenarios assuming respectively 50% cereal straw collection (BAU), no
residues removal and full straw collection (starting from the base year 2012). For each
location on the grid, a function was used to calculate the SOC change in the three scenarios

181
depending on the amount of residues removed. The maximum amounts for collection assuring
SOC stock preservation were computed for both the 2020 and 2050 years. The minimum of
the two values was finally chosen as the Optimal Collection (OC) associated to the pixel, i.e.,
the maximum amount of residues possible to be collected. Values were then converted from
tons of carbon per hectare to tons of dry biomass per hectare and derived OC rates of
collection. OC rates were further compared to the Default Collection (DC) rates, which were
previously defined in Scarlat et al. 2010 (40% of wheat, barley, rye, oat residues and 50% of
the maize, rapeseed and sunflower residues).
6.2.1 Current and projected SOC stock in Europe in next decades
The changes in the SOC stocks were modelled following the methodology described in
Lugato et al., (2014) in the different scenarios. Future SOC predictions are the modelled
changes in SOC content (t C per ha) under BAU scenario between 2012 and 2050 and the
average of the two HadCM3-A1FI and PCM-B1 climatic scenarios.
Figure 15: SOC variation (tons C per ha) in the no residues (left)
and full residues collection scenario (right)
The results show how different areas in Europe are expected to react in a different way to
residues collection scenarios in interaction with climate change. The comparison of SOC
changes with no collection and full collection scenarios in the 2020 horizon shows that no
collection of residues is expected to end up in a constant or increasing SOC content almost
everywhere in Europe, with the exemption of some limited areas. Full collection reduces the
SOC content almost everywhere, with some exemptions.
6.2.2 Available residues in EU 27
The amount of residues available for energy uses in EU 27 at a 1 km resolution was
established with Default Collection (DC) and Optimal Collection (OC) respectively, after
subtracting residues diverted to competitive uses (Figure 16).

182
Figure 16: Agricultural residues available for energy
with Default Collection (left) and Optimal Collection (right)
As seen in Figure 17, the difference between the amount of agricultural residues which might
be collected with Optimal Collection (OC) rate and the Default Collection (DC) rate is quite
important. Red colours identify areas where optimal collection provides lower values than the
default collection rate, i.e., areas where the removal of residues must be lowered to prevent
SOC depletion. Blue colours correspond to areas where residues collection could be increased.
Overall, about 146 Mt agricultural residues could be collected across the EU27 when Optimal
Collection (OC) is considered, to be compared with 102 Mt when Default Collection (DC)
rates were considered.
Figure 17: Difference between crop residues availability in Optimal (OC) and Default
(DC) collection rates (left) and optimised collection rates (right)

183
6.2.3 Collection and transformation
The spatial model for the collection of straw has been applied again to a "typical" plant with a
capacity of 50 MW of thermal input, needing about 100 ktons/year of feedstock. At the EU
level, the DC scenario allowed a range of 834 to 852 plants to be built across the EU,
producing between 1510 and 1540 PJ of primary energy per year, while the OC scenario
suggests a range of 1260 to 1276 power plants, producing between 2290 EJ and 2320 EJ, with
an increase of 51.6% in comparison with DC scenario.
Figure 18: Potential number of 'typical'
power plants possible to be allocated in
each EU MS
Figure 19: Potential energy production
from 'typical' power plants in each EU MS
6.3. Conclusions
The consequences on SOC stocks of three crop residues management systems were assessed,
considering: no residue removal; 50% removal and 100% residues removal. An optimal value
for collection was obtained at 1 km resolution in EU 27 while preserving the current SOC
content. Using the optimal collection rates compared with the default collection rates initially
proposed (Scarlat et al., 2010) can increase the amount of residues available for energy use to
146Mt (from 102 Mt estimated with default collection rates). Applying the model to calculate
the energy to be produced in "typical" straw plants leads to a range between 2290 and 2320
PJ/year in the EU 27, to be compared with 1510-1540 PJ/year when the standard collection
rate is applied. However, the collection of crop residues will ultimately depend on the farmers
decisions, in function of market conditions (such as the prices of straw or of the fertilisers
needed to compensate the nutrients export), and could be based to a limited extent on
environmental considerations, such as SOC balance.
7. Use of Municipal Solid Waste (MSW) for energy production in Waste-to-Energy
(WtE) plants
The use of energy from waste could play an important role in reaching renewable energy
targets due to the significant amounts of waste generated in the EU. The Waste Framework
Directive (2008/98/EC), defined an energy efficiency criterion (R1 criterion or the R1
formula), which sets the condition for a Municipal Solid Waste (MSW) plant to be considered
as a Recovery (R1) or as a Disposal operation (D10). The R1 formula assesses the overall

184
efficiency of the Waste-to-Energy (WtE) plants in recovering the energy from waste as well
as the effective use of the energy. The main objective of the R1 formula is to promote the
efficient use of energy from waste in WtE plants. Article 38 of the Waste Framework
Directive states that local climatic conditions may be taken into account in the R1 formula, as
they influence the amount of energy that can be used or produced. The European Commission
considered several options for a climate correction factor: 1) no correction; 2) a compensation
for the climatic impact on the electricity production; and 3) correction for the impact of
climate on both electricity production and the lack of heat demand. In this study we
investigated the options to apply a Climate Correction Factor to waste incineration facilities.
7.1. Waste incineration in the EU
The total annual incineration capacity for MSW in EU MS depends on the waste management
strategies selected. Waste incineration is generally more common in older EU MS than in new
EU MS. Waste incineration capacities of Denmark, Sweden and the Netherlands exceed the
annual value of 400 kg MSW per capita. Data collection showed that in the EU, there are 425
plants dedicated to thermal treatment of MSW to which the R1 formula could be applied. The
number of plants included in the analysis was 316, representing 74% of all WtE plants. The
capacity of the plants ranges from 9,000 to 1,300,000 tonnes of waste processed per year with
an average value of around 200,000 t/year. Almost 30% of all European WtE plants are
located in France (126), followed by Germany (79) and Italy (53). No WtE plants have been
built so far in several EU MS (Bulgaria, Croatia, Latvia, Poland, Romania, Greece).
Figure 20: Waste incineration capacities
by EU MS (Medarac et al., 2014)
Figure 21:WtE plant locations in Europe
and HDD zones (Medarac et al., 2014)
Europe features 3 broad climatic zones (warm, temperate, cold), which have been identified
depending on the heating demand and subsequently by Heating Degree Days (HDDs). The
limits between these three zones were set in the ESWET study (ESWET, 2012) based on
HDD values: 3350 between the North zone and the Intermediate one, 2150 between this one
and the Southern Europe one. The WtE plant location map uses the HDD values based on the
ECHAM5 Global Circulation Model and HIRHAM5 Regional Climate Model from the
Danish Meteorological Institute for the period 2010-2040 (Hiederer, 2012).
185
7.2. Energy generation and use in various climate conditions
Electricity generation by a steam turbine depends in particular on the enthalpy drop in the
turbine; higher air temperatures have a negative impact on the electricity generation in
warmer areas and thus on the efficiency of energy generation. Whenever possible, it is
valuable to export heat or process steam from a WtE plant, as it improves the overall energy
efficiency and economic performances of the plant. Cold climates provide a substantial and
long-lasting heat demand in buildings, sometimes met by District Heating networks in
addition to the opportunity of selling industrial heat.
Warmer locations imply smaller demand for heating. A synergy with industrial heat
customers constitutes a favourable situation, as industry could have a large consumption,
mostly constant during the year. However, it is not always possible to ensure industrial heat
demand extensively. District cooling could be of interest when the network exists. The
cooling demand is also usually much shorter (around 3 months per year) than the heating
demand (6 to 8 months). On the contrary, the cooling demand for industrial use (food
preservation, computer cooling, etc.) shows similar features everywhere in Europe. Higher
initial capital expenditure, coupled with much smaller demand for Cooling than for Heating
networks, have prevented so far the development of large District Cooling networks.
7.3. Influence of various options of R1 climate correction factor
According to the Waste Framework Directive, R1 formula shall be applied in accordance with
the Reference Document on the Best Available Techniques (BAT) for Waste Incineration
(WI-BREF, 2006) for CHP and/or heat plants (BAT 61) and electricity plants (BAT 62).
According to the ESWET study, the energy export value given by BAT 61 corresponds to the
R1 threshold for new plants (0.65) in the worst case (when generating only heat) and can be
higher when the plant generates both electricity and heat. On the other hand, the whole range
of values given in BAT 62 for electricity production alone leads to the R1 value below the R1
threshold as presented in Figure 22. The analysis of the R1 factor shows significant variation
against the HDD between different plants. All trend lines show an increase of R1 value with
the increase of HDD, which means that R1 value is higher in colder areas. This shows that in
colder area, more heat is used for heating and this has an impact on the R1 values. The low R1
values reported can also be explained both by an old, outdated technology or/and by the fact
that some of the plants were designed with the main purpose of waste incineration rather than
energy recovery. WI-BREF (2006) also shows that the specific electricity self-consumption of
a WtE plant depends on the plant capacity, with smaller plants showing higher specific energy
consumption, which has an influence on the efficiency and the economics of the plant, as well
as on the R1 values.

186
Figure 22: R1 values for BAT 61 and BAT 62 plants (Source: ESWET Report)
Figure 23: R1 formula of WtE plants in relation to HDD
7.4 Conclusions
The reference energy efficiencies set by the Waste Incineration BREF give higher R1 values
for BAT plants dedicated to heat than for plants dedicated only to electricity generation. There
is technical evidence that local conditions influence the amounts of energy that can
technically be used in the form of electricity, heating, cooling or processing steam. In order to
compensate for the lack of heat in warm areas, it was considered reasonable to propose a
factor based on the ratio between the R1 values corresponding to BAT 61 and BAT 62 plants,
while maintaining an incentive to achieve high efficiency of energy production.

187
8. International cooperation and perspectives
The Joint Research Centre (Institute for Energy & Transport) has been active during the last
few years in scientific networking in the field of bioenergy with Latin American partners, but
also with partners from other regions of the world (especially Europe, Asia & North America).
We consider this activity of technical/scientific networking as an essential step to develop
knowledge and expertise due to the strong multi-disciplinary components of bioenergy which
requires specialists in disciplines related to feedstock production/collection/mobilisation,
biomass conversion to energy and also sustainability and markets (sustainability schemes and
standardisation, supply chains, support schemes…). In addition, bioenergy development in
Europe is strongly linked to bioenergy development in other parts of the world, within the
larger framework of energy, renewables and bioeconomy.
Several workshops have thus been organised on specific topics such as:
- JRC/UABIO Workshop on the use of agricultural crop residues in Ukraine, Kiev, September
2014,
- JRC Workshop on bioenergy demand and air quality and health effects, challenges and
opportunities, Danube Region Strategy, Vienna, June 2014,
- JRC/Kurchatov Institute Workshop on International cooperation in the field of bioenergy,
Moscow, October 2013,
- JRC/CER (Centre for Renewable Energy) of Chile on International cooperation in the field
of bioenergy technology, Santiago de Chile, March 2013,
- JRC/CTBE (Brazilian Bioethanol Science & Technology Laboratory) Workshop on the
Agro-environmental impact of biofuels and bioenergy, Campinas, December 2011,
- JRC/INTA (National Agronomic Research Institute of Argentina) Workshop on GHG
emissions of biofuels and bioenergy, Buenos Aires, March 2011,
- JRC/MPOC (Malaysian Palm Oil Council) Expert Consultation on direct and indirect impact
of biofuels policies on tropical deforestation in Malaysia, Kuala Lumpur, November 2008,
- JRC/EEA/CENER Joint Seminar on sustainable bioenergy cropping systems for the
Mediterranean, Madrid, February 2006,
- JRC/CENER Expert Consultation on the energy potential from cereals straw in the
European Union, Pamplona, Spain, October 2006,
- JRC/EEA/RothamstedWorkshop on Short Rotation Forestry, Short Rotation Coppice and
energy grasses in the European Union: agro-environmental aspects, present use and
perspectives, Halpenden, United Kingdom, October 2007
The Proceedings and documentation of these meetings are available on
http://iet.jrc.ec.europa.eu/remea/past-events.
The JRC is a Member of the IEA (International Energy Agency) Bioenergy Task 43 on
Biomass feedstock for energy markets. It has also contributed in 2014 to the IEA Bioenergy
How2Guide Initiative which supports the preparation of National Bioenergy Road Maps. The
JRC is part of the GBEP (Global Bioenergy Partnership) Working Group on Water, further to
the previous work performed in cooperation with the United Nations Environment
Programme (UNEP). The JRC has also been acting for several years in the Technical
Coordination of the European Biomass Conference. The JRC is presently preparing a
Workshop on Energy, Climate and Food Security in cooperation with EC Directorate General
for Energy for the World Exhibition MILANEXPO 2015. In the field of bioenergy, further to
EUROCLIMA Project, we expect at short term collaboration with Brazil within the Science
without Border Programme and are looking forward to other activities with Latin America
due to the role of bioenergy in sectors such as agriculture, rural development, but also
technological innovation and bioeconomy.

188
9. References
- Banja M., Scarlat N., Monforti-Ferrario F., Dallemand J.F., 2013, Renewable energy
progress in EU 27 (2005-2020), Joint Research Centre, Ispra, Italy.
- Carter M.R., 2002, Soil quality for sustainable land management: Organic matter and
aggregation interactions that maintain soil functions. Agronomy Journal, 94 (1), 38-47.
- CE, 2014, Council of the European Union, Proposal on indirect land-use change: Council
reaches agreement, 7550/14, Luxembourg.
- Cefic, 2014, Measuring Bio-Based raw materials use in the chemical industry, European
Chemical Industry Council.
- EEA, European Environment Agency, How much bioenergy can Europe produce without
harming the environment? Report No 7/2006 ISBN 92–9167–849-X2006, 2006.
- EC, European Commission, 2009, Directive 2009/28/EC on the promotion of the use of
energy from renewable sources and amending and subsequently repealing Directives
2001/77/EC and 2003/30/EC.
- EC, European Commission, 2011, Energy Roadmap 2050. Communication from the
Commission to the European Parliament, the Council, the European Economic and Social
Committee and the Committee of the Regions, COM (2011) 885 final.
- EC, European Commission, 2014, European Council, Conclusions on 2030 Climate and
Energy Policy Framework, EUCO 169/14.
- EC, European Commission, 2014b, National Renewable Energy Action Plans (NREAPs),
Progress Reports, http://ec.europa.eu/energy/renewables/reports/reports_en.htm
- Ecofys, 2012, Renewable energy progress and biofuels sustainability, Report for the
European Commission, ENER/C1/463-2011-Lot2.
- Edwards R.A.H., Šúri M., Huld T., Dallemand J.F., 2005, GIS-based assessment of
cereal straw energy resource in the EU. In: Proceedings of the 14th European Biomass
Conference, Paris.
- Elbersen B., Startisky I., Hengeveld G., Schelhaas M.J., Naeff H., Bottcher H., 2012,
Atlas of EU biomass potentials. Spatially detailed and quantified overview of EU biomass
potential taking into account main criteria determining biomass availability from different
sources, Biomass Futures Project.
- ESWET, European Suppliers of Waste to Energy Technology, Energy recovery efficiency
in Municipal Solid Waste-to-Energy plants in relation to local climate conditions, 2012.
- FAO, Food & Agriculture Organisation of the United Nations, Faostat, 2014,
http://faostat3.fao.org/home/E.
- Graham R.L., Nelson R., Sheehan J., Perlack R.D., Wright L.L., 2007, Current and
Potential U.S. Corn Stover Supplies, Agron. J. 99, 1–11.
- Hiederer R., 2012, Processing Indices of Change and Extremes from Regional Climate
Change Data. Luxembourg: Publications Office of the European Union. EUR 25339 EN.
29pp. ISBN 978-92-79-24994-5, doi: 10.2788/27516.
- IICA/PROCISUR, 2013, Lignocellulosic Feedstock Catalogue, Final Report, WP 7,
Cooperative Program for Technological Development in Agrifood and Agroindustry in the
Southern Cone and Inter-American Institute for Cooperation on Agriculture.
- Kadam K.L., McMillan J.D., 2003. Availability of corn stover as a sustainable feedstock
for bioethanol production.Bioresource Technology 88, 17–25.
- Katterer T., Andrén O., Persson J., 2004,The impact of altered management on long-term
agricultural soil carbon stocks-a Swedish case study. Nutrient Cycling in Agroecosystems 70,
179-187.

189
- Lugato E., Panagos P., Bampa F., Jones A., Montanarella L., 2014, A new baseline of
organic carbon stock in European agricultural soils using a modelling approach. Global
Change Biology, 20: 313–326; DOI: 10.1111/gcb.12292.
- Medarac H., Scarlat N., Monforti-Ferrario F., Bodis K., 2014, Report on the impact of
R1 climate correction factor on the Waste-to-Energy (WtE) plants based on data provided by
Member States", EUR 26720. Luxembourg, Publications Office of the European Union,
http://iet.jrc.ec.europa.eu/remea/report-impact-r1-climate-correction-factor-waste-energy-wte-
plants-based-data-provided-member-states
- Meyer H-P. and Werbitzky O., 2011, How green can the industry become with
biotechnology ? in Biocatalysis for Green Chemistry and Chemical Process Development,
First Edition. Tao J., and Kazlauskas R., (ed.). John Wiley & Sons.
- Mitchell T.D., Carter T.R., Jones P.D. et al., 2004, A comprehensive set of high-
resolution grids of monthly climate for Europe and the globe: the observed record (1901-
2000) and 16 scenarios (2001-2100). Working Paper 55, Tyndall Centre for Climate Change
Research, University of East Anglia, Norwich, UK.
- Monfreda l., Ramankutty N., Foley J.A., Farming the planet: 2. geographic distribution of
crop areas, yields, physiological types, and net primary production in the year 2000. Global
Biogeochemical Cycles 2008; 22: GB 1022.
- Monforti F., Bodis K., Scarlat N., Dallemand J.F., 2013,The possible contribution of
agricultural crop residues to renewable energy targets in Europe: A spatially explicit study,
Renewable and Sustainable Energy Reviews, 19, 666–677
- Nelson R.G., 2002, Resource assessment and removal analysis for corn stover and wheat
straw in the Eastern and Midwestern United States—rainfall and wind-induced soil erosion
methodology Biomass and Bioenergy 22, 349 – 363.
- Panagos P., Van Liedekerke M., Jones A., Montanarella L., 2012, European Soil Data
Centre: response to European policy support and public data requirements, Land Use Policy,
29 (2), 329-338.
- Parton W.J., Stewart J.W.B., Cole C.V., 1988, Dynamics of C, N, P and S in grassland
soils: a model. Biogeochemistry 5: 109-131.
- Patterson P.E., Makus L., Momont P., Robertson L., 1995, The availability, alternative
uses and value of straw in Idaho, Final report of the Project BD-K251, Idaho Wheat
Commission, College of Agriculture, University of Idaho.
- Powlson D.S., Whitmore A.P., Goulding K.W.T., 2011, Soil carbon sequestration to
mitigate climate change: A critical re-examination to identify the true and the false, European
Journal of Soil Science, 62 (1), pp. 42-55.
- Scarlat N., Martinov M., Dallemand J.F., 2010, Assessment of the availability of
agricultural crop residues in the European Union: Potential and limitations for bioenergy use.
Waste Management, 30, 1889–1897.
- Scarlat N., Dallemand J.F., Banja M., 2013, Possible impact of 2020 bioenergy targets on
European Union land use. A scenario-based assessment from national renewable energy
action plans proposals, Renewable and Sustainable Energy Reviews, vol. 18, p. 595–606.
- Scarlat N., Dallemand J.F., Monforti-Ferrario F., Nita V., 2015, The role of biomass and
bioenergy in a future bioeconomy: policies and facts, Environmental Development Journal,
(Accepted for publication).
- Summers M.D., Jenkins B.M., Hyde P.R., Williams J.F., Mutters R.G., Scardacci S.C.,
Hair M.W., 2003, Biomass production and allocation in rice with implications for straw
harvesting and utilization, Biomass and Bioenergy 24, 163–173.
- Tóth G., Bódis K., Ivits É., Máté F., Montanarella L., Productivity evaluation component
of the proposed new European Agri-Environmental Soil Quality Indicator, ISBN:978-92-79-
17601-2; 2011.

190
- Tuyttens F.A.M., 2005, The importance of straw for pig and cattle welfare: A review,
Applied Animal Behaviour Science 92 (2005) 261–282.
- Van der Sluis E. , Shane R., Stearns L., 2007. Local Biomass Feedstocks Availability for
Fuelling Ethanol Production.Biofuels, Food and Feed Tradeoffs, Biofuels, Food and Feed
Tradeoffs Conference, April 12-13, St Louis, Missouri.
- Walsh M.E., Perlack R.L., Turhollow A., de la Torre Ugarte D., Becker D.A., Graham
R.L., Slinsky S.E., Ray D.E., 2000, Biomass Feedstock Availability in the US: 1999 State
Level Analysis. Oak Ridge National Laboratory, TN.
- WI BREF, 2006, Reference Document on the Best Available Techniques for Waste
Incineration, Integrated Pollution Prevention and Control, IPPC,
http://eippcb.jrc.ec.europa.eu/reference/wi.html.
- Wilhelm W.W., Johnson J.M.F., Hatfield J.L., Voorhees W.B., Linden D.R., 2004, Crop
and Soil Productivity Response to Corn Residue Removal: A Literature Review. Agronomy
Journal 96, 1-17.

Europe Direct is a service to help you find answers to your questions about the European Union
Freephone number (*): 00 800 6 7 8 9 10 11
(*) Certain mobile telephone operators do not allow access to 00 800 numbers or these calls may be billed.
A great deal of additional information on the European Union is available on the Internet.
It can be accessed through the Europa server http://europa.eu.
How to obtain EU publications
Our publications are available from EU Bookshop (http://bookshop.europa.eu),
where you can place an order with the sales agent of your choice.
The Publications Office has a worldwide network of sales agents.
You can obtain their contact details by sending a fax to (352) 29 29-42758.
European Commission
EUR 27185 EN – Joint Research Centre – Institute for Energy and Transport
Title: Bioenergy and Latin America: A Multi-Country Perspective
Authors: J.F. Dallemand, J.A.Hilbert, F.Monforti
Luxembourg: Publications Office of the European Union
2015 – 190 pp. – 21.0 x 29.7 cm
EUR – Scientific and Technical Research series – ISSN 1831-9424 (online), ISSN 1018-5593 (print)
ISBN 978-92-79-47240-4 (PDF)
ISBN 978-92-79-47239-8 (print)
doi:10.2790/246697

ISBN 978-92-79-47240-4
doi:10.2790/246697
JRC Mission As the Commission’s in-house science service, the Joint Research Centre’s mission is to provide EU policies with independent, evidence-based scientific and technical support throughout the whole policy cycle. Working in close cooperation with policy Directorates-General, the JRC addresses key societal challenges while stimulating innovation through developing new methods, tools and standards, and sharing its know-how with the Member States, the scientific community and international partners.
Serving society Stimulating innovation Supporting legislation
LD
-NA
-27
18
5-E
N-N