BIOENERGETICS OF GROWTH OF SEEDS, FRUITS, AND STORAGE …
24
BIOENERGETICS OF GROWTH OF SEEDS, FRUITS, AND STORAGE _ORGANS F. W. T. Penning de Vries, H. H. VanLaar, and M. C. M. Chardon In Potential Productivity of Field Crops Under Different Environments. IRRI, Los Banos Philipines, 1983, pp. 37-60 The amount of substrate required for growth of seeds, fruits, and other storage organs is computed for 23 major crops. The compu- tations are based on knowledge of the biochemical conversion processes that occur during growth, and the biochemical composi- tion of the storage organs. The amount of substrate required for maintenance processes in these organs is estimated from literature data. The procedures in calculating the growth processes are explained and justified. The substrate requirement for synthesis of 1 kg of the total storage organ varies from 1.3 to 2.4 kg glucose, and from I .6 to 5.5 kg glucose when the substrate is expressed per kg of the storage organ principal component. Synthesis of 1 kg of the total storage organ requires 0.02-0.3 kg amides, or 0.02-0.4 kg ami des I kg of the principal component. Respiration during growth is also computed. There is good evidence th(lt there is no scope for improvement of the efficiency with which plants convert substrates into storage organs. Higher yields per unit of substrate can be achieved only by the production of energetically cheaper storage organs. Mainte- nance of the storage organs during their development consumes 6 to 25% of the total substrate requirement for their growth. Research should further quantify this fraction and indicate the scope for breeding and selection of varieties with lower mainte- nance requirements. The assumption that the efficiency of transfer of nitrogen within the plant toward seeds, fruits, and storage organs is I 00% is probably incorrect. This paper addresses the question of how much substrate is required for the growth of seeds, fruits, and other storage organs. An experimental approach is cumbersome· Centre for Agrobiological Research (CABO), POB 14, Wageningen; Department of Theoretical Produc- tion Ecology, Agricultural University,.Bomsesteeg 65 Wageningen; and CABO, POB 14, Wageningen, the Netherlands.
Transcript of BIOENERGETICS OF GROWTH OF SEEDS, FRUITS, AND STORAGE …
BIOENERGETICS OF GROWTH OF SEEDS,
FRUITS, AND STORAGE _ORGANS F. W. T. Penning de Vries, H. H. VanLaar,
and M. C. M. Chardon
In Potential Productivity of Field Crops Under
Different Environments. IRRI, Los Banos
Philipines, 1983, pp. 37-60
The amount of substrate required for growth of seeds, fruits, and other storage organs is computed for 23 major crops. The computations are based on knowledge of the biochemical conversion processes that occur during growth, and the biochemical composition of the storage organs. The amount of substrate required for maintenance processes in these organs is estimated from literature data. The procedures in calculating the growth processes are explained and justified. The substrate requirement for synthesis of 1 kg of the total storage organ varies from 1.3 to 2.4 kg glucose, and from I .6 to 5.5 kg glucose when the substrate is expressed per kg of the storage organ principal component. Synthesis of 1 kg of the total storage organ requires 0.02-0.3 kg amides, or 0.02-0.4 kg ami des I kg of the principal component. Respiration during growth is also computed.
There is good evidence th(lt there is no scope for improvement of the efficiency with which plants convert substrates into storage organs. Higher yields per unit of substrate can be achieved only by the production of energetically cheaper storage organs. Maintenance of the storage organs during their development consumes 6 to 25% of the total substrate requirement for their growth. Research should further quantify this fraction and indicate the scope for breeding and selection of varieties with lower maintenance requirements.
The assumption that the efficiency of transfer of nitrogen within the plant toward seeds, fruits, and storage organs is I 00% is probably incorrect.
This paper addresses the question of how much substrate is required for the growth of seeds, fruits, and other storage organs. An experimental approach is cumbersome·
Centre for Agrobiological Research (CABO), POB 14, Wageningen; Department of Theoretical Production Ecology, Agricultural University,.Bomsesteeg 65 Wageningen; and CABO, POB 14, Wageningen, the Netherlands.
38 PRODUCTIVITY OF FIELD CROPS
and requires elaborate measurements for each species. A theoretical approach, however, seems feasible; it has no major problems, and is fast and fairly reliable. \Ve show how to calculate the amount of substrate required for synthesis, transport, and maintenance processes occurring during the growth of seeds, fruits, and other storage organs.
Knowing the substrate requirement for growth, we can compute the yield of a crop using the amount of available substrate. The substrate requirement can also be used inversely to indicate the amount of extra substrate needed for the formation of l additional kg of end product.
The substrate for growth consists of carbohydrates and amino acids. Concurrent assimilation processes are almost exclusively the source of substrate for storage organs of tuber crop.s. In other crops, a considerable fraction of the substrate is supplied by the breakdown of starch and protein in vegetative organs. In grain crops particularly, this process is important and might become even more so (Lupton 1980). Both substrate sources are important in seed legumes. The two types do not come from the same source in the same proportion; the fraction of carbohydrates that generally comes from photosynthesis is larger than that which comes from amino acids. In wheat, for example, most of the grain protein comes from nitrogenous compounds in vegetative parts, whereas most of the carbohydrate comes from photosynthesis (Spiertz 1978). Regardless of where the substrate comes from, the bulk of the organic carbon (C) that is provided to growing seeds, fruits, or storage organs is always in the form of simple c~rbohydrate molecules (such as glucose and sucrose), and the nitrogen comes almost exclusively in the form of organic nitrogen in amino acids.
The term storage organ is used to indicate the major agricultural product of a crop -grain, fleshy or dry fruits, tubers, or other vegetative storage organs. The term includes components that are indispensable for organ formation, such as chaff, seed coat, hulls, and pods. The total. weight of the storage organ, rather than the weight of only the principal fraction, is considered because it represents more truly the energy required by the crop to produce that organ. The relative substrate requirement is defined as the amount of substrate required to form 1 kg of storage organ. The substrate is expressed in glucose and amino acids when it is supplied by photosynthesis directly, and in starch and protein when vegetative tissues are their source. The numerical values of the substrate requirements are slightly different in each situation.
The present approach to determining the substrate requirement is basically a biochemical one (in which conversion processes are analyzed), rather than a statistical one (in which results of agronomical experiments are correlated with environmental factors). The approach has been developed and described earlier (Penning de Vries et al 1974, Penning de Vries and Van Laar 1977). Some of those earlier calculations have been refined for this paper, particularly those pertaining to breakdown of proteins in vegetative tissue, and to synthesis of protein and lignin. s'ome experiments evaluating the approach are discussed. The emphasis, though, is on the presentation of a simplified scheme to compute the relative substrate requirement of seeds, fruits, and other storage organs, and the scheme's application to the major
BlOE\ERGETICS OF GROWTH OF SEEDS, FRUITS, AND STORAGE ORGA\'S 39
crops. All calculations are on a dry matter basis. The nitrogen utilization efficiency within the plant is assumed to be I OOo/c; this assumption is discussed in a separate section. The efficiency of carbon utilization is one of the results of the computations presented.
In this paper. the approach is not applied to vegetative parts of crops, partly because this was done elsewhere (De Wit et all978), and partly because of the more complex situation- inYol\·ing the direct interaction of growth and photosynthesis, the form in \vhich nitrogen is absorbed from the soil- and uncertainties about the importance of maintenance processes.
BASJC CONCEPTS
Growth of storage organs is almost completely heterotrophic because most of the growing cells do not photosynthesize. This is obvious for belowground storage organs, but not quite so for those growing in light. Although their outer cell layers photosynthesize, growth of those cells contributes little to the overall dry weight increase. Photosynthetic products from outer cell layers can be transported to inner cells, but most of the organic carbon is probably transported as very simple molecules. It is assumed that the products excreted by the cells from outer layers are identical or energetically similar to those supplied by the phloem. Therefore, growth of all storage organs is considered as completely heterotrophic. This does not contradict the observation that photosynthesis by aboveground storage organs can contribute significantly to the substrate for growth.
Growth includes the conversion of substrate molecules into specjfic components and their subsequent incorporation into the cellular structures of the storage organ. Some carbohydrates are combusted to provide the energy to drive the growth reactions, and for translocation of the substances into and out of cells and through the plant. The result is the production of C0 2 related to these processes, which is called synthesis respiration. Living cells exhibit another carbon-consuming process called maintenance. l\1aintenance occurs continuously in living cells; the C0 2
production that results from it is called maintenance respiration (m.r.r.). The distinction of those two components of respiration and of carbon-consuming processes in plants goes back to McCree ( 1970), and has received a theoretical treatment (cf. Barnes and Hole 1978). There is no indication of other carbon-consuming processes that need consideration.
Efficiency of synthesis processes This section summarizes an earlier paper (Penning de Vries et al 1974).
An example of a simple equation that represents a synthesis process is the formation of the amino acid lysine from glucose and ammonia. From biochemical handbooks (Dagley and Nicholson 1970), it appears that this equation can be. represented by:
1 glucose+ 2 :'\H3 + 2 (NAD)H2 + 2 (A TP)- 1 lysine+ 4 H20 ( 1)
(units= gmol, compounds in parentheses serve only as carriers). The hydrogen and en~rgy (ATP) needed are obtained by the combustion of glucose:
40 PRODUCTIVITY OF FIELD CROPS
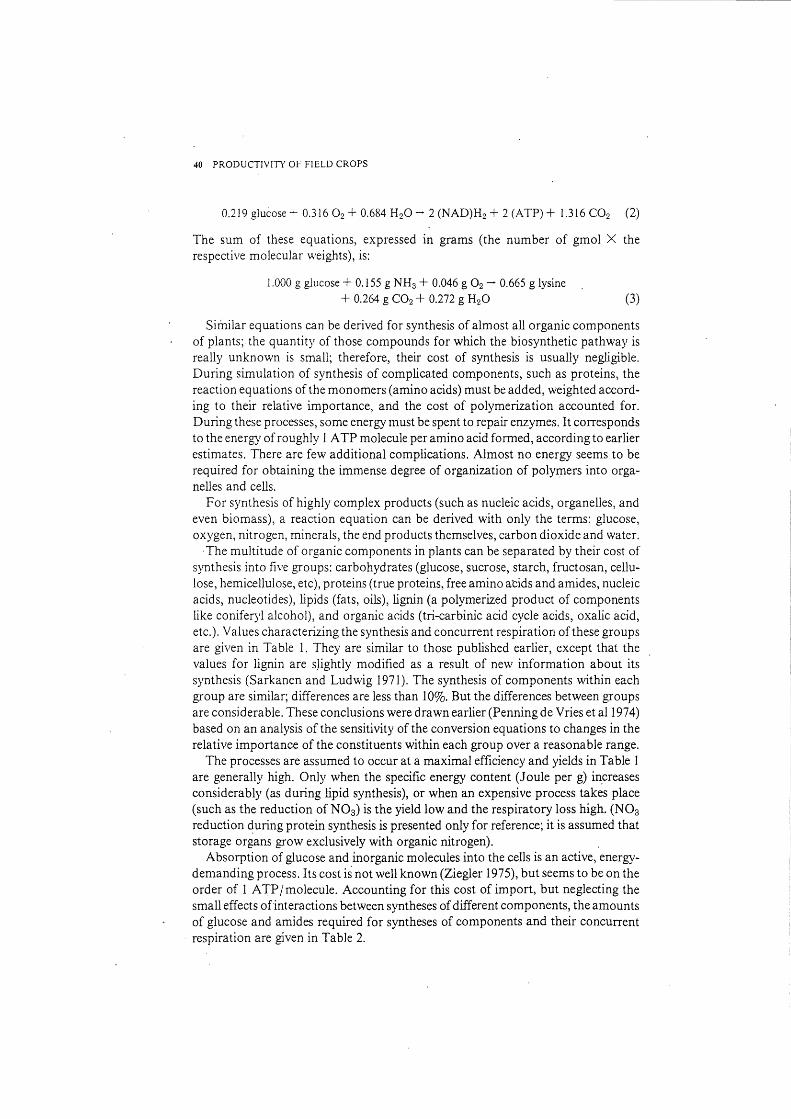
0.219 glucose-+- 0.316 0 2 + 0.684 H20- 2 (NAD)H2 + 2 (ATP) + 1.316 C02 (2)
The sum of these equations, expressed in grams (the number of gmol X the respective molecular weights), is:
I .000 g glucose+ 0.155 g NH3 + 0.046 g 0 2 - 0.665 g lysine + 0.264 g C02 + 0.272 g H20 (3)
Similar equations can be derived for synthesis of almost all organic components of plants; the quantity of those compounds for which the biosynthetic pathway is really unknown is small; therefore, their cost of synthesis is usually negligible. During simulation of synthesis of complicated components, such as proteins, the reaction equations of the monomers (amino acids) must be added, weighted according to their relative importance, and the cost of polymerization accounted for. During these processes, some energy must be spent to repair enzymes. It corresponds to the energy of roughly 1 A TP molecule per amino acid formed, according to earlier estimates. There are few additional complications. Almost no energy seems to be required for obtaining the immense degree of organization of polymers into organelles and cells.
For synthesis of highly complex products (such as nucleic acids, organelles, and even biomass), a reaction equation can be derived with only the terms: glucose, oxygen, nitrogen, minerals, the end products themselves, carbon dioxide and water.
·The multitude of organic components in plants can be separated by their cost of synthesis into five groups: carbohydrates (glucose, sucrose, starch, fructosan, cellulose, hemicellulose, etc), proteins (true proteins, free amino a'Cids and arnides, nucleic acids, nucleotides), lipids (fats, oils), lignin (a polymerized product of components like coniferyl alcohol), and organic acids (tri-carbinic acid cycle acids, oxalic acid, etc.). Values characterizing the synthesis and concurrent respiration of these groups are given in Table 1. They are similar to those published earlier, except that the values for lignin are s.lightly modified as a result of new information about its synthesis (Sarkanen and Ludwig 1971 ). The synthesis of components within each group are similar; differences are less than 10%. But the differences between groups are considerable. These conclusions were drawn earlier (Penning de Vries et al1974) based on an analysis of the sensitivity of the conversion equations to changes in the relative importance of the constituents within each group over a reasonable range.
The processes are assumed to occur at a maximal efficiency and yields in Table I are generally high. Only when the specific energy content (Joule per g) in_creases considerably (as during lipid synthesis), or when an expensive process takes place (such as the reduction of N03) is the yield low and the respiratory loss high. (N03
reduction ~uring protein synthesis is presented only for reference; it is assumed that storage organs grow exclusively with organic nitrogen). .
Absorption of glucose and inorganic molecules into the cells is an active, energydemanding process. Its cost is not well known (Ziegler 1975), but seems to be on the order of I ATP /molecule. Accounting for this cost of import, but neglecting the small effects of interactions between syntheses of different components, the amounts of glucose and amides required for syntheses of components and their concurrent respiration are given in Table 2.
BIOENERGETICS OF GROWTH OF SEEDS, FRUITS, AND STORAGE ORGANS 41
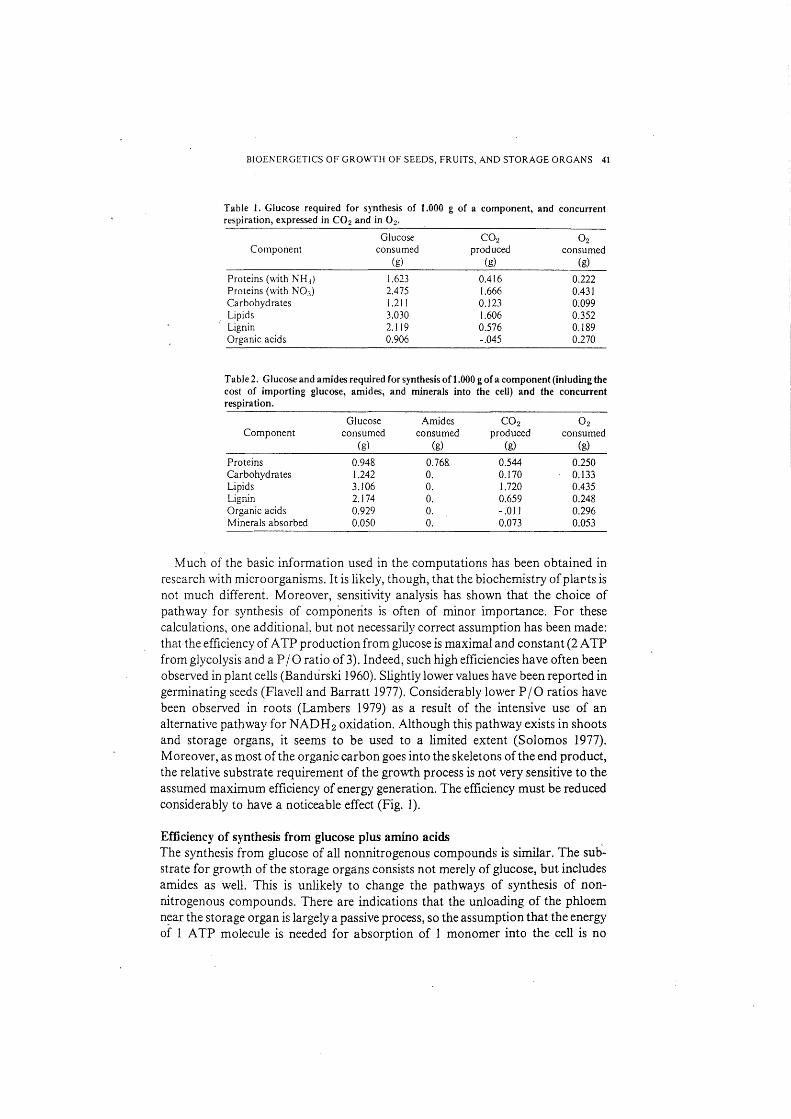
Table 1. Glucose required for synthesis of 1.000 g of a component, and concurrent respiration, expressed in C02 and in 0 2•
Component
Proteins (with NH.3)
Proteins (with NO.,) Carbohydrates Lipids Lignin Organic acids
Glucose consumed
(g)
1.623 2.475 1.2 J I 3.030 2.119 0.906
C02 produced
(g)
0.416 1.666 0.123 1.606 0.576 -.045
02 consumed
(g)
0.222 0.431 0.099 0.352 0.189 0.270
Table 2. Glucose and ami des required for synthesis of 1.000 g of a component (inluding the cost of importing glucose, amides, and minerals into the cell) and the concurrent respiration.
Component
Proteins Carbohydrates Lipids Lignin Organic acids Minerals absorbed
Glucose consumed
(g)
0.948 1.242 3.106 2.174 0.929 0.050
Amides consumed
(g)
0.768. 0. 0. 0. 0. 0.
C02 produced
(g)
0.544 0.170 1.720 0.659 -.01 I 0.073
02 consumed
(g)
0.250 0.133 0.435 0.248 0.296 0.053
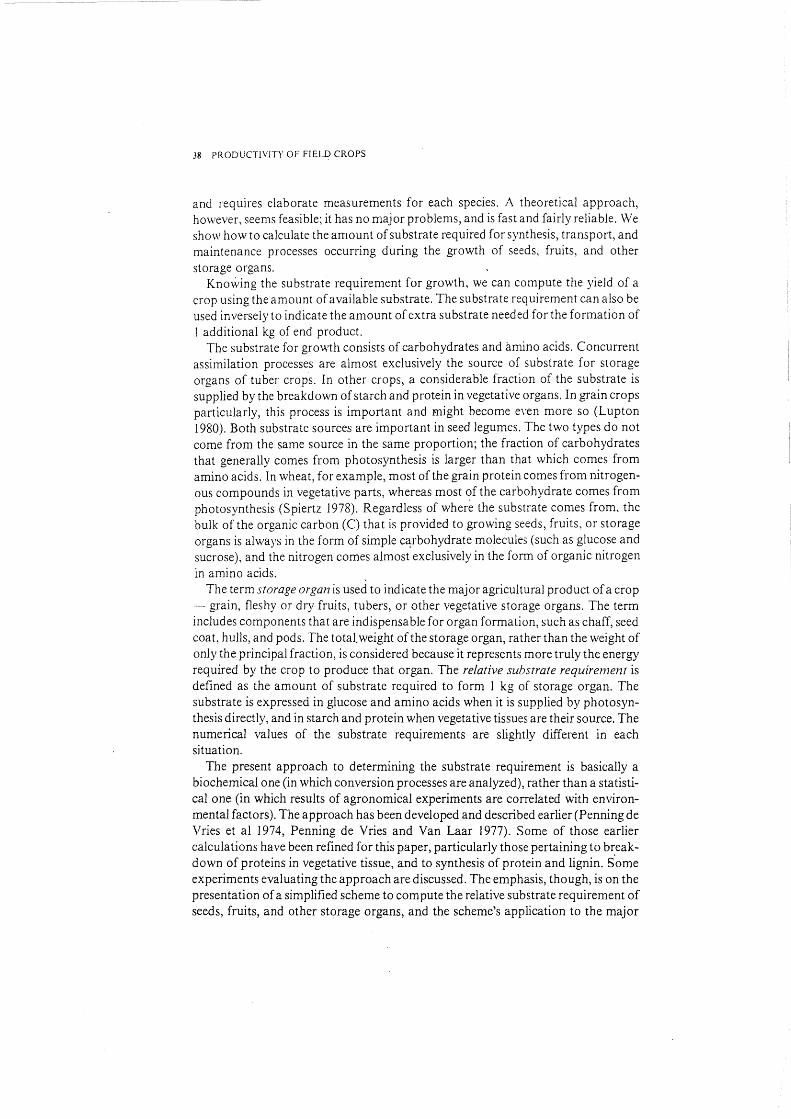
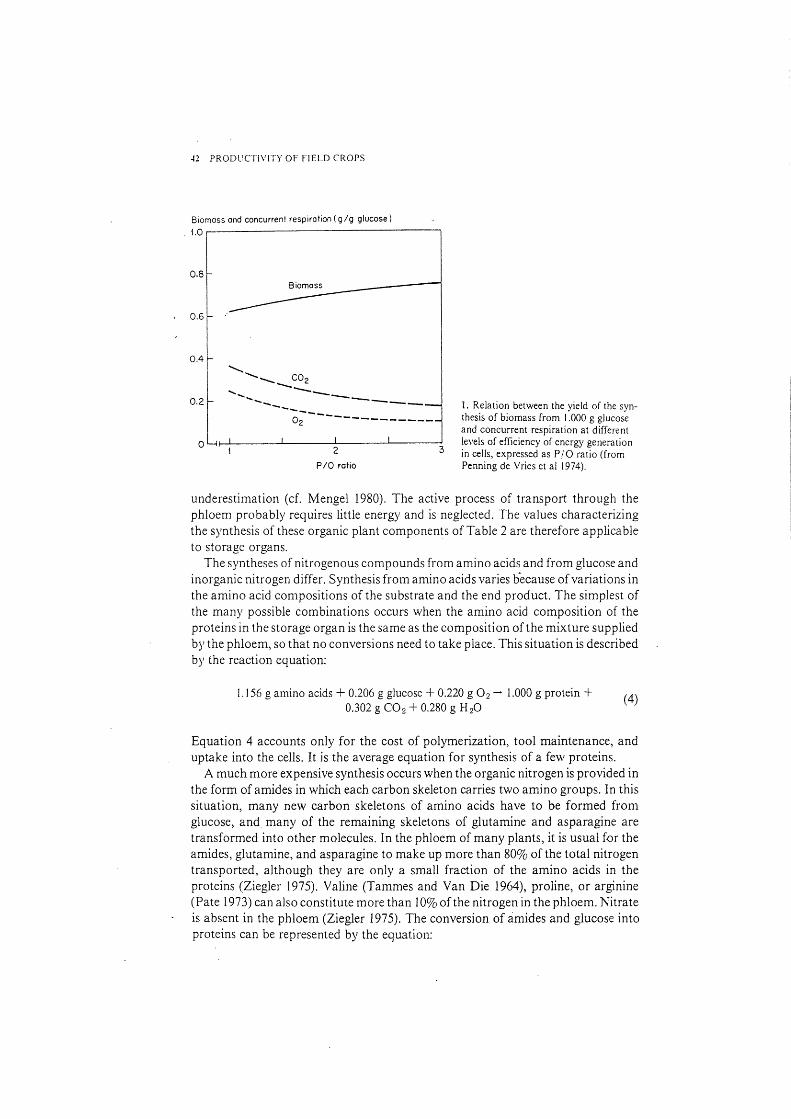
Much of the basic information used in the computations has been obtained in research with microorganisms. It is likely, though, that the biochemistry ofplarts is not much different. Moreover, sensitivity analysis has shown that the choice of pathway for synthesis of components is often of minor importance. For these calculations, one additional~ but not necessarily correct assumption has been made: that the efficiency of A TP production from glucose is maximal and constant (2 A TP from glycolysis and a PI 0 ratio of 3). Indeed, such high efficiencies have often been observed in plant cells (Bandurski 1960). Slightly lower values have been reported in germinating seeds (Flavell and Barratt 1977). Considerably lower PI 0 ratios have been observed in roots (Lambers 1979) as a result of the intensive use of an alternative pathway for NADH2 oxidation. Although this pathway exists in shoots and storage organs, it seems to be used to a limited extent (Solomos 1977). Moreover, as most of the organic carbon goes into the skeletons of the end product, the relative substrate requirement of the gro\\rt:h process is not very sensitive to the assumed maximum efficiency of energy generation. The efficiency must be reduced considerably to have a noticeable effect (Fig. 1).
Efficiency of synthesis from glucose plus amino acids The synthesis from glucose of all nonnitrogenous compounds is similar. The substrate for gro\\'th of the storage organs consists not merely of glucose, but includes amides as well. This is unlikely to change the pathways of synthesis of nonnitrogenous compounds. There are indications that the unloading of the phloem n~ar the storage organ is largely a passive process, so the assumption that the energy of 1 A TP molecule is needed for absorption of 1 monomer into the cell is no
-12 PRODUCTIVITY OF FIELD CROPS
Biomass and concurrent respiration ( g/g glucose)
1.0
............ ........... ...... _ -~;--------------
OL4f-L------~------~2-------L----~3
P/0 ratio
1. Relation between the yield of the synthesis of biomass from 1.000 g glucose and concurrent respiration at different levels of efficiency of energy generation in cells, expressed as P/ 0 ratio (from Penning de Vries et al 1974).
underestimation (cf. :Mengel 1980). The active process of transport through the phloem probably requires little energy and is neglected. The values characterizing the synthesis of these organic plant components of Table 2 are therefore applicable to storage organs.
The syntheses of nitrogenous compounds from amino acids and from glucose and inorganic nitrogen differ. Synthesis from amino acids varies b"ecause of variations in the amino acid compositions of the substrate and the end product. The simplest of the many possible combinations occurs when the amino acid composition of the proteins in the storage organ is the same as the composition of the mixture supplied by the phloem, so that no conversions need to take place. This situation is described by the reaction equation~
I .156 g amino acids + 0.206 g glucose + 0.220 g 0 2 - I .000 g protein + 0.302 g C02 + 0.280 g H 20
(4)
Equation 4 accounts only for the cost of polymerization, tool maintenance, and uptake into the cells. It is the average equation for synthesis of a few proteins.
A much more expensive synthesis occurs when the organic nitrogen is provided in the form of amides in which each carbon skeleton carries two amino groups. In this situation, many new carbon skeletons of amino acids have to be formed from glucose, and many of the remaining skeletons of glutamine and asparagine are transformed into other molecules. In the phloem of many plants, it is usual fDr the amides, glutamine, and asparagine to make up more than 80% of the total nitrogen transported, although they are only a small fraction of the amino acids in the proteins (Ziegler 1975). Valine (Tammes and Van Die 1964), proline, or arginine (Pate 1973) can also constitute more than I 0% of the nitrogen in the phloem. Nitrate is absent in the phloem (Ziegler 1975). The conversion of amides and glucose into proteins can be represented by the equation:
BIOE\'ERGETICS OF GROWTH OF SEEDS, FRUITS. A\'D STORAGE ORGANS 43
0. 76 g amides + 0.948 g glucose+ 0.250 g 0 2 - 1.000 g protein+ 0.544 g C0 2 + 0.422 g H 20
(5)
The composition of the amino acids of equation 5 (64.6~/C glutamine by weight, 33.5% asparagine, and 1.9% cystein, hence 0.197 g N j g amides) resembles compositions that have often been observed in the phloem. Equation 5 was used to calculate the substrate requirements in Table 2. For every combination of a glutamineasparagine mixture and the amino acid composition ofa protein, there is a specific reaction equation. Equation 5 is the aYe rage of nine combinations of the glutamineasparagine mixture and of three storage proteins. The three proteins gluten corn, arachin, and gluten wheat, were chosen from a group of nine that in an earlier analysis (Penning de Vries et al1974) were judged to have the low, medium, and high energy demands. The amide compositio~s used were those that result from the breakdovm of those three proteins (equation 12). It was assumed that the standard pathv:ays for synthesis were followed, always by the most efficient alternatives. A recent review of amino acid metabolism (Miflin and Lea 1977) supports this suggestion.
The computations that yielded equation 5 indicate the variability of the terms of the equation resulting from differences in the biochemical compositions of substrate and product. Of the nine equations computed, the one with the highest amount of glucose involved was
0.693 g amides + 1.124 g glucose + 0.220 g 0 2 - 1.000 g protein + 0.590 g C0 2 + 0.447 g H 20
The one with the lowest amount of glucose was
0.869 g amides + 0.797 g glucose+ 0.270 g 0 2 - 1.000 g protein+ 0.485 g C0 2 + 0.45I g H 20
(6)
(7)
Keeping in mind the types of proteins selected for this exercise, equation 5 may be rewritten as
0.77 g ± 0.1 g amides + 0.94 ± 0. I 5 g glucose+ 0.25 ± 0.02 g 0 2 -
I .000 g protein+ 0.55 ± 0.05 g C0 2 + 0.43 ± 0.03 g H 20 (8)
It appears that the ratio of amide to glucose is much more variable than their sum, and that their concurrent synthesis respiration is remarkably constant.
Breakdown of starch and protein Transport of organic carbon and of nitrogen toward the storage organs occurs mainly in the form of sucrose and ami des (Van Die and Tammes 1975, Ziegler 1975). Because other organic components are present in small amounts, only breakdown into glucose and ami des is considered. In vegetative plant parts, only carbohydrates (predominantly starch) and proteins serve as the sources of these components.
44 PRODUCTIVITI' OF FIELD CROPS
As a basis for calculations, glucose is chosen as the substrate carbohydrate, rather than sucrose, merely for convenience. Sucrose is easily formed from glucose:
2 glucose+ 2 (ATP)- 1 sucrose+ 1 H20 (9)
The reaction occurs during phloem loading ( c.f. Meng~l1980). The reverse reaction is similar, but it does not yield A TP. Sucrose is 5% lighter than glucose per carbon atom. The breakdown of starch into glucose is a simple enzymatic hydrolysis. This yields the equation:
1.000 g starch+ 0.094 g H20 + 0.031 g 0 2- 1.082 g glucose+ 0.043 g C02 (10)
For protein breakdown, there is a similar choice of what to start with and what to end with. The simplest degradation process is hydrolysis into amino acids. By including energy demand for loading the phloem and assuming that tool maintenance requires the same amount of energy as synthesis (which may be an overestimation), the average equation becomes:
1.000 g protein + 0.082 g glucose + 0.096 g 02 + 0.110 g H20- 1.166 g amino acids+ 0.122 g C02
(11)
The average equation that describes the complex process of the breakdown of gluten corn, arachin, and gluten wheat proteins is:
1.000 g protein+ 0.095 g H 20 + 0.384 g 0 2 - 0.768 g amides + 0.370 g glucose (1 2) + 0.341 g C0 2 + (0.027 gmol ATP)
All amino acids were assumed to be broken down into asparagine or glutamine. Again, the pathways followed for breakdown are standard. If any cysteine was present in the protein, it was assumed to be transported as a sulfur carrier. Remaining carbon skeletons are rebui'It into glucose by gluconeogenesis reactions. Equation 12 is very close to that calculated earlier (Penning de Vries and VanLaar 1977).
Equation 12 shows that a net production of ATP results from protein breakdown, similar to the amount obtained by the combustion of 0.128 g glucose. That energy is estimated to be 5 to 10 times smaller than that required for maintenance of the tissue during the period in which it exports these amides. The excess energy prevents some other glucose molecules from being combusted. To account for this saving, equation 12 is modified to:
1.000 g protein+ 0.172 g H20 + 0.247 g 0 2 -0.768 g amides + (13
) 0.498 g glucose + 0.153 g C0 2
Again, we can estimate the variability of the coefficients of the equation. The extremes calculated are:
and:
0.880 g protein+ 0.070 g H 20 + 0.326 g 0 2 - 0.768 g amides + 0.237 g glucose + 0.271 g C02 + (0.023 grnol A TP)
(14)
1.118 g protein+ 0.107 g H 20 + 0.482 g 0 2 -0.768 g amides + (lS) 0.505 g glucose + 0.434 g C0 2 + (0.039 grnol ATP)
BIOE\"ERGETICS OF GRO\VTH OF SEEDS, FRUITS, AND STORAGE ORGANS 45
The variability can be shown by:
1.00 ± 0.15 g prot\ :n + 0.1 ± 0.04 g H 20 + 0.38 ± 0.15 g 0 2 -0.768 g amides + (1 6) 0.37 ± 0.2 g glucose+ 0.34 ± 0.1 g C0 2 + (0.3 ± 0.1 gmol ATP)
Combining equations 4 and 11~ we see that for the breakdown and resynthesis of 1 g of protein, at least 0.288 g glucose is required~ and probably 0.450 g glucose (equations .~ plus 13). The glucose requirement may even be as high as 0.578 g glucose,' g protein (equations 5 plus 12). This glucose is converted into C0 2 and H 20. Ptotein breakdown and resynthesis thus appear to be an expensive process.
Effects of species and environmental variables As there is no indication that different species produce the same product via energetically different biochemical pathways, the efficiencies of synthesis of specific components are assumed to be equal among all species of higher plants. The relative substrate requirement, of course, is not necessarily similar among species as biochemical compositions of storage organs differ.
Temperature and drought stress probably do not affect the efficiency of synthetic processes, though they may modify the rate~ and the composition of the storage organ as well. Fertilization and other cultural practices may also influence the biochemical composition of the storage organ, and its relative substrate requirement~ but only indirectly.
The effect of growth substances on changing the cost of biosynthesis has not yet been analyzed. It seems unlikely that growth substances modify tl)e efficiency~ but rather change the biochemical composition of tissues and redirect the flow of substrate to different organs. Growth substances modify morphology more than the carbon balance.
Maintenance processes This section estimates the intensity of respiration that results from maintenance processes in storage organs. Some of the information presented was discussed earlier (Penning de Vries 1975). Maintenance processes counteract spontaneous degradation of proteins, membranes, and ion gradients 1n cells. The cost of maintenance processes per unit of time is a multi plicate of the rates of the processes and their specific cost. Degradation and resynthesis of protein~ within cells was estimated earlier to require the equivalent of 0.24 g glucose/ g protein. With a turnover rate of about 15%/day, this corresponds to 28-53 mgglucose/ g protein per day, or7-13 mg glucose/ g total dry weight per day in vegetative tissues.
Maintenance of ion gradients was estimated to require the energy of 6-10 mg glucose/ gdry matter per day. The average rates of maintenance processes, however, are only known approximately, and even less is known of their fluctuations.· Therefore, it is still impossible to predict with reasonable certainty from basic data the rate of maintenance respiration (m.r.r.). It is still obtained from measurements: 1) by extrapolation of rates of respiration at diminishing rates of growth, or 2) growth suppresion in starvation experiments. Determined in this way, maintenance processes consume 7-60 mg glucose/ g dry matter per day in vegetative tissues at normal temperatures.
46 PRODUCTIVITY Of FIELD CROPS
Such m.r.r. values should not be extrapolated without further analysis of storage organs because they differ functionally from vegetative tissues.
Storage organs may grow relatively fast. Maintenance respiration seems to be more intense in rapidly growing tissue than in slowly growing tissue. The intensity of maintenance processes (m, expressed in gmol ATP per g dry matter per hour) in bacteria at 35° C has been found to be related to the growth rate (IJ., in gj g per hour in the fo~lowing way:
m = 0.0023 + 0.072 f.L (17)
(Van Verseveld, 1979), which can be transplanted into:
M = 0.26 + 0.34 X RGR ( 18)
where M is m.r.r. (g glucose/ g dry matter per day) and RGR is the relative growth rate (g/ g per day). Even after correcting for high temperature at which the observation was made, the basic value of m still appears to be about 10 times higher in bacteria than the m.r.r. in plant cells when expressed in the same units. This may not be amazing, considering the high protein content of bacteria cells and the large surface-to-volume ratio, both of which can be expected to stimulate maintenance processes. However, if such a relation of M with RGR holds in plants- for which there are some qualitative arguments (Penning de Vries 1975) - then it would follow that the m.r.r. in plants is usually dominated by the first term of equation 18 but also that the m.r.r. may be stimulated considerably at th~ RGR attained by very .Young organs.
On the other hand most of the proteins in storage organs are inactive and stabile, and energy requirements for their maintenance are probably near zero. Protein turnover is consuming about half of the total maintenance requirement so that the cost of maintaining storage organs is expected on a theoretical basis to be in the range of 4 to 30 mg glucose/ g per day in cereals and in legumes. For tuber crops and tree crops, which accumulate large amounts of starch or oil, this estimate is probably too high.
Actual measurements of the maintenance respiration rate are scarce. Flinn et al ( 1977) measured in detail the gas exchange and growth of developing pea fruits at an average temperature of 15PC. They calculated an average m.r.r. of 4 mg C02 / dry matter per day by subtracting the synthesis respiration (0.324 g C02 biomass formed, computed according to the procedure described in Figure 2) from the total respiration reported. This m.r.r. value may be too low, because the amino acid mixture in the phloem contained a larger variety of amino acids than was assumed in our calculation. A value of 8 mg C02 / g per day for this experiment is therefore retained.
Hole and Barnes ( 1980) also analyzed data from similar experiments with developing pea fruits and concluded that the m.r.r. oflarge fruits was about 15 mg C0 2/ g per day at l5°C. Their regression analysis, however, leads to an unrealistically low value for the synthesis respiration of only 0.073 g C0 2/ g biomass. When the value of 0.324 g C0 2 / g for the synthesis respiration of pea fruits is again adopted, reinterpre-
BIOE:\ERGETJCS OF GROWTH OF SEEPS, FRUITS, AND STORAGE ORGANS 47
Fraction Glucose Am ides C02 of 02
Component biomass
consumed consumed produced consumed
(g/g) (g) (g) (g) (g)
Carbohydrates 0.40 (1.211) 0.484 (0) - _(0.123) 0.049 (0.099) 0.040
Proteins 0.21 (0.948) 0.199 (0.768) 0.161 (0.544) 0.114 (0.250) 0.052
Lipids 0.23 (3.030) 0.697 (0) - (1.606) 0.369 (0.352) 0.081
Lignin 0.08 (2.119) 0.170 (0) - (0.576) 0.046 (0.189) 0.015
' Organic acids 0.04 (0.906) 0.036 (0) - (-.045) -.002 (0.270) 0.011
l Minerals 0.04 (0) - (0) - (0) (0) - -+ + + + + I -- -- -- -- --
I 1.00 1.586 0.161 0.576 0.199
I I For import of: 1. glucose 1.586/180. = 0.0088
2. am ides 0.161/139. = 0.0012
3. minerals 0.04 /100. = 0.0004 +
0.0104 gmol ATP
Generation of ATP: 0.049 g glucose+ 0.052 g 02-+ 0.071 g C02 + 0.0104 gmol ATP
(4.737) (5.053) (6.947) (1)
Final equation:
1.635 g glucose + 0.161 g amides + 0.251 g 02 + 0.04 g minerals-+ 1.000 g biomass+ 0.648 g C02
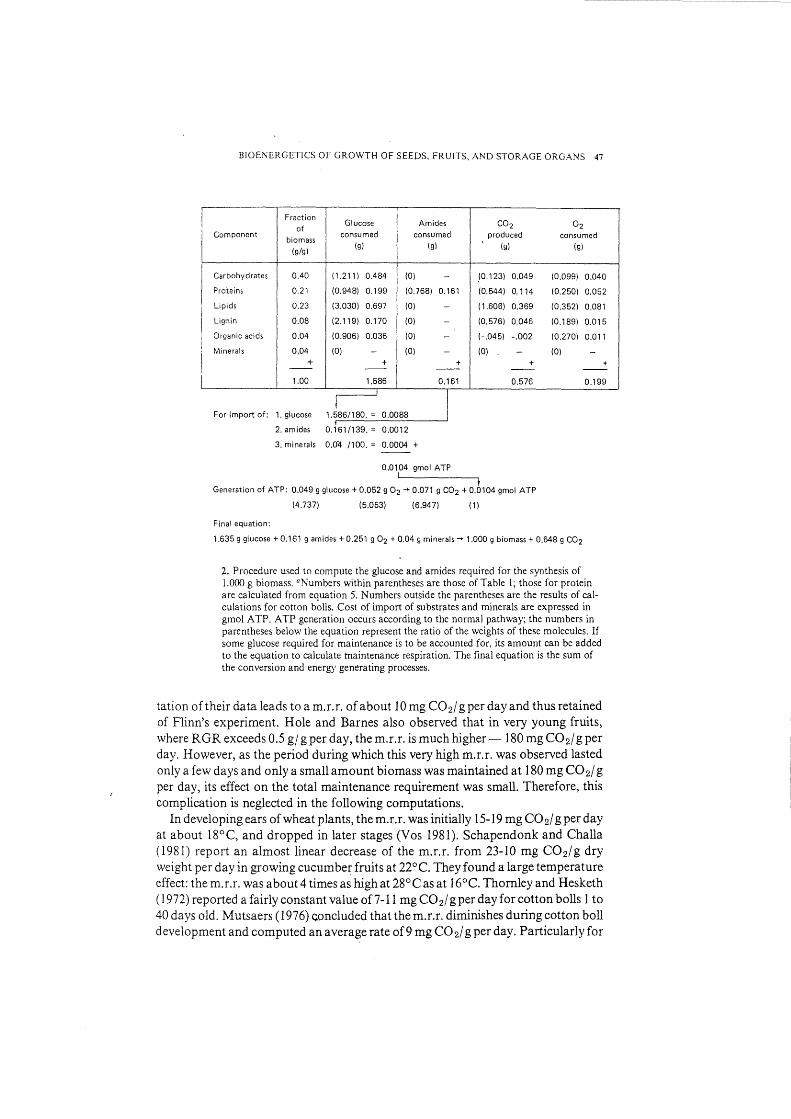
2. Procedure used to compute the glucose and amides required for the synthesis of 1.000 g biomass. 0 Numbers within parentheses are those of Table l; those for protein are calculated from equation 5. Numbers outside the parentheses are the results of calculations for cotton bolls. Cost of import of substrates and minerals are expressed in gmol ATP. ATP generation occurs according to the normal pathway; the numbers in parentheses below the equation represent the ratio of the weights of these molecules. If some glucose required for maintenance is to be accounted for, its amount can be added to the equation to calculate maintenance respiration. The final equation is the sum of the conversion and energy generating processes.
tation of their data leads to a m.r.r. of about 10 mg C0 2/ g per day and thus retained of Flinn's experiment. Hole and Barnes also observed that in very young fruits, where RGR exceeds 0.5 gf gperday, them.r.r. is much higher-180 mgC0 2/gper day. However, as the period during which this very high m.r.r. was observed lasted only a few days and only a small amount biomass was maintained at 180 mg C02/ g per day, its effect on the total maintenance requirement was small. Therefore, this complication is neglected in the following computations.
In developing ears of wheat plants, the m.r.r. was initially 15-19 mg C0 2/ g per day at about 18°C, and dropped in later stages (Vos 1981). Schapendonk and Challa (1981) report an almost linear decrease of the m.r.r. from 23-10 mg C02/g dry weight per day in growing cucumber fruits at 22°C. They found a large temperature effect: the m.r.r. was about 4 times as high at 28°C as at 16°C. Thomley and Hesketh ( 1972) reported a fairly constant value of7-11 mg C0 2/ g per day for cotton bolls 1 to 40 days old. Mutsaers (1976) concluded that the m.r.r. diminishes during cotton boll development and computed an average rate of9 mg C0 2/ g per day. Particularly for
48 PRODUCTIVITY OF FIELD CROPS
root crops and tree crops, data on the m.r.r. are lacking. The only value found in literature is 7 mg C0 2 / g per day, which Hunt and Loomis (1979) used in sugar beet growth simulation.
On the basis of this limited data, we adopt the preliminary conclusion that the m.r.r. equals 15 mg C0 2 / g dry weight per day. Its equivf.lent of 10 mg glucose/ g dry weight per day is used to calculate the substrate requirement for maintenance of growing storage organs of all species with the exception of root and tree crops. For those crops, a fixed value for the whole grmvth period is adopted. Arguments are provided below.
Maintenance respiration is generally sensitive to temperature. However, this is probably of secondary importance only, because the average temperature during the growth of the storage organs does not vary much from one site to another or from one year to another. In addition, the duration of the storage organ growth period tends to be shorter at higher temperatures. The effects on the m.r.r. of other environmental factors are probably not large, but they have not been quantified.
EVALUATION OF THE BIOCHEMICAL APPROACH
The biochemical approach to conversion and growth processes has been evaluated by comparing computations with experimental results. Unfortunately, synthesis and maintenance processes always occur simultaneously, and their substrate consumption or C0 2 production cannot be separated. Final proof of the correctness of the biochemical approach must wait until the intensity of maintenance processes can be predicted. Moreover, most experimental data are not sufficiently accurate to permit precise evaluation. ·
Observed and predicted growth or respiration rates, or both, have been compared for a maize embryo growing on a glucose solution in darkness (Penning de Vries 1974); the daily respiration of. whole plants in relation to their daily photosynthesis at various growth rates (Penning de Vries 1975); and the yield of seedlings of maize, beans, and groundnuts germinating in darkness at two temperatures (Penning de Vries and VanLaar 1977). Generally, there was fair agreement between the measured and predicted substrate requirements, growth rates, and respiration rates. Thomley and Hesketh ( 1972) analyzed the growth and respiration of cotton bolls and concluded that 0. 74 ± 0.1 g boll and 0.38 ± 0.15 g C02 were formed per 1.00 g of substrate. This value is a little lower than that computed for cotton in Figure 2: 0.648 g C02/g biomass, or 0.33 g glucose/0.74 g biomass. Yokoi et al (1978) measured a value for the synthesis respiration of germinating beans close to the theoretical value. V os ( 1981) found a synthesis respiration relative to the growth rate in developing wheat ears of0.24 g C0 2/ g biomass increase a value slightly below the theoretical 0.28 g C0 2/ g, possibly because there was little lignin synthesis at the time of measurement, hence less respiration. Schapendonk and Challa ( 1980) confirmed that the computed synthesis respiration efficiency of a growing cucumber fruit (0.15-0.17 g C0 2/g) was close to the theoretical efficiency (0.16-0.21 g C0 2/g), considering the biochemical composition of the fruit. The theoretical substrate requirements of growth processes in various crops in various stages of development are in line with observations of Yamaguchi (1978).
BJOE\ERGETICS OF GRO\\ TH OF SEEDS, FRL'ITS. A;\D STORAGE ORGA;\S 49
Except for the growth of fibrous roots no experimental data indicated that the efficiency of biosynthesis de\·iates significantly fr~.)m that computed on a theoretical basis. It is confirmed in almost all papers that temperature has no effect on efficiency.
By im·erted reasoning, Penning de Vries et al (I 979) determined the rate of growth (expressed as synthesis of structural dry matter) in intact plants by measuring the rate of respiration. subtracting maintenance respiration, and computing the rate of synthesis from the remaining synthesis respiration.
SUBSTRATE REQUIREMEJ\TS FOR GROWTH OF STORAGE ORGAJ\S
Data characterizing crops To calculate substrate requirements, data on the biochemical composition of storage organs \Vere needed. In addition to the biochemical composition of the final product after threshing, cleaning, and technological processing, the composition of the raw product was needed (final product plus hulls, seed coats, pods, and inflorescences) to fit our definition of storage organ. The fractions these parts contribute to the total weight of the storage organs are presented in Table 3. .
The biochemical compositions of whole storage organs of various crops also are given in Table 3. Two problems were involved in constructing Table 3: 1) not all appropriate data could be found and 2) data that were obtained usually concerned only th~ final product and not the total storage organ, which required adjustments of reported biochemical compositions. The ash fraction reported in literature is interpreted as oxide ash, about 60% of which is minerals. Organic acids are rarely reported. \Ve assumed that the quantity of organic acids equaled that of minerals because both are often chemically coupled into salts. The amount of lignin is also rarely reported. VanderMeer ( 1979) states that lignin is an important constituent of fiber, although some lignin is present elsewhere in the biomass. The lignin in the principal fraction of storage organs is usually very low (Hartley 1978), but fairly high in the enveloping tissues. The lignin fraction in stems of graminoids is often above 20% (Sarkanen and Ludwig 1971) and is assumed to be similar for other support tissues. Although it is a significant constituent of many aboveground storage organs, its quantification remains difficult. The carbohydrate fraction in Table 3 is equal to the difference between 100% and the sum of the other groups.
The biochemical fractions reported in Table 3 are median values. A range is indicated when several sources of data were encountered. If a few were found, only the most complete data set was used. The data are based on more than 40 literature references. The principal source of information about storage organ components and about the biochemical composition are given. Sugarcane is not really a storage organ but is included as basis of comparison with other crops.
The biochemical compositions of the storage organs are fairly characteristic per species, but are not really fixed. They can be influenced by cultural measures, variety, and weather. Examples of how fertilization affects the protein content were given by Kramer ( 1979). He also presented examples of differences in protein ~ontent of wheat cultivars. Franke (1976) shows that groundnut has higher lipid and lower protein content at higher growth temperatures.
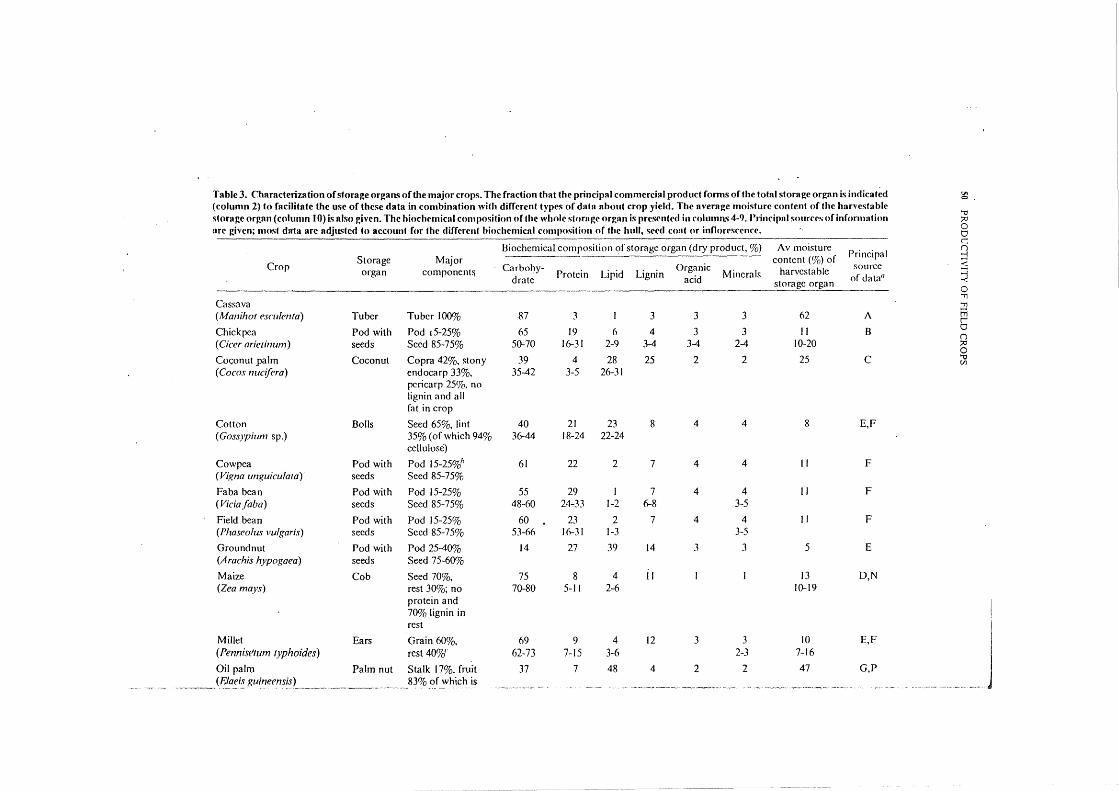
Table 3. Characterization of storage organs ofthe major crops. The fraction that the principal commercial product forms of the total storage organ is indicat~d !Jo 0
(column 2) to facilitate the usc of these data in combination with different types of d~tta about crop yield. The average moisture content of the harvestable '"0
storage organ (column I 0) is nlso givrn. The hioclwmical composition of the whole storngr orgnn is prcscrt((·d in columns 4-9. Principal sourcrs of information ;:>:1
nrc given; most dnta nrc adjusted to account for the diffrrent biochcmicnl composition of the hull, se('d coni or innorcsccncc. 0 0
Biochemical composition of storage organ (dry product,%) Av moisture c
Principal ()
Storage Major content (%) of j Crop Carbol~y- Organic source <
organ component~ Protein Lipid Lignin Minerals harvcstablc ~ drate acid of data0
storage organ 0 '"11
Cassava '11
(Manihot esmlenta) Tuber Tuber 100% 87 3 I 3 3 3 62 A tTi l'
Chickpea Pod with Pod t5-25% 65 19 6 4 3 3 II B 0 ()
( Cicer arietinum) seeds Seed 85-75% 50-70 16-31 2-9 3-4 3-4 2-4 10-20 f1:' 0
Co<;onut .ralm Coconut Copra 42%, stony 39 4 28 25 2 2 25 c '"0 Cll
(Cocos nucifera) endocarp 33%, 35-42 3-5 26-31 pcricarp 25%. no lignin and all fat in crop
Cotton Bolls Seed 65%, lint 40 21 23 8 4 4 8 E,F (Goss)pium sp.) 35% (of which 94% 36-44 18-24 22-24
cellulose)
Cowpea Pod with Pod 15-25%h 61 22 2 7 4 4 II F (Vigna unguicu!ata) seeds Seed 85-75%
Faba bean Pod with Pod 15-25% 55 29 I 7 4 4 II F (Vidafaba) seeds Seed 85-75% 48-60 24-33 1-2 6-8 3-5
Field bean Pod with Pod 15-25% 60 23 2 7 4 4 II F (Phaseoluv vulgaris) seeds Seed 85-75% 53-66 16-31 1-3 3-5
Ground nut Pod with Pod 25-40% 14 27 39 14 3 3 5 E (A rachis hypogaea) seeds Seed 75-60%
Maize Cob Seed 70%, 75 8 4 Jl I I 13 D,N (Zea mays) rest 30%; no 70-80 5-1 I 2-6 10-19
protein and I 70% lignin in
rest
I Millet Ears Grain 60%, 69 9 4 12 3 3 10 E,F (Pennisetum typhoides) rest 40%~" 62-73 7-15 3-6 2-3 7-16
I Oil palm Palm nut Stalk 17%, fruit 37 7 48 4 2 2 47 G,P
______ (J?!_af:i~ Ruineens!s L ____ ~ -~-- ------~- ____ -·· 83% of which is ----~ --~--·-..,- -- • -~c-- -- -- ~-- ---- ----- --·-.·" ~------·,..--,.,., -· ' -~
j
----, shell <t nd kernel 12.Y,i,, each
Pigeon pea Pod with Pod 15-25%, 60 20 2 10 4 4 13 F ( Cajanus cajan) seeds Seed RS-7So/d'
Potato Tuber Tuber 100% n 9 0 3 5 5 76 H (Solanum tuherosum) 73-RI 6-13 0-1 63-X7
Rice In flo res- 60% grain, 20% 76 R 2 12 I I 12 E,F,Q (Oryza sativa) cencewith chaff, 20% stalk 73-R I 6-9 0-3 0-2 11-14
seeds t:O
Sorghum Inflores- 60% grain, 20% 72 9 3 12 2 2 10 I 0 tT1
(Sorghum bicolor) cencewith chaff, 20% stalk<. 67-74 7-13 3-4 1-2 8-16 z tT1
seeds ;:o 0
Soybean Pod with Pod20-40% 29 37 18 6 5 5 7 F,R tT1 ...;
(Glycine max) seeds Seed 80-60% 20-34 32-47 14-22 3-6 2-5 2-·7 5-10 n C/1
Sugar beet Beet Beet 100% 82 5 0 5 4 4 77 H 0
(Beta vulgaris) 73-87 3-9 0-1 1-8 'T1 0
Sugarcane Whole Millable cane 57 7 2 22 6 6 73 J ;:o 0
(Saccharum sp.) tops 50-60%, in which ~ ...;
9-13% sugar ::r::
Sunflower Inflores- Kemels 44%, hulls 45 14 22 13 3 3 6 E,K 0 'T1
(Helianthus annuus) cencewith 23%,d inflorescence 29-51 12-20 18-31 3-4 C/1 tT1
seeds 33%; almost all oil tTl o· and no lignin in Yl kemels 'T1
;:o
Sweet potato Tuber Tuber 100% 84 5 2 3 3 3 70 A c =l
(Ipomoea batatas) 50-80 _Cil
Tomato Fruit Fruit 100% 54 17 4 9 8 R 94 L > z
(Lycopersicum esculentum) 51-57 16-18 2-6 8-10 93-95 0 C/1
Wheat Inflores- Grain 85% 76 12 2 6 2 2 13 M,N ...; 0
(Triticum sp.) cence with Inflorescence 15% 73-79 9-15 9-18 ;:o >
seed 0 tT1
Yam Tuber Tuber 100% 80 6 I 3 5 5 70 F 0 ;:o
(Dioscorea sp.) 60-80 0 >
0 A= Onwueme 1978, B= Vander Maesen 1972, C= Purseglove 1975, D= Earle 1977, E= Benedictus 1980, F= Purseglove 1974, G= Orr and Adair 1967, z C/1
H= Brouwer 1976, I= Franke 1976,J= Nathan 1978, K= Carter 1978, L= Herrmann 1979, M= Brouwer 1972, N= Sibma pers. comm., 0= Dantuma and Klein f-Iulze pers. comm., P= Corley, pers. comm., Q= Van Keulen pers. comm., R= Guptaetal1973. hJnanalogy to Faba bean. "Own estimate. "In ~
analogy to rice.
52 PRODUCTIVITY OF FIELD CROPS
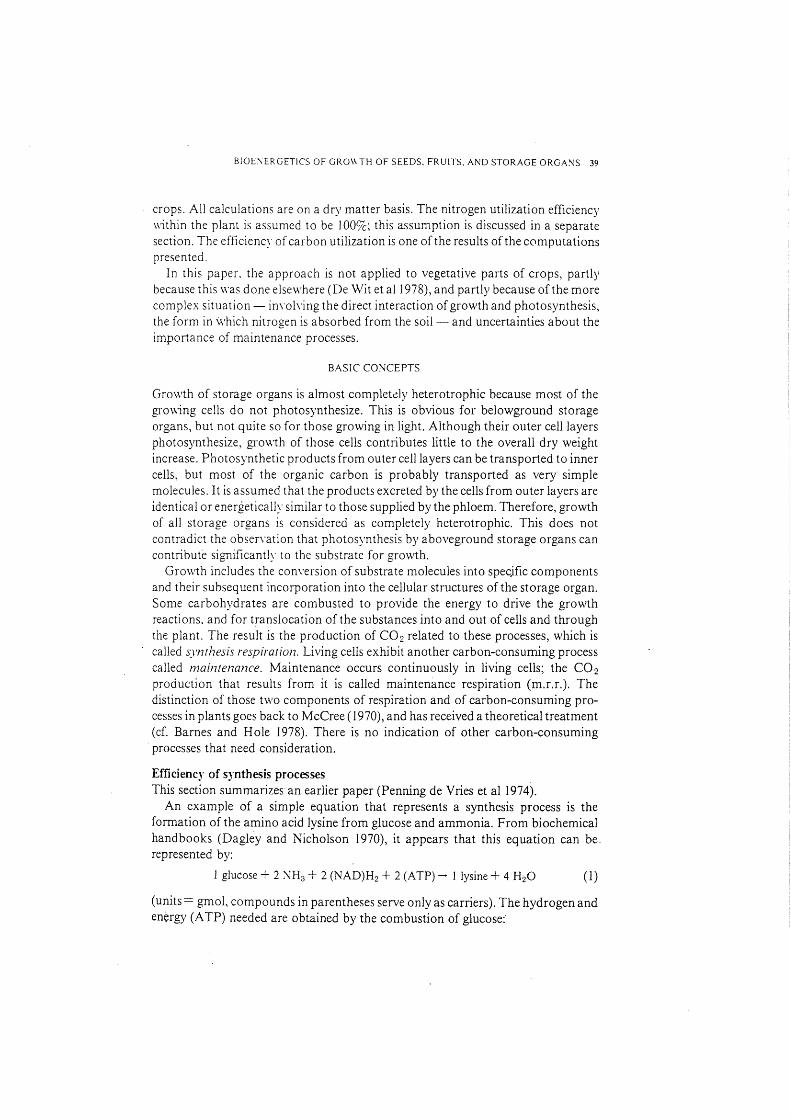
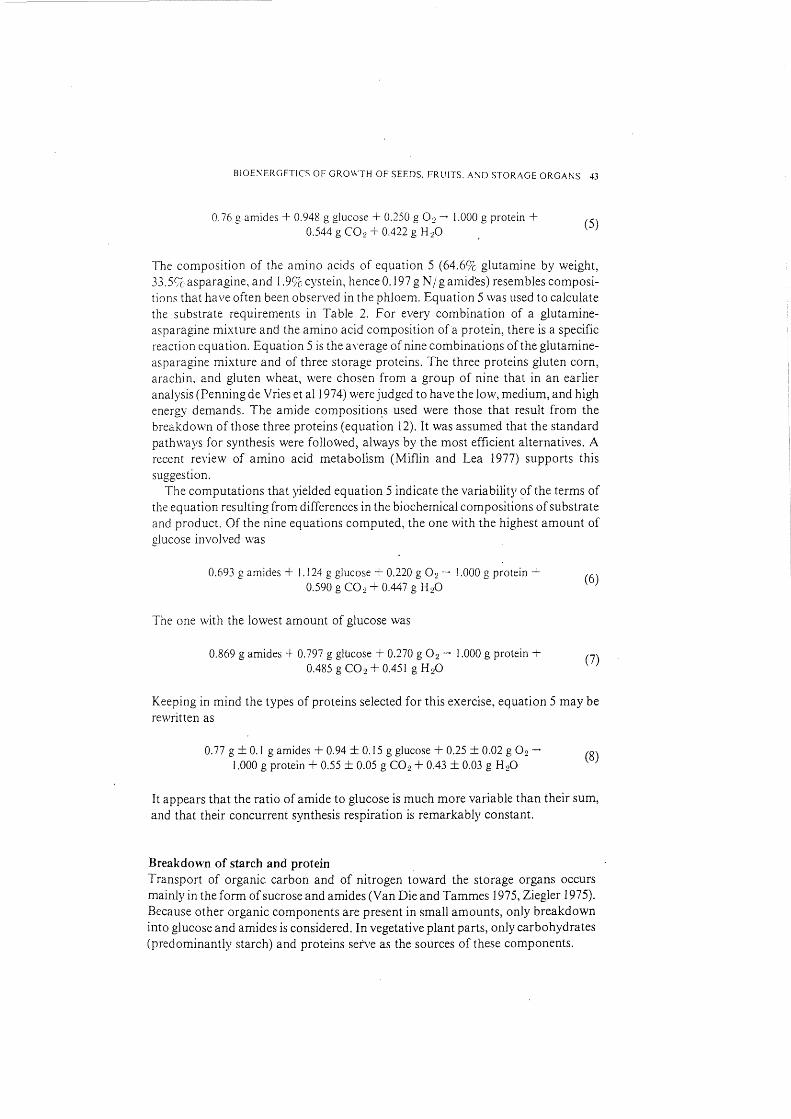
Am ides (kg /kg storage organ) 0.3~-----------------------------------------.
0.2
0.1
0
jf-(vic;a ~ut Phoseolus
\~wp Chickpea.
. To~';: Pig~eo~::f~wer Wheat~
lSorgt¥.Jm Millet ~otato Rice~iie_.5ugor\one
1 Oil palm
Yom• ~eet potato \
fl' I
cossovugor beet ~nut
2.0 3.0 Glucose (kg/kg storage organ)
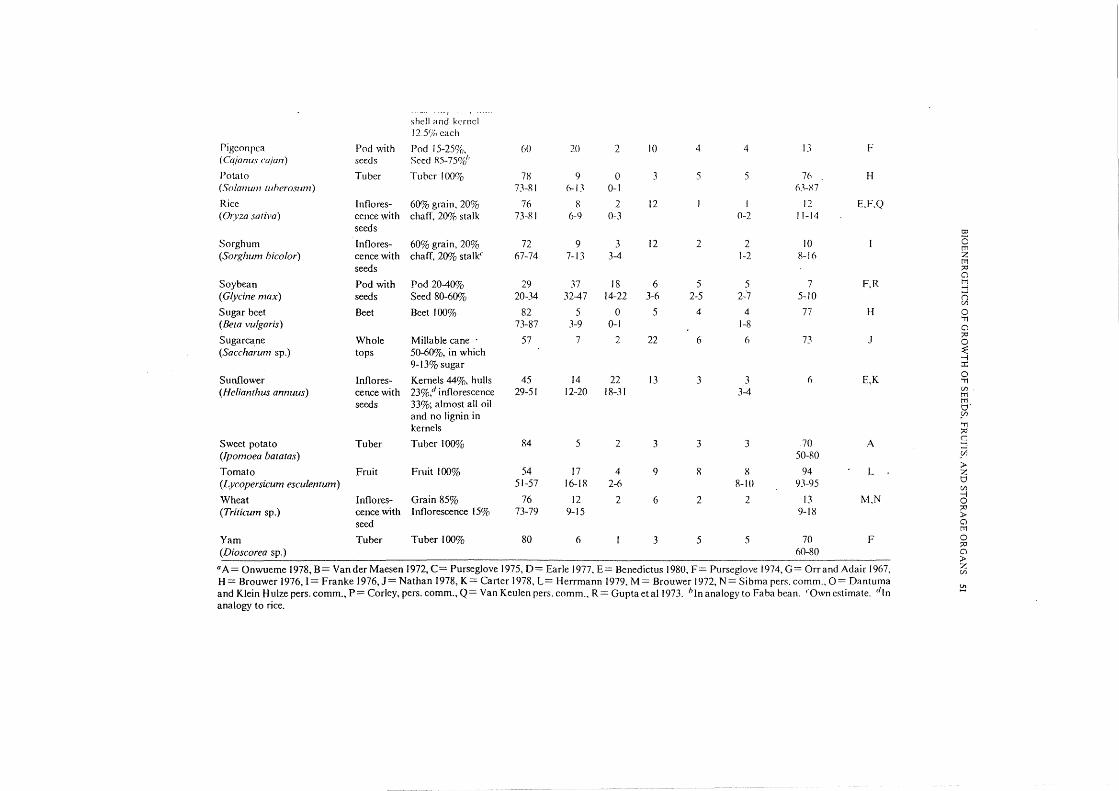
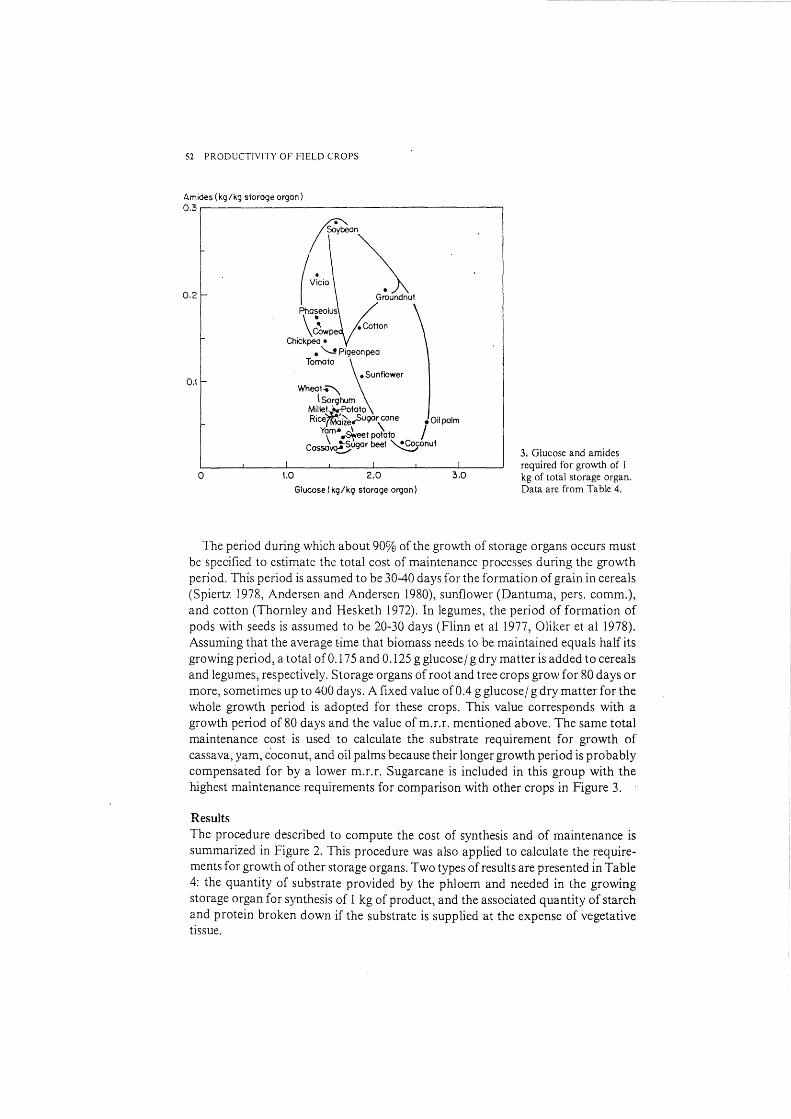
3. Glucose and amides required for growth of l kg of total storage organ. Data are from Table 4.
The period during which about 90% of the growth of storage organs occurs must be specified to estimate the total cost of maintenance processes during the growth period. This period is assumed to be 30-40 days for the formation of grain in cereals (Spiertz 1978, Andersen and Andersen 1980), sunflower (Dantuma, pers. comm.), and cotton (Thornley and Hesketh 1972). In legumes, the period of formation of pods with seeds is assumed to be 20-30 days (Flinn et al 1977, Oliker et al 1978). Assuming that the average time that biomass needs to be maintained equals half its growing period, a total of 0.17 5 and 0.125 g glucose I g dry matter is added to cereals and legumes, respectively. Storage organs of root and tree crops grow for 80 days or more, sometimes up to 400 days. A fixed value of 0.4 g glucose/ g dry matter for the whole growth period is adopted for these crops. This value corresponds with a growth period of 80 days and the value of m.r.r. mentioned above. The same total maintenance cost is used to calculate the substrate requirement for growth of cassava, yam, c'oconut, and oil palms because their longer growth period is probably compensated for by a lower m.r.r. Sugarcane is included in this group with the highest maintenance requirements for comparison with other crops in Figure 3.
Results The procedure described to compute the cost of synthesis and of maintenance is summarized in Figure 2. This procedure was also applied to calculate the requirements for growth of other storage organs. Two types of results are presented in Table 4: the quantity of substrate provided by the phloem and needed in the growing storage organ for synthesis of I kg of product, and the associated quantity of starch and protein broken down if the substrate is supplied at the expense of vegetative tissue.
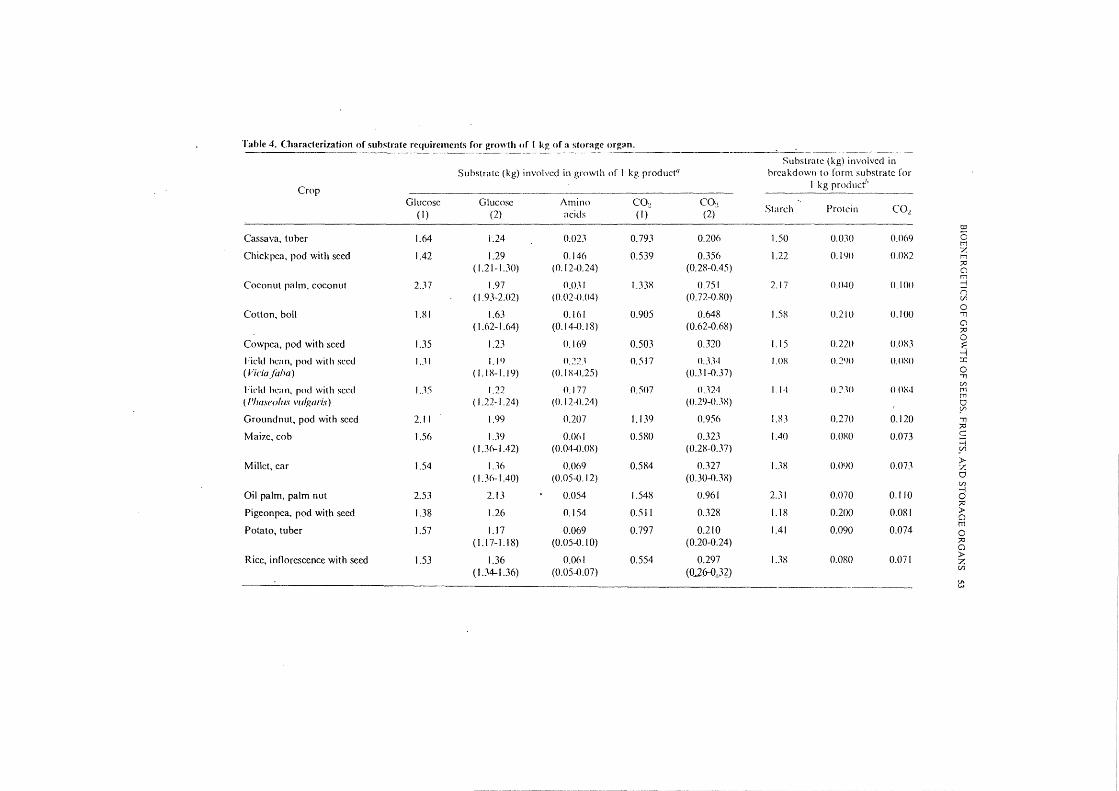
Table 4. Characteri7.ation of substrate rC<Juiremcnts for growth of 1 k~ of a storage organ.
Substrate (kg) invoivcd in Substrate (kg) involved in growth of I kg productu brcakd()\\1!1 to form substrate ror
Crop I kg product''
Glucose Glucose Amino co~ co~ Starch Protein C02 (I) (2) acids (I) (2)
1:0
Cassava, tuber 1.64 1.24 0.02J 0.793 0.206 1.50 ().()J() 0.069 0 t'T1
Chickpea, pod with seed 1.42 1.29 0.146 0.539 0.356 1.22 O.IYO O.OX2 % t'T1
( 1.21-I.JO) (0.12-0.24) (0.28-0.45) ?0 () t'T1
Coconut palm, coconut 2.37 1.97 0.031 1.338 0.751 2.17 0.040 0.100 j
( 1.93-2.02) (0.02-0.04) (0.72-0.80) n {/}
Cotton, boll 1.81 1.63 0.161 0.905 0.648 l.SX 0.210 0
0.100 ., (1.62-1.64) (0.14-0.18) (0.62-0.68) ()
?0
Cowpea, pod with seed 1.35 1.23 0.169 0.503 0.320 1.15 0.220 O.OX3 0 :;:. ....:j
Field ht:nn, pod with seed 1..11 1.19 0.~2.1 0.517 O.JJ·t I. OX 0.2110 O.OXO ::r: ( Viciafaha) ( I. 18-1. 19) (0.1 X-0.25) (O.Jl-O.J7) 0 ., held hc:m, pod with seed l .. l'i 1.22 0.177 0.507 0 .. 124 1.1•1 0.7.10 OOX4
{/}
t'T1 rn
( 1'/ra.woltJs vul~;aris) ( 1.22-1.24) (0.12-0.24) (0.29-0.JX) tJ ~
Groundnut, pod with seed 2.11 1.99 0.207 1.139 0.956 un 0.270 0.120 ., ?0
Mai?.c, cob 1.5o 1.39 ().()61 0.580 0.323 1.40 O.OXO 0.073 c =i ( 1.3(-...1.42) (0.04-<J.OX) (0.2X-0.37) _Vl
Millet, car 1.54 1.36 0.069 0.584 0.327 1.38 0.0\>0 0.073 > :7.
( l.Jfr-1.40) (0.05-0.12) (0.30-<US) tJ {/}
Oil palm, palm nut 2.53 2.13 0.054 1.548 0.961 2.31 0.070 0.110 -1 0 ?0
Pigeonpea, pod with seed 1.38 1.26 0.154 0.511 0.328 1.18 0.200 0.081 > ()
Potato, tuber 1.57 1.17 0.069 0.797 0.210 1.41 0.090 0.074 t'T1
0 (1.17-1.18) (0.05-0.1 0) (0.20-0.24) ?0
0
Rice, inllorcscence with seed 1.53 1.36 0.061 0.554 0.297 1.38 0.080 0.071 > z ( 1.34-1.36) (0.05-().07) (0..26-0.)2)
{/}
V1 w

Table 4 continued 'JI ... Substrate (kg) involved in '"0
i" Substrate (kg) involved in growth of I kg product0 breakdown to form substrate for 0
I kg product' CJ Crop c
(")
Glucose Glucose ·Amino COz COz Starch Protein COz
::J (I) (2) acids (I) (2) <
=1 ...-:
Sorghum, inflorescence with 1.53 1.36 0.069 0.571 0.314 U7 0.090 0.07J 0 .,., seed .( I.J6-I.J7) (0.05-{l.IO) (O.J0-0.35) .,., Soybean, pod with seed I. "i8 1.46 0.284 0.806 0.623 1.29 0.370 0.112
tTi r
( 1.32-1.50) (0.24-0.36) (0.60-0.65) CJ (")
Sugar beet, beet 1.62 1.22 0.038 0.794 0.207 1.47 0.050 0.071 ;:o 0
(1.18-1.26) (0.02-{).07) (0.20-0.24) '"0 (/l
Sugarcane, whole tops (1.78) 1.38 0.054 0.333 1.25 0.070 0.064
Sunflower, inflorescence with 1.87 1.69 0.108 0.889 0.632 1.66 0.140 0.093 seed ( 1.63-1.83) (0.09-0.15) (0.56-0.80)
Sweet potato, tuber 1.65 1.25 0.038 0.817 0.230 1.50 0.050 0.071
Tomato, fruit 1.36 1.24 0.131 0.513 0.330 l.I8 0.170 0.077 ( 1.20-1.27) (0. I 2-0.14) (0.29 -0.37)
Wheat, inflorescence with 1.45 1.27 0.092 0.535 0.278 1.28 0.120 0.074 seed (1.27-1.28) (0.07-0. I 2) (0.27-0.29)
Yam, tuber 1.60 1.20 .0.046 0.800 0.2I3 1.45 0.060 0.072 0 Processing that occurs in all storage organs; (I)= requirement for synthesis plus maintenance, (2)= requirements for synthesis only; numbers in parentheses represent variations due to variations in biochemical composition of the storage organ. "These processes may occur in vegetative tissues. Values are calculated according to equations 10 and 13, for situation (I).
BIOENERGETICS OF GROWTH OF SEEDS, FRUITS, AND STORAGE ORGANS 55
The amount of glucose required for synthesis only and the sum of that needed for synthesis and maintenance are specified. Also given is the. C0 2 production for synthesis and for synthesis plus maintenance together. These details will facilitate reconstruction of the final results of the calculations, and, if the reader desires, use of alternative assumptions (e.g. about cost of maintenance) and repetition of the computations. The variations in substrate requirements due to the variations in the biochemical composition are only indicated for the synthesis. The calculations to arri\·e at columns 7-9 are performed according to equations 13 and 10. The amounts of protein equal those indicated in Table 3, as the efficiency of transfer of nitrogen is supposed to be 100%. If respiration (column 9) is compared with measurements, it should be remembered that -maintenance respiration of vegetative organs is not yet accounted for.
Table 4 indicates that it is particularly the lipid content of storage organs that makes them expensive to produce. The requirements for maintenance increase the total requirements for growth, but do not disturb the picture that evolved as a result of cost of synthesis, except for tuber crops in which maintenance requires a considerable fraction of the substrate. However, the intensity of maintenance respiration processes is not well known, and deserves further crop physiological research. The efficiency of carbon utilization for synthesis of storage organs can be computed in different crops with the data from Tables 1, 3, and 4 (columns 3, 4). Carbon utilization efficiency appears to be about 0.80 g Cj g C; groundnut has the lowest efficiency (0.70) and potato the highest (0.89). -
The results given in Table 4 are those of the whole growth period of the storage organ. The concentration of components may change during growth: protein synthesis is sometimes relatively advanced and at later stages the synthesis of carbohydrates and lipids is emphasized. One example is in the growth oflupin seeds (Atkins et all975); both growth efficiency u.nd respiration per unit dry weight change during the growth period. This possible complication requires careful consideration when predicted efficiencies and respiration rates are compared with measured values.
Sinclair and De Wit (1975) calculated the substrate requirement for growth of seeds in a way similar to the one presented here. The most important differences are that \ve include the requirements for synthesis of components supporting or enveloping the principal product, and account for the cost of maintenance of the storage organ. Figure 3 presents the substrate requirements in a graphical way that permits the distinction of crop groups - cereals, legumes, beets and tubers, and oil-rich seeds - on the basis of substrate requirements.
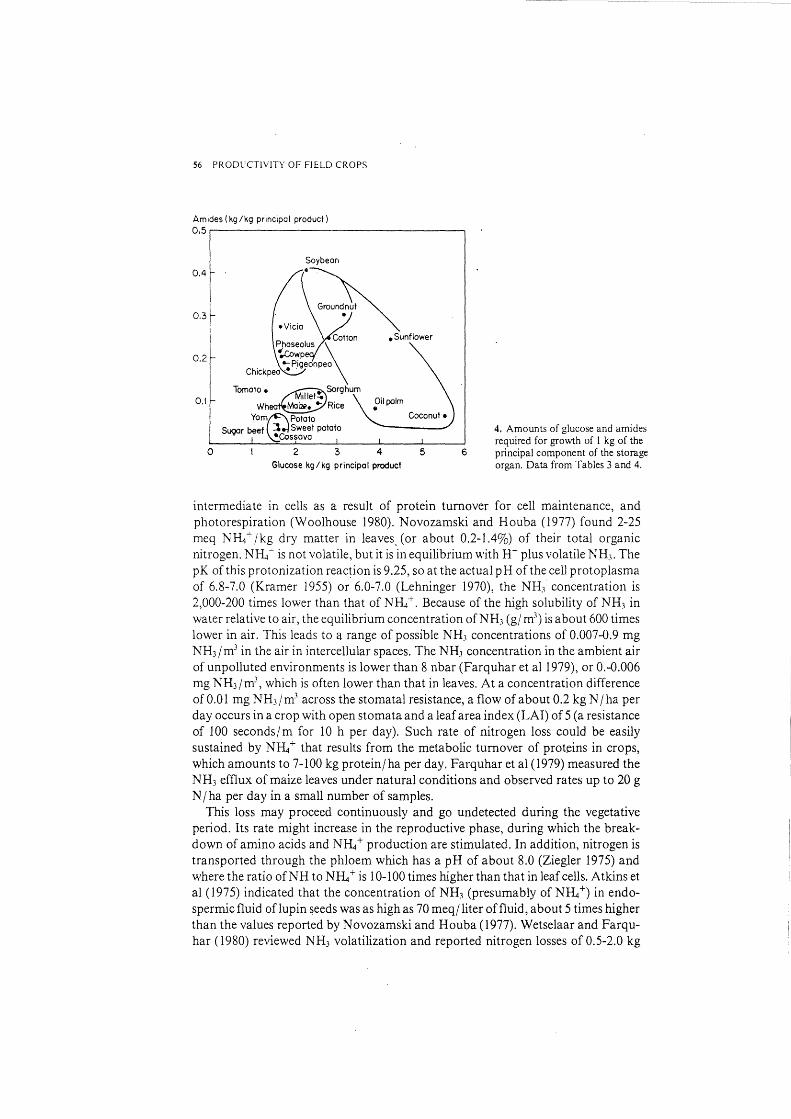
The requirements for growth expressed per kilogram of the principal component are plotted in Figure 4. This is one way to show the economic cost of the principal product. Figure 4 exaggerates the differences between crops, as valuable byproducts are ignored.
EFFICIENCY OF NITROGEN UTILIZATION
Calculations of nitrogen utilization assume that no nitrogen gets lost in the processes of breakdown, transfer, and resynthesis, but the value might not be 100%. There probably is a physicochemical loss from the formation and volatilization of NHJ. During breakdown of some amino acids, NIL+ is formed probably as a normal
56 PRODUCTIVITY OF FJELD CROPS
Am ides (kg /kg principal product) 0.5 r---------------------,
0.4
0.3
.sunflower
0.2
0.1
0 4 5 6 Glucose kg/kg principal product
4. Amounts of glucose and amides required for growth of l kg of the principal component of the storage organ. Data from Tables 3 and 4.
intermediate in cells as a result of protein turnover for cell maintenance, and photorespiration (Woolhouse 1980). Novozamski and Houba (1977) found 2-25 meq NRt /kg dry matter in leaves_ (or about 0.2-1.4%) of their total organic nitrogen. N~ ~is not volatile, but it is in equilibrium with H+ plus volatile NH3 . The pK of this protonization reac~ion is 9.25, so at the actual pH of the cell proto plasma of 6.8-7.0 (Kramer 1955) or 6.0-7.0 (Lehninger 1970), the NH_, concentration is 2,000-200 times lower than that of N~ +. Because of the high solubility of NH3 in water relative to air, the equilibrium concentration ofNH3 (g/ m3
) is about 600 times lower in air. This leads to a range of possible NH3 concentrations of 0.007-0.9 mg NH3 jm3 in the air in intercellular spaces. The NH_, concentration in the ambient air of unpolluted environments is lower than 8 nbar (Farquhar et al1979), or 0.-0.006 mg NH3 / m3
, which is often lower than that in leaves. At a concentration difference of 0.01 mg NHJ/ m3 across the stomatal resistance, a flow of about 0.2 kg N I ha per day occurs in a crop with open stomata and a leaf area index (LAI) of 5 (a resistance of 100 seconds/m for 10 h per day). Such rate of nitrogen loss could be easily sustained by N~ + that results from the metabolic turnover of protdns in crops, which amounts to 7-100 kg proteinjha per day. Farquhar et al (1979) measured the NH3 efflux of maize leaves under natural conditions and observed rates up to 20 g Njha per day in a small number of samples.
This loss may proceed continuously and go undetected during the vegetative period. Its rate might increase in the reproductive phase, during which the breakdown of amino acids and N~ + production are stimulated. In addition, nitrogen is transported through the phloem which has a pH of about 8.0 (Ziegler 1975) and where the ratio of NH to N~ + is I 0-100 times higher than that in leaf cells. Atkins et al (1975) indicated that the concentration of NH3 (presumably of NIL+) in endospermic fluid oflupin seeds was as high as 70 meq/liter of fluid, about 5 times higher than the values reported by Novozamski and Houba (1977). Wetselaar and Farquhar ( 1980) reviewed NH3 volatilization and reported nitrogen losses of 0.5-2.0 kg
BlOE!\ERGETICS OF GROWTH OF SEEDS, FRUITS, AND STORAGE ORGANS 57
\" ha per day during a few weeks at the end of the growing season. The losses could not be attributed to leaching or internal redistribution.
REFERENCES CITED
Andersen. S .. and K. Andersen. 1980. The relationship between seed maturation and seed yield in grasses. Pages 15 I- I 72 in P. Hebbletwaite, ed. Seed production. Butterworths, London.
,.;tkins. C. A .. J. S. Pate, and P. J. Sharkey. 1975. Asparagin metabolism, key to the nitrogen nutrition of developing legume seeds. Plant Physiol. 56:807-812. ·
Bandurski. R. S. 1960. The group potentials and the role of phosphate in energy transfer. Pages 132- I 57 in W. Ruhland, ed. Encyclopedia of plant physiology. Vol 12. Springer Verlag, Berlin.
Barnes. A., and C. C. Hole. 1978. A theoretical basis of growth and maintenance respiration. Ann. Bot. 42:1217-1221.
Benedictus, K, ed. 1980. Yeevoedertabel. Centraal Yeevoederbureau, Lelystad, The ;.; ether1ands.
Brouwer, W. 1972. Handbuch des speziellen Pflanzenbaues. Band 1. Paul Parey, Berlin. Brouwer, W. 1976. Handbuch des speziellen Pflanzenbaues. Band 2. Paul Parey, Berlin. Caner. J. F., ed. 1978. Sunflower science and technology. Agronomy 19. American Society of
Agronomy, Crop Science Society of America, Soil Science Society of America, Madison. Wisconsin.
Dagley. S .. and D. E. Nicholson. 1970. An introduction to metabolic pathways. Blackwell Scientific Publishers, Oxford. ·
Earle. F. R. 1977. Protein and oil in corn: variation by crop years from 1907 to 1972. Cereal Chern. 54(1):70-79.
Farquhar, G. D., R. Wetselaar, and P. M. Firth. 1979. Ammonia volatilization from senescing maize leaves. Science 203: 1257-1258.
Fla\·eJL R. B., and D. H. Barratt. 1977. Mitochondrial efficiency and grain yield in wheat. Ann. Bot. 41:1323-1331.
Flinn. A. M., C. A. Atkins, and J. S. Pate. I 977. Significance of photosynthetic and respiratory exchanges in the carbon economy of the developing pea fruit. Plant Physiol. 60:412-4 I 8.
Franke. G., ed. 1976. Nutzpflanzen der Tropen und Subtropen. 2. Aufl. Band 2. S. Hirzel Verlag, Leipzig.
Gupta, B.S., D. E. Johnson, F. C. Hinds, and H. C. Minor. 1973. Forage potential of soybean straw. Agron. J. 65:538-541.
Hartley, R. D. 1978. The lignin fraction of plant cell walls. Am. J. Clin. Nutr. 31:S90-S93. Herrmann, K. 1979. Uebersicht ueber die Inhaltsstoffe der Tomaten. Z. Lebensm. Unters.
Forsch. 169:179-200. Hole, C. C., and A. Barnes. 1980. Maintenance and growth components of carbon dioxide
efflux from growing pea fruits. Ann. Bot. 45:295-307. Hunt. W. F., and R. S. Loomis. 1979. Respiration modeling and hypothesis testing with a
dynamic model of sugar beet growth. Ann. Bot. 44:5-17. Kramer. Th. 1979. Environmental and genetic variation for protein content in winter wheat
(Triticum aestivum L.) Euphytica 28:209-218. Kramer, P. J. J 955. Physical chemistry of the vacuole. Pages 649-660 in W. Ruhland, ed.
Encyclopedia of plant physiology. Volume 1. Springer Verlag, Berlin. Lambers, J. T. 1979. Energy metabolism in higher plants in different environments. PhD
thesis. University of Groningen, The· Netherlands.
58 PRODUCTIVITY OF FIELD CROPS
Lehninger, A. L. 1970. Biochemistry. Worth Publishers, .'\ew York. Lupton, F. G. H. 1980. Breeding for higher yields. Pages 2J-36 in Physiological aspects of
crop productivity. IPI colloquium. Wageningen, the .'\etherlands. McCree, K. J. 1970. An equation of the rate of respiration for white clover plants grown under
controlled conditions. Pages 221-229 in I. Setlik, ed .. Prediction and measurement of photosynthetic productivity. Proc. IBP I PP tech. meeting PUDOC, Wageningen, The Netherlands.
Mengel. K. 1980 .. Assimilate transport through phloem tissue. Pages 51-64 in Physiological aspects of crop productivity. I 5th IPI colloquium. \Vageningen, the I\etherlands.
Miflin. B. J., and P. J. Lea. 1977. Amino acid metabolism. Ann. Rev. Plant Physiol. 28:299-329.
Mutsaers, H. J. W. 1976. Growth and assimilate conversion of cotton bolls. Ann. Bot. 40:301-315.
Nathan, R. A., ed. 1978. Fuels from sugar crops. Tech. lnf. Cent. US Dep. of Energy. Novozamsky, 1., and V. J. G. Houba. 1977. Determination of free ammonium in plant tissue.
Neth. J. Agric. Sci. 25:26-31.
Oliker, M., A. Poljakoff Mayber, and A. M. Mayer. 1978. Changes in weight, nitrogen accumulation, respiration and photosynthesis during growth and development of seeds and pods of Phaseolus vulgaris. Am. J. Bot. 65:366-371.
Onwueme, l. C. 1978. The tropical tuber crops. John Wiley and Sons, Chichester. Orr. E., and D. Adair. I 967. The production of protein foods and concentrates from oilseeds.
Tropical Products Institute, London. Pate, J. S. 1973. Uptake, assimilation and transport of nitrogen compounds by plants. Soil
Biol. Biochem. 5:109-l 19. · Penning de Vries, F. W. T. 1974. Substrate utilization and respiration in relation to growth
and maintenance in higher plants. Neth. J. Agric. Sci. 22:40-44. Penning de Vries, F. W. T. 1975. The cost of maintenance processes in plant cells. Ann. Bot.
39:77-92. Penning de Vries, F. W. T., A. H. M. Brunsting, and H. H. van Laar. 1974. Products,
requirements and efficiency of biological synthesis, a quantitative approach. J. Theor. Biol. 45:339-377.
Penning de Vries, F. W. T., and H. H. van Laar. 1977. Substrate utilization in germinating seeds. Pages 217-228 in J. J. Landsberg and C. V. Cutting, eds. Environmental effects on crop physiology. Academic Press, London.
Penning de Vries, F. W. T., J. M. Witlage, and D. J. Kremer. 1979. Rates of respiration and of increase in structural dry matter in young wheat, ryegrass and maize plants in relation to temperature, to water stress and to their sugar content. Ann. Bot. 44:591-609.
Purseglove, J. W. 1974. Tropical crops; dicotyledons. 3d. impression. Longman group LTD, London.
Purseglove, J. W. 1975. Tropical crops; monocotyledons. 2d. impression. Longman group LTD, London.
Sarkanen, K. V., and C. H. Ludwig. 1971. Lignins. Wiley Interscience, New York. Schapendonk, A. H. C. M., and H. Challa. 1981. Assimilate requirements for growth and
maintenance of cucumber fruits. Acta Hortic. 118:73-82. Sinclair, T. R., and C. T. de Wit. 1975. Photosynthate and nitrogen requirements for seed
production by various crops. Science 189:565-567. Solomos, T. 1977. Cyanide resistant respiration in higher plants. Ann. Rev. Plant Physiol.
28:279-297.
BIOEJ\'ERGETICS OF GROWTH OF SEEDS, FRUITS, AND STORAGE ORGANS 59
Spiertz, J. H. J. 1978. Grain production and assimilate utilization of wheat in relation to cultivar characteristics, climatic factors and nitrogen supply. Agric. Res. Rep. 881, PUDOC, Wageningen, The Netherlands.
Tammes, P.M. L., and J. van Die. 1964. Studies on phloem exudation from Yuccajlaccida Haw. Acta Bot. Neerl. 13:76-83.
Thornley. J. H. M., and J.D. Hesketh. 1972. Growth and respiration of cotton bolls. J. Applied Ecol. 9:315-517.
Van Die, J., and P.M. L. Tammes. 1975. Phloem exudation from monocotyledonous axes. · Pages Y96-222 in A. Pirson and M. H. Zimmermann, eds. Encyclopedia of plant . physiology. New Series, \' ol. I. Springer Verlag, Berlin.
Vander Maesen, L. J. G. 1972. Cicer L., a monograph of the genus, with special reference to the chickpea ( Cicer arietinum L.), its ecology and cultivation. Med. LH Wag. 72-10. H. Veenman en Zonen, Wageningen, The Netherlands.
VanderMeer, H. G. 1979. Analyses, nomenclatuuren definities in het celwand onderzoek./n Ruwe celstof ofvoedingsvezel. Nationale Raad Landbouwk. Onderzoek, Den Haag, the Netherlands.
Van Verseveld, H. W. 1979. Influence of environmental factors on the efficiency of energy conservation in Paracoccus denitrificans. PhD thesis, Free Univeristy, Amsterdam, the Netherlands.
Vos, J. 1981. Effect of temperature and nitrogen on carbon exchange rates and growth during grain filling in wheat; measurements and simulations. PhD thesis, Agricultural University, Wageningen, the Netherlands.
Wit, C. T. de. 1978. Simulation of assimilation, respiration and transpiration of crops. Sim~lation Monogr. PUDOC, Wageningen, The Netherlands.
Wetselaar, R., and G. D. Farquhar. 1980. Nitrogen losses from tops of plants. Adv. Agron. 33:263-302.
Woolhouse, H. W. 1980. The possibilities for modification of the pattern of photosynthetic assimilation of C0 2 in relation to growth and yield of crops. Pages 37-50 in Physiological aspects of crop physiology, 15th IPI colloquium, \Vageningen, the Netherlands.
Yamaguchi, J. 1978. Respiration. and grO\vth efficiency in relation to crop productivity. J. Fac. Agric. Hokkaido University (Sapporo, Japan) 59:59-129. Quantitative components of respiratory loss and growth efficiencies of etiolated red bean seedlings.
Yokoi, Y. M. Kimura, and K. Hogetsu. 1978. Quantitative relationships between growth and respiration. I. Components of respiratory loss and growth efficiencies of etiological red bean seedlings. Bot. Mag. 91 :31-41.
Ziegler, H. 1975. Nature of transported substances. Pages 59-100 in A. Pirson and M. H. Zimmermann, eds. Encyclopedia of plant physiology. New Series, Vol. 1. Springer Verlag, Berlin.