Bioenergetics and Biological Electron...
38
1 Bioenergetics and Biological Electron Transport Philip N. Bartlett School of Chemistry, University of Southampton, Southampton, SO17 1BJ, UK 1.1 INTRODUCTION Electron transfer reactions play a central role in all biologi- cal systems because they are essential to the processes by which biological cells capture and use energy. These electron transfer reactions occur in highly organised ways, in electron transport chains in which electron transfer occurs in an ordered way between specific components, and these electron transfer reactions occur at interfaces. In this chapter we will explore the principles behind the organisation and operation of these electron transfer chains from an electrochemical perspective. We will examine the guiding physical principles which govern the efficient operation of biological electron transfer. As we will see, several guiding principles emerge: the tuning of redox potentials for different components in the electron transfer chain to optimise energy efficiency, the control of distance between redox centres to control the kinetics of electron transfer and to achieve specificity, the role of an insulating lipid bilayer to separate charge and store electrochemical energy. Such a study is informative, not only because it tells us about the structure, organisation and function of biologi- cal systems, but also because we can learn useful lessons from the study of biological electron transfer systems which have evolved over millions of years which we can use to guide our design of electrochemical systems. For example, electrocatalysis of the four-electron reduction of oxygen to water at neutral pH remains a key barrier to the develop- ment of efficient polymer electrolyte membrane (PEM) fuel cells. This same reaction is an important component in the mitochondrial electron transport chain where it is achieved using non-noble metal catalytic sites. A detailed under- standing of this biological reaction may give clues to the design of new electrocatalysts for fuel cells. Similarly an understanding of the organisation, light harvesting and electron transfer reactions in the photosynthetic systems in plants and bacteria can inform our design of artificial photosynthetic systems for solar energy conversion. Closer to home, an understanding of the principles which govern efficient biological electron transfer is essential if we wish to exploit biological electron transfer components, such as oxidoreductase enzymes, NADH-dependent dehydro- genases or redox proteins, in biosensors, biofuel cells or bioelectrosynthesis. This chapter is conceived as a general introduction to biological electron transfer processes for those with little or no prior knowledge of the subject, but with a background in chemistry or electrochemistry. As such it should serve as an introduction to the more specific material to be found in the chapters which follow. At the same time I have tried to emphasise the underlying principles, as seen from an electrochemical perspective, and to bring out similarities rather than to emphasise the differences in detail between the different electron transport chains. Such an interest in the organisation and principles which guide biological electron transfer is directly relevant to current interest in integrated chemical systems [1]. Broadly this chapter is organised as follows. We begin with a very simple description of the different types of Bioelectrochemistry: Fundamentals, Experimental Techniques and Applications Edited by Philip Bartlett # 2008 John Wiley & Sons, Ltd COPYRIGHTED MATERIAL
Transcript of Bioenergetics and Biological Electron...

1
Bioenergetics and BiologicalElectron Transport
Philip N. Bartlett
School of Chemistry, University of Southampton, Southampton, SO17 1BJ, UK
1.1 INTRODUCTION
Electron transfer reactions play a central role in all biologi-cal systems because they are essential to the processes bywhich biological cells capture and use energy. Theseelectron transfer reactions occur in highly organised ways,in electron transport chains in which electron transferoccurs in an ordered way between specific components,and these electron transfer reactions occur at interfaces. Inthis chapter we will explore the principles behind theorganisation and operation of these electron transfer chainsfrom an electrochemical perspective. We will examine theguiding physical principles which govern the efficientoperation of biological electron transfer. As we will see,several guiding principles emerge: the tuning of redoxpotentials for different components in the electron transferchain to optimise energy efficiency, the control of distancebetween redox centres to control the kinetics of electrontransfer and to achieve specificity, the role of an insulatinglipid bilayer to separate charge and store electrochemicalenergy. Such a study is informative, not only because it tellsus about the structure, organisation and function of biologi-cal systems, but also because we can learn useful lessonsfrom the study of biological electron transfer systems whichhave evolved over millions of years which we can use toguide our design of electrochemical systems. For example,electrocatalysis of the four-electron reduction of oxygen towater at neutral pH remains a key barrier to the develop-ment of efficient polymer electrolyte membrane (PEM) fuelcells. This same reaction is an important component in the
mitochondrial electron transport chain where it is achievedusing non-noble metal catalytic sites. A detailed under-standing of this biological reaction may give clues to thedesign of new electrocatalysts for fuel cells. Similarly anunderstanding of the organisation, light harvesting andelectron transfer reactions in the photosynthetic systemsin plants and bacteria can inform our design of artificialphotosynthetic systems for solar energy conversion. Closerto home, an understanding of the principles which governefficient biological electron transfer is essential if we wishto exploit biological electron transfer components, such asoxidoreductase enzymes, NADH-dependent dehydro-genases or redox proteins, in biosensors, biofuel cells orbioelectrosynthesis.This chapter is conceived as a general introduction to
biological electron transfer processes for those with little orno prior knowledge of the subject, but with a background inchemistry or electrochemistry. As such it should serve as anintroduction to the more specific material to be found in thechapters which follow. At the same time I have tried toemphasise the underlying principles, as seen from anelectrochemical perspective, and to bring out similaritiesrather than to emphasise the differences in detail betweenthe different electron transport chains. Such an interest inthe organisation and principles which guide biologicalelectron transfer is directly relevant to current interest inintegrated chemical systems [1].Broadly this chapter is organised as follows. We begin
with a very simple description of the different types of
Bioelectrochemistry: Fundamentals, Experimental Techniques and Applications Edited by Philip Bartlett# 2008 John Wiley & Sons, Ltd
COPYRIG
HTED M
ATERIAL

biological cell, bacterial, plant and animal, their internalorganisation and the different structures within them. Wethen consider the structure of biological cells from anelectrochemical perspective focusing on the processes ofenergy transduction and utilisation. This is followed by amore detailed description of the electron transfer chains inthe mitochondria and in the photosynthetic membrane andthe different redox centres that make up the electrontransport chains in these systems. We then describe thegoverning principles which emerge as the importantfeatures in all of these electron transfer processes, beforeconcluding with a discussion of the way these processesare used to drive the thermodynamically uphill synthesisof adenosine triphosphate (ATP).
1.2 BIOLOGICAL CELLS
All living matter is made up of cells and these cells sharemany common features in terms of their structure and thechemical components which make up the cell. Thedifferent types of living cell, from the simplest bacteriato complex plant and mammalian cells, carry out many oftheir fundamental processes in the same way. Thus theproduction of chemical energy by conversion of glucoseto carbon dioxide is carried out in a similar way across allbiological cells. This similarity reflects the commonancestry of all living cells and the process of evolution.In this section we focus on the internal structure of the
different types of biological cell. For a more detailed
discussion of biological cells the reader is directed tomodern biochemistry or cell biology texts such as that byLodish and colleagues which provides a beautifully illus-trated account of the subject [2]. Biological cells can bedivided into two classes: eukaryotic and prokaryotic(Figure 1.1). The eukaryotes include all plants and animalsas well as many single cell organisms. The prokaryoteshave a simpler cell structure and include all bacteria;they are further divided into the eubacteria and archae-bacteria. In the prokaryotic cell there is a single plasmamembrane, a phospholipid bilayer, which separates theinside of the cell from the outer world, although in somecases there can also be simple internal photosyntheticmembranes.
In contrast, in eukaryotes the inner space within thecell is further divided into a number of additionalstructures called organelles. These are specialised struc-tures surrounded by their own plasma membranes. Thus,within the eukaryotic cell we find specialised structures,such as the nucleus, which contains the cell�s DNA andwhich directs the synthesis on RNA within the cell,peroxisomes, which metabolise hydrogen peroxide, mi-tochondria, where ATP is generated by oxidation ofsmall molecules, and, in plants, chloroplasts, wherelight is captured. It is the last two of these, the mitochon-dria and the chloroplasts which are of most interest to ushere since both are central to biological energy transduc-tion and both function electrochemically. These samefunctions of energy transduction occur in prokaryotes,
All Biological Cells
Eukaryotes
all plants (simple ferns to complex plants)
all animals (sponges, insects, mammals)
single celled organisms true algae amobae
fungimoulds
Prokaryotes All Bacteria
archaebacteria – less familiar, found in
unusual environments e.g. methanogens,
halophiles, thermacidophiles
eubacteria –the majority
blue-green algae
Figure 1.1 The general classification of biological cells.
2 Bioelectrochemistry
but in this case they are associated with the outer cellmembrane.Below we give a more detailed account of the electron
transfer processes which occur in the mitochondrion andchloroplast, but for now we concentrate on the essentialcommon features. Both processes, the oxidation of smallmolecules to generate energy in the mitochondrion andthe capture of light and its transduction into energy thatthe cell can use in the chloroplast, occur across energytransducing membranes. In both cases the final product isATP (see below), a high energy species that is usedelsewhere in the cell to drive catabolism (the synthesisof molecules within the cell) and other living processes.An essential feature of the phospholipid bilayers whichmake up the plasma membranes of the cell and thedifferent organelles within the eukaryotic cell is thatalthough they are permeable to gases such as oxygenand carbon dioxide, they are impermeable to largermolecules such as amino acids or sugars and they areimpermeable to ions such as Hþ, Kþ or Cl�. This allowsthe cell to control the composition of the solution on thetwo sides of the membrane separately, a process which isachieved by the presence of specific transmembraneproteins, or permeases, within the cell membrane, whichcontrol transport of molecules and ions across themembrane.The energy transducing membranes of eukaryotes and
prokaryotes, that is the plasma membrane of simpleprokaryotic cells such as bacteria and blue-green algae,the inner membrane of mitochondria and the thylakoidmembrane of chloroplasts in eukaryotes, share manycommon features. All of these membranes have twodistinct protein assemblies: the ATPase at which ADP isconverted to adenosine triphosphate (ATP) and the energysource electron transport chain which provides the ther-modynamic driving force to the synthesis of ATP. Thesetwo processes are linked by the directed flow of electronsand protons across the membrane in order to establish anelectrochemical potential which is used to drive ATPsynthesis. This chemiosmotic model of biological energytransduction, which is essentially an electrochemicalmodel, was first described by Mitchell in 1961 and wasrecognised by the award of the Nobel prize for chemistryin 1978 [3,4].
1.3 CHEMIOSMOSIS
The key concept in the chemiosmotic theory is that thesynthesis of ATP is linked to the energy source electrontransfer chain through the transmembrane proton motiveforce that is set up. This proton motive force is made up of
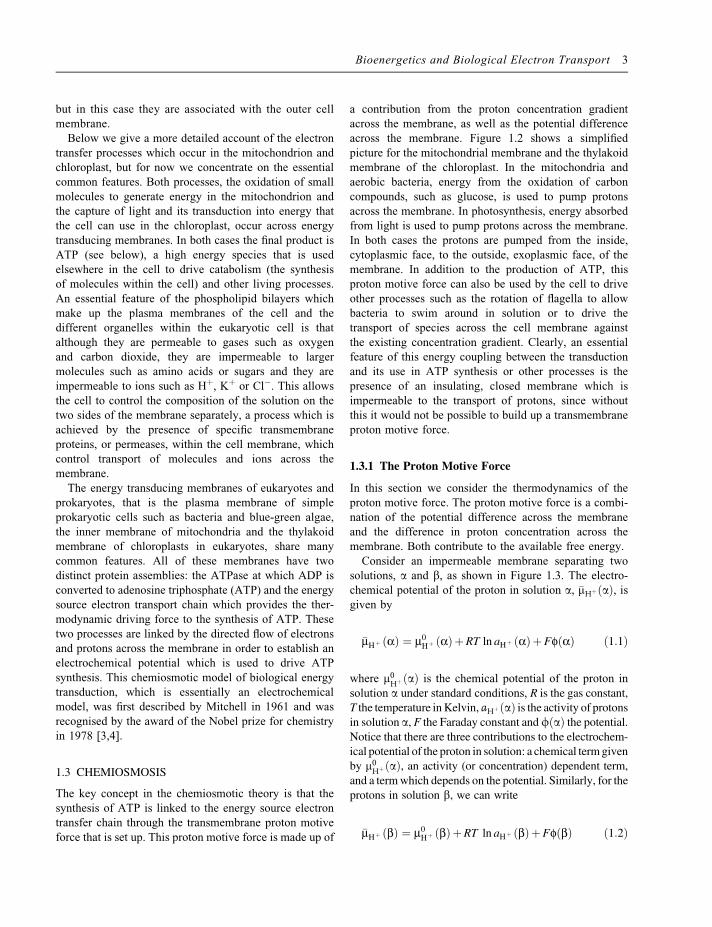
a contribution from the proton concentration gradientacross the membrane, as well as the potential differenceacross the membrane. Figure 1.2 shows a simplifiedpicture for the mitochondrial membrane and the thylakoidmembrane of the chloroplast. In the mitochondria andaerobic bacteria, energy from the oxidation of carboncompounds, such as glucose, is used to pump protonsacross the membrane. In photosynthesis, energy absorbedfrom light is used to pump protons across the membrane.In both cases the protons are pumped from the inside,cytoplasmic face, to the outside, exoplasmic face, of themembrane. In addition to the production of ATP, thisproton motive force can also be used by the cell to driveother processes such as the rotation of flagella to allowbacteria to swim around in solution or to drive thetransport of species across the cell membrane againstthe existing concentration gradient. Clearly, an essentialfeature of this energy coupling between the transductionand its use in ATP synthesis or other processes is thepresence of an insulating, closed membrane which isimpermeable to the transport of protons, since withoutthis it would not be possible to build up a transmembraneproton motive force.
1.3.1 The Proton Motive Force
In this section we consider the thermodynamics of theproton motive force. The proton motive force is a combi-nation of the potential difference across the membraneand the difference in proton concentration across themembrane. Both contribute to the available free energy.Consider an impermeable membrane separating two
solutions, a and b, as shown in Figure 1.3. The electro-chemical potential of the proton in solution a, �mHþðaÞ, isgiven by
�mHþ ðaÞ ¼ m0Hþ ðaÞþRT ln aHþ ðaÞþFfðaÞ ð1:1Þ
where m0HþðaÞ is the chemical potential of the proton insolution a under standard conditions, R is the gas constant,T the temperature inKelvin, aHþðaÞ is the activity of protonsin solution a, F the Faraday constant andfðaÞ the potential.Notice that there are three contributions to the electrochem-ical potential of the proton in solution: a chemical term givenby m0HþðaÞ, an activity (or concentration) dependent term,and a termwhich depends on the potential. Similarly, for theprotons in solution b, we can write
�mHþ ðbÞ ¼ m0Hþ ðbÞþRT ln aHþ ðbÞþFfðbÞ ð1:2Þ
Bioenergetics and Biological Electron Transport 3
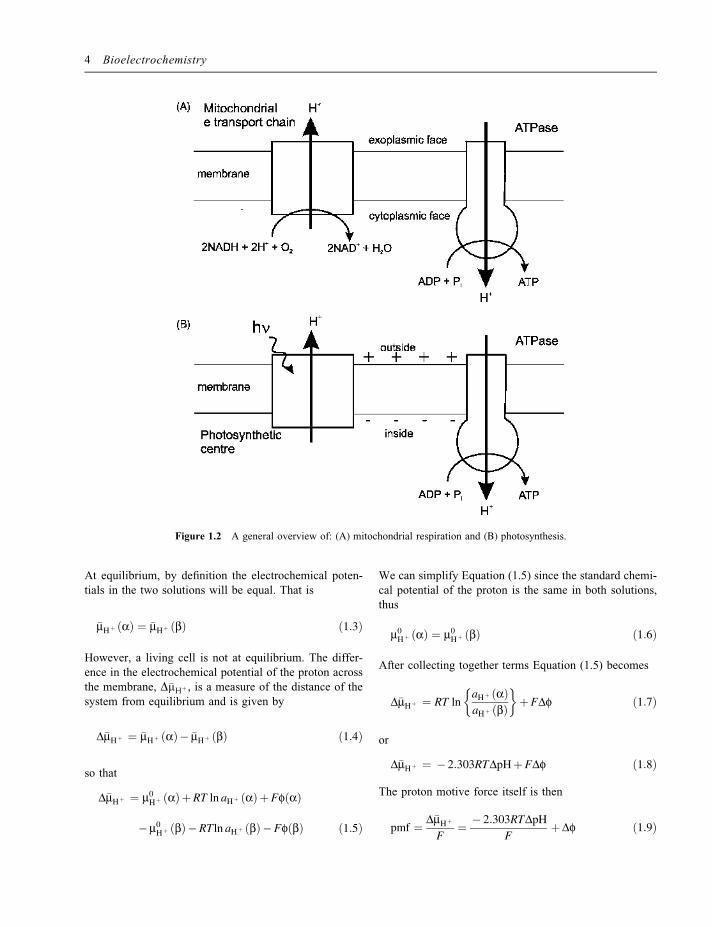
Figure 1.2 A general overview of: (A) mitochondrial respiration and (B) photosynthesis.
At equilibrium, by definition the electrochemical poten-tials in the two solutions will be equal. That is
�mHþ ðaÞ ¼ �mHþ ðbÞ ð1:3Þ
However, a living cell is not at equilibrium. The differ-ence in the electrochemical potential of the proton acrossthe membrane, D�mHþ , is a measure of the distance of thesystem from equilibrium and is given by
D�mHþ ¼ �mHþ ðaÞ� �mHþ ðbÞ ð1:4Þ
so that
D�mHþ ¼ m0Hþ ðaÞþRT ln aHþ ðaÞþFfðaÞ
�m0Hþ ðbÞ�RT ln aHþ ðbÞ�FfðbÞ ð1:5Þ
We can simplify Equation (1.5) since the standard chemi-cal potential of the proton is the same in both solutions,thus
m0Hþ ðaÞ ¼ m0
Hþ ðbÞ ð1:6Þ
After collecting together terms Equation (1.5) becomes
D�mHþ ¼ RT lnaHþ ðaÞaHþ ðbÞ
� �þFDf ð1:7Þ
or
D�mHþ ¼ � 2:303RTDpHþFDf ð1:8Þ
The proton motive force itself is then
pmf ¼ D�mHþ
F¼ � 2:303RTDpH
FþDf ð1:9Þ
4 Bioelectrochemistry

At room temperature
pmf=mV ¼ � 59� DpHþDf ð1:10Þ
Thus the proton motive force is made up of two compo-nents: the contribution from the difference in protonconcentration across the membrane, and the contributionfrom the potential difference across the membrane. Thusif the membrane is permeable to Cl� or if Hþ exchangeswith another cation (such as Kþ) the contribution from thepotential difference Df will be small but DpH can still belarge. This is the situation for the thylakoid membrane inphotosynthesis. In contrast, if themembrane is impermeableto anions,Df canmake amore significant contribution. Thisis the case in the respiring mitochondrion where the totalproton motive force of around 220mV is made up of atransmembrane potential of 160mV (with the inside of themitochondrion at a negative potential with respect to theoutside – the protons are pumped from inside to out)together with a 60mV contribution from the one unit pHdifference across the membrane.
1.3.2 The Synthesis of ATP
The second part of the story is the synthesis of ATP fromADP and inorganic phosphate and we now turn ourattention to the thermodynamics of this process. Adeno-sine triphosphate, ATP (Figure 1.4), is found in all typesof living organism and is the universal mode of transfer-
ring energy around the cell in order to drive all theendergonic (DGrxn> 0) reactions necessary for life. Theseinclude the synthesis of cellular macromolecules, such asDNA, RNA, proteins and polysaccharides, the synthesis ofcellular constituents, such as phospholipids andmetabolites,and cellular motion including muscle contraction. In hu-mans it is estimated that on average 40 kg of ATP are usedevery day corresponding to 1000 turnovers between ADP,ATP and back to ADP for every molecule of ADP in thebody each day [5]. In ATP the energy is stored in high-energy phosphoanhydride bonds and hydrolysis of thesebonds to produceADPorAMP (adenosinemonophosphate)releases this energy
ATP4� þH2O!ADP3� þHþ þHPO42� ð1:11Þ
or
ATP4� þH2O!AMP2� þHþ þHP2O73� ð1:12Þ
where HPO42� is inorganic phosphate and HP2O7
3� isinorganic pyrophosphate. In the case of Reaction (1.12),the inorganic pyrophosphate produced is hydrolysed toinorganic phosphate by the enzyme pyrophosphatase.Both reactions, (1.11) and (1.12), have a free energychange of �30.5 kJmol�1 in the standard state at pH 7.When we take account of the actual concentrations of thedifferent species (2.5mM for ATP, 0.25mM for ADP and
N
NN
N
NH2
O
OHOH
HHH
CH2
H
OPO
O
O
P
O
O
O
N
NN
N
NH2
O
OHOH
HHH
CH2
H
OPO
O
O
P
O
O
OP
O
O
O
Adenosine Diphosphate (ADP)
Adenosine Triphosphate (ATP)
Figure 1.4 The structures of adenosine diphosphate (ADP) andadenosine triphosphate (ATP).
(α) (β)
H+ H+
∆φ
Figure 1.3 Scheme for a transmembrane potential.
Bioenergetics and Biological Electron Transport 5

2.0mM for HPO42�) this gives a value of about �52 kJ
mol�1 in the living cell [6]. If we assume a transmem-brane proton motive force of, say, 200mV this corre-sponds to a free energy change for each proton translo-cated across the membrane of �19.3 kJmol�1. Thus it isnecessary to transfer at least two protons across themembrane for each ATP molecule synthesised.
1.4 ELECTRON TRANSPORT CHAINS
We now turn our attention in more detail onto the electrontransport chains in mitochondria, in the chloroplast and inbacteria and focus on the processes occurring in theseelectron transport chains. As we have seen, electrontransport in these systems is central to the process ofenergy generation in living systems. We can thereforeexpect these systems to have evolved to operate efficient-ly and it is of interest to study the way that they operateand the underlying principles involved. We begin byconsidering the mitochondrial electron transport chain.
1.4.1 The Mitochondrion
The main source of energy in non-photosynthetic cells isglucose. The standard free energy for the completeoxidation of glucose to carbon dioxide and water is�2870 kJmol�1 and in the cell this is coupled to thesynthesis of up to 32 moles of ATP for every mole ofglucose oxidised. In eukaryotic cells, the first stages ofthis process occur in the cytosol, the solution contained bythe outer cell membrane, where two moles of ATP aregenerated by the conversion of glucose to two moleculesof pyruvate in a process called glycolysis (Figure 1.5). Inaddition to two molecules of ATP, the process generatestwo molecules of NADH. The pyruvate generated in thecytosol is transported to the mitochondria where up to 30further ATP molecules are generated by the completeoxidation of the pyruvate to carbon dioxide. In addition,the two molecules of NADH formed in glycolysis reducetwo molecules of NADþ within the mitochondrion, whichare then oxidised back to NADþ by oxygen as part of themitochondrial electron transport chain. Thus the mito-chondrion is the central power plant, or more precisely thecentral fuel cell, which powers the eukaryotic cell, andthese cells generally contain hundreds of mitochondria [7].In humans, for example, it has been calculated that at restthe typical transmembrane current, summed over all themitochondria, amounts to just over 500A (assuming apower consumption of 116W and a transmembrane poten-tial of 0.2V) [8]. Given the central role of mitochondria inenergy production, it is not surprising that mitochondrial
defects are implicated with a wide range of degenerativediseases [7]. It is also worth noting that mitochondriaare also essential in the photosynthetic cells of plants forthe production of ATP during dark periods and for thegeneration of ATP in all non-photosynthetic plant cells(such as root cells).
The mitochondrion is around 1 or 2 microns in lengthand 0.1 to 0.5 microns in diameter and is therefore one ofthe larger organelles in the eukaryotic cell. The mitochon-drion, Figure 1.6, contains two separate membranes [9].The outer membrane is made up of about 50% lipid and50% of proteins called porins, which allow moleculeswith molecular weight up to 10 000Da to pass through.The inner membrane is much less porous and is about20% lipid and 80% protein. The inner membrane has alarge number of invaginations, called cristae, whichincrease the surface area of the membrane and it is acrossthis inner membrane that electron and proton transportoccur in the mitochondrial electron transport chain. The
O
H
HO
H
HO
H
HOHH OH
OH
Glucose
multiple stepsand intermediates
O
O
O
Pyruvate(2 molecules)
O
O
O
+2NADH +2ATP4-
+2NAD + +2ADP 3- +2HPO42-
Figure 1.5 The overall reaction for glycolysis.
Figure 1.6 The structure of the mitochondrion.
6 Bioelectrochemistry
solution inside the mitochondrion has a high proteincontent, around 50% by weight, and therefore is quiteviscous.Broadly, three processes occur within the mitochondria.
First, the oxidation of pyruvate to carbon dioxide with thegeneration of NADH and FADH2 through the citric acidcycle (Figure 1.7). Second, the oxidation of NADH andFADH2, by molecular oxygen in the mitochondrial elec-tron transport chain, to generate a proton motive forceacross the inner mitochondrial membrane. Third, thegeneration of ATP from ADP by F0F1 ATPase, drivenby the proton motive force across the inner membrane.This ATP is then exported from the mitochondrion todrive processes in other parts of the eukaryotic cell. In thischapter we will concentrate on the last two of theseprocesses since they are essentially electrochemical, rath-er than chemical, in their nature. Here we examine themitochondrial electron transport chain, a description ofthe F0F1 ATPase is given in a later section.Overall, the oxidation of one molecule of glucose
produces 10 molecules of NADH and two molecules ofFADH2. This process is reasonably efficient and incursonly about a 10% energy loss from that originallyavailable in the glucose. In the electron transport chain,the reduced coenzymes are reoxidised in several distinctsteps by molecular oxygen rather than in a single step – byusing the electron transfer chain, the energy is released ina number of small, and therefore thermodynamically moreefficient, steps. Overall, the oxidations of NADH andFADH2 are strongly exergonic (DGrxn< 0) processes
NADHþHþ þ 1=2O2 !NADþ þH2O
DG ¼ � 220 kJ mol� 1ð1:13Þ
FADH2 þ 1=2O2 !FADþH2O
DG ¼ � 182 kJ mol� 1
ð1:14ÞSince the conversion of ADP to ATP requires 30.5 kJmol�1, the oxidation of one molecule of NADH orFADH2 is sufficiently exergonic to generate more thatone molecule of ATP.
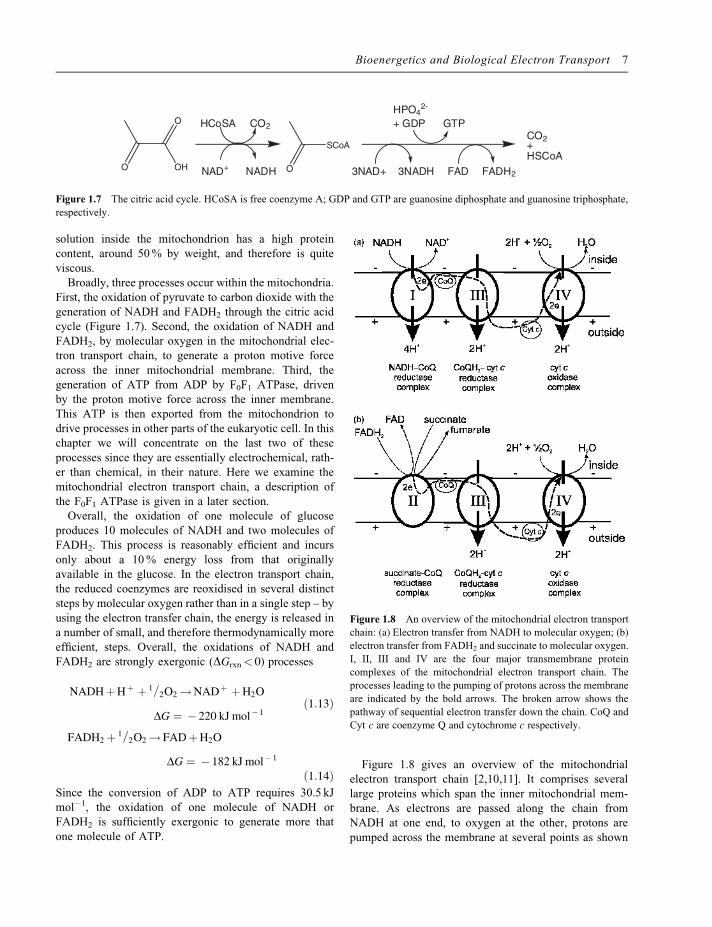
Figure 1.8 gives an overview of the mitochondrialelectron transport chain [2,10,11]. It comprises severallarge proteins which span the inner mitochondrial mem-brane. As electrons are passed along the chain fromNADH at one end, to oxygen at the other, protons arepumped across the membrane at several points as shown
O
OHO O
SCoACO2
HCoSA CO2
NAD+ NADH 3NAD+ 3NADH FAD FADH2
HPO42-
+ GDP GTP
+HSCoA
Figure 1.7 The citric acid cycle. HCoSA is free coenzyme A; GDP and GTP are guanosine diphosphate and guanosine triphosphate,
respectively.
Figure 1.8 An overview of the mitochondrial electron transport
chain: (a) Electron transfer from NADH to molecular oxygen; (b)electron transfer from FADH2 and succinate to molecular oxygen.
I, II, III and IV are the four major transmembrane protein
complexes of the mitochondrial electron transport chain. The
processes leading to the pumping of protons across the membrane
are indicated by the bold arrows. The broken arrow shows the
pathway of sequential electron transfer down the chain. CoQ and
Cyt c are coenzyme Q and cytochrome c respectively.
Bioenergetics and Biological Electron Transport 7

in the figure. Oxidation of NADH occurs at the NADH-CoQ reductase complex (complex I in Figure 1.8a). Thisprocess is accompanied by the transfer of four protonsacross the membrane and the electrons from the NADHare passed to a molecule of coenzyme Q, CoQ, a hydro-phobic quinone, which takes the electrons from theNADH-CoQ reductase complex and passes them to theCoQH2–cyt c reductase complex (complex III inFigure 1.8).Note that the structures of the individual redox centres in thedifferent parts of electron transport chains are discussed indetail later in this chapter – for now we concentrate on thelarger functional picture rather than the molecular detail.The reduced coenzyme Q passes the electrons to theCoQH2–cyt c reductase complex, where a further pair ofprotons are pumped across the membrane and the electronsare passed to twomolecules of cytochrome c, cyt c, a solubleelectron transfer protein. The cytochrome c passes theelectrons to the cyt c oxidase complex (complex IV inFigure 1.8) where a further two protons are pumped acrossthe membrane and the electrons end up on oxygen, produc-ing water. The electrons from FADH2 are fed into theelectron transfer chain in a similar way (Figure 1.8b).FADH2 is oxidised to FAD by the succinate–CoQ reductasecomplex (complex II in Figure 1.8b), with the generation ofone molecule of reduced coenzyme Q. No protons arepumped across the membrane by this reaction. The reducedcoenzyme Q produced from FADH2 joins that from NADHin passing its electrons to the CoQH2–cyt c reductasecomplex and thence to the cyt c oxidase complex andultimately to molecular oxygen (Figure 1.8b). The succi-nate-CoQ reductase complex (complex II in Figure 1.8b)also catalyses the oxidation of succinate, produced by the
citric acid cycle within the mitochondrion, to fumarate, withthe generation of one molecule of reduced coenzyme Qwhich participates in the electron transport chain.The four protein complexes, I to IV in Figure 1.8, are large
multiunit proteins each containing several redox prostheticgroups (Table 1.1) and within the individual protein com-plexes, the redox prosthetic groups are carefully arranged inthree dimensions so that the electrons are passed in anordered fashion from one redox component to the next.Much progress has been made in the last few years indetermining the structures of these large, membrane-boundproteins and the details of their operation. In the followingsections we discuss electron transfer in each of the com-plexes in turn.
1.4.2 The NADH–CoQ Reductase Complex
The NADH–CoQ reductase complex, or complex I, isfound in the mitochondria of eukaryotes and in the plasmamembranes of purple photosynthetic bacteria and respira-tory bacteria. The complex (Figure 1.9a) has an L-shapewith two major sub-units, one predominantly within themembrane and the other protruding into the inner mito-chondrial space containing the NADH reaction site[12–15]. The NADH–CoQ reductase complex is themost complex and largest of the proton pumping enzymesin the mitochondrion and is made up of about 30 separatesub-units; it is also, because of this complexity, the leastwell understood. The NADH reacts with a flavin mononu-cleotide (FMN) prosthetic group. From here the electronsare passed to several (eight or nine) iron–sulfur centres.
Table 1.1 The four protein complexes of the mitochondrial electron transport chain.
Complex RMM/kDa Redox centres Comments Ref
I NADH–CoQreductase
>900 FMN transmembrane, pumps Hþ,43–46 subunits
[12–15]
8 or 9 Fe-S2 quinones
II Succinate–CoQreductase
120 FAD membrane bound, does not pump Hþ,4 subunits
[11,22–24]
3 Fe-S1 Heme b
III CoQH2–cyt creductase
240 2 Heme b transmembrane, pumps Hþ, 11 subunits,exits in membrane as functional dimmer
[28,31]
1 Heme c1 Fe-S
IV Cyt c oxidase 204 2 Heme a transmembrane, pumps Hþ, 13 subunits [37–39]2 Cu
8 Bioelectrochemistry

A recent study by Hinchliffe and Sazanov [16] has found achain of eight iron–sulphur clusters in the hydrophilicdomain of the complex with edge-to-edge spacings ofless than 1.4 nm with the ninth iron–sulfur cluster some-what further away (Figure 1.9b). The eight iron–sulfurclusters form an electron transport chain 8.4 nm long,which is believed to connect the two catalytic sites of theenzyme. Reduction of coenzyme Q occurs at the part of theprotein complex which is within the membrane. Overallthe reaction of one molecule of NADH generates onemolecule of reduced coenzyme Q and, it is suggested,pumps four protons across the membrane
NADHþCoQþ 5Hþinside !NADþ þCoQH2 þ 4Hþ
outside
ð1:15Þ
Here the subscripts �inside� and �outside� refer to thelocation of the proton with respect to the inner mitochon-drial membrane. At present there is not a crystal structurefor the NADH–CoQ reductase complex and the precisepathway of electron transfer within the complex andthe mechanism and stoichiometry of proton transport arecurrently not well established, although a crystal structureof the hydrophilic domain of complex I from Thermusthermoplilus has recently been obtained [17]. For furtherdetails of the NADH–CoQ reductase complex, readers aredirected to several recent reviews [13,18–21].
1.4.3 The Succinate–CoQ Reductase Complex
The succinate–CoQ reductase complex, also referred to ascomplex II, spans the mitochondrial membrane, but doesnot pump protons across it – the free energy released bythe reaction of succinate with coenzyme Q is insufficientto drive the transfer of a proton across the membrane [11].The complex comprises two hydrophilic sub-units andone or two hydrophobic sub-units, which are associatedwith the membrane [22–24]. Succinate reacts at a flavin,FAD, prosthetic group in one of the hydrophilic sub-units,of the complex located on the inside of the membrane.From here the electrons are passed one at a time toiron–sulfur centres and thus to the coenzyme Q reductionsite (Figure 1.10). Succinate–CoQ reductase complexesfrom some species also contain cytochrome b560 redoxsites [22,23,25].
1.4.4 The CoQH2–Cyt c Reductase Complex
The CoQH2-cyt c reductase complex, also referred to as thecytochrome bc1 complex or complex III, is a homodimerictransmembrane protein complex that takes electrons fromthe reduced coenzyme Q, produced by the NADH–CoQreductase and succinate–CoQ reductase complexes, andpasses the electrons to cytochrome c, a water soluble 13 kDaelectron transfer protein through the so-called Q cycle[26,27]. In doing so it pumps two protons across the mem-brane and releases another two from the reduced quinone
CoQH2 þ 2cyt cðFe3þ Þþ 2Hþinside
!CoQþ 2cyt cðFe2þ Þþ 4Hþoutside
ð1:16Þ
Figure 1.11 summarises the scheme. In the complex thereare three catalytic sub-units which contain two cytochromeb redox centres (b-type hemes), a cytochrome c1 redoxcentre and a two iron two sulfur, Fe2S2, centre, respectively.
Figure 1.9 (a)Schematic of the NADH–CoQ reductase complex
(complex I) showing the organisation of the redox sites. N-1, N-2,
N-3 and N-4 are iron sulfur clusters, Qi is an internal quinone,
FMN is flavin mononucleotide and CoQ is coenzyme Q. The full
arrows show the direction of electron transfer and the broken
arrows the direction of proton transfer (based on Hofhaus
et al. [14]). (b) The arrangement of the electron transfer chain
in the hydrophilic (peripheral) arm of the complex (based on
Hinchcliffe and Sazanov [16]. N1a and N1b are two iron two
sulfur clusters; N2, N3, N4, N5, N6a/b, N6b/a and N7 are four iron
four sulfur clusters. The suggested electron transport pathway is
shown by the arrows.
Bioenergetics and Biological Electron Transport 9

The reduced coenzyme Q, CoQH2, is oxidised in two stepswith one electron being transferred to a high potential redoxchain to give the semiquinone, CoQ�, which then gives up asecond electron to a separate low-potential redox chain inwhat appears to be a concerted electron transfer, since nointermediate semiquinone can be detected. In the first elec-tron transfer the electron is transferred to the Fe2S2 clusterand then to the cytochrome c1 from where it is transferred tothe soluble cytochrome c electron transfer protein. This isreferred to as the high-potential redox pathway, because theredox potentials of the Fe2S2 cluster and the cytochrome c1redox centres are significantly more positive (�300mVvs NHE) than those of the cytochrome b centres in the otherpathway (�50 and�70mVvsNHE). The second electron istransferred from the semiquinone, CoQ�, to one cytochromeb and then on to a second cytochrome b, at a site within theprotein complex on the other side of the membrane, wherecoenzyme Q is reduced in two steps to CoQH2, the fullyreduced form. This makes up the Q cycle and leads topumping of protons across the membrane. Crystallographicstudies by Zhang et al. [28] suggest that a significantconformational change in the protein is associated with thisdirection of the electrons from the reduced coenzymeQ [27].In one conformation the Fe2S2 cluster is close enough to thecoenzymeQbinding site to pick up an electron. In the secondconformation the Fe2S2 cluster swings away from the coen-zyme Q binding site, moving through about 1.6 nm, andapproaches close enough to the cytochrome c2 heme to allowelectron transfer. At the same time the Fe2S2 cluster is too farfrom the coenzyme Q binding site to collect the secondelectron, which is therefore passed to the heme of thecytochrome b. For a discussion of possible short circuitsbetween these two pathways in the Q cycle see Osyczkaet al. [29,30].
The crystal structures of CoQH2–cyt c reductase com-plexes from several organisms have been solved at highresolution [28,31], so that we know quite a lot about therelative organisation and distances between the redoxgroups within the protein.
1.4.5 The Cyt c Oxidase Complex
The cyt c oxidase complex, or complex IV, is the terminusfor the mitochondrial electron transport and the site for thereduction of molecular oxygen to water [32–36]. The mito-chondrial complex has 13 sub-units, two of which havecatalytic functions, while the others are involved in thebinding of the active sub-units and a lipidmolecule [37–39].The first of the catalytic sub-units contains an unusual Cucentrewith twoCu atoms,which is thought to be the reactionsite for the cytochrome c. The second of the catalytic
Figure 1.10 A schematic of the succinate–CoQ reductase
complex (complex II) showing the organisation of the redox
sites. The arrows show the direction of electron transfer. FeS are
iron–sulfur clusters, FAD is flavin dinucleotide, cyt b560 iscytochrome b560 and CoQ is coenzyme Q (based on H€agerh€alland Hederstedt [23]).
Figure 1.11 A schematic of the CoQH2–cyt c reductase complex(complex III) showing the organisation of the redox sites. Thearrows show the direction of electron and proton transfer. Qo and Qi
represent the coenzyme Q, CoQ, reaction sites on the outside andinside of the membrane respectively, cyt c1, cyt bL and cyt bH arethree cytochrome centres with bL and bH being the low and highpotential cytochrome b centres respectively, Fe2S2 is a two iron, twosulfur cluster. The overall complex is a homodimer, the electron andproton transfer chains are only shown for one half for clarity.
10 Bioelectrochemistry

sub-units contains two type-a heme centres; one of theseaccepts electrons from the first sub-unit. The second type-aheme forms part of a binuclear centre with a Cu centre. Thisbinuclear Cu/heme-a centre is the site for oxygen reduction(Figure 1.12). Transfer of electrons from the reduced cyto-chrome c, produced by theCoQH2–cyt c reductase complex,through the Cyt c oxidase complex to molecular oxygen,leads to the transfer of a further two protons across the innermitochondrial membrane for every pair of electrons trans-ferred
2 cyt cðFe2þ Þþ 4Hþinside þ 1=2 O2
! 2 cyt cðFe3þ ÞþH2Oþ 2Hþoutside ð1:17Þ
The precise molecular mechanism by which the protonsare pumped across the membrane has been investigatedby Fax�en et al. [40].From an electrochemical perspective, the detailed
mechanism of the reduction of molecular oxygen towater by the cyt c oxidase complex is of particular interest,since the design of efficient catalysts for four electronreduction of oxygen at neutral pH remains a very significantimpediment to the development of PEM fuel cells. Atpresent, although crystal structures have been obtained forcyt c oxidase complexes, the resolution is not sufficient to
fully define the geometry of the oxygen binding site.Furthermore the X-ray structures show only a snapshot ofthe structure and cannot reveal the dynamics of proteinmovement during the catalytic cycle. Twomechanisms havebeen proposed to describe oxygen reduction by thebinuclear Cu/heme-a site. As shown in Figure 1.13, Michelet al. [35] suggest that the oxygen binds to the heme iron (A)and then forms a peroxy intermediate (PM), by transfer of anelectron from the Cu, followed by the addition of a secondelectron and two protons to produce an oxoferryl state (F).Further addition of a proton and electron gives a hydroxystate (H). Protonation and two further electron transfersreturn the system to the starting, doubly reduced state (R).Michel et al. also suggest that there could be an alternativeroute if one assumes that the O¼O bond is broken at anearlier stage. In this case there are several possibilities for theintermediate species, as shown in the box in Figure 1.13,depending on where the additional electron is taken from. Incontrast,Wikstr€om [41] has proposed a differentmechanismin which the two peroxy intermediates, PR and PM, corre-spond to ferryl, Fe(IV), specieswhere the additional electronis provided by a nearby tyrosine (YOH) (Figure 1.14). Inboth cases the close proximity of the heme iron and the Cu,
Figure 1.12 A schematic of the cyt c oxidase complex (complexIV) showing the organisation of the redox sites. Hemes a and a3 arethe two heme centres associated with the copper b site, Cub
2þ;Cua
2þ are the two copper a centres (based on Fax�en et al. [40]).
Figure 1.13 The mechanism for oxygen reduction in the cyt coxidase complex proposed by Michel et al. [35]. O is the oxidisedform, E the one-electron reduced form, R the two-electron reducedform, and A the product formed on oxygen binding. PM and PR areperoxy intermediates, alternative structures are given in the box onthe right assuming that the O�O bond is already broken in thesestates; the missing electron could be provided by a porphyrin ring(Por�þ), an amino acid residue (res�þ), a copper b site (Cu3þ), or theheme a3-Fe (Fe
5þ). F is the oxyferryl state and H the hydroxyl stateformed after protonation of the iron-bound oxygen.
Bioenergetics and Biological Electron Transport 11

they are within 0.52 nm of each other, is important for thecatalysis.
1.4.6 Electron Transport Chains in Bacteria
In comparison to mitochondria, bacteria tend to containredundant electron transport systems [42]. As a result,bacteria can grow under a variety of conditions and canswitch between different branches of their electron trans-port chains depending upon the conditions. Bacteriautilize a range of electron donors in energy generation,together with either oxygen as the ultimate electronacceptor, in aerobic respiration, or other species such asNO3
� or SO42�, in anaerobic respiration, although in
these cases less energy is generated. The electron trans-port chains in bacteria are very similar to those in themitochondrion and the principles are the same [43],although the polypeptide composition of the electrontransport proteins in bacteria is usually simpler thanthose in mitochondria and the proteins involved arelocated in the cell membrane itself (prokaryotes do notcontain separate mitochondria). Sequential electron trans-fers between different components in the electron trans-port chain leads to the pumping of protons across themembrane. This establishes a proton motive force whichthe cell uses to synthesise ATP from ADP. In addition, thedifferent protein complexes and prosthetic redox centresare closely related to those of the mitochondrion, although
there are differences in the detailed structures. In fact, thisis not surprising since it is now accepted that the mito-chondria found in eukaryotes arose more than 1 billionyears ago when an energetically inefficient eukaryotic cellwas invaded by a more energy efficient bacterium, aprocess called endosymbiosis. Subsequent transfer ofmuch of this bacterial genetic information to the nucleusof the eukaryotic cell led to the invading symbioticbacterium being transformed into the structure we knowtoday as the mitochondrion [44]. As a consequence,mitochondrial DNA (mtDNA) which codes for the fourrespiratory complexes (I to IV) and the ATP synthasefound in the mitochondrial membrane, is distinct from therest of the DNA of the organism, uses a different DNAcode, and is strictly maternally inherited [7,44].
As an illustration, Figure 1.15 shows the respiratorychain of marine Vibrio [45]. Notice, in this case, that thereare three main complexes, an NADH–quinone reductase, aquinol oxidase, and an NADH–quinone reductase. Theseare linked together by quinones. In this case, the organismpumps both Hþ and Naþ across the membrane to generateboth a proton motive force and a transmembrane differencein the electrochemical potential of Naþ.
Escherichia coli is able to assemble specific respiratorychains by the synthesis of the necessary dehydrogenase andreductase enzymes in response to the conditions in which itfinds itself. As an example, Figure 1.16 shows an electrontransport chain for Escherichia coli during anaerobic respi-ration [46,47]. In this case, nitrate replaces oxygen as theultimate electron acceptor.
1.4.7 Electron Transfer in Photosynthesis
A very similar situation pertains in photosynthesis as inthe mitochondrial electron transport chain, except that thistime the energy is provided by light rather than by
Figure 1.15 The respiratory electron transport chain of marine
Vibrio based on thework ofUnemoto [45]. Q is ubiquinone, FNM isflavin mononucleotide and FAD is flavin dinucleotide.
Figure 1.14 The mechanism for oxygen reduction in the cyt coxidase complex proposed by Wikstr€om [41]. The boxes representthe binuclear centrewith the nearby tyrosine residue (YOH).O is theoxidised form, R the two-electron reduced form, A the productformed on oxygen binding and PM and PR are peroxy intermediates.
12 Bioelectrochemistry

glucose. However, the molecular organisation and thestructures of many of the components involved are verysimilar, and the governing principle, that sequential elec-tron transfers lead to the generation of a proton motiveforce across the energy transducing membrane by pump-ing protons across the membrane, remains the same. Inthis section we will look at the photosynthetic electrontransport chain found both in plants and bacteria. Again,as in respiration, the proton motive force set up by thephotosynthetic membrane is used to drive the formationof ATP from ADP.In plants, photosynthesis occurs in the chloroplasts.
These are large organelles found mainly in the leaf cellsof the plant. The principle products of the photosyntheticmetabolism of carbon dioxide are C6 sugars in the form ofsucrose and starch. The sucrose is water soluble and istransported from the chloroplast to other parts of the plantto provide energy for metabolism. The starch is storedwithin the leaf.The chloroplast (Figure 1.17) has three membranes.
The outermost membrane of the chloroplast, as with themitochondrion, contains a large number of porin proteins,which make it readily permeable to low molecular weightspecies, such as sucrose. Inside this, the second membraneis the primary permeability barrier of the chloroplast andcontains various permeases, proteins which control in-gress and egress of species from the chloroplast interior.Unlike the mitochondrion, the energy transducing mem-brane of the chloroplast, called the thylakoid membrane,is separate from the inner membrane of the organelle. Thethylakoid membrane is where the chlorophyll is locatedand is the site of energy conversion. Again, note that asfor the mitochondrion, the thylakoid membrane totallyencloses a volume of solution, called the lumen, within
the chloroplast, so that a proton motive force can begenerated across the membrane during photosynthesis.Within the chloroplast these thylakoid membranes fre-quently form flattened, pancake-like structures, calledgrana, which then form into stacks.The thylakoid membrane in algae and higher plants
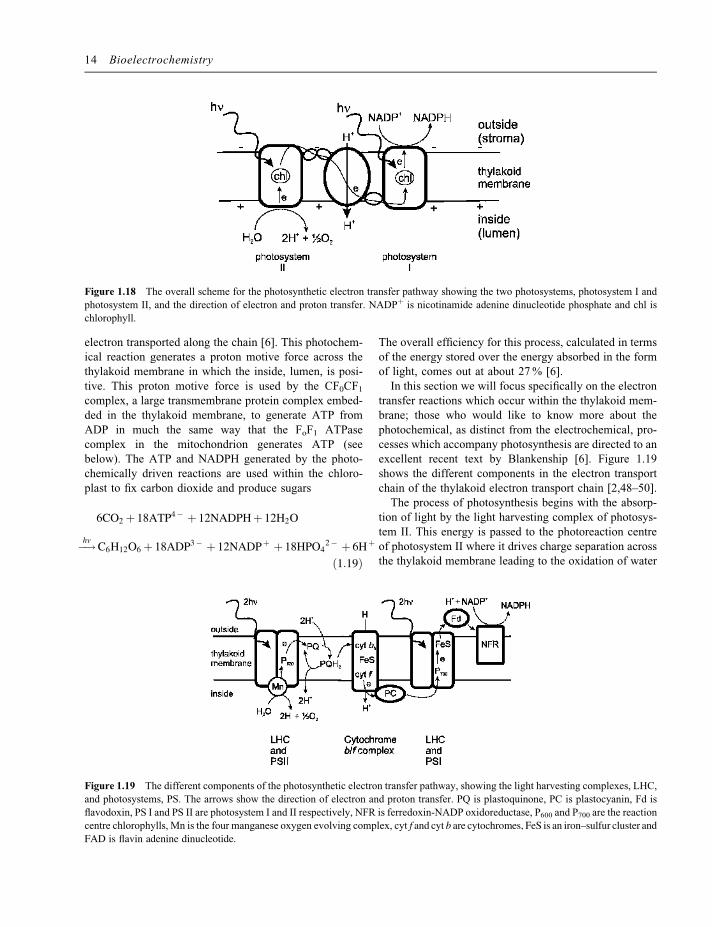
contains two photosystems referred to as photosystem Iand photosystem II or PS I and PS II. Both photosystemscontain chlorophyll and under irradiation, the absorptionof light within the photosystem leads to charge separationacross the thylakoid membrane, with positive chargebeing drive to the lumen side of the membrane andnegative charge to the stroma side of the membrane.The stroma side is the side of the thylakoid membranewhich is on the outside – that is the solution containedwithin the chloroplast. Photochemically driven chargeseparation in photosystems I and II is coupled togetherby a quinone cycle and a cytochrome bf complex(Figure 1.18). Overall the photochemically drivenreaction is
2H2Oþ 2NADPþ þ 2Hþoutside�!
hvO2 þ 2NADPHþ 4Hþ
inside
ð1:18Þ
where electrons are transferred from water to NADPþ.This reaction is essentially the reverse of the reaction ofrespiration in the mitochondrion (NADPH is closelyrelated in structure to NADH, see below). The measuredvalues for the quantum requirement (that is the number ofphotons required for each molecule of oxygen produced)in intact leaves, under ideal conditions, are typically nineor ten, close to the theoretical value of eight with onephoton absorbed by each of the two photosystems for each
Figure 1.16 The electron transport chain for Escherichia coliduring anaerobic respiration (based on Smith and Wood [70], Dymet al. [47] and Bertero et al. [46]). FAD is flavin, FeS are iron–sulfurclusters, Q is menaquinone, cyt b is a b-type cytochrome and Mo ismolybdopterin-guanosine-dinucleotide.
Figure 1.17 The structure of the chloroplast.
Bioenergetics and Biological Electron Transport 13
electron transported along the chain [6]. This photochem-ical reaction generates a proton motive force across thethylakoid membrane in which the inside, lumen, is posi-tive. This proton motive force is used by the CF0CF1complex, a large transmembrane protein complex embed-ded in the thylakoid membrane, to generate ATP fromADP in much the same way that the FoF1 ATPasecomplex in the mitochondrion generates ATP (seebelow). The ATP and NADPH generated by the photo-chemically driven reactions are used within the chloro-plast to fix carbon dioxide and produce sugars
6CO2 þ 18ATP4� þ 12NADPHþ 12H2O
�!hv C6H12O6 þ 18ADP3� þ 12NADPþ þ 18HPO42� þ 6Hþ
ð1:19Þ
The overall efficiency for this process, calculated in termsof the energy stored over the energy absorbed in the formof light, comes out at about 27% [6].In this section we will focus specifically on the electron
transfer reactions which occur within the thylakoid mem-brane; those who would like to know more about thephotochemical, as distinct from the electrochemical, pro-cesses which accompany photosynthesis are directed to anexcellent recent text by Blankenship [6]. Figure 1.19shows the different components in the electron transportchain of the thylakoid electron transport chain [2,48–50].The process of photosynthesis begins with the absorp-
tion of light by the light harvesting complex of photosys-tem II. This energy is passed to the photoreaction centreof photosystem II where it drives charge separation acrossthe thylakoid membrane leading to the oxidation of water
Figure 1.18 The overall scheme for the photosynthetic electron transfer pathway showing the two photosystems, photosystem I and
photosystem II, and the direction of electron and proton transfer. NADPþ is nicotinamide adenine dinucleotide phosphate and chl is
chlorophyll.
Figure 1.19 The different components of the photosynthetic electron transfer pathway, showing the light harvesting complexes, LHC,
and photosystems, PS. The arrows show the direction of electron and proton transfer. PQ is plastoquinone, PC is plastocyanin, Fd is
flavodoxin, PS I and PS II are photosystem I and II respectively, NFR is ferredoxin-NADP oxidoreductase, P600 and P700 are the reaction
centre chlorophylls, Mn is the four manganese oxygen evolving complex, cyt f and cyt b are cytochromes, FeS is an iron–sulfur cluster andFAD is flavin adenine dinucleotide.
14 Bioelectrochemistry
to molecular oxygen, the generation of a reduced mole-cule of ubiquinone (the equivalent of coenzyme Q inthe plant system) and the translocation of protons acrossthe membrane. The reduced ubiquinone (QH2) passes theelectrons to the cytochrome bf complex and hence toplastocyanin, a water-soluble electron transfer protein witha single Cuþ/2þ redox site. At the same time protons arepumped across the membrane. From plastocyanin the elec-trons are passed to photosystem I, where further absorptionof light drives electron transfer across themembrane and thereduction of NADPþ to NADPH.Photosystems I and II both have light-harvesting com-
plexes associated with them, but the two are structurallydifferent and are located in different parts of the thylakoidmembrane. Photosystem II and its associated light-har-vesting complex is located mainly in the stacked granamembranes, whereas photosystem I and the CF0CF1complex are located in the parts of the membrane, thestroma, which link together the grana. The cytochrome bfcomplex is found in both grana and stromamembranes [51].Since the photosystems are located in physically separateparts of the thylakoid membrane, relatively long range (tensof nm) diffusive transport of electrons by the plastoquinoneassociated with the membrane and the plastocyanin in thelumen play an important part in the overall process.Comparing the overall picture shown in Figure 1.19 for
photosynthesis with that for the mitochondrial electrontransport chain, Figure 1.8, reveals some significantsimilarities. Thus, quinone redox species, either coen-zyme Q or plastoquinone, play an important role in protontransfer across the membrane; water soluble one-electrontransfer proteins, either cytochrome c or plastocyanin, areused to couple together electron transfer between largetransmembrane proteins, and, as we shall see below whenwe consider the components of the photosynthetic electrontransport chain in more detail, there are striking similaritiesbetween the CoQH2–cyt c reductase complex in mitochon-dria and the cytochrome bf complex in photosynthesis.These significant similarities in the operation of the twomajor energy transducing systems in biology strongly sug-gest a common evolutionary origin.
1.4.8 Photosystem II
Photosystem II is a multisub-unit protein complex whichis found embedded in the thylakoid membranes of higherplants as well as algae and cyanobacteria [52,53]. Associ-ated with photosystem II there is a light-harvestingcomplex, which contains an array of chlorophyll a,chlorophyll b and carotenoid pigments (Figure 1.20)[54–56]. The role of the light-harvesting complex is to
capture the energy from incoming light and funnel it tothe photoreaction centre where charge separation occurs,it also has a role in the non-radiative dissipation of excessexcitation energy to protect the system from damage athigh light levels. The light-harvesting complex is neces-sary because, even in full sunlight, the light falling on theplant leaf represents a fairly dilute energy source [6]. Thedifferent pigments in the light-harvesting complex pig-ments have the effect of extending the range of wave-lengths of light that the plant can absorb. When light isabsorbed by the pigment array of the light-harvestingcomplex, the energy is passed by rapid resonant energytransfer in less than 1 ns to a pair of the chlorophyll apigments in the photoreaction centre of photosystem II.This special pair of chlorophyll a molecules, P680, play acentral role in energy transduction in photosystem II,because it is at this stage that charge separation occurs(Figure 1.21).The Photosystem II photoreaction centre contains these
two special chlorophyll a molecules (P680) together withtwo other chlorophylls, two pheophytin molecules (pheo-phytin is a metal-free chlorophyll, where the Mg2þ isreplaced by two protons) and two quinones, all arrangedto form an efficient electron transport chain [55,57–61].Absorption of a photon with wavelength below 680 nm(corresponding to an energy of 176 kJmol�1) generatesthe oxidised form of the chlorophyll a, P680
þ, by electrontransfer via pheophytin and a quinone to the terminalquinone acceptor molecule on the outer surface of thethylakoid membrane. The P680
þ is reduced by electrontransfer from the oxygen evolving complex of photosys-tem II located on the inner side on the thylakoid mem-brane. This oxygen evolving complex contains a cluster offour manganese ions as well as bound chloride andcalcium ions. The oxidation of water to molecular oxygenis a four-electron process
2H2Oþ 4e!O2 þ 4Hþ ð1:20Þ
The cluster of four manganese ions in the oxygen evolvingcomplex therefore cycles through four different oxidationstates in order to couple the one-electron transfer to P680
þ
to the four-electron oxidation of water [62]. The precisedetails of the structure of the oxygen evolving complexremain the subject of debate [55,59]. With the oxidation ofone molecule of water to oxygen four protons are releasedon the inside of the membrane. Thus, photosystem II takesin energy from the light absorbed by the light-harvestingcomplex and uses it to produce oxygen and pump protonsacross the thylakoid membrane contributing to the protonmotive force across the membrane.
Bioenergetics and Biological Electron Transport 15

1.4.9 Cytochrome bf Complex
The cytochrome bf complex transfers electrons fromphotosystem II to photosystem I by catalysing the oxida-tion of reduced plastoquinone by plastocyanin, Pc
QH2 þ 2Pcþ !Qþ 2Pcþ 2Hþoutside ð1:21Þ
In some cases, this reaction is accompanied, as in thecorresponding reaction of the mitochondrial CoQH2–cytc reductase complex, by the pumping of two additionalprotons across the membrane through the operation of a Qcycle. For the cytochrome bf complex this is not always thecase, however, under some circumstances it can switch to amechanism in which the two additional protons are notpumped across the membrane [49].
N N
NN
Mg
OH3COOC
O
O
N N
NN
Mg
OH3COOC
O
O
O
Chlorophyll a
Chlorophyll b
β-carotene
Figure 1.20 Structures of the light-harvesting pigments.
16 Bioelectrochemistry

The cytochrome bf complex (Figure 1.22) is made up offour subunits and contains a 2Fe2S centre, two b-type hemesand a c-type heme [48]. The 2Fe2S centre is the site foroxidation of the reduced plastoquinone. The two b-typehemes span the hydrophobic core of the complex and are thebasis of the Q cycle (as in the mitochondrial CoQH2–cyt creductase complex, see above). The crystal structure of the
cytochrome b6f complex from a cyanobacterium has recent-ly been reported [63]. However, the full details of electrontransfer in the cytochrome bf complex between the reducedplastoquinone and the plastocyanin are, as yet, not clear.
1.4.10 Photosystem I
Much of our present understanding of photosystem I isbased on the crystal structure solution for photosystem Ifrom the cyanobacterium Synechococcus elongatus, byJordan et al. [50,58,64,65]. The core of photosystem I issubstantially larger than the corresponding core of photo-system II, but despite this there is still a single pair ofchlorophyll a molecules at the heart of the charge separationprocess. Photosystem I contains significantly more chloro-phyll than photosystem II, with about 90 chlorophyllmolecules associated with the light-harvesting complex andsix associated with the electron transport chain.The chlorophylls in the light-harvesting complex are
arranged, along with about 20 carotenoids, in two layers(Figure 1.23). Once absorbed by the array of pigments inthe light-harvesting complex, the excitation energy israpidly passed by resonant energy transfer to a specialpair of chlorophylls, P700, located in the core of thephotoreaction centre, which are the start of the electrontransfer chain. The absorption of this pair of chlorophyllsis at 700 nm, slightly red shifted from that in photosystem
Figure 1.21 A schematic of photosystem II showing the arrangement of the redox sites (based on Loll et al. [55]). QA and QB areplastoquinones, Chl is chlorophyll, Pheo is pheophytin, P680 are a special pair of chlorophyllmolecules where charge separation occurs, Tyrare tyrosine residues, Mn4Ca is the four manganese cluster of the oxygen evolving complex, Fe2þ is a non-heme iron.
Figure 1.22 A schematic of the cytochrome bf complex showingthe arrangement of the redox sites (based on Kurisu et al. [63]). Theenzyme is a homodimer, the electron transfer pathway is shown inone half for clarity. PC is plastocyanin, PQ is plastoquinone andFe2S2 is an iron–sulfur cluster.
Bioenergetics and Biological Electron Transport 17

II. In photosystem I charge separation occurs by electrontransfer from the excited chlorophyll, P700
�, through a
chain of four accessory chlorophylls and two phylloqui-nones to three 4Fe4S clusters, the last of which is locatedon the outside of the thylakoid membrane. The chloro-phylls and phylloquinones are arranged in two branchesand there is still controversy over whether both branchesor only one is involved in the electron transport [64]. Theresulting oxidised chlorophyll, P700
þ, is reduced by plas-tocyanin on the inside of the membrane. Unlike photosys-tem II, proton transfer across the membrane does notaccompany the electron transfer. From the terminal 4Fe4Scluster, the electron is transferred to ferredoxin, a small(11 kDa) soluble one-electron redox protein containing a2Fe2S cluster complexed to four cysteines.The reduced ferredoxin transfers electrons to NADP
reductase, a peripheral protein bound on the inside of thethylakoid membrane near photosystem I [48]. Its role is tolink the one electron transfers from the ferredoxin, Fd, tothe two-electron reduction of NADPþ
NADPþ þHþoutside þ 2Fd!NADPHþ 2Fdþ ð1:22Þ
To do this the ferredoxin reductase contains a single FADcentre with two different binding sites for ferredoxin andNADPþ [66]. Recent crystallographic studies of photosys-tem I from a higher plant have shown strong similarities instructure and in the positions of almost all of the chlor-ophylls with those in the cyanobacterium, despite theirevolutionary divergence around 1 billion years ago [67].
1.4.11 Bacterial Photosynthesis
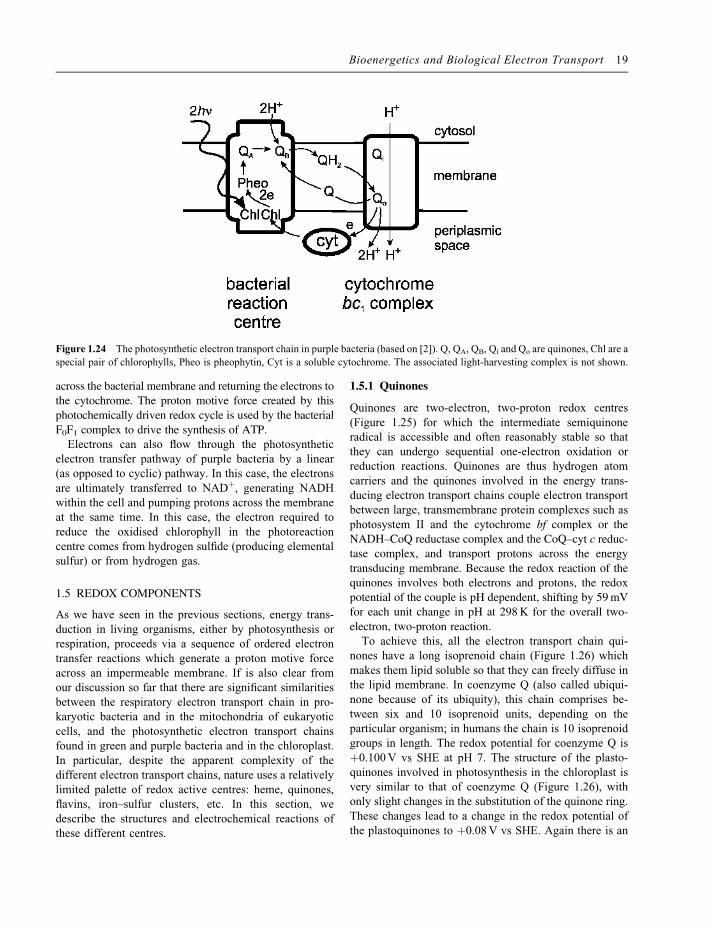
There are five different major types of bacteria: cyano-bacteria, purple bacteria, green sulfur bacteria, green non-sulfur bacteria and heliobacteria, that are capable ofphotosynthesis [6]. Of these only one, the cyanobacteria,produce oxygen. Photosynthesis in green and purplebacteria does not generate oxygen, because they onlycontain one photoreaction centre, rather than the twofound in green plants, cyanobacteria and algae [2].Figure 1.24 shows the electron transport chain in purplebacteria. In this case, the process is cyclic with each cyclepumping protons across the membrane. The basic com-ponents of the chain strongly resemble those of thechloroplast discussed above [68]. Again, this similarityis not surprising, but demonstrates a common evolution-ary origin; as for the mitochondrion, it is now generallyaccepted that the chloroplast has an endosymbiotic origin,a view supported by genetic analysis [6].
In contrast to the chloroplast, in bacteria the variouscomponents of the photosynthetic apparatus are located inthe bacteria�s lipid bilayer cytoplasmic membrane. In mostcases this is surrounded by a second, more permeable,membrane and a tough outer cell wall to provide mechani-cal stability. The bacterial reaction centre captures light anduses this to drive charge separation across the bacterialmembrane taking electrons from a reduced soluble cyto-chrome and passing on to a quinone. The resulting reducedquinone reacts with the transmembrane cytochrome bc1complex through aQ cycle leading to the pumping of protons
Figure 1.23 A schematic of photosystem II and its light-harvesting complex showing the arrangements of pigments and redox centres
and the direction of energy (dotted arrows) and electron (solid arrows) transfers (based on Jordan et al. [64] and K€uhlbrandt [65]). PC isplastocyanin, Fd is ferredoxin, Chl is chlorophyll, PhQ is phylloquinone, Fe4S4 are iron–sulfur clusters and P700 are a special pair ofchlorophylls where charge separation occurs.
18 Bioelectrochemistry
across the bacterial membrane and returning the electrons tothe cytochrome. The proton motive force created by thisphotochemically driven redox cycle is used by the bacterialF0F1 complex to drive the synthesis of ATP.Electrons can also flow through the photosynthetic
electron transfer pathway of purple bacteria by a linear(as opposed to cyclic) pathway. In this case, the electronsare ultimately transferred to NADþ, generating NADHwithin the cell and pumping protons across the membraneat the same time. In this case, the electron required toreduce the oxidised chlorophyll in the photoreactioncentre comes from hydrogen sulfide (producing elementalsulfur) or from hydrogen gas.
1.5 REDOX COMPONENTS
As we have seen in the previous sections, energy trans-duction in living organisms, either by photosynthesis orrespiration, proceeds via a sequence of ordered electrontransfer reactions which generate a proton motive forceacross an impermeable membrane. If is also clear fromour discussion so far that there are significant similaritiesbetween the respiratory electron transport chain in pro-karyotic bacteria and in the mitochondria of eukaryoticcells, and the photosynthetic electron transport chainsfound in green and purple bacteria and in the chloroplast.In particular, despite the apparent complexity of thedifferent electron transport chains, nature uses a relativelylimited palette of redox active centres: heme, quinones,flavins, iron–sulfur clusters, etc. In this section, wedescribe the structures and electrochemical reactions ofthese different centres.
1.5.1 Quinones
Quinones are two-electron, two-proton redox centres(Figure 1.25) for which the intermediate semiquinoneradical is accessible and often reasonably stable so thatthey can undergo sequential one-electron oxidation orreduction reactions. Quinones are thus hydrogen atomcarriers and the quinones involved in the energy trans-ducing electron transport chains couple electron transportbetween large, transmembrane protein complexes such asphotosystem II and the cytochrome bf complex or theNADH–CoQ reductase complex and the CoQ–cyt c reduc-tase complex, and transport protons across the energytransducing membrane. Because the redox reaction of thequinones involves both electrons and protons, the redoxpotential of the couple is pH dependent, shifting by 59mVfor each unit change in pH at 298K for the overall two-electron, two-proton reaction.To achieve this, all the electron transport chain qui-
nones have a long isoprenoid chain (Figure 1.26) whichmakes them lipid soluble so that they can freely diffuse inthe lipid membrane. In coenzyme Q (also called ubiqui-none because of its ubiquity), this chain comprises be-tween six and 10 isoprenoid units, depending on theparticular organism; in humans the chain is 10 isoprenoidgroups in length. The redox potential for coenzyme Q isþ0.100V vs SHE at pH 7. The structure of the plasto-quinones involved in photosynthesis in the chloroplast isvery similar to that of coenzyme Q (Figure 1.26), withonly slight changes in the substitution of the quinone ring.These changes lead to a change in the redox potential ofthe plastoquinones to þ0.08V vs SHE. Again there is an
Figure 1.24 The photosynthetic electron transport chain in purple bacteria (based on [2]). Q, QA, QB, Qi and Qo are quinones, Chl are a
special pair of chlorophylls, Pheo is pheophytin, Cyt is a soluble cytochrome. The associated light-harvesting complex is not shown.
Bioenergetics and Biological Electron Transport 19
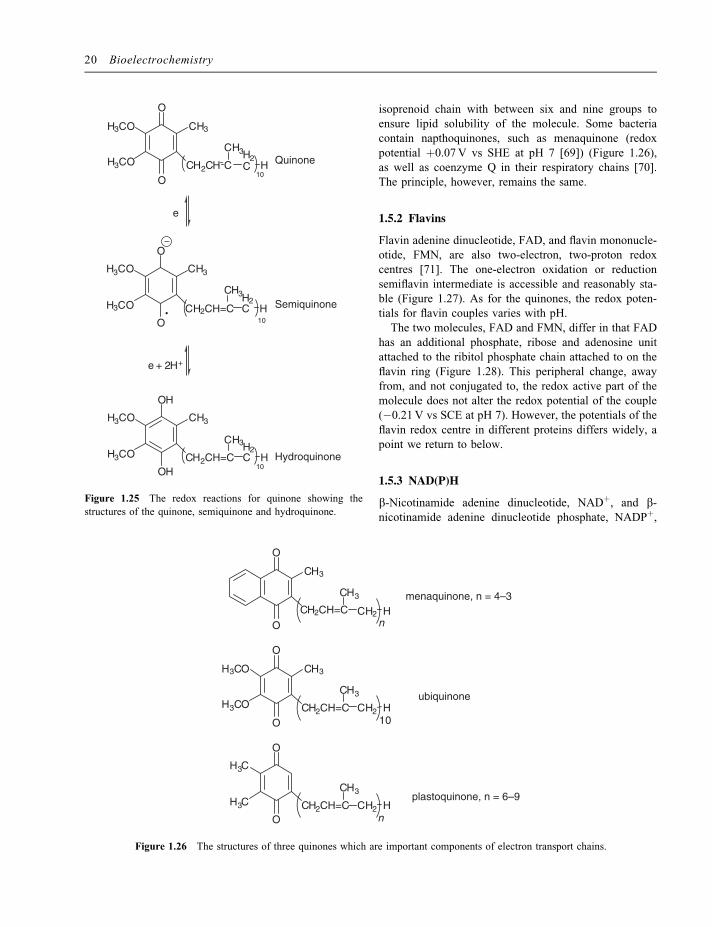
isoprenoid chain with between six and nine groups toensure lipid solubility of the molecule. Some bacteriacontain napthoquinones, such as menaquinone (redoxpotential þ0.07V vs SHE at pH 7 [69]) (Figure 1.26),as well as coenzyme Q in their respiratory chains [70].The principle, however, remains the same.
1.5.2 Flavins
Flavin adenine dinucleotide, FAD, and flavin mononucle-otide, FMN, are also two-electron, two-proton redoxcentres [71]. The one-electron oxidation or reductionsemiflavin intermediate is accessible and reasonably sta-ble (Figure 1.27). As for the quinones, the redox poten-tials for flavin couples varies with pH.
The two molecules, FAD and FMN, differ in that FADhas an additional phosphate, ribose and adenosine unitattached to the ribitol phosphate chain attached to on theflavin ring (Figure 1.28). This peripheral change, awayfrom, and not conjugated to, the redox active part of themolecule does not alter the redox potential of the couple(�0.21V vs SCE at pH 7). However, the potentials of theflavin redox centre in different proteins differs widely, apoint we return to below.
1.5.3 NAD(P)H
b-Nicotinamide adenine dinucleotide, NADþ, and b-nicotinamide adenine dinucleotide phosphate, NADPþ,
O
O
CH3
CH2CH=C
CH3
CH2
menaquinone, n = 4–3
ubiquinone
plastoquinone, n = 6–9
Hn
O
O
CH3
CH2CH=C
CH3
CH2
H3CO
H3CO H10
O
OCH2CH=C
CH3
CH2H3C H
n
H3C
Figure 1.26 The structures of three quinones which are important components of electron transport chains.
O
O
CH3H3CO
H3CO CH2CH C
CH3H2C H
10
O
O
CH3H3CO
H3CO CH2CH=C
CH3H2C H
10
OH
OH
CH3H3CO
H3CO CH2CH=C
CH3H2C H
10
e
e + 2H+
Quinone
Semiquinone
Hydroquinone
Figure 1.25 The redox reactions for quinone showing the
structures of the quinone, semiquinone and hydroquinone.
20 Bioelectrochemistry

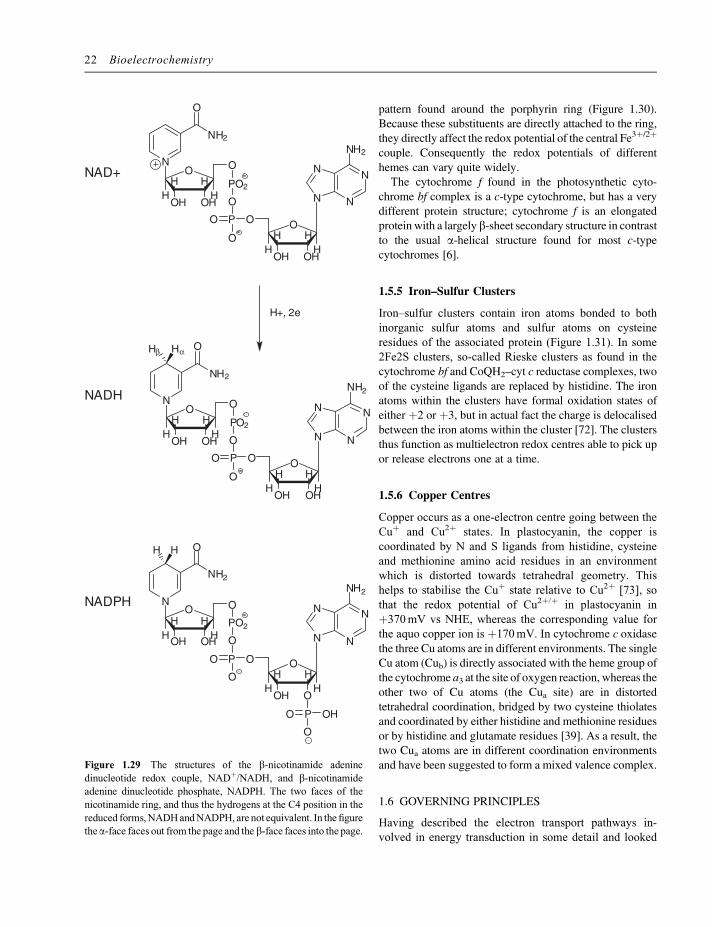
are two-electron, one-proton redox couples for which theintermediate radical forms are not readily accessible(Figure 1.29). NADH and NADPH act as hydride carriersin the biological system and generally undergo oxidationby hydride transfer in a single step. This hydride transfercan occur either to or from the alpha or beta face of themolecule. The choice of the particular face is determinedby the binding of the NAD(P) within the active site of theenzyme, and is different for different enzymes.NADþ and NADPþ differ in that NADPþ has an
additional phosphate on the ribose ring of the adenosine.Again, this is sufficiently removed from, and not conju-gated to, the redox centre within the molecule, so that theredox potentials of the two couples are the same. Thechange does, however, significantly affect the binding ofthe different molecules to proteins and, consequently,NADH and NADPH perform separate functions withinliving cells.The redox potential for the NAD(P)þ/NAD(P)H couple
is �320mV vs SHE at pH 7. Since the reaction involvestwo electron and one proton this potential shifts by29.5mV for each unit change in pH at 298K.
1.5.4 Hemes
The heme redox centre (also spelt haem) is a porphyrinring, comprising four pyrrole rings linked by methylenebridges, with a single Fe ion coordinated in the centre.The different heme types, a, b and c differ in the substitution
N
N
N
NH
R
H3C
H3C
O
O
N
HN
N
NH
R
H3C
H3C
O
O
N
HN
NH
NH
R
H3C
H3C
O
O
e + H+
e + H+
FAD
Semiquinone
FADH2
Figure 1.27 The redox reaction of flavin adenine dinucleotide.
N
N
N
NH
CH2
H3C
H3C
O
O
HC
HC
HC
CH2
O
P
O
O O
N
NN
N
NH2
O
HOH
HHHH
OP
O
O
OH
OH
OH
flavin
adenosine
ribitol
N
N
N
NH
CH2
H3C
H3C
O
O
HC
HC
HC
CH2
O
P
O
O O
OH
OH
OHFMN,flavinmononucleotide
FAD,flavinadeninedinucleotide
Figure 1.28 The structures of flavin adenine dinucleotide, FAD, and flavin adenine mononucleotide, FMN.
Bioenergetics and Biological Electron Transport 21
pattern found around the porphyrin ring (Figure 1.30).Because these substituents are directly attached to the ring,they directly affect the redox potential of the central Fe3þ/2þ
couple. Consequently the redox potentials of differenthemes can vary quite widely.
The cytochrome f found in the photosynthetic cyto-chrome bf complex is a c-type cytochrome, but has a verydifferent protein structure; cytochrome f is an elongatedprotein with a largely b-sheet secondary structure in contrastto the usual a-helical structure found for most c-typecytochromes [6].
1.5.5 Iron–Sulfur Clusters
Iron–sulfur clusters contain iron atoms bonded to bothinorganic sulfur atoms and sulfur atoms on cysteineresidues of the associated protein (Figure 1.31). In some2Fe2S clusters, so-called Rieske clusters as found in thecytochrome bf and CoQH2–cyt c reductase complexes, twoof the cysteine ligands are replaced by histidine. The ironatoms within the clusters have formal oxidation states ofeither þ2 or þ3, but in actual fact the charge is delocalisedbetween the iron atoms within the cluster [72]. The clustersthus function as multielectron redox centres able to pick upor release electrons one at a time.
1.5.6 Copper Centres
Copper occurs as a one-electron centre going between theCuþ and Cu2þ states. In plastocyanin, the copper iscoordinated by N and S ligands from histidine, cysteineand methionine amino acid residues in an environmentwhich is distorted towards tetrahedral geometry. Thishelps to stabilise the Cuþ state relative to Cu2þ [73], sothat the redox potential of Cu2þ/þ in plastocyanin inþ370mV vs NHE, whereas the corresponding value forthe aquo copper ion is þ170mV. In cytochrome c oxidasethe three Cu atoms are in different environments. The singleCu atom (Cub) is directly associated with the heme group ofthe cytochrome a3 at the site of oxygen reaction, whereas theother two of Cu atoms (the Cua site) are in distortedtetrahedral coordination, bridged by two cysteine thiolatesand coordinated by either histidine and methionine residuesor by histidine and glutamate residues [39]. As a result, thetwo Cua atoms are in different coordination environmentsand have been suggested to form a mixed valence complex.
1.6 GOVERNING PRINCIPLES
Having described the electron transport pathways in-volved in energy transduction in some detail and looked
N
NN
N
NH2
O
OHOH
HHHH
O
O
OH OH
H HH H
N
P
O
O
O
PO2
O
NH2
O
N
NN
N
NH2
O
OHOH
HHHH
O
O
OH OH
H HH H
N
P
O
O
O
PO2
O
NH2
O
H+, 2e
Hβ Hα
NAD+
NADH
NADPHN
NN
N
NH2
O
OOH
HHHH
O
O
OH OH
H HH H
N
P
O
O
O
PO2
O
NH2
OH H
P OHO
O
Figure 1.29 The structures of the b-nicotinamide adenine
dinucleotide redox couple, NADþ/NADH, and b-nicotinamide
adenine dinucleotide phosphate, NADPH. The two faces of the
nicotinamide ring, and thus the hydrogens at the C4 position in the
reduced forms,NADHandNADPH, are not equivalent. In the figure
thea-face faces out from the page and the b-face faces into the page.
22 Bioelectrochemistry

at the different redox centres involved, we are in aposition to think about some of the common generalguiding principles that determine the efficient operationof these systems. For example, it is clear from ourdiscussion that organisation of the redox species with
respect to the lipid membrane is important, and that it isessential to ensure that the electron transfer reactionswhich occur within the electron transport chains occurbetween specific partners within the chain. If this breaksdown, the organism will either not be able to captureenergy efficiently from sunlight or will not be able toutilise the energy from food to make ATP. Thus, com-pounds which block the photosynthetic electron transportchain or intercept the mitochondrial electron transportchain are highly toxic to living systems. Defects in theefficiency of proton pumping across the mitochondrialmembrane are associated with a wide range of humandiseases, particularly those affecting the brain and muscle,where large amounts of ATP are used, although singleorgans or combinations of organs can be affected [18,19].It is also clear that the properties of the phospholipid
membrane, as a barrier to transport of protons between theinside and outside of the structure and as an environmentin which to embed the large electron transfer proteins, iscrucial in order to establish the proton motive force whichultimately drives synthesis of ATP in the living cell. Wehave also seen that these processes are achieved with arelatively restricted palette of redox centres and it istherefore of importance to consider the ways in whichthe properties of these redox centres, in particular theirredox potentials, can be tuned within the system tooptimise them for their place within the electron transportchain. We also need to consider the factors which controlthe rates of electron transfer between the different mem-bers of the electron transfer chain, both within multicentreredox proteins [74] and between different components. Inthis section we consider these different general points inturn starting with the membrane itself.
1.6.1 Spatial Separation
Phospholipids are amphiphilic molecules with a hydro-philic headgroup and a hydrophobic tail. To make thephospholipid membrane, the individual phospholipidmolecules assemble with their headgroups on the outsideand the hydrophobic tails on the inside in a bilayermembrane (Figure 1.32). This membrane is about 4 or5 nm thick and is essentially impermeable to ions, includ-ing protons. The various membrane-bound proteins asso-ciated with the phospholipid bilayer make up a significantcomponent of the overall membrane. For example, theinner mitochondrial membrane is typically 24% lipid and76% protein, while the chloroplast membrane is only25–30% lipid and 70–75% protein [75].The lipid component is made up of a complex
mixture of many different lipids that is different for
N N
NN
Fe
CH3
CH3
H3C
HC
CHCH2
OH
OHC
heme a
N N
NN
Fe
CH3
CH3H3C
H3C
CHCH2
CHCH2
heme b
N N
NN
Fe
CH3
CH3H3C
H3C
heme c
O O O O
O O OO
O O O O
(protein)RS
SR(protein)
Figure 1.30 The structures of common hemes.
Bioenergetics and Biological Electron Transport 23

the mitochondrial membrane, the chloroplast and otherbiological membranes, and which is different for theinner and outer layers of the bilayer. This complexity,there are over 1000 different lipids in mammaliancells, indicates that there is some tuning of theproperties of the lipid bilayer for different applica-tions [76–78]. Figure 1.33 shows the structures ofsome common glycerophospholipids, that is phospho-lipids based on phosphatidic acid (3-sn-phosphatidicacid) esterified with different headgroups.Galactophospholipids make up as much as 70% of the
lipids in the chloroplast thylakoid membrane. Studies ofthe phospholipid composition of chloroplasts and mito-chondria from avocado and cauliflower showed differ-ences in the precise composition between the species and
major differences between the chloroplast and mitochon-drion in both cases [76]. Diphosphatidylglycerol (cardio-lipin) is highly enriched in the inner mitochondrialmembrane and is not generally present in other cellularmembranes; phosphatidylethanolamine is relatively moreabundant and phosphatidylserine relatively less abundantin mitochondrial inner membranes [77]. The particularcomposition of the phospholipid bilayer determines itsfluidity, which then regulates the properties of proteinsembedded within it. It is also important to note that thecomposition of the lipid layer will not be homogeneous;there is good evidence for a non-uniform distribution ofthe different phospholipids within the membrane andassociation between specific proteins and specificphospholipids.
Fe
Fe
S
S
S
Fe
Fe
S
S-Cys
S-Cys
Cys-S
Cys-S
SFe
SFe
S-Cys
S-Cys
Cys-S
Cys-S
SFe
SFe
S-Cys
S-Cys
N
N
NH
HN
His
His
Fe
S
S
S
Fe
Fe
S
S-Cys
Cys-S
Cys-S
Fe2S2 Rieske complex
Fe3S4 Fe4S4
Figure 1.31 The structures of the common iron–sulfur clusters.
Figure 1.32 A schematic of the phospholipid bilayer membrane.
24 Bioelectrochemistry

1.6.2 Energetics: Redox Potentials
When we look at the energetics of electron transfer alongthe mitochondrial electron transport chain, from NADH atone terminus to oxygen at the other (Figure 1.34), we see
that the redox potentials of the different couples are orga-nised in a steadily increasing sequence. At each step somepart of the available free energy is used to drive the kineticsof electron transfer along the chain, while the remainder is
O OO
OPO
OO
O
O OO
OPO
OO
O
O OO
OPO
OO
O
O OO
OPO
OO
O
NH3
NH3
OO
NMe3
phosphatidylethanolamine
phosphatidylserine
phosphatidylcholine
phosphatidylglycerolOH
OH
O OO
OP
OO
O
O OO
OP
OO
O
OH
diphosphatidylglycerol(cardiolipin)
OO
OH
OH
OHCH2OH
OO
OR2
OR1
galactolipid
Figure 1.33 The structures of some common phospholipids.
used to pump protons across the mitochondrial membrane
Bioenergetics and Biological Electron Transport 25

against the proton motive force (Figure 1.35). The sequenceof redox potentials (Figure 1.34) also reveals the kineticbarrier for the reduction of oxygen to water, with by far thegreatest drop in redox potential, �0.2V, occurring in thefinal step between Cub/heme a3 of cytochrome c oxidase andthe water/oxygen couple. This is a situation which is mirroredin current attempts to produce efficient fuel cells, where theslow electrode kinetics of the oxygen reduction reaction atneutral or acidic pHare a significant limitationon the efficiencyof current fuel cells and biofuel cells.An examination of the sequence of redox potentials for
the components of the photosynthetic electron transferpathway reveals the same story, albeit in this case thereare two large endergonic steps corresponding to theadsorption of two photons (Figure 1.36).This precise tuning of the redox potentials of the
different constituents of the mitochondrial and photosyn-thetic electron transfer chains is achieved by control of thecoordination sphere and environment of the differentconstituent redox centres. Thus, in the case of the hemeproteins, the heme centre is bound to the polypeptide bytwo thioether bonds involving two cysteine residues. Theredox potential of the FeIII/FeII centre in the heme is
altered by the coordination of two axial ligands, either ahistidine and a methionine or two histidines above andbelow the heme plane, to the Fe centre and by theinteraction of the heme with the surrounding polypep-tide [79]. If we consider the full range of hemes inbiological systems we find that the potentials for theFe(III)/Fe(II) couple span 0.7V from �0.3V in histi-dine/histidine ligated heme c to þ0.4V vs SHE in histi-dine/methionine ligated heme c [73]. This wide variation ofredox potentials allows heme redox centres to fulfil roles atdifferent stages all the way along the redox chain.
In class I cytochromes c, where the two axial ligands area histidine and a methionine, the redox potential of theFe centre varies fromþ0.2 toþ 0.38V vs SHE [80] and thisis attributed to thep electronwithdrawing effect of the sulfuratoms of the thioether linkages and the axially boundmethionine, all of which stabilise the Fe(II) state, and thepoor solvent accessibility of the heme within the hydropho-bic polypeptide pocket, again favouring the less chargedFe(II) state over the Fe(III) state. The final fine tuning of theredox potential is caused by changes in the electrostaticinteractions between the charge on the Fe centre and thecharges on polar amino acid residues within, and on the
Figure 1.34 The sequence of redox potentials in the mitochondrial electron transport chain from NADþ to O2. The bars represent the
range of potentials corresponding to the ratio of oxidised to reduced form from 1 : 10 to 10 : 1 (adapted from Smith and Wood [70]).
26 Bioelectrochemistry

surface of, the protein. For example, site directed mutagen-esis studies ofmyoglobin have shown that replacing a valine(an uncharged amino acid residue) which is in van derWaalscontact with the heme by glutamate or aspartate (bothnegatively charged amino acid residues) shifts the potentialof the Fe(III)/Fe(II) couple by �0.2V. Replacing the samevaline by asparagine (which is uncharged) shifts the redoxpotential by�0.08V [81]. In general, for type I cytochromesc, the modification of internal charges causes a 50 to 60mVshift, whereas modification of surface charges has a smallereffect (10 to 30mV) [79,80]. Similar effects have beendemonstrated for cytochrome b562 variants [82].A similar situation pertains for the flavin two electron,
two proton redox couple. The redox potential of freeflavin in solution at pH 7 is �0.21V vs SHE [71].However, the redox potentials of flavin in redox proteinsand redox enzymes spans a wide range. In this case, theredox potential of the flavin is modulated by its immediateenvironment and by the significant difference between thetypical dielectric constant for the interior of the protein,�5, and the much larger value for water, 78. Stackinginteractions with aromatic amino acid residues above andbelow the flavin ring within the protein, also exert a
significant effect on the redox potential [83–87]. In thecase of flavodoxins, these effects lead to a large shift(around �0.45V) of the flavin potential relative to that inwater.The blue copper proteins are another example where
the potentials of the redox centre span a range ofvalues [88], in this case from 0.37V vs NHE in P. nigraplastocyanin to 0.785V vs. NHE in Polyporus versicolorlaccase. Again, these differences can be explained bydifferences in the axial ligands around the Cu centre andby the degree of hydrophobicity of the polypeptide sur-rounding the redox centre. It is interesting to note that in thecase of the blue copper proteins the coordination geometryabout the Cu centre is virtually identical in the Cu(I) and Cu(II) redox states. Consequently there is very little reorgani-sation accompanying the electron transfer and the reorga-nisation energy (see below) is low, ER� 0.6 to 0.8 eV,leading to fast electron transfer kinetics.
1.6.3 Kinetics: Electron Transfer Rate Constants
Organising the redox potentials of the individual couplesin the electron transport pathways in sequence is only onepart of the story. The ordering of the redox potentialscontrols the thermodynamic driving force for the reactionbetween each sequential pair of components in the chain,
Figure 1.35 The redox potentials for the three main complexes
of the mitochondrial electron transport chain showing the number
of protons pumped across the membrane at each stage for the
transfer of two electrons along the chain. I is the NADH–CoQ
reductase complex, II the CoQH2–Cyt c reductase complex and IVis the Cyt c oxidase complex; Q is ubiquinone and cyt c iscytochrome c.
Figure 1.36 The sequence of redox potentials in the
photosynthetic electron transport chain (adapted from
Blankenship [6]).
Bioenergetics and Biological Electron Transport 27

but it cannot prevent non-specific electron transfer reac-tions between disparate components; indeed the thermo-dynamic driving force for these undesirable reactions maybe significantly greater than for the specific, sequentialelectron transfer. Therefore, in addition to ordering of theredox potentials of the couples, there has to be significantselectivity in the kinetics of the reactions. This is achievedin several ways: spatial separation of components acrossthe membrane, control of the distance for electron trans-fer, and the use of one- and two- electron couples.Electron transfer is, at its core, a quantum process (for
an in depth discussion of the theory of electron transfersee [89]). The basic model for electron transfer reactionswas developed by Marcus, Hush, Levich and Dogonadzein a series of contributions starting in the 1950s [90,91].The basic versions of the theory are predicated on theseparation of fast electronic motion and slow nuclearmotion – the Franck–Condon principle. According tothis model, electron transfer occurs by tunnelling betweenreactant and product nuclear vibrational surfaces. Theactivation energy for the process arises from the reorga-nisation of the nuclear and solvent coordinates required tobring the reactant system to a configuration in which theelectron can transfer adiabatically to the product surface.In the basic treatment of electron transfer kinetics, thereactant and product energy surfaces are treated as para-bolic and we have a model, as shown in Figure 1.37. Here
q represents the reaction coordinate and includes both theinner and outer contributions, where the inner contributionsrefer to the nuclear rearrangement of the nuclei of the redoxcentres themselves and the outer contributions refer to thesolvent environment around the reactant centres. DG0 is thethermodynamic driving force and DGz is the activationenergy for the reaction. The rate constant for electrontransfer between the donor and acceptor
DþA!Dþ þA� ð1:23Þ
is given by
kDA ¼ kelweff
2pexp
�DGz
RT
� �ð1:24Þ
In this equation,oeff is the effective frequency of the nuclearmotions which brings the system to the transition stateconfiguration qz, and kel is the electron transfer probabilityat the nuclear configuration of the transition state. Assumingthat the reactant and product energy surfaces are parabolicand of the same shape the free energy of activation can bewritten
DGz ¼ ðER �DG0Þ24ER
ð1:25Þ
Equation (1.25) makes explicit the relationship betweenthe activation energy and the thermodynamic drivingforce for the reaction, and predicts a quadratic depen-dence of ln(kDA) onDG
0. This prediction has been verifiedfor a number of systems including studies of electrontransfer in ruthenium modified myoglobin [92], in whichruthenium redox centres were attached to a specific histi-dine residue on the surface of the protein and the rate ofelectron transfer between different ruthenium amine com-plexes and the active site were measured. In these experi-ments the thermodynamic driving force for the reactionwas changed by changing the metal in the porphyrin at theactive site (native Fe, Cd, Mg, Zn, Pd and proton) and bychanging the ligands on the ruthenium attached to theperipheral histidine. In this way, the driving force for theelectron transfer was varied from 0.39 to 1.17 eV givingaround a 1000-fold change in the rate of intramolecularelectron transfer. For the photosynthetic reaction centre,electron transfer has been shown to follow a quantumcorrected Marcus expression [93].
The quantity ER in Equation (1.25) is the reorganisationenergy. It corresponds to the free energy required to reor-
Figure 1.37 Gibbs free energy surfaceG(q) where q is the reactioncoordinate, for an electron transfer reaction showing the reactant andproduct curves. DG0 is the thermodynamic driving force for thereaction, DGz is the activation free energy for the reaction, ER thereorganisation energy, qR, q
z and qP are the configurations of thereactant, transition state and product, respectively.
28 Bioelectrochemistry

ganise the nuclear coordinates for the reactant from thosecorresponding to equilibrium for the reactants qR, to thosecorresponding to the equilibrium organisation for the pro-ducts, qP, but without transfer of the electron (Figure 1.37).The reorganisation energy, ER, includes both the inner andouter sphere contributions to the reorganisation process.From Figure 1.37 it is clear that small values of ER,corresponding to similar structures for reactants and pro-ducts, and/or broad parabolic free energy surfaces, corre-sponding to an easy reorganisation process, will give largervalues of the electron transfer rate constant, kDA. In general,even for fast electron transfer reactions, ER is a largequantity many times bigger that kT. For biological systems,the protein surrounding the redox centre plays an importantrole in reducing the reorganisation energy and, as a conse-quence, speeding up electron transfer reactions [94]. A largepart of this reduction in ER is caused by the exclusion ofwater. Bulk water has a high dielectric constant (e¼ 78) andtherefore interacts strongly with the charge, and the changein charge that accompanies electron transfer, at the redoxcentre. In contrast, the dielectric constant of the protein islower (around five) and the interactions with the redoxcentre consequently smaller. Added to this, the constrainedstructure of the protein around the redox centre reduces theinner sphere contribution to ER. For example, the reorga-nisation energies for self-exchange in redox proteins aretypically of the order of 0.6 to 0.8 eV [94], whereas thetypical values for simple complex ions in aqueous solutionare significantly larger (around 2 eV).Although the reorganisation process is important in
determining the kinetics of electron transfer betweendonor and acceptor, in order to determine the origin ofthe selectivity in the kinetics of electron transfer betweenspecific partners in the biological electron transfer path-ways, we must turn our attention to the pre-exponentialterm kel in Equation (1.24). According to the semi-classicalmodel kel is given by
kel ¼ffiffiffiffiffiffiffiffiffiffiffiffiffiffiffiffi
p�h2ERRT
rH2
DA ð1:26Þ
where H2DA is the electronic coupling matrix element and
describes the strength of coupling between the reactantand product states at the nuclear configuration of thetransition state. If we assume that the electron transferoccurs by tunnelling through a square, uniform barrierusing the Hopfield model, then
HDAðrÞ ¼ HDAðr0Þexp � bðr� r0Þ2
� �ð1:27Þ
where r0 is the van der Waals contact distance for the donorand acceptor and b describes the exponential attenuation ofthe overlap with distance between the donor and acceptor.The simple exponential dependence of the rate of electrontransferwith distancepredicted byEquations (1.24) to (1.27)can be understood in terms of the drop off of the electronicwavefunctions of the donor HOMO and acceptor LUMOorbitals with distance. In general, these will decrease expo-nentially at larger distances from the redox centre; theoverlap of these two exponentially decayingwavefunctions,then, itself yields an exponential dependence on the separa-tion of donor and acceptor. There is some debate as towhether the distance between donor and acceptor should bemeasured between the metal centres in the redox groups inspecies such as hemes, or between the edges of theligands [94].The parameter b in Equation (1.27) depends on the nature
of the intervening medium through which the electrontunnels. For an electron tunnelling through a vacuum, b isgenerally taken to be between 30 and 50 nm�1 [94]. How-ever, when the electron tunnels through an interveningmedium between the donor and acceptor, the value of b isreduced, because the height of the tunnel barrier is reduced;the electron is able to travel further. For protein a value of bof 14 nm�1 has been suggested based on a range of experi-mental measurement [93]. This means that for every0.17 nm increase in the distance between the donor andacceptor, the rate of electron transfer will decrease by afactor of 10.The topic of long range electron transfer remains an
area of significant interest, not only within bioelectro-chemistry, but also in the field of molecular electronicsand nanotechnology [95,96] and there have been manyelegant studies on model systems. One of these that isparticularly relevant to bioelectrochemistry is the workof Isied et al. [97] who studied the distance dependence ofelectron transfer between two metal complexes separatedby an oligoproline bridge (Figure 1.38). Oligoprolinebridges were selected because their rigidity allows thespacing between donor and acceptor to be well defined;themolecule cannot fold up to bring the donor and acceptorends close to each other. They found an exponentialdecrease in the rate of electron transfer with increasingdistance up to three or four proline molecules in the bridge(corresponding to a donor/acceptor spacing of�2 nm), andbeyond that a levelling off of the electron transfer rate.They suggest several possible explanations for this changein terms of different pathways for electron transfer, includ-ing the possibility of a change from through-space tothrough-bond electron transfer.
Bioenergetics and Biological Electron Transport 29
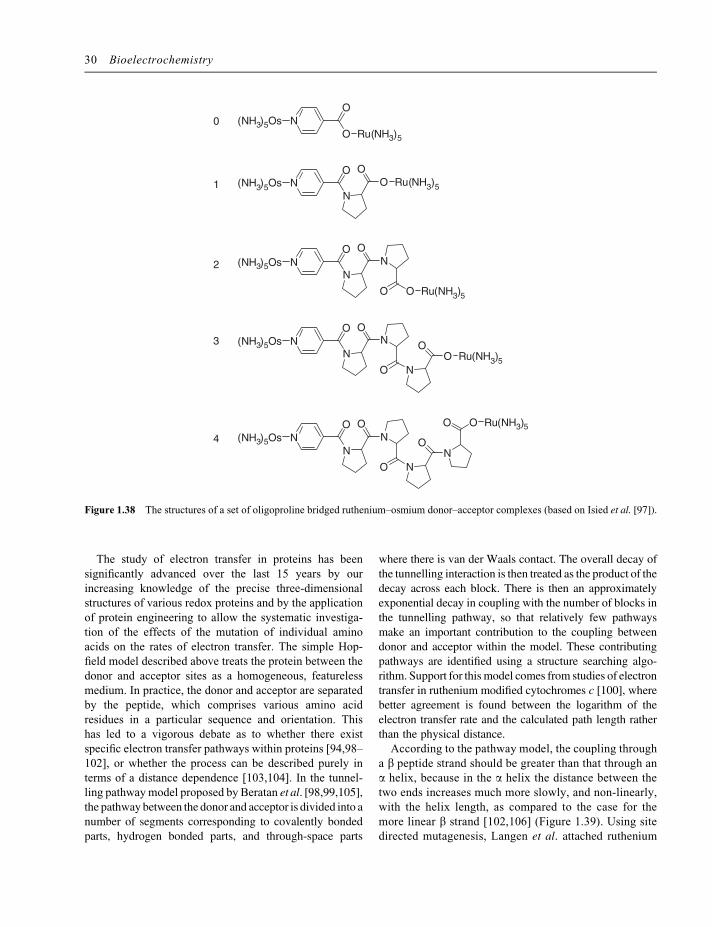
The study of electron transfer in proteins has beensignificantly advanced over the last 15 years by ourincreasing knowledge of the precise three-dimensionalstructures of various redox proteins and by the applicationof protein engineering to allow the systematic investiga-tion of the effects of the mutation of individual aminoacids on the rates of electron transfer. The simple Hop-field model described above treats the protein between thedonor and acceptor sites as a homogeneous, featurelessmedium. In practice, the donor and acceptor are separatedby the peptide, which comprises various amino acidresidues in a particular sequence and orientation. Thishas led to a vigorous debate as to whether there existspecific electron transfer pathways within proteins [94,98–102], or whether the process can be described purely interms of a distance dependence [103,104]. In the tunnel-ling pathwaymodel proposed by Beratan et al. [98,99,105],the pathway between the donor and acceptor is divided into anumber of segments corresponding to covalently bondedparts, hydrogen bonded parts, and through-space parts
where there is van der Waals contact. The overall decay ofthe tunnelling interaction is then treated as the product of thedecay across each block. There is then an approximatelyexponential decay in coupling with the number of blocks inthe tunnelling pathway, so that relatively few pathwaysmake an important contribution to the coupling betweendonor and acceptor within the model. These contributingpathways are identified using a structure searching algo-rithm. Support for this model comes from studies of electrontransfer in ruthenium modified cytochromes c [100], wherebetter agreement is found between the logarithm of theelectron transfer rate and the calculated path length ratherthan the physical distance.
According to the pathway model, the coupling througha b peptide strand should be greater than that through ana helix, because in the a helix the distance between thetwo ends increases much more slowly, and non-linearly,with the helix length, as compared to the case for themore linear b strand [102,106] (Figure 1.39). Using sitedirected mutagenesis, Langen et al. attached ruthenium
O
ON
Ru(NH3)5
(NH3)5Os
ON(NH3)5Os
NO
ORu(NH3)5
ON(NH3)5Os
N
ON
OO Ru(NH3)5
ON(NH3)5Os
N
ON
O N
OO Ru(NH3)5
ON(NH3)5Os
N
ON
O N
ON
O O Ru(NH3)5
0
1
2
3
4
Figure 1.38 The structures of a set of oligoproline bridged ruthenium–osmium donor–acceptor complexes (based on Isied et al. [97]).
30 Bioelectrochemistry
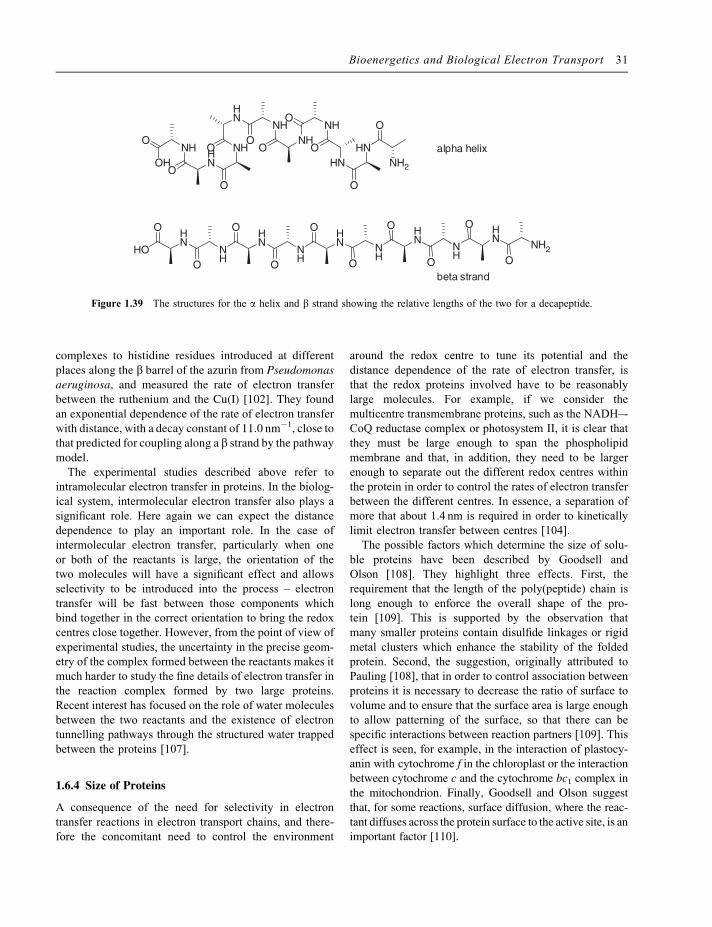
complexes to histidine residues introduced at differentplaces along the b barrel of the azurin from Pseudomonasaeruginosa, and measured the rate of electron transferbetween the ruthenium and the Cu(I) [102]. They foundan exponential dependence of the rate of electron transferwith distance, with a decay constant of 11.0 nm�1, close tothat predicted for coupling along a b strand by the pathwaymodel.The experimental studies described above refer to
intramolecular electron transfer in proteins. In the biolog-ical system, intermolecular electron transfer also plays asignificant role. Here again we can expect the distancedependence to play an important role. In the case ofintermolecular electron transfer, particularly when oneor both of the reactants is large, the orientation of thetwo molecules will have a significant effect and allowsselectivity to be introduced into the process – electrontransfer will be fast between those components whichbind together in the correct orientation to bring the redoxcentres close together. However, from the point of view ofexperimental studies, the uncertainty in the precise geom-etry of the complex formed between the reactants makes itmuch harder to study the fine details of electron transfer inthe reaction complex formed by two large proteins.Recent interest has focused on the role of water moleculesbetween the two reactants and the existence of electrontunnelling pathways through the structured water trappedbetween the proteins [107].
1.6.4 Size of Proteins
A consequence of the need for selectivity in electrontransfer reactions in electron transport chains, and there-fore the concomitant need to control the environment
around the redox centre to tune its potential and thedistance dependence of the rate of electron transfer, isthat the redox proteins involved have to be reasonablylarge molecules. For example, if we consider themulticentre transmembrane proteins, such as the NADH–-CoQ reductase complex or photosystem II, it is clear thatthey must be large enough to span the phospholipidmembrane and that, in addition, they need to be largerenough to separate out the different redox centres withinthe protein in order to control the rates of electron transferbetween the different centres. In essence, a separation ofmore that about 1.4 nm is required in order to kineticallylimit electron transfer between centres [104].The possible factors which determine the size of solu-
ble proteins have been described by Goodsell andOlson [108]. They highlight three effects. First, therequirement that the length of the poly(peptide) chain islong enough to enforce the overall shape of the pro-tein [109]. This is supported by the observation thatmany smaller proteins contain disulfide linkages or rigidmetal clusters which enhance the stability of the foldedprotein. Second, the suggestion, originally attributed toPauling [108], that in order to control association betweenproteins it is necessary to decrease the ratio of surface tovolume and to ensure that the surface area is large enoughto allow patterning of the surface, so that there can bespecific interactions between reaction partners [109]. Thiseffect is seen, for example, in the interaction of plastocy-anin with cytochrome f in the chloroplast or the interactionbetween cytochrome c and the cytochrome bc1 complex inthe mitochondrion. Finally, Goodsell and Olson suggestthat, for some reactions, surface diffusion, where the reac-tant diffuses across the protein surface to the active site, is animportant factor [110].
NH2
O
HN
O
HNO
NHO
NHO
NHO
HN
O NH
O
HN
O
NHO
OH
HN
NH
HN
O
O
O
NH
HN
O
O
HO NH2
HN
NH O
O
O
HN
NH
O
O
alpha helix
beta strand
Figure 1.39 The structures for the a helix and b strand showing the relative lengths of the two for a decapeptide.
Bioenergetics and Biological Electron Transport 31
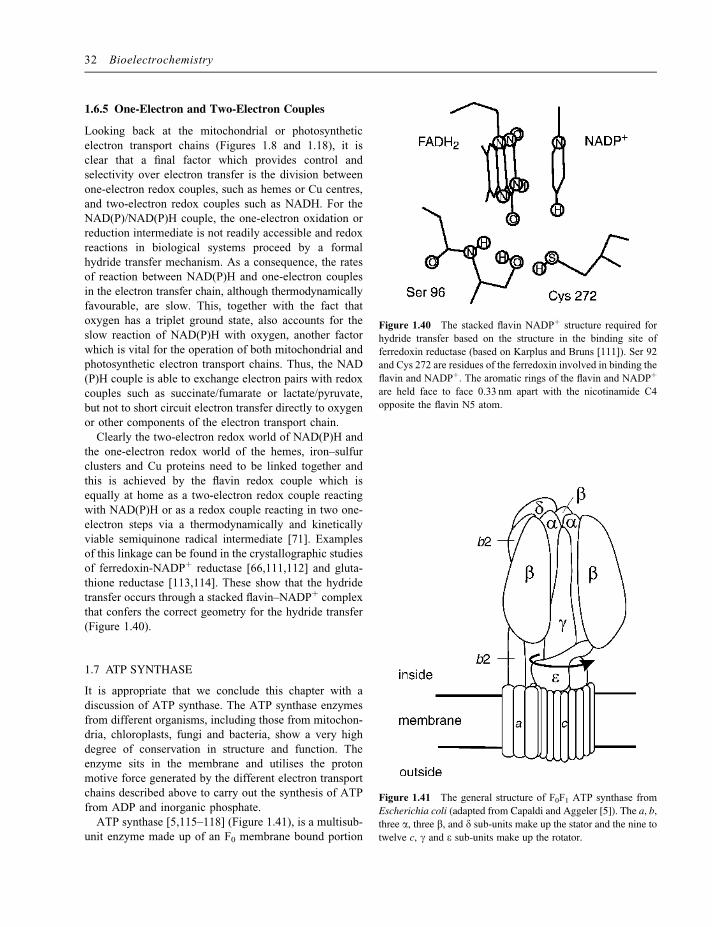
1.6.5 One-Electron and Two-Electron Couples
Looking back at the mitochondrial or photosyntheticelectron transport chains (Figures 1.8 and 1.18), it isclear that a final factor which provides control andselectivity over electron transfer is the division betweenone-electron redox couples, such as hemes or Cu centres,and two-electron redox couples such as NADH. For theNAD(P)/NAD(P)H couple, the one-electron oxidation orreduction intermediate is not readily accessible and redoxreactions in biological systems proceed by a formalhydride transfer mechanism. As a consequence, the ratesof reaction between NAD(P)H and one-electron couplesin the electron transfer chain, although thermodynamicallyfavourable, are slow. This, together with the fact thatoxygen has a triplet ground state, also accounts for theslow reaction of NAD(P)H with oxygen, another factorwhich is vital for the operation of both mitochondrial andphotosynthetic electron transport chains. Thus, the NAD(P)H couple is able to exchange electron pairs with redoxcouples such as succinate/fumarate or lactate/pyruvate,but not to short circuit electron transfer directly to oxygenor other components of the electron transport chain.Clearly the two-electron redox world of NAD(P)H and
the one-electron redox world of the hemes, iron–sulfurclusters and Cu proteins need to be linked together andthis is achieved by the flavin redox couple which isequally at home as a two-electron redox couple reactingwith NAD(P)H or as a redox couple reacting in two one-electron steps via a thermodynamically and kineticallyviable semiquinone radical intermediate [71]. Examplesof this linkage can be found in the crystallographic studiesof ferredoxin-NADPþ reductase [66,111,112] and gluta-thione reductase [113,114]. These show that the hydridetransfer occurs through a stacked flavin–NADPþ complexthat confers the correct geometry for the hydride transfer(Figure 1.40).
1.7 ATP SYNTHASE
It is appropriate that we conclude this chapter with adiscussion of ATP synthase. The ATP synthase enzymesfrom different organisms, including those from mitochon-dria, chloroplasts, fungi and bacteria, show a very highdegree of conservation in structure and function. Theenzyme sits in the membrane and utilises the protonmotive force generated by the different electron transportchains described above to carry out the synthesis of ATPfrom ADP and inorganic phosphate.ATP synthase [5,115–118] (Figure 1.41), is a multisub-
unit enzyme made up of an F0 membrane bound portion
Figure 1.40 The stacked flavin NADPþ structure required for
hydride transfer based on the structure in the binding site of
ferredoxin reductase (based on Karplus and Bruns [111]). Ser 92
and Cys 272 are residues of the ferredoxin involved in binding the
flavin and NADPþ. The aromatic rings of the flavin and NADPþ
are held face to face 0.33 nm apart with the nicotinamide C4
opposite the flavin N5 atom.
Figure 1.41 The general structure of F0F1 ATP synthase from
Escherichia coli (adapted from Capaldi and Aggeler [5]). The a, b,three a, three b, and d sub-units make up the stator and the nine totwelve c, g and e sub-units make up the rotator.
32 Bioelectrochemistry
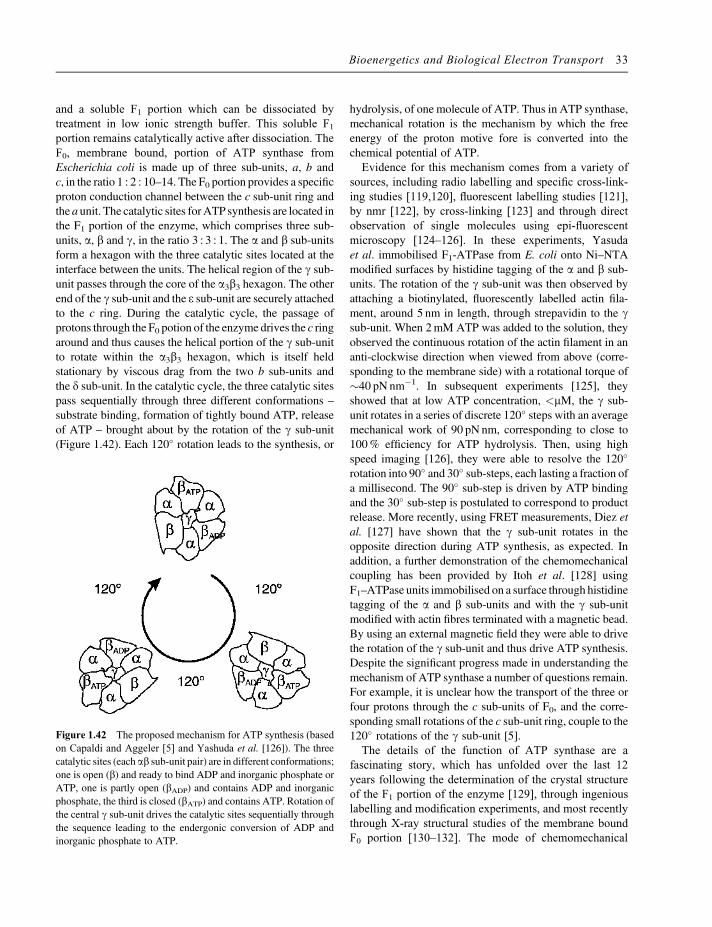
and a soluble F1 portion which can be dissociated bytreatment in low ionic strength buffer. This soluble F1portion remains catalytically active after dissociation. TheF0, membrane bound, portion of ATP synthase fromEscherichia coli is made up of three sub-units, a, b andc, in the ratio 1 : 2 : 10–14. The F0 portion provides a specificproton conduction channel between the c sub-unit ring andthe a unit. The catalytic sites forATP synthesis are located inthe F1 portion of the enzyme, which comprises three sub-units, a, b and g, in the ratio 3 : 3 : 1. The a and b sub-unitsform a hexagon with the three catalytic sites located at theinterface between the units. The helical region of the g sub-unit passes through the core of the a3b3 hexagon. The otherend of the g sub-unit and the e sub-unit are securely attachedto the c ring. During the catalytic cycle, the passage ofprotons through the F0 potion of the enzyme drives the c ringaround and thus causes the helical portion of the g sub-unitto rotate within the a3b3 hexagon, which is itself heldstationary by viscous drag from the two b sub-units andthe d sub-unit. In the catalytic cycle, the three catalytic sitespass sequentially through three different conformations –substrate binding, formation of tightly bound ATP, releaseof ATP – brought about by the rotation of the g sub-unit(Figure 1.42). Each 120� rotation leads to the synthesis, or
hydrolysis, of one molecule of ATP. Thus in ATP synthase,mechanical rotation is the mechanism by which the freeenergy of the proton motive fore is converted into thechemical potential of ATP.Evidence for this mechanism comes from a variety of
sources, including radio labelling and specific cross-link-ing studies [119,120], fluorescent labelling studies [121],by nmr [122], by cross-linking [123] and through directobservation of single molecules using epi-fluorescentmicroscopy [124–126]. In these experiments, Yasudaet al. immobilised F1-ATPase from E. coli onto Ni–NTAmodified surfaces by histidine tagging of the a and b sub-units. The rotation of the g sub-unit was then observed byattaching a biotinylated, fluorescently labelled actin fila-ment, around 5 nm in length, through strepavidin to the gsub-unit. When 2mM ATP was added to the solution, theyobserved the continuous rotation of the actin filament in ananti-clockwise direction when viewed from above (corre-sponding to the membrane side) with a rotational torque of�40 pN nm�1. In subsequent experiments [125], theyshowed that at low ATP concentration, <mM, the g sub-unit rotates in a series of discrete 120� steps with an averagemechanical work of 90 pN nm, corresponding to close to100% efficiency for ATP hydrolysis. Then, using highspeed imaging [126], they were able to resolve the 120�
rotation into 90� and 30� sub-steps, each lasting a fraction ofa millisecond. The 90� sub-step is driven by ATP bindingand the 30� sub-step is postulated to correspond to productrelease. More recently, using FRET measurements, Diez etal. [127] have shown that the g sub-unit rotates in theopposite direction during ATP synthesis, as expected. Inaddition, a further demonstration of the chemomechanicalcoupling has been provided by Itoh et al. [128] usingF1–ATPase units immobilised on a surface through histidinetagging of the a and b sub-units and with the g sub-unitmodified with actin fibres terminated with a magnetic bead.By using an external magnetic field they were able to drivethe rotation of the g sub-unit and thus drive ATP synthesis.Despite the significant progress made in understanding themechanism of ATP synthase a number of questions remain.For example, it is unclear how the transport of the three orfour protons through the c sub-units of F0, and the corre-sponding small rotations of the c sub-unit ring, couple to the120� rotations of the g sub-unit [5].The details of the function of ATP synthase are a
fascinating story, which has unfolded over the last 12years following the determination of the crystal structureof the F1 portion of the enzyme [129], through ingeniouslabelling and modification experiments, and most recentlythrough X-ray structural studies of the membrane boundF0 portion [130–132]. The mode of chemomechanical
Figure 1.42 The proposed mechanism for ATP synthesis (based
on Capaldi and Aggeler [5] and Yashuda et al. [126]). The threecatalytic sites (each ab sub-unit pair) are in different conformations;one is open (b) and ready to bind ADP and inorganic phosphate orATP, one is partly open (bADP) and contains ADP and inorganicphosphate, the third is closed (bATP) and contains ATP. Rotation ofthe central g sub-unit drives the catalytic sites sequentially throughthe sequence leading to the endergonic conversion of ADP andinorganic phosphate to ATP.
Bioenergetics and Biological Electron Transport 33

coupling of the proton motive force to endergonic chemi-cal reaction is a fascinating example and a future chal-lenge to bioelectrochemists.
1.8 CONCLUSION
In this chapter the emphasis has been on the electrontransfer steps in the mitochondrial and photosyntheticelectron transfer chains. As we have seen, our understand-ing of these processes and the underlying physical prin-ciples is enormously enhanced and informed by the highquality structural information available from high resolu-tion X-ray crystallographic studies of the large membranebound proteins involved in these processes. It is amazingto realise that it is only really within the last 11 years,starting with the crystal structure determination of cyto-chrome c oxidase in 1995 that these structures have beenelucidated (the single exception to this is the bacterial photo-synthetic reaction centrewhichwasfirst determined in 1988).Clearly, there are still many questions of detail to answer.Equally, it is also clear that there are many important mes-sages and challenges for bioelectrochemists to be found in theway the electron transfer chains are so exquisitely organisedand in the way they drive the endergonic synthesis of ATP.
REFERENCES
1. A. J. Bard, Integrated Chemical Systems. A Chemical
Approach to Nanotechnology. John Wiley, New York,
1994.
2. H. Lodish, A. Berk, P. Matsudaira, C. A. Kaiser, M. Krieger,
M. P. Scott, S. L. Zipursky and J. Darnell, Mol. Cell Biol.
5th edn., W. H. Freeman, New York, 2003.
3. P. Mitchell, Coupling of phosphorylation to electron and
hydrogen transfer by a chemi-osmotic type of mechanism,
Nature, 191, 144–148 (1961).
4. P. Mitchell, Keilin�s respiratory chain concept and its chemi-
osmotic consequences, Science, 206, 1148–1159 (1979).
5. R. A. Capaldi, R. and Aggeler, Mechanism of the F1F0-type
ATP synthase, a biological rotary motor, Trends Biochem.
Sci., 27, 154–160 (2002).
6. R. E. Blankenship, Molecular Mechanisms of Photosyn-
thesis. Blackwell Science, Oxford, 2002.
7. D. C. Wallace, Mitochondrial diseases in man and mouse,
Science, 283, 1482–1488 (1999).
8. P. Rich, The cost of living, Nature, 421, 583 (2003).
9. T. G. Frey and C. A. Mannella, The internal structure of
mitochondria, Trends Biochem. Sci., 25, 319–324 (2000).
10. M. Saraste, Oxidative phosphorylation at the fin de si�ecle,Science, 283, 1488–1493 (1999).
11. B. E. Schultz and S. I. Chan, Structures and proton-pumping
strategies of mitochondrial respiratory enzymes, Ann. Rev.
Biophys. Biomol. Struct., 30, 25–65 (2001).
12. V. Gu�enebaut, R. Vincentelli, D. Mills, H. Weiss and K.
Leonard, Three-dimensional structure of NADH-dehydroge-
nase from Neurospora crassa by electron microscopy andconical tilt reconstruction, J. Mol. Biol., 265, 409–418 (1997).
13. N. Grigorieff, Structure of the respiratory NADH:ubiquinone
oxidoreductase (complex I), Curr. Op. Struct. Biol., 9,476–483 (1999).
14. G. Hofhaus, H. Weiss and K. Leonard, Electron microscopic
analysis of peripheral and membrane parts of mitochondrial
NADH dehydrogenase (complex I), J. Mol. Biol., 221,1027–1043 (1991).
15. T. Friedrich, U. Weidner, U. Nehls, W. Fecke, R. Schneider
and H. Weiss, Attempts to define distinct parts of NADH:
ubiquinone oxidoreductase (complex I), J. Bioenerg.
Biomembr., 25, 331–337 (1993).
16. P. Hinchliffe and L. A. Sazanov, Organization of iron–sulfur
clusters in respiratory complex I,Science, 309, 771–774 (2005).17. L. A. Sazanova and P. Hinchliffe, Structure of the hydro-
philic domain of respiratory Complex I from Thermusthermophilus, Science, 311, 1430–1436 (2006).
18. T. Yagi, The bacterial energy-transducing NADH–quinone
oxidoreductase,Biochim. Biophys. Acta, 1141, 1–17 (1993).19. H. Weiss, T. Friedrich, H. G. and D. Price, The respiratory-
chain NADH dehydrogenase (complex I) of mitochondria,
Eur. J. Biochem., 197, 563–576 (1991).
20. T. Ohnishi, NADH-quinone oxidoreductase, the most com-
plex complex, J. Bioenerg. Biomembr., 25, 325–329 (1993).21. U. Brandt, Proton-translocation by membrane-bound NADH:
ubiquinone-oxidoreductase (complex I) through redox-gated
ligand conduction, Biochim. Biophys. Acta, 1318, 79–81(1997).
22. C. R. D. Lancaster, A. Kr€oger, M. Auer and H. Michel,
Structure of fumarate reductase fromWolinella succinogenesat 2.2 Å resolution, Nature, 402, 377–385 (1999).
23. C. H€agerh€all and L. Hederstedt, A structural model for the
membrane-integral domain of succinate:quinone oxidore-
ductase, FEBS Lett., 389, 25–31 (1996).
24. C. H€agerh€all, Succinate: quinone oxidoreductases. Varia-
tions on a conserved theme, Biochim. Biophys. Acta, 1320,107–141 (1997).
25. T. M. Iverson, C. Luna-Chavez, G. Cecchini and D. C. Rees,
Structure of the Escherichia coli fumerate reductase respira-tory complex, Science, 284, 1961 (1999).
26. B. L. Trumpower, The protonmotive Q cycle, J. Biol. Chem.,
265, 11409–11412 (1990).
27. E. Darrouzet, C. C. Moser, P. L. Dutton and F. Daldal, Large
scale domain movement in cytochrome bc1: a new device forelectron transfer in proteins, Trends Biochem. Sci., 26,445–451 (2001).
28. Z. Zhang, L. Huang, V. M. Shulmeister, Y.-I. Chi, K. K. Kim,
L.-W. Hung, A. R. Crofts, E. A. Berry and S.-H. Kim,
Electron transfer by domain movement in cytochrome bc1,Nature, 392, 677–684 (1998).
29. A. Osyczka, C. C. Moser, F. Daidal and P. L. Dutton,
Reversible redox energy coupling in electron transfer chains,
Nature, 427, 607–612 (2004).
34 Bioelectrochemistry

30. A. Osyczka, C. C. Moser and P. L. Dutton, Fixing the Q-
cycle, Trends Biochem. Sci., 30, 176–182 (2005).
31. D. Xia, C.-A. Yu, H. Kim, J.-Z. Xia, A. M. Kachurin, L.
Zhang, L. Yu and J. Deisenhofer, Crystal structure of the
cytochrome bc1 complex from bovine heart mitochondria,Science, 277, 60–66 (1997).
32. M. Saraste, Structural features of cytochrome-oxidase,
Quart. Rev. Biophys., 23, 331–366 (1990).
33. M. W. Calhoun, J. W. Thomas and R. B. Gennis, The
cytochrome oxidase superfamily of redox-driven proton
pumps, Trends Biochem. Sci., 19, 325–330 (1994).
34. G. T. Babcock and M. Wilkst€om, Oxygen activation and the
conservation of energy in cell respiration, Nature, 356,301–309 (1992).
35. H. Michel, J. Behr, A. Harrenga and A. Kannt, Cytochrome coxidase: structure and spectroscopy, Ann. Rev. Biophys.Biomol. Struct., 27, 329–356 (1998).
36. D. Zaslavsky and R. B. Gennis, Proton pumping by cyto-
chome oxidase: progress, problems and postulates, Biochim.
Biophys. Acta, 1458, 164–179 (2000).
37. R. J. P. Williams, Purpose of proton pathways, Nature, 376,643 (1995).
38. T. Tsukihara, H. Aoyama, E. Yamashita, T. Tomizaki, H.
Yamaguchi, K. Shinzawa-Itoh, R. Nakashima, R. Yaono and
S. Yoshikawa, The whole structure of the 13-subunit oxi-
dized cytochrome c oxidase at 2.8 Å, Science, 272,1136–1144 (1996).
39. S. Iwata, C. Ostermeier, B. Ludwig and H. Michel, Structure
at 2.8 A resolution of cytochrome c oxidase fromParacoccusdenitrificans, Nature, 376, 660–669 (1995).
40. K. Fax�en, G. Gilderson, P. €Adelroth and P. Brzezinski, A
mechanistic principle for proton pumping by cytochrome coxidase, Nature, 437, 286–289 (2005).
41. M. Wikstr€om, Proton translocation by cytochrome c oxidase:a rejoinder to recent criticism, Biochem., 39, 3515–3519(2000).
42. Y. Anraku, Bacterial electron transport chains, Ann. Rev.
Biochem., 57, 101–132 (1988).
43. S. J. Ferguson, Energy transduction processes: from respi-
ration to photosynthesis in The Desk Encyclopedia of
Microbiology, M. Schaechter (ed.), Elsevier, 2003, pp.
392–400.
44. M. W. Gray, G. Burger and B. F. Lang, Mitochondrial
evolution, Science, 283, 1476–1481 (1999).
45. T. Unemoto and M. Hayashi, Naþ -translocating NADH-
quinone reductase of marine and halophilic bacteria, J. Mol.
Biol., 25, 385–391 (1993).
46. M. G. Bertero, R. A. Rothery, M. Palak, C. Hou, D. Lim, F.
Blasco, J. H. Weiner and N. C. J. Strynadka, Insights into the
respiratory electron transfer pathway from the structure of
nitrate reductase A, Nature Struct. Biol., 10, 681–687
(2003).
47. O. Dym, E. A. Pratt, C. Ho and D. Eisenberg, The crystal
structure of D-lactate dehydrogenase, a peripheral mem-
brane respiratory enzyme, Biochem., 97, 9413–9418
(2000).
48. J. Whitmarsh, Electron transport and energy transduction in
Photosynthesis: A Comprehensive Treatise, A. S. Ragha-
vendra (ed.), Cambridge University Press, Cambridge,
1997, Chapter 7.
49. J. F. Allen, Photosynthesis of ATP–electrons, proton pumps,
rotors, and poise, Cell, 110, 273–276 (2002).
50. J. Barber, The structure of photosystem I, Nature Struct.
Biol., 8, 577–579 (2001).
51. J. P. Dekker and E. J. Boekema, Supramolecular organiza-
tion of thylakoid membrane proteins in green plants,
Biochim, Biophys. Acta, 1706, 12–39 (2005).
52. B. Hankamer, J. Barber and E. J. Boekema, Structure and
membrane organization of photsystem II in green plants,
Ann. Rev. Plant Physiol. Plant Mol. Biol., 48, 641–671(1997).
53. J. Barber and W. K€uhlbrandt, Photosystem II, Curr. Op.
Struct. Biol., 9, 469–475 (1999).
54. Z. Liu, H. Yan, K. Wang, T. Kuang, J. Zhang, L. Gui, X. An
and W. Chang, Crystal structure of spinach major light-
harvesting complex at 2.72 A resolution, Nature, 428,287–292 (2004).
55. B. Loll, J. Kern, W. Saenger, A. Zouni and J. Biesiadka,
Towards complete cofactor arrangement in the 3.0 A
resolution structure of photosystem II, Nature, 438,1040–1043 (2005).
56. A. A. Pascal, Z. Liu, K. Broess, van Oort, B. H. van
Amerongen, C. Wang, P. Horton, B. Robert, W. Chang
and A. Ruban, Molecular basis of photoreception and control
of photosynthetic light-harvesting, Nature, 436, 134–137(2005).
57. A. Zouni, H.-T. Witt, J. Kern, P. Fromme, N. Krauß, W.
Saenger and P. Orth, Crystal structure of photosystem II from
Synechococcus elongatus at 3.8 Å resolution, Nature, 409,739–743 (2001).
58. P. Heathcote, P. K. Fyfe and M. R. Jones, Reaction centres:
the structure and evolution of biological solar power, Trends
Biochem. Sci., 27, 79–87 (2002).
59. K. N. Ferreira, T. M. Iverson, K. Maghlaoui, J. Barber and S.
Iwata, Architecture of the photosynthetic oxygen-evolving
center, Science, 303, 1831–1838 (2004).
60. N. Kamiya and J.-R. Shen, Crystal structure of oxygen-
evolving photosystem II from Thermosynechococcusvulcanus at 3.7 A resolution, Proc. Nat. Acad. Sci., 100,98–103 (2003).
61. N. Krauß, Mechanisms for photosystems I and II, Curr. Op.
Chem. Biol., 7, 540–550 (2003).
62. C. W. Hoganson, A metalloradical mechanism for the
generation of oxygen from water photosynthesis, Science,
277, 1953–1956 (1997).
63. G. Kurisu, H. Zhang, J. L. Smith and W. A. Cramer, Structure
of the cytochrome b6 f complex of oxygenic photosynthesis:tuning the cavity, Science, 302, 1009–1014 (2003).
64. P. Jordan, P. Fromme, H.-T. Witt, O. Klukas, W. Saenger and
N. Krauß, Three-dimensional structure of cyanobacterial
photosystem I at 2.5 A resolution, Nature, 411, 909–917(2001).
Bioenergetics and Biological Electron Transport 35
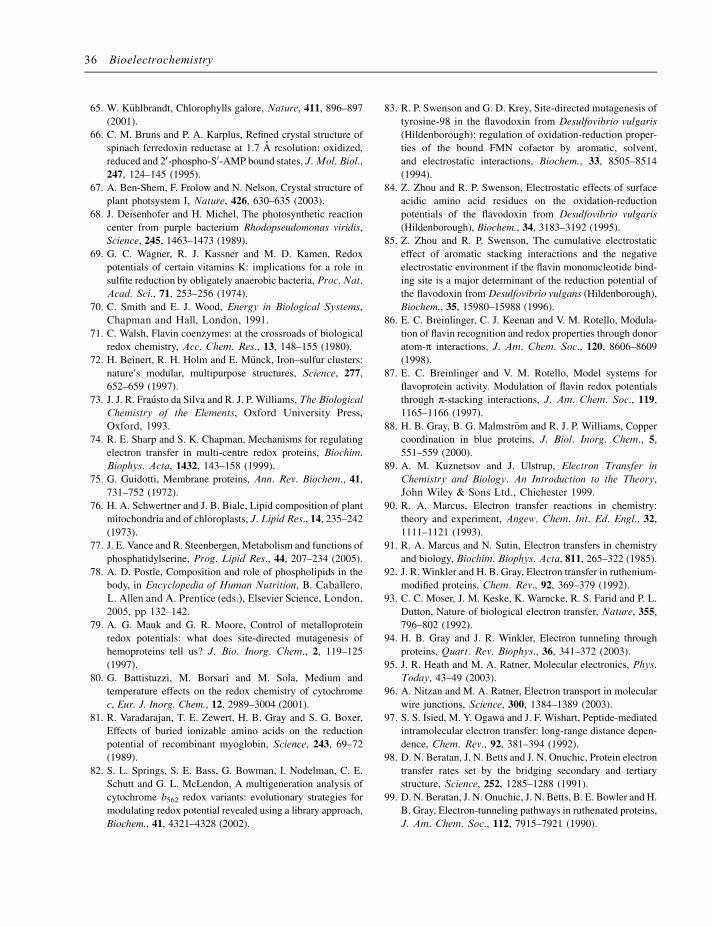
65. W. K€uhlbrandt, Chlorophylls galore, Nature, 411, 896–897(2001).
66. C. M. Bruns and P. A. Karplus, Refined crystal structure of
spinach ferredoxin reductase at 1.7 A resolution: oxidized,
reduced and 20-phospho-S0-AMP bound states, J. Mol. Biol.,
247, 124–145 (1995).
67. A. Ben-Shem, F. Frolow and N. Nelson, Crystal structure of
plant photsystem I, Nature, 426, 630–635 (2003).
68. J. Deisenhofer and H. Michel, The photosynthetic reaction
center from purple bacterium Rhodopseudomonas viridis,Science, 245, 1463–1473 (1989).
69. G. C. Wagner, R. J. Kassner and M. D. Kamen, Redox
potentials of certain vitamins K: implications for a role in
sulfite reduction by obligately anaerobic bacteria, Proc. Nat.
Acad. Sci., 71, 253–256 (1974).
70. C. Smith and E. J. Wood, Energy in Biological Systems,
Chapman and Hall, London, 1991.
71. C. Walsh, Flavin coenzymes: at the crossroads of biological
redox chemistry, Acc. Chem. Res., 13, 148–155 (1980).
72. H. Beinert, R. H. Holm and E. M€unck, Iron–sulfur clusters:
nature�s modular, multipurpose structures, Science, 277,652–659 (1997).
73. J. J. R. Frausto da Silva and R. J. P. Williams, The Biological
Chemistry of the Elements, Oxford University Press,
Oxford, 1993.
74. R. E. Sharp and S. K. Chapman, Mechanisms for regulating
electron transfer in multi-centre redox proteins, Biochim.
Biophys. Acta, 1432, 143–158 (1999).
75. G. Guidotti, Membrane proteins, Ann. Rev. Biochem., 41,731–752 (1972).
76. H. A. Schwertner and J. B. Biale, Lipid composition of plant
mitochondria and of chloroplasts, J. Lipid Res., 14, 235–242(1973).
77. J. E. Vance and R. Steenbergen, Metabolism and functions of
phosphatidylserine, Prog. Lipid Res., 44, 207–234 (2005).
78. A. D. Postle, Composition and role of phospholipids in the
body, in Encyclopedia of Human Nutrition, B. Caballero,
L. Allen and A. Prentice (eds.), Elsevier Science, London,
2005, pp 132–142.
79. A. G. Mauk and G. R. Moore, Control of metalloprotein
redox potentials: what does site-directed mutagenesis of
hemoproteins tell us? J. Bio. Inorg. Chem., 2, 119–125(1997).
80. G. Battistuzzi, M. Borsari and M. Sola, Medium and
temperature effects on the redox chemistry of cytochrome
c, Eur. J. Inorg. Chem., 12, 2989–3004 (2001).81. R. Varadarajan, T. E. Zewert, H. B. Gray and S. G. Boxer,
Effects of buried ionizable amino acids on the reduction
potential of recombinant myoglobin, Science, 243, 69–72(1989).
82. S. L. Springs, S. E. Bass, G. Bowman, I. Nodelman, C. E.
Schutt and G. L. McLendon, A multigeneration analysis of
cytochrome b562 redox variants: evolutionary strategies formodulating redox potential revealed using a library approach,Biochem., 41, 4321–4328 (2002).
83. R. P. Swenson and G. D. Krey, Site-directed mutagenesis of
tyrosine-98 in the flavodoxin from Desulfovibrio vulgaris(Hildenborough): regulation of oxidation-reduction proper-ties of the bound FMN cofactor by aromatic, solvent,and electrostatic interactions, Biochem., 33, 8505–8514(1994).
84. Z. Zhou and R. P. Swenson, Electrostatic effects of surface
acidic amino acid residues on the oxidation-reduction
potentials of the flavodoxin from Desulfovibrio vulgaris(Hildenborough), Biochem., 34, 3183–3192 (1995).
85. Z. Zhou and R. P. Swenson, The cumulative electrostatic
effect of aromatic stacking interactions and the negative
electrostatic environment if the flavin mononucleotide bind-
ing site is a major determinant of the reduction potential of
the flavodoxin from Desulfovibrio vulgans (Hildenborough),Biochem., 35, 15980–15988 (1996).
86. E. C. Breinlinger, C. J. Keenan and V. M. Rotello, Modula-
tion of flavin recognition and redox properties through donor
atom-p interactions, J. Am. Chem. Soc., 120, 8606–8609(1998).
87. E. C. Breinlinger and V. M. Rotello, Model systems for
flavoprotein activity. Modulation of flavin redox potentials
through p-stacking interactions, J. Am. Chem. Soc., 119,1165–1166 (1997).
88. H. B. Gray, B. G. Malmstr€om and R. J. P. Williams, Copper
coordination in blue proteins, J. Biol. Inorg. Chem., 5,551–559 (2000).
89. A. M. Kuznetsov and J. Ulstrup, Electron Transfer in
Chemistry and Biology. An Introduction to the Theory,
John Wiley & Sons Ltd., Chichester 1999.
90. R. A. Marcus, Electron transfer reactions in chemistry:
theory and experiment, Angew. Chem. Int. Ed. Engl., 32,1111–1121 (1993).
91. R. A. Marcus and N. Sutin, Electron transfers in chemistry
and biology, Biochim. Biophys. Acta, 811, 265–322 (1985).92. J. R. Winkler and H. B. Gray, Electron transfer in ruthenium-
modified proteins, Chem. Rev., 92, 369–379 (1992).
93. C. C. Moser, J. M. Keske, K. Warncke, R. S. Farid and P. L.
Dutton, Nature of biological electron transfer, Nature, 355,796–802 (1992).
94. H. B. Gray and J. R. Winkler, Electron tunneling through
proteins, Quart. Rev. Biophys., 36, 341–372 (2003).
95. J. R. Heath and M. A. Ratner, Molecular electronics, Phys.
Today, 43–49 (2003).
96. A. Nitzan and M. A. Ratner, Electron transport in molecular
wire junctions, Science, 300, 1384–1389 (2003).
97. S. S. Isied, M. Y. Ogawa and J. F. Wishart, Peptide-mediated
intramolecular electron transfer: long-range distance depen-
dence, Chem. Rev., 92, 381–394 (1992).
98. D. N. Beratan, J. N. Betts and J. N. Onuchic, Protein electron
transfer rates set by the bridging secondary and tertiary
structure, Science, 252, 1285–1288 (1991).
99. D. N. Beratan, J. N. Onuchic, J. N. Betts, B. E. Bowler and H.
B. Gray, Electron-tunneling pathways in ruthenated proteins,
J. Am. Chem. Soc., 112, 7915–7921 (1990).
36 Bioelectrochemistry

100. D. N. Beratan, J. N. Onuchic, J. R. Winkler and H. B. Gray,
Electron-tunneling pathways in proteins, Science, 258,1740–1741 (1992).
101. H. B. Gray and J. R. Winkler, Long-range electron transfer,
Proc. Nat. Acad. Sci., 102, 3534–3539 (2005).
102. R. Langen, I.-J. Chang, J. P. Germanas, J. H. Richards, J. R.
Winkler and H. B. Gray, Electron tunneling in proteins:
coupling through a b strand, Science, 268, 1733–1735
(1995).
103. C. C. Page, C. C. Moser, X. Chen and P. L. Dutton, Natural
engineering principles of electron tunnelling in biological
oxidation-reduction, Nature, 402, 47–52 (1999).
104. C. C. Page, C. C. Moser and P. L. Dutton, Mechanism for
electron transfer within and between proteins, Curr. Op.
Chem. Biol., 7, 551–556 (2003).
105. J. N. Onuchic, D. N. Beratan, J. R. Winkler and H. B.
Gray, Pathway analysis of protein electron-transfer reac-
tions, Ann. Rev. Biophys. Biomol. Struct., 21, 349–377(1992).
106. H. B. Gray and J. R. Winkler, Electron transfer in proteins,
Ann. Rev. Biochem., 65, 537–561 (1996).
107. J. Lin, I. A. Balabin and D. N. Beratan, The nature of
aqueous tunneling pathways between electron-transfer pro-
teins, Science, 310, 1311–1313 (2005).
108. D. S. Goodsell and A. L. Olson, Soluble proteins: size, shape
and function, Trends Biochem. Sci., 18, 65–68 (1993).
109. P. A. Srere, Why are enzymes so big? Trends Biochem. Sci.,
9, 387–390 (1984).
110. T. A. Payens, Why are enzymes so large? Trends Biochem.
Sci., 8, 46 (1983).
111. P. A. Karplus and C. M. Bruns, Structure-function relations
for ferredoxin reductase, J. Bioenerg. Biomembr., 26, 89–99(1994).
112. P. A. Karplus, M. J. Daniels and J. R. Herriott, Atomic
structure of ferredoxin-NADPþ reductase: prototype for a
structurally novel flavoenzyme family, Science, 251, 60–66(1991).
113. P. A. Karplus and G. E. Schulz, Substrate binding and
catalysis by glutathione reductase as derived from refined
enzyme: substrate crystal structures at 2 A resolution, J.
Mol. Biol., 210, 163–180 (1989).
114. E. F. Pai, P. A. Karplus and G. E. Schulz, Crtystallographic
analysis of the binding of NADPH, NADPH fragments, and
NADPH analogues to glutathione reductase, Biochem., 27,4465–4474 (1988).
115. H. C. Berg, Keeping up with the F1-ATPase, Nature, 394,324–325 (1998).
116. P. D. Boyer, The ATP synthase – a splendid molecular
machine, Ann. Rev. Biochem., 66, 717–749 (1997).
117. P. D. Boyer, What makes ATP synthase spin? Nature, 402,247–249 (1999).
118. A. E. Senior and J. Weber, Happy motoring with ATP
synthase, Nature Struct. Mol. Biol., 11, 110–112 (2004).
119. T. M. Duncan, V. V. Bulygin, Y. Zhou, M. L. Hutcheon and
R. L. Cross, Rotation of subunits during catalysis by Es-cherichia coli F1-ATPase, Proc. Natl. Acad. Sci., 92,10964–10968 (1995).
120. Y. Zhou, T. M. Duncan and R. L. Cross, Subunit rotation in
Escherichia coli F0F1-ATPase synthase during oxidativephosphorylation, Proc. Natl. Acad. Sci., 94, 10583–10587(1997).
121. D. Sabbert, S. Engelbrecht and W. Junge, Intersubunit
rotation in active F-ATPase, Nature, 381, 623–625 (1996).
122. V. K. Rastogi and M. E. Girvin, Structural changes linked to
proton translocation by subunit c of the ATP synthase,Nature, 402, 263–268 (1999).
123. S. P. Tsunoda, R. Aggeler, M. Yoshida and R. A. Capaldi,
Rotation of the c subunit oligomer in fully functional F1F0ATP synthase, Proc. Natl. Acad. Sci., 98, 898–902 (2001).
124. H. Noji, R. Yasuda, M. Yoshida and K. J. Kinosita, Direct
observation of the rotation of F1-ATPase, Nature, 386,299–302 (1997).
125. R. Yasuda, H. Noji, K. J. Kinosita and M. Yoshida, F1-
ATPase is a highly efficient molecular motor that rotates with
discrete 120� steps, Cell, 93, 1117–1124 (1998).
126. R. Yasuda, H. Noji, M. Yoshida, K. Kinoshita and H. Itoh,
Resolution of distinct rotational sunsteps by submillisecond
kinetic analysis of F1-ATPase,Nature, 410, 898–904 (2001).127. M. Diez, B. Zimmermann, M. B€orsch, M. K€onig, E.
Schweinberger, S. Steigmiller, R. Reuter, S. Felekyan, V.
Kudryavtsev, C. A. M. Seidel and P. Gr€aber, Proton-powered
subunit rotation in single membrane-bound F0F1-ATP
synthase, Nature Struct. Mol. Biol., 11, 135–141
(2004).
128. Q1H. Itoh, A. Takahashi, K. Adaxhi, H. Noji, R. Yashuda, M.
Yoshida and K. Kinoshita, Mechanically driven ATP syn-
thesis by F1-ATPase, 427, 465–468 (2004).
129. J. P. Abrahams, A. G. W. Leslie, R. Lutter and J. E. Walker,
Structure at 2.8 A resolution of F1-ATPase from bovine heart
mitochondria, Nature, 370, 621–628 (1994).
130. W. Junge and N. Nelson, Nature�s rotary electromotors,
Science, 308, 642–644 (2005).
131. T. Meier, P. Polzer, K. Diederichs, W. Welte and P. Dimroth,
Structure of the rotor ring of F-type Naþ -ATPase from
Ilyobacter tartaricus, Science, 308, 659–662 (2005).132. T. Murata, I. Yanato, Y. Kakinuma, A. G. W. Leslie and J. E.
Walker, Structure of the rotor of the V-type Naþ -ATPasefrom Enterococcus hirae, Science, 308, 564–659 (2005).
Bioenergetics and Biological Electron Transport 37