Biodiversity of the Bacterial Flora on the Surface of a Smear Cheese
11
APPLIED AND ENVIRONMENTAL MICROBIOLOGY, Feb. 2002, p. 820–830 Vol. 68, No. 2 0099-2240/02/$04.000 DOI: 10.1128/AEM.68.2.820–830.2002 Copyright © 2002, American Society for Microbiology. All Rights Reserved. Biodiversity of the Bacterial Flora on the Surface of a Smear Cheese Noelle M. Brennan, 1,2 Alan C. Ward, 3 Thomas P. Beresford, 1 Patrick F. Fox, 2 Michael Goodfellow, 3 and Timothy M. Cogan 1 * Dairy Products Research Centre, Teagasc, Moorepark, Fermoy, 1 and Department of Food Science and Technology, University College, Cork, 2 Ireland, and Department of Agricultural and Environmental Science, University of Newcastle, Newcastle-upon-Tyne, NE7 7RU, United Kingdom 3 Received 6 August 2001/Accepted 8 November 2001 The bacteria on the surface of a farmhouse smear-ripened cheese at four stages of ripening (4, 16, 23, and 37 days) from inoculated (i.e., deliberately inoculated with Brevibacterium linens BL2) and noninoculated (not deliberately inoculated with B. linens BL2) cheese were investigated. The results show that, contrary to accepted belief, B. linens is not a significant member of the surface flora of smear cheese and no microbial succession of species occurred during the ripening of the cheeses. Of 400 isolates made, 390 were lactate-utilizing coryneforms and 10 were coagulase-negative Staphylococcus spp. A detailed analysis of the coryneforms was undertaken using phenotypic analysis, molecular fingerprinting, chemotaxonomic techniques, and 16S rRNA gene sequencing. DNA banding profiles (ramdom amplified polymorphic DNA [RAPD]-PCR) of all the coryneform isolates showed large numbers of clusters. However, pulsed-field gel electrophoresis (PFGE) of the isolates from the cheeses showed that all isolates within a cluster and in many contiguous clusters were the same. The inoculated and noninoculated cheeses were dominated by single clones of novel species of Coryne- bacterium casei (50.2% of isolates), Corynebacterium mooreparkense (26% of isolates), and Microbacterium gubbeenense (12.8% of isolates). In addition, five of the isolates from the inoculated cheese were Corynebacterium flavescens. Thirty-seven strains were not identified but many had similar PFGE patterns, indicating that they were the same species. C. mooreparkense and C. casei grew at pH values below 4.9 in the presence of 8% NaCl, while M. gubbeenense did not grow below pH 5.8 in the presence of 5 to 10% NaCl. B. linens BL2 was not recovered from the inoculated cheese because it was inhibited by all the Staphylococcus isolates and many of the coryneforms. It was concluded that within a particular batch of cheese there was significant bacterial diversity in the microflora on the surface. The most significant period of cheese production is probably the ripening process, during which starter and nonstarter bac- teria, chymosin, and the indigenous milk enzymes develop the organoleptic and textural properties of the cheese. This is particularly true for surface-ripened cheese, due to the variety and abundance of microorganisms on its surface. Surface-rip- ened cheeses can be divided into mold ripened, e.g., Camem- bert and Brie, and bacteria ripened, e.g., Limburger, Tilsit, Brick, and Münster. The latter cheeses are sometimes called washed-rind cheeses because of the extensive washing given to the surfaces of these cheeses during ripening. They are also called smear cheeses, because of the glistening appearance of the surface, or red-smear cheeses, due to the production of a red carotinoid by Brevibacterium linens, which is thought to be the most common bacterium occurring on the surface of the cheese. For this reason, B. linens is often deliberately inocu- lated onto the surface of the cheese during the early days of ripening, either as a commercial preparation or as the so-called “old-young” smearing method, in which young cheeses are washed with a brine suspension of microorganisms from the surface of mature cheese. The latter system effects the transfer of desirable microorganisms necessary for the ripening process to the young cheeses, but it can also effect the transfer of undesirable microorganisms, such as Listeria monocytogenes and Staphylococcus aureus (25). Based on these considerations, the microflora of smeared and nonsmeared cheeses should be quite different. Various studies have shown that the ripening of bacterial smear-ripened cheese is characterized by a succession of ill- defined microbial communities on the surface of the cheese. Surface ripening begins with the growth of yeasts, which me- tabolize the lactic acid produced by the starter to CO 2 and H 2 O, increase the pH on the cheese surface from 5.0 to 6.0 (3, 6, 7, 12, 19, 25), and produce growth factors for B. linens (17). Both factors promote growth of a gram-positive, catalase- positive, salt-tolerant bacterial microflora composed primarily of Micrococcaeae and coryneform bacteria (5, 14). It is generally believed that B. linens is the dominant bacte- rium on red-smear cheese although recent results have shown a large number of several species of other genera, particularly Arthrobacter, Brevibacterium, Corynebacterium, Microbacterium, and Rhodococcus (5, 6, 22, 25). These are all coryneform bac- teria, which are difficult to identify by classical phenotypic analyses. Usually, the identification of coryneforms should in- clude determination of the types of peptidoglycan, menaqui- nones, and fatty acids in the cell wall. Some of these analyses are labor-intensive, which effectively means that only small numbers of isolates can be analyzed. It is not clear if a progression of different bacteria occurs on the surface of the cheese during ripening since a systematic study of isolates from smear cheese does not appear to have been undertaken. In addition, the contribution that B. linens * Corresponding author. Mailing address: Dairy Products Research Centre, Teagasc, Moorepark, Fermoy, Ireland. Phone: 353 25 42227. Fax: 353 25 42340. E-mail: [email protected]. 820 Downloaded from https://journals.asm.org/journal/aem on 31 January 2022 by 13.231.187.169.
Transcript of Biodiversity of the Bacterial Flora on the Surface of a Smear Cheese

APPLIED AND ENVIRONMENTAL MICROBIOLOGY, Feb. 2002, p. 820–830 Vol. 68, No. 20099-2240/02/$04.00�0 DOI: 10.1128/AEM.68.2.820–830.2002Copyright © 2002, American Society for Microbiology. All Rights Reserved.
Biodiversity of the Bacterial Flora on the Surface of a Smear CheeseNoelle M. Brennan,1,2 Alan C. Ward,3 Thomas P. Beresford,1 Patrick F. Fox,2 Michael Goodfellow,3
and Timothy M. Cogan1*Dairy Products Research Centre, Teagasc, Moorepark, Fermoy,1 and Department of Food Science and Technology, University
College, Cork,2 Ireland, and Department of Agricultural and Environmental Science, University of Newcastle,Newcastle-upon-Tyne, NE7 7RU, United Kingdom3
Received 6 August 2001/Accepted 8 November 2001
The bacteria on the surface of a farmhouse smear-ripened cheese at four stages of ripening (4, 16, 23, and37 days) from inoculated (i.e., deliberately inoculated with Brevibacterium linens BL2) and noninoculated (notdeliberately inoculated with B. linens BL2) cheese were investigated. The results show that, contrary to acceptedbelief, B. linens is not a significant member of the surface flora of smear cheese and no microbial successionof species occurred during the ripening of the cheeses. Of 400 isolates made, 390 were lactate-utilizingcoryneforms and 10 were coagulase-negative Staphylococcus spp. A detailed analysis of the coryneforms wasundertaken using phenotypic analysis, molecular fingerprinting, chemotaxonomic techniques, and 16S rRNAgene sequencing. DNA banding profiles (ramdom amplified polymorphic DNA [RAPD]-PCR) of all thecoryneform isolates showed large numbers of clusters. However, pulsed-field gel electrophoresis (PFGE) of theisolates from the cheeses showed that all isolates within a cluster and in many contiguous clusters were thesame. The inoculated and noninoculated cheeses were dominated by single clones of novel species of Coryne-bacterium casei (50.2% of isolates), Corynebacterium mooreparkense (26% of isolates), and Microbacteriumgubbeenense (12.8% of isolates). In addition, five of the isolates from the inoculated cheese were Corynebacteriumflavescens. Thirty-seven strains were not identified but many had similar PFGE patterns, indicating that theywere the same species. C. mooreparkense and C. casei grew at pH values below 4.9 in the presence of 8% NaCl,while M. gubbeenense did not grow below pH 5.8 in the presence of 5 to 10% NaCl. B. linens BL2 was notrecovered from the inoculated cheese because it was inhibited by all the Staphylococcus isolates and many of thecoryneforms. It was concluded that within a particular batch of cheese there was significant bacterial diversityin the microflora on the surface.
The most significant period of cheese production is probablythe ripening process, during which starter and nonstarter bac-teria, chymosin, and the indigenous milk enzymes develop theorganoleptic and textural properties of the cheese. This isparticularly true for surface-ripened cheese, due to the varietyand abundance of microorganisms on its surface. Surface-rip-ened cheeses can be divided into mold ripened, e.g., Camem-bert and Brie, and bacteria ripened, e.g., Limburger, Tilsit,Brick, and Münster. The latter cheeses are sometimes calledwashed-rind cheeses because of the extensive washing given tothe surfaces of these cheeses during ripening. They are alsocalled smear cheeses, because of the glistening appearance ofthe surface, or red-smear cheeses, due to the production of ared carotinoid by Brevibacterium linens, which is thought to bethe most common bacterium occurring on the surface of thecheese. For this reason, B. linens is often deliberately inocu-lated onto the surface of the cheese during the early days ofripening, either as a commercial preparation or as the so-called“old-young” smearing method, in which young cheeses arewashed with a brine suspension of microorganisms from thesurface of mature cheese. The latter system effects the transferof desirable microorganisms necessary for the ripening processto the young cheeses, but it can also effect the transfer ofundesirable microorganisms, such as Listeria monocytogenes
and Staphylococcus aureus (25). Based on these considerations,the microflora of smeared and nonsmeared cheeses should bequite different.
Various studies have shown that the ripening of bacterialsmear-ripened cheese is characterized by a succession of ill-defined microbial communities on the surface of the cheese.Surface ripening begins with the growth of yeasts, which me-tabolize the lactic acid produced by the starter to CO2 andH2O, increase the pH on the cheese surface from 5.0 to �6.0(3, 6, 7, 12, 19, 25), and produce growth factors for B. linens(17). Both factors promote growth of a gram-positive, catalase-positive, salt-tolerant bacterial microflora composed primarilyof Micrococcaeae and coryneform bacteria (5, 14).
It is generally believed that B. linens is the dominant bacte-rium on red-smear cheese although recent results have showna large number of several species of other genera, particularlyArthrobacter, Brevibacterium, Corynebacterium, Microbacterium,and Rhodococcus (5, 6, 22, 25). These are all coryneform bac-teria, which are difficult to identify by classical phenotypicanalyses. Usually, the identification of coryneforms should in-clude determination of the types of peptidoglycan, menaqui-nones, and fatty acids in the cell wall. Some of these analysesare labor-intensive, which effectively means that only smallnumbers of isolates can be analyzed.
It is not clear if a progression of different bacteria occurs onthe surface of the cheese during ripening since a systematicstudy of isolates from smear cheese does not appear to havebeen undertaken. In addition, the contribution that B. linens
* Corresponding author. Mailing address: Dairy Products ResearchCentre, Teagasc, Moorepark, Fermoy, Ireland. Phone: 353 25 42227.Fax: 353 25 42340. E-mail: [email protected].
820
Dow
nloa
ded
from
http
s://j
ourn
als.
asm
.org
/jour
nal/a
em o
n 31
Jan
uary
202
2 by
13.
231.
187.
169.

makes to the surface bacterial flora when it is deliberatelyinoculated onto the cheese surface has not been studied.
The aim of this study was to identify the bacteria on thesurface of a red-smear cheese at four different times duringripening using a polyphasic approach, including phenotypic,chemotaxonomic, and genotypic analyses. A comparison be-tween cheeses, some of which had been deliberately inoculatedwith B. linens and some of which were not, was also under-taken.
MATERIALS AND METHODS
Cheese manufacture. Gubbeen cheese was used in this study. It is a washed-rind, surface-ripened cheese made on a milk-producing farm from pasteurizedmilk by a proprietary method using a mesophilic starter culture, and it is similarto Tilsit, Reblochon, Limburger, and other surface-ripened cheeses. The curd iswashed during manufacture and, after brining, the cheese is smeared with asaline suspension of B. linens BL2 (Chr. Hansen Laboratories). During ripening,the cheeses are also turned and washed with dilute saline at regular intervals. Thecheeses are flat and cylindrical, weigh from 200 to 500 g, and have a moisturelevel of �45% and a pH of �5.0 1 day after manufacture. Thirty cheeses fromthe same production batch were used in the analysis. Some of the cheeses werenot smeared with B. linens; these cheeses were termed “noninoculated” to dis-tinguish them from the normal inoculated cheese.
Microbiological examination. Cheeses were sampled after salting but beforesmearing (3 days), after smearing (4 days), and after ripening at 15 to 20°C at arelative humidity of �90% for 9, 16, 23, 30, 37, and 44 days. A separate cheesefrom the same batch was used at each sampling time. The surface of each cheesewas marked with the rim of a sterile plastic petri dish (90-mm diameter), and alayer (�90 mm in diameter and 3 mm in depth) was removed with a sterile knife,placed into a sterile stomacher bag, and weighed and sufficient sterile 2% (wt/vol) trisodium citrate solution was added to yield a 1:10 dilution. The resultingsuspension was macerated in a stomacher for 4 min.
The bacteria were enumerated by surface plating on Milk Plate Count Agar(MPCA; Oxoid) containing 5 g of NaCl per 100 ml (MPCA5). Yeast develop-ment on the agar was suppressed by aseptically spreading 100 �l of a suspensionof pimaricin (20 mg/ml) on the surface of each plate before use (8, 20). Plateswere incubated at 30°C for 12 days. Yeast counts were determined on yeast-glucose-chloramphenical agar containing 10 �g of bromophenol blue/liter afterincubation at 25°C for 5 days (18).
Phenotypic characterization. Fifty colonies were selected from countableMPCA5 plates at 4, 16, 23, and 37 days from both the inoculated and noninocu-lated cheese and were purified by restreaking. Cell morphology was determinedon mineral base E, yeast extract, glucose agar (4) after incubation at 30°C for12 h and 1, 3, and 7 days. Strains which were rod-shaped organisms in youngcultures and cocci in older cultures were considered to undergo a rod/coccustransformation. Cultures were also Gram stained and tested for the presence ofcatalase.
All isolates were tested for 53 biochemical characteristics as described previ-ously (21, 22, 23). These included the utilization of organic acids, amino acids,sugars, and alcohols as growth substrates and the abilities to produce acid fromseveral sugars, to grow in the presence of 10% salt, to reduce nitrate, and tohydrolyze starch, gelatin, and casein. Lipase activity was determined using APIZYM kits (API Biomerieux, Marcy l’Etoile, France) which were read after 24 hof incubation at 30°C (1). For casein hydrolysis, 100 ml of 10% (wt/vol) recon-stituted skimmed milk autoclaved at 110°C for 10 min and 900 ml of MPCAautoclaved at 121°C for 15 min were tempered to 45°C and mixed prior topouring. Each strain was streaked and incubated at 30°C for 4 or 10 days.Proteolysis was determined by flooding the plates with 12% (wt/vol) HgCl2 in20% (vol/vol) HCl. A clear zone around the colonies indicated the hydrolysis ofcasein.
The results were compared with a database of the same tests on 557 strains ofArthrobacter, Brevibacterium, Corynebacterium, Microbacterium, and Rhodococcusby using the computer programs CORYNE and CLUSUM (24). Several collec-tion strains of Brevibacterium, Corynebacterium, and Microbacterium were used aspositive controls. These are indicated on Fig. 3. Duplicate analyses of all testswere carried out on a small number (�20) of strains on the day they were testedand also at regular intervals (5 to 10 days) throughout the study. Production ofmethanethiol was determined as described previously (1).
Growth on pH-NaCl gradient plates. Two-dimensional pH-NaCl gradientplates were prepared by a modification of that described by Wimpenny and
Waters (26). Salt and pH gradients were poured at right angles to each other,using four layers (15 ml of each medium) in 10-cm2 petri dishes. Layer 1 mediumcontained 10 g of peptone, 5 g of yeast extract, 5 g of malt extract, 5 g ofCasamino Acids, and 15 g of bacteriological agar no. 1 per liter. The pH wasadjusted to 7.2 and autoclaved at 121°C for 15 min (10). To 15 ml of this medium,220 �l of 1 M DL-lactic acid was added. The medium in layer 2 was the same asthat in layer 1 except that 440 �l of 1 M NaOH was added per 15 ml of medium.Layer 3 contained 10 g of peptone, 5 g of yeast extract, 5 g of malt extract, 5 gof Casamino Acids, 15 g of bacteriological agar no. 1, and 320 g of NaCl per liter.Layer 4 contained the same medium as layer 1 without the addition of acid oralkali. All media were tempered to 75°C before the lactic acid or NaOH wasadded. Plates were poured as follows. One edge of the plate was supported on a3-mm-thick piece of wood, and layer 1 was poured and allowed to solidify as awedge shape. After solidification, the plate was placed on a flat surface and layer2 was poured. Once solidified, the plate was turned through 90°, one side waselevated (3 mm), and the salt layer (layer 3) was poured. Layer 4 was pouredafter placing the plate on a flat surface. The plates were held for 24 h at 30°C toallow the acid and salt to equilibrate vertically by diffusion. Plates were pouredon 5 successive days, and the pH and salt were measured to establish thereproducibility of both salt and pH gradients. pH was measured by excising stripsof agar at 1-cm intervals across the pH gradient, melting them in a microwaveoven, allowing them to cool to room temperature, and measuring the pH. For themeasurement of salt, pieces of agar were excised at 1-cm intervals along the saltgradient, 60 ml of distilled water was added, and the mixture was melted byheating in a microwave oven. The NaCl was measured potentiometrically bytitration with 0.1 N AgNO3. The gradient plates were inoculated with biomassfrom MPCA5 plates resuspended in 1.5 ml of sterile water to a turbidity ofMcFarland standard 3. One milliliter was then spread aseptically over the surfaceof the plate and incubated at 30°C for 3 days. One uninoculated plate wasincubated with each test series to determine pH and salt gradients. Growth wasphotographed and mapped with the aid of a template etched at 1-cm intervals inboth dimensions. The limits of growth were recorded as x and y coordinates.
Extraction of genomic DNA. Strains were cultivated on MPCA5 for 5 days at30°C, and the DNA was extracted as described previously (1).
DNA amplification with random primer. The randomly amplified polymorphicDNA (RAPD)-PCR was carried out in 50-�l reaction volumes in a Perkin-Elmer4800 (Applied Biosystems) PCR instrument. Each reaction mixture (50 �l)contained 5 �l of 10� NH4 buffer, 5 �l of 50 mM MgCl2, 1 �l of deoxynucleotidetriphosphates (dNTPs) mastermix containing 12.5 �mol of each dNTP, 2.5 �l ofa 20 �M stock of primer (M13 forward primer [5�-GTA AAA CGA CGG CCAGT-3�]), 1.0 �l of chromosomal DNA, 0.25 �l of Taq polymerase (5 U/�l)(Bioline), and sufficient sterile water to make the reaction mixture 50 �l. DNAfrom strains which exhibited a coryneform morphology was amplified as follows.The Taq polymerase was added after a 6-min hot start at 95°C, followed by 34amplification cycles of 1 min at 94°C, an annealing temperature of 37°C for 1min, and an extension step of 72°C for 1 min. PCR products (7 �l) wereseparated on a 1.5% (wt/vol) agarose gel (Promega Corp.) containing ethidiumbromide at 100 V for 2 h, and the DNA was detected by UV transillumination.RAPD patterns on Polaroid photographs were digitized with a Scanjet 4P scan-ner and Deskscan II version 2.7 software (Hewlett-Packard, Dublin, Ireland).Patterns were normalized and processed using GelCompar, version 4.0 (AppliedMaths, Kortijk, Belgium); strains were grouped using cluster analysis by theunweighted pair group method (UPGMA) algorithm (16).
Pulsed-field gel electrophoresis (PFGE) analysis. Biomass was scraped fromFunke agar (10) plates, washed twice in 10 mM Tris-HCl (pH 7.6) containing 1M NaCl, and resuspended in 200 �l of the same solution. The suspensions werethen heated to 37°C for 15 min, mixed with an equal volume of 2% low-melting-point agarose (Bio-Rad Laboratories) in 0.125 M EDTA, pH 7.6, and left tosolidify in molds (Bio-Rad). Cells were lysed in situ in agarose blocks by gentleshaking for 18 h at 37°C in EC buffer (1 M NaCl–6 mM Tris-HCl–100 mMEDTA–1% [wt/vol] sarkosyl, pH 7.6) containing 10 mg of lysozyme/ml. Theblocks were then shaken in proteinase K (0.5 mg/ml in 0.5 M EDTA, 1%sarkosyl, pH 8.0) for 24 h at 55°C and twice in 1 mM phenylmethylsulfonylfluoride (PMSF) in 10 mM Tris-HCl containing 1 mM EDTA, pH 8.0, and thenstored in 10 mM Tris-HCl containing 100 mM EDTA, pH 8.0, at 4°C untilrequired. Slices (1 to 2 mm) were cut from the agarose blocks with sterilecoverslips and washed three times at room temperature with gentle shaking in 10mM Tris-HCl–0.1 mM EDTA, pH 8.0 (Tris-HCl-to-EDTA ratio, 10/0.1). Sliceswere washed once at 4°C for 30 min with restriction buffer (New EnglandBiolabs) and incubated for 4 h with 20 U of SpeI (New England Biolabs) in atotal volume of 100 �l. Following digestion, slices were loaded into wells of a 1%PFGE grade agarose gel (Bio-Rad) and the gel was run in 0.5� Tris-boratebuffer using a CHEF-DRIII PFGE apparatus and cooling module (Bio-Rad) at 1 V
VOL. 68, 2002 SMEAR-RIPENED CHEESE 821
Dow
nloa
ded
from
http
s://j
ourn
als.
asm
.org
/jour
nal/a
em o
n 31
Jan
uary
202
2 by
13.
231.
187.
169.

(6 V · cm�1) for 16 h at 14°C, with the pulse ramped from 1 to 20 s. Gels werestained with ethidium bromide (0.5 �g/ml) in water, destained in water, andphotographed using Polaroid type 667 film.
Antimicrobial activity. One colony from an MPCA5 plate was resuspended in500 �l of sterile water, and 5 �l of the resultant suspension was spotted onto thesame agar and incubated at 30°C overnight. The plates were then overlaid with5 ml of the appropriate sloppy agar (7.5 g of agar/liter) containing the target(indicator) strain (�105 CFU/ml) and incubated at the temperature appropriatefor growth of the target strain for 2 to 3 days; the diameter of the inhibition zonewas measured. The target organisms used were Propionibacterium freundenreichiiLMG (Laboratorium voor Microbiologie, University of Ghent, Ghent, Belgium)16424T, Enterococcus faecalis DPC (Dairy Products Research Centre, Teagasc,Fermoy, Ireland) 3546, and Listeria innocua LMG 11386 and LMG 11387 and B.linens BL1 and BL2 (Chr. Hansen’s Laboratory, Little Island, Cork, Ireland).
Chemical analysis of cheese. Moisture and salt were determined by standardmethods (15). pH was determined by placing the electrodes directly into gratedcheese.
RESULTS
Microbiology of cheese surface. A comparison of the bacte-rial and yeast counts on the surface of the inoculated andnoninoculated cheeses is shown in Fig. 1. The initial numbersof bacteria and yeast ranged from �102 to 103 CFU/cm2 andincreased to a maximum of �108 CFU of bacteria/cm2 after 30days and �106 CFU of yeasts/cm2 after 9 days, after which thenumbers of both decreased slightly. Generally, there was littledifference between the bacterial and yeast counts of the inoc-ulated and noninoculated cheeses except at the end of ripen-ing, when a �0.5 log difference was observed between thebacterial counts. This difference was not considered to be sig-nificant.
Composition of cheese surface. The moisture content of thesurface of both cheeses increased between the third and fourthday of ripening, after which it decreased steadily to �25 g/100g (Fig. 2A). The salt content was very high on day 3, probablybecause the salt had not diffused into the cheese, and de-creased rapidly between days 3 and 4, after which it increasedgradually to a final level of 2 to 2.5 g/100 g. There was littledifference in the percent salt-in-moisture between the inocu-lated and noninoculated cheese. Moreover, the percent salt-in-moisture gradually increased in both cheeses during ripen-ing; this coincided with the drying out of the cheese surface(Fig. 2B). The pH of both cheeses was 5.0 at day 3 and in-
creased to 5.7 to 6.0 at the end of ripening (Fig. 2B); theincrease was greater in the inoculated than in the noninocu-lated cheese.
Characterization of isolates. From each cheese, 50 isolateswere made at 4, 16, 23, and 37 days, yielding a total of 400isolates. All of the isolates fell into two groups, gram-positive,catalase-positive cocci (10 isolates) and gram-positive, cata-lase-positive, irregularly shaped rods (390 isolates). All thecocci were coagulase-negative, facultative anerobes and were,therefore, Staphylococcus species. No effort was made to iden-tify them to species level. The rod-shaped organisms wereconsidered to be coryneforms.
Seiler and Braatz (24) developed two computer programs,CORYNE and CLUSUM, to identify coryneform bacteria,based on 53 biochemical tests on 557 different strains of Ar-throbacter, Brevibacterium, Corynebacterium, and Microbacte-rium spp. The same tests were performed on the 390 coryne-forms isolated in the present study, but none of them could beidentified with any of the strains in the database. The smallestnumber of phenotypic differences found between the isolatesand those in the database was 5.
Development of RAPD methodology. The usefulness ofRAPD-PCR, using M13 forward as primer, to distinguish be-tween several strains of corynebacteria, most of which hadbeen originally isolated from cheese, was investigated. DNA
FIG. 1. Development of bacteria and yeast on the surface of theinoculated and noninoculated cheese during ripening.
FIG. 2. (A) Salt and moisture levels in the surface layer of theinoculated and noninoculated cheese during ripening. (B) Salt-in-moisture levels and pH in the surface layers of the inoculated andnoninoculated cheese during ripening.
822 BRENNAN ET AL. APPL. ENVIRON. MICROBIOL.
Dow
nloa
ded
from
http
s://j
ourn
als.
asm
.org
/jour
nal/a
em o
n 31
Jan
uary
202
2 by
13.
231.
187.
169.
was extracted from independently grown duplicate culturesand PCR was performed in duplicate on each strain on 4successive days. The results are shown in Fig. 3. Species ofArthrobacter, Corynebacterium, and Microbacterium clusteredvery poorly, showing little relationship with each other, whilesome strains of B. linens and Brevibacterium casei clustered at75% similarity. However, within a strain, the reproducibilitywas �96%, except for Microbacterium lacticum NCIMB 8540T
and Microbacterium liquefaciens NCIMB 11509T, where it was�90%. Because of the high reproducibility of the techniquewithin a species, it was felt that it could be used to clustermonoclonal isolates and that, at 70% similarity, different gen-era of coryneform bacteria would remain distinct and identi-fiable from each other.
RAPD analysis of coryneforms from inoculated cheese.Analysis of the RAPD dendrograms of the 195 coryneformisolates from the inoculated cheese resulted in 29 differentclusters and 39 strains, which did not cluster (Fig. 4). None ofthe cheese isolates clustered with the culture collection strainsexcept DPC 5584 and DPC 5585, which clustered with Coryne-bacterium flavescens ATCC 10340T in cluster 8. B. casei NCFB2049 and NCFB 2050 and B. linens BL2, NCIMB 8546, andNCIMB 11437 were found in cluster 25, but this did not in-clude any cheese isolate. Corynebacterium variabilis NCFB2097T and NCFB 2099 were found in cluster 3, which also didnot include any cheese isolate. The other collection strains, A.globiformis NCIMB 8605, A. nicotianae NCIMB 9458T, M. liq-uefaciens NCIMB 11509T, B. linens BL1, and M. lacticumNCIMB 8540T, did not cluster.
PFGE of isolates from inoculated cheese. SpeI restrictiondigests of the chromosomal DNA of all isolates from the in-oculated cheese were examined by PFGE. The results showedthat all isolates within a cluster had identical band patterns(data not shown), except for cluster 25, which contained cul-ture collection strains of B. casei and B. linens. A comparisonof the band patterns of one isolate from within a cluster and allthe unclustered isolates, with the RAPD dendrogram, is shownin Fig 4. All the isolates in clusters 1, 2, 4, 5, and 6 and theunclustered isolates between these clusters had identical bandpatterns (Fig. 4). Two culture collection strains, M. liquefaciensNCIMB 11509T and M. lacticum NCIMB 8540T, were alsofound unclustered in this group, but they had very differentbanding patterns from the others.
Eleven of the isolates had been previously identified by che-motaxonomic and 16S rRNA sequencing as new species ofMicrobacterium gubbeenense, Corynebacterium casei, andCorynebacterium mooreparkense (1, 2). The relevant cluster inwhich these isolates were found is also shown in Fig. 4. The M.gubbeenense isolates were found in clusters 1, 2, 4, 5, and 6.Their PFGE band patterns were identical and were also similarto those of the unclustered isolates between clusters 1 and 6and to the other isolates in clusters 1, 2, 4, 5, and 6. Therefore,all the isolates in these clusters and the unclustered isolatesbetween clusters 1 and 6 were considered to be M.gubbeenense. Cluster 3 comprised C. variabilis NCDO 2097 andNCDO 2099. Their band patterns were identical but quitedifferent from those of M. gubbeenense.
Similar arguments were used to identify the isolates in clus-ters 9 to 16, the unclustered isolates between clusters 9 and 16,the isolates in clusters 17 to 29, and the unclustered isolates
between clusters 17 and 29 as C. mooreparkense and C. casei,respectively. C. mooreparkense was found in clusters 9, 10, 11,and 16. All the isolates in clusters 9 to 16, as well as theunclustered isolates between these clusters, had band patternsidentical to those of C. mooreparkense and hence all theseisolates were considered to be this species. Similarly, all theunclustered isolates between clusters 17 and 29, except Ar-throbacter nicotinanae ATCC 9458T, as well as all the isolates inclusters 17 to 29, except cluster 25, had patterns which wereidentical to C. casei and were thus considered to be C. casei.
To confirm the reliability of the PFGE fingerprinting tech-nique to identify strains, the chemotaxonomic analyses and 16SrRNA sequencing used previously (1) were applied to otherisolates, four from cluster 20 (DPC 5577, DPC 5578, DPC5579, and DPC 5580), two from cluster 26 (DPC 5581 andDPC 5582), and one from cluster 29 (DPC 5583). All of thesewere identified as C. casei sp. nov. The position of two of thelatter three isolates in the RAPD dendrogram is also indicatedin Fig. 4.
The only cluster which contained both cheese isolates and aculture collection strain was cluster 8, which contained C. fla-vescens ATCC 10340T. The five cheese isolates in clusters 7and 8 had similar banding patterns as C. flavescens ATCC10340T and are therefore considered to be C. flavescens (Fig.5). Like C. flavescens ATCC 10340T, all five cheese isolatesproduced yellow colonies.
The PFGE band patterns of C. variabilis NCDO 2097T andNCDO 2099 (cluster 3) were identical, as were those of B. caseiNCFB 2049 and NCFB 2050 (cluster 25), confirming the reli-ability of the PFGE technique for species identification. B.linens was an exception to this. Two of the four strains of B.linens, NCIMB 11437 and NCIMB 8546 (cluster 25), had iden-tical band patterns while B. linens BL2 (cluster 25) and B.linens BL1 (unclustered) had different band patterns fromthese and from each other. This is not surprising as, based onDNA:DNA hybridization data, B. linens is a mixture of twodifferent species (9); the present data suggest that it might bea mixture of three different species.
The eight unclustered cheese isolates at the end of theRAPD dendrogram were not identified further, but four ofthem appeared to have identical band patterns.
PFGE of isolates from noninoculated cheese. RAPD andPFGE analyses were also carried out on the isolates from thenoninoculated cheese (Fig. 5). The RAPD analysis divided the195 coryneform isolates from this cheese into 26 clusters and47 isolates that did not cluster. None of the isolates clusteredwith any of the collection strains. Cluster 9 contained B. linensNCIMB 8546, NCIMB 11437, and BL1 and B. casei NCFB2049 and NCFB 2050, while cluster 23 contained C. variabilisNCFB 2097T and NCFB 2099. Neither of these clusters con-tained a cheese isolate and all other clusters contained onlycheese isolates. The other collection strains, Arthrobacter glo-biformis NCIMB 8605, A. nicotianae NCIMB 9458T, C. flave-scens ATCC 10340T, M. liquefaciens NCIMB 11509T, B. linensBL1, and M. lacticum NCIMB 8540T, did not cluster.
The PFGE band patterns of all isolates within a cluster wereidentical, except those in cluster 9, which contained B. linensand B. casei. All the isolates in clusters 2 to 8 had identicalPFGE band patterns. Four of these isolates, DPC 5293 andDPC 5300 (cluster 2), DPC 5294 (cluster 4), and DPC 5299
VOL. 68, 2002 SMEAR-RIPENED CHEESE 823
Dow
nloa
ded
from
http
s://j
ourn
als.
asm
.org
/jour
nal/a
em o
n 31
Jan
uary
202
2 by
13.
231.
187.
169.
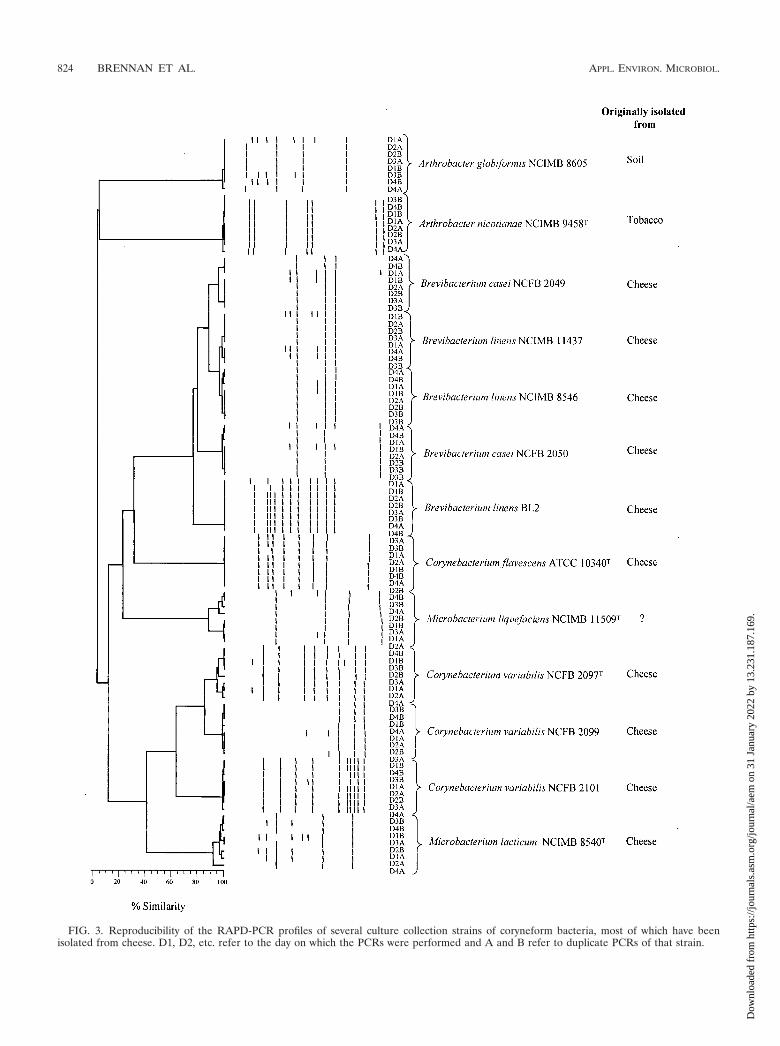
FIG. 3. Reproducibility of the RAPD-PCR profiles of several culture collection strains of coryneform bacteria, most of which have beenisolated from cheese. D1, D2, etc. refer to the day on which the PCRs were performed and A and B refer to duplicate PCRs of that strain.
824 BRENNAN ET AL. APPL. ENVIRON. MICROBIOL.
Dow
nloa
ded
from
http
s://j
ourn
als.
asm
.org
/jour
nal/a
em o
n 31
Jan
uary
202
2 by
13.
231.
187.
169.

FIG. 4. Comparison of RAPD-PCR results and PFGE band patterns of isolates from the inoculated cheese. The cluster numbers (C1 to C29)are shown and the number of strains in each cluster is in parentheses. All isolates within a cluster had the same PFGE pattern and, for clarity, onlyone example of the band pattern in each cluster is shown. Strains which were previously identified by chemotaxonomic analyses and 16S rRNAsequencing (1, 2) are also indicated, while strains with one asterisk were identified in this study by chemotaxonomic analyses and 16S rRNAsequencing.
VOL. 68, 2002 SMEAR-RIPENED CHEESE 825
Dow
nloa
ded
from
http
s://j
ourn
als.
asm
.org
/jour
nal/a
em o
n 31
Jan
uary
202
2 by
13.
231.
187.
169.

FIG. 5. Comparison of RAPD-PCR results and PFGE band patterns of isolates from the noninoculated cheese. The cluster numbers (C1 toC26) are shown and the number of strains in each cluster is in parentheses. All isolates within a cluster had the same PFGE pattern and, for clarity,only one example of the pattern in each cluster is shown. Strains which were previously identified by chemotaxonomic analyses and 16S rRNAsequencing (1, 2) are also indicated.
826 BRENNAN ET AL. APPL. ENVIRON. MICROBIOL.
Dow
nloa
ded
from
http
s://j
ourn
als.
asm
.org
/jour
nal/a
em o
n 31
Jan
uary
202
2 by
13.
231.
187.
169.

(cluster 6) were previously identified by chemotaxonomic anal-ysis and 16S rRNA sequencing as C. casei (1). Therefore, allthe strains in these clusters and the unclustered strains be-tween these clusters were considered to be C. casei.
All the isolates in clusters 10 to 20 had identical PFGEpatterns as those previously identified as C. mooreparkenseDPC 5307 (cluster 11) and C. mooreparkense DPC 5313 (un-clustered) and so are considered to be C. mooreparkense (1).Similarly, the isolates in clusters 21, 22, and 24 to 26 had PFGEpatterns similar to those previously identified as M.gubbeenense DPC 5286 and DPC 5291 (cluster 21) and M.gubbeenense DPC 5281 (unclustered) (2). Cluster 23 containedC. variabilis NCDO 2097 and NCDO 2099.
The four isolates in cluster 1 and three unclustered isolatesaround it, together with seven isolates between cluster 20 andcluster 21 and two above cluster 23 were not identified but haddifferent band patterns from C. casei, C. mooreparkense, andM. gubbeenense. Two of them, on either side of cluster 1, twoof the unidentified five in the middle of Fig. 5, and two abovecluster 21 appear to have similar band patterns, indicating thatthey were identical isolates, but all the other unidentified iso-lates had different band patterns.
Progression of species during ripening. The number ofstrains of each species isolated at the different times from theinoculated and noninoculated cheeses during ripening aresummarized in Table 1. The coagulase-negative staphylococciwere mainly found early in ripening and at very low numberscompared with the coryneforms. In both cheeses, C. casei wasthe dominant species, followed by C. mooreparkense; generally,M. gubbeenense was isolated more frequently late in ripening.C. flavescens was isolated only from the inoculated cheese after16 days of ripening. With the exception of this organism, thesame species were found in both the inoculated and noninocu-lated cheese at each time point examined. A small number ofstrains, particularly in the noninoculated cheese, were notidentified.
Although the inoculated cheese had been smeared severaltimes during ripening with B. linens BL2, this strain was neverisolated at any time point from either cheese (Fig. 4 and 5).This was not due to the inability of the strain to grow on theisolation medium. However, the 10 strains of Staphylococcusisolated from the cheese, 2 strains of C. casei, and strains of C.mooreparkense inhibited B. linens BL2 and B. linens BL1 butnot L. innocua LMG 11387 and LMG 13586, P. freudenreichii16424, or E. faecalis DPC 3546 (Table 2). Several strains of M.gubbeenense had no effect on these indicator strains.
Ranges of pH and NaCl allowing growth of isolates. Two-dimensional pH and NaCl gradient plates were used to evalu-ate the growth response of C. casei, C. mooreparkense, and M.gubbeenense to pH and NaCl. Preliminary studies indicatedthat the pH and salt gradients in different batches of plateswere stable and reproducible and showed no significant changewith time over a 4-day incubation at 30°C (data not shown).
The growth profiles of C. casei, C. mooreparkense, and M.gubbeenense at different pH values and salt concentrations areshown in Fig. 6. C. casei and C. mooreparkense grew at pHvalues of �4.9 in the presence of 7 and 8% NaCl, respectively,which are well within the ranges of pH and salt concentrationsfound in the cheese (Fig. 2). In contrast, M. gubbeenense didnot grow below pH 5.8 but did grow in the presence of up to
TABLE 1. Number of strains of different species found in inoculated and noninoculated cheeses at different times during ripening
Organism
No. of strains found after ripening (days) of:
Inoculated cheese Noninoculated cheese
4 16 23 37 4 16 23 37
Coagulase-negative staphylococci 1 2 2 5C. casei 35 24 18 28 24 19 25 23C. mooreparkense 4 11 23 6 14 16 14 14M. gubbeenense 8 5 7 13 1 5 11C. flavescens 5Unidentified coryneforms 2 3 2 1 7 14 6 2
TABLE 2. Inhibition of several indicator strains by different isolatesfrom the inoculated and uninoculated cheesesa
Producer strainsbInhibition of indicator strains
B. linens BL1 B. linens BL2
Staphylococcus 1 � �Staphylococcus 2 � �Staphylococcus 3 � �Staphylococcus 4 � �Staphylococcus 5 � �Staphylococcus 6 � �Staphylococcus 7 � �Staphylococcus 8 � �Staphylococcus 9 � �Staphylococcus 10 � �
C. casei DPC 5293 � �C. casei DPC 5294 � �C. casei DPC 5297 � �C. casei DPC 5299 � �C. casei DPC 5300 � �C. casei DPC 5303 � �
C. mooreparkense DPC 5305 � �C. mooreparkense DPC 5307 � �C. mooreparkense DPC 5308 � �C. mooreparkense DPC 5309 � �C. mooreparkense DPC 5310 � �C. mooreparkense DPC 5313 � �C. mooreparkense DPC 5315 � �
a M. gubbeenense DPC 5291, DPC 5282, DPC 5283, DPC 5284, DPC 5285,DPC 5286, DPC 5288, DPC 5289, and DPC 5291 did not produce any inhibitorfor any of the indicator strains tested.
b No strain inhibited L. innocua LMG 11386, L. innocua LMG 11387, P.freudenreichii LMG 16424, or E. faecalis DPC 3546.
VOL. 68, 2002 SMEAR-RIPENED CHEESE 827
Dow
nloa
ded
from
http
s://j
ourn
als.
asm
.org
/jour
nal/a
em o
n 31
Jan
uary
202
2 by
13.
231.
187.
169.

10% NaCl at this pH. The pH and NaCl tolerances of severalstrains of each species were examined, and all strains yieldedthe same results (data not shown).
Technologically important properties. All the isolates of C.casei, C. mooreparkense and M. gubbeenense, which were iden-tified using chemotaxonomic methods and 16S rRNA sequenc-ing (1, 2), utilized lactate but produced only small amounts ofproteinase. Only C. mooreparkense produced lipase. All of the
isolates of these three species, except M. gubbeenense DPC5286, DPC 5289, and DPC 5288 and C. casei DPC 5297, DPC5299, and DPC 5300, also produced methanethiol from methi-onine.
DISCUSSION
In this study, classical and molecular approaches were usedto identify 400 isolates from the surface of inoculated andnoninoculated smear-ripened cheeses at four different timepoints during ripening. The bacterial flora was dominated bycorynebacteria (390 isolates); the remaining 10 isolates werestaphylococci. All the latter were coagulase negative but werenot identified further. The coagulase-negative staphylococci ina number of French cheeses have been identified as Staphylo-coccus equorum, Staphylococcus vitulus, and Staphylococcus xy-losus (11). It proved impossible to identify the 390 corynebac-teria by classical phenotypic tests despite the fact that a batteryof 53 biochemical tests were carried out on each isolate and theavailability of a database of 557 strains of coryneforms (23, 24).Therefore, a polyphasic approach to their identification, in-volving chemotaxonomic RAPD and PFGE, was used. Thisshowed that, except for five isolates which were identified as C.flavescens, most (89%) of the 390 isolates from the inoculatedand noninoculated cheese were either C. casei (196 [50.2%] iso-lates), C. mooreparkense (102 [26%] isolates) or M. gubbeenense(50 [12%] isolates), all of which are new species (1, 2). Thirty-seven (9.3%) isolates were not identified. Isolates from twoother batches of cheese are currently been identified to deter-mine if the new species also dominate other batches of thischeese. The fact that most of the isolates were new species,which were not present in the database, explains why the initialphenotypic analysis failed to identify any isolate. It is probablethat other bacteria were also present in lower numbers butwere not isolated by the techniques used.
The surface of this cheese is deliberately smeared with B.linens BL2 at the beginning of ripening. However, this strainwas not recovered from the surface at any time point duringripening. This result was surprising and is most likely due to thefact that all the staphylococcal and many of the coryneformisolates inhibited the growth of B. linens BL2 (Table 2). Thisinhibition may be due to bacteriocin production, but this as-pect was not investigated further. Many bacteriocins are plas-mid encoded and easily lost on subculture, which may explainwhy only some isolates showed inhibition. In reality, the mostlikely inhibitors are the staphylococci since they grow duringthe early period of ripening (Table 1).
Inoculating the surface of smear-cheese and other fer-mented food products with microorganisms from a previousbatch, so-called “backslopping,” is a common practice in somefermented foods but is not recommended because of the pos-sibility of transferring pathogens from the older to the youngerproduct (25). In this regard, deliberate smearing of the cheesesurface with C. casei, C. moorparkense, and M. gubbeenense asa surface starter culture could be useful. Before this can bedone, however, a system of culturing and storing the organismswould need to be developed so as to maximize their survival.
Within each new species, the PFGE patterns of each isolatewere virtually identical, implying that the isolates were singleclones of that species. This result is not surprising when one
FIG. 6. Growth of M. gubbeenense DPC 5283 (A), C. mooreparkenseDPC 5308 (B), and C. casei DPC 5583 (C) on 2-dimensional pH andsalt gradient plates. The dark areas indicate where growth occurredand the light areas indicate where growth did not occur.
828 BRENNAN ET AL. APPL. ENVIRON. MICROBIOL.
Dow
nloa
ded
from
http
s://j
ourn
als.
asm
.org
/jour
nal/a
em o
n 31
Jan
uary
202
2 by
13.
231.
187.
169.

considers the way the cheese is handled during ripening. Dur-ing the early stages, the surface of the cheese is washed severaltimes with dilute saline, which spreads the most rapidly grow-ing microcolonies on the cheese surface, allowing them todevelop more uniformly. Thus, the more rapidly growing bac-teria will dominate and it is likely that only one or a few strainsof each species would be present. In the present study, onlyone strain of each of the species was found. To our knowledge,there is no other study with which we can compare our data.Many of the 37 unidentified isolates (Table 1) had similarPFGE patterns (Fig. 4 and 5), indicating they were the samestrain. Only the dominant bacteria on the surface were iso-lated, and it would be interesting to determine if other bacteriaare present in lower numbers.
The RAPD technique was very reproducible and yieldedhigh similarity values, with several bacteria isolated initiallyfrom cheese. Therefore, we felt that it should be useful ingrouping large numbers of the same clone. The PFGE analysisof isolates within a cluster showed that this did happen, but italso showed that many isolates in adjacent RAPD clusters hadidentical band patterns (Fig. 5 and 6). We have no explanationfor this result. It does imply that the PFGE technique appearsto be much better than the RAPD technique for clarifying therelationships of different isolates from smear-ripened cheese toeach other. Despite this, the RAPD technique did bring mono-clonal isolates together since all isolates from several contigu-ous clusters clustered together. The RAPD technique appearsto be too discriminating and probably relies on very subtledifferences in banding patterns and their intensities to clusterthe strains.
There was no significant difference between the bacterialcounts on the surfaces of the inoculated and noninoculatedcheese. This confirms that the contribution of B. linens BL2 tothe smear was of little consequence. In recent report, Kollöffelet al. (13) showed that cell and colony counts on the surface ofGruyère cheese were 2 log cycles lower than in situ and colonyhybridization counts. This prompts the following question: dothe bacterial counts reported in the present study and otherstudies (5, 6, 25) reflect the actual numbers of bacteria presentin the smear, or are these values lower than the true numberspresent? This question is currently being addressed using dif-ferential gradient gel electrophoresis to determine the otherbacteria which may be present on the cheese.
The source of C. casei, C. mooreparkense, and M. gubbeenenseon the cheese surface is not clear, but brine, shelving, and thecheesemakers’ hands are probable sources. The most likelysource may be the shelving, on which the cheese is held duringripening, but the cheesemakers’ hands could also be important,as these cheeses receive a significant amount of manual han-dling during ripening and coryneforms are an important com-ponent of the microflora on human skin. The shelves weremade of wood, which is difficult to clean and which couldcontain traces of cheese curd to sustain the growth of micro-organisms, which would then inoculate the cheese surfacewhen the cheese is placed on the shelf to ripen.
Except for C. flavescens, the same organisms were isolated ateach time point during ripening (Table 1). These results showthere is no real progression of organisms on the surface of thecheese during ripening. This is not surprising considering thatthe cheese surface is washed frequently during ripening. This
results in the disruption of microcolonies and the spreading ofthe resulting cells on the cheese surface. There was a tendencyfor greater numbers of M. gubbeenense bacteria to be isolatedlate in ripening. M. gubbeenense is unable to grow below pH5.8, and the pH of the cheese surface does not reach this valueuntil 30 days of ripening (Fig. 2). The M. gubbeenense isolatesrecovered early in ripening may be just nongrowing contami-nants. The fluctuations in each species during ripening can nowbe easily followed since the 16S rRNA sequences (1, 2) can beused to design species-specific probes for these organisms.
Compositional analysis of the cheese during ripening showedthat the pH and salt content gradually increased during ripen-ing and the moisture content decreased. The salt is dissolved inthe moisture and the salt-in-moisture also increased duringripening, especially from day 23 of ripening. It is generallyconsidered that yeast grow first on smear-ripened cheese, ca-tabolizing the lactate produced by the starter bacteria to CO2
and H2O, which cause the pH to increase to a value at whichthe bacteria grow (6, 12, 19, 25). C. casei and C. mooreparkenseare capable of growth at pH values below 4.9, in the presenceof 8.0% NaCl. These values are much greater than those foundin the cheese (Fig. 2). These organisms also metabolize lactate,implying that they can grow from the beginning of ripening andtherefore may not be as dependent on significant yeast growthduring the initial stages of ripening, as previously thought. Atthe end of ripening, yeast counts were 3 log cycles lower thanthe corresponding coryneform counts, indicating that, at theend of ripening, the microflora of the inoculated and nonin-oculated cheeses are dominated by bacteria. Keller and Puhan(12) also found that the yeast counts on Tilsit cheese duringripening were never greater than the bacterial counts. Thisshift from yeast dominance early in ripening to bacterial dom-inance is critical to the ripening process. Most of the isolates ofC. casei, C. mooreparkense, and M. gubbeenense were able toproduce methanthiol from methionine, which is one of themajor flavor compounds in smear-ripened cheeses.
Previous studies on the surface microflora of smear-ripenedcheese focused on the phenotypic identification of strains, usu-ally at unspecified times during ripening. In the present study,both phenotypic and genotypic approaches were used to iden-tify the bacteria on the surface of a farmhouse smear-ripenedcheese throughout ripening. The results showed that the bac-terial flora was dominated by single clones of three adventi-tious species of coryneforms, implying that the growth of theseadventitious bacteria is more important than that of those, e.g.,B. linens, which are added intentionally. This study is a detailedanalysis of one batch of cheese, and it would be necessary tostudy other batches of this cheese and other smear cheeses todetermine how similar or different they are. Such studies arecurrently under way.
ACKNOWLEDGMENTS
Grateful thanks are extended to Giana and Tom Ferguson for fa-cilitating this study of their cheese, Finbarr Drinan and Eddie Mul-holland for their excellent technical help, Teagasc for the award of aWalsh Fellowship to N.B., and the National University of Ireland forthe award of a Travel Bursary in Food Science and Technology to N.B.Mike Goodfellow and Tim Cogan acknowledge the European Com-munity’s project “Biodiversity and anti-listerial activity of surface mi-crobial consortia from Limburger, Reblochon, Livarot, Tilsit andGubbeen cheese,” QLK1-2001-O2228.
VOL. 68, 2002 SMEAR-RIPENED CHEESE 829
Dow
nloa
ded
from
http
s://j
ourn
als.
asm
.org
/jour
nal/a
em o
n 31
Jan
uary
202
2 by
13.
231.
187.
169.
REFERENCES
1. Brennan, N. M., R. Brown, M. Goodfellow, A. C. Ward, T. P. Beresford, P. J.Simpson, P. F. Fox, and T. M. Cogan. 2001. Corynebacterium mooreparkensesp. nov., and Corynebacterium casei sp. nov. isolated from the surface of asmear-ripened cheese. Int. J. Syst. Evol. Microbiol. 51:843–852.
2. Brennan, N. M., R. Brown, M. Goodfellow, A. C. Ward, T. P. Beresford, M.Vancanneyt, T. M. Cogan, and P. F. Fox. 2001. Microbacterium gubbeenensesp. nov., isolated from the surface of a smear-ripened cheese. Int. J. Syst.Evol. Microbiol. 51:1969–1976.
3. Busse, M. 1989. Die Oberflachenflora von Geschmierten Käse. Milchwirt.Berichte. 99:137–141.
4. Cure, G. L., and R. M. Keddie. 1973. Methods for the morphological exam-ination of aerobic coryneform bacteria, p. 123–135. In R. G. Board andD. W. Lovelock (ed.), Sampling—microbiological monitoring of environ-ments—1973. Academic Press, London, United Kingdom.
5. El-Erian, A. F. M. 1969. Bacteriological studies on limburger cheese. Ph.D.thesis. Agricultural University, Wageningen, The Netherlands.
6. Eliskases-Lechner, F., and W. Ginzinger. 1995. The bacterial flora of surfaceripened cheese with special regard to coryneforms. Lait 75:571–584.
7. Eliskases-Lechner, F., and W. Ginzinger. 1995. The yeast flora of surfaceripened cheese. Milchwissenschaft 50:458–462.
8. Engel, G. 1993. Hemmung von Hefe-und Schimmelpilzwachstum beim quan-titativen Nachweis von Bakterien. Milchwissenschaft 48:325–327.
9. Fiedler, F., M. J. Schäffler, and E. Stackebrandt. 1981. Biochemical andnucleic acid hybridisation studies on Brevibacterium linens and relatedstrains. Arch. Microbiol. 129:85–93.
10. Funke, G., G. Martinetti Lucchini, G. E. Pfyffer, M. Marchiani, and A. vonGraevenitz. 1993. Characteristics of CDC group 1 and group 1-like coryne-form bacteria isolated from clinical specimens. J. Clin. Microbiol. 31:2907–2912.
11. Irlinger, F., A. Morvan, N. El Solh, and J. L. Bergere. 1997. Taxonomiccharacterization of coagulase-negative staphylococci in ripening flora fromtraditional French cheeses. Syst. Appl. Microbiol. 20:319–328.
12. Keller, S., and Z. Puhan. 1985. Deacidification of smear cheese, e.g., Tilsitcheese. Schweiz. Milchwirtsch. Forsch. 14:3–11.
13. Kollöffel, B., L. Meile, and M. Teuber. 1999. Analysis of brevibacteria on the
surface of Gruyère cheese detected by in situ hybridisation and by colonyhybridisation. Lett. Appl. Microbiol. 29:317–322.
14. Lenoir, J. 1984. The surface flora and its role in the ripening of cheese. Int.Dairy Fed. Annu. Bull. 171:3–20.
15. Lynch, C. M., P. L. H. McSweeney, P. F. Fox, T. M. Cogan, and F. D. Drinan.1997. Contribution of starter lactococci and non-starter lactobacilli to pro-teolysis in Cheddar cheese with a controlled microflora. Lait 77:441–459.
16. Pot, B., P. Vandamme, and K. Kersters. 1994. Analysis of electrophoreticwhole-organism protein fingerprints, p. 493–521. In M. Goodfellow andA. G. O’Donnell, (ed.), Chemical methods in prokaryotic systematics—1994.J. Wiley & Sons, Chichester, United Kingdom.
17. Pukro, M., W. O. Nelson, and W. A. Wood. 1951. The associative actionbetween certain yeast and Bacterium linens. J. Dairy Sci. 24:699–705.
18. Rapps, M. 1974. Indikatorzusatze zur Keimdifferenzirerung auf Wurze-undMalzextrakt-agar. Milchwissenschaft 29:341–344.
19. Reps, A. 1993. Bacterial smear-ripened cheese, p. 137–172. In P. F. Fox (ed.),Cheese: chemistry, physics and microbiology, vol. 2. Major cheese groups,2nd ed. Chapman and Hall, London, United Kingdom.
20. Sauter, H. 1986. Die Oberflachenflora von Weinkase. Reinfungsfehler undihre Ursachen. Ph.D. thesis. Technical University Munich, Munich, Ger-many.
21. Seiler, H. 1983. Identification key for coryneform bacteria derived by nu-merical taxonomic studies. J. Gen. Microbiol. 129:1433–1471.
22. Seiler, H. 1986. Identification of cheese smear coryneform bacteria. J. DairyRes. 53:39–441.
23. Seiler, H., R. Braatz, and G. Ohmayer. 1980. Numerical cluster analysis ofthe coryneform bacteria from activated sludge. Zentbl. Bakteriol. Mikrobiol.Hyg. I Abt. Orig. C 1:357–375.
24. Seiler, H., and R. Braatz. 1988. Computerprogramme MCOMPRE undCLUSUM zur Coryneformenidentifizierung. Bakteriologisches Institut,sudd versuchs-und Forschungsanstalt fur Milchwirtschaft, Weihenstephan,Germany.
25. Valdes-Stauber, N., S. Scherer, and H. Seiler. 1997. Identification of yeastand coryneform bacteria from the surface microflora of Brick cheese. Int. J.Food Microbiol. 34:115–129.
26. Wimpenny, J. W. T., and P. Waters. 1984. Growth of microorganisms ingel-stabilized two-dimensional diffusion gradient systems. J. Gen. Microbiol.130:2921–2926.
830 BRENNAN ET AL. APPL. ENVIRON. MICROBIOL.
Dow
nloa
ded
from
http
s://j
ourn
als.
asm
.org
/jour
nal/a
em o
n 31
Jan
uary
202
2 by
13.
231.
187.
169.