Biodiversity and Ecosystem Services .... AGRO CITY KALTIM 13,096.69 PT. BALIKPAPAN FOREST INDUSTRIES...
15
Biodiversity and Ecosystem Services Tokyo December 4th-5th, 2013 REDD+ Safeguard; Fundamental, Not an add on An Opportunity and Challenges for REDD+ Implementation in the Upper Mahakam
-
Upload
vuongtuong -
Category
Documents
-
view
218 -
download
2
Transcript of Biodiversity and Ecosystem Services .... AGRO CITY KALTIM 13,096.69 PT. BALIKPAPAN FOREST INDUSTRIES...

Biodiversity and Ecosystem Services
Tokyo December 4th-5th, 2013
REDD+ Safeguard; Fundamental, Not an add on
An Opportunity and Challenges for REDD+ Implementation in the
Upper Mahakam

1
Upper Mahakam Overview
Size: 31.628,70 km2
Administratif: 2 districts, 21 sub districts and 223 villages.
Population: 167.700
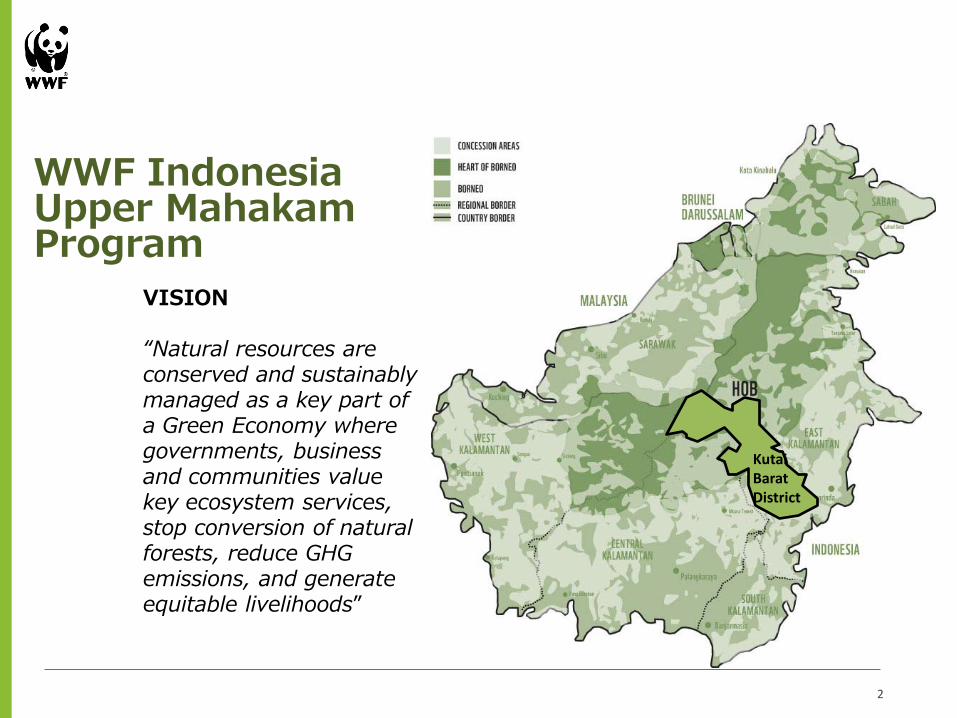
WWF Indonesia Upper Mahakam Program
Kutai Barat District
VISION “Natural resources are conserved and sustainably managed as a key part of a Green Economy where governments, business and communities value key ecosystem services, stop conversion of natural forests, reduce GHG emissions, and generate equitable livelihoods”
2

Non Forested 868,465.76 Ha
Forest Cover
Forested Area 2,427,716.67 Ha
Source: Landsat 2009

The Nature Reserve 5,855.04 Ha
The Protected Forest 859,941.75 Ha
Spatial Planning
The Production Forest 1,325,608.47 Ha Development Area/ other
utilization area 1,082,602.39 Ha
Source: Bappeda Kutai Barat

6
The District Emission, sector based
Source: Analysis by Mc Kinsey Tim
Tarakan
Tana Tidung
Samarinda
Pasir
Panajam Paser Utara
Nunukan
Malinau
Kutai Timur
Kutai Barat
Bulungan
Bontang
Berau
Balikpapan
0-1 Mt CO2e
1-2 Mt CO2e
2-5 Mt CO2e
5-10 Mt CO2e
10+ Mt CO2e
1 Palm oil mill effluent
Total
5.9
21.8
18.5
18.2
44.9
Kutai Kertanegara 57.6
43.6
6.9
40.2
8.3
12.3
3.5
2.3
0.3
284.3 East Kalimantan
MtCO2e, 2010
0.0
Palm Oil
Deforest ation
Peat decay Fire POME1
Agriculture
Deforest ation Fire
Agricul Ture proses
Peat Decay
Forestry
Degrada tion
Deforest ation
Peat Decay Fire
Oil and Gas
Exploitation process
Coal Mining
6.3 3.1 0.8 2.3
0.0 0.0 0.0 0.0 0.1 0.0 0.0 - 0.0 0.0 0.0 0.0
2.6 1.7 0.7 0.3 4.7 3.9 0.5 1.3 - 0.2 1.5 1.0 0.3
0.0 0.0 0.0 0.0 0.0 0.0 0.8 0.0 - 0.0 0.0 1.5 0.4
2.0 1.5 1.5 0.2 2.5 2.4 1.4 1.0 0.0 0.1 0.9 2.5 0.6
7.8 4.1 1.9 0.4 8.7 4.0 1.7 3.9 - 0.2 1.9 3.1 0.8
5.6 6.0 4.6 0.7 1.8 2.7 4.2 2.8 5.9 0.8 0.9 7.7 2.0
4.5 3.9 0.8 0.8 0.3 0.7 1.4 1.7 0.5
0.0 0.6 0.0 0.1 4.7 0.6 0.0 0.0 - 0.1 0.5 0.1 0.0
1.4 0.9 7.1 0.3 1.5 2.8 6.8 0.7 - 0.4 0.9 12.1 3.1
0.4 0.6 0.0 0.1 2.6 0.8 0.0 0.2 - 0.2 0.4 0.0 0.0
1.6 2.1 0.3 0.3 1.2 2.4 0.3 0.8 - 0.4 0.8 0.7 0.2
0.0 0.0 0.0 0.0 0.0 0.0 0.3 0.0 - 0.0 0.0 0.6 0.2
0.0 0.8 0.0 0.1 0.0 0.9 0.0 0.0 - 0.0 0.0 0.0 0.0
0.0 0.0 0.0 0.0 0.0 0.1 0.0 0.0 0.0 0.0 0.0 0.0 0.0
26.0 22.4 16.9 3.2 33.8 23.9 16.8 13.0
Refining process & LNG
Gas Flaring
3.3 -
- -
15.1 -
- 0.1
- -
- 1.4
- 0.2
- -
- -
- -
- -
- -
- -
- 0.0
18.4 1.7
Others
2.5
0.4
0.7
0.5
0.6
2.8
0.2
0.2
0.4
0.1
0.6
2.1
0.5
0.2
11.8 6.2
Deforest ation
Mining Process
Metan Release
- - -
0.4 0.8 1.5
- - -
0.1 0.1 0.8
0.5 0.9 4.4
0.8 1.5 5.4
4.3 8.1 3.7
0.0 0.0 -
0.1 0.3 1.4
0.8 1.4 0.7
0.1 0.1 0.4
0.1 0.2 0.0
0.0 0.0 0.0
- - -
7.2 13.5 18.4 3.2 9.4 31.0 8.0
Others
Total

14746
117
20211141010281420
Bulungan Berau Kutai Timur
Nunukan Kutai Barat
Kutai Kar-tanagara
Bontang
519
Paser Balik-papan
Panajam Paser Utara
Malinau Tarakan Tana Tidung
Sama-rinda
7
Kutai Barat is the biggest second emitter of CO2e in Kalimantan Timur
3 6 6
0,3 2 7 8
12 18
21
31
40 45
52
Sources: Kaltim Green; Wetlands International; East Kalimantan Statistics 2009; Team Mc Kinsey analysis
Sharing total emission by district (%)
20.5 18.2 16.4 12.9 8.5 7.3 4.8 3.2 2.8 2.6 1.4 0.8 0.5 0.1
Oil palm
Agriculture
Forestry
Oil & Gas
Mining
Other sectors
Gross emission occured in each districts within East Kalimantan contributed by five production sectors MtCO2e
Emission per ha MtCO2/ha
Analysed by Mc Kinsey Date 14th May 2010 3
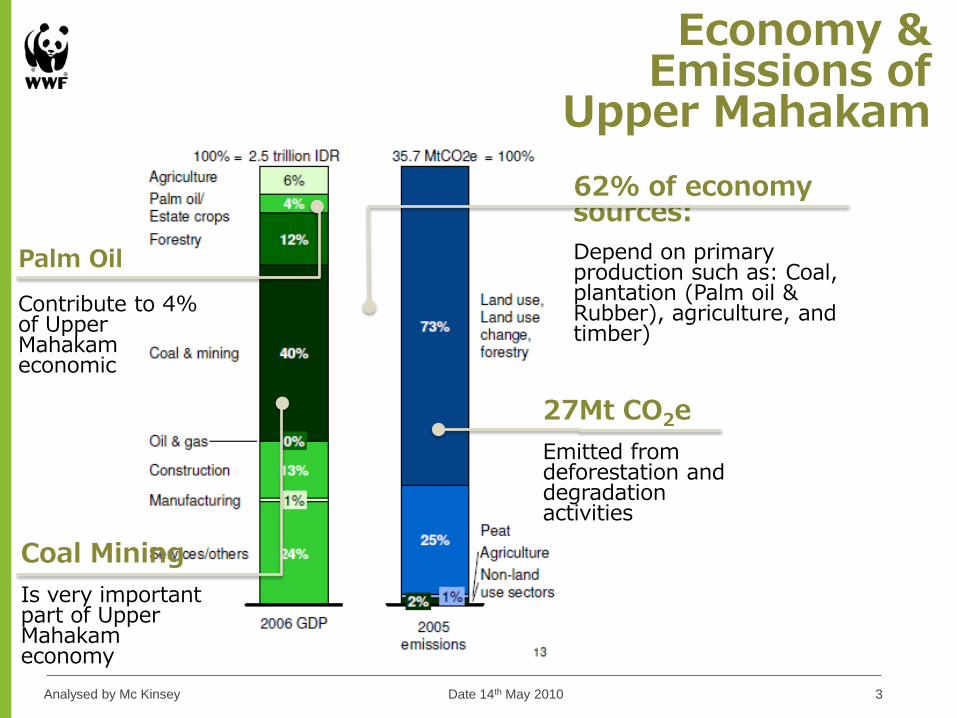
Economy & Emissions of
Upper Mahakam
Palm Oil Contribute to 4% of Upper Mahakam economic
Coal Mining Is very important part of Upper Mahakam economy
27Mt CO2e Emitted from deforestation and degradation activities
62% of economy sources: Depend on primary production such as: Coal, plantation (Palm oil & Rubber), agriculture, and timber)

There are 164.005,17 Ha Of Non Forested Area located in the Production Forest
Forest Cover & Spatial
Planning
There are 433.763,73 Ha Of Forested Area located in the Development Area
Source: - Landsat 2009 - Bappeda Kutai Barat
There are 12.469 Ha Of Non-forested Area located in the protected forest
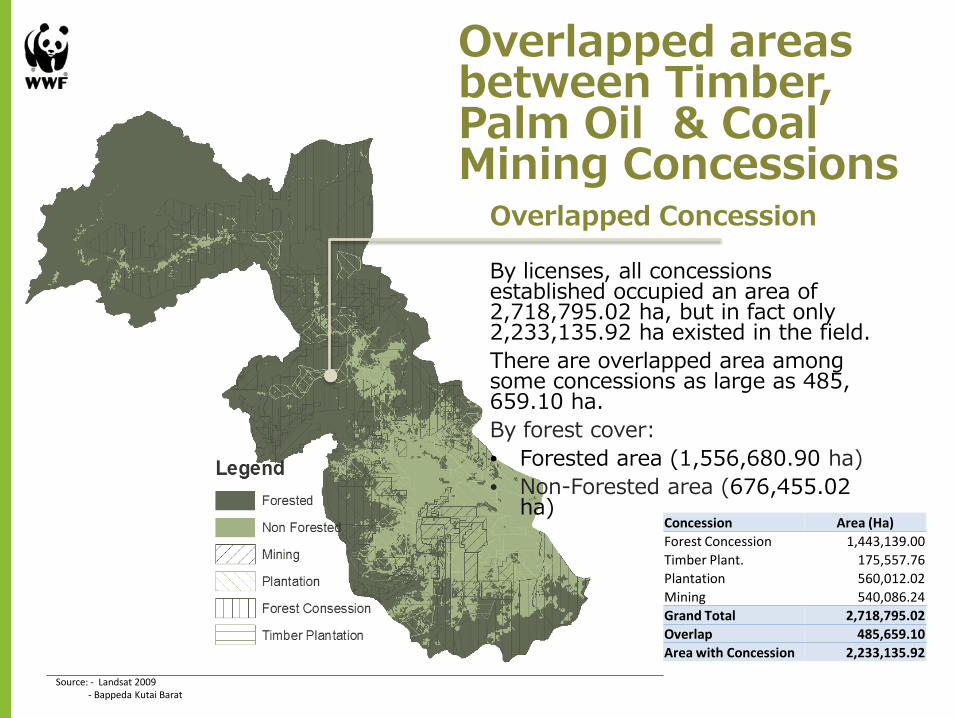
Overlapped Concession By licenses, all concessions established occupied an area of 2,718,795.02 ha, but in fact only 2,233,135.92 ha existed in the field. There are overlapped area among some concessions as large as 485, 659.10 ha. By forest cover: • Forested area (1,556,680.90 ha) • Non-Forested area (676,455.02
ha)
Overlapped areas between Timber, Palm Oil & Coal Mining Concessions
Source: - Landsat 2009 - Bappeda Kutai Barat
Concession Area (Ha) Forest Concession 1,443,139.00 Timber Plant. 175,557.76 Plantation 560,012.02 Mining 540,086.24 Grand Total 2,718,795.02 Overlap 485,659.10 Area with Concession 2,233,135.92

Forest Concessions There are 42 timber concessions occupied 1,443,139.00 Ha of natural forest. These areas are home to very few endemic faunas such as rhino and orangutan and provides services for hundred thousands people living in and surrounding those areas.
Forest Cover, Forest Concessions &
Biodiversity
Source: - Landsat 2009 - Bappeda Kutai Barat
Company Area (Ha) BAGUN JAYA 10,502.46 CV PARI JAYA MAKMUR 13,574.97 DANUM PAROY (IUHKM) 8,273.96 Ex. PT. GUNUNG JATI RIMBA 10,170.65 KEDAQ SAYAAG 10,921.34 KOP. BATUAN JAYA 30,592.86 KOP. LUVANG KRIMAN (IUHKM) 6,469.71 KOPERASI PONDOK PESANTREN DARUSSALAM 22,007.97 KSU MAYANG PUTRI PRIMA 15,213.11 KUD MAHAKAM JAYA 5,915.31 LG BAGUN ILIR (IUHKM) 4,092.33 LONG GELAWANG (IUHKM) 15,058.03 NAHARIQ URIP (IUHKM) 15,816.54 NEDAU APAU (IUHKM) 9,114.34 PT. AGRO CITY KALTIM 13,096.69 PT. BALIKPAPAN FOREST INDUSTRIES 97,501.41 PT. BARITO NUSANTARA INDAH 42,289.40 PT. BELAYAN RIVER TIMBER 15,098.08 PT. DUTA RENDRA MULIA SEJAHTERA 6,954.27 PT. HARAPAN KALTIM LESTARI 44,412.06 PT. HITAYAQ ALAN MEDANG 55,585.39 PT. INDOWANA ARGA TIMBER 25,402.50 PT. ITCI 85,381.10 PT. JAYA TIMBER TRADING 18,000.01 PT. KARYA WIJAYA SUKSES 17,334.23 PT. KEMAKMURAN BERKAH TIMBER 67,745.24 PT. LIMBANG GANECA 6,155.55 PT. MARIMUN TIMBER INDUSTRIES 59,460.68 PT. RANGGAKESUMA (S. BOH) 1,029.51 PT. RATAH TIMBER COMPANY 99,582.20 PT. RIMBA KARYA RAYATAMA 41,624.45 PT. RIMBA SEMPURNA MAKMUR 31,274.11 PT. RODAMAS TIMBER KALIMANTAN 101,893.22 PT. SENDAWAR MAJU SEJAHTERA 26,615.92 PT. SEROJA UNIVERSUM NARWASTU 40,035.87 PT. SUMALINDO LESTARI JAYA (UNIT II) 130,038.93 PT. SUMALINDO LESTARI JAYA V 62,746.91 PT. TIMBER DANA 45,337.02 PT. TRIWIRA ASTA BHARATA 61,799.74 PT. WANGSA LESTARI JAYA 16,202.49 WANGSA LESTARI JAYA 40,381.90 YOSEBA (IUHKM) 12,436.55
Grand Total 1,443,139.
00

Forest Managers
Forest
Actors: Government; Private Sector; Community groups
Sustainable forest
management
Economic, social, culture and identity
“Managed ecosystem, well function and
usefull for biodiversity and community”
Implementation approaches & Tools: • Certification
scheme • HCVF • RIL • FPIC • Benefit
Sharing Mechanism
Target • Capacity improvement at forest managers
• Strengthening government and civil society in supervision and monitoring
Biodiversity Safeguard Design for REDD+ Implementation in the upper Mahakam
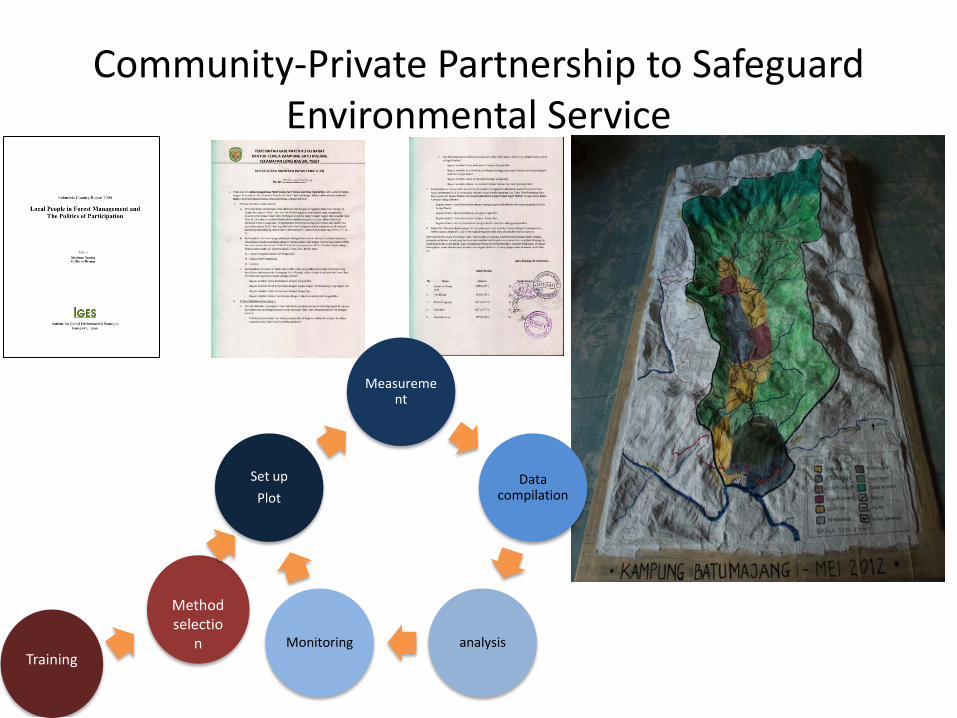
Community-Private Partnership to Safeguard Environmental Service
Methodselectio
n Training
Measurement
Data compilation
analysis Monitoring
Set up Plot

• REDD+ discourse should be landed to the Earth
Next Challenges
• Good communication skill in explaining REDD+ is very important • Need expertise support to translate the REDD+ more operational that
could solved economic challenge at the field level • Biodiversity and ecosystem services provided by nature are not deemed
sufficiently profitable for related private sector compared to the its maintenance cost.
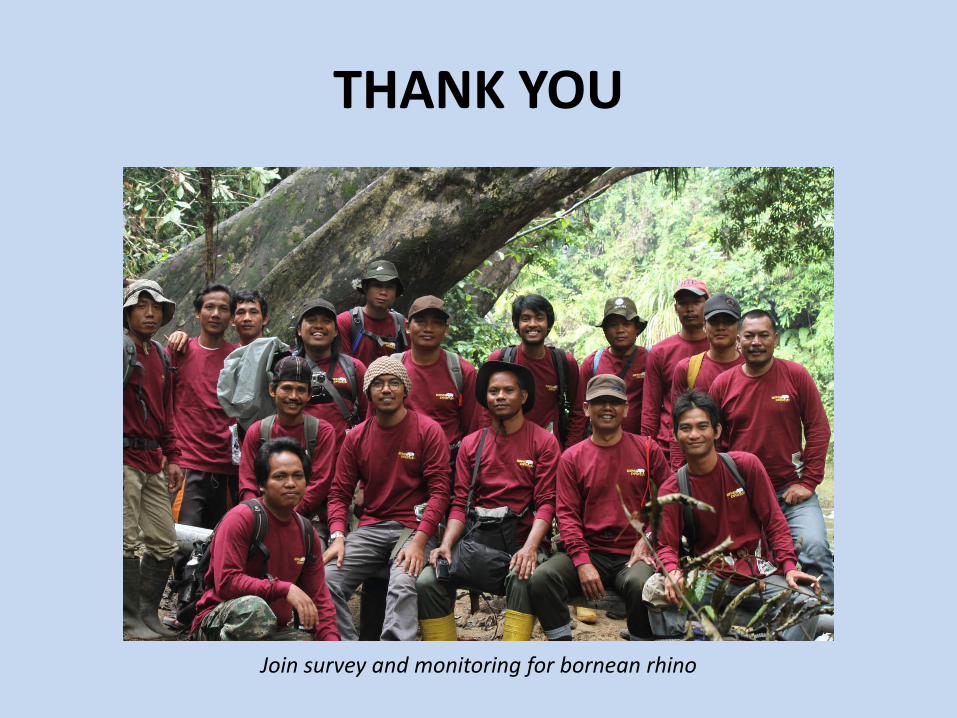
THANK YOU
Join survey and monitoring for bornean rhino


![PT CHANDRA ASRI PETROCHEMICAL TBK [TPIA.JK]barito-pacific.com/files/Investor relations/managementPresentation/c… · PT CHANDRA ASRI PETROCHEMICAL TBK [TPIA.JK] Citi Asia Pacific](https://static.fdocuments.us/doc/165x107/607fc4a288f0f94c624ff284/pt-chandra-asri-petrochemical-tbk-tpiajkbarito-relationsmanagementpresentationc.jpg)